1. Introduction
Stormwater runoff from roads and highways often has elevated levels of nitrogen and phosphorus [
1]. Phosphorus species concentrations are of importance in watersheds because they are a limiting nutrient for plant and algal growth in freshwater systems and excess loadings in surface waters may result in eutrophication [
2,
3]. A common type of eutrophication is harmful algal blooms (HABs). HABs can have devastating effects on ecosystem integrity, species interactions, aquatic animal health and population growth, human health, economy, industry, and ecology [
4].
The practical implementation for stormwater treatment is governed by regulations requiring net improvement of the receiving water body, which implies a reduction of a target water quality parameter. In many cases, the target water quality parameter is a nutrient species. Wet ponds are a commonly used method of achieving nutrient reduction and typically have a total phosphorus removal efficiency of 48% [
5]. New and future stormwater regulations, such as Florida’s pending Statewide Stormwater Treatment Rule, may require phosphorus removal efficiencies that exceed what traditional wet ponds are capable of achieving [
6].
In anticipation of more stringent stormwater regulations, new technologies and systems, such as biosorption activated media (BAM) and bio-filtration systems, are being developed to meet the new nutrient reduction requirements. BAM is a type of soil amendment technology designed for three purposes: inert filtration (
i.e., depth filtration), reactive filtration (
i.e., adsorption & ion-exchange), and to provide an ideal habitat for microbes in order to facilitate biosorption & biological uptake. Bio-filtration systems are shallow depressions, with vegetation and filter media, into which stormwater drains and infiltrates. Stormwater entering the bio-filtration system is first filtered by the vegetation and topsoil before entering the filter media. As the stormwater flows through the media, additional pollutants are captured
via depth filtration, adsorption, ion exchange, and biosorption [
7,
8,
9,
10]. An extensive discussion on the composition and various treatment processes of BAM and bio-filtration systems can be found in Hood [
10].
The purpose of this paper is to assess the removal efficiencies and effluent total phosphorus and soluble reactive phosphorus (SRP) concentrations of roadside swale bio-filtration systems utilizing BAM compared to sandy soil as the filter media. The Florida Department of Transportation (FDOT) is the funding agency for this research; thus, a roadside swale utilizing sandy soil is used as the baseline comparison since it is the dominant pre-existing condition for Florida’s roadside swales. As stated previously, total phosphorus is of particular interest since it is regulated by some federal rules and state rules; however, SRP is also significant as SRP represents the phosphorus that is readily available to plants and algae. SRP is composed of dissolved inorganic and dissolved organic phosphorus species and can be used to approximate ortho-phosphorus [
11].
2. Materials and Methods
The data presented in this paper compares the effluent concentrations and removal efficiencies of total phosphorus and SRP for the biosorption activated media, Bold & Gold™ and sandy soil for simulated highway runoff. This comparison is performed using a field scale test bed split into sandy soil and Bold & Gold™ bio-filtration system sides. The sandy soil used is classified as A-3 by the American Association of State Highway and Transportation Officials (AASHTO). The Bold & Gold™ used in this research is specified for highway runoff and is composed of an uncompacted volume ratio of 75% expanded clay and 25% tire crumb. The tire crumb has 100 percent passing through a #10 sieve and the expanded clay has 100 percent passing a 0.95 cm (3/8 inch) sieve.
2.1. Test Bed Construction
The test bed represents a highway and an adjacent roadside swale. The concrete portion of the test bed represents a single 3.66 m (12 feet) wide lane with a 61 cm (2.0 feet) wide inside shoulder. The dimensions of the roadway are based upon the requirements stated in the Florida Department of Transportation Plans Preparation Manual [
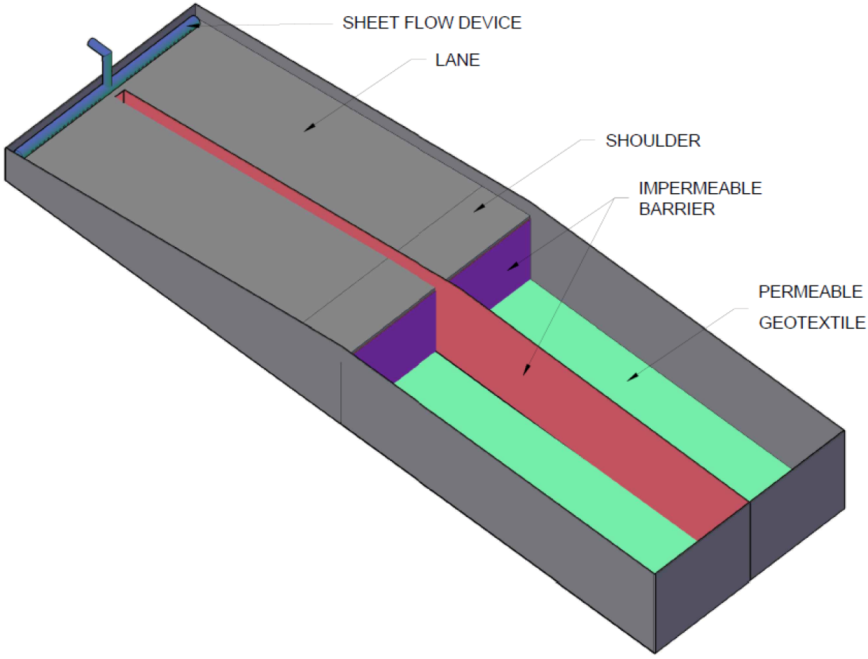
12]. A diagram of the test bed prior to being filled with Bold & Gold™ and sandy soil is displayed in
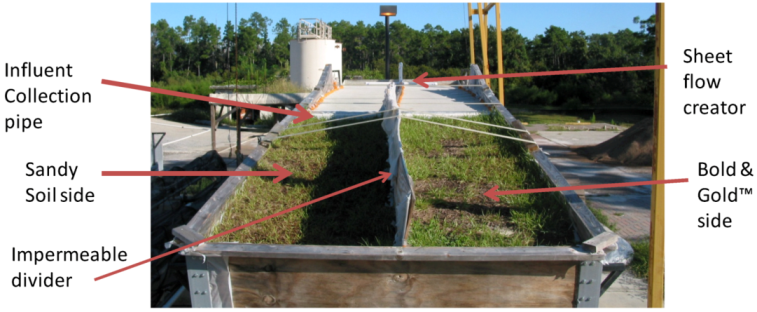
Figure 1 in order to show the locations of the impermeable barriers. A 5.08 by 10.16 cm (2 by 4 inch) piece of wood is placed on the concrete lane and shoulder to approximately split the sheet flow equally between the sandy soil and Bold & Gold™ sides. A picture of the fully constructed test bed is shown in
Figure 2.
Figure 1.
Diagram of empty test bed.
Figure 1.
Diagram of empty test bed.
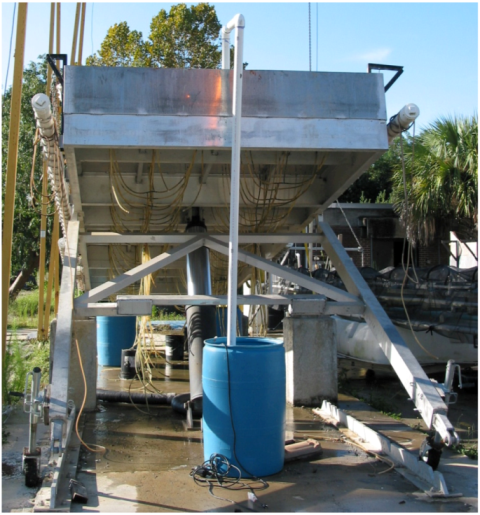
Figure 2.
Picture of the fully constructed test bed.
Figure 2.
Picture of the fully constructed test bed.
The field scale tests were done on an elevated and tilt-able test bed. The test bed represents a highway and an adjacent roadside swale. The lane had a 2% slope and the shoulder had a 5% slope; the roadside swale had a slope of 1:6, which is approximately 16.67% [
12]. The slopes of the roadway and roadside swale are based upon the requirements stated in the Florida Department of Transportation Plans Preparation Manual [
12]. The Bold & Gold™ and sandy soil were approximately 84 cm deep (2.74 feet). The depth of 84 cm (2.74 feet) was used due to the geometric limitations of the test bed; in order to have the correct lane and shoulder widths, the Bold & Gold™ and sandy soil needed to be 84 cm (2.74 feet) deep. The St. Johns River Water Management District (SJRWMD) requires that detention with filtration systems have a minimum filter media depth of 61 cm (2.0 feet), thus the Bold & Gold™ and sandy soil depth of 84 cm (2.74 feet) was satisfactory [
13]. As shown in
Figure 2, the test bed was split in half with one side being Bold & Gold™ and the other being sandy soil. Both sides were compacted in five levels using a 6.5 horse power Compact Vibrator Plate manufactured by Central Machinery of Camarillo, CA; the Bold & Gold™ and sandy soil were not wetted during compaction. Compaction was performed without watering since a loose condition was desired to optimize permeability.
The roadside swale section of the test bed had a vegetative cover of Argentine Bahia. The Argentine Bahia was placed on the test bed as sod and was allowed two months to establish prior to the start of testing. During the first month of sod establishment the sod was watered every other day; during the second month the sod was watered every four days.
2.2. Simulated Highway Runoff
The water used to create simulated highway runoff is collected from a local stormwater pond. In order for the pond water to become simulated highway runoff, the nitrogen and phosphorus species concentrations need to approximate the National Stormwater Quality Database average values for freeways shown in
Table 1. To create simulated highway runoff, ammonium carbonate, potassium nitrate, and potassium phosphate are added to the collected pond water.
Table 1.
National Stormwater Quality Database average nitrogen and phosphorus species concentrations for freeway runoff [
14].
Table 1.
National Stormwater Quality Database average nitrogen and phosphorus species concentrations for freeway runoff [14].
| Units | Name | Freeways |
|---|
| Median values in mg/L as N or P | NH3 | 1.07 |
| TKN | 2.0 |
| NO2− + NO3− | 0.28 |
| Total Nitrogen | 2.28 |
| Filtered Phosphorus (aka OP) | 0.20 |
| Total Phosphorus | 0.25 |
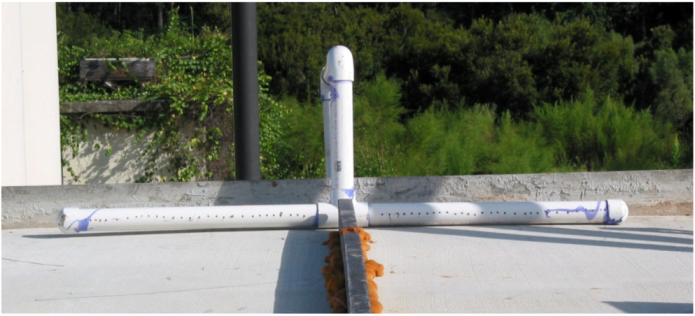
Storms of 2.54, 3.81, and 7.62 cm (1.0, 1.5, and 3.0 inches) of rainfall with a duration of 30 min are being simulated; these storm events correspond to 318, 480.7, and 961.5 L (84, 127, and 254 gallons) respectively. The water is pumped up through the PVC piping system, shown in
Figure 3 and
Figure 4, and then sheet flows over the simulated roadway.
Figure 3.
Influent delivery system.
Figure 3.
Influent delivery system.
Figure 4.
PVC piping system used to create sheet flow over simulated roadway.
Figure 4.
PVC piping system used to create sheet flow over simulated roadway.
2.3. Collection of Influent and Effluent
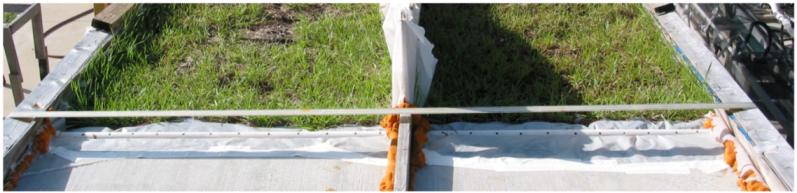
A sample of the influent is collected at the start of the 30 min rainfall event. The influent is collected using a perforated PVC pipe lying along the interface of the concrete shoulder and the Argentine Bahia as shown in
Figure 5. The influent is collected at this location, as opposed to from the influent source container, in order to include any changes or additions to the water chemistry that occur as the simulated runoff flows over the concrete lane and shoulder.
Figure 5.
Perforated PVC pipe used for influent collection.
Figure 5.
Perforated PVC pipe used for influent collection.
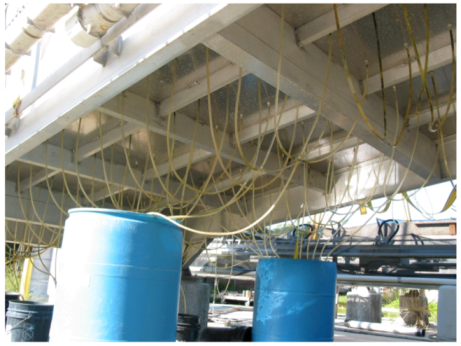
Effluent is defined as the water that has infiltrated through the soil in the test bed. The effluent drains from holes in the bottom of the test bed. The effluent is collected in 208 L (55 gallon) barrels located underneath the test bed as shown in
Figure 6. The effluent is collected for two hours after the 30 min simulated rainfall event has concluded. Water samples for analysis are taken from the collection barrels at the completion of the two hour collection time.
Figure 6.
Effluent collection system.
Figure 6.
Effluent collection system.
2.4. Water Quality Analysis
The pH of the samples is determined at the field lab using an Accumet Research AR50 by Fisher Scientific® (Barrington, IL, USA). The influent and effluent samples are then transported to a NELAC (National Environmental Laboratory Accreditation Conference) certified lab for total phosphorus and SRP analysis.
2.5. Column Test
Column tests are performed on the Bold & Gold™ and sandy soil without sod present. Sod farms typically use fertilizer to increase production, thus it is reasonable to assume that the sod will leach nutrients into the Bold & Gold™ and sandy soil on the test bed, especially during the initial test runs. This presents a problem for analyzing nutrient removal efficiencies since an unknown amount of nutrients are being added to the simulated highway runoff. As a result, column tests without sod are run on the Bold & Gold™ and sandy soil to obtain a percent removal. It should be noted that the Bold & Gold™ and sandy soil being used in the column tests are fresh and should be minimally biologically active compared to media in the field scale test bed bio-filtration system, which has been allowed time to become biologically active.
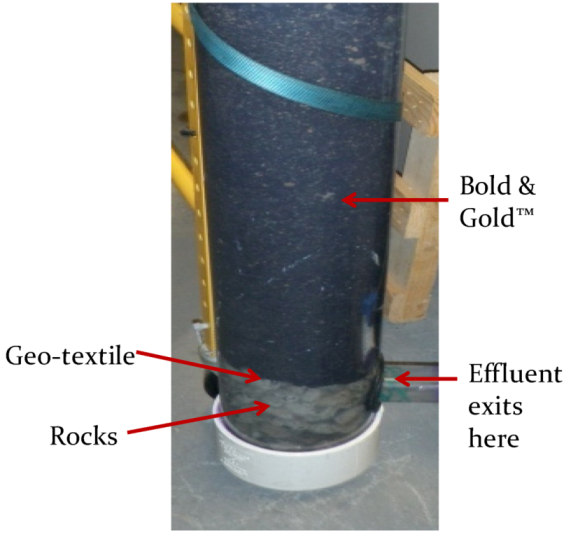
The column test apparatus consists of a 1.07 m (3.5 feet) long clear PVC pipe with an inside diameter of 15.24 cm (6 inches). There are 20.32 cm (8 inches) of limestone rocks at the bottom of the column and geotextile fabric separating the limestone rocks from the media; the media is 84 cm (2.74 feet) deep. The effluent collection pipe is located within the rock layer. The column test apparatus is shown in
Figure 7.
The column test is performed for both the sandy soil and Bold & Gold™ and consists of running 94.6 L (25 gallons) of simulated highway runoff through the apparatus. The first 18.9 L (5 gallons) of effluent collected are discarded and not included in the cumulative effluent collection. The first 18.9 L (5 gallons) are discarded because it is considered the first flush through the system and will contain fines and other constituents that are not representative of normal flow operation of the system. The remainder of the effluent is collected and a sample is taken for analysis. The sample is analyzed for total phosphorus by a NELAC certified laboratory.
Figure 7.
Column test apparatus.
Figure 7.
Column test apparatus.
3. Results
Water quality data is used to compare total phosphorus and SRP effluent concentrations and removal efficiencies of the soil amendment Bold & Gold™ to sandy soil for simulated highway runoff. This comparison is performed using column tests and field scale bio-filtration systems constructed on an elevated test bed.
3.1. Column Tests
A single column test is performed on the sandy soil and Black & Gold™. The water quality testing is performed by a NELAC certified lab. The results of the column test for sandy soil and Bold & Gold™ are presented in
Table 2. Total phosphorus removal is achieved by both the Bold & Gold™ and sandy soil; however, the removal efficiency of the Bold & Gold™ is greater. The Bold & Gold™ achieves a total phosphorus removal of 60%, whereas the sandy soil only achieves a 14% removal. The removal efficiency achieved by the Bold & Gold™ in the column test should be lower than that achieved in the field scale test bed since it is freshly made and should not have significant biological activity,
i.e., biosorption, yet.
Table 2.
Column test results for total phosphorus.
Table 2.
Column test results for total phosphorus.
| Soil or Media Type | Influent (mg/L as P) | Effluent (mg/L as P) | Removal Efficiency |
|---|
| Sandy Soil | 0.21 | 0.18 | 14% |
| Bold & Gold™ | 0.21 | 0.085 | 60% |
3.2. Field Scale Bio-Filtration Systems: Removal Efficiencies
As stated previously, leaching of nutrients from the sod is expected, especially during the initial tests. To account for the leaching, the average removal efficiencies will be calculated based upon the removal efficiencies that occur after leaching has appeared to cease, i.e., when the removal efficiency trend has leveled out.
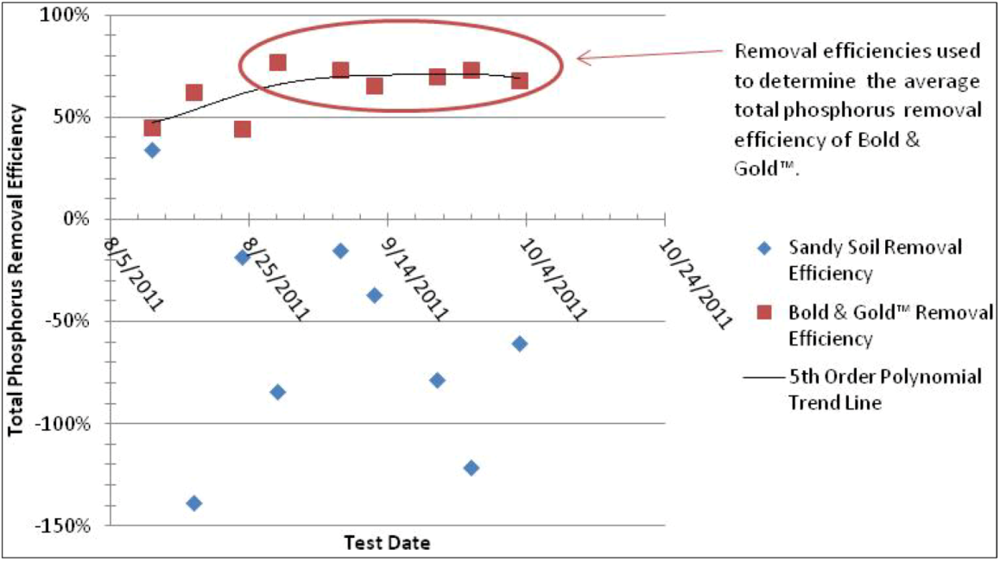
3.2.1. Total Phosphorus Removal Efficiencies
Regulations and designs are often based upon removal efficiencies. The total phosphorus removal efficiency trend with time for the Bold & Gold™ bio-filtration system is shown in
Figure 8. As stated previously, leaching of nutrients from the sod is expected during the initial test runs. During the column test, the Bold & Gold™ achieved a total phosphorus removal efficiency of 60%, thus when the removal efficiencies in the test bed are consistently above 60% it can be inferred that significant leaching has ceased. As shown in
Figure 8, the total phosphorus removal efficiencies are all above 60% starting on 29 August 2011; additionally, the slope of the 5th order polynomial trend line has become minimal by 29 August 2011, indicating leaching has become negligible. Thus, only the last six values are averaged together to determine the average total phosphorus removal efficiency of the Bold & Gold™ bio-filtration system is 71%.
Figure 8.
Total phosphorus removal efficiencies of field scale bio-filtration systems.
Figure 8.
Total phosphorus removal efficiencies of field scale bio-filtration systems.
The total phosphorus removal efficiency with respect to time trend for the sandy soil in the test bed is presented in
Figure 8. During the column test, sandy soil achieved a 14% total phosphorus removal efficiency; however, the field scale bio-filtration system tests resulted in many negative removal efficiencies. The negative values indicate significant leaching of total phosphorus from the sod. Due to the sod’s nutrient leaching, no definite total phosphorus removal efficiency for sandy soil bio-filtration system can be determined.
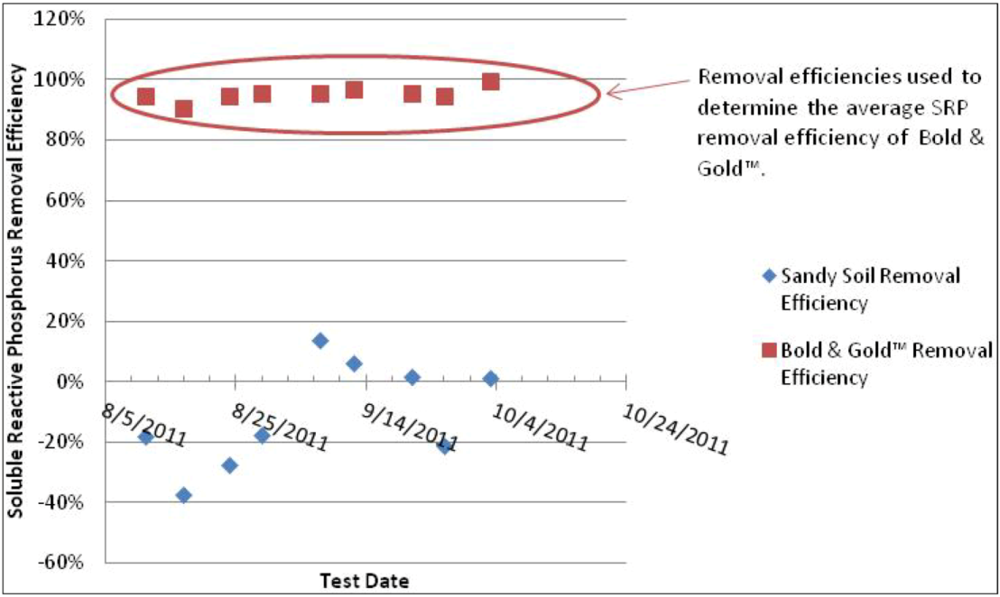
3.2.2. Soluble Reactive Phosphorus Removal Efficiencies
Soluble reactive phosphorus represents phosphorus that is readily available to plants and algae and is composed of dissolved inorganic and dissolved organic phosphorus species [
11]. The SRP removal efficiency trend with time for both the Bold & Gold™ and sandy soil bio-filtration systems is presented in
Figure 9.
Figure 9.
SRP removal efficiencies of field scale bio-filtration systems.
Figure 9.
SRP removal efficiencies of field scale bio-filtration systems.
The SRP removal efficiencies of the Bold & Gold™ bio-filtration system, shown in
Figure 9, appear to be relatively consistent; as a result, all data points are considered in determining the average removal efficiency. The average SRP removal efficiency of the Bold & Gold bio-filtration system is 95%.
As shown in
Figure 9, the SRP removal efficiencies of the sandy soil are minimal or negative. The small and negative SRP removal efficiencies suggest there is a combination of significant nutrient leaching by the sod and a low SRP removal efficiency. Due to the sod’s nutrient leaching, the SRP removal efficiency of the sandy soil bio-treatment system cannot be determined.
3.3. Field Scale Bio-Filtration Systems: ANOVA Test of Effluent Concentrations
Due to the leaching of phosphorus from the sod, it may be beneficial to compare the Bold & Gold™ and sandy soil bio-filtration systems’ total phosphorus and SRP effluent concentrations instead of the removal efficiencies. Recall that the influent for both of the bio-filtration systems is identical for each test, additionally if it is assumed that the sod on each side of the test bed is leaching approximately the same mass loading of nutrients, then a comparison between the effluent concentrations of the sandy soil and Bold & Gold™ bio-filtration systems can be made. An analysis of variance (ANOVA) test is used to analyze the total phosphorus and SRP effluent concentrations.
3.3.1. Total Phosphorus Effluent Concentrations
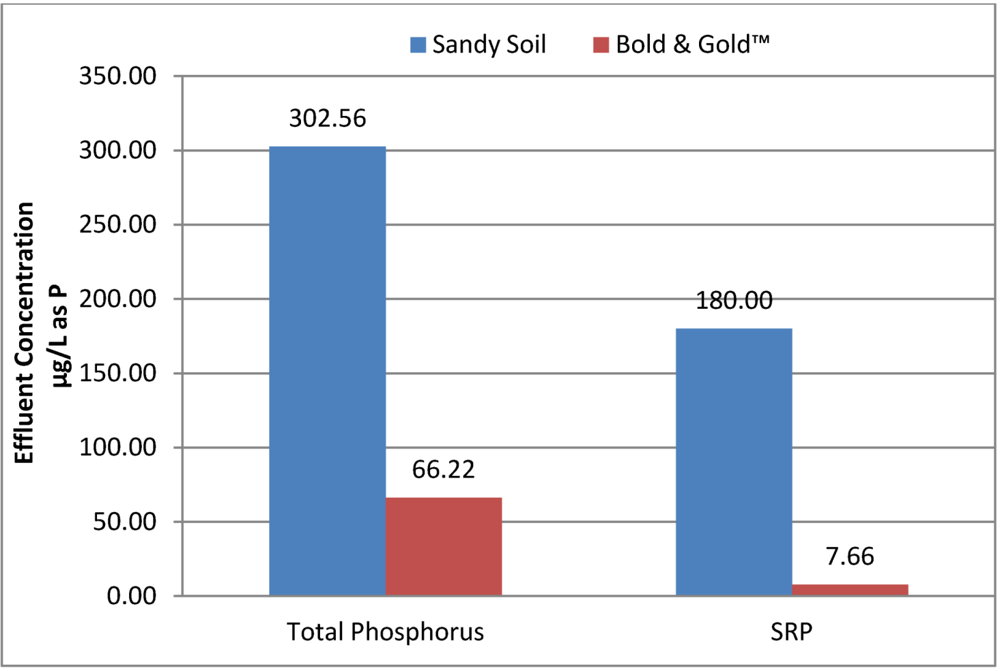
There is found to be a significant difference in the total phosphorus concentration of the effluents at a confidence level of 100%. The Bold & Gold™ bio-filtration system has a 78% lower average effluent concentration of total phosphorus than sandy soil bio-filtration system. The average effluent concentrations of total phosphorus are 302.6 and 66.22 µg/L as phosphorus for the sandy soil and Bold & Gold™ bio-filtration systems respectively; the relative difference between the average total phosphorus effluent concentrations is 128%. A bar graph displaying the comparison of the average effluent concentrations is presented in
Figure 10.
3.3.2. Soluble Reactive Phosphorus Effluent Concentrations
There is found to be a significant difference in the soluble reactive phosphorus concentration of the effluents at a confidence level of 100%. The Bold & Gold™ bio-filtration system has a 96% lower average effluent concentration of soluble reactive phosphorus than the sandy soil bio-filtration system. The average effluent concentrations of soluble reactive phosphorus are 180.0 and 7.656 µg/L as phosphorus for sandy soil and Bold & Gold™ bio-filtration systems respectively; the relative difference between the average soluble reactive phosphorus effluent concentrations is 184%. A bar graph displaying the comparison of the average effluent concentrations is presented in
Figure 10.
Figure 10.
Average total phosphorus & soluble reactive phosphorus effluent concentrations of field scale bio-filtration systems.
Figure 10.
Average total phosphorus & soluble reactive phosphorus effluent concentrations of field scale bio-filtration systems.
3.4. pH of Influent & Effluents
pH is an important aquatic characteristic due to its affects upon speciation and adsorption chemistry.
Table 3 shows the mean, median, and standard deviation values for the pH of the influent and the sandy soil and Bold & Gold™ bio-filtration system effluents.
Table 3.
Summary of influent and effluent pH values.
Table 3.
Summary of influent and effluent pH values.
| Statistic | Sandy Soil | Bold & Gold™ | Influent |
|---|
| Mean | 6.89 | 6.92 | 7.74 |
| Median | 6.92 | 6.83 | 7.77 |
| Standard Deviation | 0.218 | 0.253 | 0.181 |
4. Discussion
The overall goal of this research is to evaluate the effectiveness of Bold & Gold™, a type of biosorption activated media (BAM), in a bio-filtration swale system. The primary focus of this paper is to compare the phosphorus removal efficiencies and effluent concentrations from simulated highway runoff treated by Bold & Gold™ and sandy soil bio-filtration systems. Field scale experiments are performed on a test bed that simulates a typical roadway with a swale. Column tests are performed on sandy soil and freshly made Bold & Gold™ without sod present.
4.1. Soluble Reactive Phosphorus
SRP represents the phosphorus that is readily available to plants and algae. SRP is composed of dissolved inorganic and dissolved organic phosphorus species and can be used to approximate ortho-phosphorus [
11]. The SRP removal efficiency of Bold & Gold™ bio-filtration system is 95%. This removal efficiency is in agreement with research, by Wanielista and Shah, focusing on the usage of other versions of Bold & Gold™ in septic tank drain fields. Wanielista and Shah reported ortho-phosphorus removal efficiencies of 98.79% and 97.83% for two types of Bold & Gold™ [
15,
16]. The SRP removal efficiency of the sandy soil bio-filtration system could not be determined.
A comparison of the effluent concentrations utilizing an ANOVA test revealed that the Bold & Gold™ bio-filtration system has a 96% lower effluent concentration of soluble reactive phosphorus than the sandy soil bio-filtration system. From these results it is apparent that roadside bio-filtrations systems utilizing Bold & Gold™ are superior to those utilizing sandy soil for the removal of SRP from highway runoff.
There are three reasons for the superior SRP removal performance of Bold & Gold™ compared to sandy soil. First, Bold & Gold™, a type of BAM, is specifically made to provide habitat for algae and bacteria, thus enabling the capture of nutrients
via biosorption. Since SRP is readily available for uptake by plants, bacteria, and algae, it is logical to assume that biosorption is a significant removal mechanism of SRP. Furthermore, clay is known to effectively capture phosphorus
via anion exchange. Additionally the average pH values of the influent and effluent from the Bold & Gold™ bio-filtration system tests are 6.92 and 7.74 respectively, which is in the effective pH range for phosphate adsorption by tire crumb [
17].
4.2. Total Phosphorus
Stormwater regulations, such as Florida’s pending Statewide Stormwater Treatment Rule, often times pertain to a total species category, such as total phosphorus, instead of individual species, such as SRP. Thus, it is useful to know the overall performance of a bio-filtration system for the total species category. The column tests indicated that Bold & Gold™ is capable of a 60% removal efficiency for total phosphorus, whereas the sandy soil only achieves a 14% removal efficiency. Field scale tests show that the Bold & Gold™ bio-filtration system achieves a total phosphorus removal efficiency of 71%. The difference between the total phosphorus removal efficiencies of the Bold & Gold™ column test and field scale test is likely due to biosorption. The column test was conducted with fresh Bold & Gold™ that likely had very little biofilm present, where as the Bold & Gold™ in field scale bio-filtration system had been establishing for months and likely had large amounts of biofilm present. Due to the sod’s nutrient leaching, no definite total phosphorus removal efficiency for sandy soil can be determined.
A comparison of the total phosphorus effluent concentrations utilizing an ANOVA test revealed that the Bold & Gold™ bio-filtration system performed superiorly compared to the sandy soil bio-filtration system by having a 78% lower total phosphorus effluent concentration than the sandy soil bio-filtration system. Thus, based upon the column tests removal efficiencies and the comparison of effluent concentrations it is established that BAM is superior to sandy soil for the removal of total phosphorus, additionally; the Bold & Gold™ bio-filtration system is capable of a 71% total phosphorus removal efficiency. Similar research, by Wanielista and Shah, focusing on the usage of other versions of Bold & Gold™ in septic tank drain fields has reported total phosphorus removal efficiencies of 99.93% and 99.92% for two types of Bold & Gold™ [
15,
16]. The much higher total phosphorus removal efficiencies achieved by Wanielista and Shah may be attributed to the influent in the drain field application had a 99.44% higher concentration of total phosphorus than the influent of the bio-filtration system.
It should be noted from
Table 1 that SRP,
i.e., ortho-phosphorus, comprises 80% of the total phosphorus found in freeway runoff, thus whichever bio-filtration system is superior for SRP removal should be superior for total phosphorus removal also. As stated earlier, the Bold & Gold™ bio-filtration system achieves a 95% average removal efficiency of SRP. The Bold & Gold™ bio-filtration system has a 96% lower effluent concentration of soluble reactive phosphorus than the sandy soil bio-filtration system. Based upon the high SRP removal efficiency of the Bold & Gold™ bio-filtration system, the vast difference between SRP effluent concentrations between the systems, and the fact that SRP comprises 80% of the total phosphorus, it is logical that the Bold & Gold™ bio-filtration system is superior to the sandy soil bio-filtration system for the treatment total phosphorus in highway runoff.
4.3. Stormwater Reuse to Sustain Value
As stated previously, the Bold & Gold™ bio-filtration system is capable of achieving a 71% total phosphorus removal efficiency; however, regulations may require a higher total phosphorus removal efficiency. In order to achieve a total phosphorus removal efficiency in excess of 71%, additional treatment methods, such as stormwater harvesting, should be considered. Stormwater harvesting, or reuse, is defined as the collection of stormwater runoff for application in irrigation or industrial uses [
18].
Stormwater harvesting can be used to reduce the overall mass loading of pollutants to a surface water body by reducing the volume of water that is discharged. In addition to pollutant loading reduction, the reduction in discharge volume of discharge to a surface water body can also be advantageous. An example of when discharge volume reduction is important is the discharging of stormwater into a marine estuary, which causes a reduction in salinity. The use of harvested stormwater for non-potable applications, such as irrigation, saves money and reduces the withdrawal from the aquifers by reducing the volume of potable water used for non-potable applications [
18]. An in-depth sample design of a
Bio-detention & Harvesting Swale System, which utilizes Bold & Gold™ can be found in Hood [
10].
5. Conclusions
The phosphorus loadings in stormwater runoff from highways are a source of aquatic pollution and can result in the eutrophication of surface water bodies. Treatment of stormwater for phosphorus removal is frequently necessary to sustain ecological and economical benefits related to aquatic resources. Bold & Gold™, a type of BAM, is specifically made to provide habitat for algae and bacteria, thus enabling the capture of nutrients via biosorption. Furthermore, Bold & Gold™ is composed of clay and tire crumb, which are known to readily adsorb phosphorus species. The data presented in this paper indicate that BAM bio-filtration systems are a feasible treatment method for removing phosphorus from highway runoff. The specific type of BAM utilized in this study is Bold & Gold™. For the test conditions of this study, Bold & Gold™ bio-filtration systems are capable of 71% total phosphorus and 95% soluble reactive phosphorus removal efficiencies. A comparison of the effluent concentrations utilizing an ANOVA test revealed that the Bold & Gold™ bio-filtration system has a 96% lower effluent concentration of SRP and a 78% lower total phosphorus effluent concentration than the sandy soil bio-filtration system.

