1. Introduction
West Africa has been going through a long-term drought since the end of the 1960s. This trend has been particularly noted in the Sahel, but appears to have been attenuated in the last decade in the eastern and central parts of the Sahel. On the other hand, annual rainfall remains very low in the western part of the Sahel.
It is well established that for the period of 1970–2000, the decrease in the mean annual discharge of the region’s largest rivers, namely the Senegal and Niger rivers, was in proportion almost twice as much as the decrease in rainfall [
1,
2]. Similar trends have been observed for smaller river systems [
3,
4] while, in contrast, other studies have indicated a runoff increase in some Sahelian catchments [
5,
6,
7,
8].
The increase in discharge of the Sahelian Rivers, despite the reduction in rainfall, was first noticed by Albergel [
5] in Burkina Faso, hence the term “Sahelian Paradox” used in the following to designate this unexpected behavior. Similar observations were made for the Nakambé River, one of the main tributaries of the Upper Volta River in Burkina Faso [
7], and for the right bank tributaries of the Niger River during its Sahel crossing [
9]. In these two areas, the increase was mainly observed during the drought years from 1968 to 1995 [
10]. This is an almost general observation in Sahelian areas, and it led to an increase in the number, size, and duration of ponds in some endorheic areas, and then a rise in groundwater level, ponds being their main recharge area [
11,
12].
A great deal of attention was dedicated to rainfall evolution in West Africa; the great drought that affected the region being the strongest climatic signal observed in the World since the beginning of meteorological observations [
13]. Le Barbé and Lebel [
14] already characterized this phenomenon, and more recently, Ali and Lebel [
15] and Lebel and Ali [
16] showed that this is ongoing in the western part of West Africa while it is partially attenuated in the central and eastern Sahel; however this attenuation is linked to an increase in the inter-annual variability. Mahé and Paturel [
17] divided the Sahel into four different areas, opposing the North-Western Sahel where drought remains severe and the South-Eastern Sahel where it is almost completely attenuated.
As rainfall has decreased during this period, the increase in runoff cannot be due to climatic reasons; land cover has effectively changed significantly in the last few decades. At the local scale, the land use changes have been shown to lead to an evolution of soil physical characteristics, mainly bulk density, porosity, hydraulic conductivity, and a reduction in infiltration rates as well as a significant increase in runoff [
18,
19,
20].
At the meso scale and the regional scale, the cumulative effect of the changes in small catchments leads to modification in the behavior (discharges and regime) of larger river basins [
10]. Land-cover changes, most often resulting from land use changes, trigger alterations in hydrodynamic soil behavior—for instance, increase in bare soil areas causes erosion and soil crusting—and can impact the local and regional water budget. Land use changes have obviously occurred, and their hydrological effects have been demonstrated; but how much of a reality is the land use change at the regional scale?
What is a more accurate indicator of land use/land cover changes (LULC)?
(1) Some previous studies based on satellite image vegetation indices [
21,
22,
23,
24] have perhaps led to an overestimation of vegetation cover through the Sahel in recent years (after 1994). At the local scale, these results have been corroborated by some observations. Non-governmental organizations involved in tree planting have recorded some success, particularly in areas such as Keita in central Niger [
25,
26], as well as near Aguié, near Zinder and along the Niger-Nigeria boundary in eastern Niger [
27,
28]. Similar re-greening experiments in Burkina Faso [
29] and in eastern Senegal (region of Goudiry) have also been successful. Inversely, there has been a significant decrease in biomass in the Sudanian climatic region: this area was barely exploited until the drought and its population was relatively sparse, due to the prevalence of trypanosomiasis as well as the effect of the slave trade on population density, and this relative vacuum is being filled.
(2) Recent studies of Hountondji
et al. [
30] and Hein and de Ritter [
31] highlighted the limitations of vegetation indices (NDVI, EVI, SAVI, NSAVI,
etc.) for the determination of land use and land use changes when using remote sensing at low resolution (AVHRR, SPOT/VGT). These authors recommend the use of NDVI/P or NPP/P ratio (net primary productivity/rainfall) instead of any vegetation index.
Most of the land cover studies based on aerial photograph analyses show a decrease in vegetation cover throughout the Sahel ([
32,
33,
34,
35,
36,
37] among others). This is corroborated by the official statistical data of cropping areas. For the Niger Republic during the 1999–2006 period, Garba [
38] observed a decrease in biomass in a study based on NDVI; but he explains this by the fact that the year 1999–2000 was a humid one. Karambiri
et al. [
39], Diello
et al. [
40] and Hauchart [
41] also noticed a reduction in vegetation cover in two different regions of Burkina Faso (the Nakambe and Mouhoun basins). Liénou
et al. [
42] made similar observations in Cameroon, which are consistent with the works of Amani and Nguetora [
9], and Mahé
et al. [
43] on the west bank of the Niger River. Statistical data of the FAO indicated a yearly decrease of 3.7% in the biomass for the Niger Republic, and Hiernaux
et al. [
44] measured an annual reduction of 2.7% of this biomass in the Fakara (Western Niger).
(3) Mapping studies of land use and land cover carried out within the AMMA (African Monsoon Multidisciplinary analysis) project indicated that it is necessary to apply different methods depending on the considered area, Sudanian or Sahelian.
Glenn
et al. [
45] achieved better accuracy using the EVI than the NDVI, and obtained rather good correlations with fields data (flux tower particularly).
The objectives of this paper are the following:
To synthesize the runoff measurements realized in the framework of the AMMA program at the point and the local scales, and compare them with some previous results obtained in the same or similar basins;
To analyze the runoff evolution at the meso and the regional scales
To determine at which scales runoff evolution can be related with land use changes;
To define the spatial and temporal extension of the Sahelian paradox.
2. Material and Methods
This study is mainly based on two sources of data:
The methods to be applied to attain the stated objectives include the following:
Analysis of plots runoff and river discharge data (in order to characterize the trends in the river discharge records) at several scales:
- ▪
At the local scale: Tondi Kiboro and Wankama catchments, as well as 20 experimental plots of 10 and 100 m2 located in the same catchments; these data were collected during the AMMA experiment (2004–2008). On the plots, the measurements were made after each event; on the catchment, stream gauges (equipped with OTT Thalimedes devices) allowed the monitoring of the discharges;
- ▪
At the meso scale:
- ➢
Some small direct tributaries of the Niger River; despite discharges are registered since 2008 in two catchments near Niamey (Niger), we only use here the regional balance allowed by the comparison of data of the stations located in the Niger River upstream (Kandadji) and downstream (Niamey) the studied stretch
- ➢
The main tributaries of Niger River’s middle stretch ([
36,
10]).
- ▪
At the regional scale: discharge data of some West African rivers allowed these analyses.
Analyses of land cover data (including agricultural data, NDVI,
etc.) were realized during AMMA experiments ([
46]; and a map of land cover in the square degree of Niamey realized by Ottlé, C. in [
46,
47]).
Analyses of precipitation trends across the Sahel of Ali and Lebel [
15] and Lebel and Ali [
16].
Table 1 summarizes all the data used in this study;
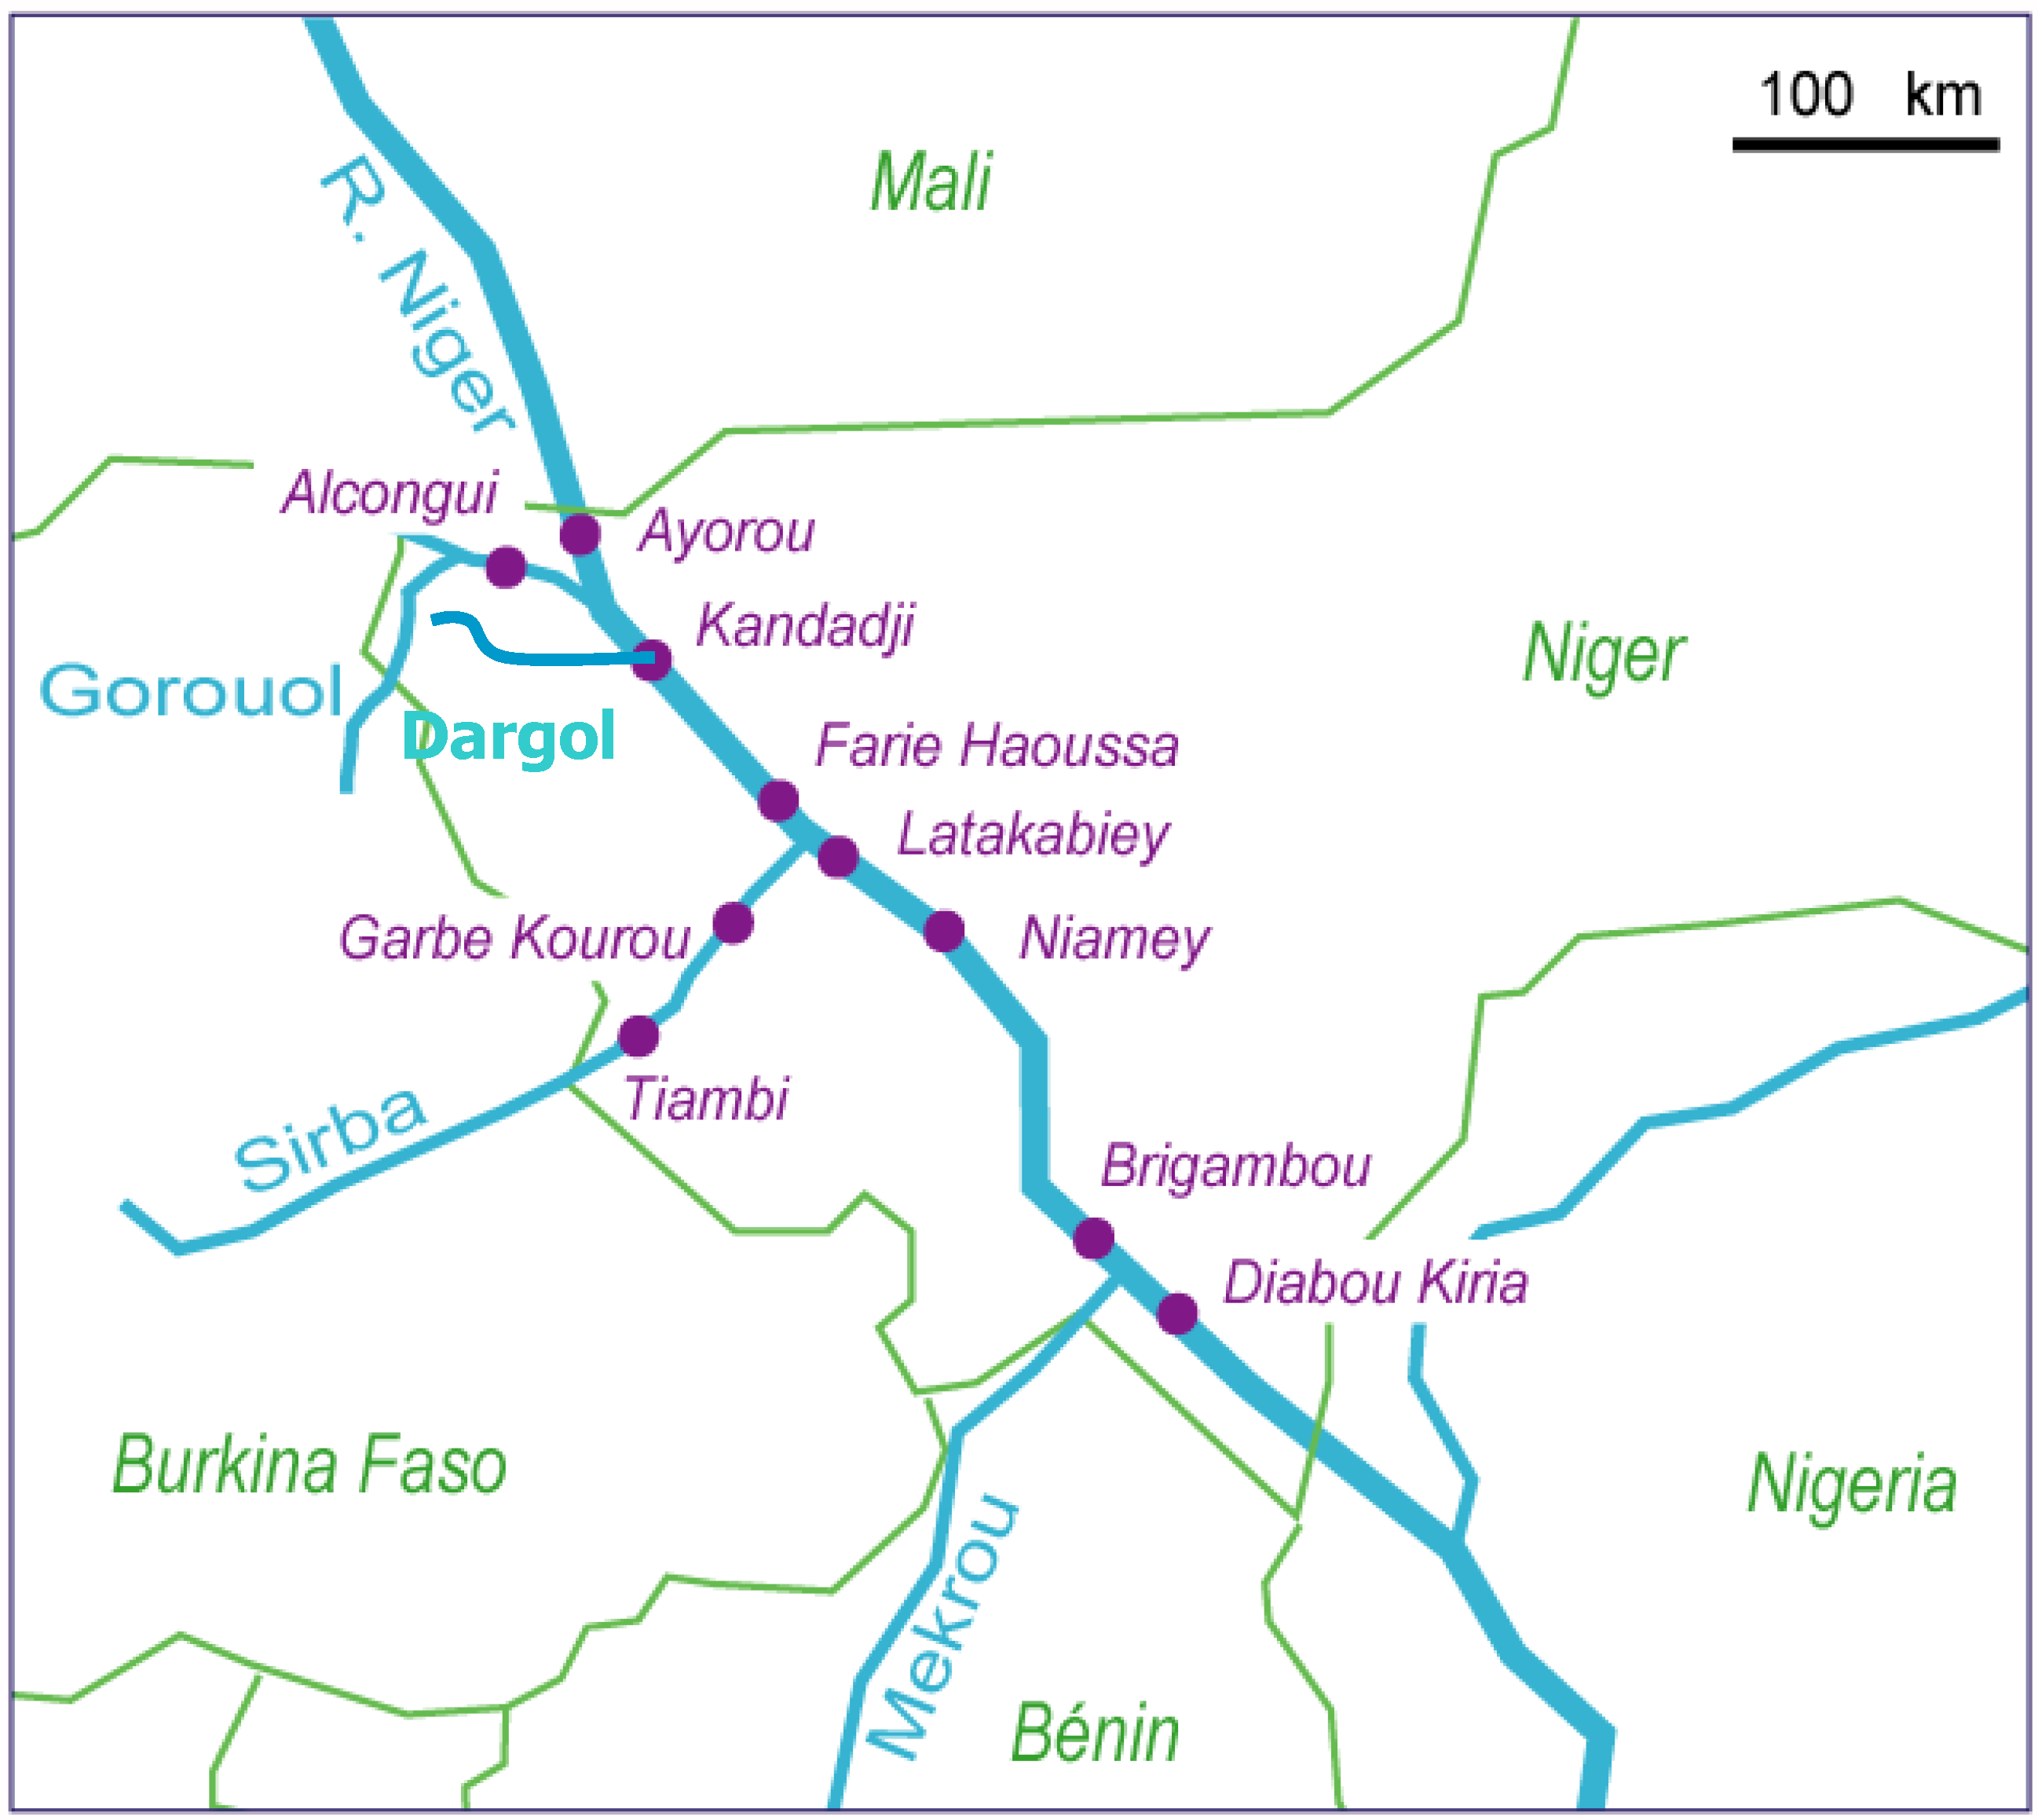
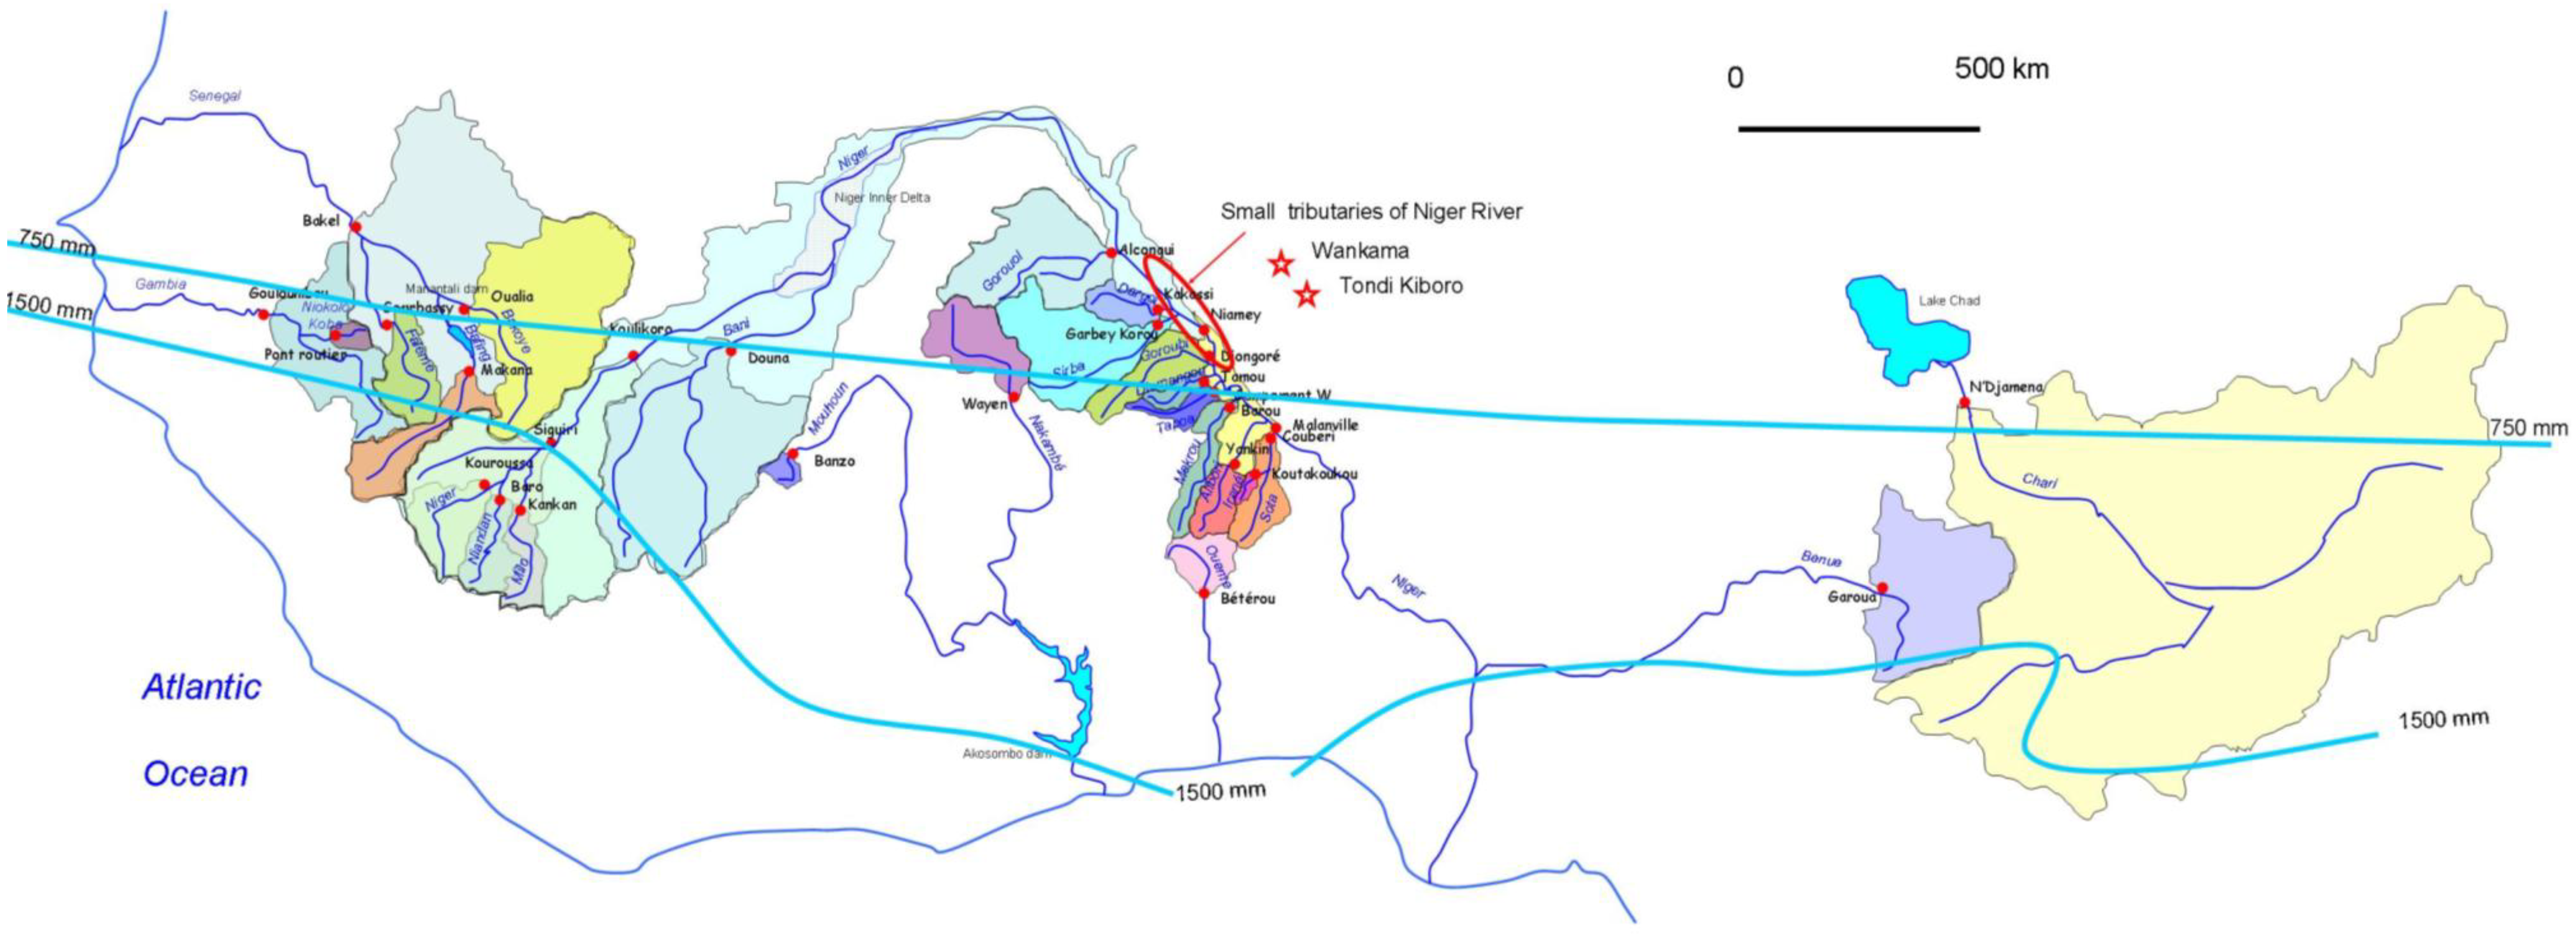
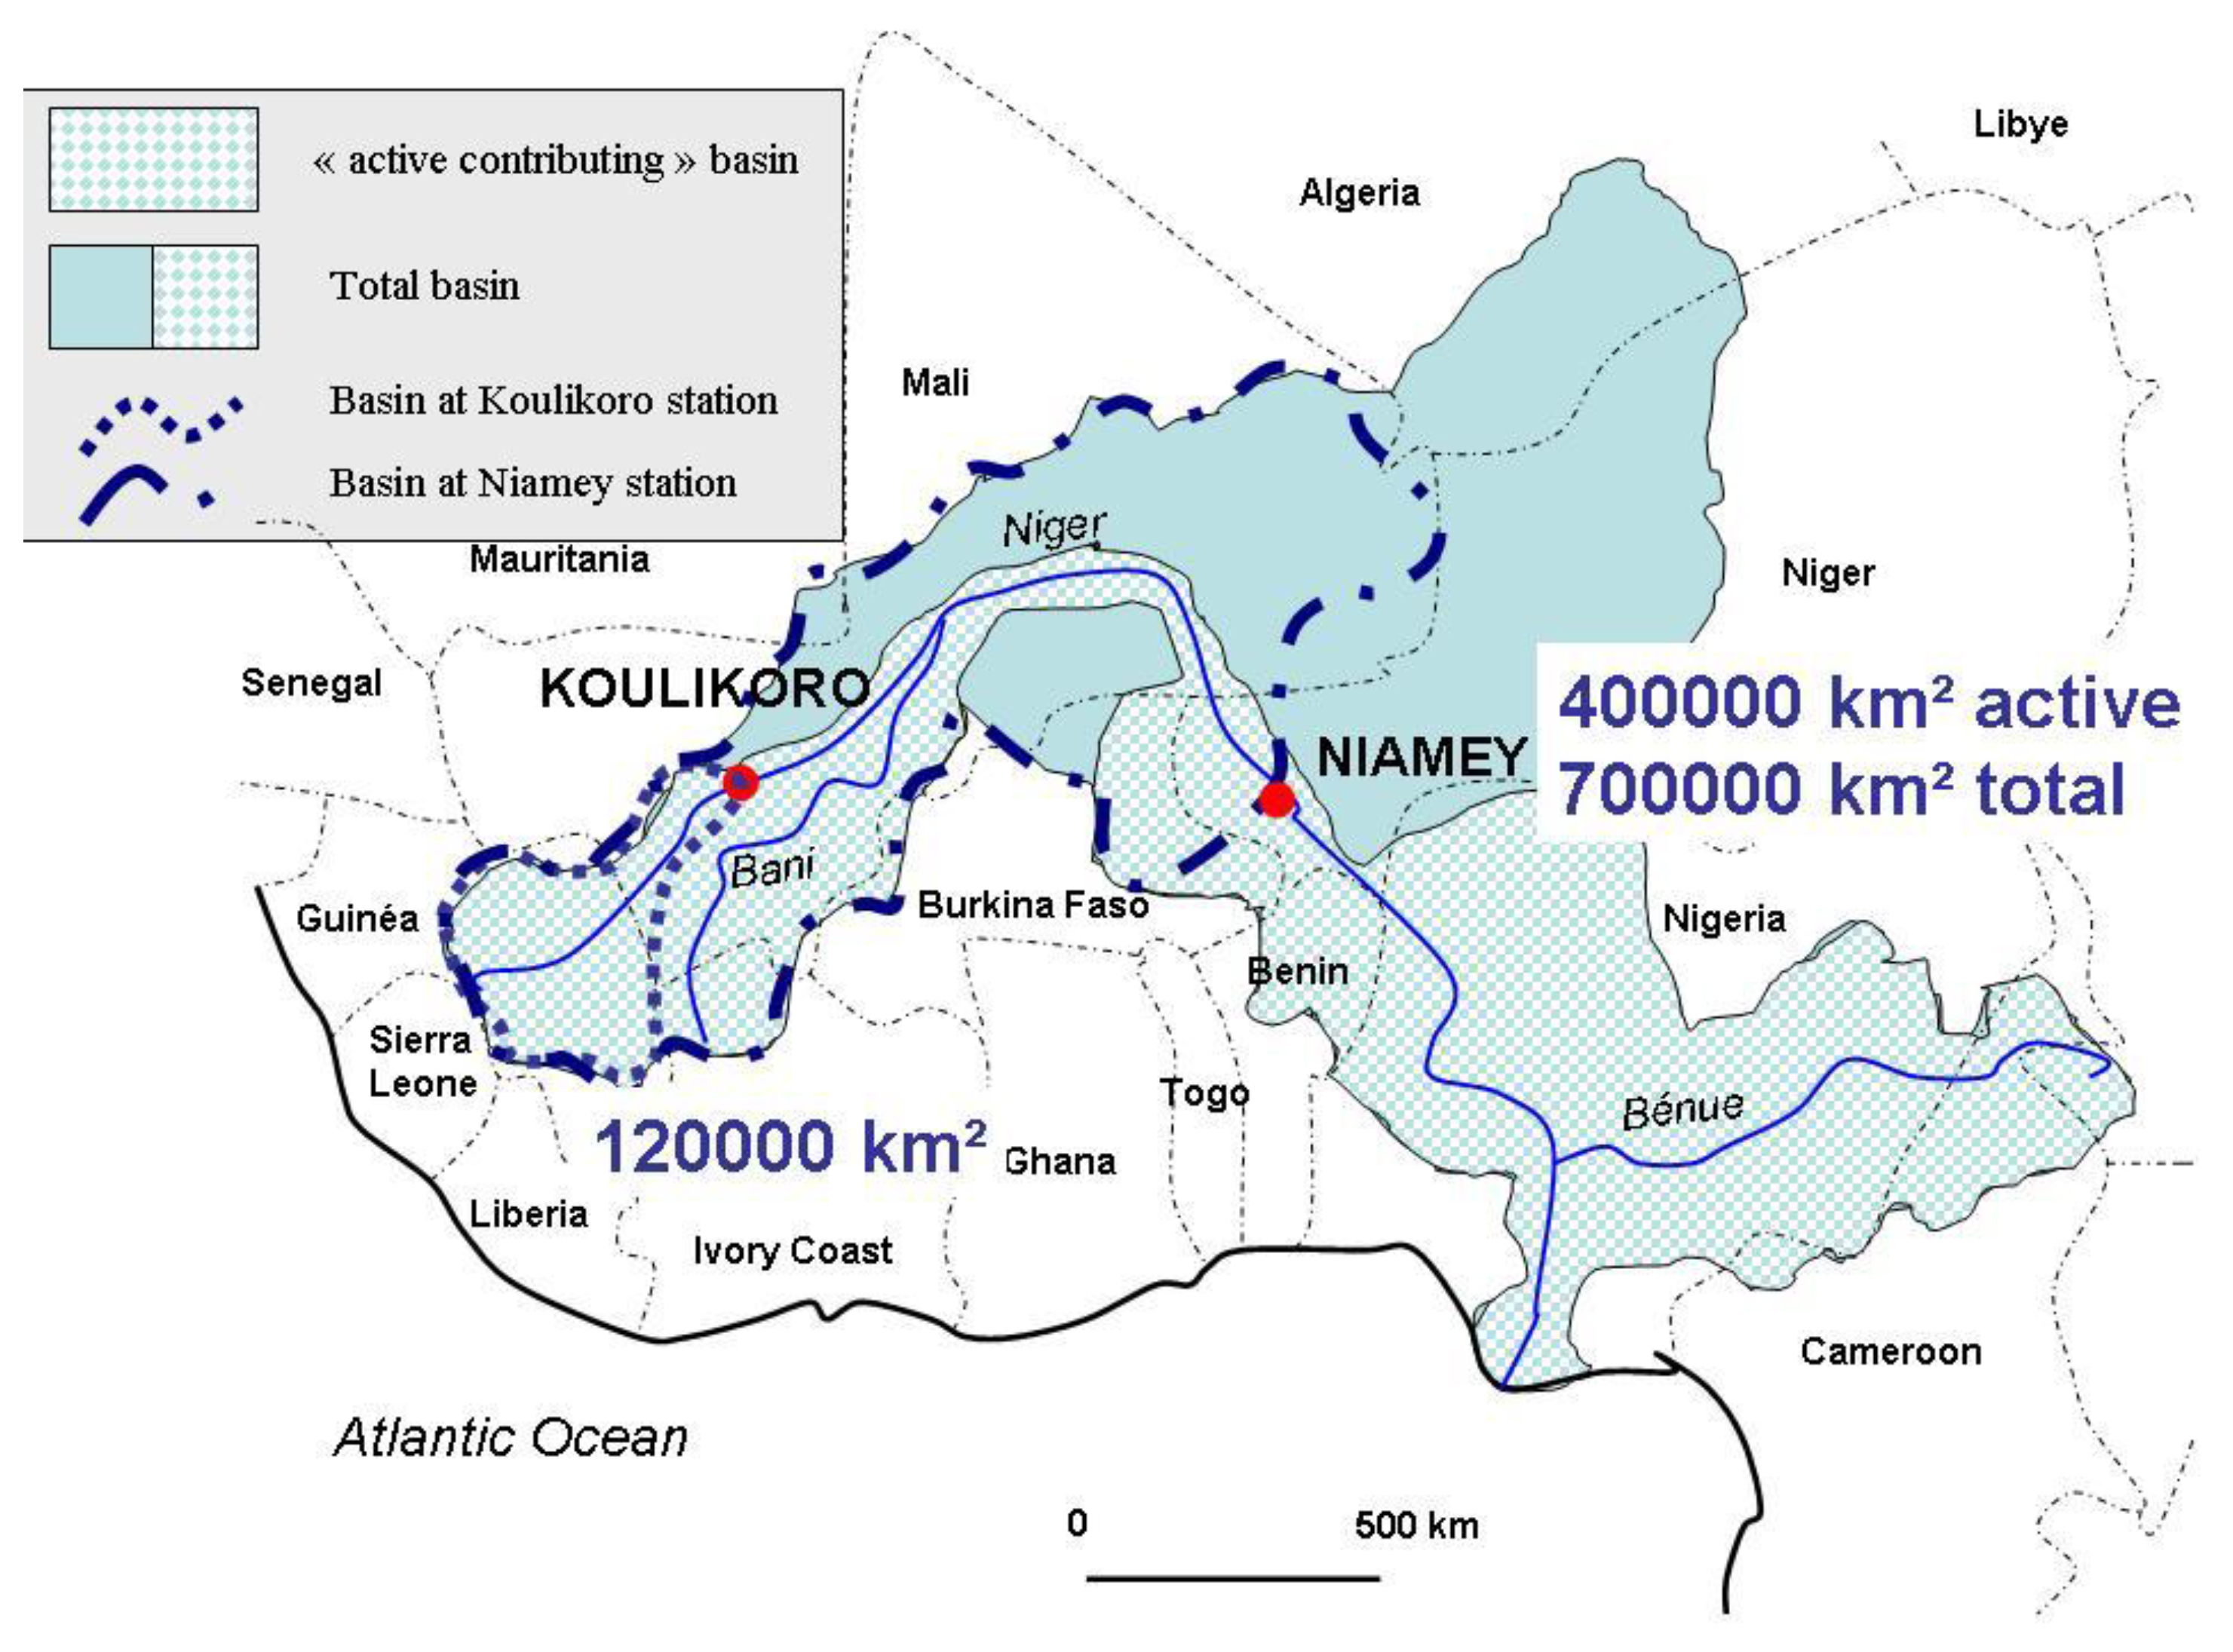
Figure 1 shows the location of each catchment.
Figure 1.
Location of the experimental sites and rivers analyzed and/or cited. The 700 and 1,400 mm isohyets are the common southern boundaries of Sahel and Sudan.
Figure 1.
Location of the experimental sites and rivers analyzed and/or cited. The 700 and 1,400 mm isohyets are the common southern boundaries of Sahel and Sudan.
Table 1.
Data, area and periods monitored, rainfall and runoff data used in this study.
Table 1.
Data, area and periods monitored, rainfall and runoff data used in this study.
| Catchment | Area size | Rainfall data | Hydrological data | Measurement years |
|---|
| Plots | 16 plots of 10 m2
4 plots of 100 m2 | Rain gauges | Event scale | 2004–2008 |
| Micro-catchments | 5 to 32 ha
Wankama 32 ha
Tondi K amont 4.6 ha
Tondi K aval 11 ha
Tondi K bodo 12 ha | Rain gauges | monitoring | 2004–2008 |
| Meso scale basins 1 | 5 to 500 km2 | Rain gauges | * | 2008–2009 |
Niger tributaries
(meso scale basins 2) | 5 to 50,000 km2
Gorouol 46,000 km2
Dargol 6,500 km2
Sirba 38,000 km2 | Rainfall index | Annual data | 1950–2006 |
| 29 catchments | From 1,250 to 600,000 km2 | Rainfall index | Runoff index | 1950–2000 |
Hydrological and rain fall data were critically analyzed and their validity assessed before carrying out river discharge and rainfall/runoff evolution analyses. The standardized rainfall is that proposed by Ali and Lebel (2009), which is computed as:
where
SPI2 is the Standardized Precipitation Index, a regional rainfall index of year
i,
is the regional rainfall of year
i,
is the interannual regional rainfall average, σ
R is the standard deviation of
.
Regional refers here to an area value computed over the whole Sahelian and Sudanian areas. In the following, we will consider the Sahelian areas as those where annual rainfall is less than 700 mm, the Sudanian as the areas receiving from 700 to 1,400 mm annually, and the Guinean region where annual rainfall exceeds 1,400 mm.
The regional indices were built with the data of 273 rain gauges ([
15,
16]). The location is specified in the papers (maps). The authors created various rainfall indices according to the longitude of the area, one of their aims being to demonstrate that the drought is ongoing in West Africa, overall in the western part of this region.
Runoff index is calculated on the same way.
where
SRI2 is the basin Standardized Runoff Index of year
i,
is the basin runoff of year
i,
is the interannual runoff average, σ
B is the standard deviation of
R. Runoff is calculated by basin. The indices are calculated by basin, using the data specified in
Table 1.
3. Results
The results include but are not limited to
A characterization of the phenomenon of increasing river flows at selected gauging stations on rivers across the Sahel;
An attempt of classification of the basins according to their hydrological behavior, the geographical location and the land cover changes.
3.1. At the Local Scale
runoff and erosion rates were measured at the experimental plots scale; the 20 plots were sixteen 10 m
2 and four 100 m
2 plots representative of the typical land covers. Runoff coefficients at the plot scale are summarized in
Table 2.
Table 2.
Mean runoff coefficient and erosion rates at the plot scale (20 plots, 2004–2008). Data are the average of five years measurement in four plots of 10 m2 and one plot of 100 m2 for each class.
Table 2.
Mean runoff coefficient and erosion rates at the plot scale (20 plots, 2004–2008). Data are the average of five years measurement in four plots of 10 m2 and one plot of 100 m2 for each class.
| | Runoff coefficient % | Erosion kg ha−1 |
|---|
| millet | 3.8 | 373 |
| fallow | 10.5 | 881 |
| ERO crust | 60 | 5566 |
| ALG crust | 25 | 863 |
Although we have only a five years period of measurement without any antecedent period to compare with, these data are consistent with our approach, as map data with the spatial extents of each land cover class exists for some period in recent decades.
Effectively, some land use mapping allowed us to compare the situation of land cover for two periods: 1991–1994 and 2004–2008 for two small catchments of approximately 12 hectares near Tondi Kiboro, and near Banizoumbou, 70 km east of Niamey.
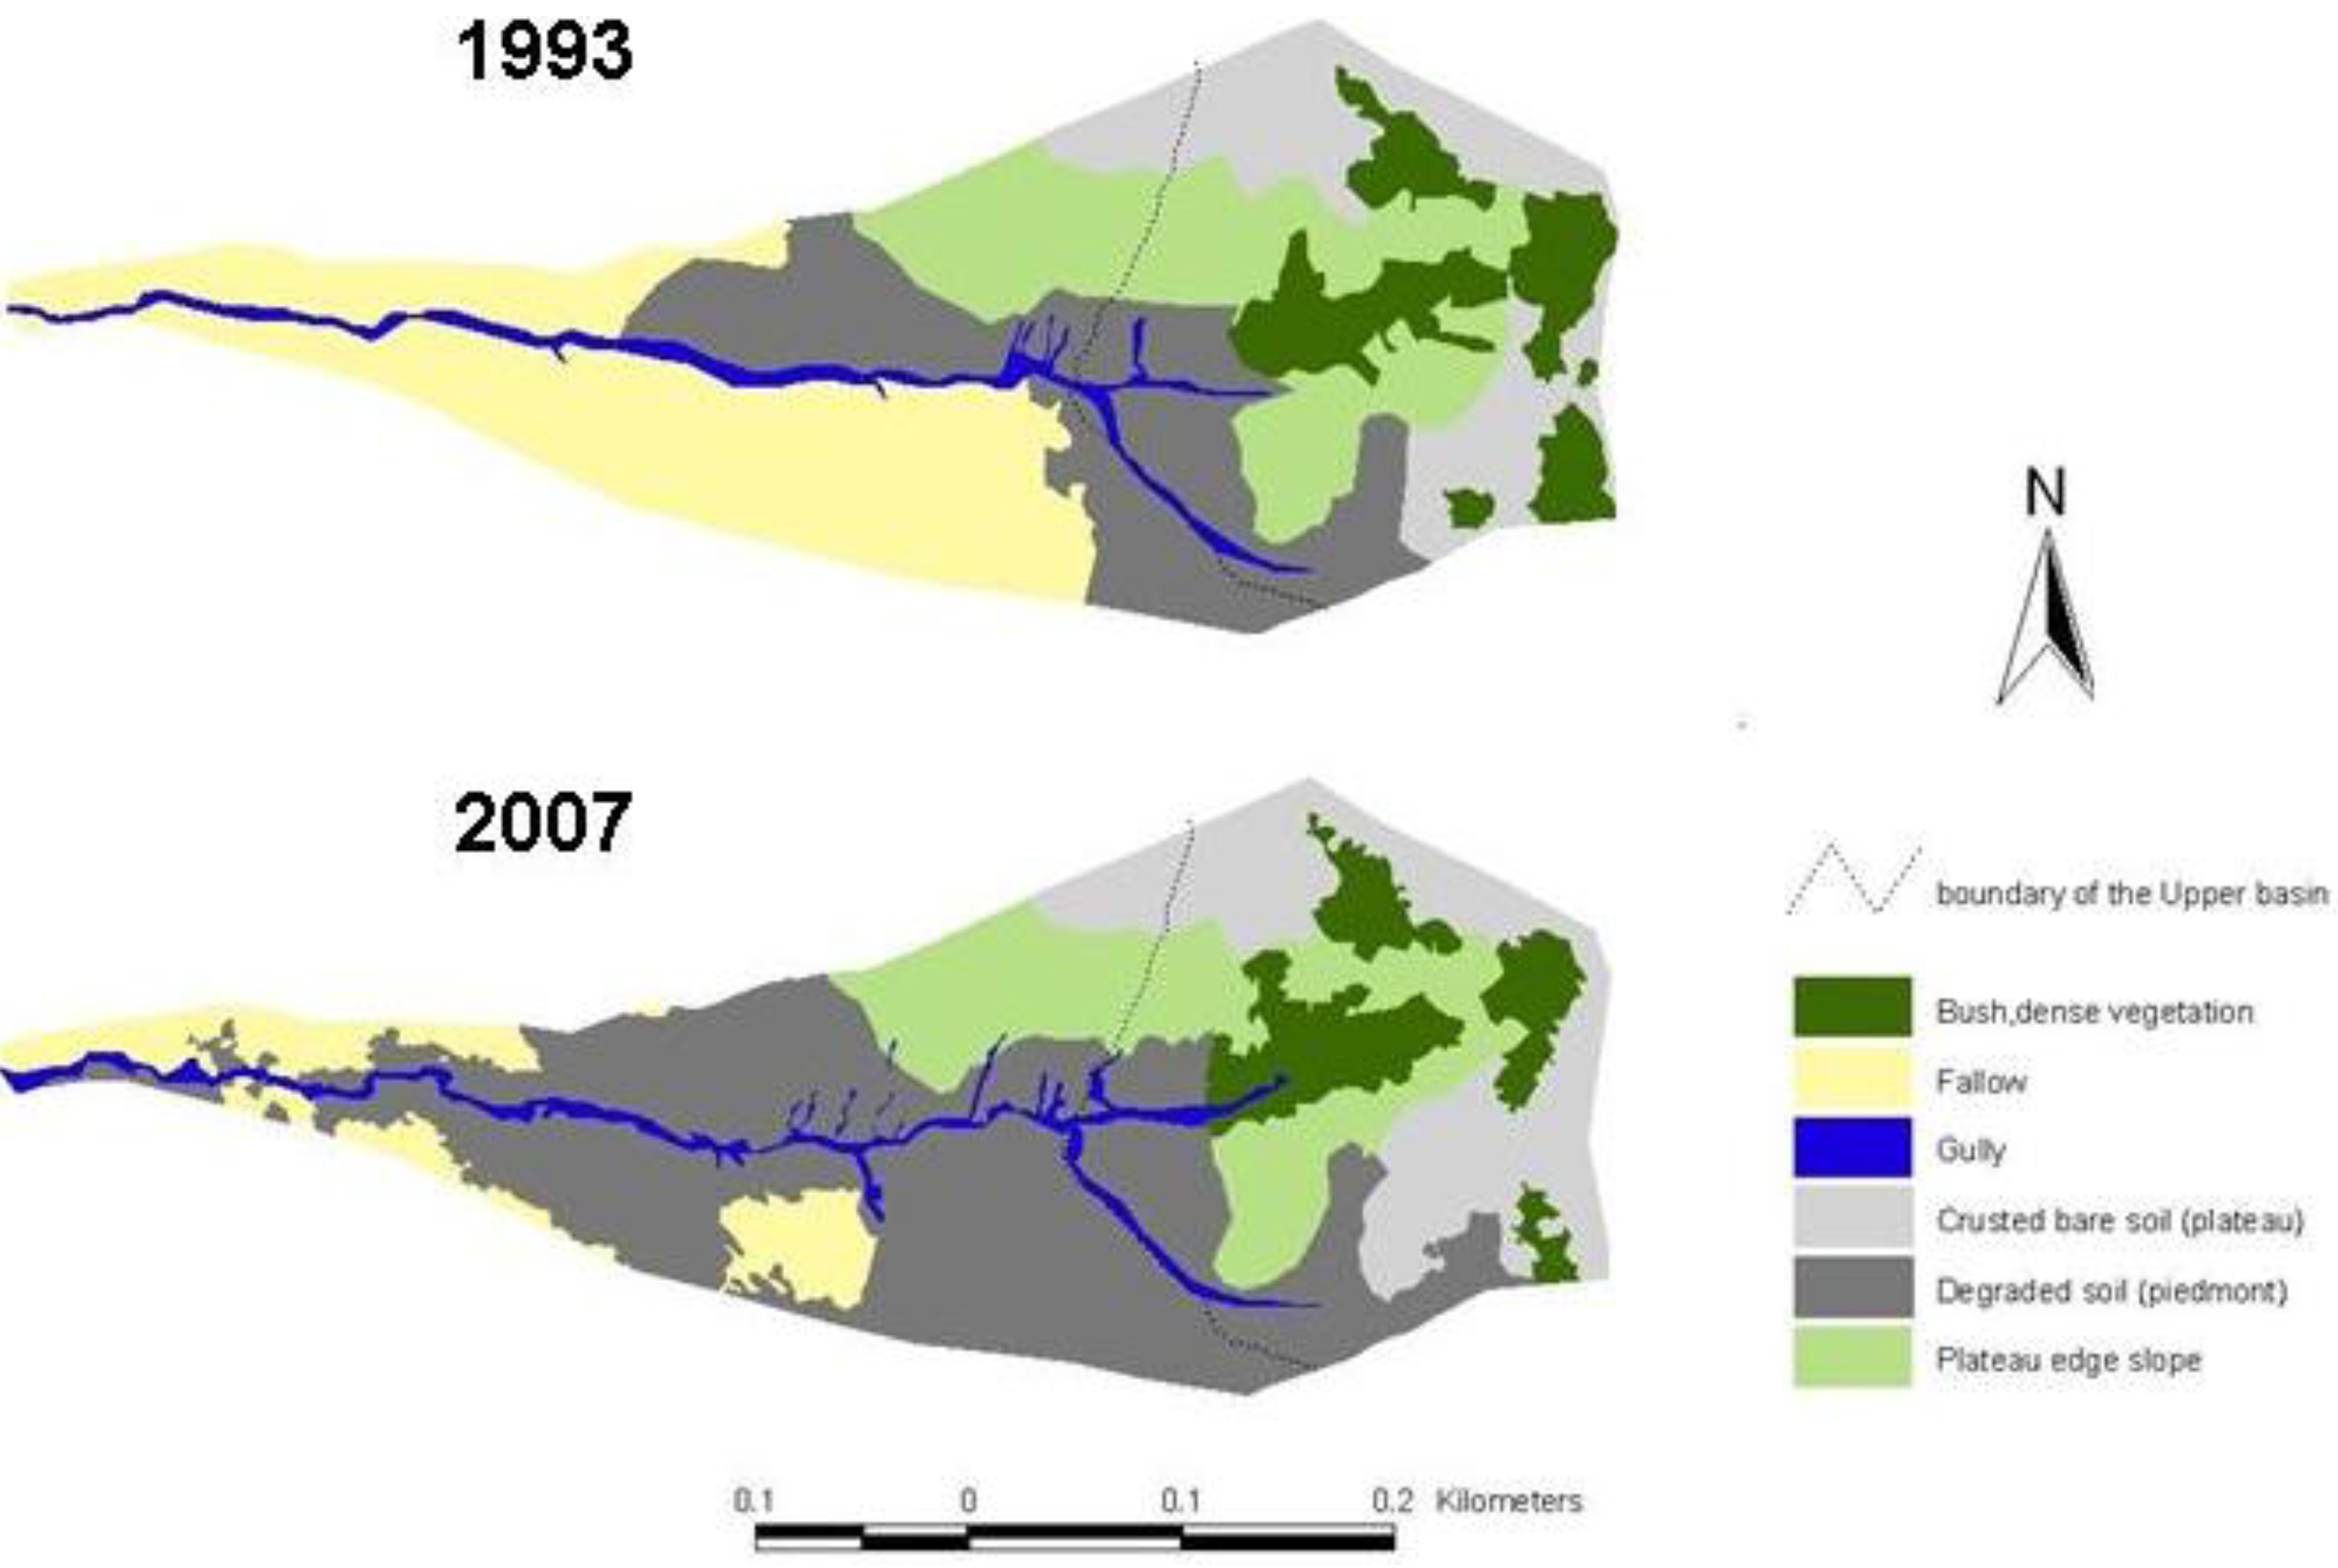
Figure 2 shows the land use change in this micro-catchment between 1993 and 2007.
Figure 2 shows a strong increase in bare and degraded soils from 1993 to 2007, which were 16% of the total area in 1993 and 38% in 2007. This seems representative of the regional trend. In the nearby catchment of Wankama, a monitoring of LULC since 1950 using aerial photographs indicated that degraded soils covered 5% of this 1.5 km
2 catchment in 1950, 17% in 1975, 31% in 1992 and 47% in 2005 [
48].
The combination of the information in
Table 2 (difference in runoff coefficient depending on the land cover) and
Figure 2 (the extension of degraded bare and crusted soils) can explain the results summarized in
Table 3, highlighting a significant increase in runoff coefficient between the two periods 1991–1994 and 2004–2008. Column (2) of
Table 3 shows that in the three cases, runoff depth increased between the two periods. In the three basins or sub basins considered, the annual runoff coefficient (Column (3)) increased over time,except in TK aval, where it was proved that there was a strong increase in volume of infiltration water between the two stream gauges (TK amont catchment is the upper, embedded part of the TK aval catchment). At the event time scale (Column (4)), all the runoff coefficients increased, including at TK aval. Finally, a significant decrease in total stream flow duration was observed over the time (Column (5)). However it is worth noticing that total rainfall amount is similar in both periods, but the mean rainfall intensity of the 30% higher rainfall events is 14 mm h
−1 in the second period (2004–2008) instead of 12 mm h
−1 during the second.
Figure 2.
Evolution of land use and land cover between 1993 and 2007 in the “Tondi Kiboro aval” catchment; the catchment area is 11 hectares.
Figure 2.
Evolution of land use and land cover between 1993 and 2007 in the “Tondi Kiboro aval” catchment; the catchment area is 11 hectares.
Table 3.
Runoff coefficient in the Tondi Kiboro (TK) catchment between the two periods (1991–1994 and 2004–2008).
Table 3.
Runoff coefficient in the Tondi Kiboro (TK) catchment between the two periods (1991–1994 and 2004–2008).
| 1991–1994 | Rainfall (1) (mm) | Runoff (2) depth (mm) | runoff (3) coefficient | rainfall/runoff (4) relationship | Flow annual (5) duration (hours) |
| TK amont | 512.8 | 180.3 | 0.35 | R = 0.56 P − 2.61 | 39.6 |
| TK aval | 512.5 | 132.6 | 0.26 | R = 0.43 P − 2.30 | 28.1 |
| TK Bodo | 485 | 185.2 | 0.38 | R = 0.53 P − 2.14 | 44.2 |
| | | | | | |
| 2004–2008 | Rainfall (mm) | Runoff depth (mm) | runoff coefficient | rainfall/runoff relationship | Flow annual duration (hours) |
| TK amont | 525.6 | 239.6 | 0.46 | R = 0.76 P − 4.80 | 36.3 |
| TK aval | 525.6 | 137.7 | 0.26 | R = 0.50 P − 3.59 | 19.1 |
| TK Bodo* | 567 | 265 | 0.47 | R = 0.85 P − 7.20 | 24.8 |
Thus, higher volumes of water flow are observed in a shorter elapsed time, as a result of a strong decrease in the soil water holding capacity and the increase in crusted soil areas.
3.2. At the Meso-Scale
The meso-scale was subdivided into two different scales:
basins of 100 to 1,000 km2, which are the direct ungauged tributaries of the Niger River;
basins of 5,000 to 50,000 km2, of the main Niger River tributaries in its middle reach.
3.2.1. At the 102–103 km2 Basin Scale
Recent and current studies [
37,
48,
49] have shown a significant degradation of slopes in the Niamey area. The direct tributaries seem to have a very special role, since the area of alluvial deposits of these tributaries in Niger River channel have increased in the two last decades.
Figure 3 shows the middle reach of Niger River and its main tributaries.
As an example, the basin of Boubon (
Figure 4) is one of the newly contributing areas flowing directly in the Niger River bed. Less than 30 of these “koris” (wadi or temporary stream flows) in the stretch between Kandadji and Niamey have become contributors in the two last decades, causing the large increase in River discharge showed in
Figure 5.
Figure 3.
Map of Niger River middle reach and its main tributaries. Location of tributaries and stream gauges stations of Kandadji and Niamey is indicated.
Figure 3.
Map of Niger River middle reach and its main tributaries. Location of tributaries and stream gauges stations of Kandadji and Niamey is indicated.
Figure 4.
Boubon basin (20 km NW of Niamey): an endorheic basin became an exorheic one, probably due to the strong spatial extension of degraded vegetation and soils.
Figure 4.
Boubon basin (20 km NW of Niamey): an endorheic basin became an exorheic one, probably due to the strong spatial extension of degraded vegetation and soils.
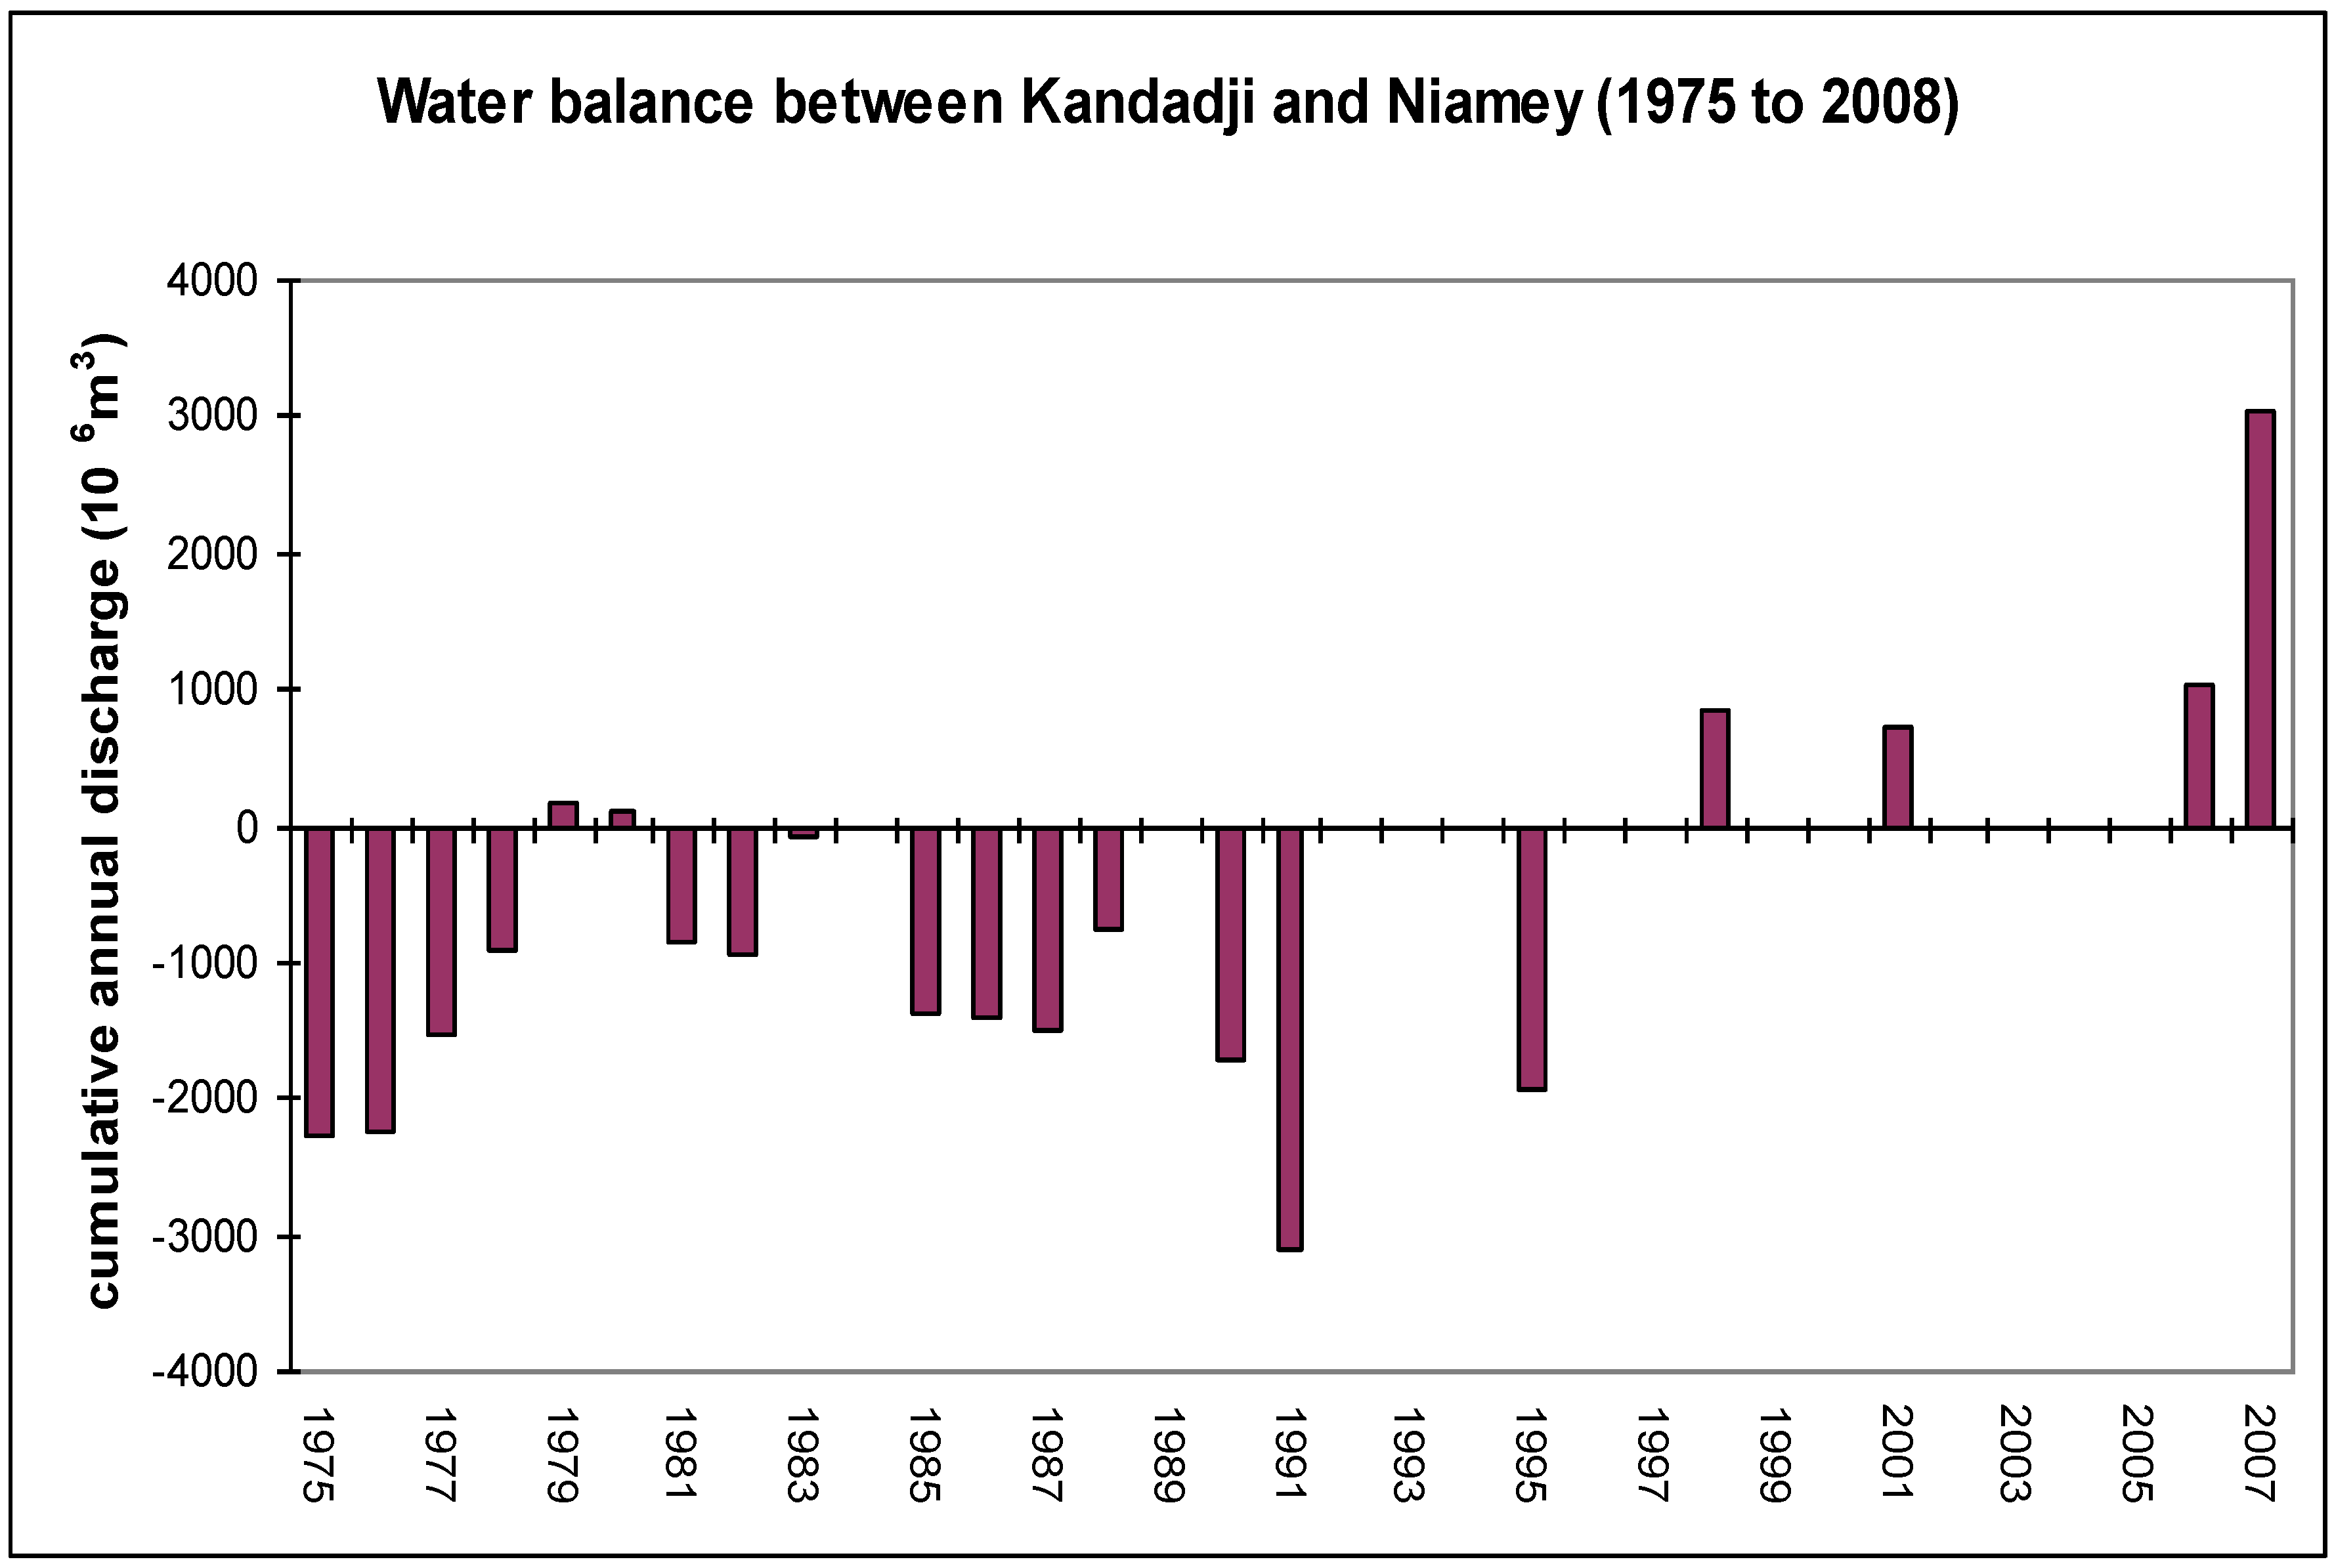
Figure 5 indicates the remaining annual balance of discharges between the two stream gauge stations of Kandadji and Niamey (see location in
Figure 3), after removal of the gauged discharges of the two main intermediate tributaries (Dargol and Sirba Rivers). It was observed that, in general, between 1975 and 1996 the input volume was greater than the output volume. Since 1998, for the years with complete discharge data, the reverse has been the case.
Figure 5.
Evolution of the remaining water balance between Kandadji and Niamey from 1975 to 2008, once the discharges of the two main tributaries between both stations, the Dargol and the Sirba, were removed (see
Figure 3). Years without column are missing data.
Figure 5.
Evolution of the remaining water balance between Kandadji and Niamey from 1975 to 2008, once the discharges of the two main tributaries between both stations, the Dargol and the Sirba, were removed (see
Figure 3). Years without column are missing data.
The input is the annual volume discharged at Kandadji plus the volumes discharged by the Dargol and Sirba rivers, while the output is the annual cumulative water discharged by the Niger at Niamey plus losses. These losses are due to evaporation, infiltration as well as water abstraction. Negative values in
Figure 5 occur when the annual cumulative discharge measured at Niamey is less than the sum of annual cumulative discharge of the Niger at Kandadji and the annual discharge volumes of Dargol and Sirba Rivers, while positive values indicate higher cumulative discharge at Niamey compared to all the upstream inputs. Although there is a serious lack of data for recent years,
Figure 5 shows that the increase in discharge of small direct tributaries of Niger River since the end of the 1990s widely compensate the common diminution of stream flow between both stations, due to evaporation and infiltration. It could be mostly due to the supplies of the newly contributive small tributaries (some tens or hundreds of km
2).
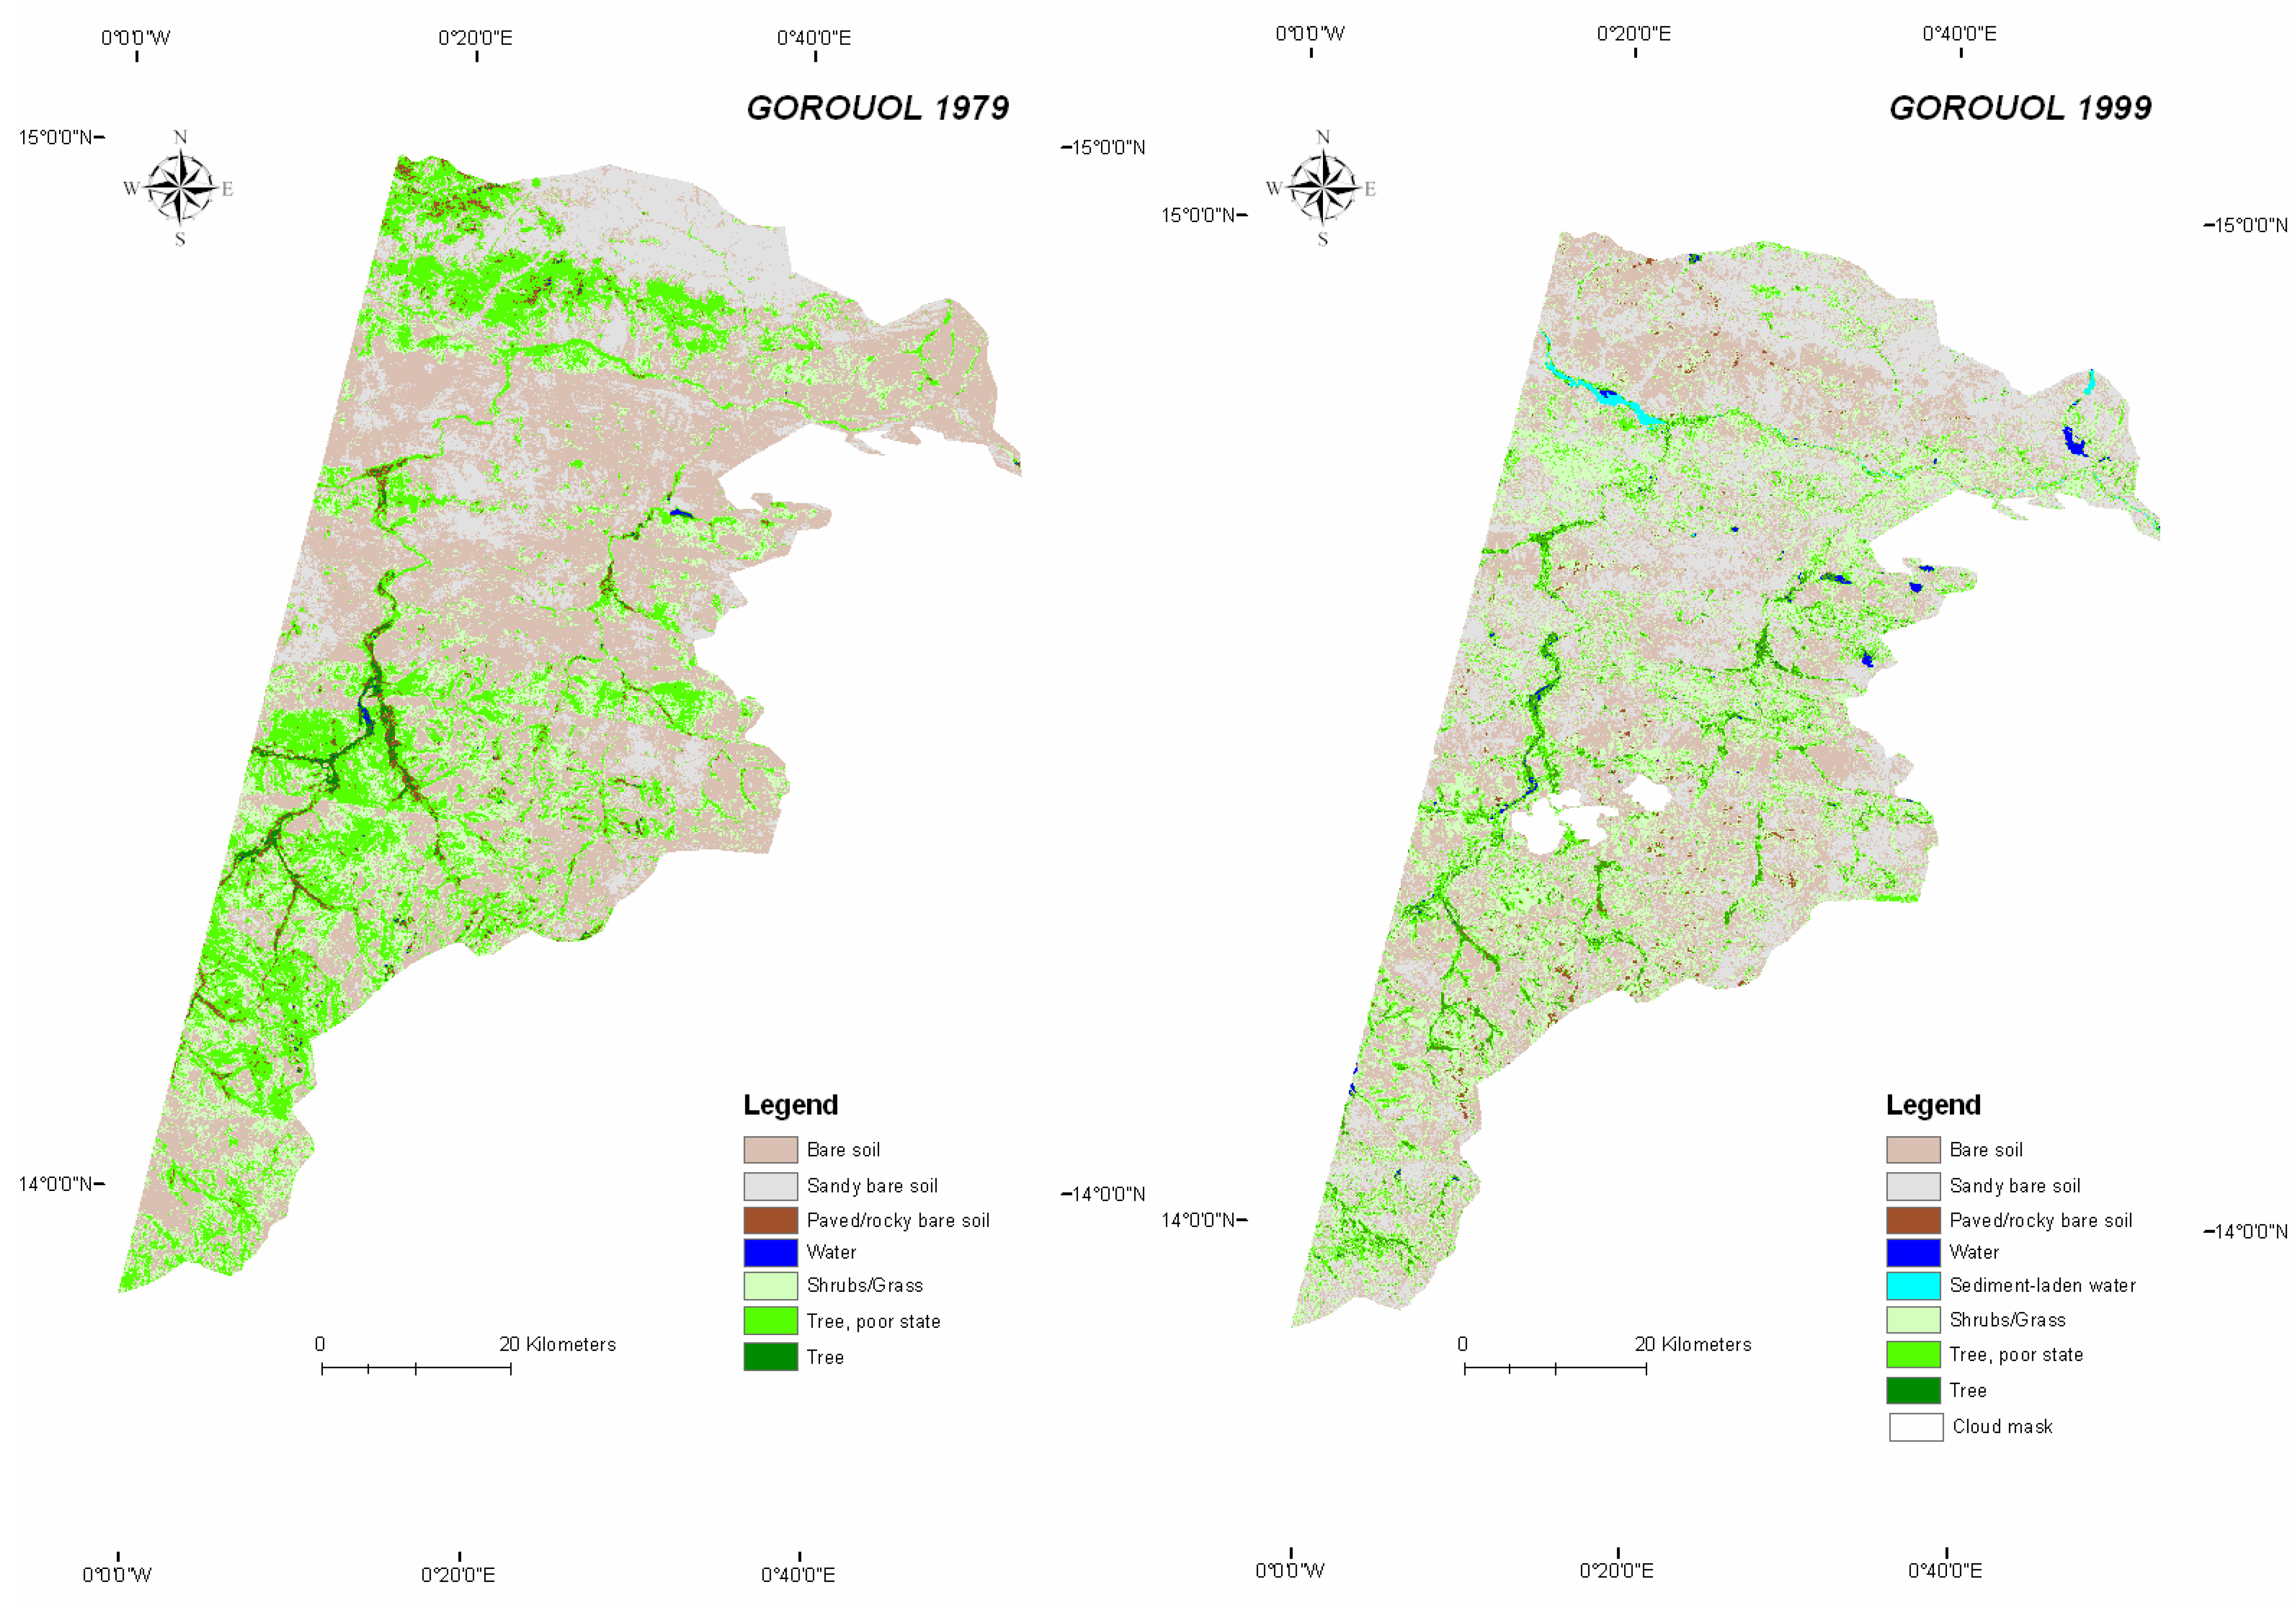
3.2.2. At the 104–105 km2 Basin Scale
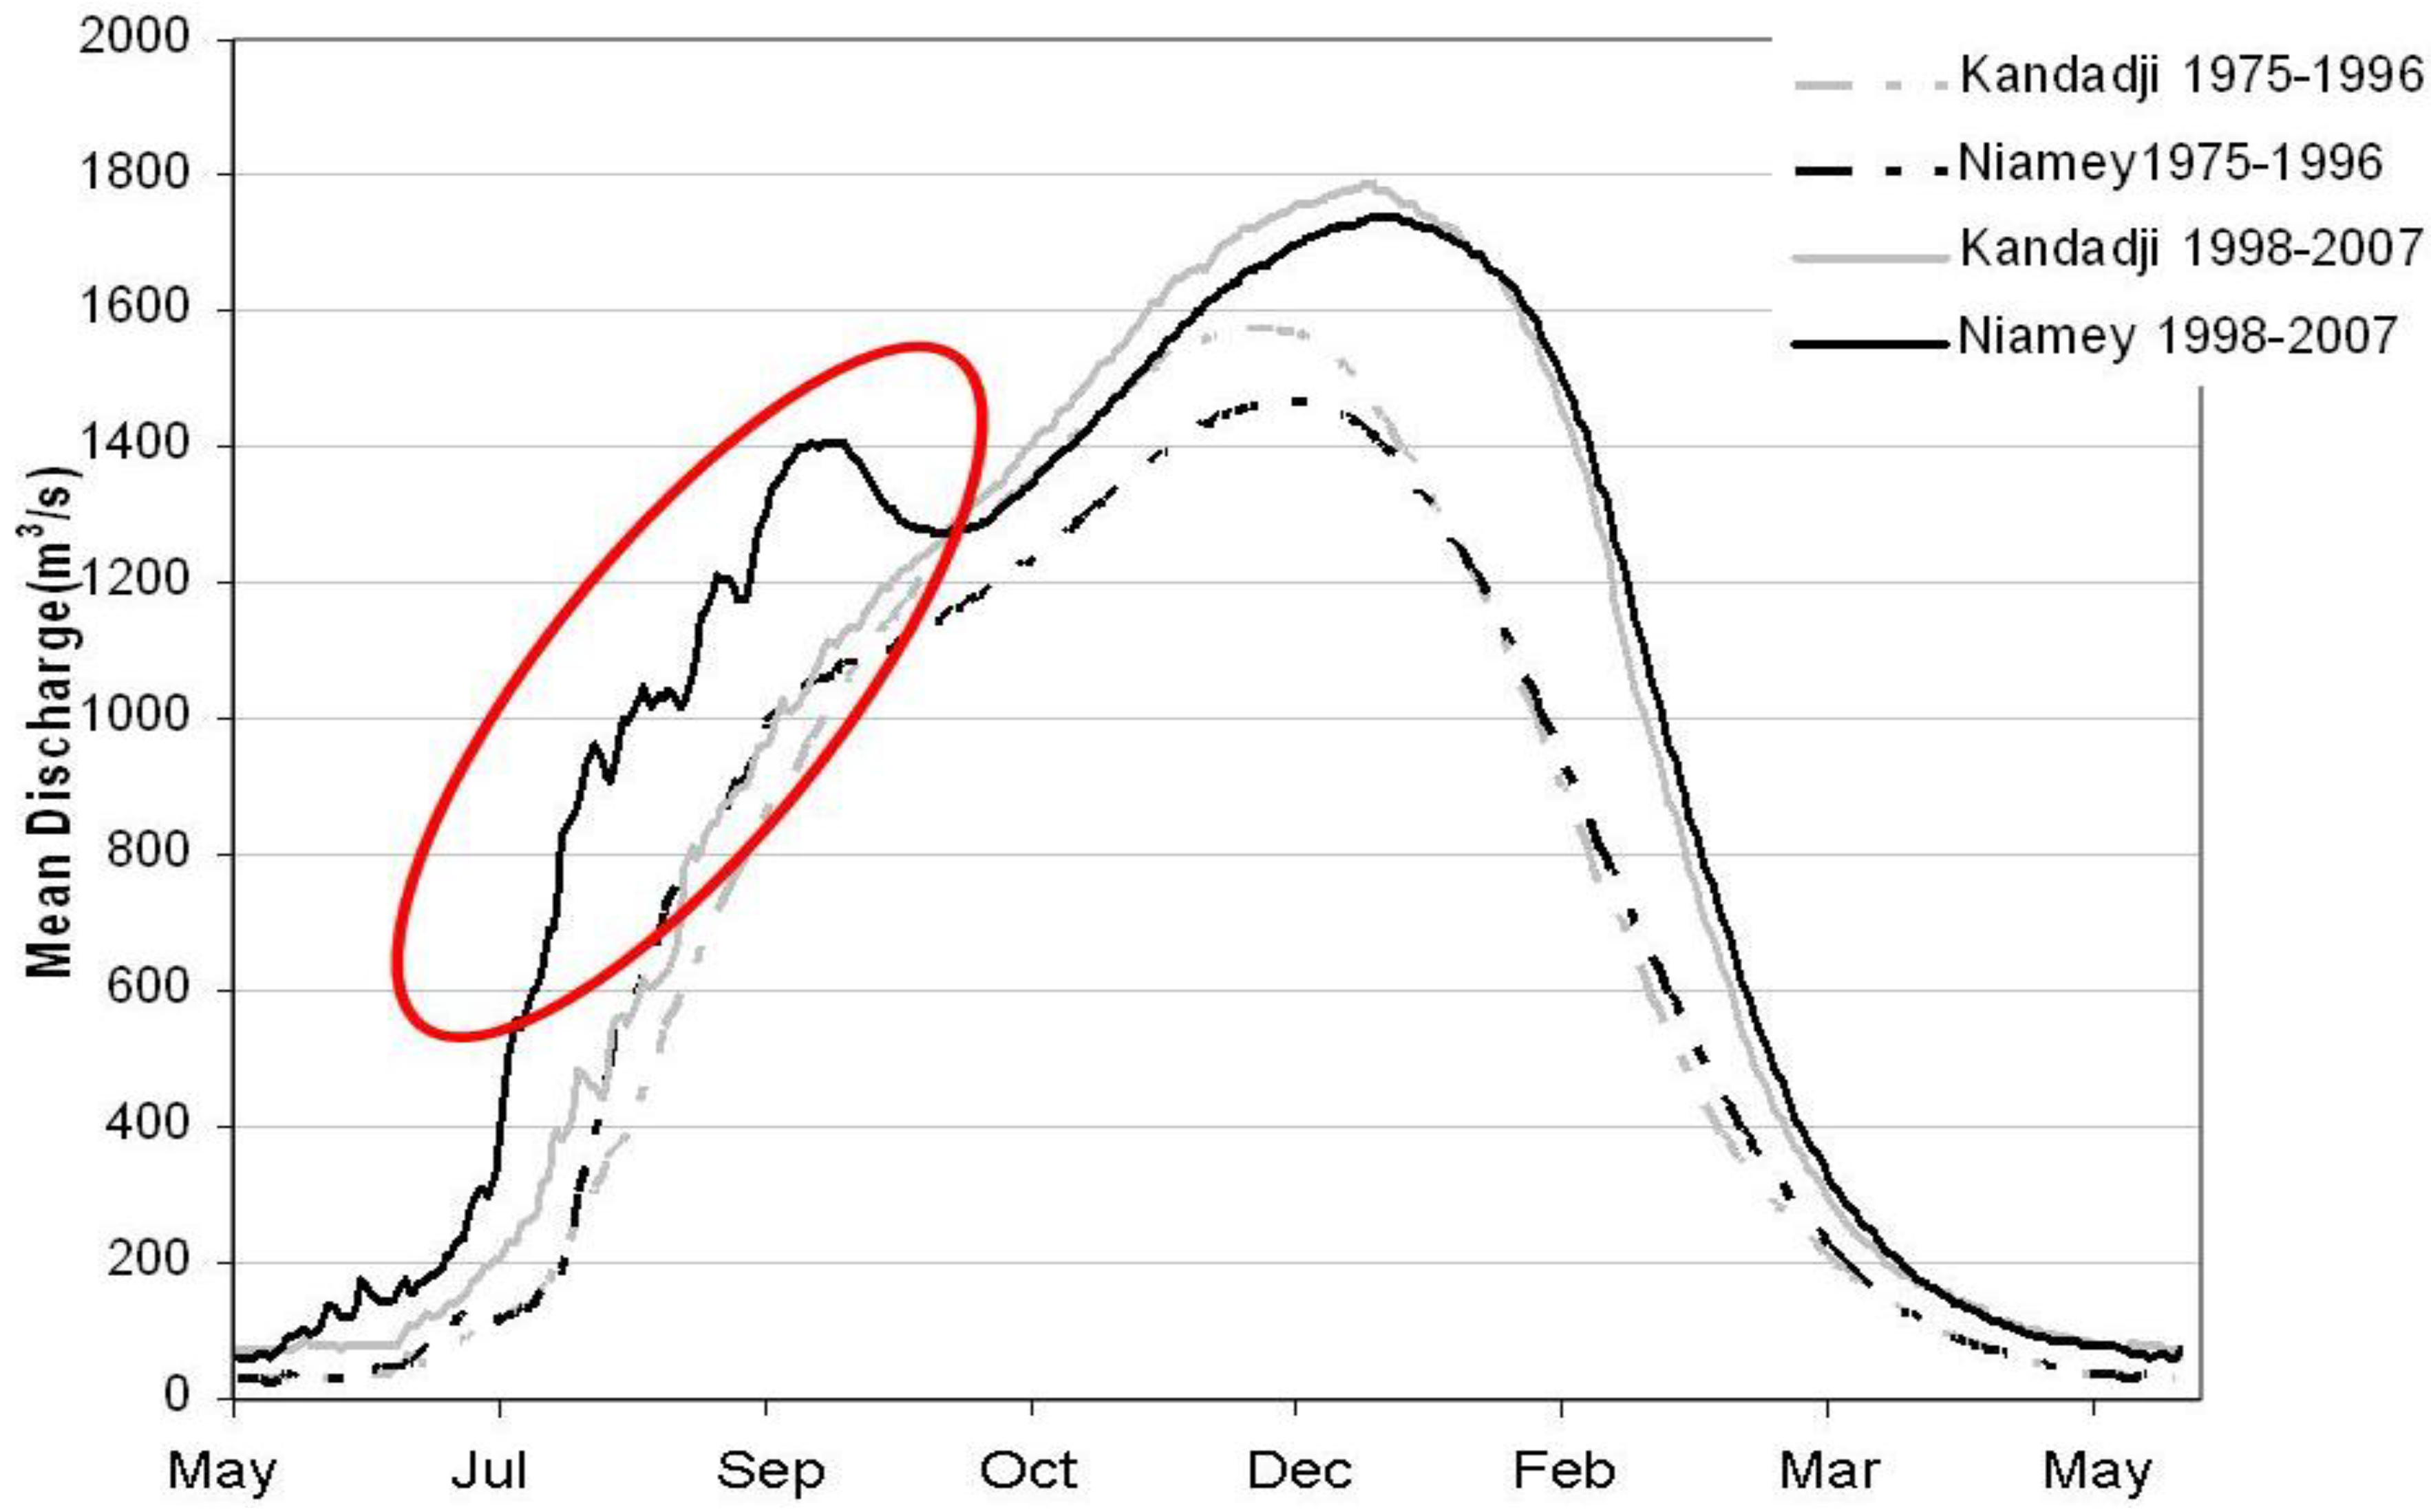
Figure 6 shows a significant land use change between 1979 and 1999 in the lower part of the Gorouol basin, determined using two Landsat scenes. Otherwise, the average hydrographs of the Niger at Kandadji and Niamey for the period between 1975 and 1996 (
Figure 7) have similar shapes, in contrast with the hydrographs for the period between 1998 and 2007, where both hydrographs (Niger River at Kandadji
vs. Niger River at Niamey) are very different, because the tributaries contribution to the Niamey hydrograph is obvious.
The two periods are compared in
Figure 7, showing that the peak discharge at Kandadji is reproduced at Niamey in December or January. This implies that the “surplus” volume discharged at Niamey during the recent period 1998–2007 is due to the more prominent first peak discharge period during the local rainy season (August to September). This is due to the discharge of both the small direct tributaries of the Niger River (see above), whose effect has been amplified in recent years due to strong land degradation, and the main tributaries (Dargol and Sirba) whose discharges have been already observed to be increasing.The shape of the current hydrograph at Niamey station also reveals a reduction in lag time of tributaries discharge, making the peak of the first, local flood, earlier than in the previous years, as a consequence of the reduction in soil water holding capacity in the basins.
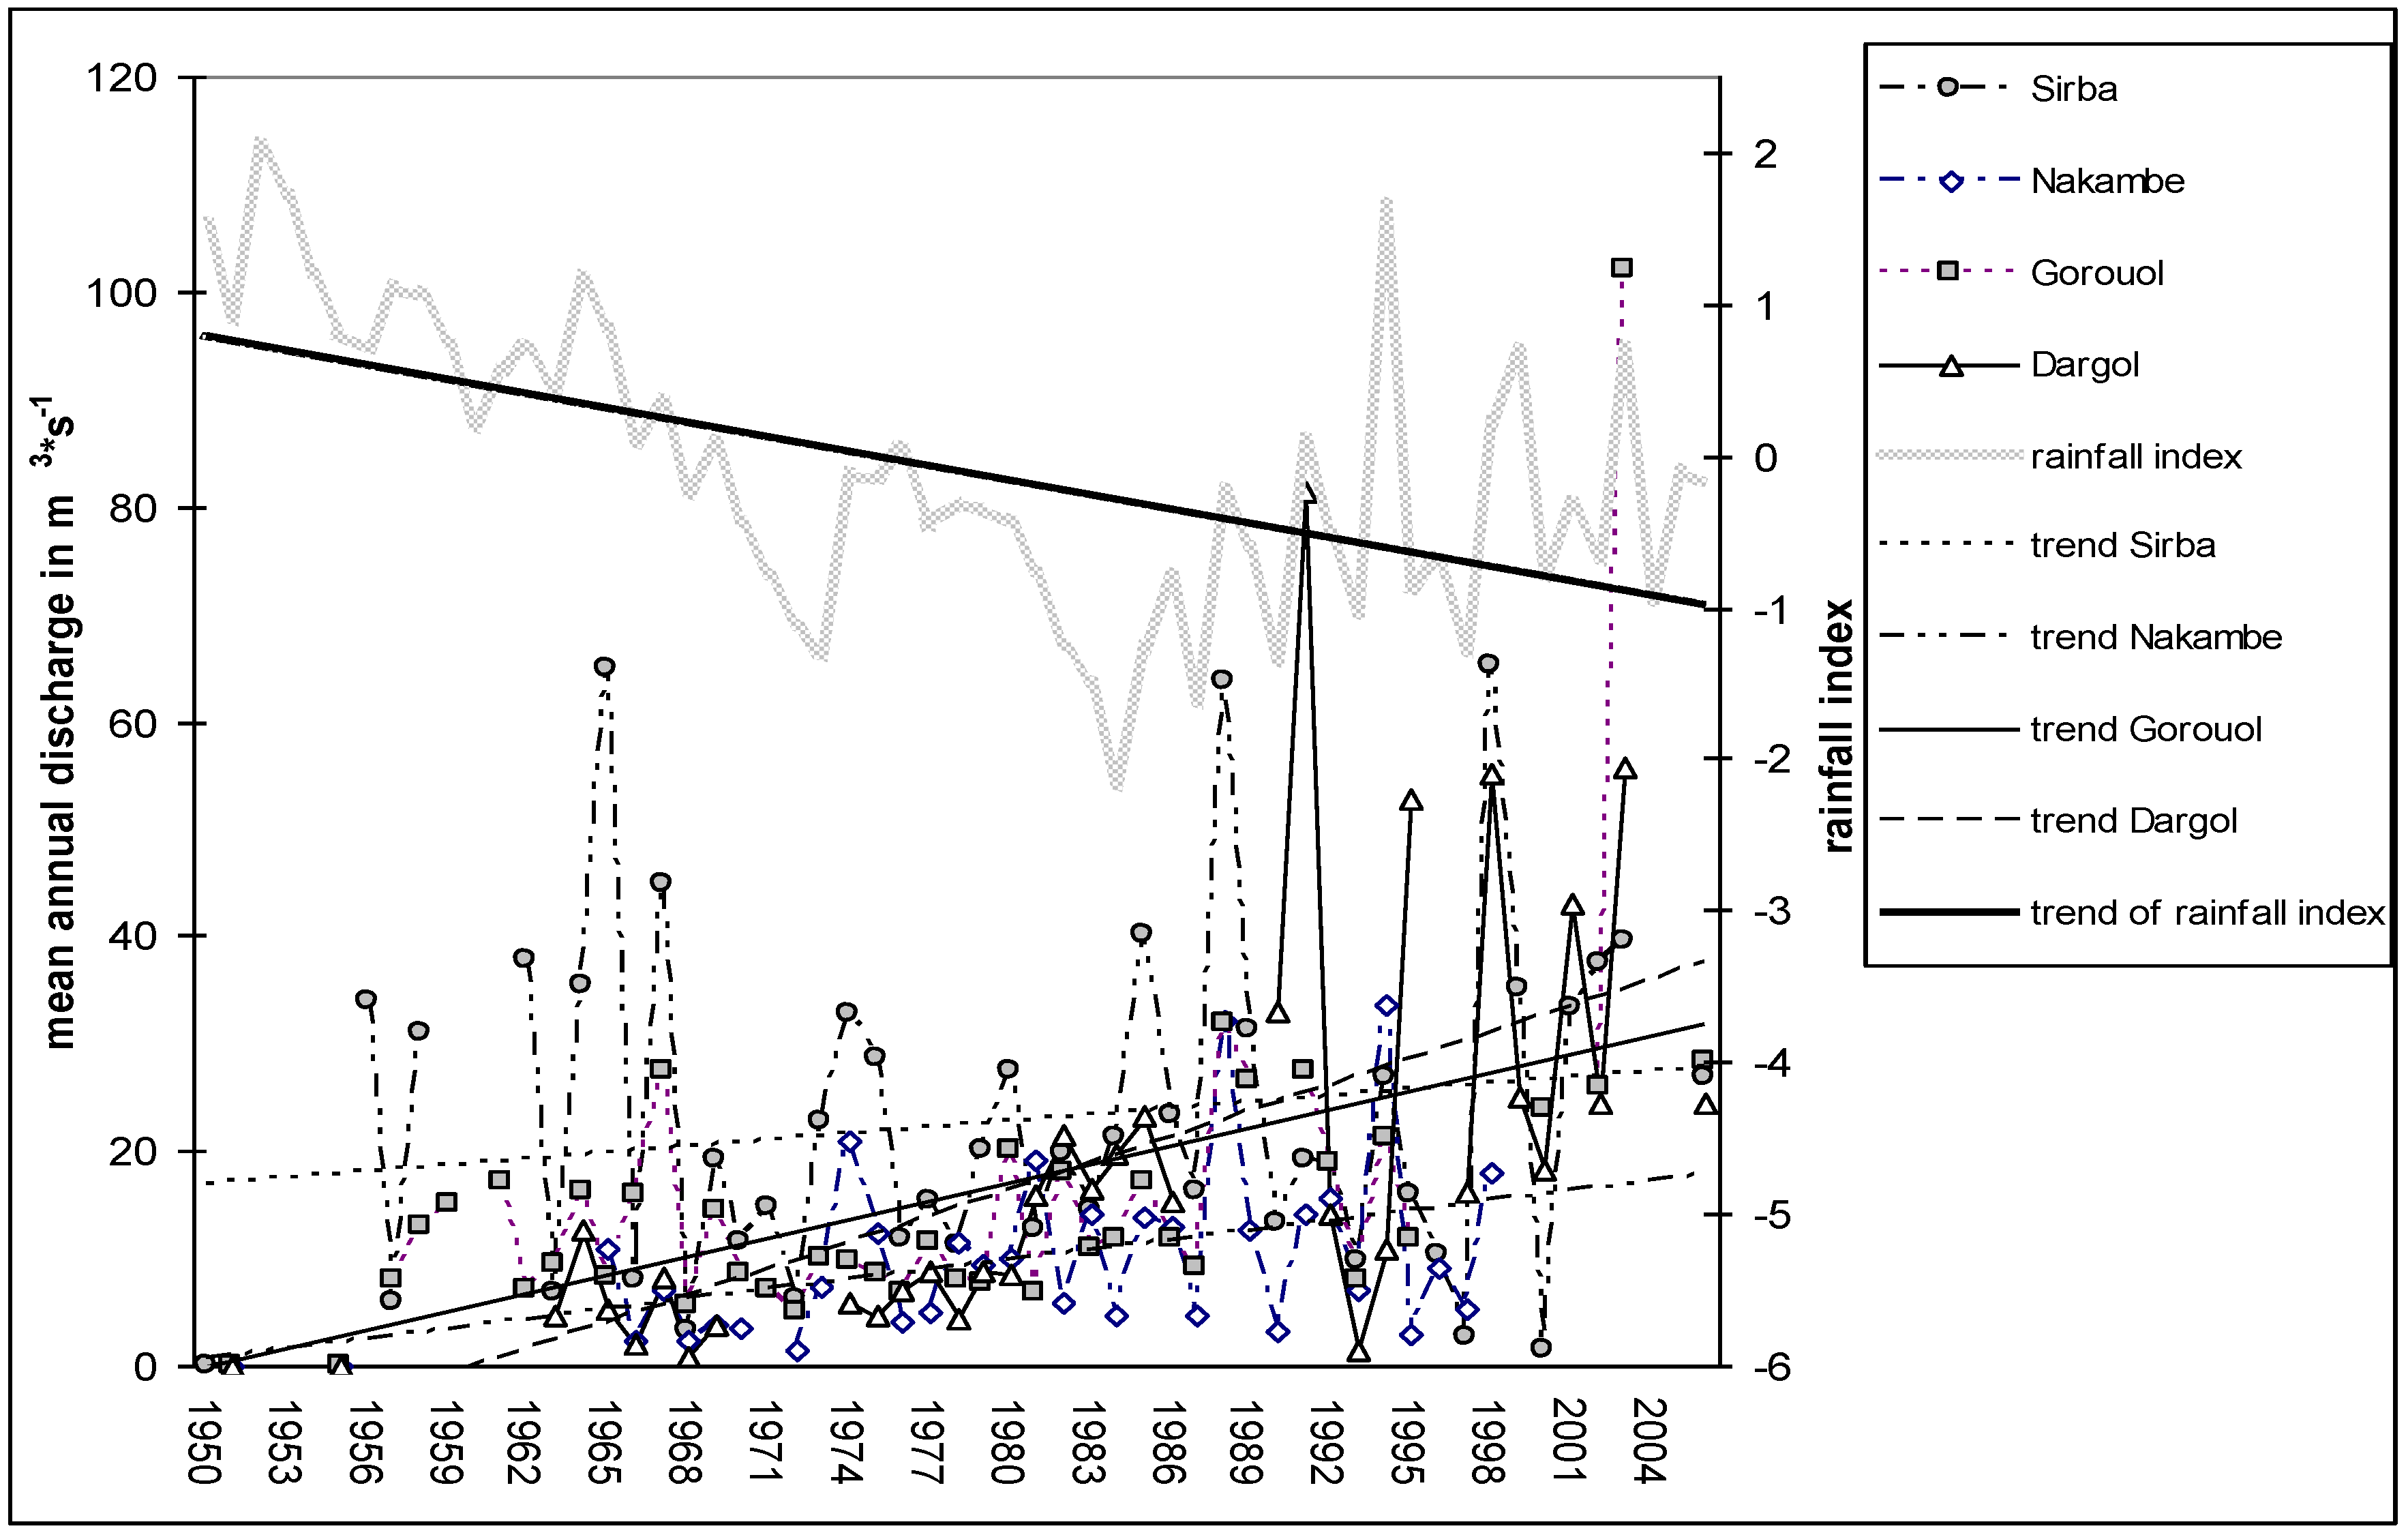
The increase in discharge of the Sahelian tributaries of the Niger River is depicted in
Figure 8. It is noteworthy that the interannual variability of annual discharge has increased in the last few decades, simultaneously with the increase in runoff.
Figure 6.
Land cover changes in the Gorouol basin between 1979 and 1999, using Landsat data.
Figure 6.
Land cover changes in the Gorouol basin between 1979 and 1999, using Landsat data.
Figure 7.
Average hydrographs of the Niger River at Kandadji and Niamey stations for the periods 1975–1996 and 1998–2007.
Figure 7.
Average hydrographs of the Niger River at Kandadji and Niamey stations for the periods 1975–1996 and 1998–2007.
Figure 8.
Average yearly total discharge of the three main “Sahelian” tributaries of the Niger River in its middle reach from 1955 to 2006. The increase trend is lower for the Sirba River than for the other two; but it is real in spite of the decreasing rain fall, as evidence of the significant increase in runoff coefficients
3.3. At the Regional Scale (106 km2 Basin Scale)
Considering the whole Niger Basin at the Niamey station (400,000 km2 of “active catchment”), we analyzed the behavior of at least two very different components of the Niger basin; the “Guinean” and “Sudanian” upstream of the Niger Interior Delta (NID), and the “Sahelian” component downstream of the NID.
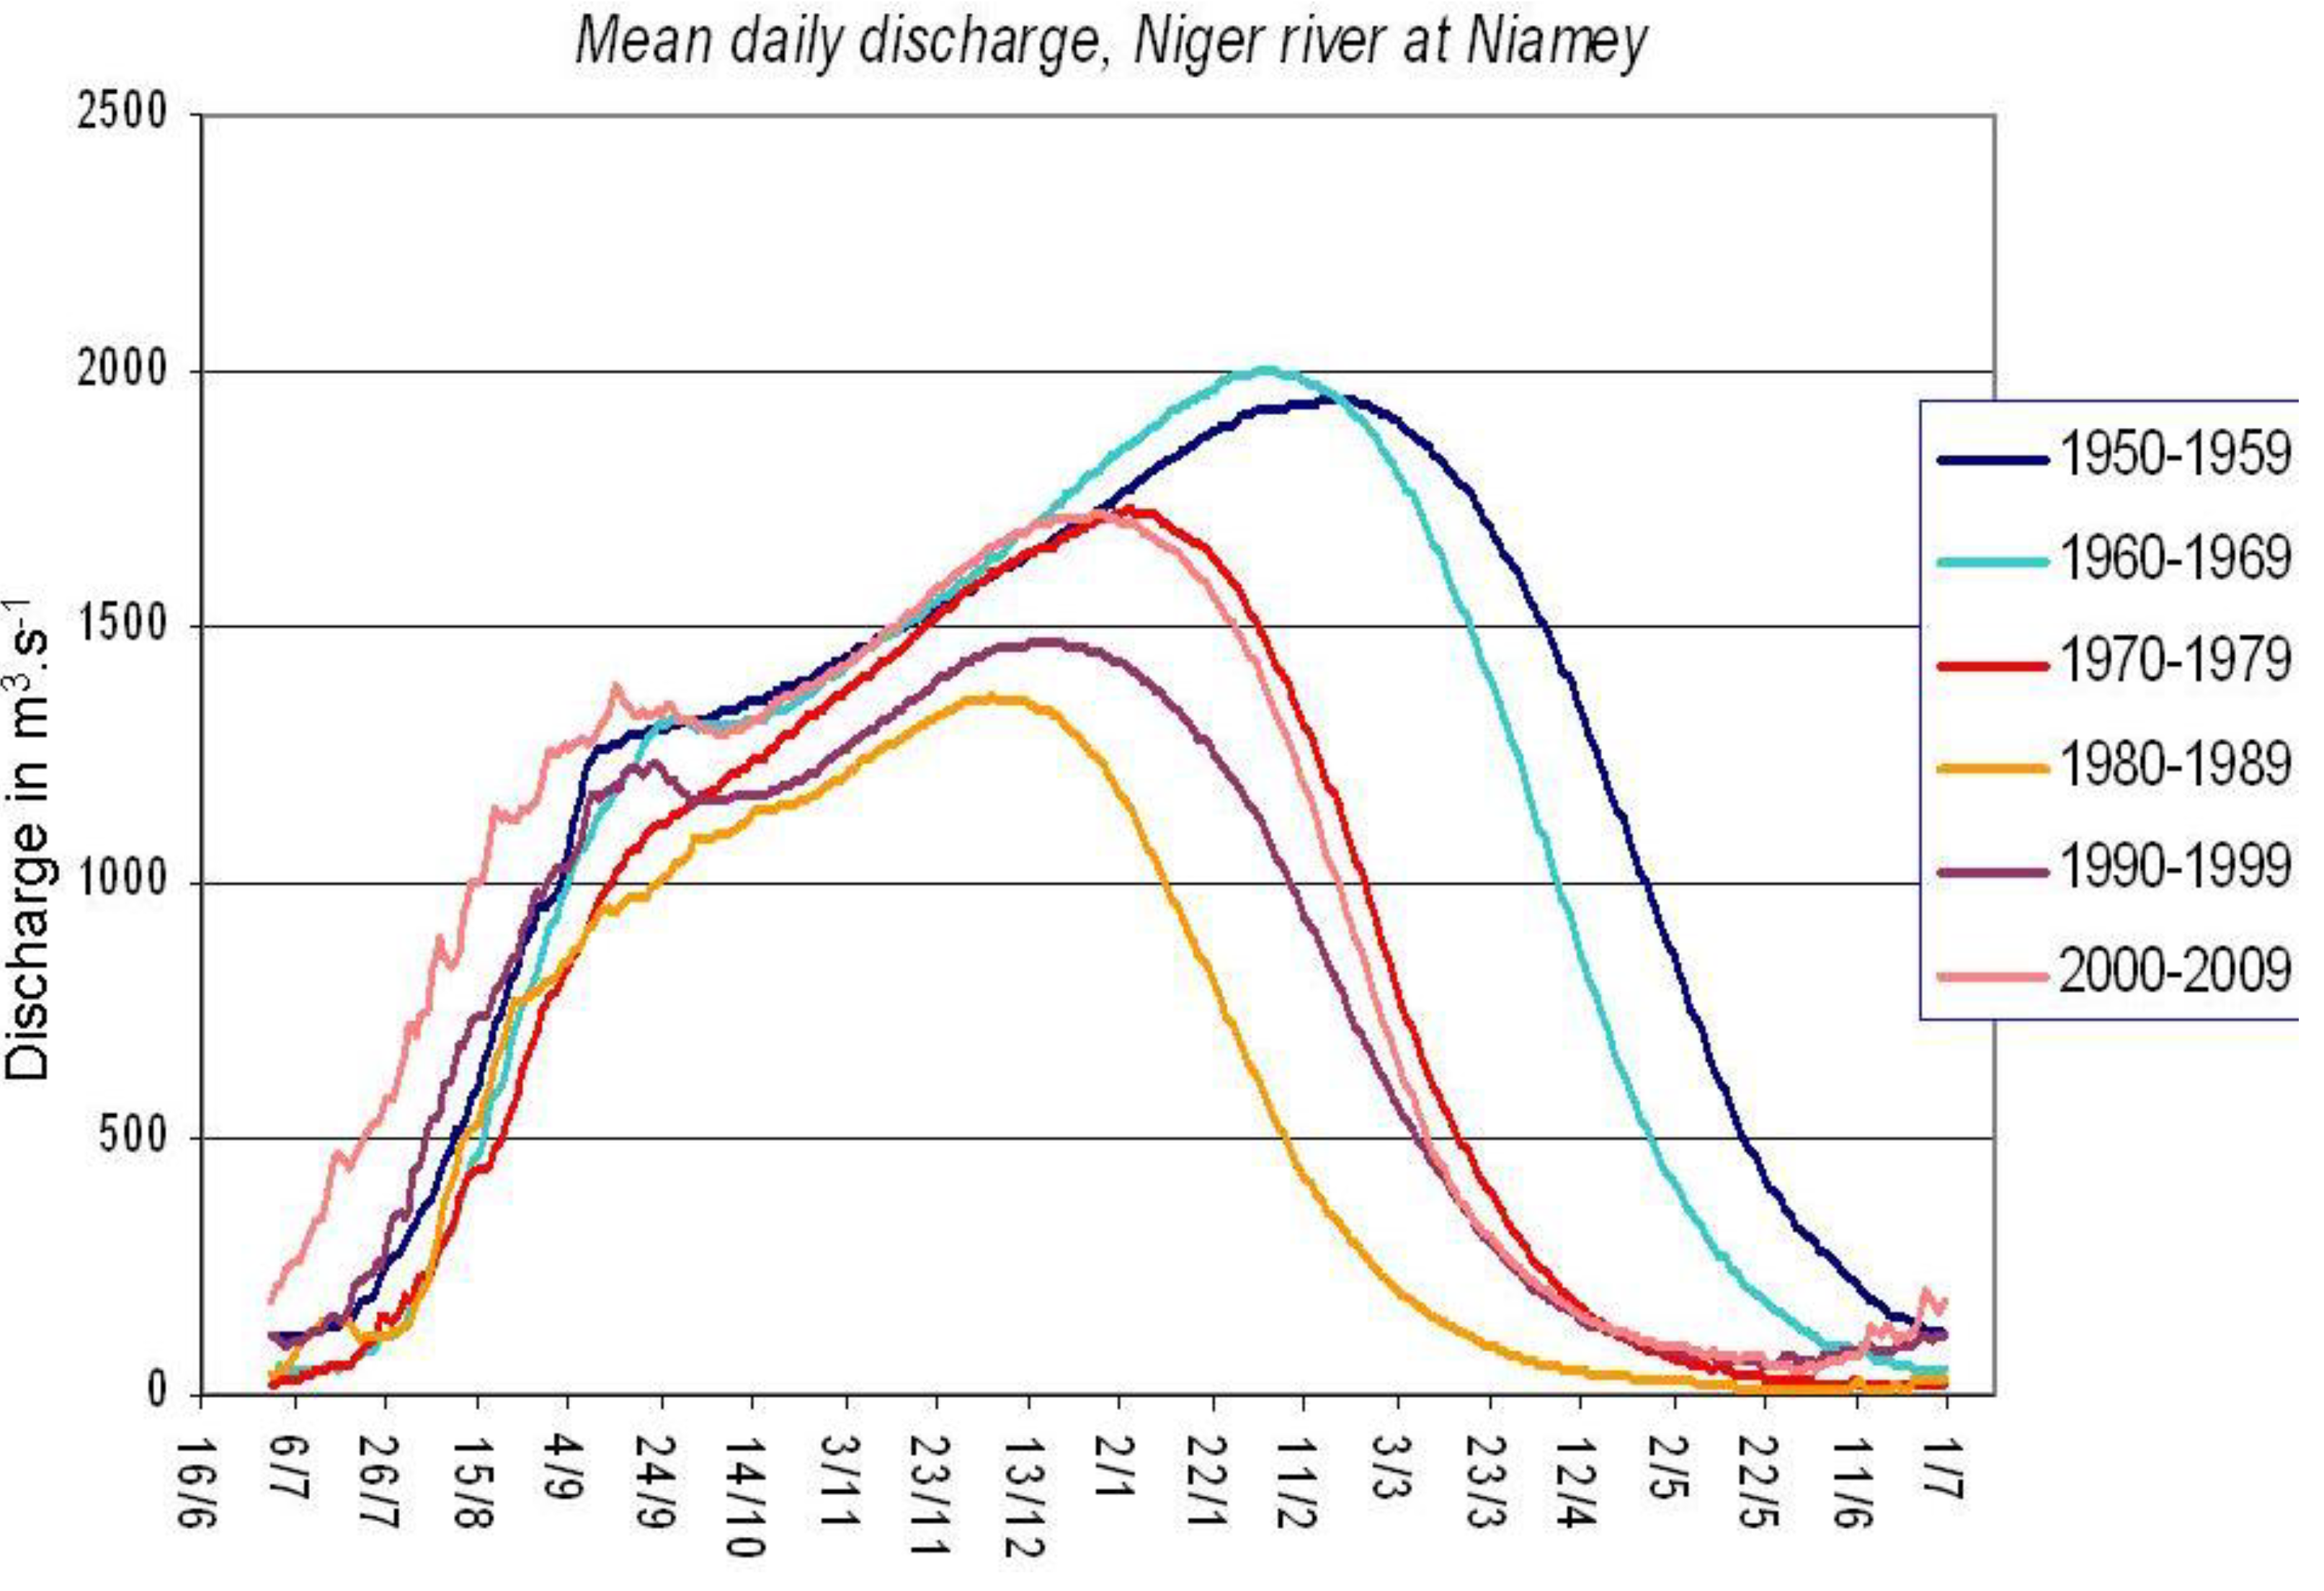
Figure 9 shows the average decadal hydrograph of the Niger River at the Niamey station from 1950. Three groups of decades can be distinguished:
the first group includes the 1950s and the 1960s, well known as a “humid” period [
15,
16]: the annual flood began at the end of July and lasted until the end of February or the beginning of March; the peak is almost 2,000 m
3 s
−1.
The second group is composed of the 1980s and the 1990s and constitutes the drier period: high flow still began at the end of July, but finished by the end of December, the peak discharge being below 1,500 m3 s−1. The appearance of a more distinct first peak flood in September, due to the supply of local Sahelian Rivers, was observed in the 1990s.
The third group is made up of the 1970s and the 2000s: in these periods the peak flood clearly exceeded 1,500 m3 s−1 and reached almost 1,750 m3 s−1, at the beginning of January; the decrease in discharge after the peak has almost the same shape. However, during the 2000s, the beginning of the flood is two or three weeks earlier, exaggerating the first peak that was first observed in the 1990s. These two decades represent the decreasing (1970s) and the increasing (2000s) stages of the long-term drought.
Figure 9.
Average hydrographs of the Niger River by decades at the Niamey station.
Figure 9.
Average hydrographs of the Niger River by decades at the Niamey station.
The evolution of regime and discharge of the Niger River at Niamey is still under the dominancy of the Upper Niger basin: there, geoclimates are Guinean (annual rainfall above 1,400 mm) and Sudanian (annual rainfall between 700 and 1,400 mm), and the important role of soil water holding capacity and groundwater explains the strong decrease in discharges linked to the drought; discharges were strongly decreasing until the beginning of the 1990s before increasing again moderately after that.
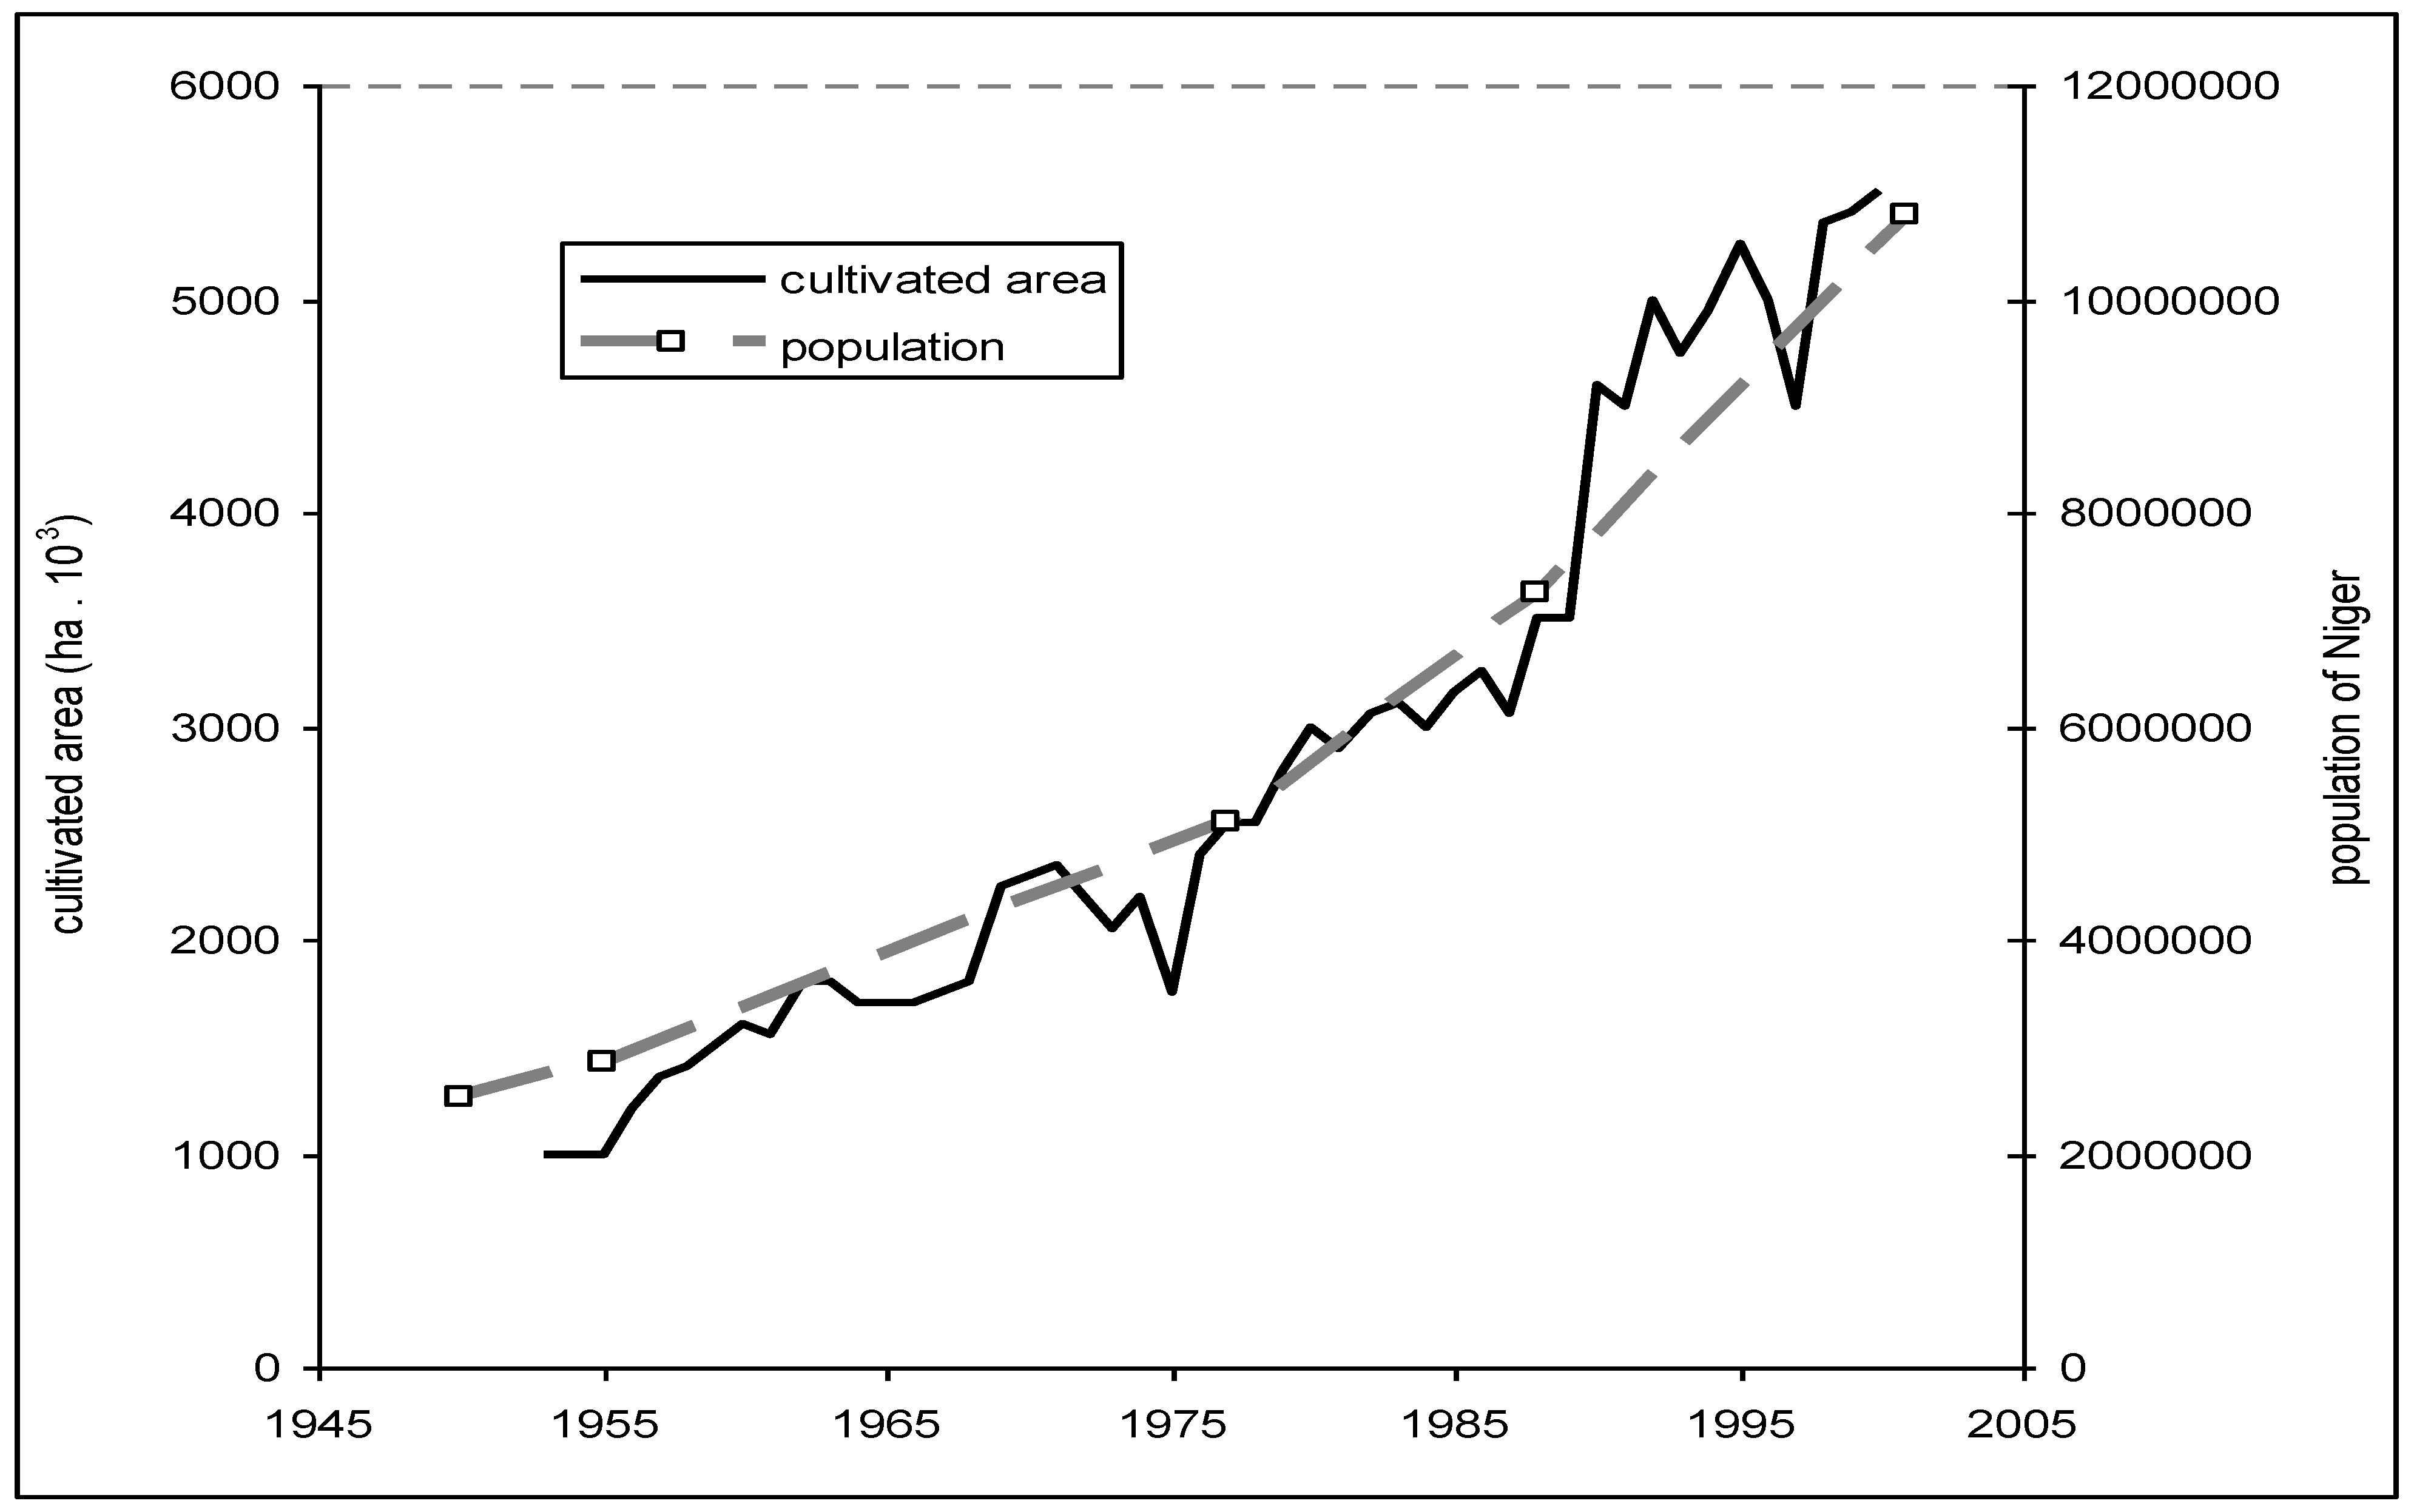
Figure 10 highlights the evolution of land cover in the Niger; Amogu [
37] showed that the same evolution is observed in the whole Sahelian region.
Figure 10.
Evolution of crop areas in the Niger since 1950.
Figure 10.
Evolution of crop areas in the Niger since 1950.
The comparison of rainfall indices and runoff indices in the Sudano-Sahelian area could provide information on the regional trends. The location of the cited rivers is shown in
Figure 1 and that of the Niger sub-basins are shown in
Figure 11. The contributing area was defined as that where rivers run, even in a temporary way. This was determined [
10] using the mapped hydrological network, confirming other older sources.
Table 4 and
Table 5 indicate little difference in both rainfall and runoff indexes between the Niger basin at Koulikoro and at Niamey for the wet (1950–1967) and the dry (1968–1993) periods, while in the recent, and current, period (since 1994), the rainfall index is significantly lower for the upper basin (at Koulikoro,
Figure 11) than for the total basin up to Niamey, as a result of the western location of Koulikoro. The runoff index is much higher at Niamey—near zero—as a result of the increase in runoff due to the Sahelian paradox in the area included between both stations, under a Sahelian climate. When comparing with other basins (
Table 4,
Table 5 versus Table 6), the Niamey station runoff index is the only one above zero for the 1994–2006 period, the others range from −0.39 and −0.25. More precisely, it is possible to segregate two classes in the basins (except the Niger River at Niamey):
on the one hand, the Niger at Koulikoro (runoff index 1994–2006 = −0.35), the Falémé (−0.37) and the Bakoye (−0.39) with the lower runoff indices;
on the other hand, the Bafing (−0.25) and the Gambia (−0.25), with runoff indices significantly higher than the first ones, probably because of the “Guinean” and southern location of their upper basin; this area of the Fouta Djalon is mainly constituted of plutonic impermeable rocks, thus it is hardly affected by “Hewlettian” processes involving a part of the water cycle in deep soils with an extended water table, both producing a high water holding capacity.
Figure 11.
The Niger River basin at Koulikoro and Niamey stations. The blue area is the non-contributing basin regions (endorheic and arheic regions).
Figure 11.
The Niger River basin at Koulikoro and Niamey stations. The blue area is the non-contributing basin regions (endorheic and arheic regions).
Table 4.
Evolution of rainfall and runoff indexes of the Niger River at Niamey station.
Table 4.
Evolution of rainfall and runoff indexes of the Niger River at Niamey station.
| | Rainfall index | runoff index |
|---|
| 1950–1967 | 0.9 | 0.98 |
| 1968–1993 | −0.72 | −0.6 |
| 1994–2006 | −0.38 | 0.005 |
Table 5.
Evolution of rainfall and runoff indexes of the Niger River at Koulikoro station.
Table 5.
Evolution of rainfall and runoff indexes of the Niger River at Koulikoro station.
| | Rainfall index | runoff index |
|---|
| 1950–1967 | 0.9 | 1.03 |
| 1968–1993 | −0.8 | −0.53 |
| 1994–2006 | −0.57 | −0.35 |
Table 6.
Evolution of rainfall and runoff indexes of the Gambia River and the three main tributaries of the Senegal River: the Falémé, the Bafing and the Bakoye.
Table 6.
Evolution of rainfall and runoff indexes of the Gambia River and the three main tributaries of the Senegal River: the Falémé, the Bafing and the Bakoye.
| Rainfall index | Gambia | Falémé | Bafing | Bakoye |
|---|
| 1950–1967 | 0.88 | 0.91 | 0.90 | 0.90 |
| 1968–1993 | −0.88 | −0.82 | −0.81 | −0.8 |
| 1994–2006 | −0.71 | −0.68 | −0.63 | −0.57 |
| Runoff index | Gambia | Falémé | Bafing | Bakoye |
| 1950–1967 | 1.16 | 1.25 | 1.19 | 1.15 |
| 1968–1993 | −0.67 | −0.67 | −0.69 | −0.6 |
| 1994–2006 | −0.25 | −0.37 | −0.25 | −0.39 |
The measured rainfall/runoff relationships at different scales allows showing that the increasing runoff in the Sahelian area is measured from the local to the regional scales.
It is the first time that the recent increase in runoff in the Sahelian area has been demonstrated from the point scale up to the regional scale; and these results are only based on measurements, not on models runs. These results also show that the increase in runoff is in an accelerating phase.
3.4. Statistical Analysis of Regional Differences
In the following, we determine the consistency of our measured data with those of the whole West African region, at the basin scale. Unfortunately, we cannot compare at the regional scale (contrary to the previous steps where comparisons were possible): discharge and rainfall evolution vs. land cover change, which is supposedly the main factor explaining the evolution in runoff coefficient; this is due to the fact that we are not sure enough of the accuracy of our regional mapping based on NDVI.
Data of 29 stream gauges have been synthesized in an index form, in order to be compared with rainfall data, provided in an index form.
A PCA Analysis (Principal Component Analysis; similar to EOF, Empirical Orthogonal Function) was processed in order to establish a statistical classification of the hydrological basins and of a set of variables; the list of samples (stream gauges) is in
Table 7; the percentage of explained variance by the axes of the PCA is indicated in
Table 8.
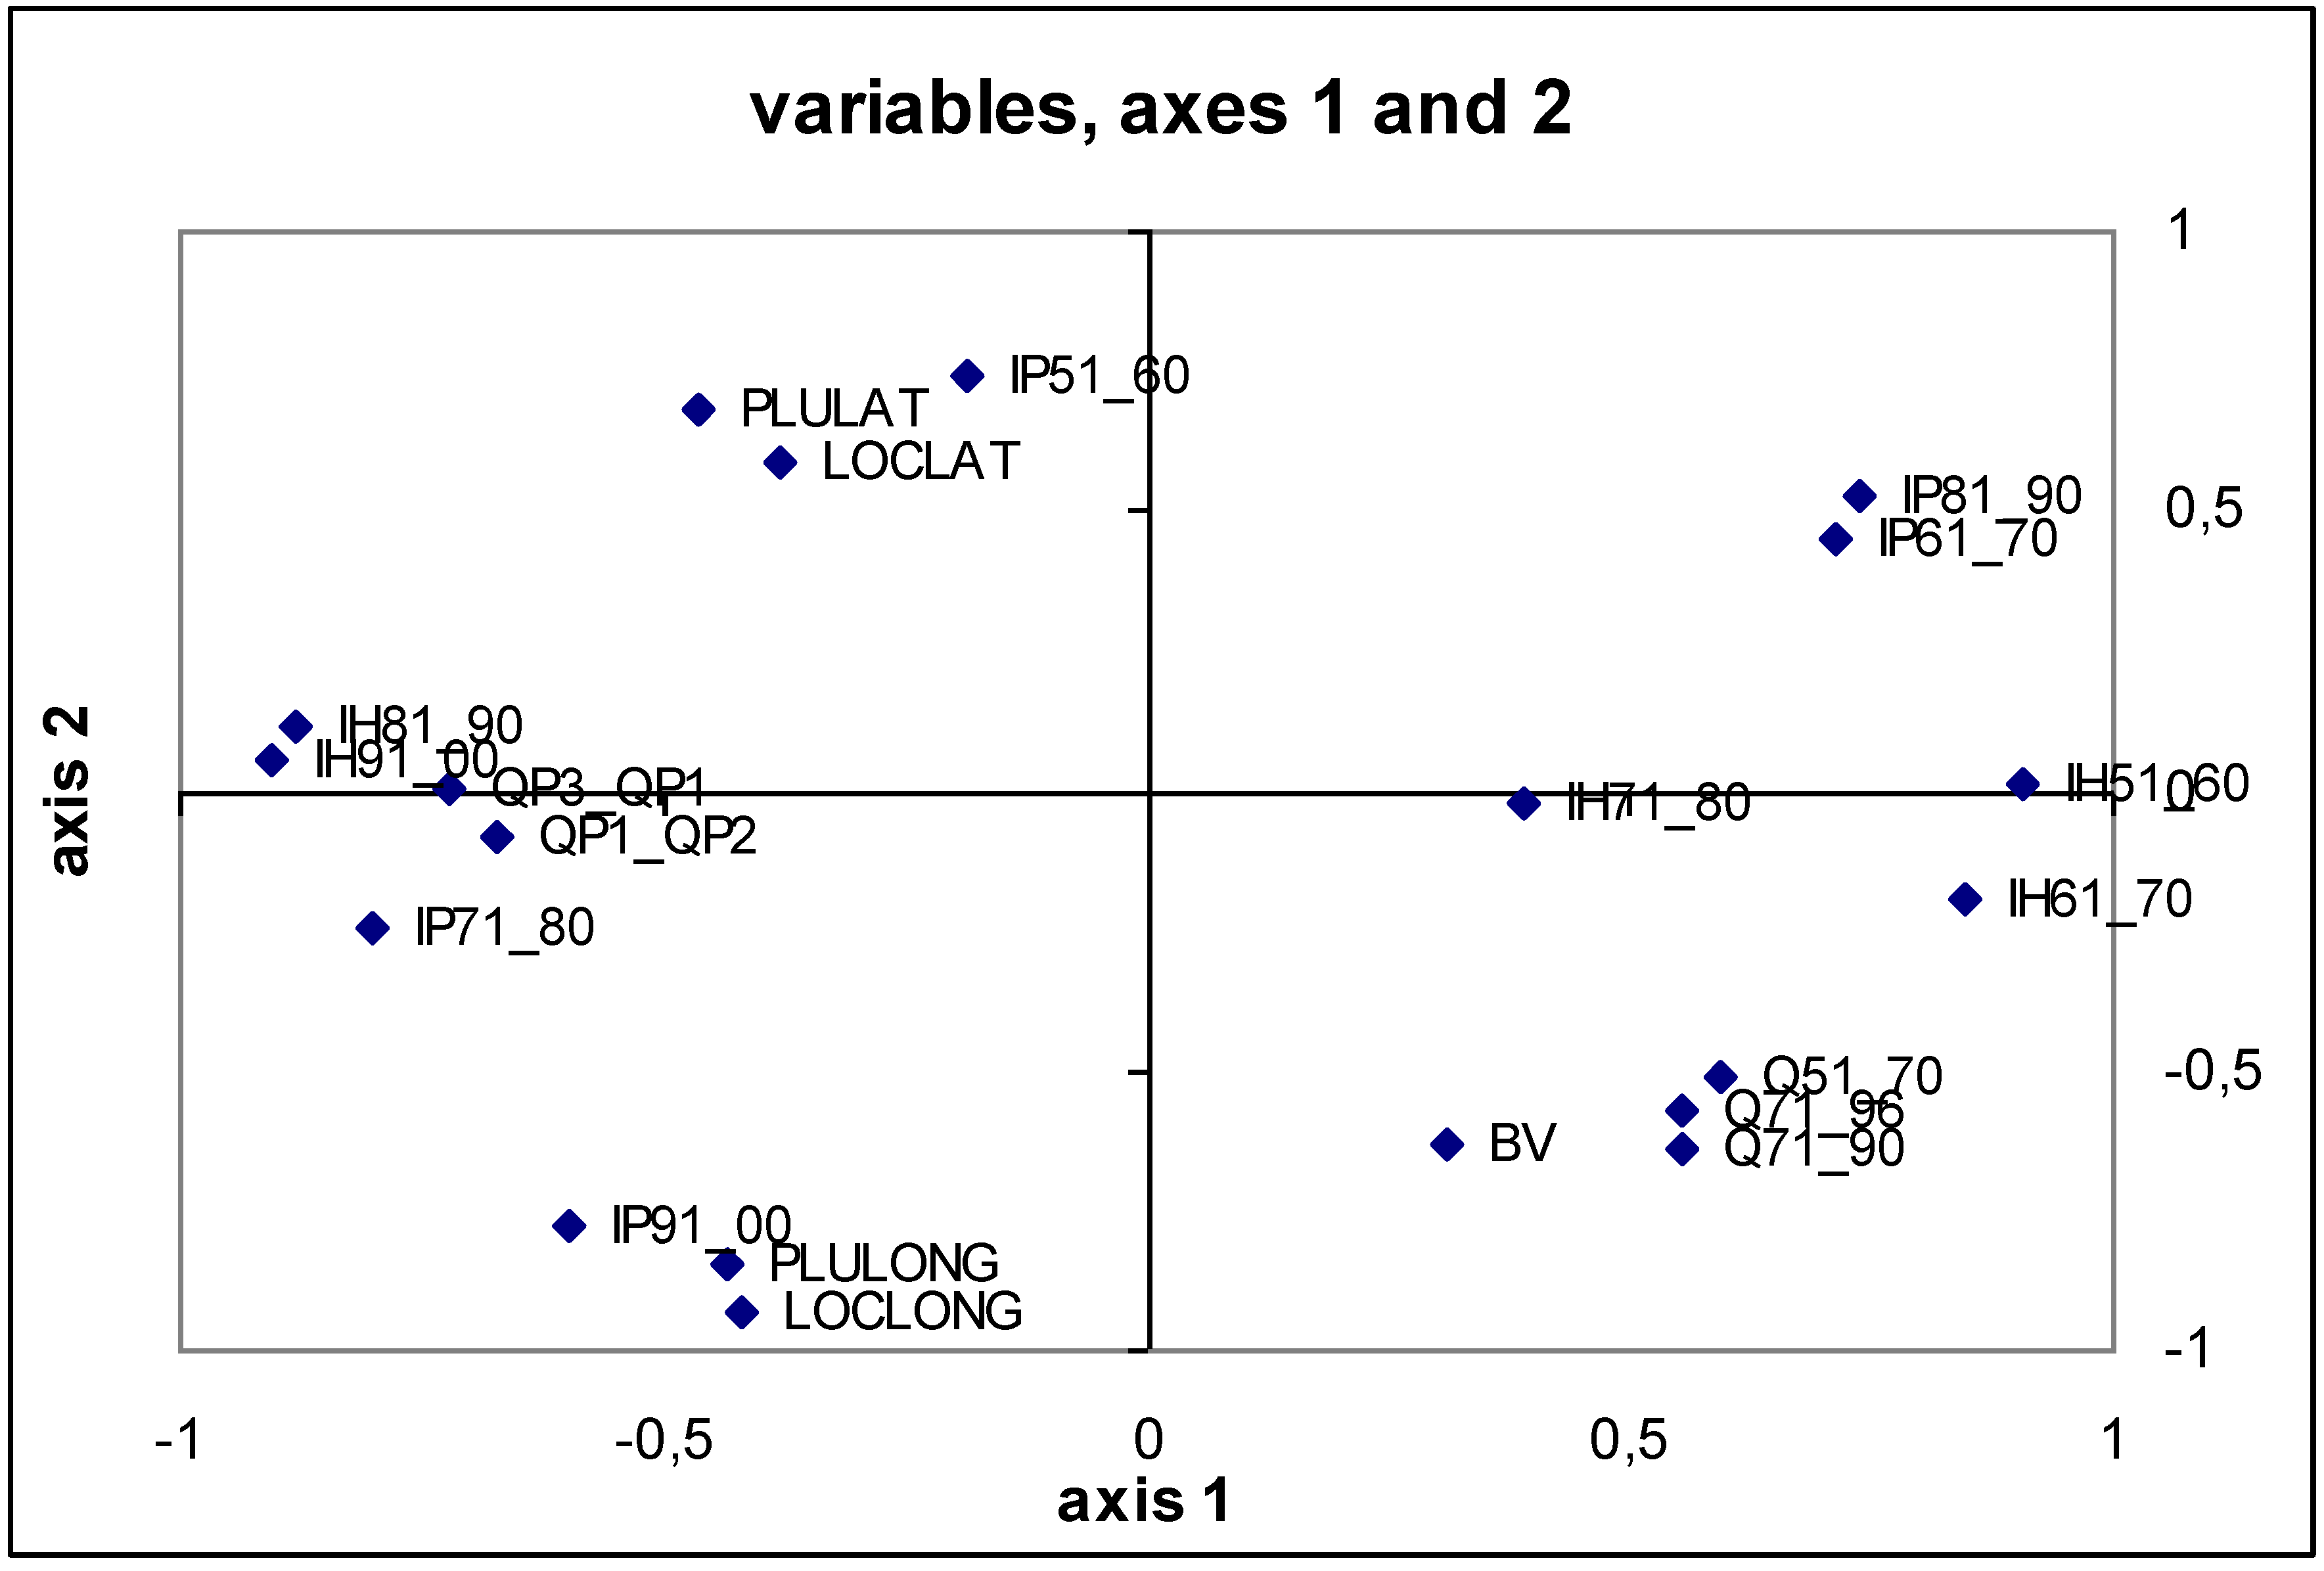
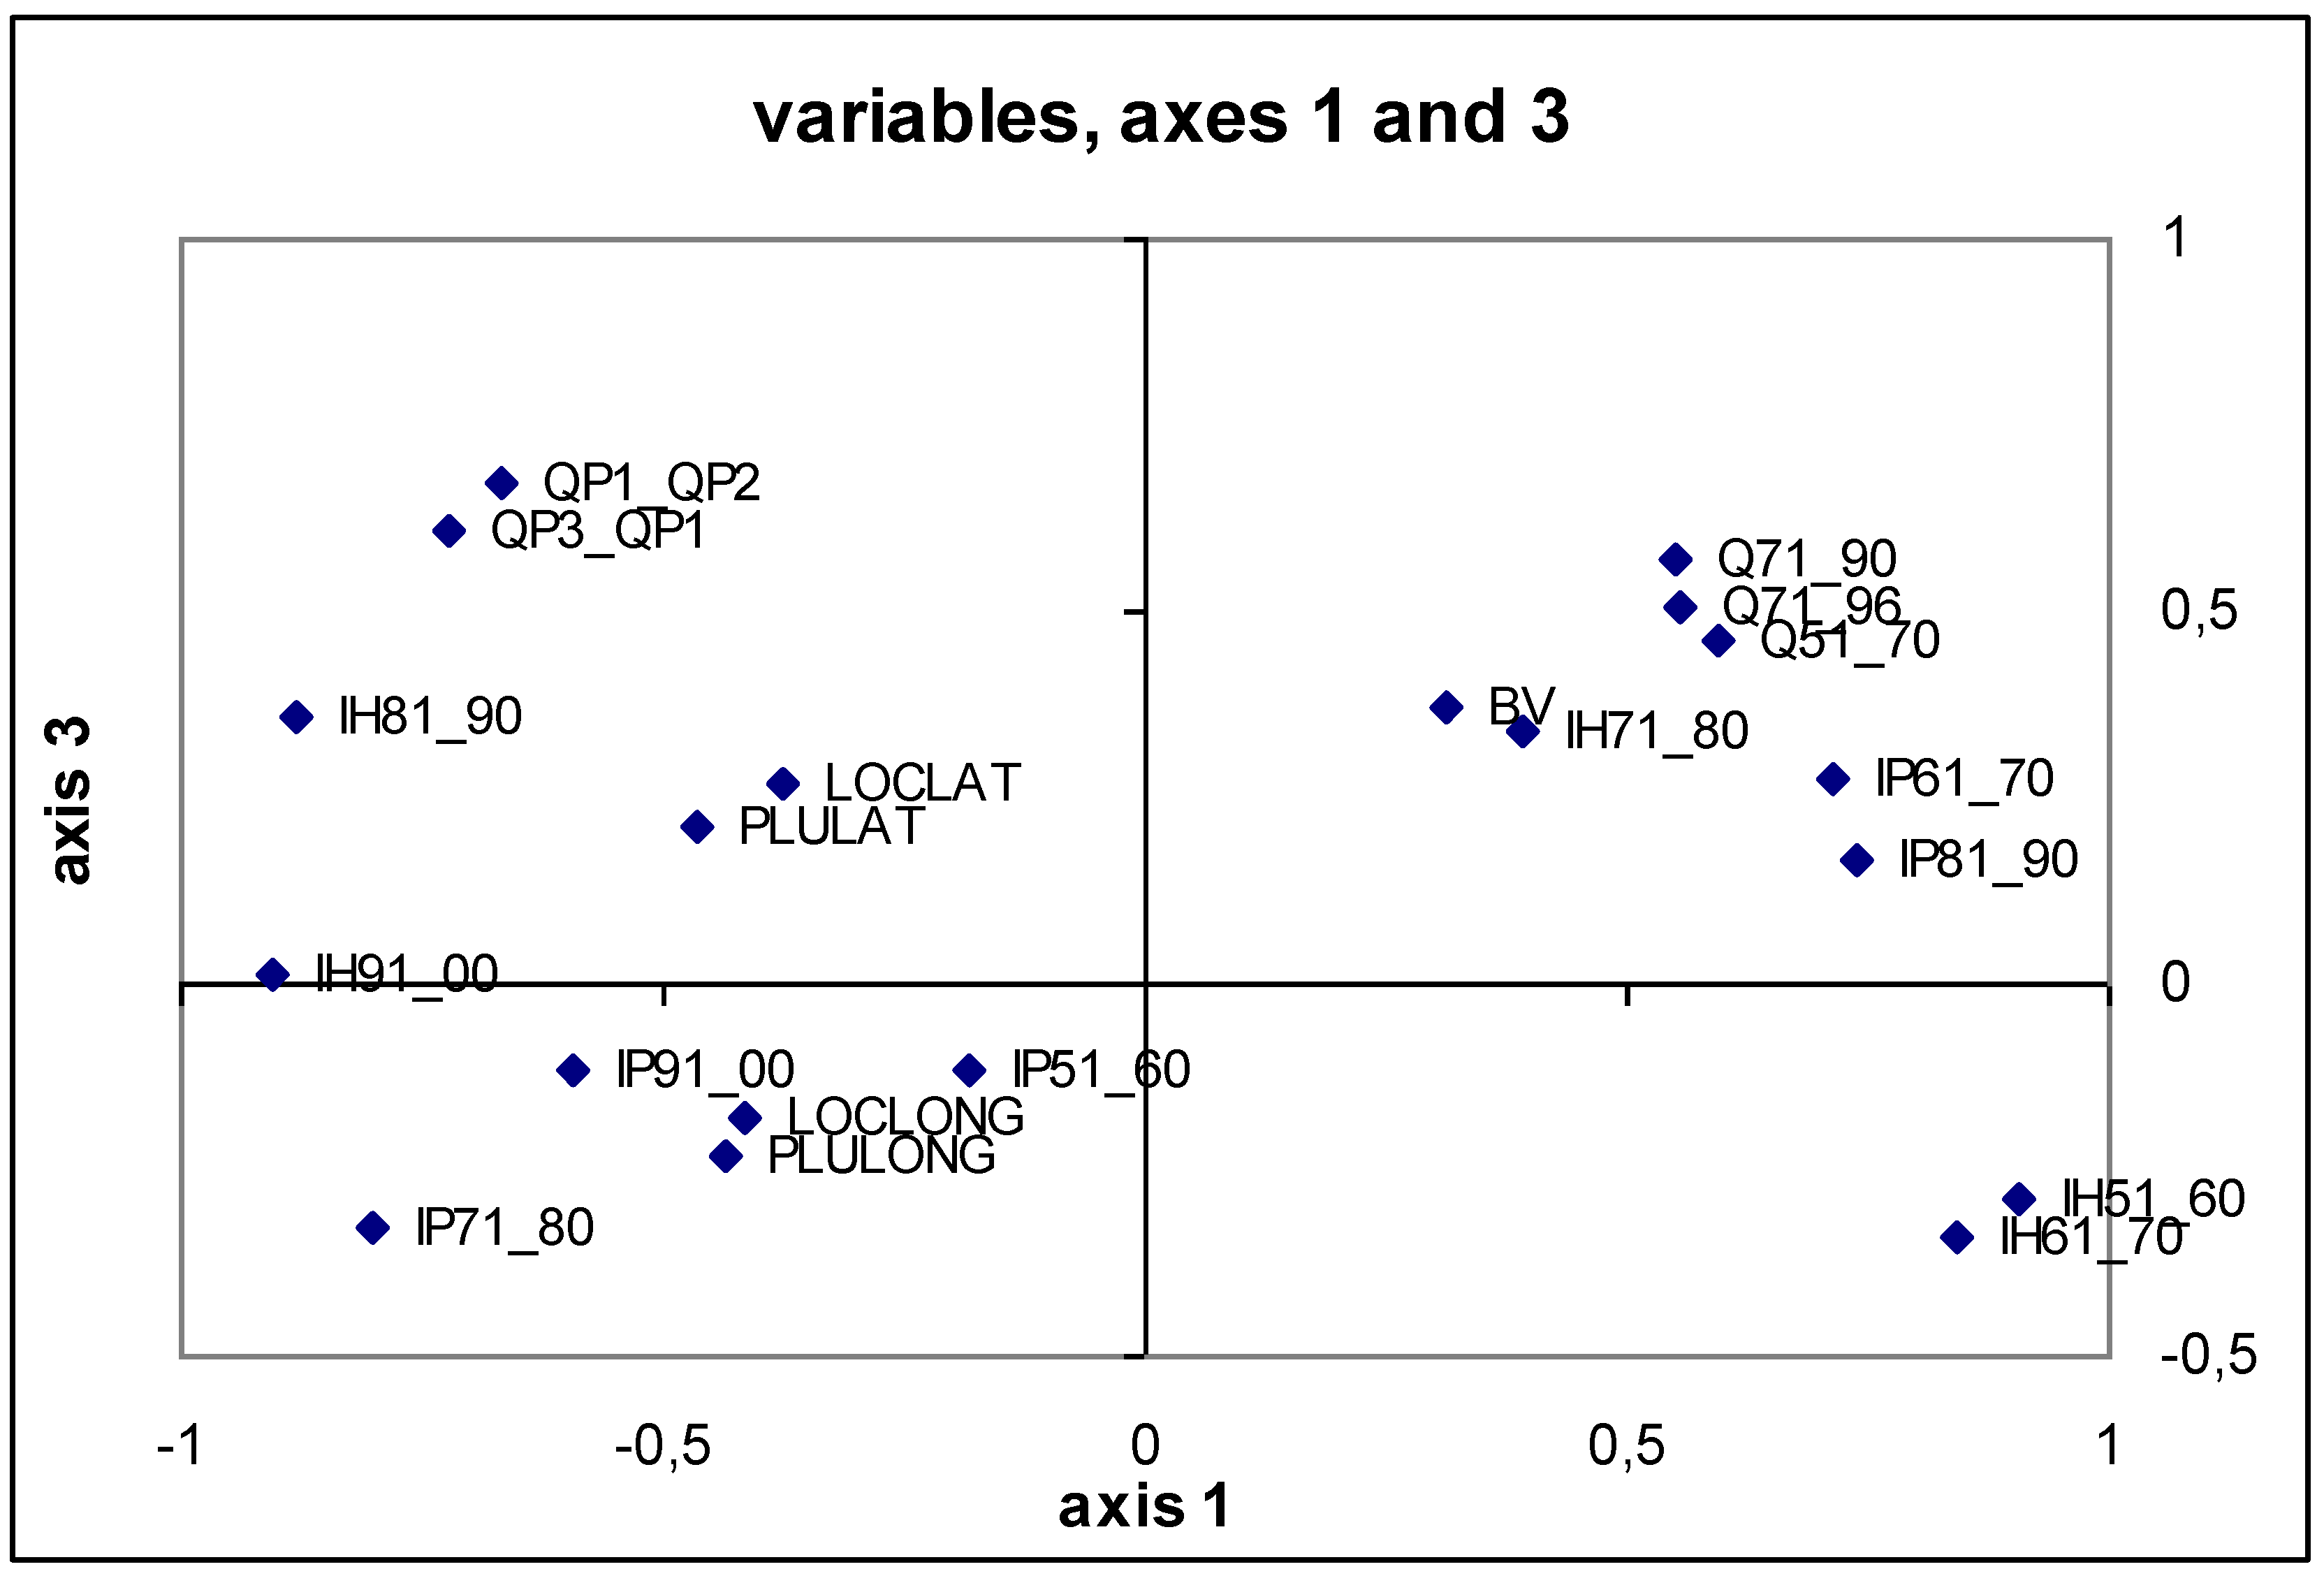
Figure 12 and
Figure 13 give the statistical space of the samples, the list of variables is in
Table 9, and
Figure 14 and
Figure 15 show the space of variables.
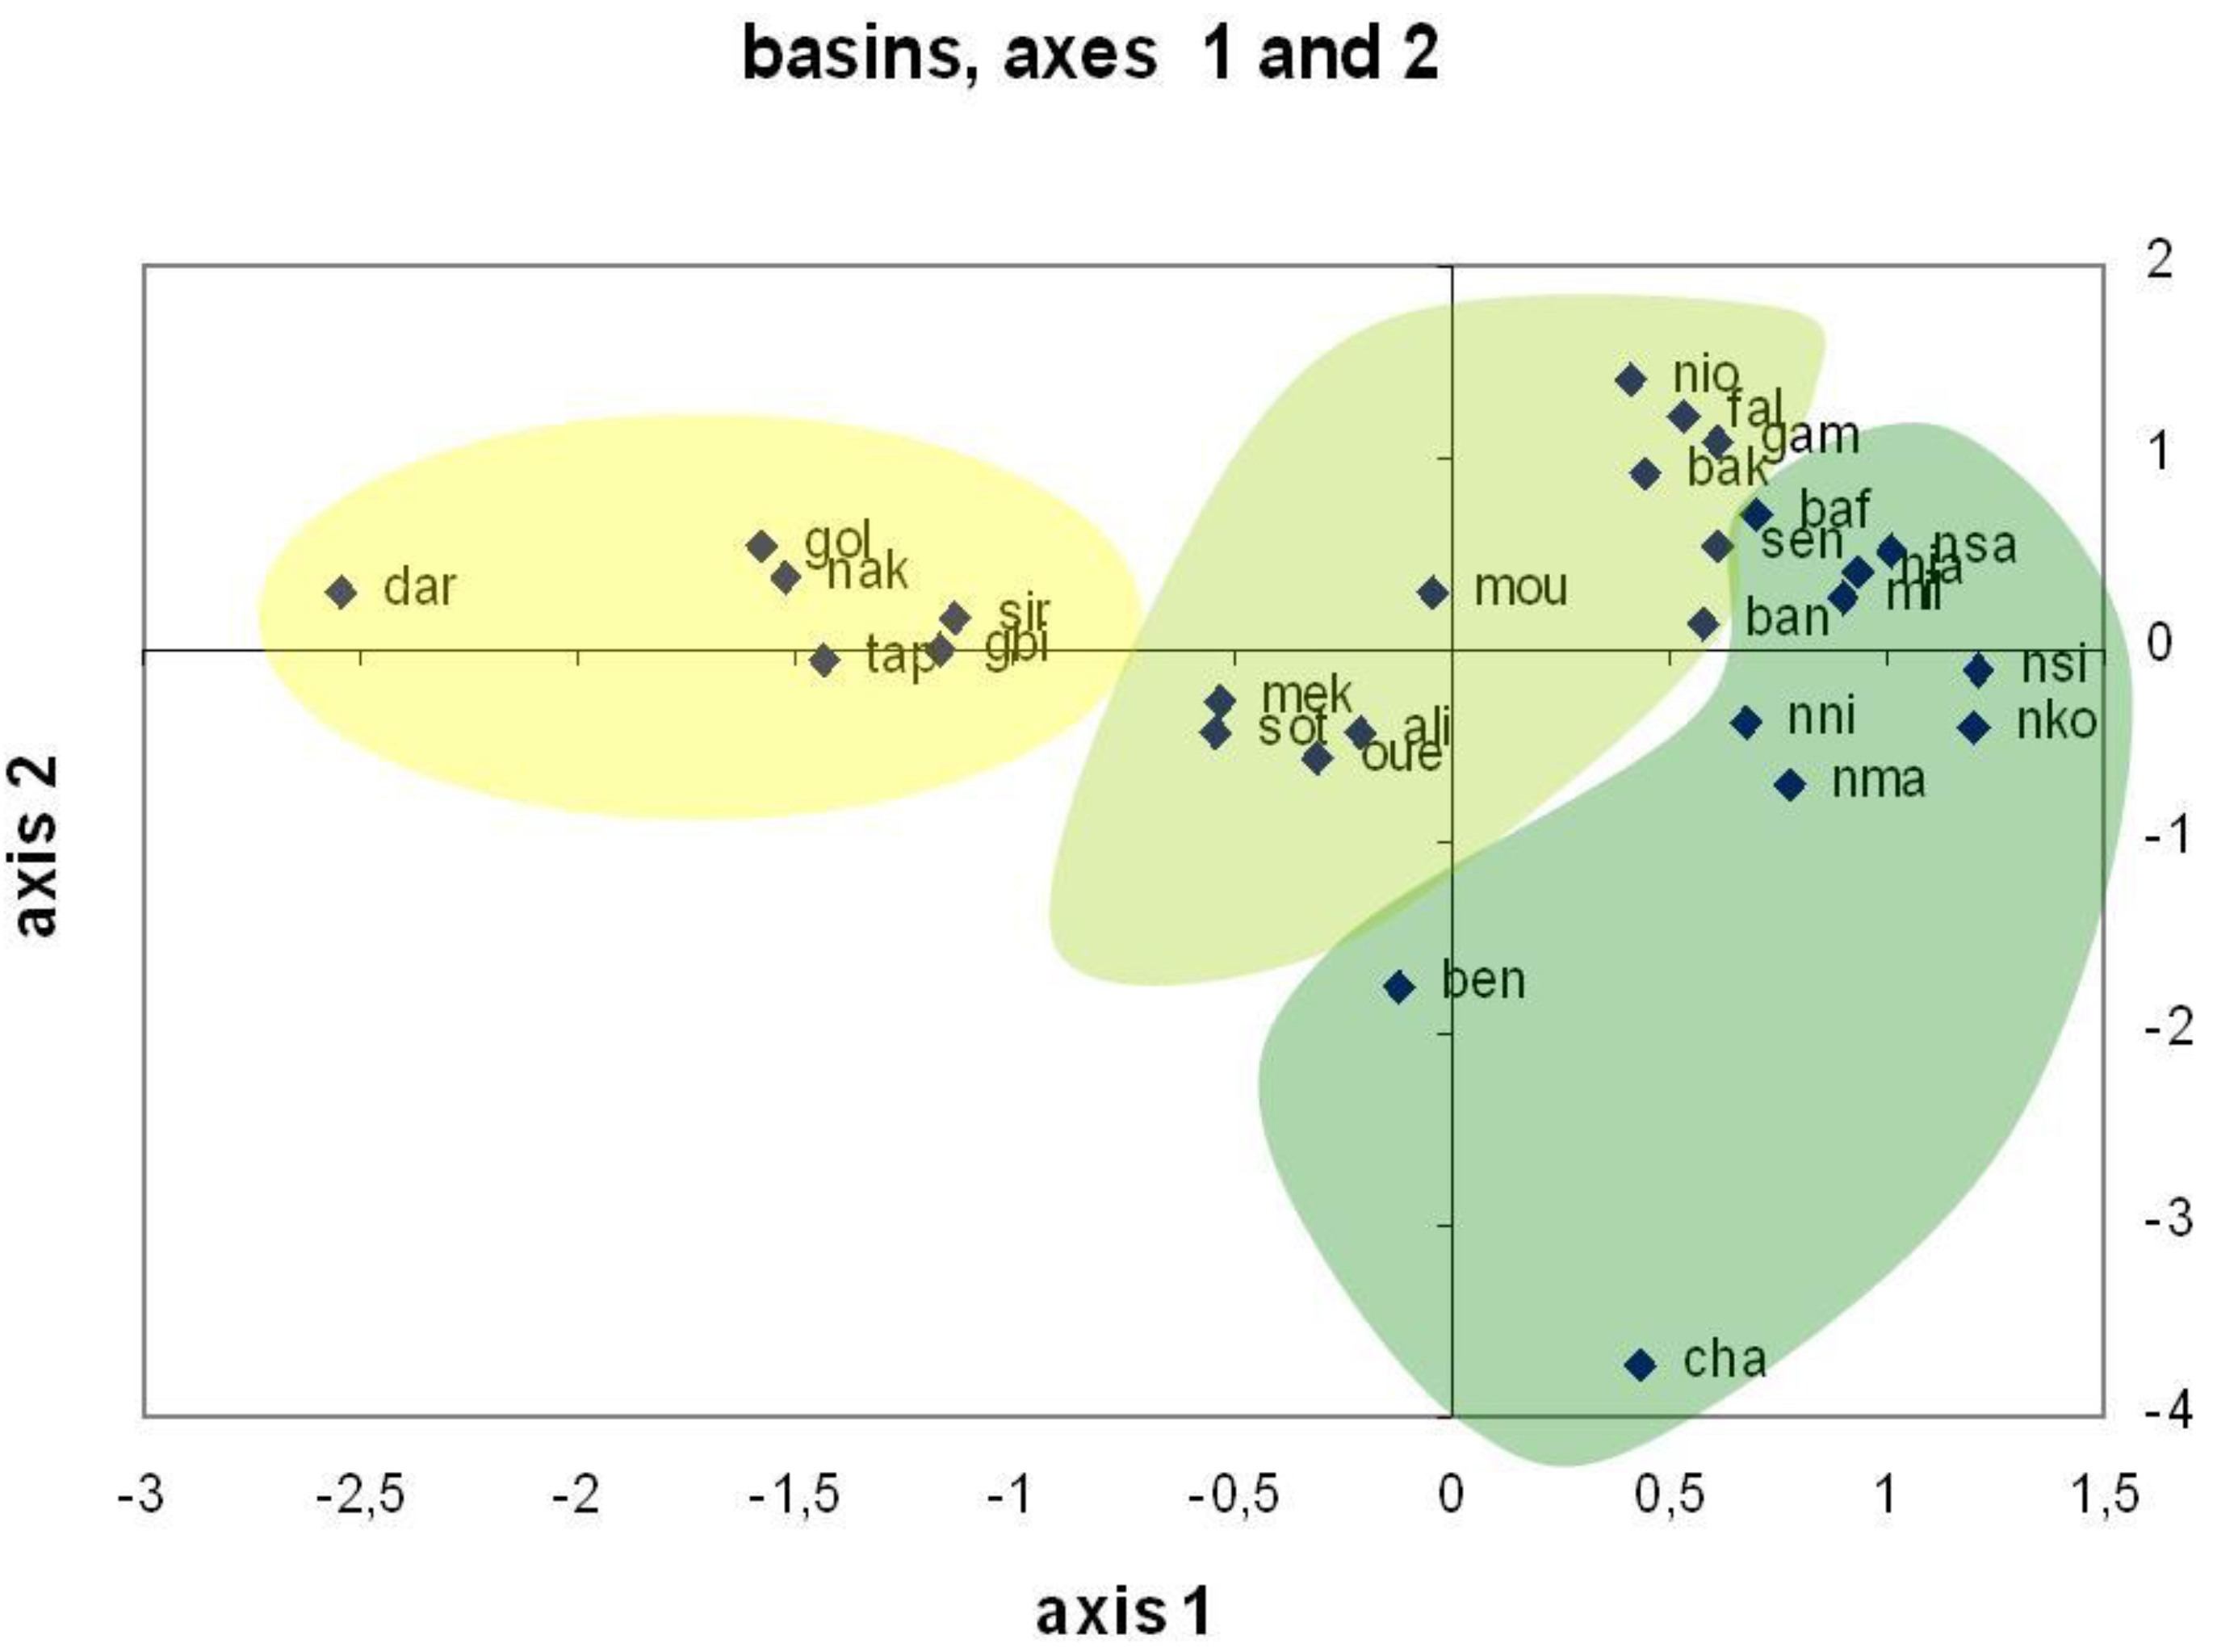
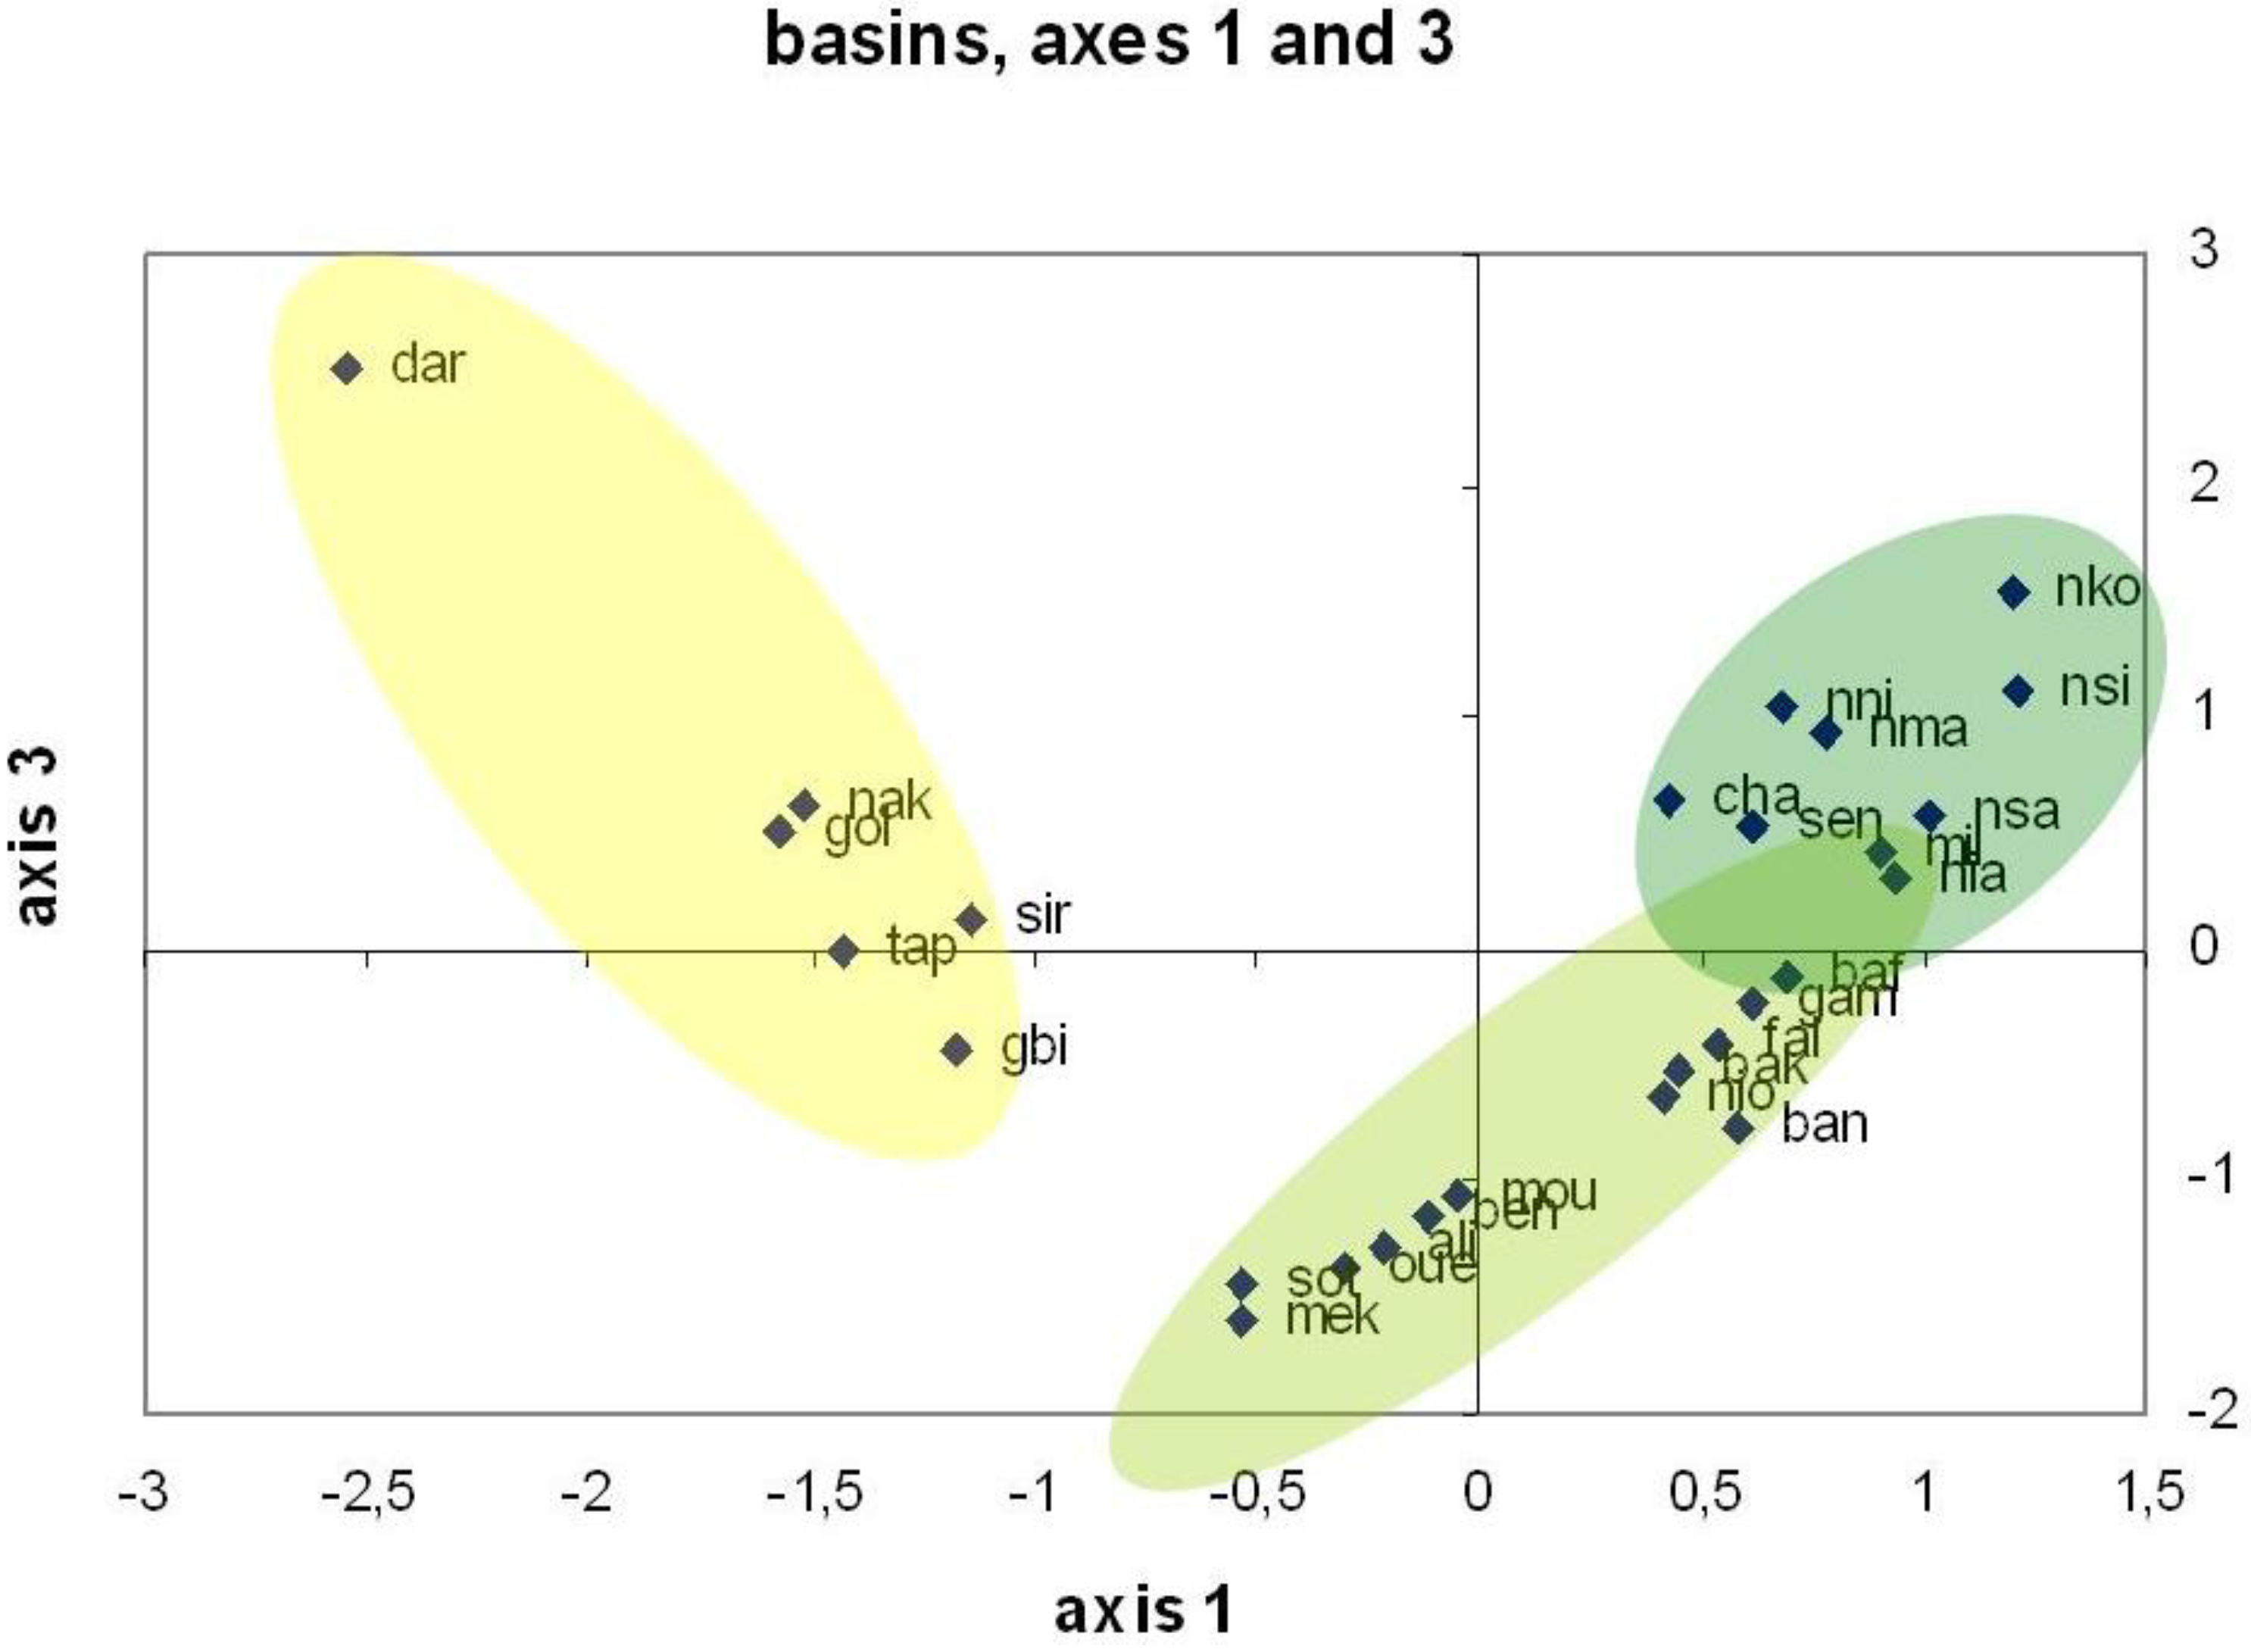
In
Figure 12 and
Figure 13, basins were arbitrarily classified according to the geo-climatic context of their main water providing area: Sahelian and north-Sudanian in yellow, Sudanian in light green and Guinean in dark green; this classification seems to be partially consistent with the one of the PCA analysis, in both cases. According to the data of
Table 9, the three components represented in these two plans of the PCA explain 80% of the variance of the population.
Table 7.
List of the 29 basins analyzed and the corresponding code in the figures of the PCA (principal component analysis; Irane and Diamangou are not used in the PCA analysis).
Table 7.
List of the 29 basins analyzed and the corresponding code in the figures of the PCA (principal component analysis; Irane and Diamangou are not used in the PCA analysis).
| River | Code in graphs |
|---|
| BANI | ban |
| NIOKOLO KOBA | nio |
| BAKOYE | bak |
| IRANE | |
| FALEME | fal |
| ALIBORI | ali |
| SOTA | sot |
| MEKROU | mek |
| OUEME | oue |
| GAMBIE | gam |
| SENEGAL | sen |
| MOUHOUN | mou |
| BAFING | baf |
| NIG-MAL | nma |
| BENOUE | ben |
| NIG-SIG | nsi |
| NIG-KRO | nko |
| NIG-NIA | nni |
| NIANDAN | nia |
| CHARI | cha |
| NIG-KSA | nsa |
| GOROUBI | gbi |
| MILO | mil |
| TAPOA | tap |
| SIRBA | sir |
| GOROUOL | gor |
| DIAMANGOU | |
| NAKAMBE | nak |
| DARGOL | dar |
| | |
Table 8.
Cumulated explained variance (in %).
Table 8.
Cumulated explained variance (in %).
| Component | Total explained Variance | Cumulated % |
|---|
| 1 | 40.58 | 40.58 |
| 2 | 26.93 | 67.51 |
| 3 | 12.62 | 80.12 |
Table 9.
List of variables used in the PCA.
Table 9.
List of variables used in the PCA.
| Code | Name of the variable |
|---|
| BV | Area of the basin |
| Q51-70 | Mean discharge 1951–1970 |
| Q71-90 | Mean discharge 1971–1990 |
| QP2/QP1 | Ratio Q71-90/Q51-70 |
| Q71_96 | Mean discharge 1971–1996 |
| QP3_QP1 | Ratio Q71-96/Q51-70 |
| LOCLONG | Longitude of center of basin |
| LOCLAT | Latitude of center of basin |
| PLULONG | Longitude of «pluviometric» center of basin |
| PLULAT | Latutude of «pluviometric» centr of basin |
| IH51_60 | Runoff index 1951–1960 |
| IH61_70 | Runoff index 1961–1970 |
| IH71_80 | Runoff index 1971–1980 |
| IH81_90 | Runoff index 1981–1990 |
| IH91_00 | Runoff index 1991–2000 |
| IP51_60 | Rainfall index 1951–1960 |
| IP61_70 | Rainfall index 1961–1970 |
| IP71_80 | Rainfall index 1971–1980 |
| IP81_90 | Rainfall index 1981–1990 |
| IP91_00 | Rainfall index 1991–2000 |
Figure 12.
Sample space of the PCA, axes 1 and 2. Sahelian and north-Sudanian is yellow, Sudanian is light green and Guinean is dark green.
Figure 12.
Sample space of the PCA, axes 1 and 2. Sahelian and north-Sudanian is yellow, Sudanian is light green and Guinean is dark green.
Figure 13.
Sample space of the PCA, axes 1 and 3. Sahelian and north-Sudanian is yellow, Sudanian is light green and Guinean is dark green.
Figure 13.
Sample space of the PCA, axes 1 and 3. Sahelian and north-Sudanian is yellow, Sudanian is light green and Guinean is dark green.
Figure 14.
Variables space of the PCA, axes 1 and 2.
Figure 14.
Variables space of the PCA, axes 1 and 2.
Figure 15.
Variables space of the PCA, axes 1 and 3.
Figure 15.
Variables space of the PCA, axes 1 and 3.
Figure 14 and
Figure 15 show that the first axis of the PCA (the main component), which explains 40% of the variance (
Table 9), is mostly represented by the Runoff index (IH51-60, IH61-70, IH71-80 as positive correlation, IH81-90 and IH91-00 as negative ones). The variables describing the decrease in runoff between the “rainy” period (1951–1970) and the “dry” period (1971–1990), QP2/QP1 and QP3/QP1 (in the latter, the dry period is extended until 1996), are obviously those which constitute the first component (
Figure 14). The second and the third components, which explain respectively 27% and 13% more of the variance of the population, are not so easy to define: no variable being located near the axis 2 (
Figure 14 and
Figure 15)—it is only possible to estimate that this is determined partially by the basin location (PLULONG, PLULAT, LOCLONG, LOCLAT) and the basin size (BV); the same configuration makes it difficult to interpret the sense of the 3rd axis (
Figure 15).
The classification of the basins by the evolution rate of their discharge between period 1 (1951–1970) and period 2 (1971–1990) or 3 (1971–1996) (
Table 10) provides almost the same information with only one variable. Except the Goroubi in the first comparison (1971–1990
vs. 1951–1970), which has a decrease in discharge higher than this of the Milo (but not if comparing 1971–1996
vs. 1951–1970), all the basins are classified in the same way as by the PCA analysis. It is possible to discuss the case of the Senegal basin, which is at the boundary of Sudanian and Guinean areas: most of its basin area is located in Sudanian and Sahelian regions, but its main water providing area is situated in the Guinean zone.
Table 10.
Relative values of total annual discharge for the periods 1971–1990 and 1971–1996 vs. the period 1951–1970.
Table 10.
Relative values of total annual discharge for the periods 1971–1990 and 1971–1996 vs. the period 1951–1970.
| River | Q71_90/Q51-70 | Q71_96/Q51-70 |
|---|
| SUDANIAN BASINS | | |
| BANI | 0.30 | 0.30 |
| NIOKOLO KOBA | 0.31 | 0.32 |
| BAKOYE | 0.33 | 0.35 |
| IRANE | 0.34 | |
| FALEME | 0.39 | 0.39 |
| ALIBORI | 0.39 | 0.39 |
| SOTA | 0.41 | 0.49 |
| MEKROU | 0.41 | 0.47 |
| OUEME | 0.42 | 0.49 |
| GAMBIE | 0.42 | 0.43 |
| SENEGAL | 0.46 | 0.48 |
| MOUHOUN | 0.49 | 0.51 |
| GUINEAN BASINS | | |
| BAFING | 0.54 | 0.55 |
| NIG-MAL | 0.57 | 0.59 |
| BENOUE | 0.59 | 0.61 |
| NIG-SIG | 0.60 | 0.60 |
| NIG-KRO | 0.61 | 0.61 |
| NIG-NIA | 0.62 | 0.63 |
| NIANDAN | 0.67 | 0.66 |
| CHARI | 0.68 | 0.67 |
| NIG-KSA | 0.69 | 0.64 |
| MILO | 0.76 | 0.72 |
| NORTH SUDANIAN BASINS | | |
| GOROUBI | 0.72 | 0.81 |
| TAPOA | 0.92 | 1.22 |
| DIAMANGOU | 1.11 | |
| SAHELIAN BASINS | | |
| SIRBA | 0.97 | 0.91 |
| GOROUOL | 1.09 | 1.13 |
| NAKAMBE | 1.22 | 1.31 |
| DARGOL | 2.88 | 2.90 |
Therefore, it is possible to oppose a «geographical» classification of the basins, this of the PCA analysis (
Figure 12 and
Figure 13) with a North to South evolution from the Sahelian to the Guinean areas, via the Sudanian, with the hydrological classification, where the Sahel (including the North Sudanian region) is the area where runoff coefficients are increasing, and discharges show in a few cases a slight decrease and mostly a significant increase; then, instead the Sudanian region, the Guinean one is the second area, with a significant decrease in discharges between the two periods, while the Sudanian region, although it is geographically located between the two previous ones, is characterized by the highest discharge decrease rates.
4. Discussion
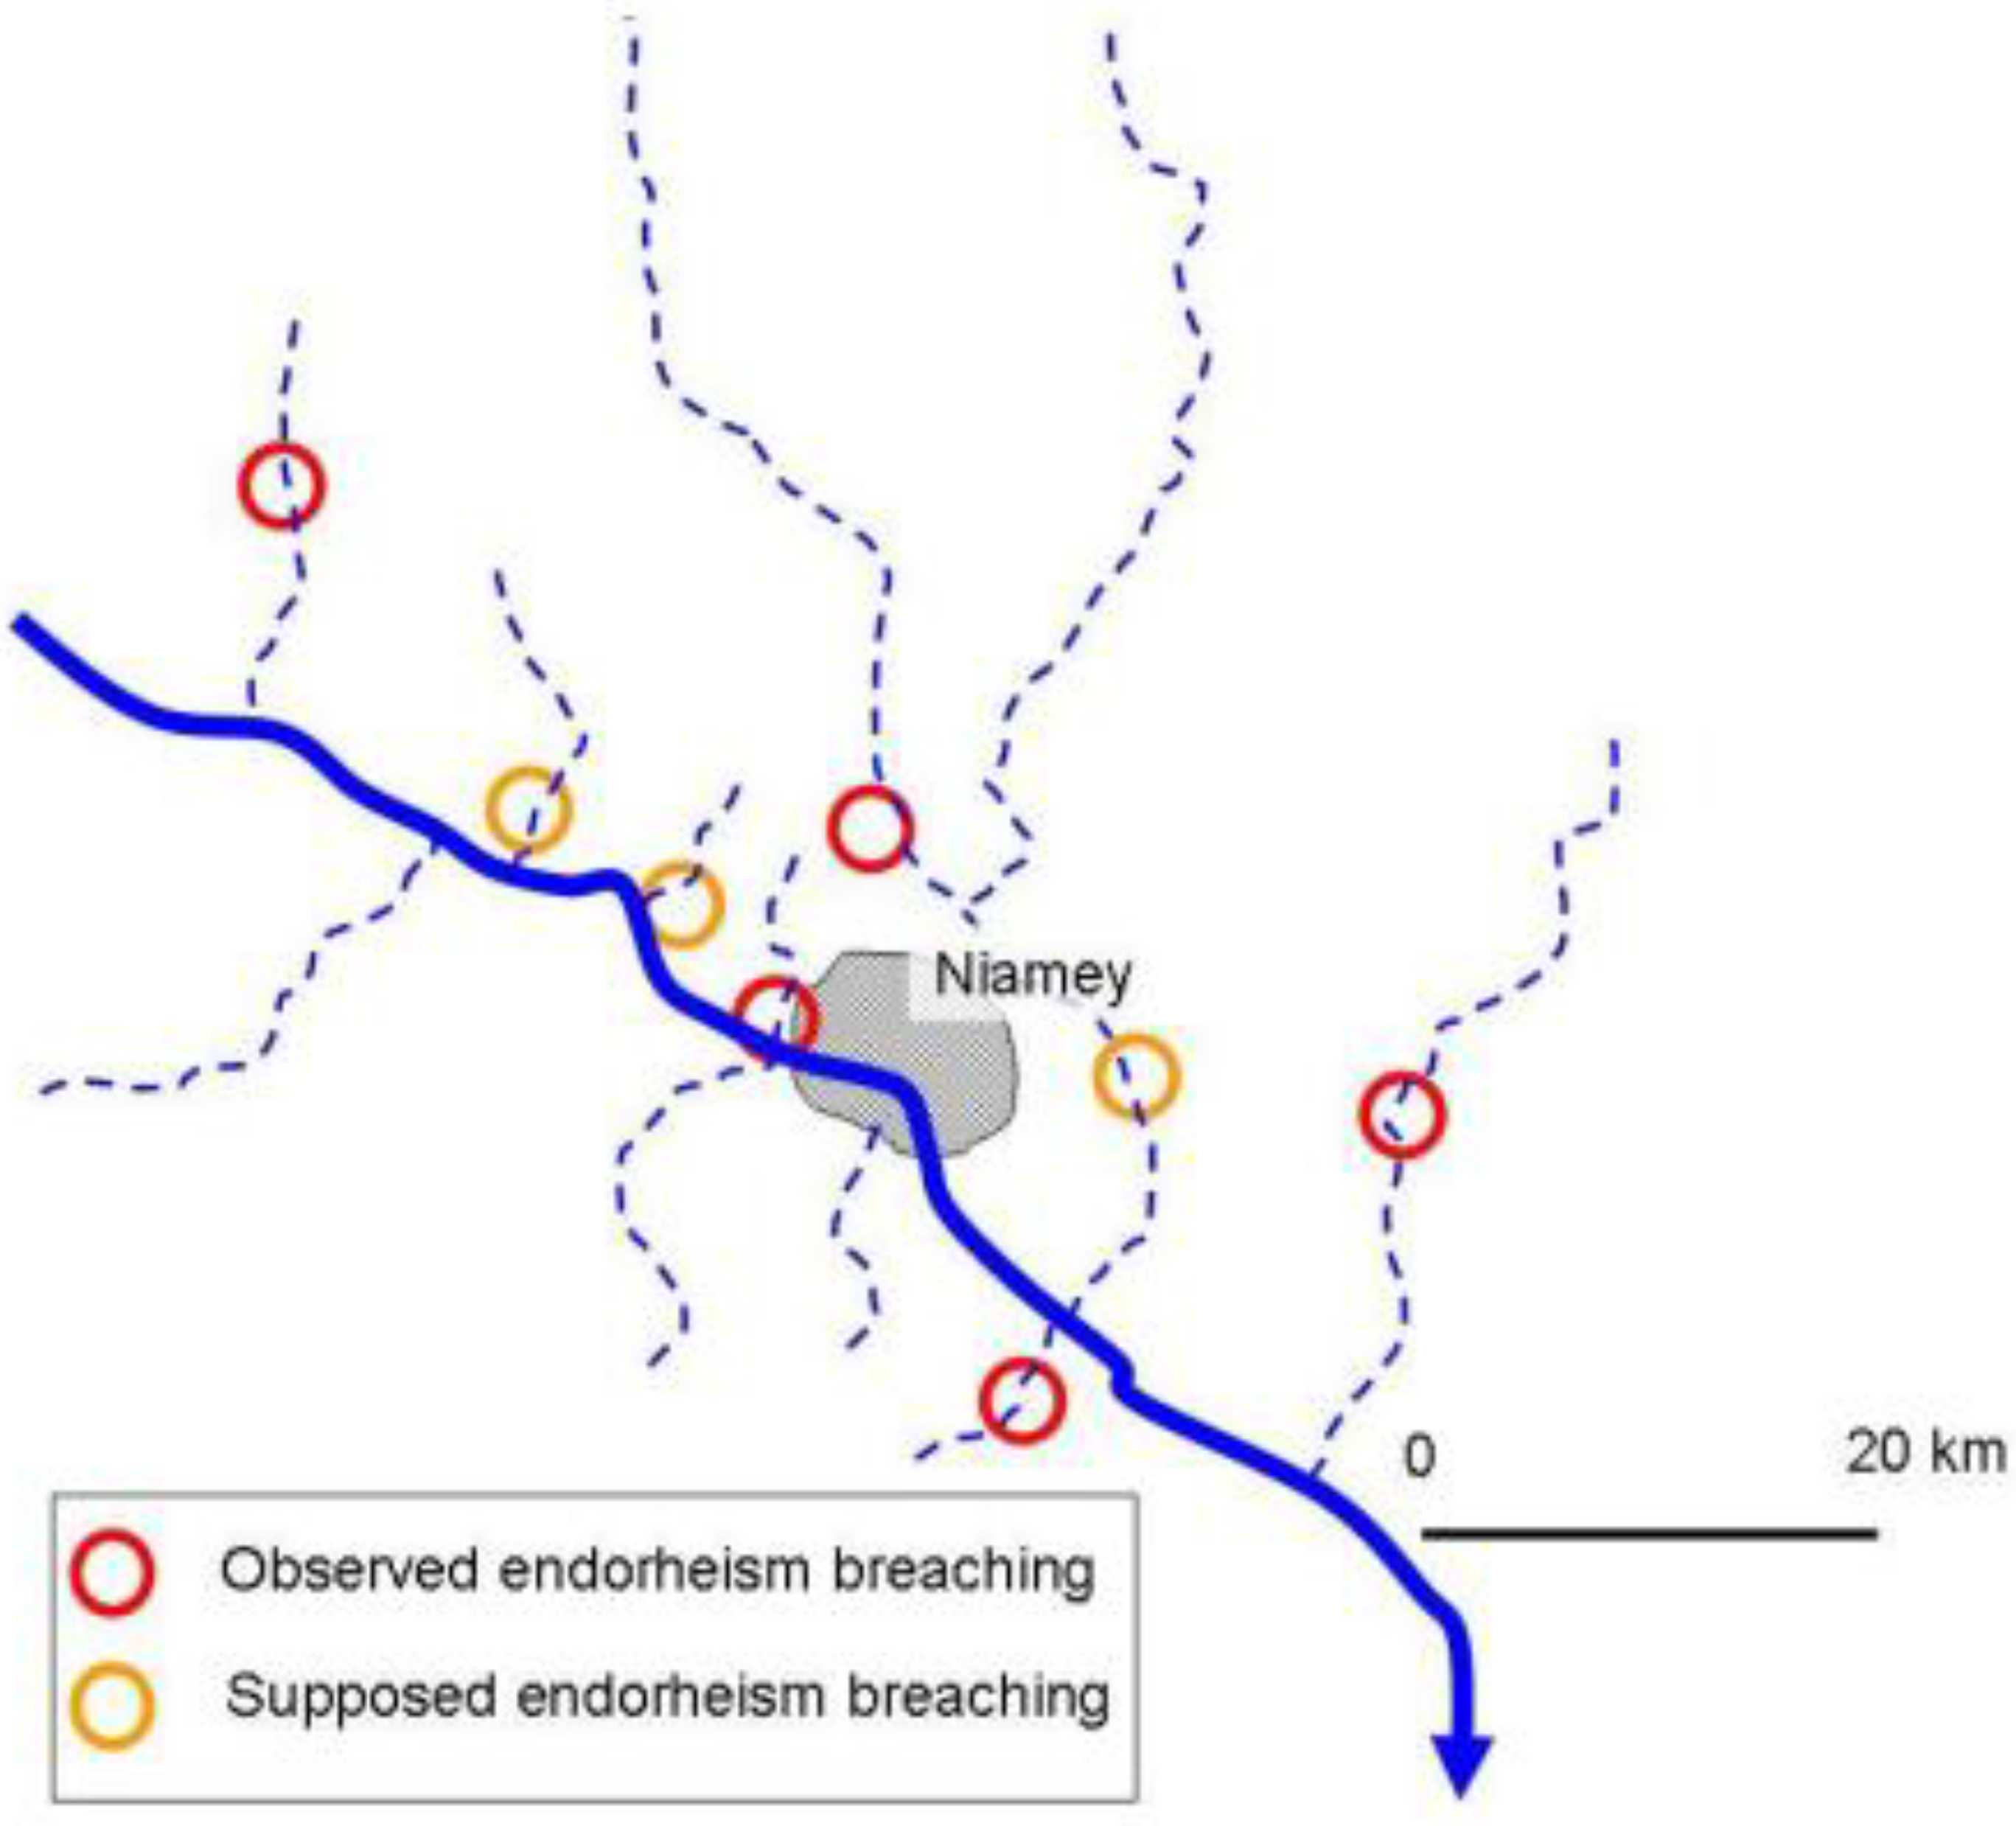
Otherwise, we noticed an increase in the appearance of “endorheism” ruptures; several cases of endorheic valleys becoming exorheic after a heavy rain event in the last decade;
Figure 16 shows the location of the cases observed near the city of Niamey, highlighting the vicinity of many of these phenomena in the areas surrounding this city. It is likely that land degradation is stronger near the capital of Niger due to the exacerbation of land overexploitation and firstly due to wood and forage harvesting, dedicated for household uses (wood for cooking and forage for the urban and near-urban breeding).
Figure 16.
Location of recent endorheism ruptures observed near Niamey, in the middle reach of the Niger River.
Figure 16.
Location of recent endorheism ruptures observed near Niamey, in the middle reach of the Niger River.
As a conclusion, we observed—in Sahelian areas and at all scales—an increase in runoff coefficient, and generally an increase in river discharges. In most cases, this is correlated with a decrease in vegetation cover due to land use changes, increase in crop area, in overgrazing and in wood harvesting. Nevertheless, at the regional scale, the degradation of vegetation cover is not so evident and detectable. The contrary (observation or evidence of the increase in vegetation indices as the NDVI) is commonly observed. However, due to the high runoff coefficient of the degraded soils in the Sahel (close to 60% instead of 4% for millet crops and bush and 10% in fallows—see
Table 2 above) the increase from between 2 and 3% to 10% of the total area concerned by degraded, crusted soils, can explain both the increase in runoff (up to +100 or 400% at the local scale) and the observed increase in NDVI values for the Sahelian areas, the remaining soils being covered by higher densities of graminaceae, herbaceae and annual plants than in previous periods. This is consistent with previous works, where the current (possible) increase in vegetation was not yet taken into account: Amani and Nguetora [
9] suggested that the runoff coefficient of the middle Niger’s tributaries could be increasing due to a reduction in vegetation cover, while Mahé
et al. [
43] highlighted a “post 1973 phenomenon” of increased runoff despite a reduction in rainfall in mostly Sahelian areas with less than 700 mm of annual precipitation, including most of the present study area. In Sudanian areas with more than 700 mm of annual rainfall, Mahé
et al. [
43] found runoff to vary directly with rainfall. A similar trend was noted by Séguis
et al. [
6] in Wankama on the mainly endorheic left bank of the Niger River: with the runoff coefficient estimated to have increased by up to 1.7-times the value in 1950, despite the reduction in precipitation observed. This is consistent with our observations concerning the “Sudano-Sahelian” basins, where the decrease in discharges is more or less equivalent to the decrease in rainfall; the recent years being characterized by an increase in both variables. Mahé
et al. [
43] did not notice this increase because this process is more recent than their observations.
The analysis presented here is only based on measured and observed data, no modeling is proposed. It is worth noting that Itiveh and Bigg [
50], using only field data, noticed at the entry of the Niger delta system in Nigeria, “
a strong relationship between precipitation and the discharge data from both sections of the Niger River basin”, without introducing the effects of either land cover or land use change. But conclusions corroborate some modeling based previous works: Li
et al. [
51] (2007) in a study based on the River Niger and Lake Chad basins revealed “
how land use changes affect hydrological regimes at the watershed scale”..”
total deforestation increases the simulated runoff ratio from 0.15 to 0.44”; then they noticed that “there is no significant impact on the water yield and river discharge when the deforestation (thinning) percentage is below 50% or the overgrazing percentage below 70% for savanna and 80% for grassland areas”. D’orgeval and Polcher [
52] (2008) using the model ORCHIDEE to simulate the impacts of precipitation events and land-use changes on West African river discharges during the years 1951–2000 stated that “
precipitation changes account for the main part of the shift in river discharges between humid and dry periods. In other words, changes in land use and land cover in the quality of the forcing and flaws in ORCHIDEE parameterizations are non significant compared to the precipitation changes between these two periods”; however, they added later that “
ORCHIDEE misses
an increase in the mean and the variability of discharge which is around 5–20% at Koulikoro and Aniassue”.
The simple classification proposed in
Table 10 corroborates the recent conclusions of Mahé and Paturel [
17], who stated that “
the joint effect of climate change and of human activities … is responsible for an increase of the runoff coefficients of West African Sahelian rivers since the 1970s despite the rainfall shortage” and that “
the runoff coefficients have increased in regions with less than 750 mm of annual rainfall” and finally, “
the highest values are observed in the most inhabited areas, where land cover is dominated by cultivated areas”. These authors showed that this process is observed also in the southern Sahelian, part of Mauritania.
Comparison with southward located basins in
Table 10 also shows that the decrease in runoff is much higher in Sudanian areas than in Guinean ones; an explanation was given by Descroix
et al. (2009) based on the geographical extension of respectively Hortonian and Hewlettian functioning areas. Furthermore, comparing surface and groundwater interactions in the Bani and Nakambe Rivers, Mahé [
53] highlighted the role of the “
reduction in the baseflow related to the cumulated rainfall deficit”. By comparing a mostly Sudanian river (the Bani River. tributary of the Niger) with a fully Sahelian one (the Nakambe, tributary of the Volta River), this author distinguished two different hydrological behaviors consistent with the regionalization attempted by Descroix
et al. [
10]. It is interesting to notice that the two basins opposed by Mahé [
53] are precisely in the opposed part of
Table 10: the Bani River being the first one, the Nakambé the last but one when classified by their discharge decrease rate. Their description of the opposition between the Hortonian behavior of Sahelian catchments on the one hand and the role of soil water holding capacity (despite its declining importance) in Sudanian regions, always mostly characterized by a “Hewlettian” hydrology and the existence of a baseflow, on the other hand, corroborates our previous statements [
10] and those presented here.
Land use change in West Africa leads to an extension of the areas where the “Hortonian” functioning dominates, maybe an indicator of the southward extension of the Sahel?
5. Conclusions
The Sahel has been shown to have an increasing water yield because of land use changes, and more precisely, because of soil crusting and land degradation: this process being demonstrated here at the small basin scale only. We showed in this study that the increase in runoff has been observed from the local to the regional scales, whatever the land use change is, in the Sahelian region. Although there has been a recent increase in vegetation indices over the whole Sahel, possibly linked to the slight increase in rainfall observed after 1994, runoff coefficients and discharge continue to increase, as a result of the reduction in soil water holding capacity.
Using most of the available data, hydrological, climatic as well as vegetation data, we proposed in this study that a spatial extension of the “Sahelian paradox”, defined as the increase in runoff despite the decrease in rainfall, was observed in recent years.
We demonstrated that the increase in runoff is observed from the point scale to the regional scale, and that it concerns the whole Sahelian area. The original recent hydrological evolution (known as the “Sahelian paradox”) is highlighted by its strong opposition with the behavior of Sudanian areas.
However, this fact has direct consequences for the availability of water resources. Firstly, this phenomenon is a consequence of land degradation, which constitutes a threatening factor for the future of West African populations. Secondly, it is accompanied by a reduction in the duration of stream flow in small rivers and a shortening of the annual flood in larger rivers. Therefore, this “new” or “increasing” resource is more difficult to use and leads to new problems of flood disasters, such as those observed in August and September 2007 in northern Togo and southern Burkina Faso, when rainfall events of common intensity caused runoff and severe floods in places where such events never provoked inundations in the past. As climate change seems to provoke a rise in extreme rainfall events (as those observed on the 1st of September. 2009, at Ouagadougou—Burkina Faso and Agadez, Niger, among others), it is likely that severe flooding disasters will increase in number and severity in coming decades.


