Article

Urban Runoff Pollution Forecasting in the Yangtze River Basin: A Physics-Informed Data-Driven Framework Enhanced with Cluster-Based Transfer Learning


1
State Key Laboratory of Water Cycle and Water Security, College of Environment, Hohai University, Nanjing 210098, China
2
National Engineering Research Center of Eco-Environment Protection for Yangtze River Economic Belt, China Three Gorges Corporation, Wuhan 430010, China
*
Author to whom correspondence should be addressed.
Water 2026, 18(9), 1095; https://doi.org/10.3390/w18091095
Submission received: 1 March 2026 / Revised: 28 April 2026 / Accepted: 30 April 2026 / Published: 2 May 2026

Abstract

Accurate forecasting of urban rainfall-runoff pollution across large river basins is essential for urban water management. However, this task faces formidable challenges due to the scarcity of locally monitored data and the heterogeneity in hydrological and pollution processes. To address these challenges, we proposed a novel three-tiered framework comprising (1) functional area clustering using 16-dimensional features to identify zones with shared pollution mechanisms and establish a physical parameter library; (2) a hybrid physics-informed data-driven model integrating SWMM with a Residual-BiLSTM-Multi-Head Attention (RLA) model; and (3) cluster-based transfer learning enabling predictions in data-scarce zones. The framework’s efficacy was demonstrated through a multi-tiered dataset for the Yangtze River Basin. First, a knowledge base comprising 2390 reported rainfall events across 57 functional areas was synthesized to inform the functional clustering and establish a shared physical parameter library. Subsequently, intensive field monitoring from two representative residential areas was used to train and validate the hybrid model. In data-rich zones within a cluster, the model achieved high accuracy (R2 > 0.82). For data-scarce zones within the same functional cluster, the model maintained a promising performance (R2 > 0.5). This study presents a novel basin-scale framework, with its initial application and preliminary validation in the Yangtze River Basin.

1. Introduction

Urban rainfall-runoff pollution transports contaminants from impervious surfaces into receiving waters through drainage systems. This process is characterized by multiple sources, spatio-temporal heterogeneity, and nonlinear dynamics. Consequently, accurate basin-scale forecasting is essential for urban water management [1,2,3]. Traditional process-based models rely on intricate parameterization to describe runoff generation and pollutant transport mechanisms [4,5]. However, in large river basins such as the Yangtze, rapid urbanization has markedly increased the complexity of impervious surfaces and land-use patterns, intensified spatial mechanistic heterogeneity across functional areas, and resulted in severe data scarcity in numerous regions [6,7,8]. This greatly limits the wide application of traditional physical models at the basin scale [9,10]. Recent advances in data-driven models, particularly deep learning, which demonstrate powerful nonlinear mapping capabilities, can accurately capture the dynamic evolution of rainfall-runoff pollution processes [11,12,13]. Coupling physical and data-driven models preserves the mechanistic constraints of runoff pollution processes while exploiting the data-driven advantages in nonlinear fitting, thereby offering the potential for basin-scale prediction [14,15,16].
The physical model and data-driven model are coupled through observation bias, inductive bias and learning bias, which have application advantages in complex scenes with scarce data and known physical parts [17]. Wang et al. proposed a physics-encoded deep learning framework for distributed hydrological modeling over the Amazon Basin, which integrates physical constraints into neural networks and achieves high accuracy in streamflow prediction under data-rich conditions [18]. Zubelzu et al. proposed a hybrid methodology that integrates the Green-Ampt infiltration model with deep neural networks, employing a physics-guided approach to incorporate both static soil characteristics and dynamic pre-event meteorological data, thereby improving the prediction of runoff occurrence and volume in a small basin [19]. Although hybrid models demonstrate strong advantages in various complex environmental scenarios, their application to the large basin-scale runoff pollution prediction remains severely constrained. This limitation primarily arises from significant disparities in data availability across cities, especially in small and medium-sized urban areas [20]. Moreover, mechanistic heterogeneity results from variations in dominant pollution pathways across different functional land-use types and rainfall regimes [21,22]. To effectively generalize models under such complex conditions, it is crucial to identify shared regional characteristics in hydrological processes, pollutant transport dynamics, and land-use functions [23,24,25].
Multi-source data clustering offers a promising approach to uncover these common patterns. For instance, Lapo et al. demonstrated unsupervised extraction of spatio-temporal patterns, and Wang et al. used clustering to elucidate physical mechanisms in climate phenomena [26,27]. Similarly, for urban runoff pollution, studies reveal significant pattern clustering tendencies based on macro-dimensions such as climate zoning and land use type [28,29,30]. However, despite these advances, most existing clustering approaches rely heavily on superficial indicators that fail to capture the underlying physical mechanisms of runoff and pollutant generation. This results in groupings that may reflect apparent similarities but lack the runoff pollution generation mechanism. As a consequence, the potential for shared modeling strategies, particularly in constructing transferable physical parameter libraries, is limited. A critical gap remains in the development of physics-informed clustering frameworks that can group heterogeneous urban functional areas according to their intrinsic runoff pollution generation mechanisms. Constructing feature spaces that capture the core physical processes is essential for enabling meaningful parameter sharing across zones with similar hydrological responses and pollution behaviors. This approach helps reduce data requirements and enhances model generalization [31,32,33].
This study proposes a novel physics-informed data-driven framework. It aims to address key challenges in basin-scale urban rainfall-runoff pollution forecasting, particularly under data scarcity and spatial heterogeneity. The specific objectives of this framework are: (i) to identify urban functional areas with shared pollution generation mechanisms by clustering 16-dimensional features, thereby establishing a transferable physical parameter library; (ii) to construct a hybrid prediction model that integrates physical simulations with deep learning, leveraging physical simulations as inputs to a deep learning architecture; and (iii) to enable cluster-based transfer learning for predictions in data-scarce zones. The remainder of this paper is organized as follows. Section 2 describes the study area, the acquisition of rainfall-runoff pollution event data across 57 functional areas within the Yangtze River Basin, and the detailed methodology of the proposed framework. Section 3 presents the results and discussion, including clustering outcomes, comparative evaluation of the hybrid model against benchmark models, ablation studies quantifying the contribution of each model component, and the basin-scale prediction performance after transfer learning. Section 4 summarizes the main conclusions of this study and outlines recommendations for future research.

2. Materials and Methods

2.1. Study Area

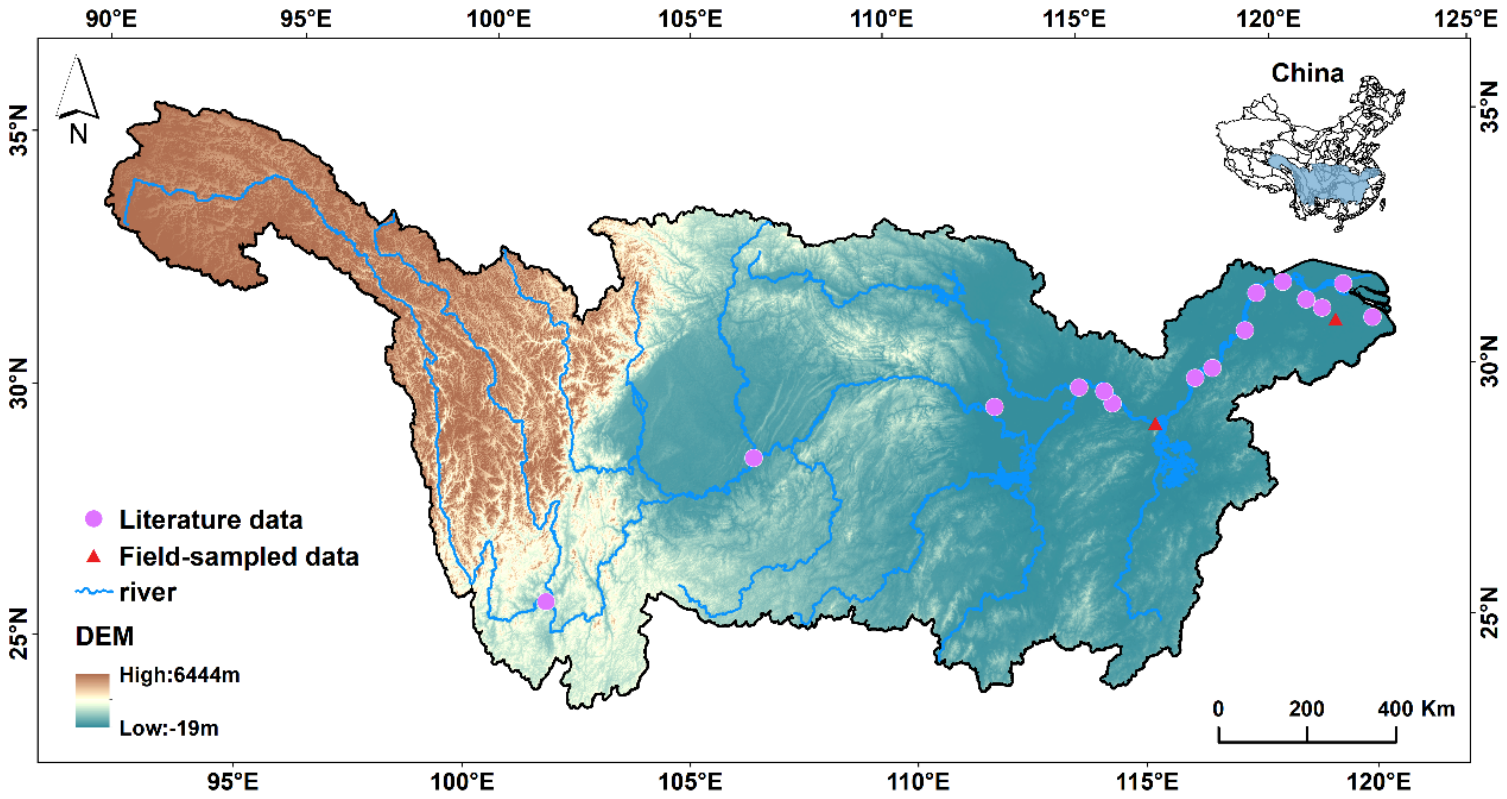
The Yangtze River Basin spans the transition zone between China’s eastern monsoon region and the Qinghai–Tibet Plateau region (Figure A1). Characterized by a typical subtropical to warm temperate climate, the basin receives an average annual precipitation ranging from 500 to 2500 mm, predominantly concentrated in summer [34]. Encompassing a vast area of 1.8 million square kilometers, the Yangtze River Basin is not only the largest river basin in China but also ranks as the third-largest globally. It serves as a critical economic zone experiencing rapid urbanization, hosting over 30 large and medium-sized cities [35,36]. This high urbanization rate, coupled with a dense population and intensive human activities across its extensive territory, renders the basin both a representative and challenging region for studying and managing large-scale urban non-point source pollution.
To evaluate the model’s performance specifically for basin migration applications (i.e., transferring knowledge from data-rich to data-scarce areas), detailed field monitoring of rainfall-runoff pollution events was conducted in two representative residential areas within the basin. One is located in Wujiang District, Suzhou, China (Area A), and the other is located in Lianxi District, Jiujiang, China (Area B). In Area A, a rain-pollution diversion drainage system was implemented, covering a drainage area of 55,677 square meters. The land cover can be categorized into four types: green space, roads, roofs, and squares. The basin exhibits a north subtropical monsoon maritime climate, with an average annual temperature of 18.2 °C. The average annual rainfall is 1490 mm, of which summer precipitation accounts for nearly 50%. In Area B, a rain-pollution diversion drainage system was implemented, covering a drainage area of 410,160 square meters. The land cover can be categorized into six types: green space, roofs, concrete pavements, tarred pavements, permeable pavements, and artificial turf playgrounds. The basin features a subtropical humid monsoon climate, with an average annual temperature ranging from 15 to 21 °C and an average annual rainfall between 1583 and 1766 mm. Over 40% of the rainfall is concentrated during the plum rain season from April to June, with monthly precipitation in May and June reaching approximately 200 mm.

2.2. Data Acquisition

This study takes the Yangtze River Basin as the research object. Through compilation of public literature, urban rainfall-runoff pollution event data for 17 cities and 57 functional areas within the Yangtze River Basin were acquired (Table A1). These literature-derived data were used exclusively for constructing the 16-dimensional feature vectors (Table A3) to perform functional area clustering (Section 2.2). The clustering results subsequently guided the selection of target domains in the transfer learning framework (Section 2.3.3). Following the Standard for Basic Terminology of Urban Planning [37], urban functional area types were classified. According to this standard, the urban functional areas in the study area were categorized into six types: cultural and educational areas, storage areas, commercial areas, residential areas, scenic areas, and industrial areas.
Drainage network data for Areas A and B were sourced from residential property management departments and the National Engineering Research Center of Eco-environment Protection for the Yangtze River Economic Belt. Additionally, pollutant concentrations were monitored at the outlets of storm-sewer pipelines from June 2023 to July 2024. Rainfall data were recorded manually using JQR-1 rain gauges (Jinshui Huayu Information Technology Co., Ltd., Weifang, China) and computed using the local rainstorm intensity formula. During this period, five rainfall events in Area A and fourteen rainfall events in Area B were monitored (Table A2). Water sampling was conducted at 5 min intervals during the initial storm phase and approximately 30 min intervals thereafter until runoff cessation. According to the standard methods outlined in the Water and Wastewater Monitoring and Analysis Method [38], the chemical oxygen demand (COD), total nitrogen (TN), suspended solids (SS), and total phosphorus (TP) of the samples were analyzed using the potassium dichromate method, potassium persulfate oxidation-UV spectrophotometry method, filter drying method, and ammonium molybdate spectrophotometry method, respectively. These field monitoring data from Areas A and B constituted the core dataset for training, validating, and testing the hybrid model and served as the source domain for the subsequent transfer learning experiments.
Based on the influencing factors of urban rainfall runoff pollution and the representativeness and availability of related data, a 16-dimensional feature vector was constructed, incorporating rainfall characteristics, pollution characteristics, and human and social characteristics (Table A3) [39,40,41]. The hierarchical clustering algorithm with the Canberra distance was employed to conduct unsupervised classification based on the similarity of pollution mechanisms in functional areas, resulting in the output of multiple classes of typical functional areas [42,43,44].

2.3. Hybrid Model Construction

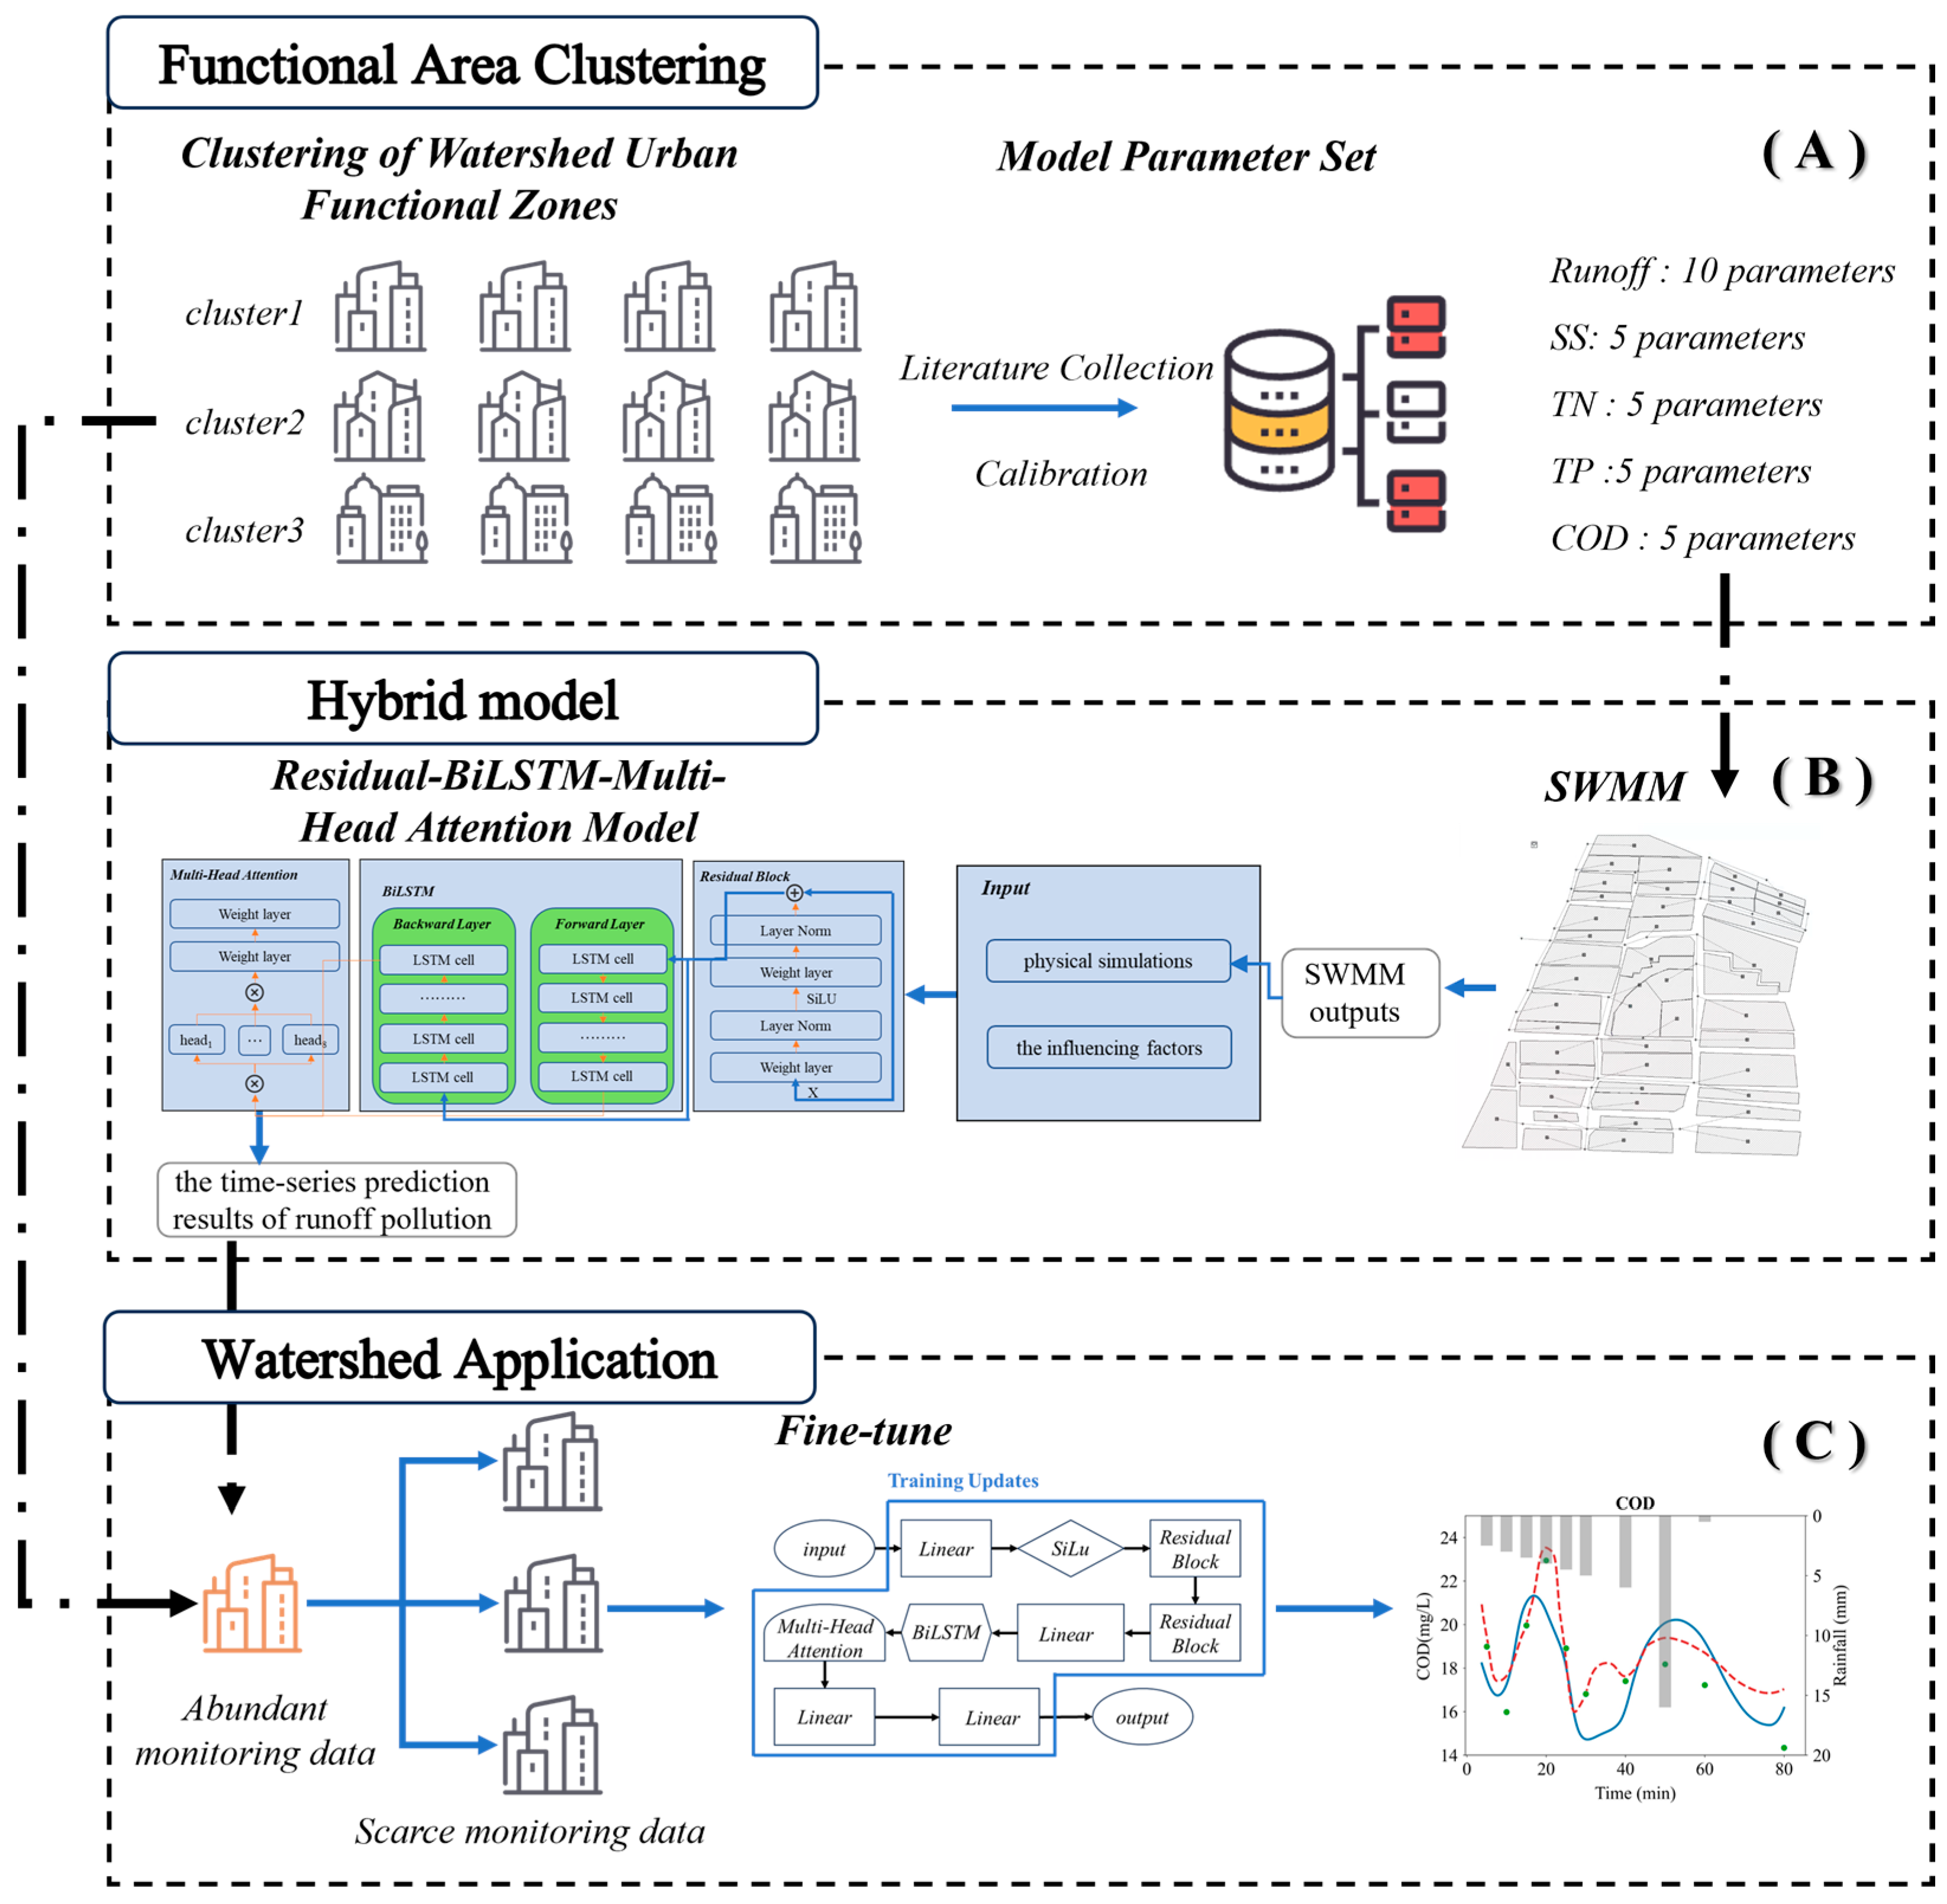
In response to the limitations of traditional models in basin-scale urban rain-runoff pollution load accounting, a computational framework integrating the physical model and the data-driven model was proposed (Figure 1). The systematic errors in physically based models, often stemming from initial parameterization and leading to reduced prediction accuracy, can be learned and corrected using data-driven models, as established in prior research on similar modeling frameworks [45]. Therefore, by integrating the preliminary simulation results of the process model, time-series monitoring data, and deep learning approaches, high-precision and transferable rainfall-runoff pollution prediction can be achieved.

2.3.1. SWMM

Storm Water Management Model (SWMM) is a dynamic rainfall-runoff simulation model developed by the U.S. Environmental Protection Agency (EPA) [46]. It is primarily utilized to simulate stormwater runoff, pipeline network transportation, water quality, and the performance of low-impact development facilities in urban drainage systems. In the SWMM, the study area is divided into several sub-catchment areas, and surface runoff production and confluence calculations are performed separately in each sub-catchment area. The sub-catchment area is divided into pervious and impervious surfaces [47]. The Horton method was used to simulate the process of surface runoff generation, and the Horton equation is an empirical model proposed by Horton. The principle of the model is to describe long-duration precipitation events, where the infiltration attenuation index decreases exponentially from the maximum infiltration rate to a minimum value over time, as shown in Equation (1) [48,49]. The model employs the nonlinear reservoir method to estimate the surface confluence process [50,51]. An exponential function model was used to simulate the accumulation process of surface pollutants in Equation (2), while an exponential function was employed to simulate the scouring process of pollutants in Equation (3) [52], and the dynamic wave method was utilized to simulate water flow movement in pipes [53].
f = f t + f 0 f t e k t
B = C 1 1 e C 2 t
W = C 3 q C 4 B
where f is the infiltration rate (mm/h); f t is the steady infiltration rate (mm/h); f 0 is the initial infiltration rate (mm/h); t is precipitation duration (h); k is the attenuation coefficient of infiltration (1/h); B is the accumulation of pollutants (kg); C 1 is the maximum accumulation of pollutants (kg); C 2 is the half-saturation constant; W is the surface pollutant washout (kg); C 3 is the wash-off coefficient; C 4 is the wash-off exponent; q is the runoff rate (mm/h).
In this hybrid framework, SWMM is employed to provide a physically consistent baseline simulation rather than a precisely calibrated prediction. Accordingly, the SWMM parameters (Table A4) are derived from literature-based values. This design preserves the generalizability of the framework across data-scarce regions, as the subsequent RLA model is tasked with learning the systematic bias between the uncalibrated SWMM output and observed concentrations.

2.3.2. Residual-BiLSTM-Multi-Head Attention Model

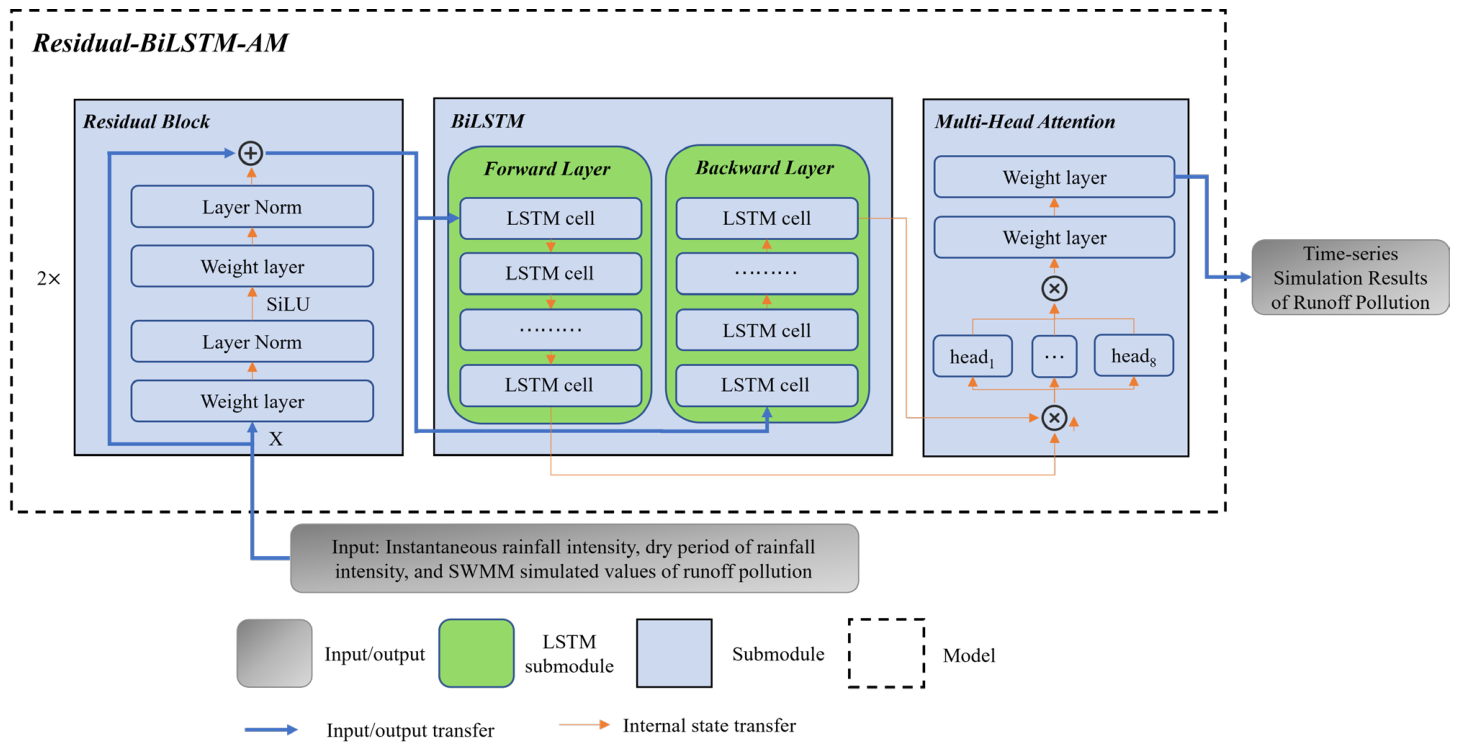
We employ the Bi-directional Long Short-Term Memory (BiLSTM) model as the fundamental machine learning module and integrate residual linking and the multi-head attention mechanism to construct our model architecture (RLA) (Figure A2). The BiLSTM model is an improvement of the traditional LSTM network [54]. In the traditional LSTM network, information is propagated backward only from past time steps. However, the BiLSTM introduces an additional forward layer, enabling bidirectional information propagation from both past and future time steps. At each time step, the outputs of the forward and backward channels are concatenated to generate the complete bidirectional output. This allows the BiLSTM to capture temporal information in sequence data more comprehensively. The fundamental computational method of the BiLSTM algorithm is presented in Equations (4) and (5) [55]. In this study, the BiLSTM model had an input dimension of 64, a hidden layer dimension of 64, and consisted of 6 hidden layers.
f t = σ W f · h t 1 ; x t + b f i t = σ W i · h t 1 ; x t + b i Z t ~ = tanh W z · h t 1 ; x t + b Z Z t = f t × Z t 1 + i t × Z t ~ o t = σ W o · h t 1 ; x t + b o h t = o t × tanh Z t f t = σ W f · h t + 1 ; x t + b f i t = σ W i · h t + 1 ; x t + b i Z t ~ = tanh W z · h t + 1 ; x t + b Z Z t = f t × Z t + 1 + i t × Z t ~ o t = σ W o · h t + 1 ; x t + b o h t = o t × tanh Z t
h t = h t ; h t
where . is the forward computation and . is the backward computation. W f , W i , W z , W o are the weight matrices for the forward LSTM, while W f , W i , W z , W o are the weight matrices for the backward LSTM. b f , b i , b Z , b o are the bias vectors for the forward LSTM, and b f , b i , b Z , b o are the bias vectors for the backward LSTM. x t is the model input at time step t. [   ;   ] is the vector concatenation operation. Z t ~ is the new cell state candidate generated by the hyperbolic tangent function (tanh). Z t is the updated cell state. σ is the sigmoid activation function. o t is the output gate information. f t is the forget gate information. i t is the input gate information. h t is the output of the current sequence.
It is widely acknowledged that the deeper the deep learning layers, the richer the high-level features that can be extracted, thereby enhancing model performance [56]. However, a network that is excessively deep may cause the gradient to either gradually vanish or explode during backpropagation across layers, thereby hindering the model’s ability to learn effectively. Therefore, the concept of residual learning was proposed to address this issue [57]. In this study, the residual block was adopted. This block comprises two mappings: the residual mapping and the identity mapping. It can be expressed as follows:
y = x + F x
F x = L a y e r N o r m W 1 · D r o p o u t S i L U L a y e r N o r m W 1 · x + b 1 , p + b 2
where x is the input feature map. F x is the residual function, representing the “residual” that the network needs to learn. F x is composed of a series of nonlinear transformations. W 1 , W 2 are the weight matrices of the linear layers. b 1 , b 2 are the bias terms. L a y e r N o r m is the layer normalization operation, used to stabilize training. S i L U is the Sigmoid Linear Unit activation function. D r o p o u t x , p is the regularization operation that randomly drops units to prevent overfitting. p denotes the regularization rate and is set to 0.1 in this study.
Residual connections enable the network to learn incremental changes in the input instead of directly learning complex transformations. This structure helps mitigate the vanishing gradient problem and facilitates the training of deeper networks. In this paper, the input linear layer has 312 dimensions and maps the 6 input features to a 312-dimensional space. The activation function layer: The SiLU function is employed to activate two residual blocks. Each residual block comprises two linear layers, each followed by a layer normalization operation. The features are mapped from 312 dimensions to 64 dimensions in the final linear layer.
To further focus on the prediction of urban rainfall-runoff pollution, the attention mechanisms are frequently employed to identify and weight relevant features [58]. The attention mechanism determines the importance level of different features by calculating attention scores, while the multi-head attention mechanism not only focuses on various historical time points in the time series but also attends to different heads. Compared with the single attention mechanism, it exhibits stronger comprehensive efficiency [59]. This mechanism maps the input to each head by randomly initializing the mapping matrix, enabling each head to focus on information from different positions within the input feature. As a result, the model is able to learn a variety of complex features. The corresponding formula is:
M u l t i H e a d Q , K , V = C o n c a t h e a d 1 , h e a d 2 , , h e a d h W 0
h e a d i = A t t e n t i o n Q i , K i , V i = s o f t m a x Q i K i d k V i
where h e a d i is the result of a single attention head, Q i , K i and V i are the query, key, and value matrices, respectively. d k is the dimensionality of the keys. In this paper, the number of heads h is 8.
Owing to the deep network architecture of the model in this study and the distinct characteristics of rainfall data across different time periods, conventional training strategies struggle to achieve ideal outcomes. In this study, a self-paced learning method was employed, where the samples in the training set were categorized into different difficulty levels through the design of a loss function [60]. Initially, the model prioritizes samples that are easier to predict and progressively incorporates more challenging samples as training progresses. The following expression can be used:
L o s s = i = 1 N v i y i y i 2 N
v i = 0   w h e n y i y i 2 N λ 1   w h e n y i y i 2 N < λ
λ = λ + K
where y i is the model’s predicted value, and y i is the ground truth value. v i is the weight assignment, where simple samples are assigned 1 and complex samples are assigned 0. N is the number of samples. λ is the threshold of the loss function, which is progressively increased by adding K per training epoch. In this study, the initial value of λ is 0.1, and K is 0.01.
The RLA input (Xt) includes instantaneous rainfall intensity, the duration of the dry period preceding the rain, and the SWMM simulation values (TN, TP, COD, SS). Xt is first extracted and transformed by the residual encoder, and the resulting encoded features are then input into the bidirectional LSTM to capture the temporal dependency. The output of the BiLSTM is enhanced to focus on key information through the multi-head attention mechanism.

2.3.3. Transfer Learning

Transfer Learning refers to the learning process where the similarity between data, tasks, or models is leveraged to apply a model learned in an old domain to a new domain [61]. Before applying transfer learning, the dataset needs to be divided into a source domain and a target domain. In this study, based on the clustering results of functional areas in the Yangtze River Basin, functional areas with sufficient data (the number of rainfall monitoring data in each event ≥ 4) within the same class were designated as the source domain, while the remaining regions were assigned as the target domain.
This study adopts a model-based fine-tuning strategy for transfer learning. The RLA model pre-trained on the source domain (detailed in Section 2.3.2) provided the initial weights for the target-domain model, expressed as:
θ 0 = θ s o u r c e
where θ denotes the comprehensive set of learnable parameters within the RLA network architecture. This parameter set encompasses the input encoder (comprising a linear projection layer and two subsequent residual blocks), the stacked bidirectional LSTM, the multi-head self-attention module, the temporal-compression fully connected layer, and the final output regression layer. During the fine-tuning phase on the target-domain training set, the physical parameters of the SWMM component were strictly frozen, ensuring that only the parameters within the deep-learning backend underwent joint optimization.
The robust feature representations acquired from the source domain were preserved via three implicit regularization mechanisms: (i) initialization with near-optimal source-domain weights, (ii) execution over a shortened training horizon, and (iii) application of a self-paced adaptive loss-threshold weighting scheme inherited from the source-domain training phase, which actively filters out high-error batches during the initial fine-tuning iterations. The parameter update rule is defined as:
θ t + 1 = θ t η θ L t
where the learning rate is set to η = 5 × 10⁻⁵, consistent with the rate utilized during the initial source-domain pre-training. To maintain methodological consistency and stabilize optimization across both training phases, the identical objective was employed for both source-domain pre-training and target-domain fine-tuning.
The fine-tuning procedure was executed over 50 epochs on the target-domain training set, utilizing a batch size of 312, with optimization driven by the Adam algorithm at a learning rate of η = 5 × 10⁻⁵. In contrast to the initial source-domain training, which required 120 epochs with a batch size of 256, the fine-tuning phase necessitated fewer than half the total epochs. This intentionally abbreviated training horizon constrains the cumulative parameter drift, restricting deviation from the original θ s o u r c e . Model evaluation was conducted on the target-domain test set at defined step intervals, and the model checkpoint yielding the lowest test-set MSE was preserved as the definitive fine-tuned model. Hyperparameters, including the window length, feature dimensions, and LSTM structural configurations (depth and width), were strictly aligned with those established in Section 2.3.2.

3. Results and Discussion

This section may be divided by subheadings. It should provide a concise and precise description of the experimental results, their interpretation, and the experimental conclusions that can be drawn.

3.1. Clustering Results and Analysis of Functional Areas in the Yangtze River Basin

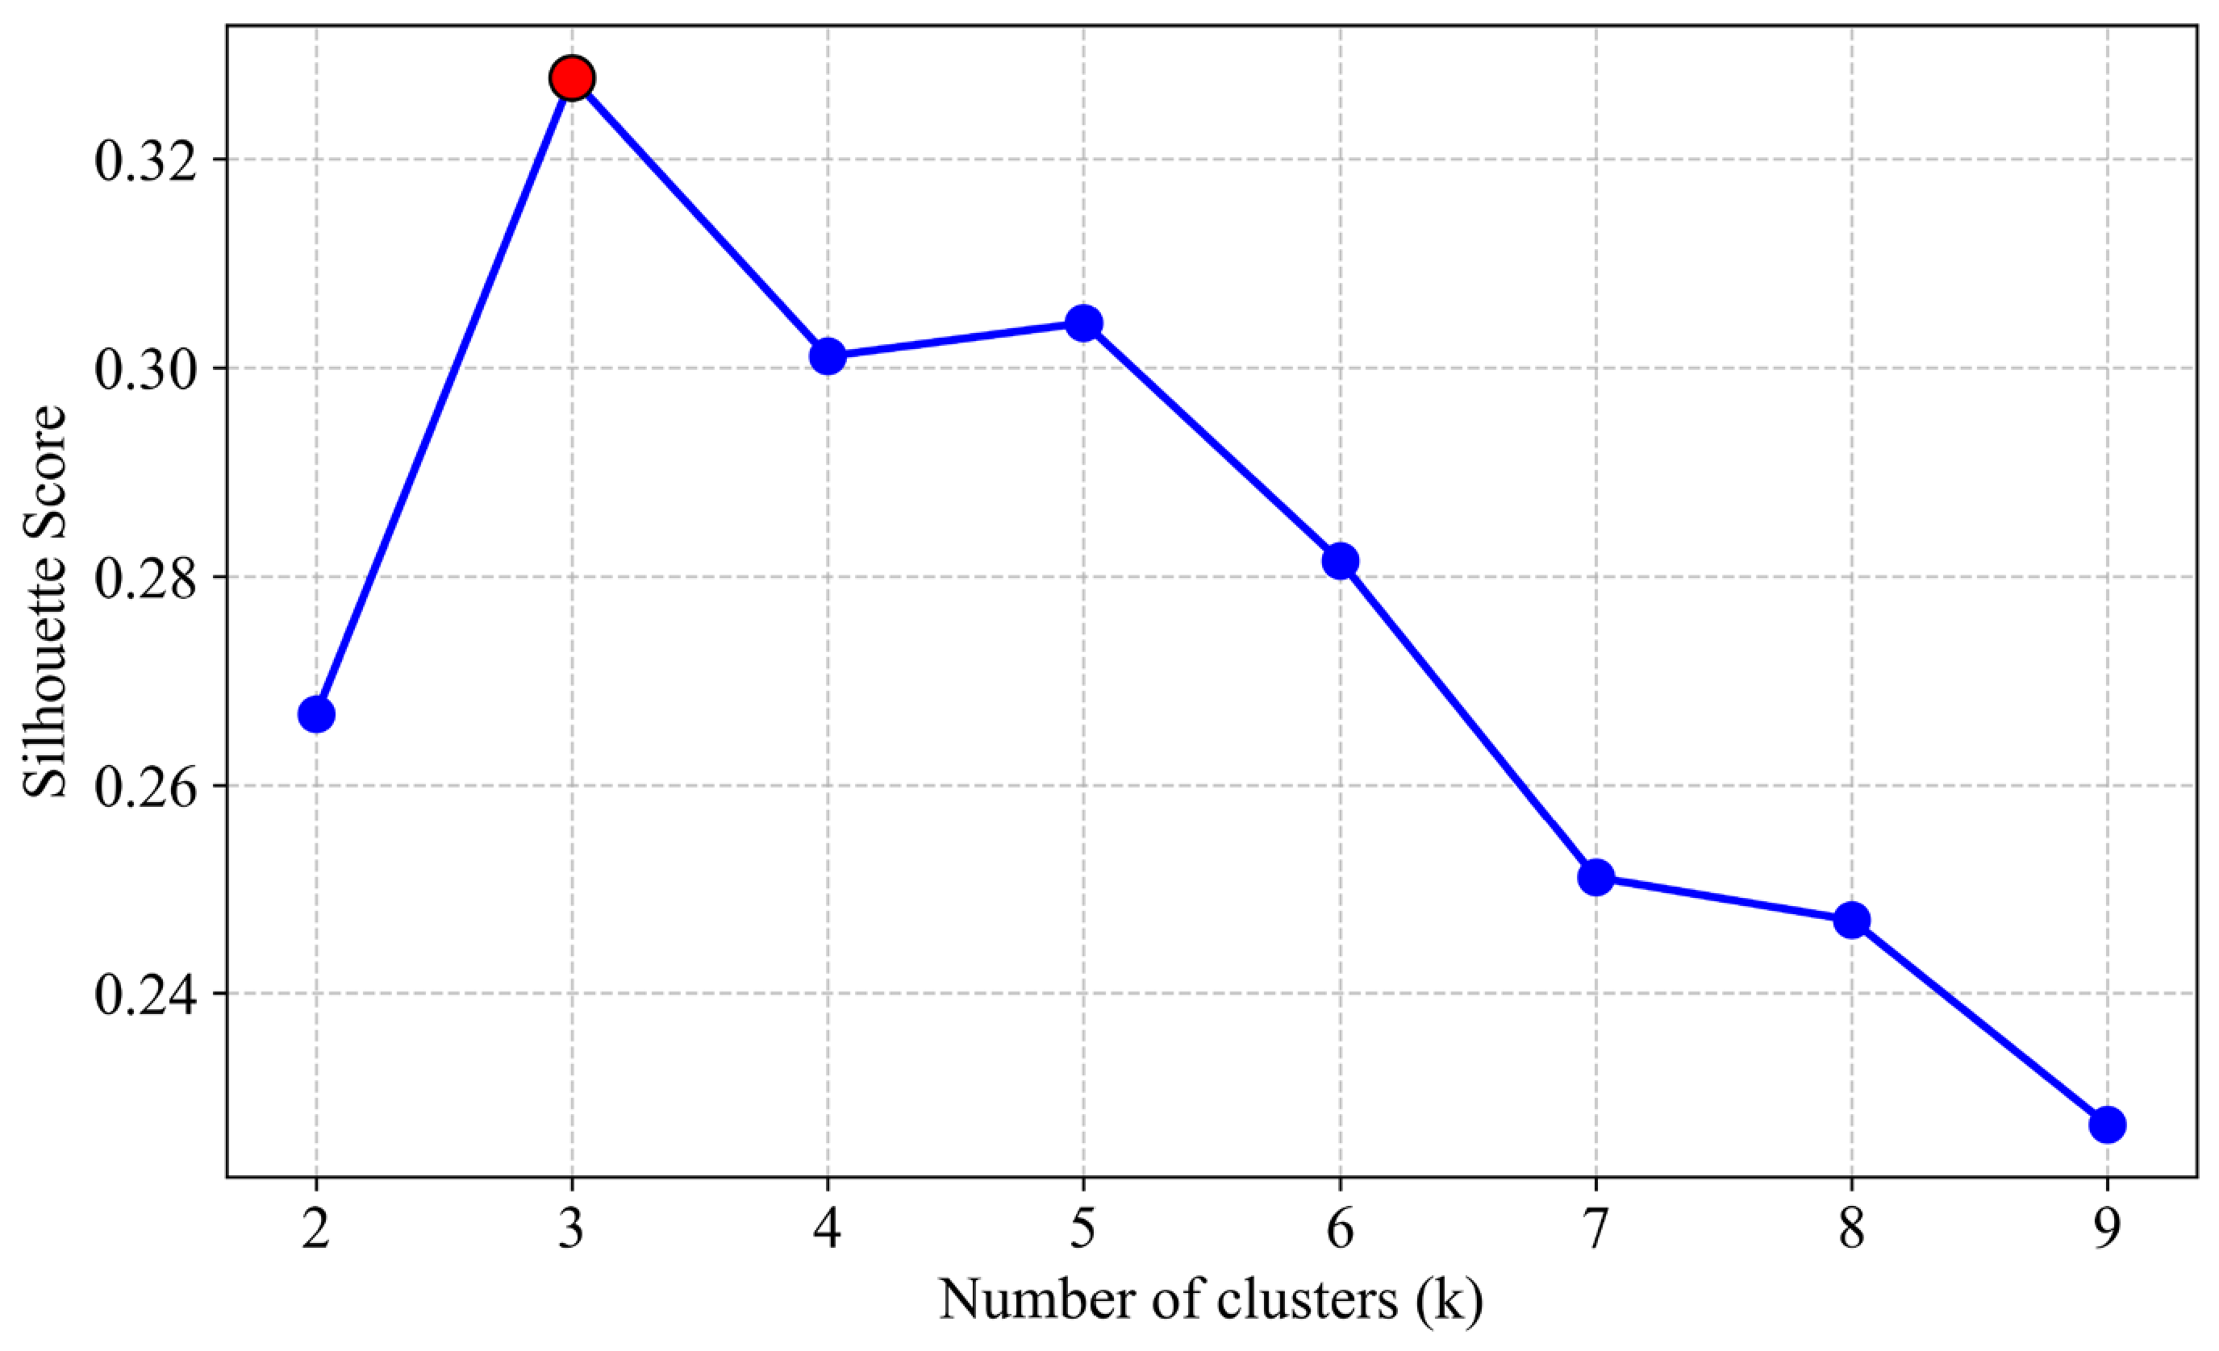
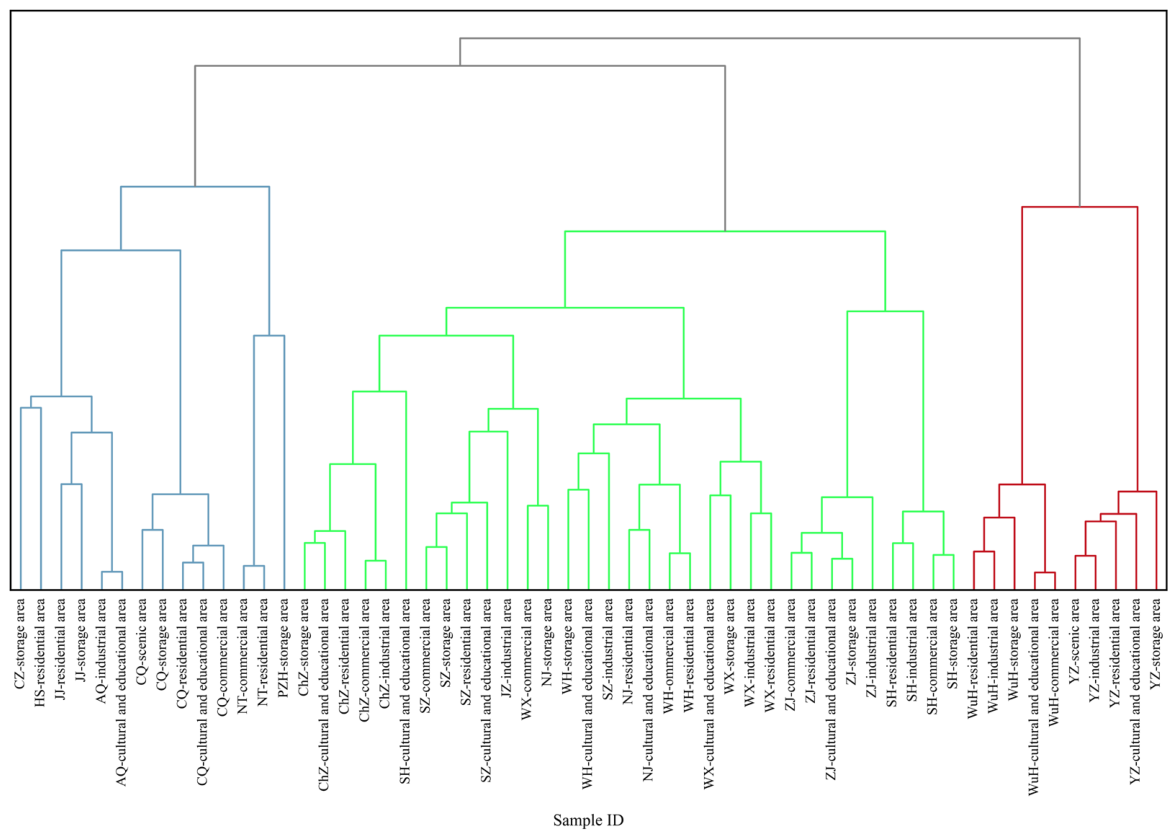
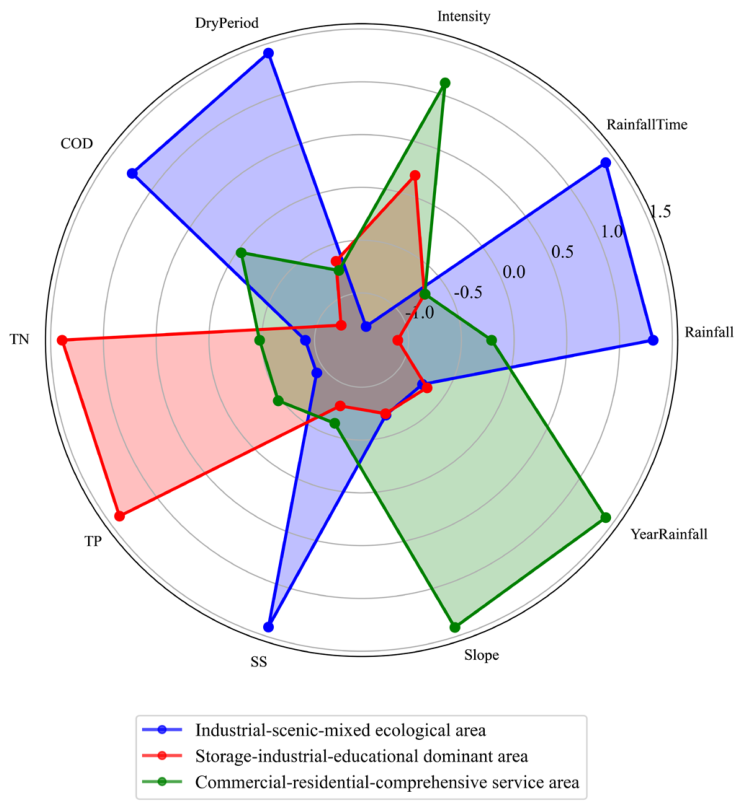
Building on established knowledge of the key drivers influencing urban rainfall-runoff pollution (Section 2.2), a comprehensive 16-dimensional feature space was developed to capture rainfall characteristics, pollution signatures, and socio-environmental factors. These features directly reflect the underlying hydrological and pollutant generation mechanisms, ensuring that the resulting clusters are not merely statistically similar but physically meaningful. Based on 16-dimensional feature vectors incorporating land use types and runoff pollution characteristics, hierarchical clustering categorized typical urban functional areas within the Yangtze River Basin into three distinct groups sharing common pollution mechanisms. The specific classification is presented in Figure 2, where the first type represents traffic-industry-education oriented functional areas, and the second type corresponds to commercial-residence-comprehensive service functional areas. The third category comprises industrial-recreation-mixed ecological functional areas. Based on the clustering results, a shared physical parameter library (Table A4) for these functional areas was established. To quantitatively justify the selection of three clusters, we performed a silhouette coefficient analysis for k values ranging from 2 to 9 (Figure A3). The silhouette score measures how similar an object is to its own cluster compared to other clusters, with higher values indicating better-defined clusters. The results show that k = 3 yields the highest silhouette score.
As shown in Figure A4, the storage-industrial-education dominant areas exhibited characteristics of large rainfall amounts, long rainfall durations, extended intervals between rainfalls, prolonged dry periods prior to rain, as well as long-duration and high-intensity rainfall events. Combined with the dominant characteristics of this cluster, the pollution concentration was closely associated with traffic volume and industrial activities, exhibiting high concentrations of COD, TN, and SS. The second type was the commercial-residential-integrated service area. Its rainfall events were relatively small in amount but large in intensity, with a short dry period before rain. Overall, the rainfall events in this cluster exhibited characteristics of a short pre-rain dry period and medium-to-high intensity rainfall. The third cluster was the industrial-scenic-mixed ecological area, which demonstrated relatively large rainfall events, a short interval between consecutive rainfall events, and a high average rainfall intensity. Overall, this cluster showed characteristics of a short pre-rain dry period and high-intensity rainfall. Critically, this approach explicitly grouped regions according to their shared physical drivers of runoff pollution. Thereby, it identified underlying similarities in hydrological response and contaminant generation across areas within each group, providing a solid basis for parameter sharing. This grouping into homogeneous clusters allowed the development of representative shared physical parameter libraries (Table A4), overcoming the high data demands of traditional basin-scale modeling. Notably, our clustering units, urban functional areas, are consistent with those identified by X. Wang et al. [62]. This deliberate selection prioritized categorizations that meet practical model application requirements, thereby serving basin-scale runoff pollution prediction.

3.2. Prediction Performance of the Hybrid Model

To evaluate the predictive capability and data efficiency of the proposed framework, this study employs the R2 to quantify model performance. Given that LSTM has demonstrated remarkable effectiveness in simulating sequential data and is widely applied in runoff pollution prediction, they were selected as the benchmark model to provide a comparative reference for capturing complex temporal dynamics.
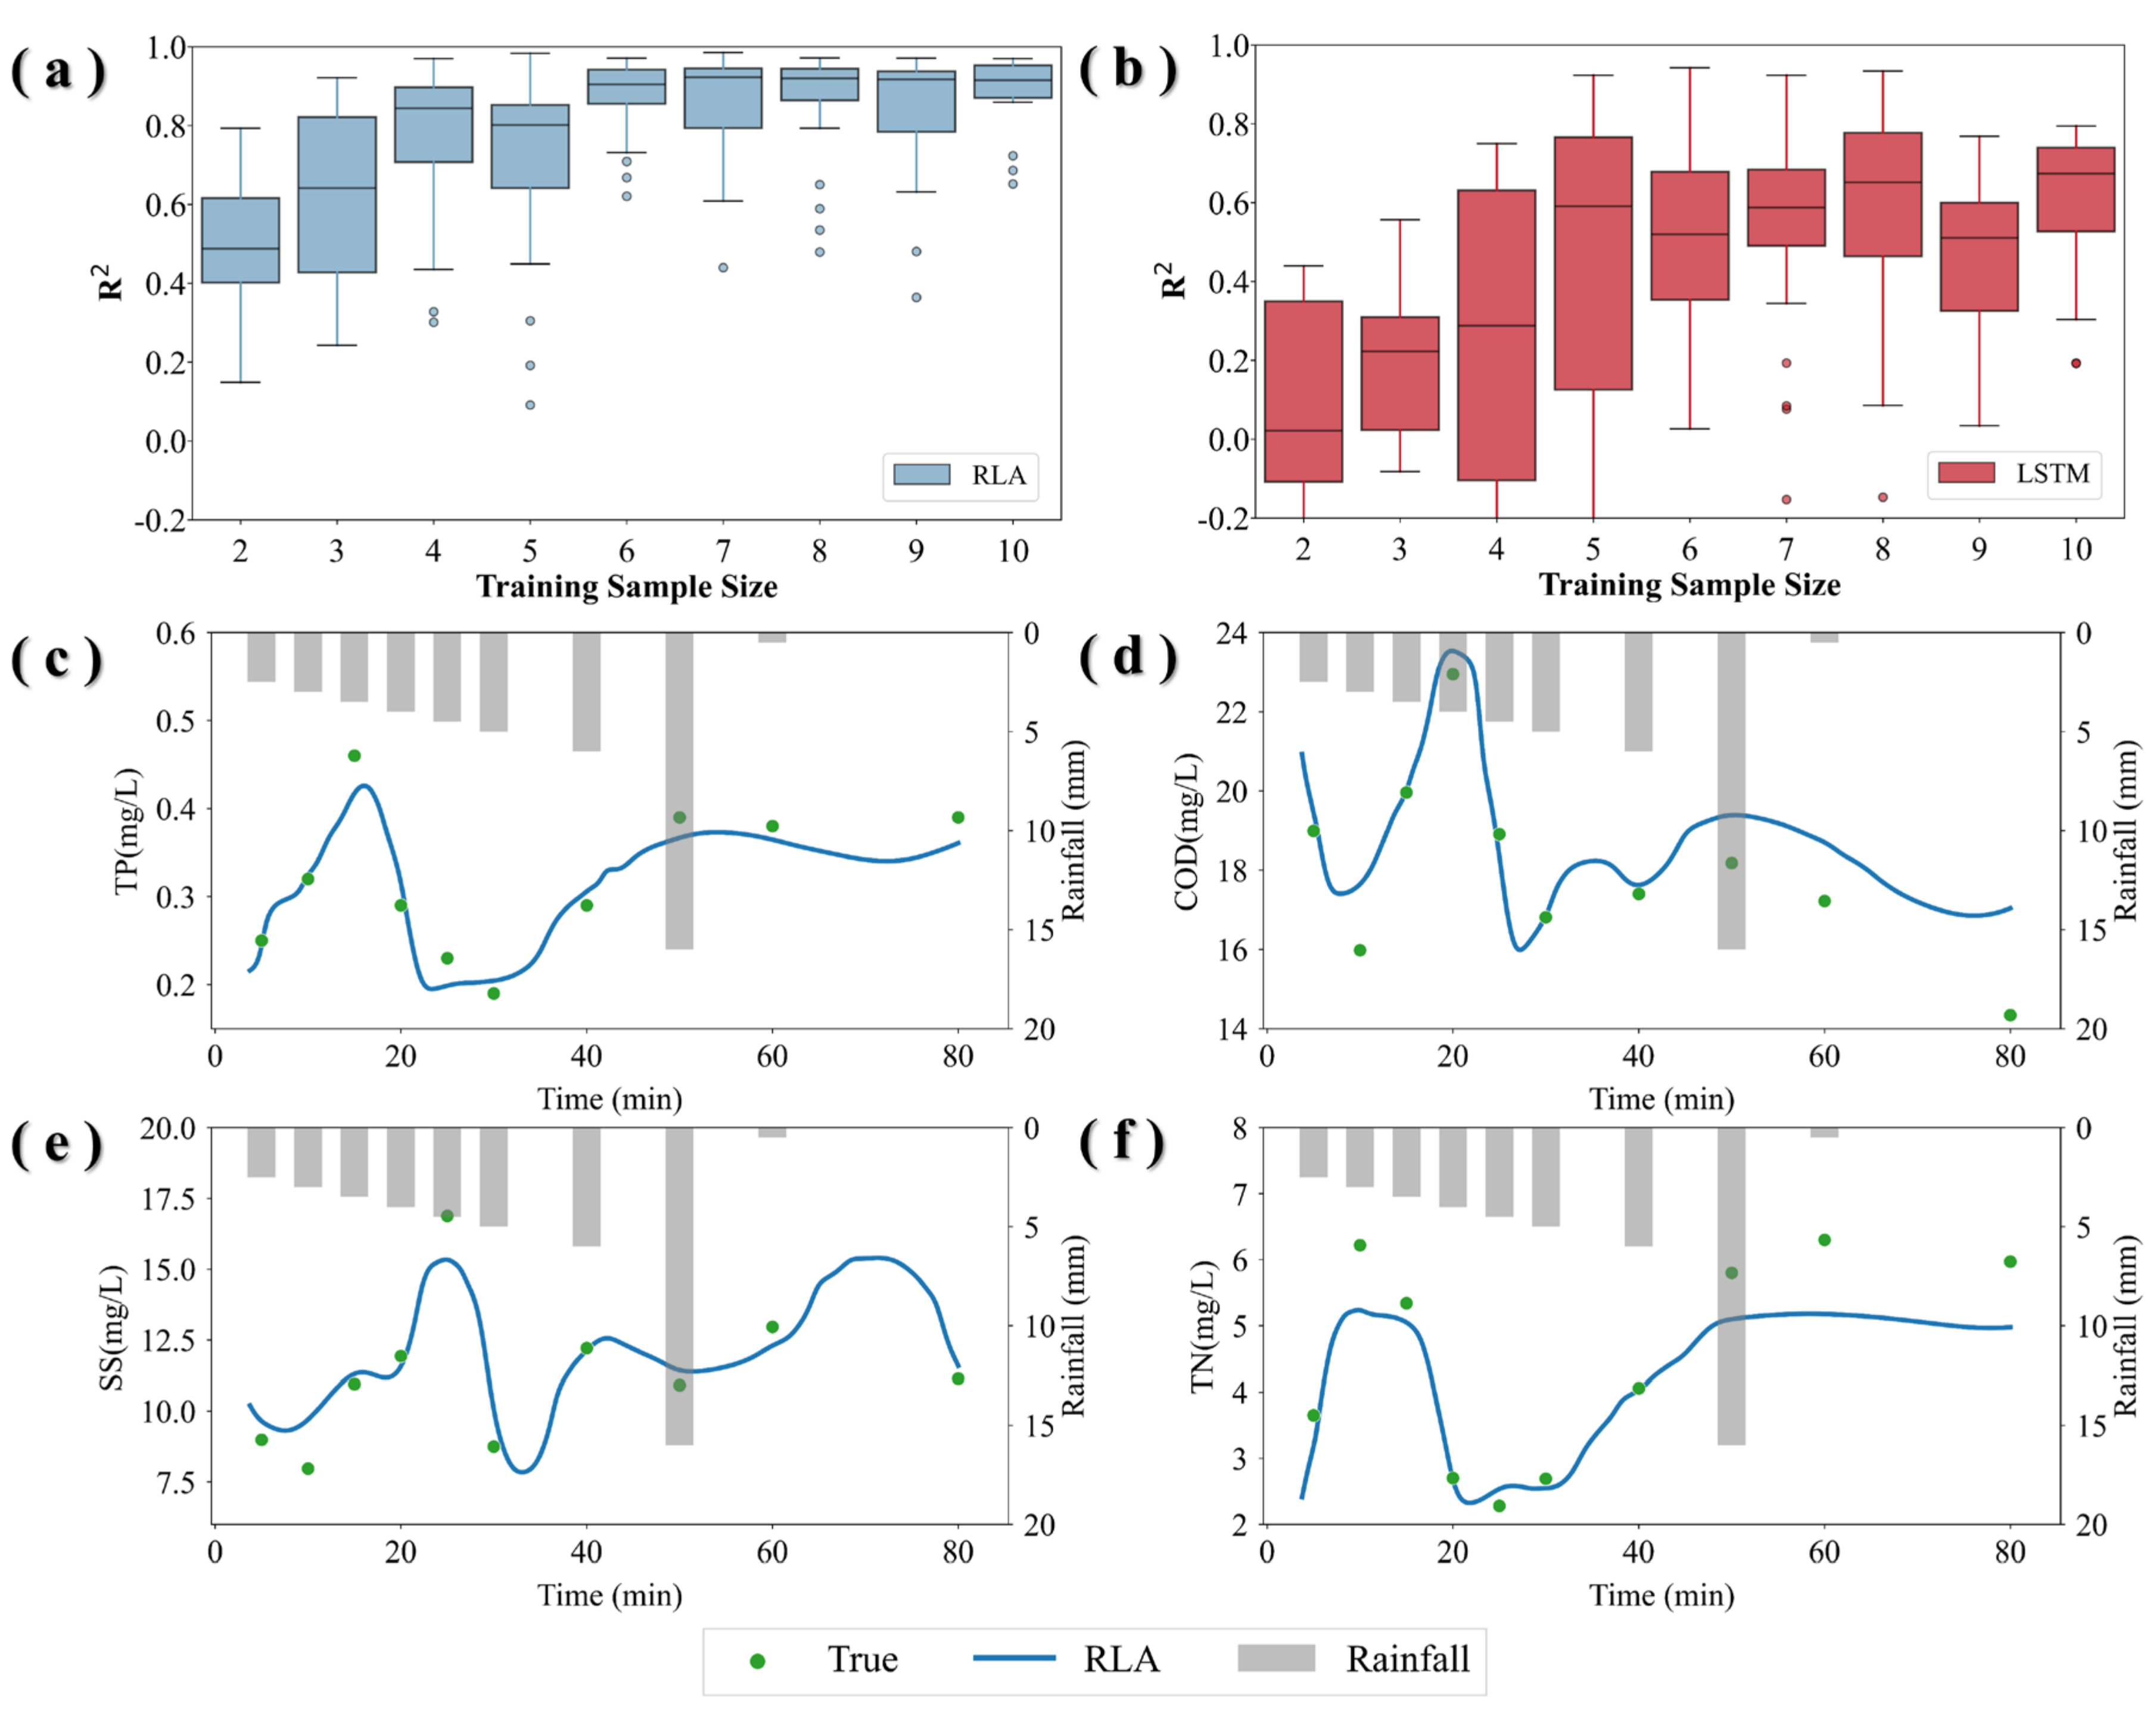
Firstly, according to the accuracy evaluation under different data volumes (Figure 3a), the model maintained a low prediction error (R2 > 0.5) even in data-scarce scenarios (≤3 events), demonstrating its robustness in handling small-sample data. In data-sufficient regions (>3 events), the model performance was further improved and stabilized (R2 > 0.82), indicating its high data utilization efficiency. By integrating residual connections, bidirectional temporal processing, and multi-head attention mechanisms, RLA adaptively optimized initial predictions based on physical processes, thereby significantly mitigating the impact of SWMM parameter uncertainty on the final results.
Second, four rainfall-runoff pollution event datasets were selected to predict individual rainfall events, further validating the model’s time-series predictive capability (Figure 3c–f). In the prediction of TP, the RLA model exhibited a high degree of alignment with the observed values throughout the entire period, particularly during the critical concentration peak phase from 20 to 60 min after rainfall. For COD prediction, the RLA model accurately captured the rising concentration trend from the early stage of rainfall, demonstrating its strong capability to model nonlinear and transient pollution dynamics, which provides direct evidence for the effectiveness of its physics-based error correction mechanism.
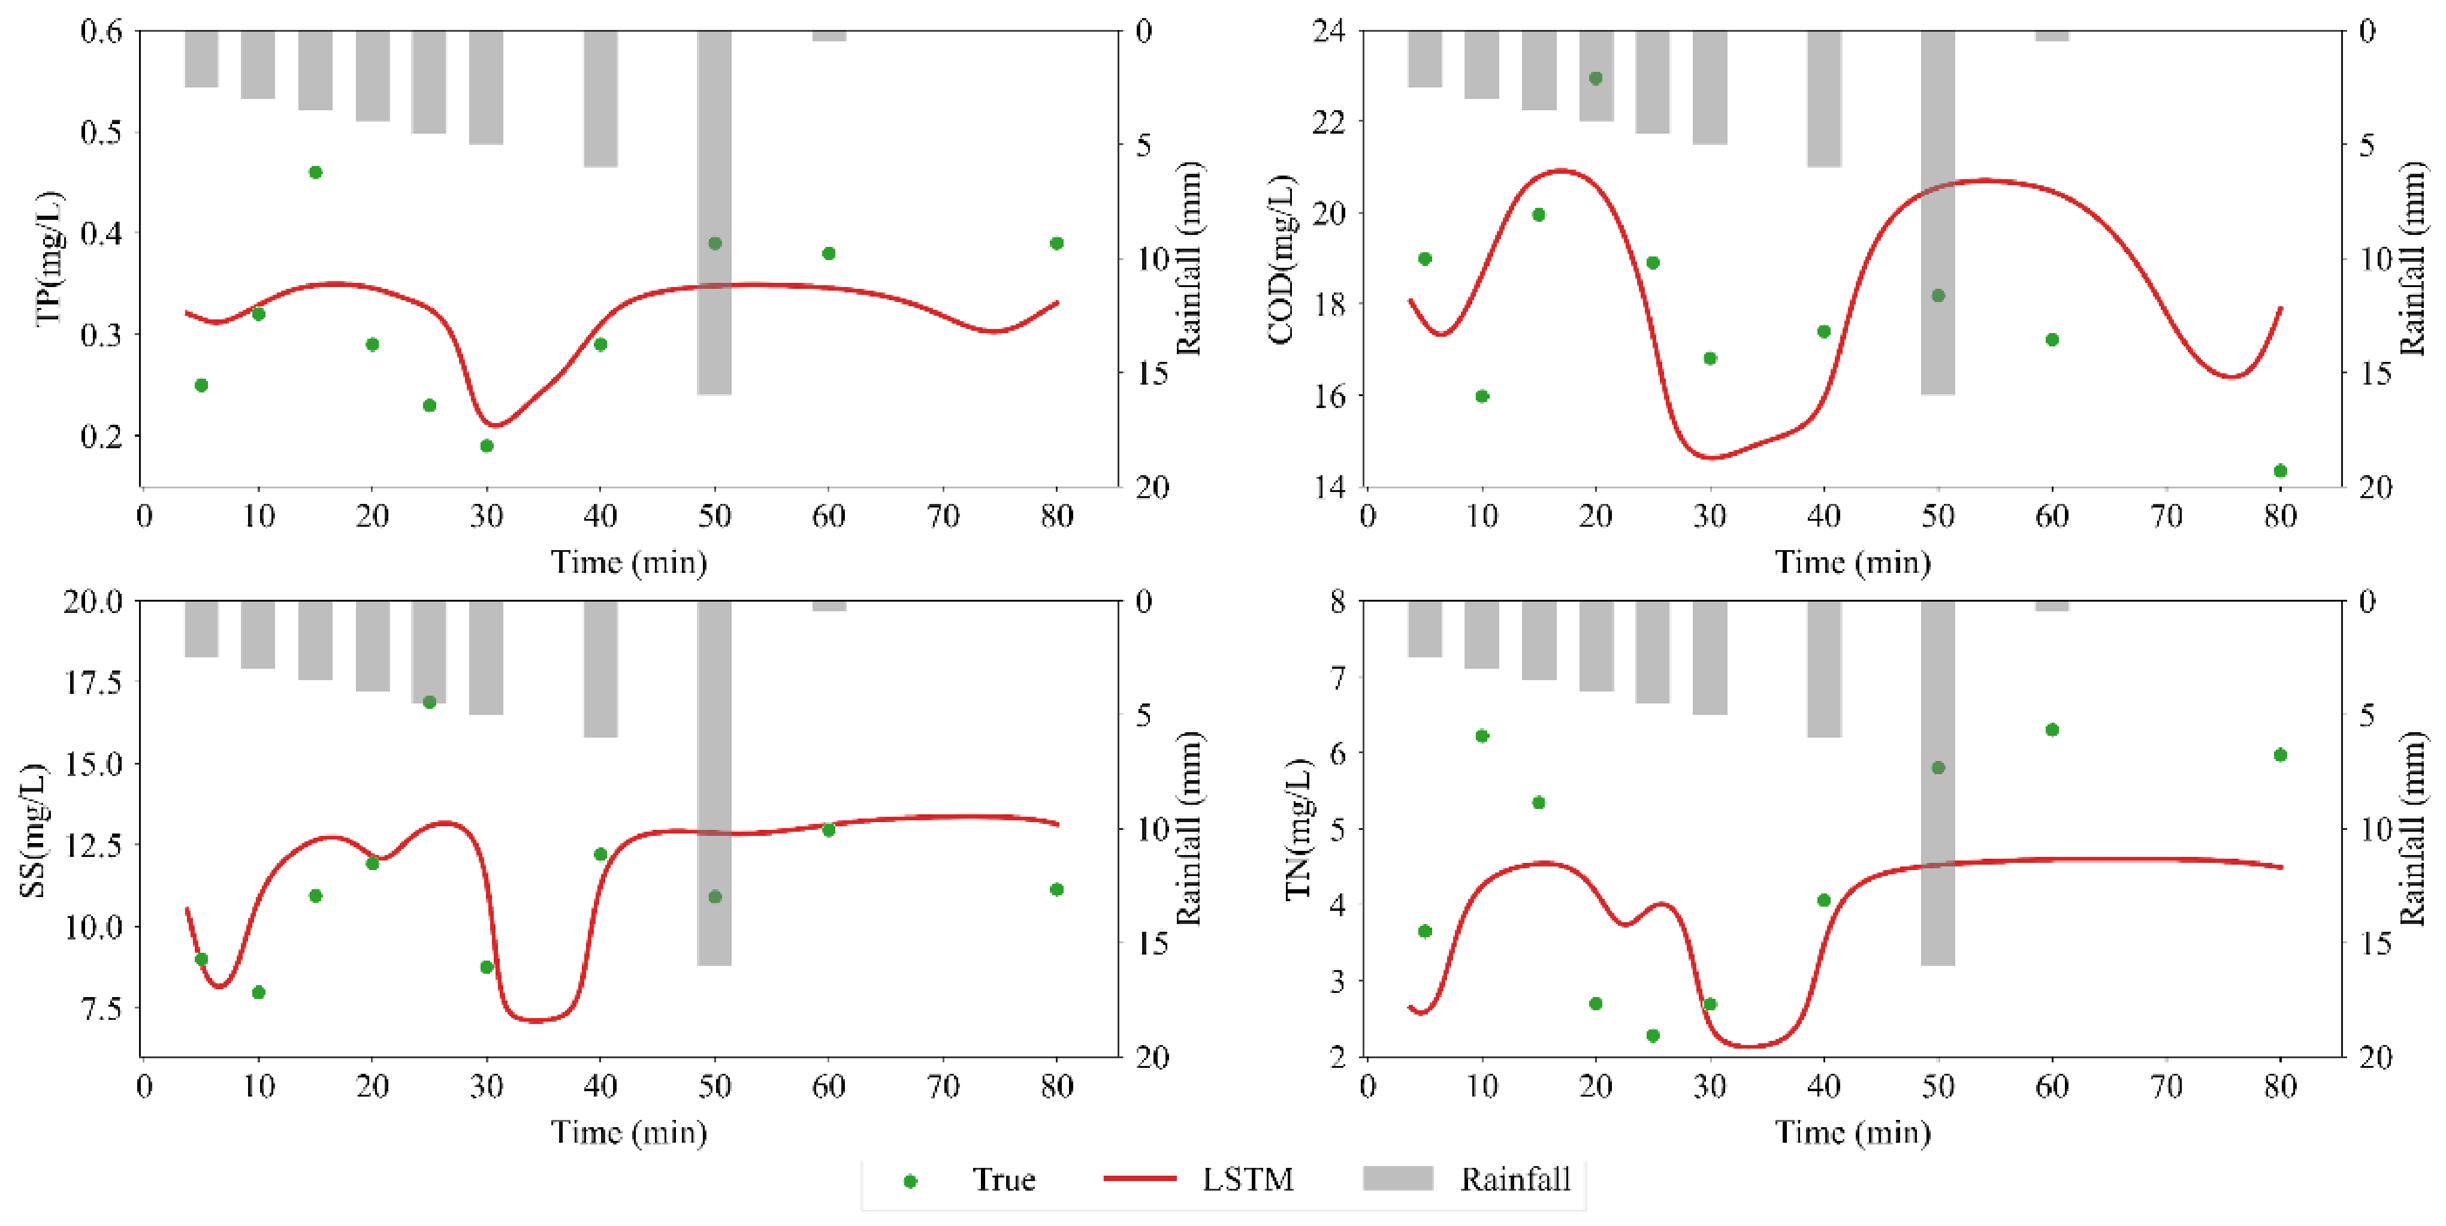
As shown in Figure 3b, when training data are limited (≤3 events), the prediction accuracy of LSTM decreased significantly (R2 ≈ 0.17). Although the accuracy of LSTM improved with increasing data volume (>3 events) (R2 ≈ 0.39), its performance remained consistently inferior to that of RLA. The comparison of time trajectories in Figure A5 further confirmed that LSTM is prone to prediction deviations during the initial stage of rainfall or during fluctuation phases, whereas RLA demonstrates higher accuracy and stability. These results align with the findings of Chen et al. [15] and Xu et al. [63], who also showed that integrating physics-based models with data-driven approaches substantially improves prediction accuracy, particularly when physical simulation outputs are used as input features. The present study further extends this advantage through the innovative RLA architecture, especially in the most challenging small-data scenarios.

3.3. Analysis of Hybrid Model Component Contributions

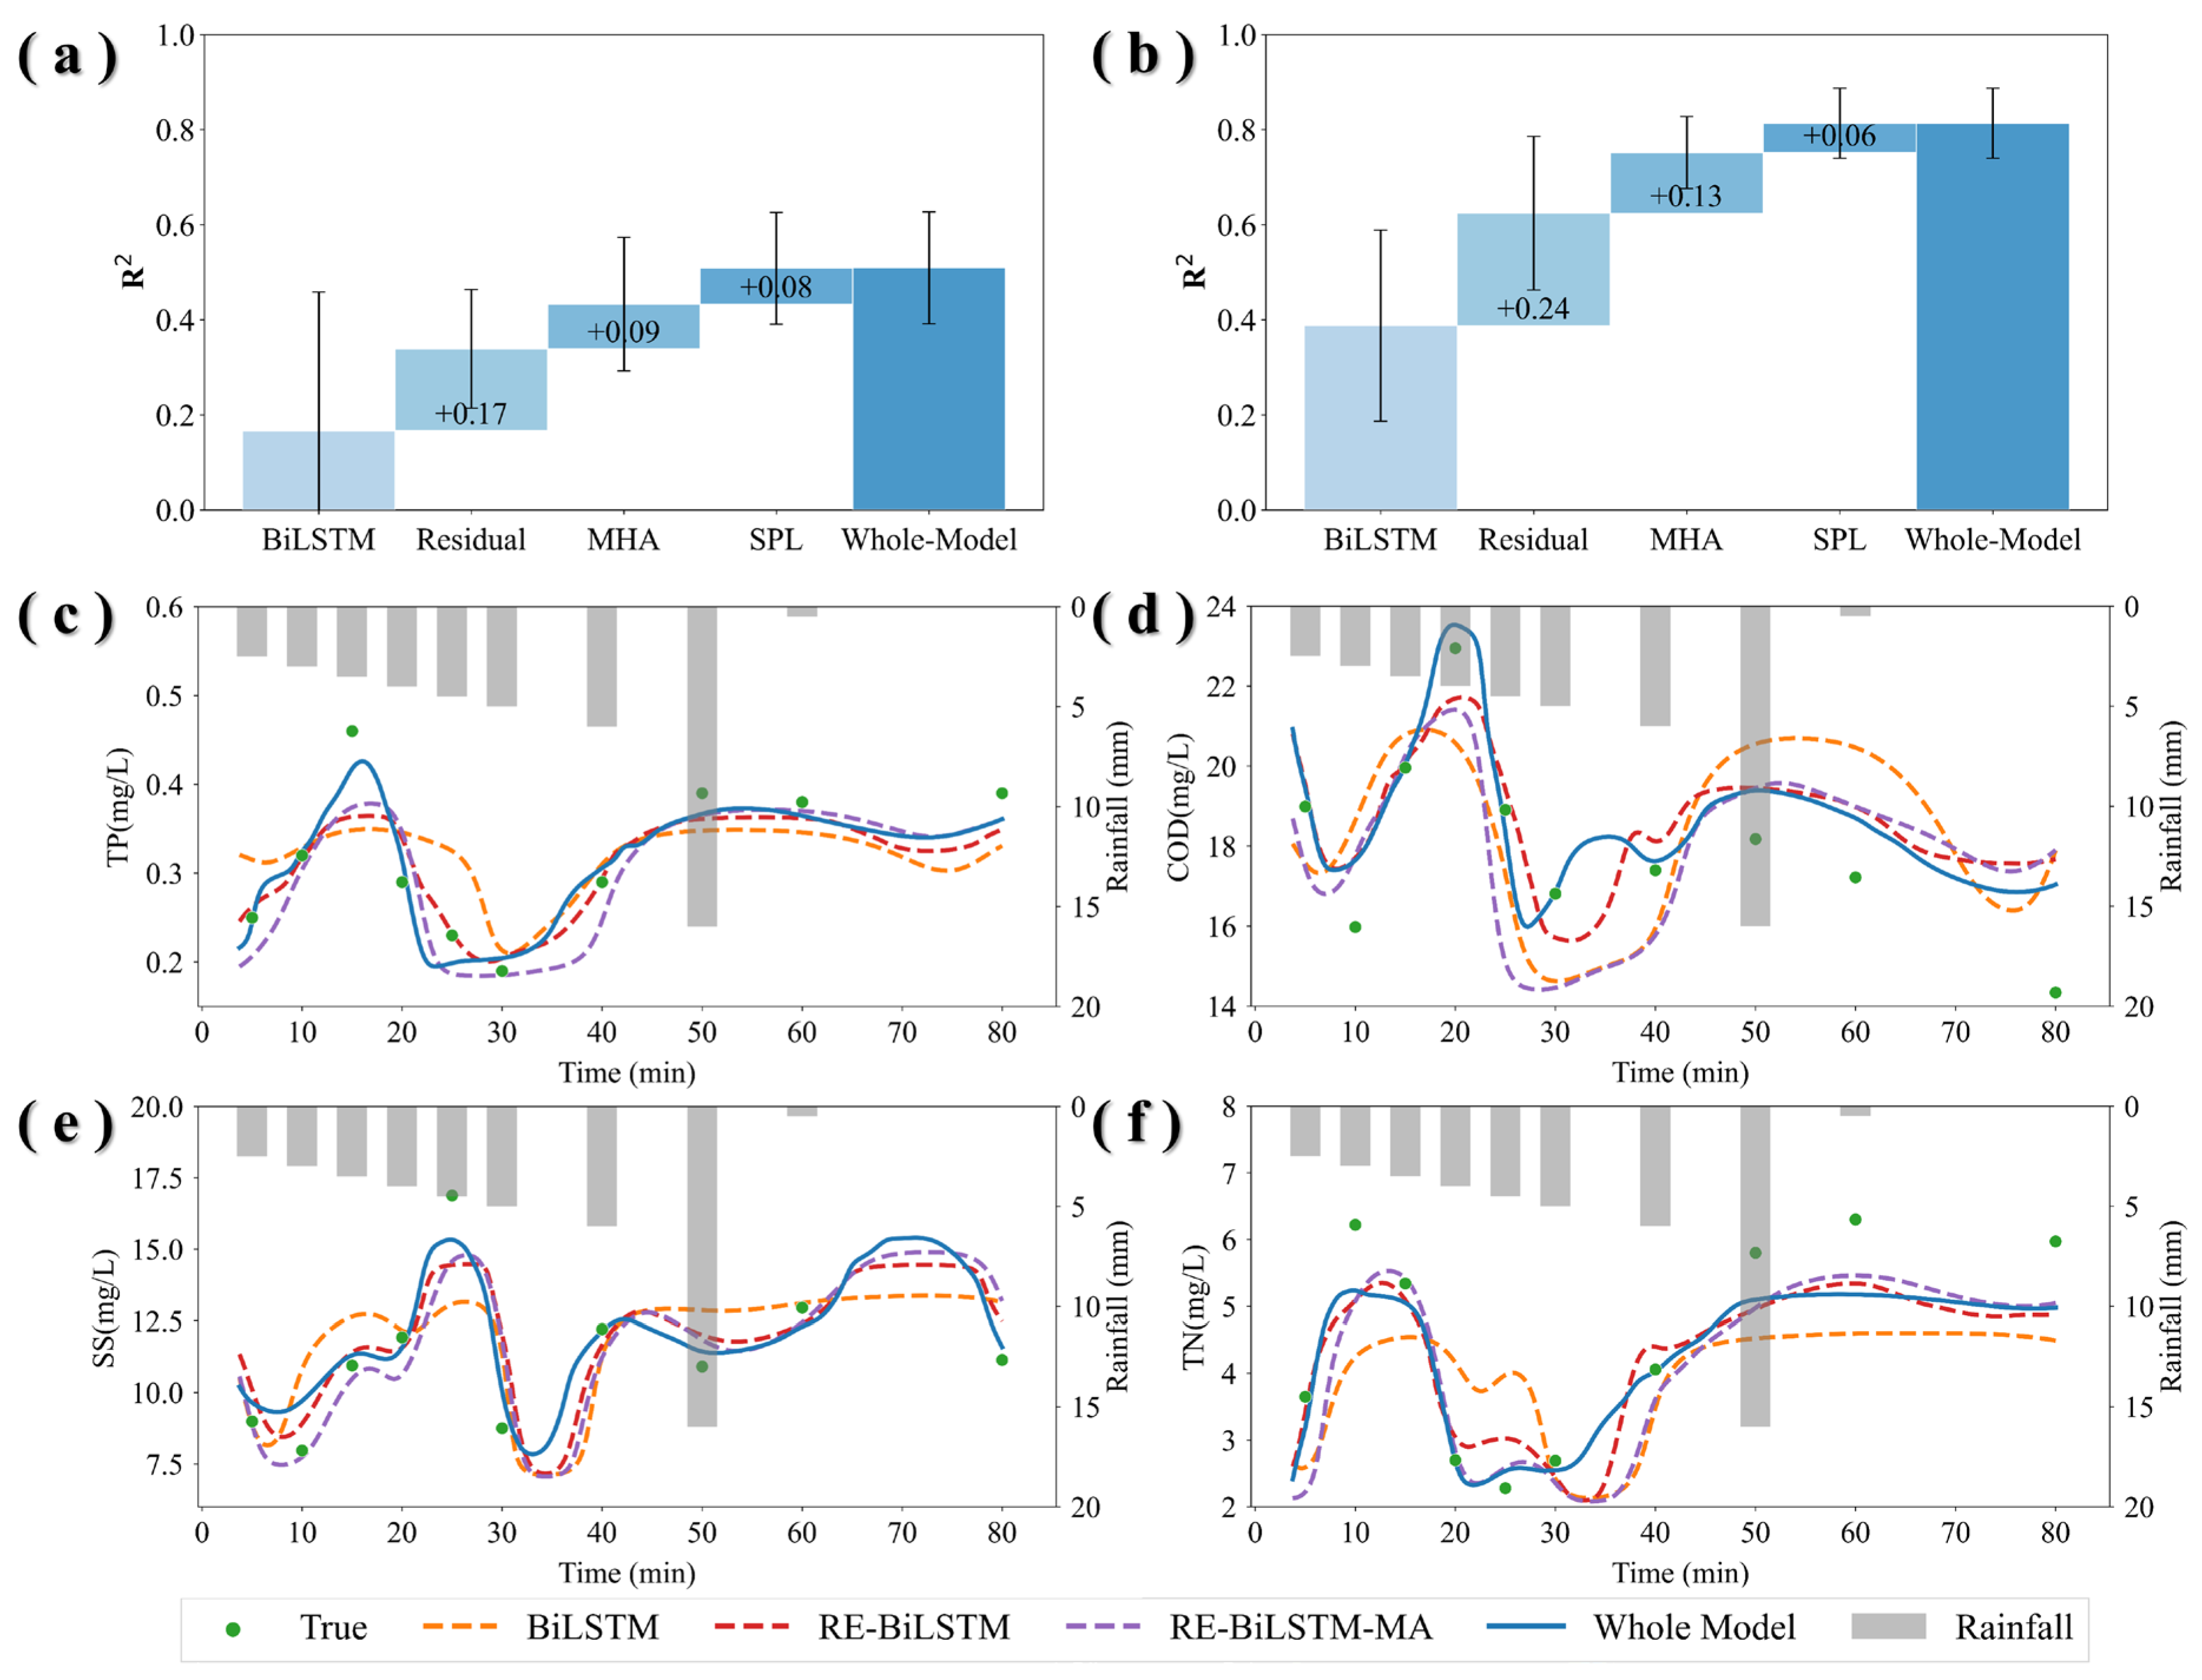
To validate the contribution of each component while mitigating the risk of single-event overfitting, we performed ablation experiments on the complete test dataset consisting of 10 rainfall events (Figure 4a,b). As illustrated in this figure, the mean R2 value of the BiLSTM model was as low as 0.167 in the small-data scenario and improved only marginally to 0.3877 in the large-data scenario. This suggests that traditional recurrent neural networks have difficulty capturing the highly nonlinear features of rain-runoff pollution. After the introduction of residual connections, the performance of the model exhibited a breakthrough improvement: the average R2 value in the small-data scenario increased to 0.339, while that in the large-data scenario reached 0.624. The residual structure effectively alleviated the vanishing gradient problem in deep LSTM networks. After incorporating the multi-head attention mechanism, the model achieved R2 increments of 0.09 and 0.13 in the small-data and large-data zones, respectively. This dynamic feature focusing mechanism successfully decoupled the timing deviation between SWMM simulation outputs and the corresponding measured data. In addition, the significant performance improvement in the small-data scenario revealed the critical role of the attention mechanism in enhancing information via feature importance recalibration when data are scarce. After integrating the self-paced learning component, the model achieved optimal performance, demonstrating its critical role in dynamically adjusting learning priorities and optimizing overall simulation performance. The prediction examples from different component models further illustrate this improvement. Specifically, the RLA model demonstrates a clear ability to capture the complex rainfall-runoff pollution process (Figure 4c–f).
These ablation results collectively confirm that the complexity of the RLA model is justified. It can be concluded from the above results that the residual connection and feature selection mechanism effectively compensate for the lack of data information density and prevent the model from falling into a local optimum. That is, under realistic conditions with limited monitoring data, more efficient knowledge mining can be achieved through architectural innovation rather than by merely increasing the parameter scale. This model introduces a novel technical paradigm for environmental temporal modeling, serving as a collaborative framework that ensures gradient propagation via the residual structure, decouples features through the attention mechanism, and optimizes the training trajectory using self-paced learning. Furthermore, our ablation results are consistent with the well-established consensus in machine learning that model architecture design and training strategies have a decisive impact on final performance [64,65,66]. We systematically integrated these advanced techniques, residual learning, multi-head attention, and self-paced learning, into an urban hydro-environmental prediction framework, revealing their strong synergistic effects. Crucially, this work represents the first systematic quantification of the individual and joint contributions of these three pivotal components specifically for urban runoff pollution forecasting. This quantification offers clear architectural and training guidelines for constructing efficient and robust physics-informed data-driven models in this domain.

3.4. Pollution Prediction at the Basin Scale After Transfer Learning

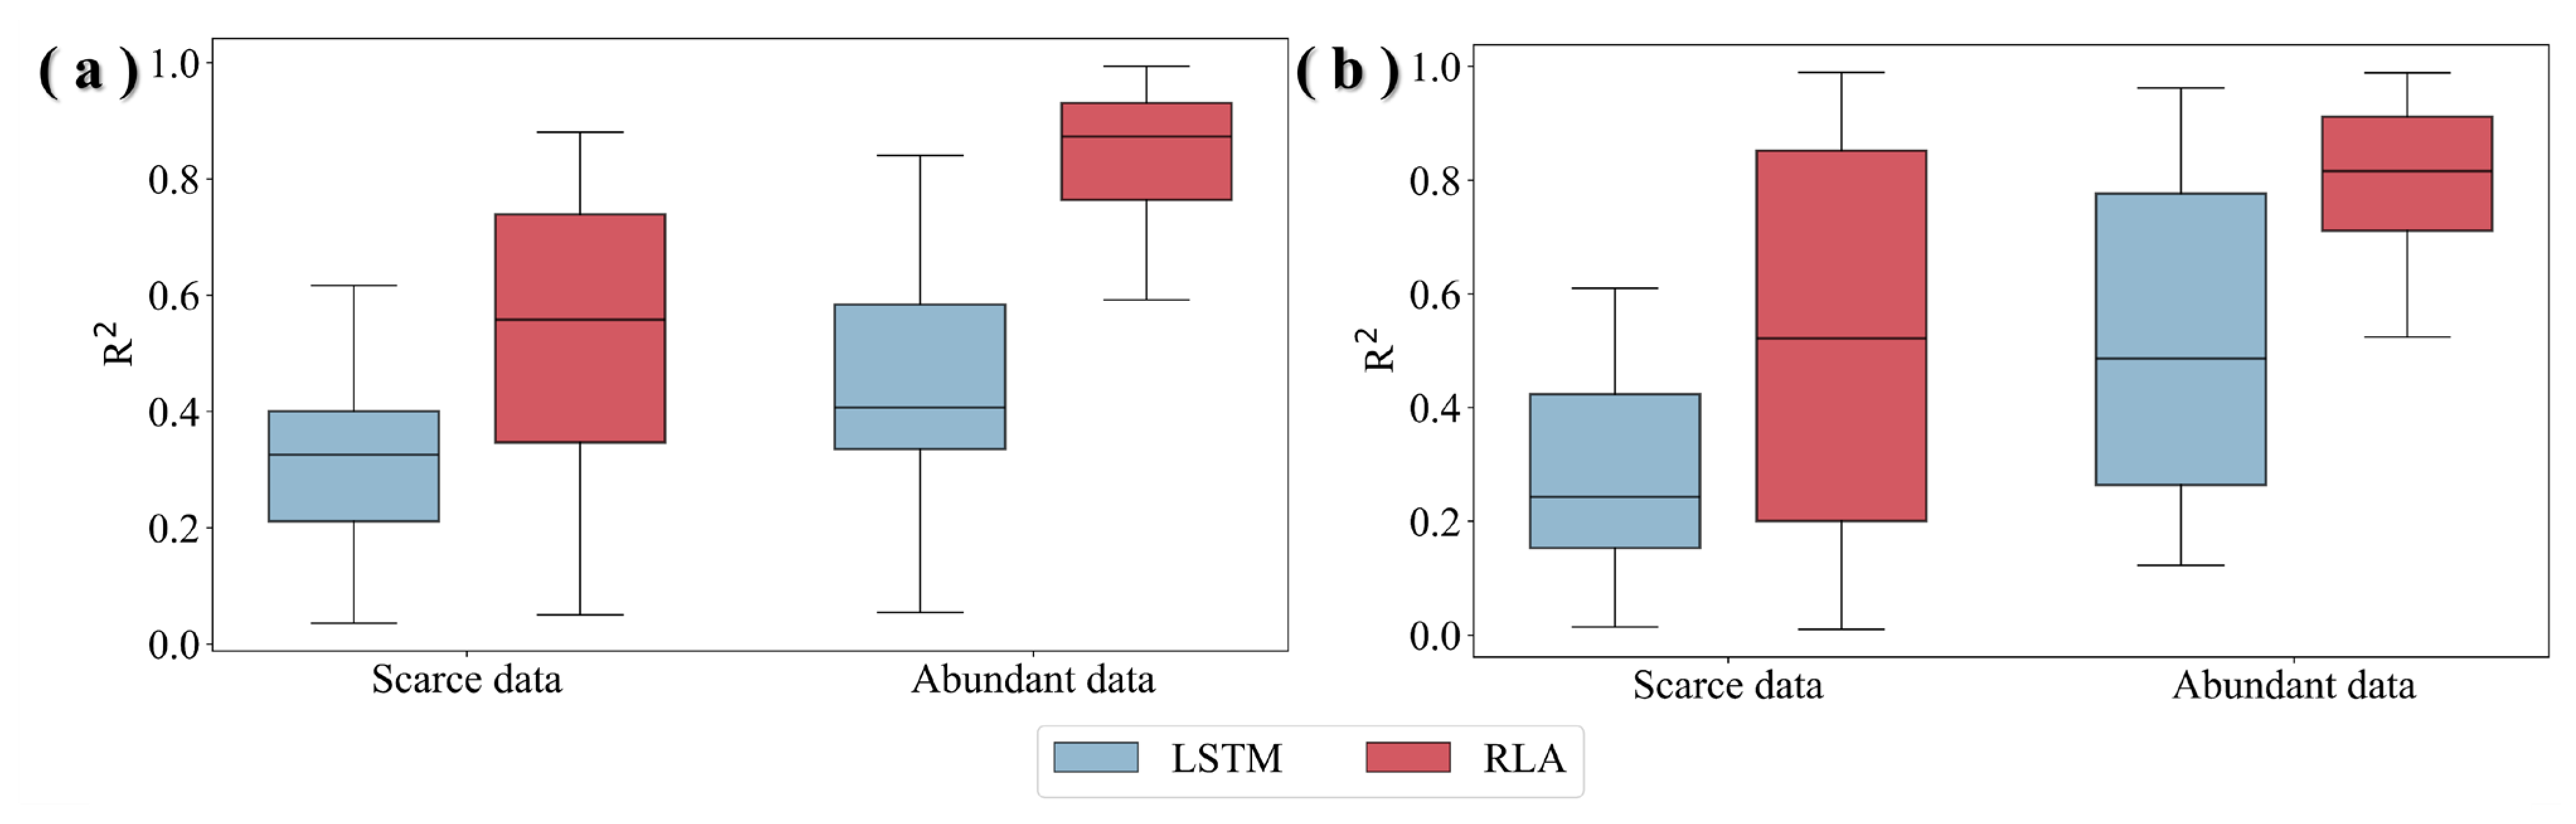
To further demonstrate the performance advantages of the proposed framework at the basin scale and under varying data availability conditions, this study implemented the cluster-based transfer learning strategy as outlined in Section 2.3.3. The prediction performance of the LSTM and RLA models in target functional areas within the Yangtze River Basin was then quantitatively analyzed, specifically categorized by the number of monitored rainfall-runoff pollution events in the target domain. The results (Figure 5) show that in the Yangtze River Basin, when sufficient data exists in the target functional area (>3 events), the RLA model achieves a significantly higher R2 value compared to the LSTM model. Meanwhile, the results also indicate that the fine-tuning strategy has higher prediction accuracy than the freezing strategy and is a better transfer learning strategy. Cluster-based transfer learning enabled the RLA model to maintain robust performance even in target zones with very limited monitored events (≤3 events), demonstrating its effectiveness under data scarcity. This result validates the critical role of the transfer learning framework in overcoming the data barrier [67]. By leveraging knowledge transfer from shared pollution mechanisms, data-driven models can effectively preserve prediction performance in areas with limited monitoring data.
The robust predictive performance maintained after cluster-based transfer learning (R2 > 0.5 with ≤3 events) demonstrates the framework’s effectiveness across data-scarce functional areas within the Yangtze River Basin. This validates the core premise that organizing knowledge transfer around areas with similar pollution mechanisms enables basin-scale prediction. While this study rigorously validated the framework at the functional-area scale, the approach provides a foundation for larger-scale assessment. Future work incorporating finer-resolution spatial data can further enhance the precision of basin-wide pollution pattern analysis.

3.5. Critical Discussion on Model Limitations and Assumptions

Despite the promising performance of the proposed framework, several limitations need to be acknowledged. First, the hybrid RLA model, while accurate, has high structural complexity, which imposes computational demands. More importantly, its current design predicts time-series pollutant concentrations at the outlet but does not yet provide spatially distributed pollution loads across sub-catchments, limiting its utility for spatially explicit management. Second, the cluster-based transfer learning strategy assumes that the hydrological and pollution mechanisms of the target domain remain similar to those of the source domain. This assumption may weaken under rapidly evolving urban forms or extreme climate events that alter the original pollution generation regime. Therefore, the framework is most robust when applied within the same cluster and under climate and land-use conditions comparable to those represented in the training data. Explicitly recognizing these boundary conditions is essential for avoiding overgeneralization.

4. Conclusions

The “functional area clustering-coupled model-transfer learning” framework developed in this study clusters the functional areas of the Yangtze River Basin into three pollution mechanism common groups using 16-dimensional feature vectors. The established physical model parameter library reduces the cost of cross-regional parameter calibration. In data-sufficient regions, the prediction R2 of the coupled model reaches 0.82, while in data-scarce regions, transfer learning maintains the R-squared above 0.5, significantly enhancing the prediction accuracy and generalization ability of the basin-scale pollution load model.
This accounting system offers a technical paradigm for the precise prevention and control of non-point source pollution in the Yangtze River Basin and represents a feasible pathway for upscaling water environment modeling from individual cities to basin-wide applications. This approach may offer insights for pollution control in other complex watersheds globally.
While this study demonstrates the effectiveness of the proposed framework in the Yangtze River Basin, future work should extend its validation to other major river basins under diverse climatic and land-use conditions. Further efforts will also focus on quantifying uncertainty propagation from the SWMM parameters, the RLA model, and the clustering process, as well as developing lightweight model versions with online learning capabilities to enhance generalizability.

Author Contributions

Y.S.: Writing—original draft, Visualization, Methodology, Data curation. Y.C.: Writing—review and editing, Project administration, Data curation, Resources, Funding acquisition. Y.L.: Software, Methodology, Data curation. T.L.: Validation, Data curation. W.Z.: Validation, Investigation, Funding acquisition, Conceptualization. All authors have read and agreed to the published version of the manuscript.

Funding

This research was funded by the Research Project of China Three Gorges Corporation (NBWL202300013), the National Natural Science Foundation of China (52470183), the Natural Science Foundation of Jiangsu Province (BK20240085), and the Fundamental and Interdisciplinary Disciplines Breakthrough Plan of the Ministry of Education of China (JYB2025XDXM907).

Data Availability Statement

The original contributions presented in the study are included in the article; further inquiries can be directed to the corresponding author.

Acknowledgments

We wish to thank the Research Project of China Three Gorges Corporation (NBWL202300013), the National Natural Science Foundation of China (52470183), the Natural Science Foundation of Jiangsu Province (BK20240085), and the Fundamental and Interdisciplinary Disciplines Breakthrough Plan of the Ministry of Education of China (JYB2025XDXM907) for the support of this work.

Conflicts of Interest

The authors declare that this study received funding from the Research Project of China Three Gorges Corporation (NBWL202300013), the National Natural Science Foundation of China (52470183), the Natural Science Foundation of Jiangsu Province (BK20240085), and the Fundamental and Interdisciplinary Disciplines Breakthrough Plan of the Ministry of Education of China (JYB2025XDXM907). Author Yasong Chen was employed by China Three Gorges Corporation. The remaining author declare no conflicts of interest. The funder was not involved in the study design, collection, analysis, interpretation of data, the writing of this article, or the decision to submit it for publication.

Appendix A

Table A1. Classification of functional areas in the research area.
Functional Urban AreaCities
cultural and educational areasChongqing, Wuhan, Anqing, Wuhu, Nanjing, Zhenjiang, Yangzhou, Changzhou, Suzhou, Shanghai, Wuxi,
storage areasChongqing, Panzhihua, Wuhan, Jiujiang, Chizhou, Wuhu, Nanjing, Zhenjiang, Yangzhou, Changzhou, Suzhou, Shanghai, Wuxi
commercial areasChongqing, Wuhan, Wuhu, Zhenjiang, Changzhou, Nantong, Suzhou, Shanghai, Wuxi
residential areasChongqing, Wuhan, Huangshi, Jiujiang, Wuhu, Nanjing, Zhenjiang, Yangzhou, Changzhou, Nantong, Suzhou, Shanghai, Wuxi
scenic areasChongqing, Yangzhou
industrial areasJingzhou, Anqing, Wuhu, Zhenjiang, Yangzhou, Changzhou, Suzhou, Shanghai, Wuxi
Table A2. Basic information on the monitored rainfall events.
Event IDDateRainfall (mm)Duration (min)Antecedent Dry Days (d)Region
119 June 20248.91801A
220 June 20243.11900A
321 June 20243.51800A
427 June 20244.31801A
512 July 202423.31801A
630 June 202313600B
74 July 202366.5603B
817 July 202313.5650B
919 July 202343.6570B
1030 July 202312.8550B
116 August 202320.41007B
1213 August 20239.8496B
1327 August 2023341200B
149 November 202322.8760B
1525 March 202413.2656B
1619 April 202413.2602B
1726 May 202440.42091B
1822 June 202424.3600B
1929 June 202424.21450B
Table A3. Feature Selection for Clustering.
TypeFeature
rainfall characteristicsRainfall, Duration, Max intensity, Antecedent dry days, Temperature, Annual rainfall
pollution characteristicsPollution concentration (COD, TN, TP SS)
social characteristicsSlope, City area, Built-up area, Green-coverage rate, Population, Per capita GDP
Figure A1. This diagram illustrates the elevation distribution within the river basin, expressed in meters above sea level, along with the locations of monitoring and data collection points.
Water 18 01095 g0a1
Table A4. SWMM parameter values.
Target VariableClusterN-impervN-pervS-impervS-pervPctZeroMaxRateMinRateDryTimeDecayManning-N
Runoff10.0080.223247579.23.92440.008
20.0140.2248074.33.7304.20.008
30.0160.2711.538068.42.5243.20.009
Target VariableClusterKdecayCoeff-1
(build)
Coeff-2
(build)
Coeff-3
(wash)
Coeff-42
(wash)
SS10.114020.0242
20.114020.0372
30.120020.0381.5
TN10.6101.50.0292
20.1121.50.0142.2
30.1121.50.0151.8
TP10.821.20.0052
20.821.10.0052.2
30.8210.0151.5
COD10.51001.650.0072
20.51001.550.0071.5
30.51001.280.0051.5
Figure A2. The basic structure of the Residual-BiLSTM-Multi-Head Attention Model developed in this study.
Water 18 01095 g0a2
Figure A3. Silhouette coefficient analysis for different numbers of clusters, with the red dot indicating three clusters.
Water 18 01095 g0a3
Figure A4. The distribution maps of the main features in each clustering group.
Water 18 01095 g0a4
Figure A5. An example of predicted urban runoff pollution based on LSTM for simulating pollutant concentrations. True values (green dots), LSTM predictions (red line) and rainfall intensity (gray bars).
Water 18 01095 g0a5

References

  1. Yin, D.; Evans, B.; Wang, Q.; Chen, Z.; Jia, H.; Chen, A.S.; Fu, G.; Ahmad, S.; Leng, L. Integrated 1D and 2D model for better assessing runoff quantity control of low impact development facilities on community scale. Sci. Total Environ. 2020, 720, 137630. [Google Scholar] [CrossRef]
  2. Wang, Y.; Li, C.; Qiao, J.; Hu, Y.; Zhang, Q.; Yin, J.; Slater, L. Meta-Analysis of Urban Non-Point Source Pollution from Road and Roof Runoff Across China. Earth’s Future 2025, 13, e2024EF005296. [Google Scholar] [CrossRef]
  3. Li, C.; Zheng, X.; Zhao, F.; Wang, X.; Cai, Y.; Zhang, N. Effects of Urban Non-Point Source Pollution from Baoding City on Baiyangdian Lake, China. Water 2017, 9, 249. [Google Scholar] [CrossRef]
  4. Garsdal, H.; Mark, O.; Dorge, J.; Jepsen, S.E. MOUSETRAP: Modelling of water quality processes and the interaction of sediments and pollutants in sewers. Water Sci. Technol. 1995, 31, 33–41. [Google Scholar] [CrossRef]
  5. Tan, M.L.; Gassman, P.W.; Yang, X.; Haywood, J. A review of SWAT applications, performance and future needs for simulation of hydro-climatic extremes. Adv. Water Resour. 2020, 143, 103662. [Google Scholar] [CrossRef]
  6. Zhang, X.; Wu, Y.; Liu, X.; Reis, S.; Jin, J.; Dragosits, U.; Van Damme, M.; Clarisse, L.; Whitburn, S.; Coheur, P.-F.; et al. Ammonia Emissions May Be Substantially Underestimated in China. Environ. Sci. Technol. 2017, 51, 12089–12096. [Google Scholar] [CrossRef]
  7. Wang, S.; Jiang, R.; Yang, M.; Xie, J.; Wang, Y.; Li, W. Urban rainstorm and waterlogging scenario simulation based on SWMM under changing environment. Environ. Sci. Pollut. Res. 2023, 30, 123259–123273. [Google Scholar] [CrossRef] [PubMed]
  8. Huang, S.; Gan, Y.; Chen, N.; Wang, C.; Zhang, X.; Li, C.; Horton, D.E. Urbanization enhances channel and surface runoff: A quantitative analysis using both physical and empirical models over the Yangtze River basin. J. Hydrol. 2024, 635, 131194. [Google Scholar] [CrossRef]
  9. Han, J.; Xin, Z.; Han, F.; Xu, B.; Wang, L.; Zhang, C.; Zheng, Y. Source contribution analysis of nutrient pollution in a P-rich watershed: Implications for integrated water quality management. Environ. Pollut. 2021, 279, 116885. [Google Scholar] [CrossRef]
  10. Driscoll, C.T.; Whitall, D.; Aber, J.; Boyer, E.; Castro, M.; Cronan, C.; Goodale, C.L.; Groffman, P.; Hopkinson, C.; Lambert, K.; et al. Nitrogen Pollution in the Northeastern United States: Sources, Effects, and Management Options. BioScience 2003, 53, 357–374. [Google Scholar] [CrossRef]
  11. Niu, W.-J.; Feng, Z.-K. Evaluating the performances of several artificial intelligence methods in forecasting daily streamflow time series for sustainable water resources management. Sustain. Cities Soc. 2021, 64, 102562. [Google Scholar] [CrossRef]
  12. Molajou, A.; Nourani, V.; Afshar, A.; Khosravi, M.; Brysiewicz, A. Optimal Design and Feature Selection by Genetic Algorithm for Emotional Artificial Neural Network (EANN) in Rainfall-Runoff Modeling. Water Resour. Manag. 2021, 35, 2369–2384. [Google Scholar] [CrossRef]
  13. Zanoni, M.G.; Majone, B.; Bellin, A. A catchment-scale model of river water quality by Machine Learning. Sci. Total Environ. 2022, 838, 156377. [Google Scholar] [CrossRef] [PubMed]
  14. Huan, J.; Fan, Y.; Xu, X.; Zhou, L.; Zhang, H.; Zhang, C.; Hu, Q.; Cai, W.; Ju, H.; Gu, S. Deep learning model based on coupled SWAT and interpretable methods for water quality prediction under the influence of non-point source pollution. Comput. Electron. Agric. 2025, 231, 109985. [Google Scholar] [CrossRef]
  15. Chen, S.; Huang, J.; Huang, J.-C. Improving daily streamflow simulations for data-scarce watersheds using the coupled SWAT-LSTM approach. J. Hydrol. 2023, 622, 129734. [Google Scholar] [CrossRef]
  16. Noori, N.; Kalin, L.; Isik, S. Water quality prediction using SWAT-ANN coupled approach. J. Hydrol. 2020, 590, 125220. [Google Scholar] [CrossRef]
  17. Karniadakis, G.E.; Kevrekidis, I.G.; Lu, L.; Perdikaris, P.; Wang, S.; Yang, L. Physics-informed machine learning. Nat. Rev. Phys. 2021, 3, 422–440. [Google Scholar] [CrossRef]
  18. Wang, C.; Jiang, S.; Zheng, Y.; Han, F.; Kumar, R.; Rakovec, O.; Li, S. Distributed Hydrological Modeling with Physics-Encoded Deep Learning: A General Framework and Its Application in the Amazon. Water Resour. Res. 2024, 60, e2023WR036170. [Google Scholar] [CrossRef]
  19. Zubelzu, S.; Ghalkha, A.; Ben Issaid, C.; Zanella, A.; Bennis, M. Coupling machine learning and physical modelling for predicting runoff at catchment scale. J. Environ. Manag. 2024, 354, 120404. [Google Scholar] [CrossRef] [PubMed]
  20. Lee, J.H.; Bang, K.W. Characterization of urban stormwater runoff. Water Res. 2000, 34, 1773–1780. [Google Scholar] [CrossRef]
  21. Liu, A.; Egodawatta, P.; Guan, Y.; Goonetilleke, A. Influence of rainfall and catchment characteristics on urban stormwater quality. Sci. Total Environ. 2013, 444, 255–262. [Google Scholar] [CrossRef]
  22. Zhang, M.; Chen, H.; Wang, J.; Pan, G. Rainwater utilization and storm pollution control based on urban runoff characterization. J. Environ. Sci. 2010, 22, 40–46. [Google Scholar] [CrossRef]
  23. Valtanen, M.; Sillanpaa, N.; Setala, H. The Effects of Urbanization on Runoff Pollutant Concentrations, Loadings and Their Seasonal Patterns Under Cold Climate. Water Air Soil Pollut. 2014, 225, 1977. [Google Scholar] [CrossRef]
  24. Wang, S.; He, Q.; Ai, H.; Wang, Z.; Zhang, Q. Pollutant concentrations and pollution loads in stormwater runoff from different land uses in Chongqing. J. Environ. Sci. 2013, 25, 502–510. [Google Scholar] [CrossRef] [PubMed]
  25. Qin, H.-P.; Khu, S.-T.; Yu, X.-Y. Spatial variations of storm runoff pollution and their correlation with land-use in a rapidly urbanizing catchment in China. Sci. Total Environ. 2010, 408, 4613–4623. [Google Scholar] [CrossRef] [PubMed]
  26. Lapo, K.; Ichinaga, S.M.; Kutz, J.N. A method for unsupervised learning of coherent spatiotemporal patterns in multiscale data. Proc. Natl. Acad. Sci. USA 2025, 122, e2415786122. [Google Scholar] [CrossRef]
  27. Wang, B.; Luo, X.; Yang, Y.-M.; Sun, W.; Cane, M.A.; Cai, W.; Yeh, S.-W.; Liu, J. Historical change of El Nino properties sheds light on future changes of extreme El Nino. Proc. Natl. Acad. Sci. USA 2019, 116, 22512–22517. [Google Scholar] [CrossRef]
  28. Li, C.; Liu, M.; Hu, Y.; Shi, T.; Qu, X.; Walter, M.T. Effects of urbanization on direct runoff characteristics in urban functional zones. Sci. Total Environ. 2018, 643, 301–311. [Google Scholar] [CrossRef] [PubMed]
  29. Xu, C.; Rahman, M.; Haase, D.; Wu, Y.; Su, M.; Pauleit, S. Surface runoff in urban areas: The role of residential cover and urban growth form. J. Clean. Prod. 2020, 262, 121421. [Google Scholar] [CrossRef]
  30. Cheng, C.; Zhang, F.; Shi, J.; Kung, H.-T. What is the relationship between land use and surface water quality? A review and prospects from remote sensing perspective. Environ. Sci. Pollut. Res. 2022, 29, 56887–56907. [Google Scholar] [CrossRef]
  31. Ju, Q.; Yu, Z.; Hao, Z.; Ou, G.; Zhao, J.; Liu, D. Division-based rainfall-runoff simulations with BP neural networks and Xinanjiang model. Neurocomputing 2009, 72, 2873–2883. [Google Scholar] [CrossRef]
  32. Belvederesi, C.; Zaghloul, M.S.; Achari, G.; Gupta, A.; Hassan, Q.K. Modelling river flow in cold and ungauged regions: A review of the purposes, methods, and challenges. Environ. Rev. 2022, 30, 159–173. [Google Scholar] [CrossRef]
  33. Dariane, A.B.; Javadianzadeh, M.M. Towards an Efficient Rainfall-Runoff Model through Partitioning Scheme. Water 2016, 8, 63. [Google Scholar] [CrossRef]
  34. Xu, J.; Yang, D.; Yi, Y.; Lei, Z.; Chen, J.; Yang, W. Spatial and temporal variation of runoff in the Yangtze River basin during the past 40 years. Quat. Int. 2008, 186, 32–42. [Google Scholar] [CrossRef]
  35. Zhu, M.; Zhang, Z.; Zhu, B.; Kong, R.; Zhang, F.; Tian, J.; Jiang, T. Population and Economic Projections in the Yangtze River Basin Based on Shared Socioeconomic Pathways. Sustainability 2020, 12, 4202. [Google Scholar] [CrossRef]
  36. Shang, S.; Cui, T.; Wang, Y.; Gao, Q.; Liu, Y. Dynamic variation and driving mechanisms of land use change from 1980 to 2020 in the lower reaches of the Yangtze River, China. Front. Environ. Sci. 2024, 11, 1335624. [Google Scholar] [CrossRef]
  37. GB/T 50280-98; Standard for Basic Terminology of Urban Planning. Department of System Reform and Legal Affairs, Ministry of Housing and Urban-Rural Development: Beijing, China, 1998.
  38. State Environmental Protection Administration of China. Water and Wastewater Monitoring and Analysis Methods, 4th ed.; China Environmental Science Press: Beijing, China, 2002; pp. 210–213.
  39. Li, Q.; Chen, Q.; Deng, J.; Hu, W. The use of simulated rainfall to study the discharge process and the influence factors of urban surface runoff pollution loads. Water Sci. Technol. 2015, 72, 484–490. [Google Scholar] [CrossRef]
  40. Hu, D.; Zhang, C.; Ma, B.; Liu, Z.; Yang, X.; Yang, L. The characteristics of rainfall runoff pollution and its driving factors in Northwest semiarid region of China—A case study of Xi’an. Sci. Total Environ. 2020, 726, 138384. [Google Scholar] [CrossRef]
  41. Valtanen, M.; Sillanpaa, N.; Setala, H. Key factors affecting urban runoff pollution under cold climatic conditions. J. Hydrol. 2015, 529, 1578–1589. [Google Scholar] [CrossRef]
  42. Istalkar, P.; Unnithan, S.L.K.; Biswal, B.; Sivakumar, B. A Canberra distance-based complex network classification framework using lumped catchment characteristics. Stoch. Environ. Res. Risk Assess. 2021, 35, 1293–1300. [Google Scholar] [CrossRef]
  43. Murtagh, F.; Contreras, P. Algorithms for hierarchical clustering: An overview. Wiley Interdiscip. Rev.-Data Min. Knowl. Discov. 2012, 2, 86–97. [Google Scholar] [CrossRef]
  44. Ran, X.; Xi, Y.; Lu, Y.; Wang, X.; Lu, Z. Comprehensive survey on hierarchical clustering algorithms and the recent developments. Artif. Intell. Rev. 2023, 56, 8219–8264. [Google Scholar] [CrossRef]
  45. Sun, A.Y.; Scanlon, B.R.; Zhang, Z.; Walling, D.; Bhanja, S.N.; Mukherjee, A.; Zhong, Z. Combining Physically Based Modeling and Deep Learning for Fusing GRACE Satellite Data: Can We Learn from Mismatch? Water Resour. Res. 2019, 55, 1179–1195. [Google Scholar] [CrossRef]
  46. Babaei, S.; Ghazavi, R.; Erfanian, M. Urban flood simulation and prioritization of critical urban sub-catchments using SWMM model and PROMETHEE II approach. Phys. Chem. Earth 2018, 105, 3–11. [Google Scholar] [CrossRef]
  47. Gironás, J.; Roesner, L.A.; Rossman, L.A.; Davis, J. A new applications manual for the Storm Water Management Model (SWMM). Environ. Model. Softw. 2010, 25, 813–814. [Google Scholar] [CrossRef]
  48. Gupta, V.K.; Ayalew, T.B.; Mantilla, R.; Krajewski, W.F. Classical and generalized Horton laws for peak flows in rainfall-runoff events. Chaos 2015, 25, 075408. [Google Scholar] [CrossRef]
  49. Wang, N.; Chu, X. Revised Horton model for event and continuous simulations of infiltration. J. Hydrol. 2020, 589, 125215. [Google Scholar] [CrossRef]
  50. Hashemi, M.M.; Saghafian, B.; Niri, M.Z.; Najarchi, M. Applicability of Rainfall-Runoff Models in Two Simplified Watersheds. Iran. J. Sci. Technol.-Trans. Civ. Eng. 2022, 46, 3295–3306. [Google Scholar] [CrossRef]
  51. Xiong, Y.Y.; Melching, C.S. Comparison of kinematic-wave and nonlinear reservoir routing of urban watershed runoff. J. Hydrol. Eng. 2005, 10, 39–49. [Google Scholar] [CrossRef]
  52. Egodawatta, P.; Thomas, E.; Goonetilleke, A. Mathematical interpretation of pollutant wash-off from urban road surfaces using simulated rainfall. Water Res. 2007, 41, 3025–3031. [Google Scholar] [CrossRef]
  53. Behrouz, M.S.; Zhu, Z.; Matott, L.S.; Rabideau, A.J. A new tool for automatic calibration of the Storm Water Management Model (SWMM). J. Hydrol. 2020, 581, 124436. [Google Scholar] [CrossRef]
  54. An, F.; Yang, D.; Sun, X.; Wei, H.; Chen, F. A machine learning model integrating spatiotemporal attention and residual learning for predicting periodic air pollutant concentrations. Environ. Model. Softw. 2025, 188, 106438. [Google Scholar] [CrossRef]
  55. Ren, Y.; Wang, S.; Xia, B. Deep learning coupled model based on TCN-LSTM for particulate matter concentration prediction. Atmos. Pollut. Res. 2023, 14, 101703. [Google Scholar] [CrossRef]
  56. Alzubaidi, L.; Zhang, J.; Humaidi, A.J.; Al-Dujaili, A.; Duan, Y.; Al-Shamma, O.; Santamaría, J.; Fadhel, M.A.; Al-Amidie, M.; Farhan, L. Review of deep learning: Concepts, CNN architectures, challenges, applications, future directions. J. Big Data 2021, 8, 53. [Google Scholar] [CrossRef]
  57. Alom, M.Z.; Hasan, M.; Yakopcic, C.; Taha, T.M.; Asari, V.K. Inception recurrent convolutional neural network for object recognition. Mach. Vis. Appl. 2021, 32, 28. [Google Scholar] [CrossRef]
  58. Cui, B.; Liu, M.; Li, S.; Jin, Z.; Zeng, Y.; Lin, X. Deep learning methods for atmospheric PM2.5 prediction: A comparative study of transformer and CNN-LSTM-attention. Atmos. Pollut. Res. 2023, 14, 101833. [Google Scholar] [CrossRef]
  59. Li, A.; Wang, Y.; Qi, Q.; Li, Y.; Jia, H.; Zhou, X.; Guo, H.; Xie, S.; Liu, J.; Mu, Y. Improved PM2.5 prediction with spatio-temporal feature extraction and chemical components: The RCG-attention model. Sci. Total Environ. 2024, 955, 177183. [Google Scholar] [CrossRef] [PubMed]
  60. Liu, L.; Zhou, W.; Guan, K.; Peng, B.; Xu, S.; Tang, J.; Zhu, Q.; Till, J.; Jia, X.; Jiang, C. Knowledge-guided machine learning can improve carbon cycle quantification in agroecosystems. Nat. Commun. 2024, 15, 357. [Google Scholar] [CrossRef]
  61. Zhuang, F.; Qi, Z.; Duan, K.; Xi, D.; Zhu, Y.; Zhu, H.; Xiong, H.; He, Q. A Comprehensive Survey on Transfer Learning. Proc. IEEE 2021, 109, 43–76. [Google Scholar] [CrossRef]
  62. Wang, X.; Tang, Y.; Zhang, F.; Fu, C.; Zhao, M. Optimum urban runoff pollution control based on dynamic load calculation and effective control units identification—A case study in a highly urbanized basin in China. Phys. Chem. Earth 2024, 135, 103629. [Google Scholar] [CrossRef]
  63. Xu, C.; Zhong, P.-A.; Zhu, F.; Xu, B.; Wang, Y.; Yang, L.; Wang, S.; Xu, S. A hybrid model coupling process-driven and data-driven models for improved real-time flood forecasting. J. Hydrol. 2024, 638, 131494. [Google Scholar] [CrossRef]
  64. Ahmed, S.F.; Alam, M.S.B.; Hassan, M.; Rozbu, M.R.; Ishtiak, T.; Rafa, N.; Mofijur, M.; Shawkat Ali, A.; Gandomi, A.H. Deep learning modelling techniques: Current progress, applications, advantages, and challenges. Artif. Intell. Rev. 2023, 56, 13521–13617. [Google Scholar] [CrossRef]
  65. Xu, F.; Yan, H.; Ma, C.; Zhao, H.; Sun, Q.; Cheng, K.; He, J.; Liu, J.; Wu, Z. Genius: A generalizable and purely unsupervised self-training framework for advanced reasoning. arXiv 2025, arXiv:2504.08672. [Google Scholar] [CrossRef]
  66. Candemir, S.; Nguyen, X.V.; Folio, L.R.; Prevedello, L.M. Training Strategies for Radiology Deep Learning Models in Data-limited Scenarios. Radiol. Artif. Intell. 2021, 3, e210014. [Google Scholar] [CrossRef] [PubMed]
  67. Zhao, Z.; Alzubaidi, L.; Zhang, J.; Duan, Y.; Gu, Y. A comparison review of transfer learning and self-supervised learning: Definitions, applications, advantages and limitations. Expert Syst. Appl. 2024, 242, 122807. [Google Scholar] [CrossRef]
Figure 1. Flowchart of the proposed three-tiered framework for urban runoff pollution forecasting. A Flowchart detailing the strategies of the Functional Area Clustering—Model Development—Basin Application framework. (A) In the Functional Area Clustering phase, basin urban functional areas are clustered into different clusters. Through literature collection and calibration, a model parameter set is formed. (B) In the Model Development phase, there are a data—driven model (BiLSTM with Multi—Head Attention structure including Forward Layer, Backward Layer, and Residual Block) and a process—driven model. The process-driven model utilizes hydrologic-hydraulic and water quality parameters, along with catchment characteristics, to generate SWMM simulation outputs, which subsequently serve as inputs for the data-driven model. (C) In the Basin Application phase, for areas with abundant monitoring data and scarce monitoring data, a fine—tune process is carried out. The fine—tune involves a model structure with Freezing Parameters (including operations like Linear, Residual Block, Multi—Head Attention, BiLSTM) and Training Updates (Linear—Linear structure). The model framework ultimately outputs the time-series prediction results of runoff pollution.
Water 18 01095 g001
Figure 2. Cluster analysis of urban functional areas in the Yangtze River Basin.
Water 18 01095 g002
Figure 3. Performance comparison and time-series prediction results of urban runoff pollution between the Residual-BiLSTM-Multi-Head Attention (RLA) model and the traditional LSTM model. Performance comparison of the LSTM and the RLA using monitoring data from varying numbers of rainfall events for training (a) RLA, (b) LSTM. An example of predicted urban runoff pollution based on RLA for simulating pollutant concentrations. True values (green dots), RLA predictions (blue line) and rainfall intensity (gray bars) (c) TP, (d) COD, (e) SS, (f) TN.
Water 18 01095 g003
Figure 4. Quantitative contribution analysis of each component of the Residual-BiLSTM-Multi-Head Attention (RLA) model to prediction performance. (a,b) The boxplots in (a,b) summarize the R2 distributions across 10 independent rainfall events from the test set, demonstrating the statistical consistency of the component contributions. The impact of incrementally adding RLA components to a BiLSTM model on prediction accuracy across different data volumes (a) small data, (b) large data; An example of predicted urban runoff pollution based on models with varying components (c) TP, (d) COD, (e) SS, (f) TN.
Water 18 01095 g004
Figure 5. Prediction performance of LSTM and RLA models at the basin scale, (a) traffic-industry-education oriented functional areas (b) commercial-residence-comprehensive service functional areas.
Water 18 01095 g005
Disclaimer/Publisher’s Note: The statements, opinions and data contained in all publications are solely those of the individual author(s) and contributor(s) and not of MDPI and/or the editor(s). MDPI and/or the editor(s) disclaim responsibility for any injury to people or property resulting from any ideas, methods, instructions or products referred to in the content.