Metaheuristic Optimization of Treated Sewage Wastewater Quality Parameters with Natural Coagulants


Abstract
1. Introduction
1.1. Background
1.2. The Justification for Using Metaheuristic Optimization Techniques
1.3. Rationale for Choosing Natural Coagulants
1.4. Contribution of the Study
- The implementation of multi-objective optimization via Pareto fronts using GWO for coagulation with Cucumis melo;
- The exploration of trade-offs among multiple conflicting objectives (e.g., turbidity reduction vs. coagulant dosage);
- The integration of statistical modeling (regression and ANOVA) with evolutionary algorithms to enhance the understanding and optimization of the coagulation process.
2. Methodology
2.1. Data Collection
2.2. Modeling
2.2.1. Multivariate Polynomial Regression
2.2.2. Analysis of Variance
2.2.3. Model Analysis (Methodological Overview)
Optimization and Model Accuracy Discussion (Equations and Metrics)
2.3. Approach for the Optimization
- α (alpha): Best solution;
- β (beta): Second-best solution;
- δ (delta): Third-best solution;
- ω (omega): Remaining solutions.
3. Results
3.1. Data Explanation
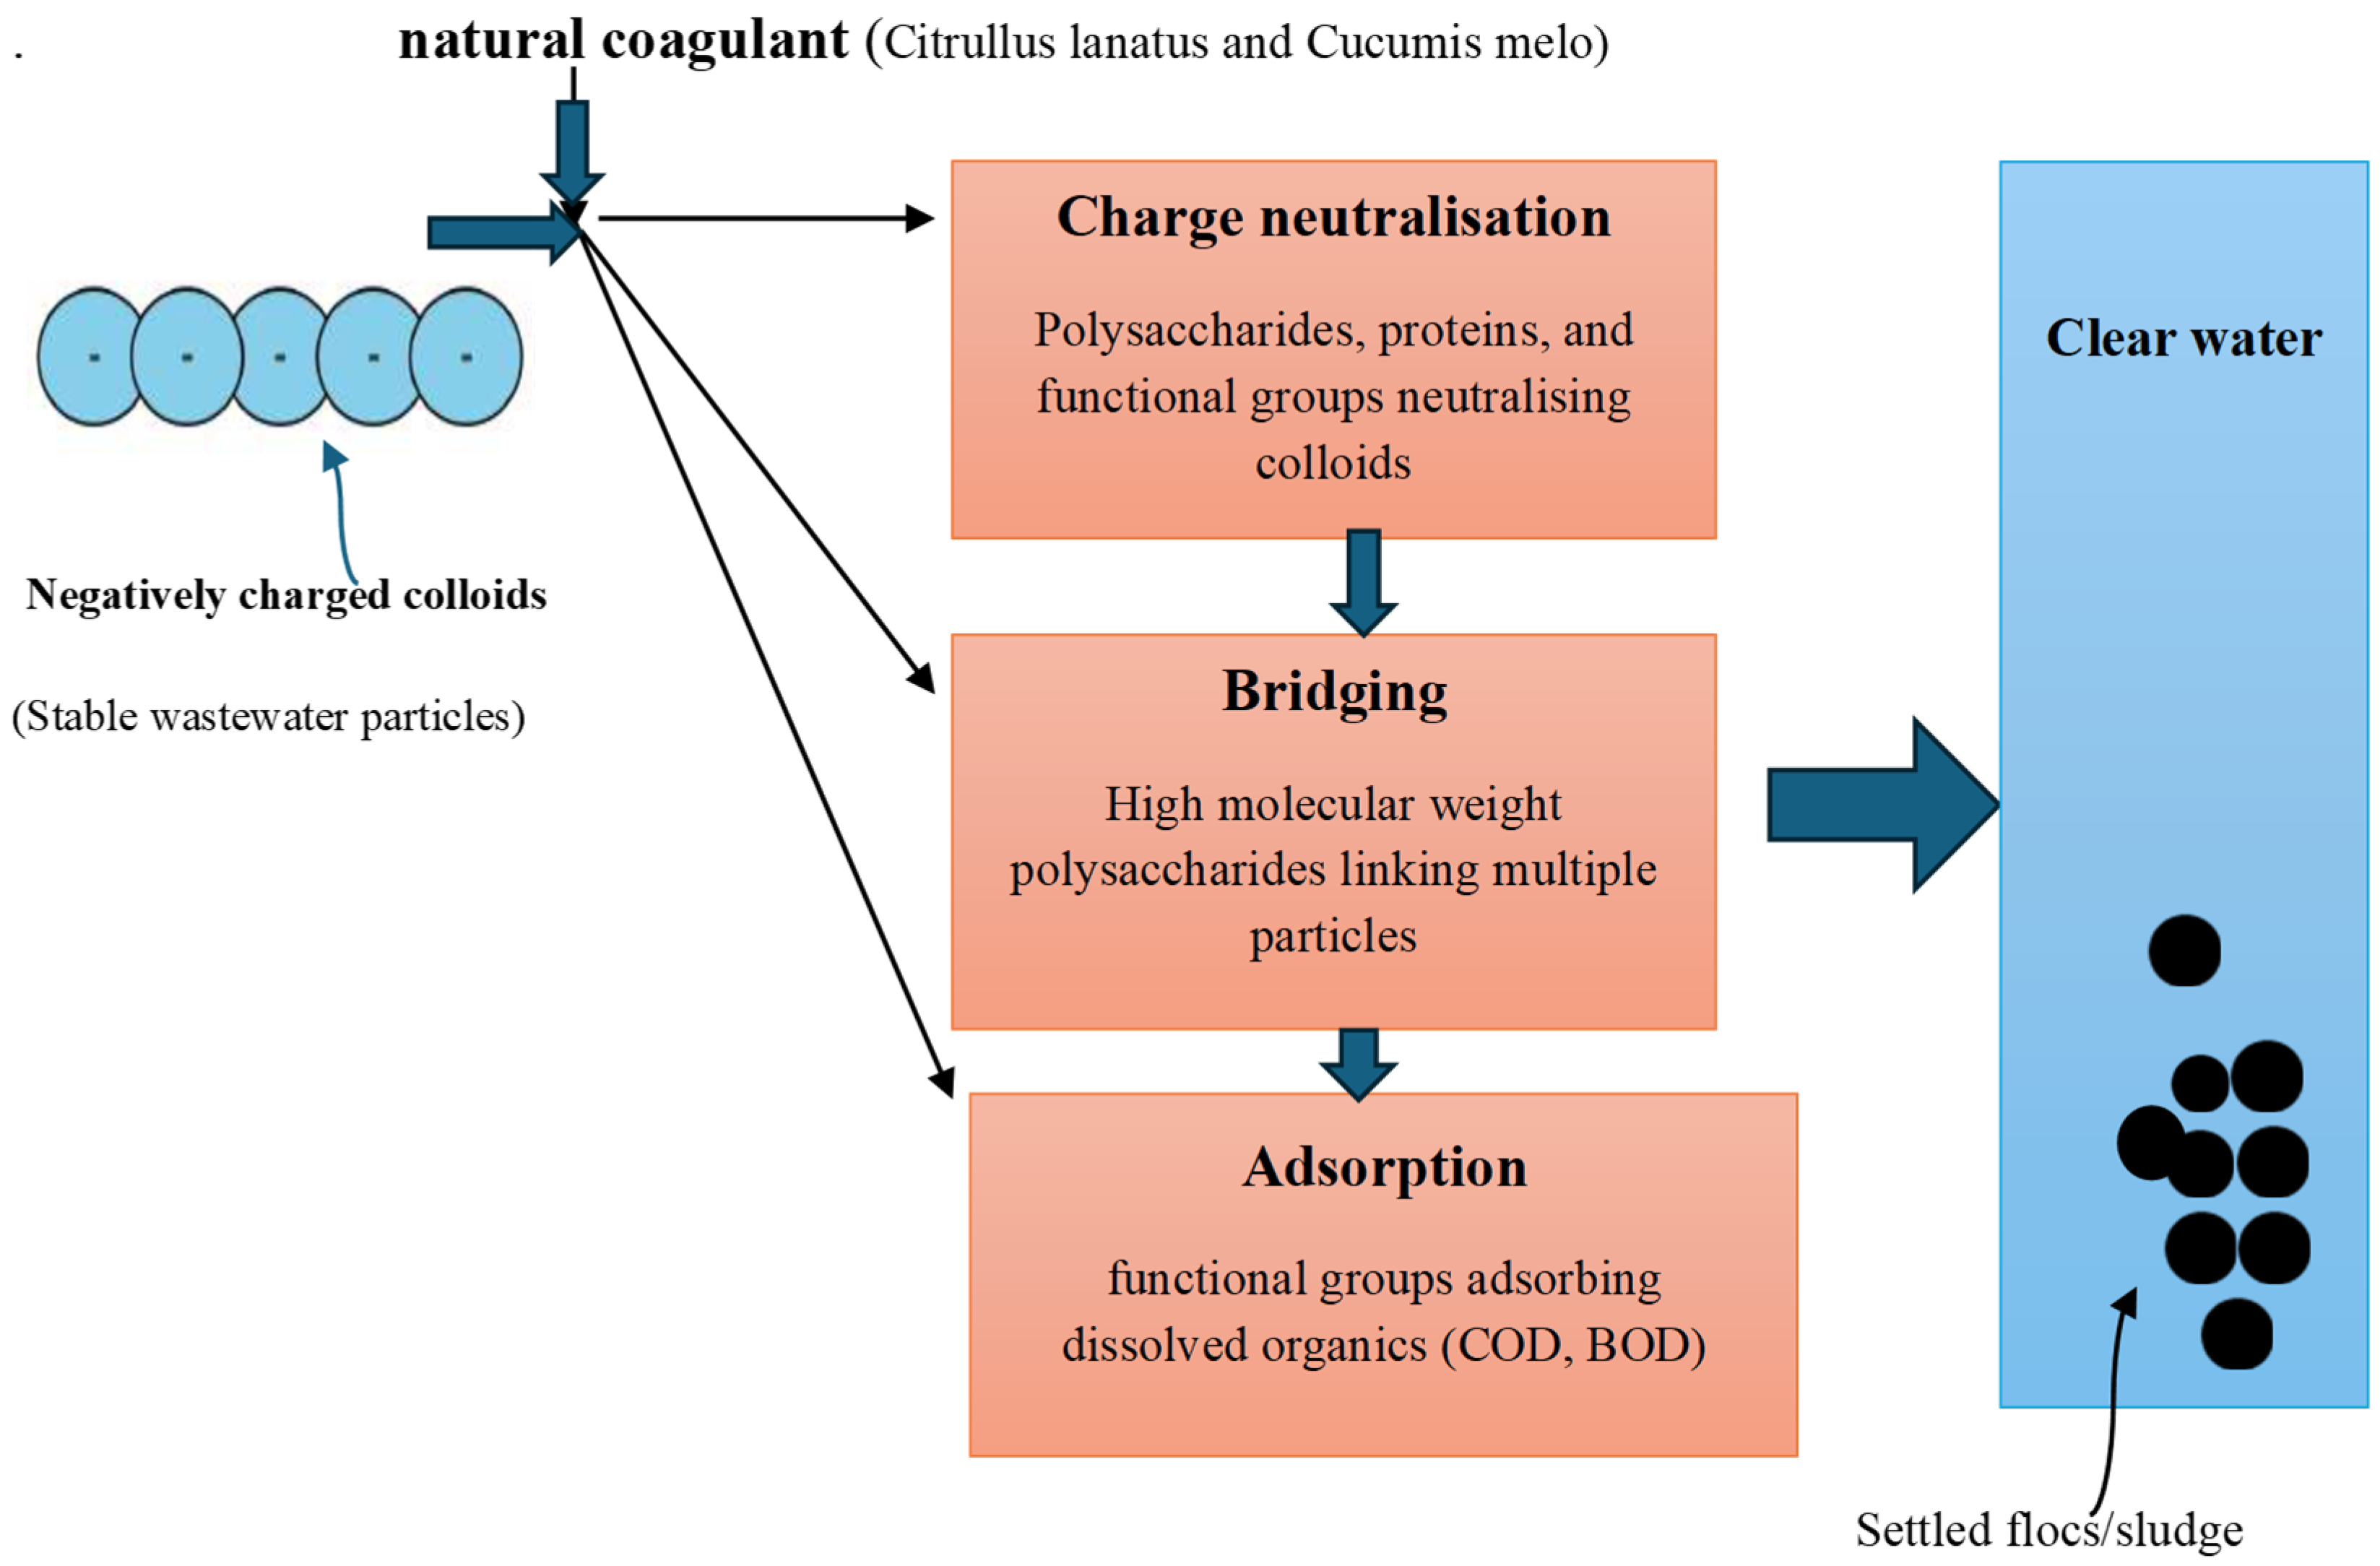
- Summary of the Chemical Mechanisms in Relation to Observed Patterns
- Charge Neutralization: Predominant at pH levels where coagulant components are ionized and can neutralize colloidal particles, consistent with increased turbidity and organic removal at specific pH values.
- Bridging: Effective at pH ranges where natural polymers (such as polysaccharides and proteins) can adsorb multiple particles, contributing to TSS reduction, especially in regions of the plot with optimal A and B combinations.
- Adsorption: Organic matter removal (reflected in BOD and COD reductions) is facilitated when functional groups on organic molecules interact with active sites of coagulant components, which is pH-dependent, explaining maxima or interaction effects in the plots.
- pH Dependency: The ionization states of natural organic polymers vary with pH, influencing their ability to destabilize colloids, adsorb organics, or form flocs, thereby shaping the spatial patterns observed in the plots.
- -
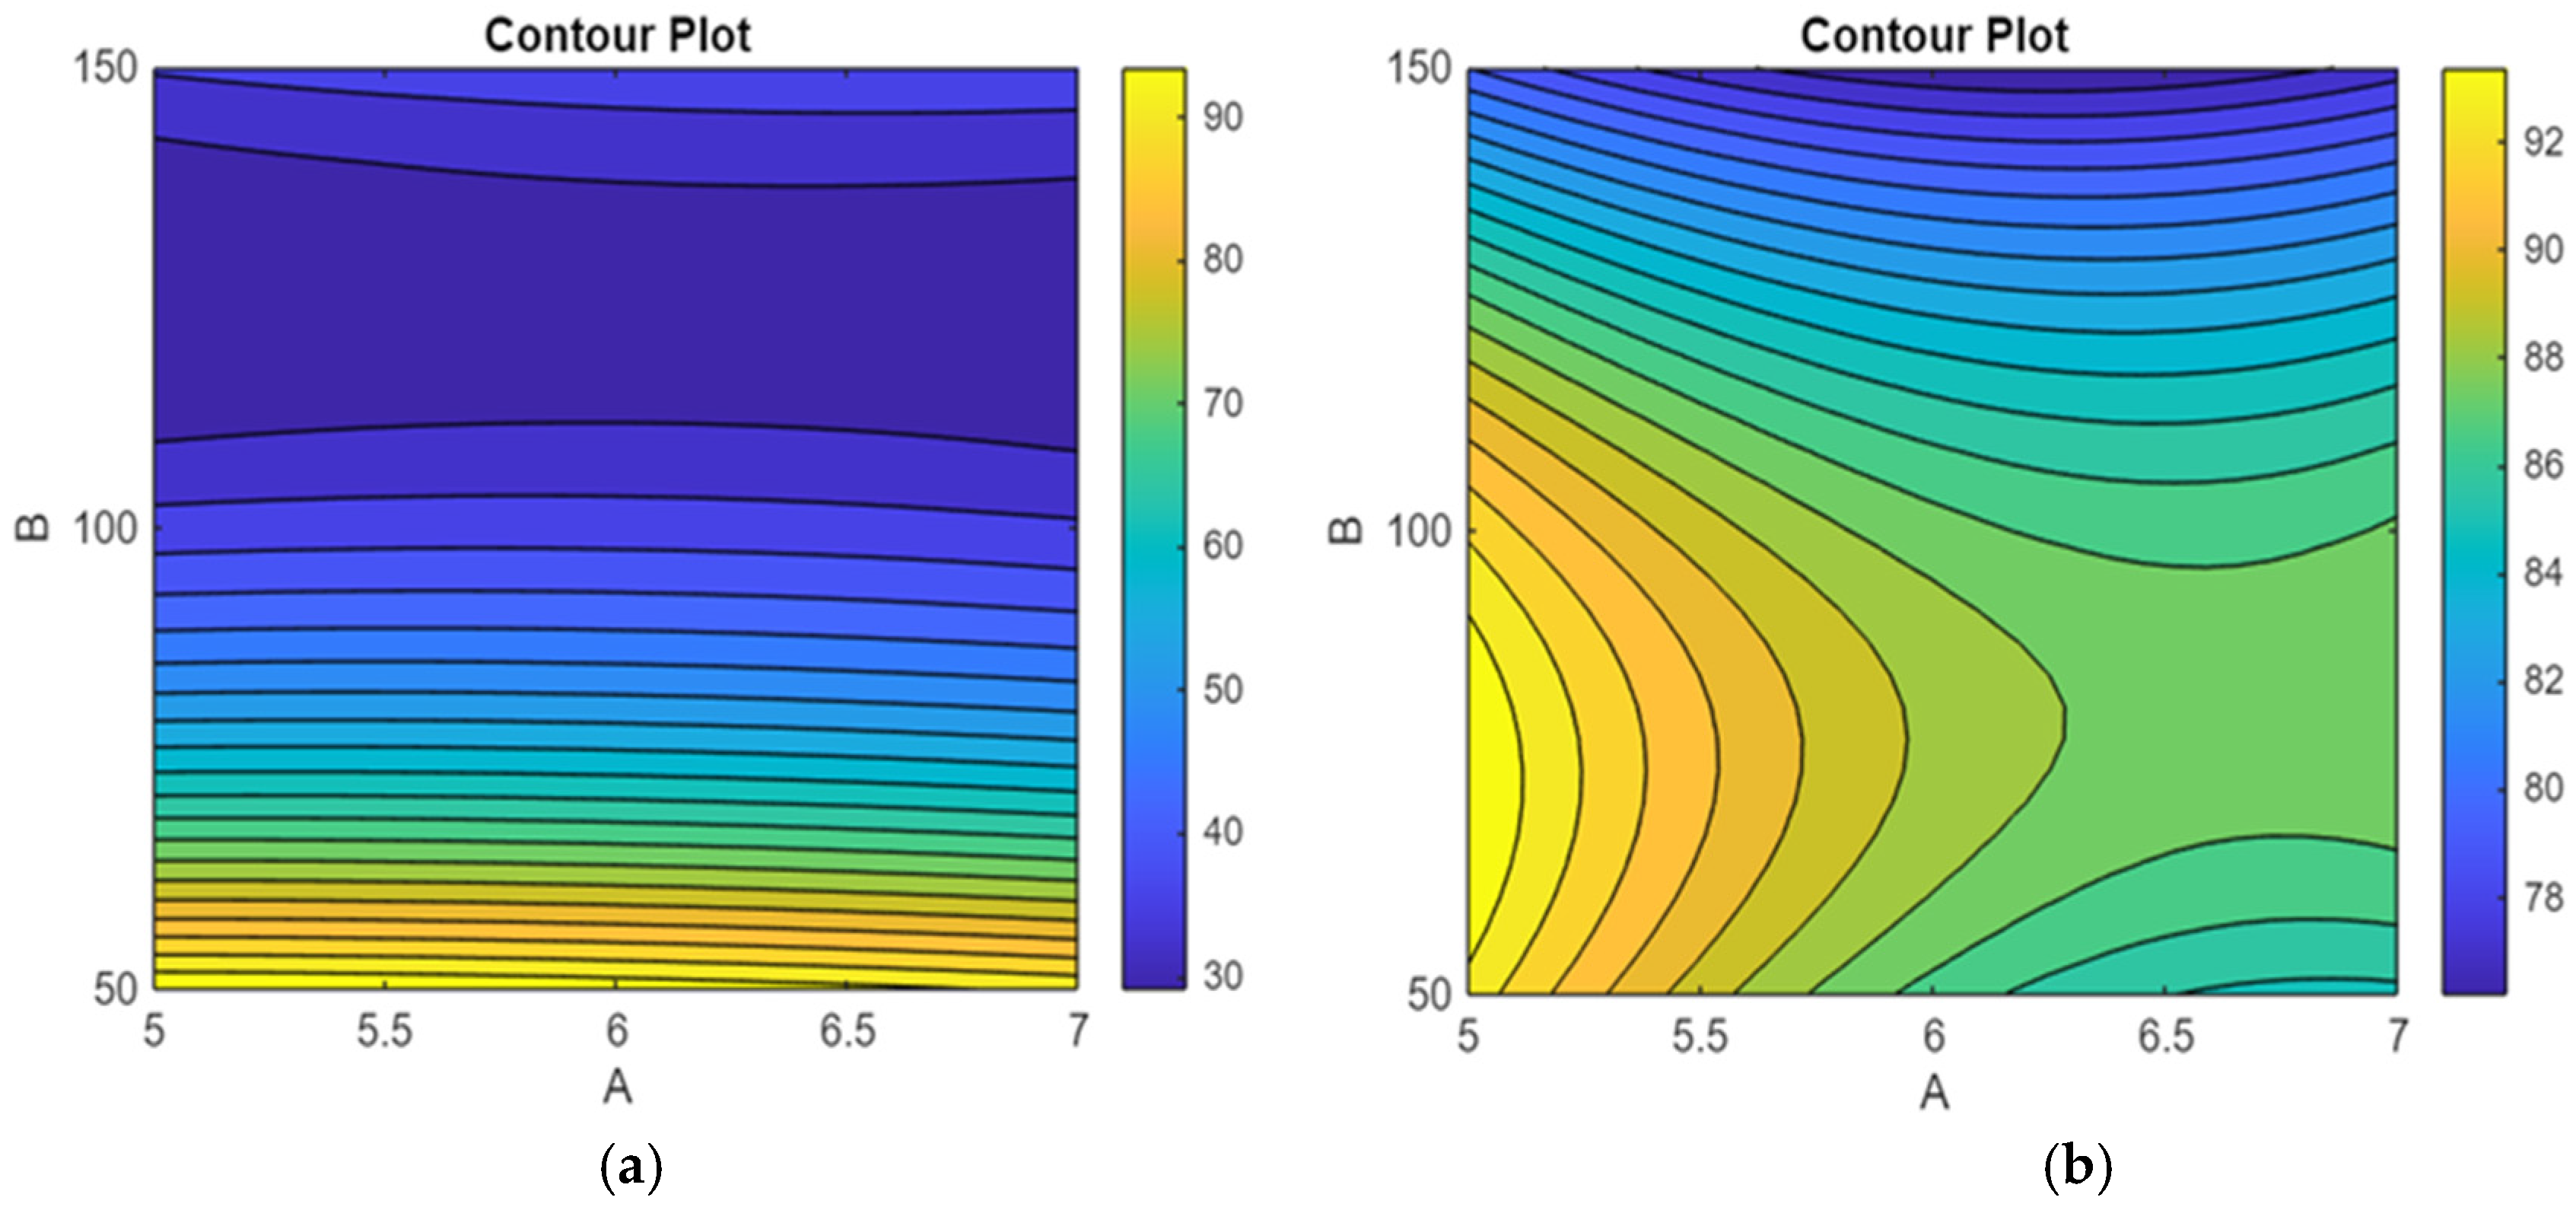
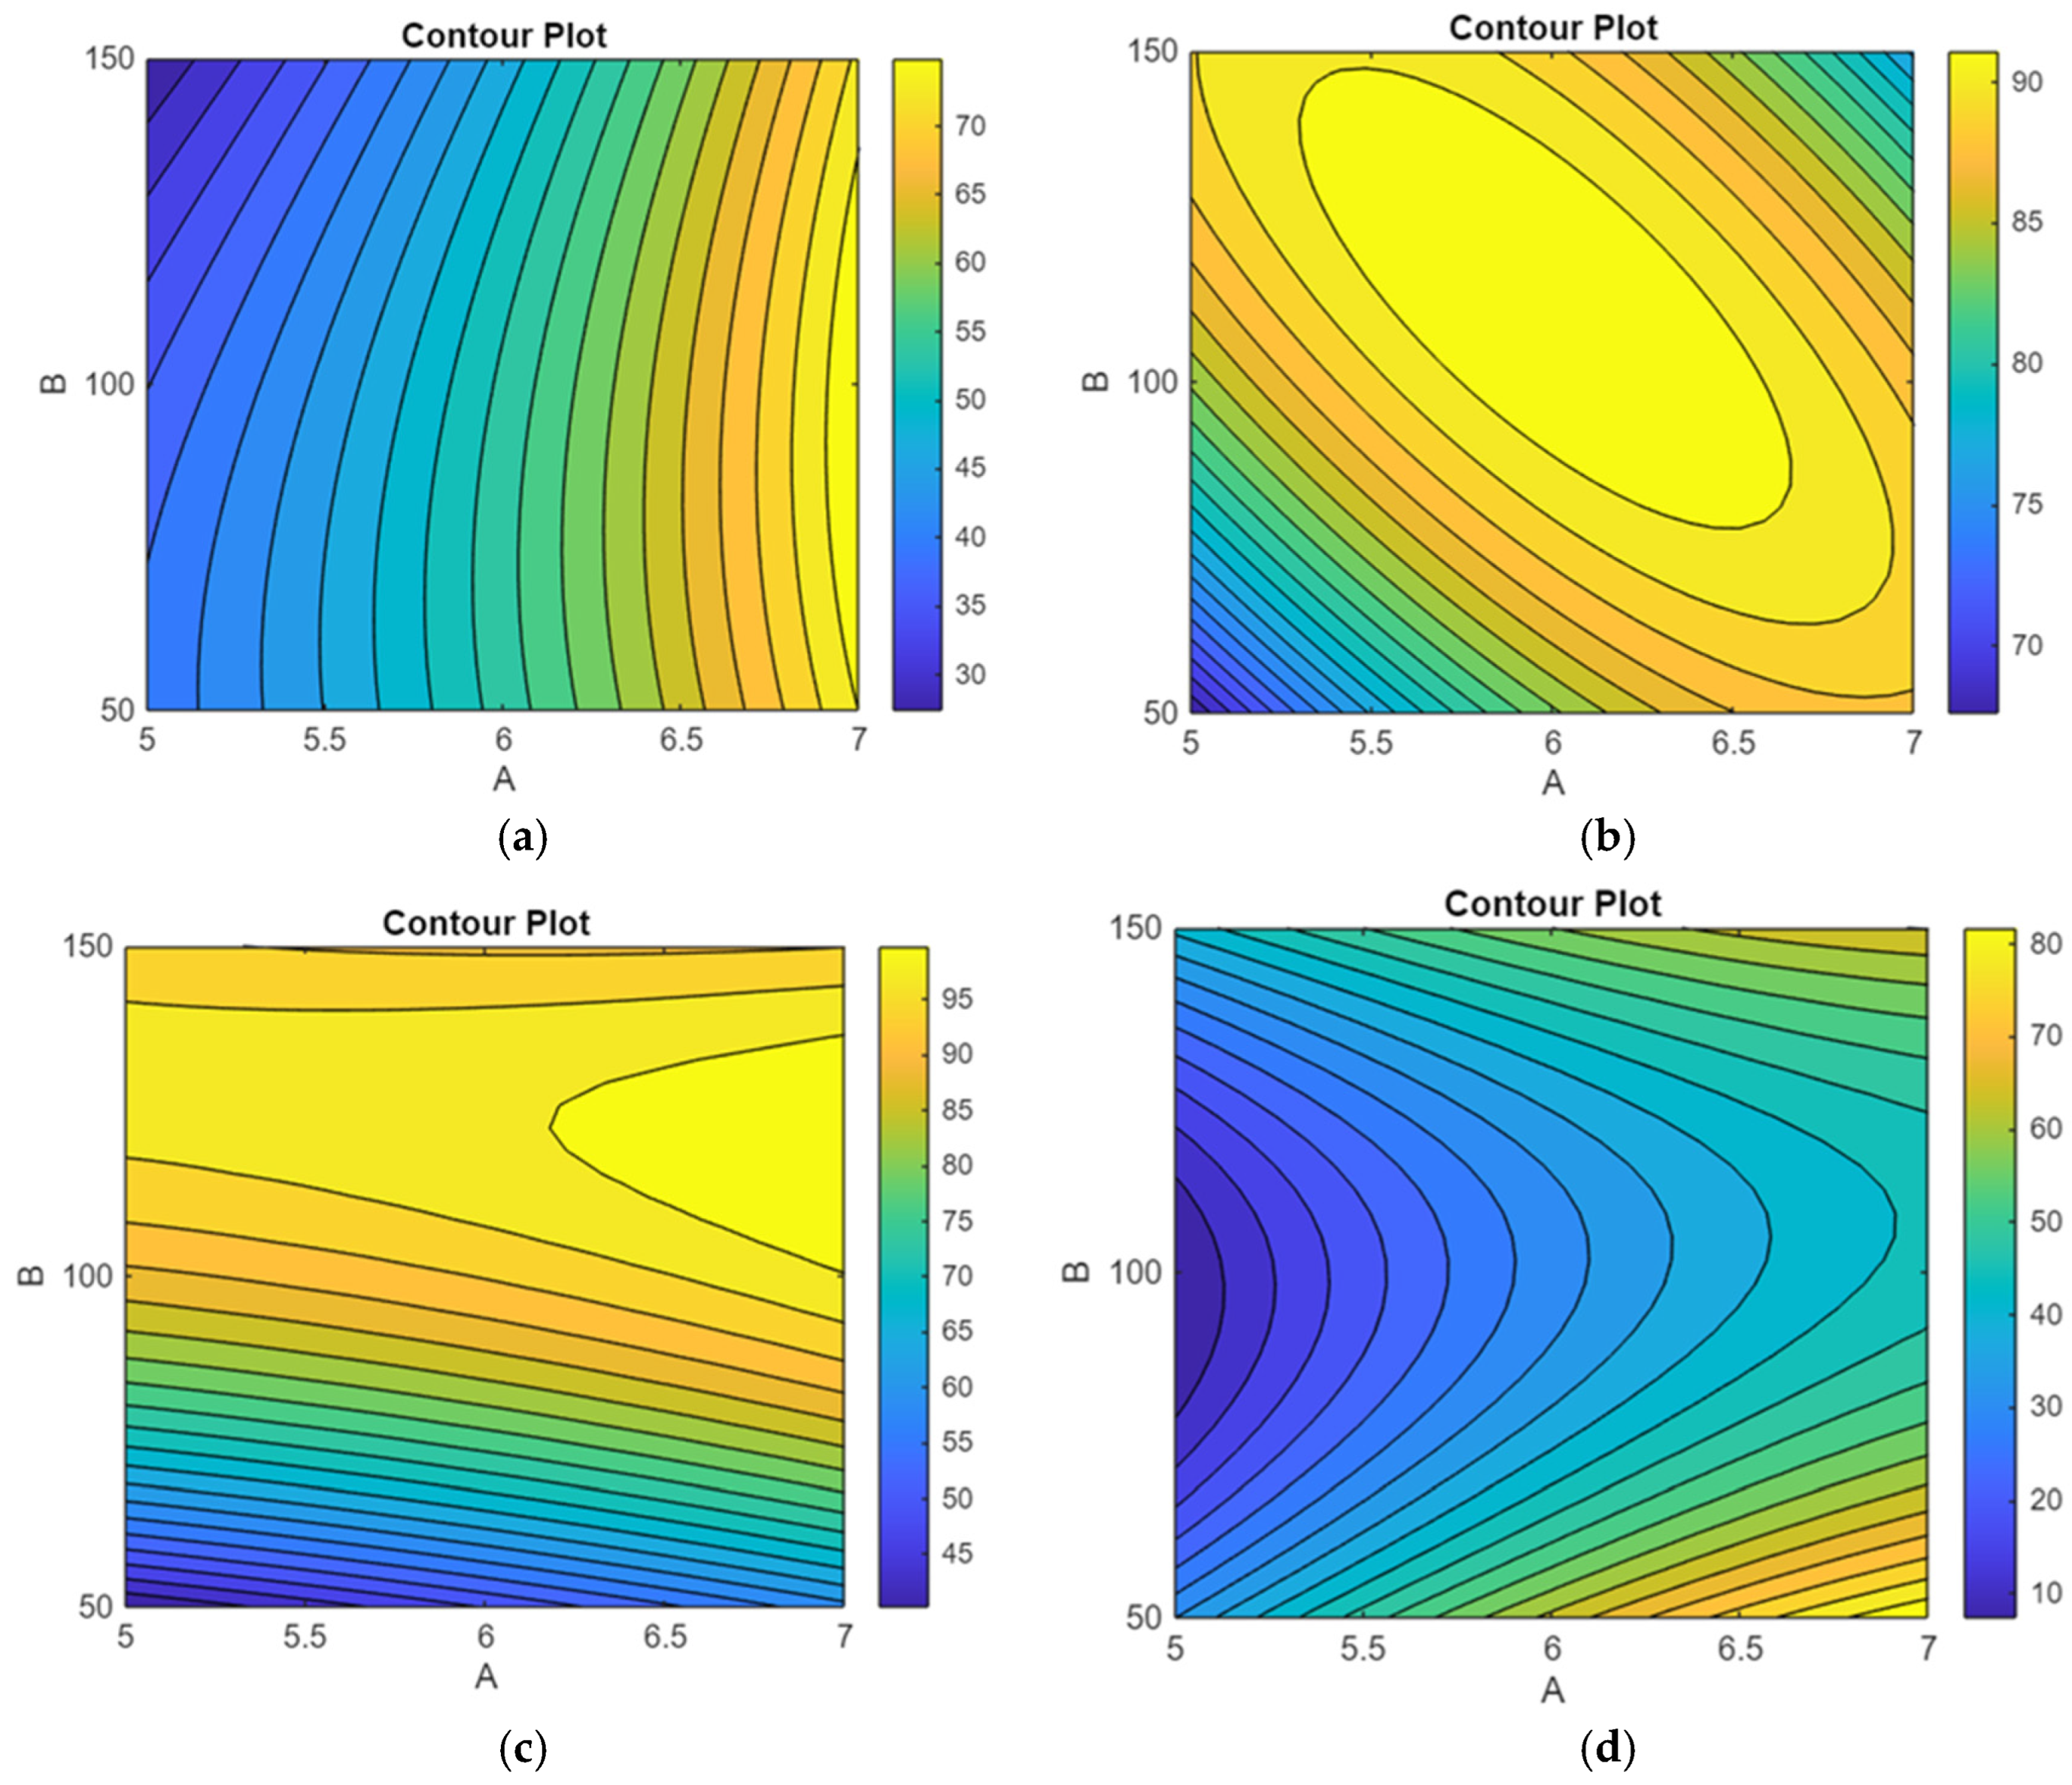
- Turbidity reduction (2a): The plot shows a gradient from blue (lower reductions) in the bottom left to yellow (higher reductions) in the top right. Approximate maximum reduction values are around 85–90%, whereas minimum reductions are near 10–15%. This indicates that both A and B significantly influence turbidity removal, with the strongest effects observed at high variable levels.
- -
- TSS reduction (2b): The elliptical high-value region suggests a peak reduction near 95–98%, with minimum reductions around 5–10% at opposite ends of the variable spectrum. The peak in this region signifies optimal interaction between A and B for TSS removal.
- -
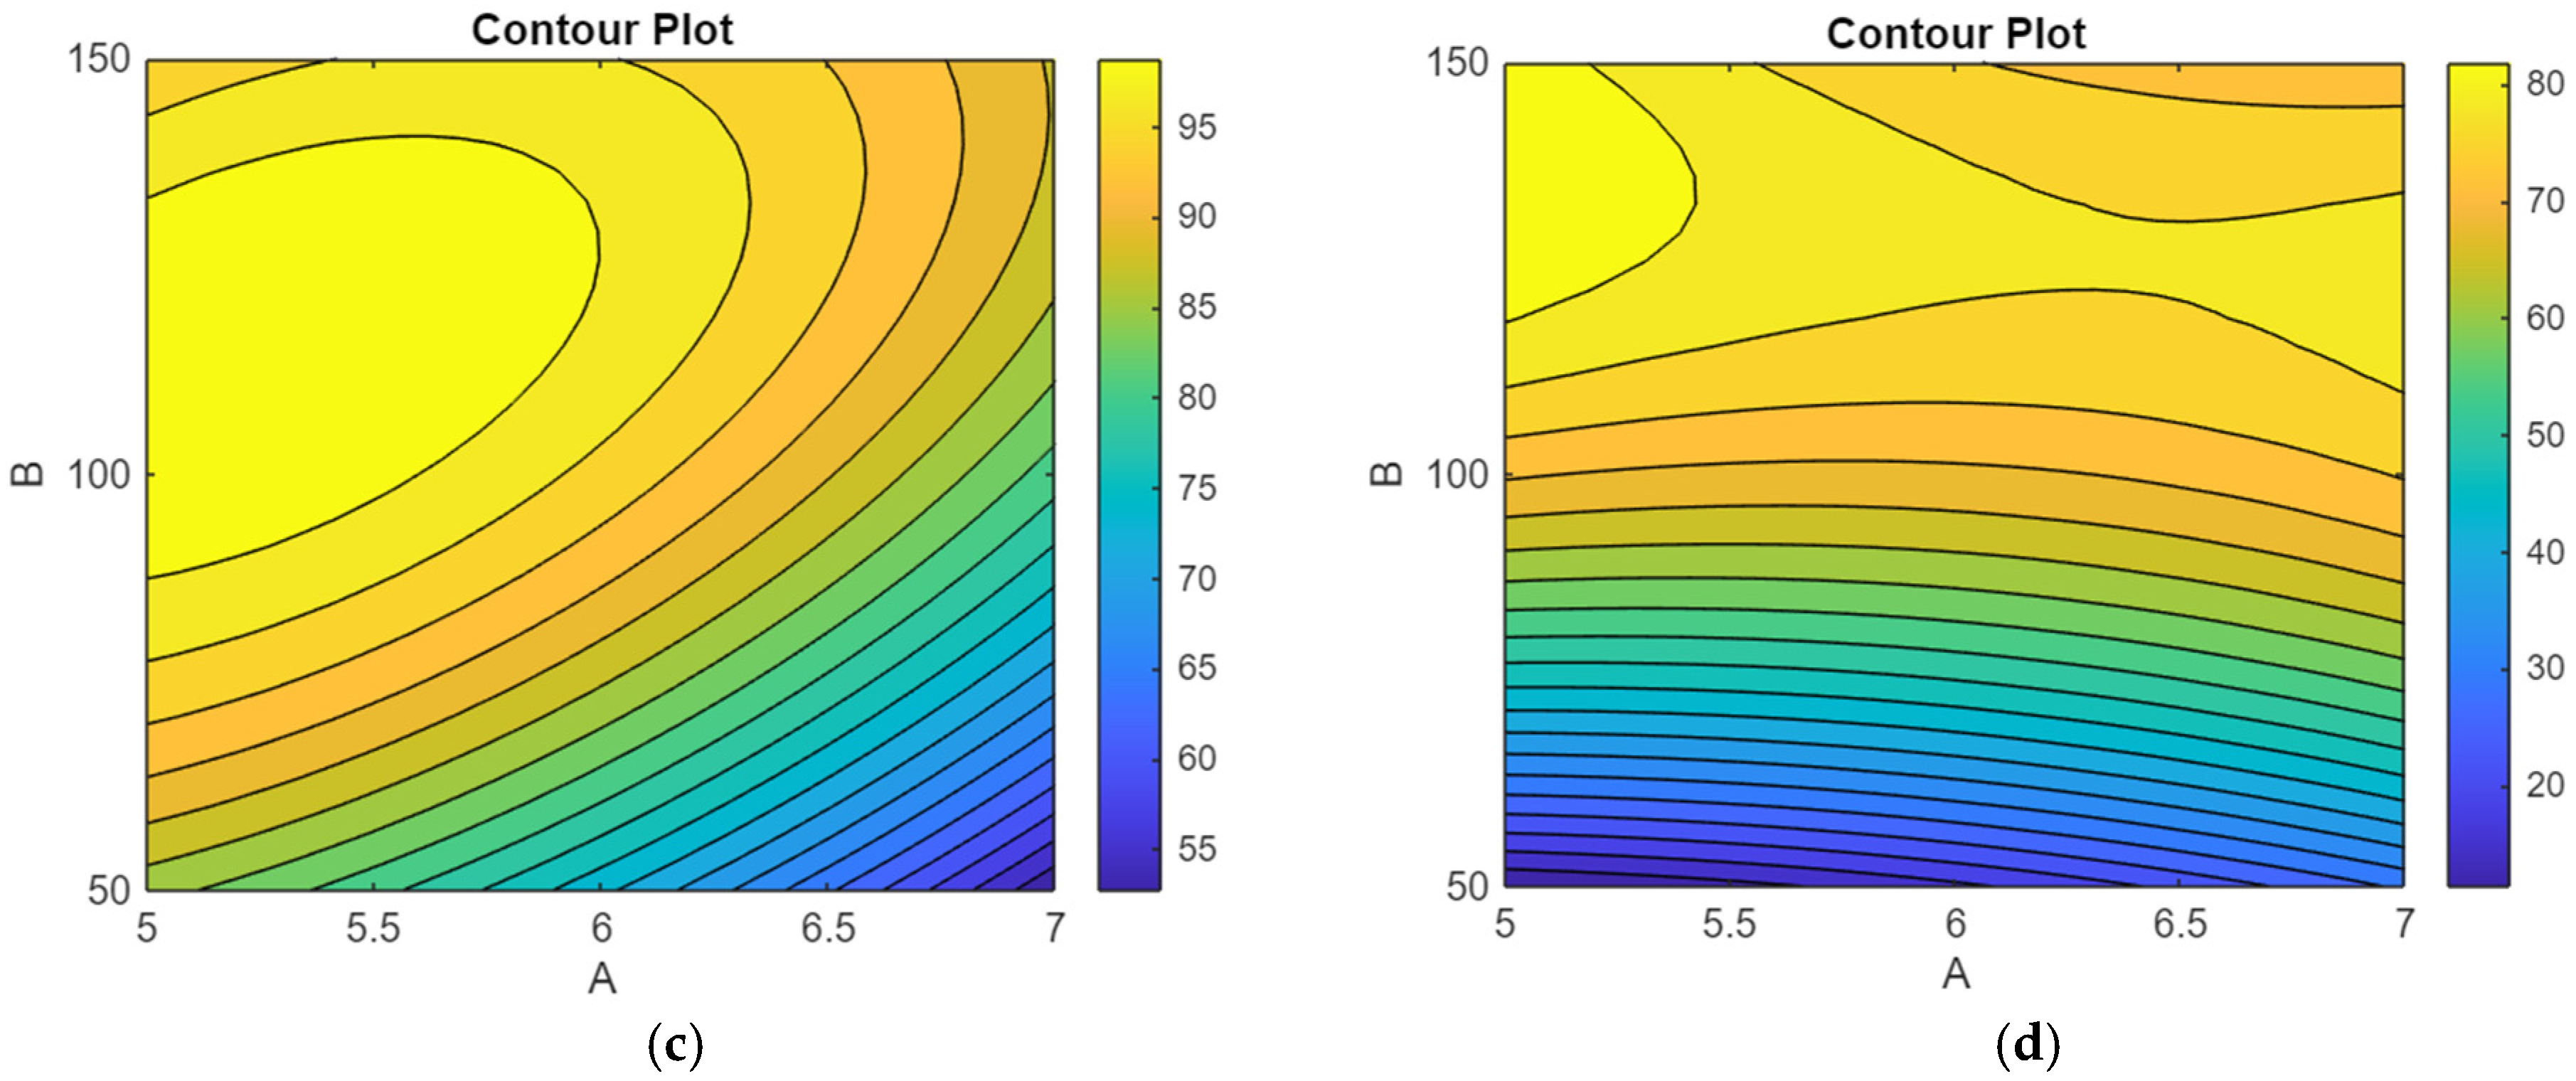
- BOD reduction (2c): Similar to turbidity, the gradient shifts from blue (~10–15%) to yellow (~75–80%), indicating a wider range of BOD removal effectiveness. The maximum approximate reduction is around 80%, with the lowest near 10%, emphasizing the influence of both variables.
- -
- COD reduction (2d): The reverse gradient from yellow (around 85–90%) in the bottom left to blue (around 10–15%) in the top right suggests that increasing A while decreasing B enhances COD removal efficacy up to approximately 88%, whereas the minimum reduction is near 12%.
3.2. Model Validation and Results (Application Outcomes and Interpretation)
- 1.
- Effectiveness of Citrullus lanatus as a Natural Coagulant:
- The positive coefficient for the intercept and the variables associated with pH and coagulant dose illustrate that increasing coagulant dosage and optimizing pH levels can significantly enhance pollutant removal.
- For example, the positive influence of B (coagulant dose) on turbidity and TSS reductions suggests that higher doses generally improve removal efficiencies for suspended solids and turbidity.
- 2.
- Pollutant-Specific Responses to Operational Variables:
- The interaction term (A:B) indicates that the combined effect of pH and dosage can either enhance or diminish removal performance depending on their specific values.
- The quadratic terms (A2, B2) imply that there are optimal levels of pH and dosage beyond which further increases may not lead to better removal and could potentially reduce efficiency.
- 3.
- Implications for Practical Application:
- The findings underscore that each pollutant responds differently to changes in operational parameters.
- For instance, achieving high turbidity removal may require a certain pH and coagulant dose, while BOD removal might be optimized at different conditions.
- 4.
- Guidance for Process Optimization:
- The results suggest that precise control over pH and coagulant dosage is crucial to maximize removal efficiencies.
- Since different pollutants have different optimal conditions, a balanced or multi-objective approach is necessary for comprehensive wastewater treatment.
- 1.
- Effectiveness of Cucumis melo as a Natural Coagulant:
- The coefficients indicate that adjusting pH and coagulant dosage can influence the removal efficiencies.
- For example, positive estimated coefficients for some parameters suggest that increasing pH or coagulant dose within certain ranges improves pollutant removal, especially for turbidity and TSS.
- 2.
- Pollutant-Specific Responses:
- The interaction term (A:B) and quadratic terms suggest that the relationship between the operational conditions and pollutant removal is nonlinear.
- Different pollutants respond differently, e.g., turbidity and TSS may be more effectively reduced at specific pH and dosage combinations, while BOD and COD may require different conditions for optimal removal.
- 3.
- Process Optimization Implications:
- The variations in estimated effects show that the optimal treatment conditions are pollutant-specific; for some pollutants, higher coagulant doses and certain pH levels lead to better removal, while for others, lower doses or different pH levels are preferable.
- Balancing these effects is critical—there is no single set of optimal conditions for all pollutants simultaneously.
- 4.
- Practical Application in Wastewater Treatment:
- The data imply that by carefully controlling pH and coagulant dosage, engineers can tailor the coagulation process to maximize removal efficiency for targeted pollutants.
- This flexibility allows for designing treatment protocols that can prioritize certain pollutants based on specific water quality goals.
Model Performance and Validity (Table 2 and Table 3)
3.3. Residual Plots
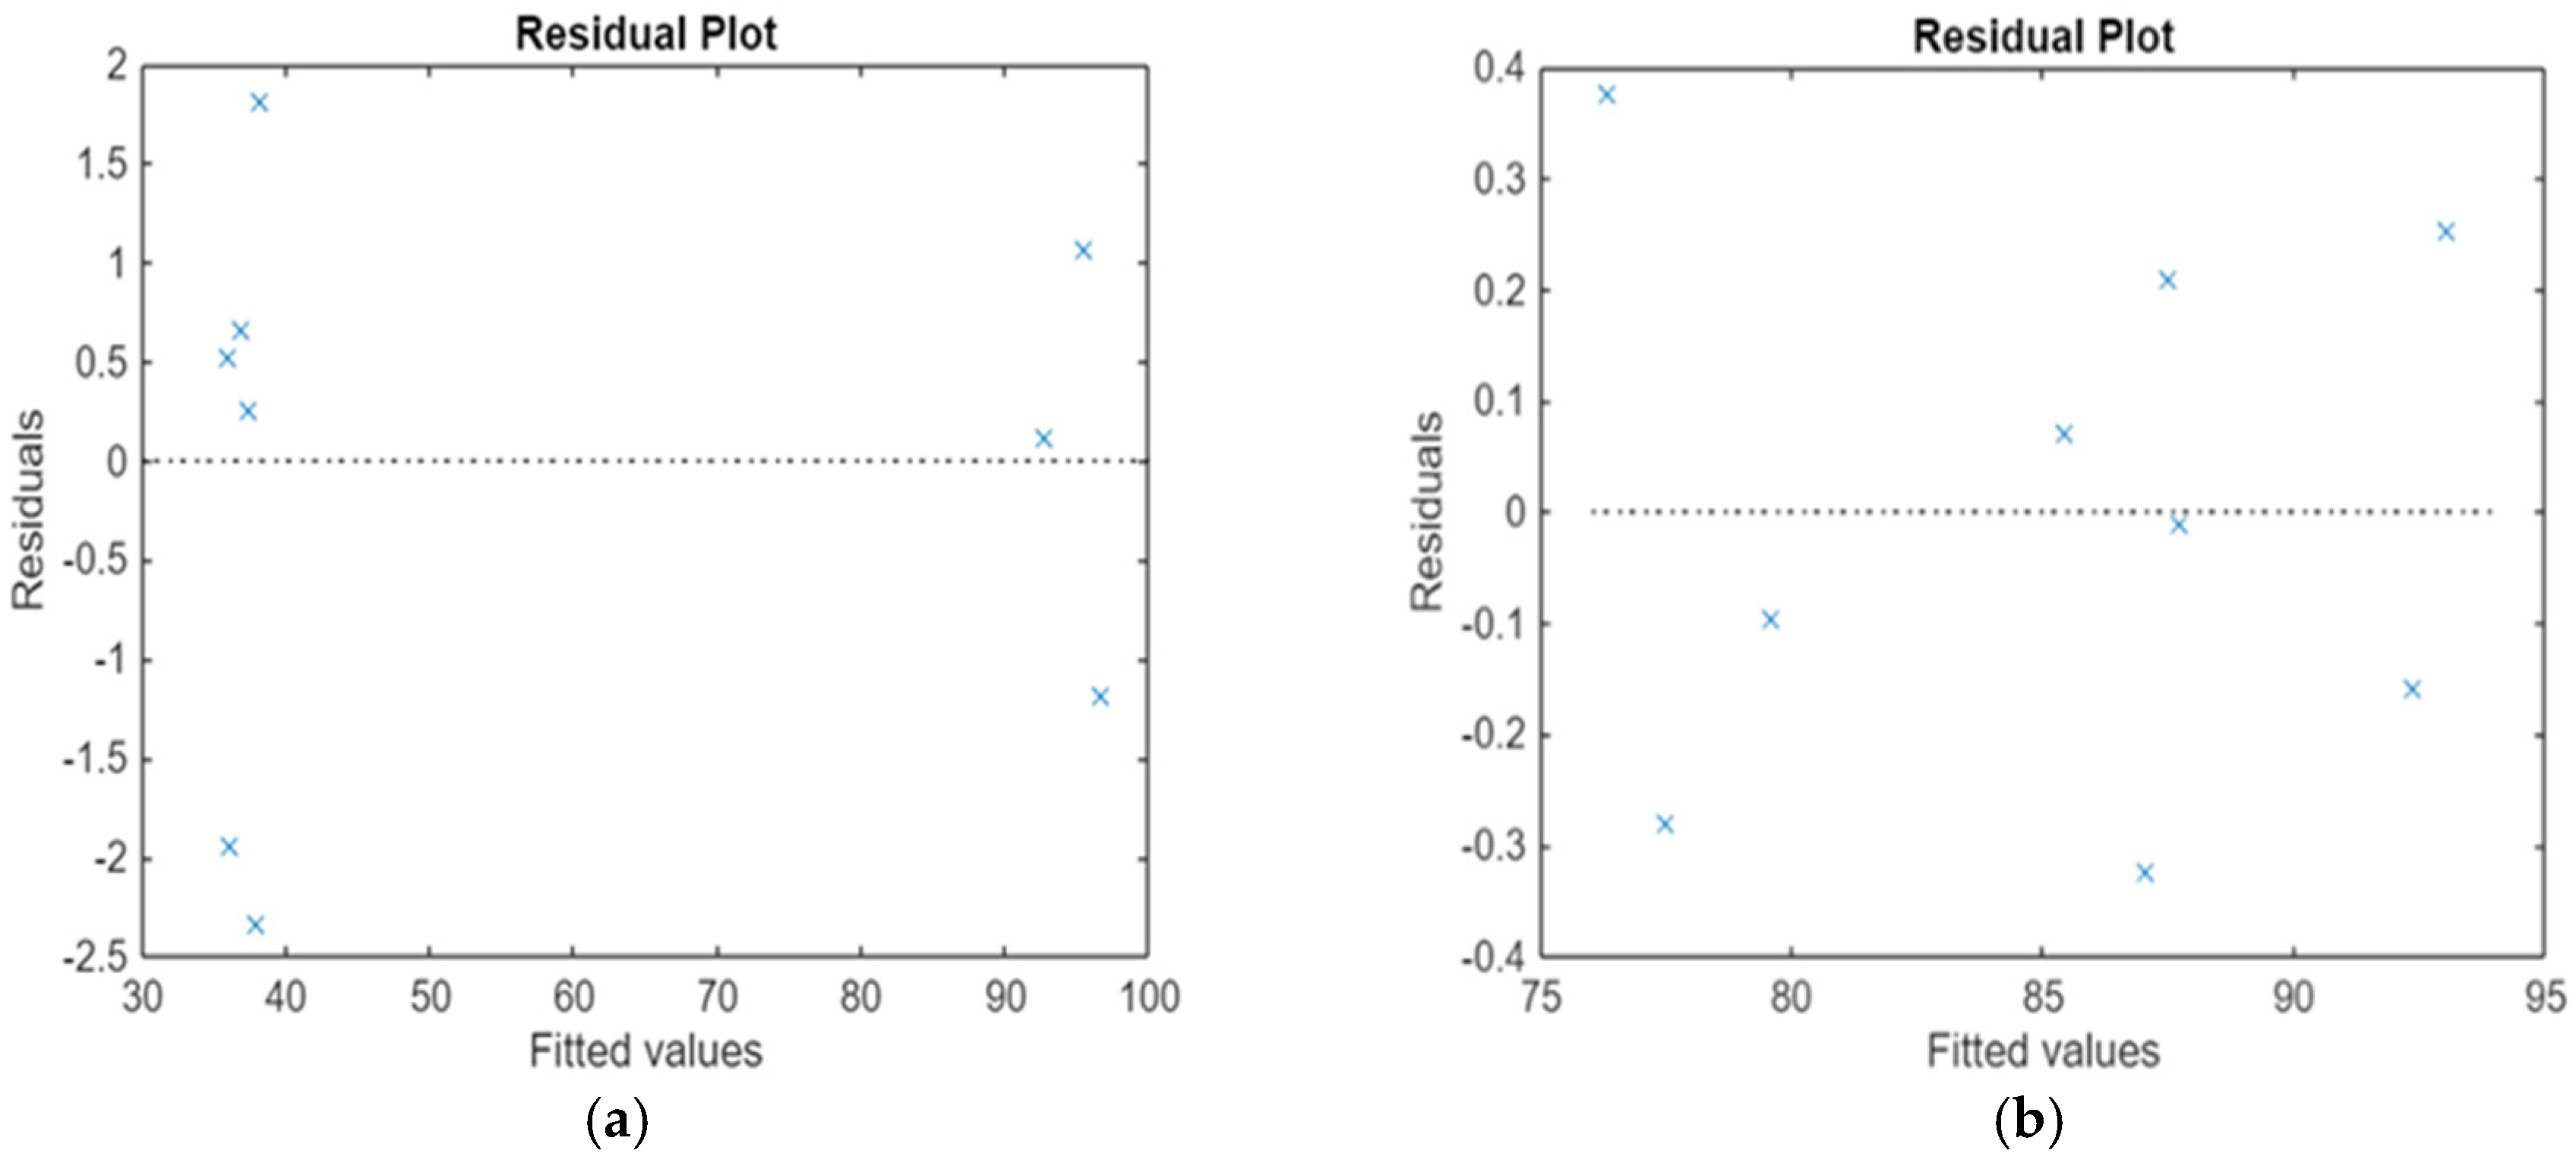
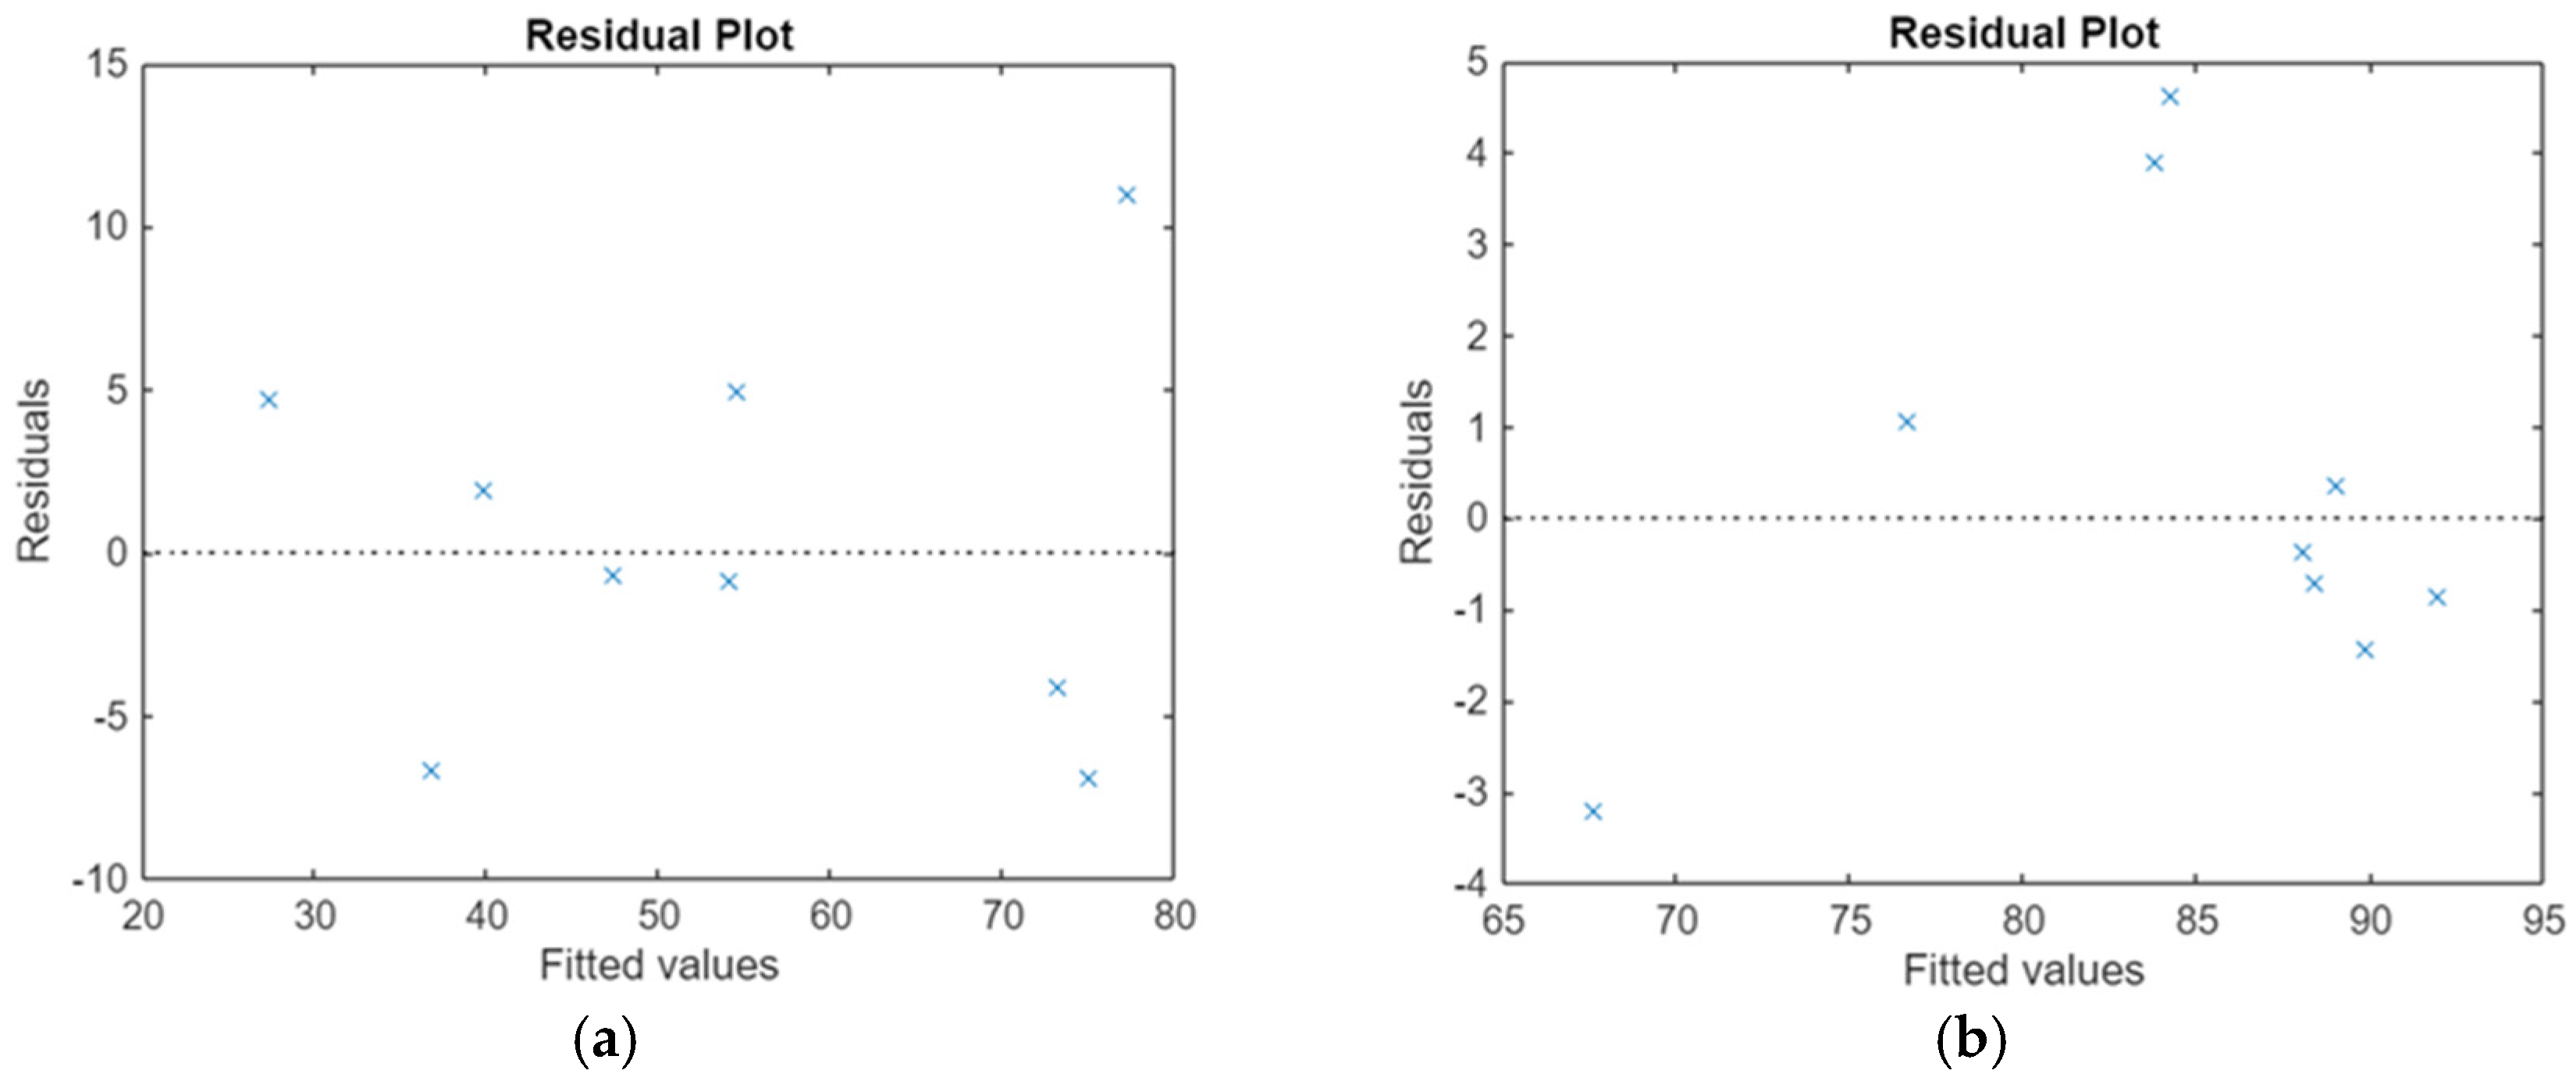
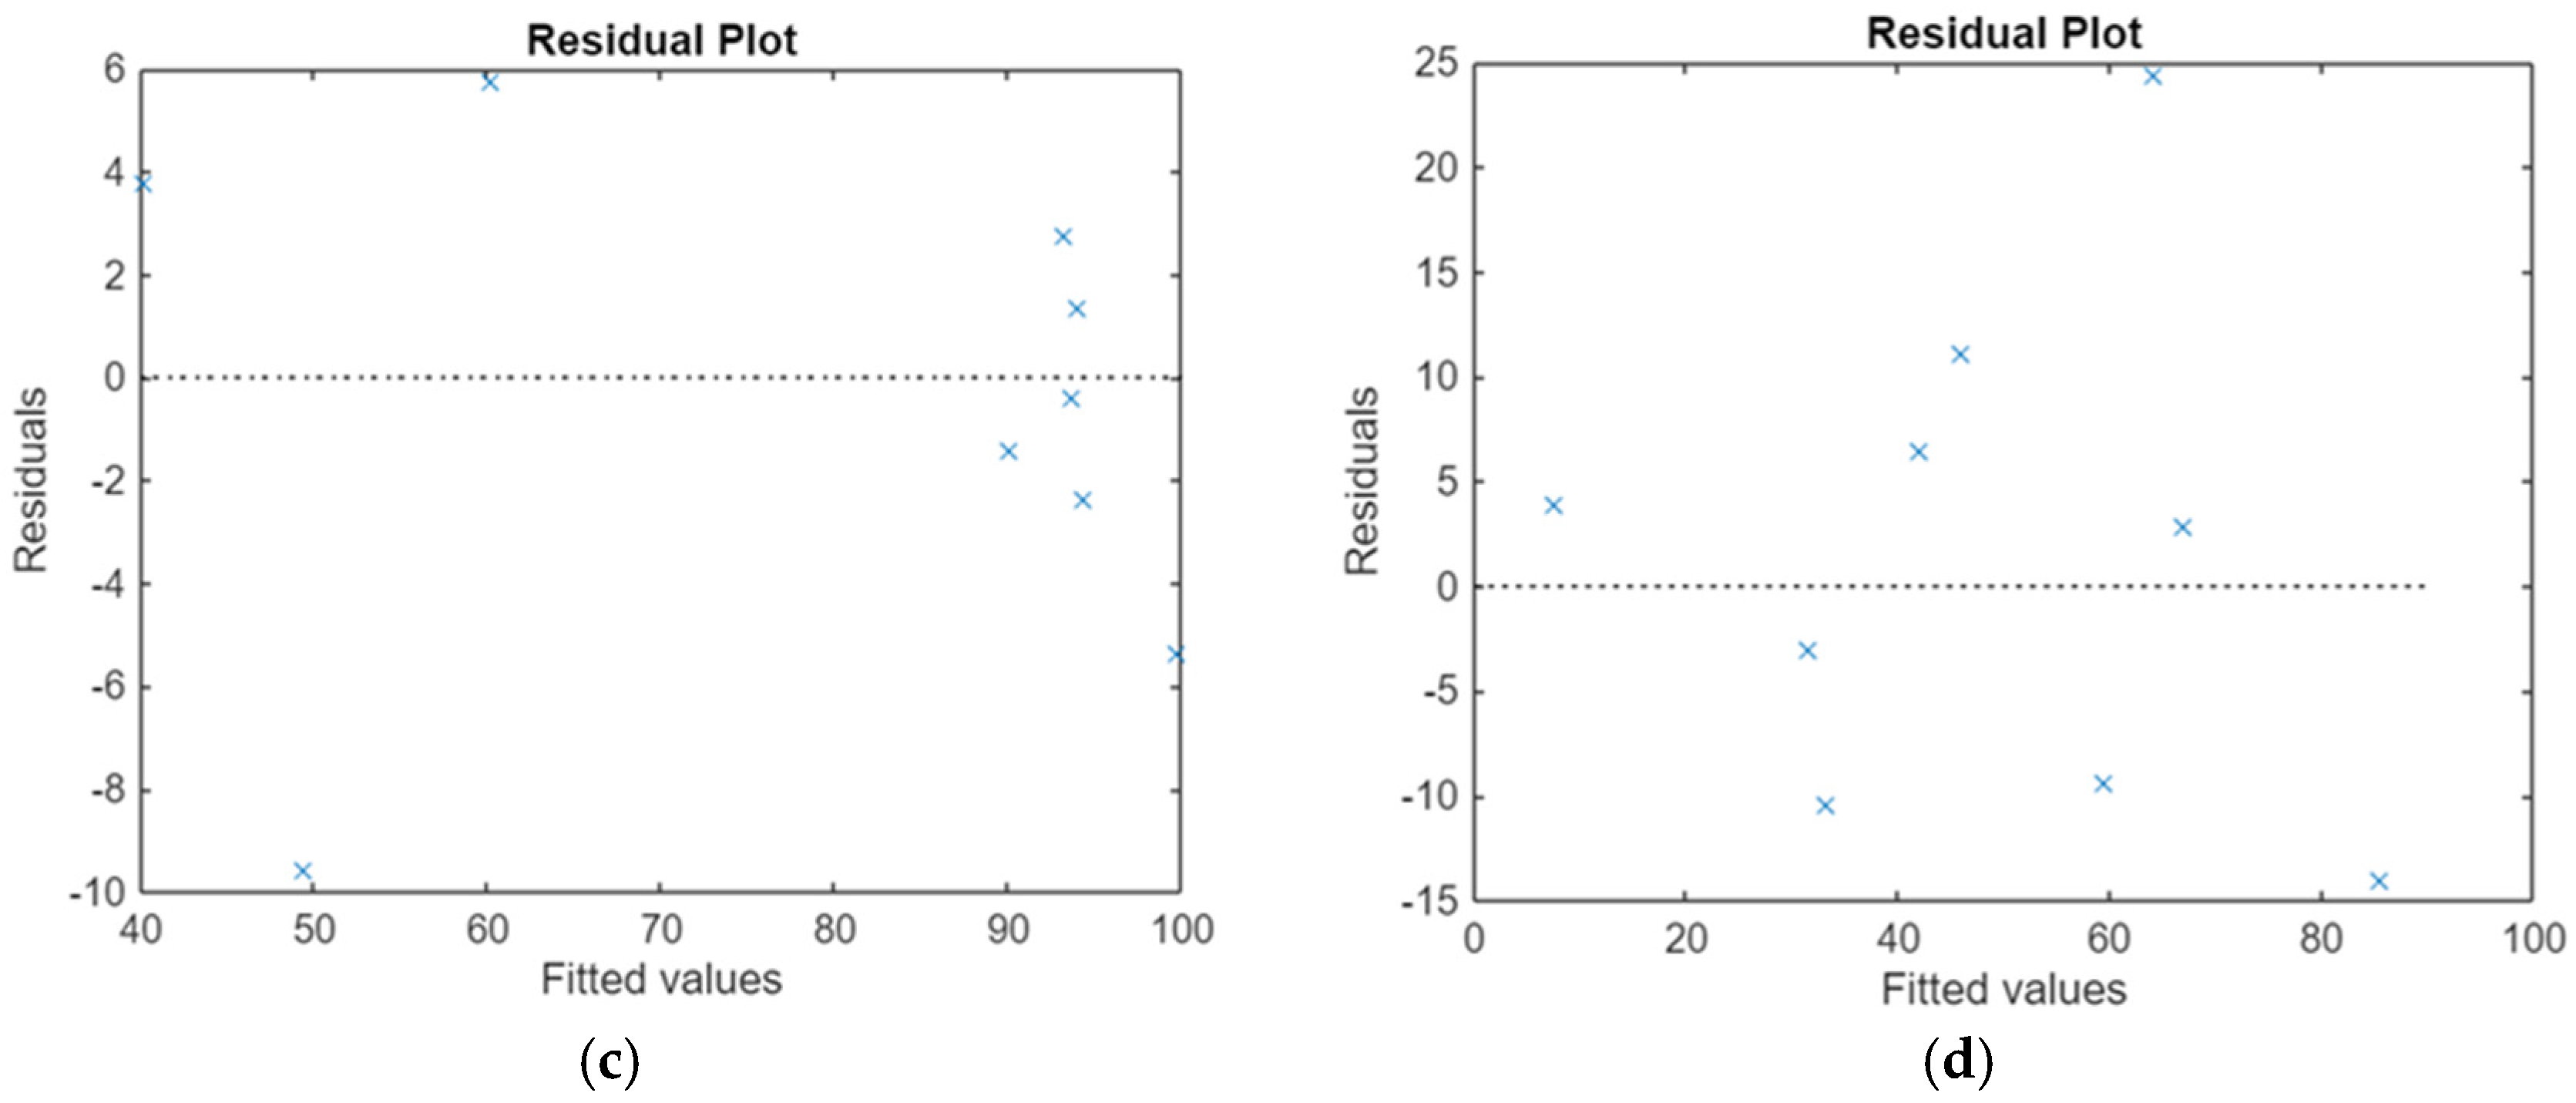
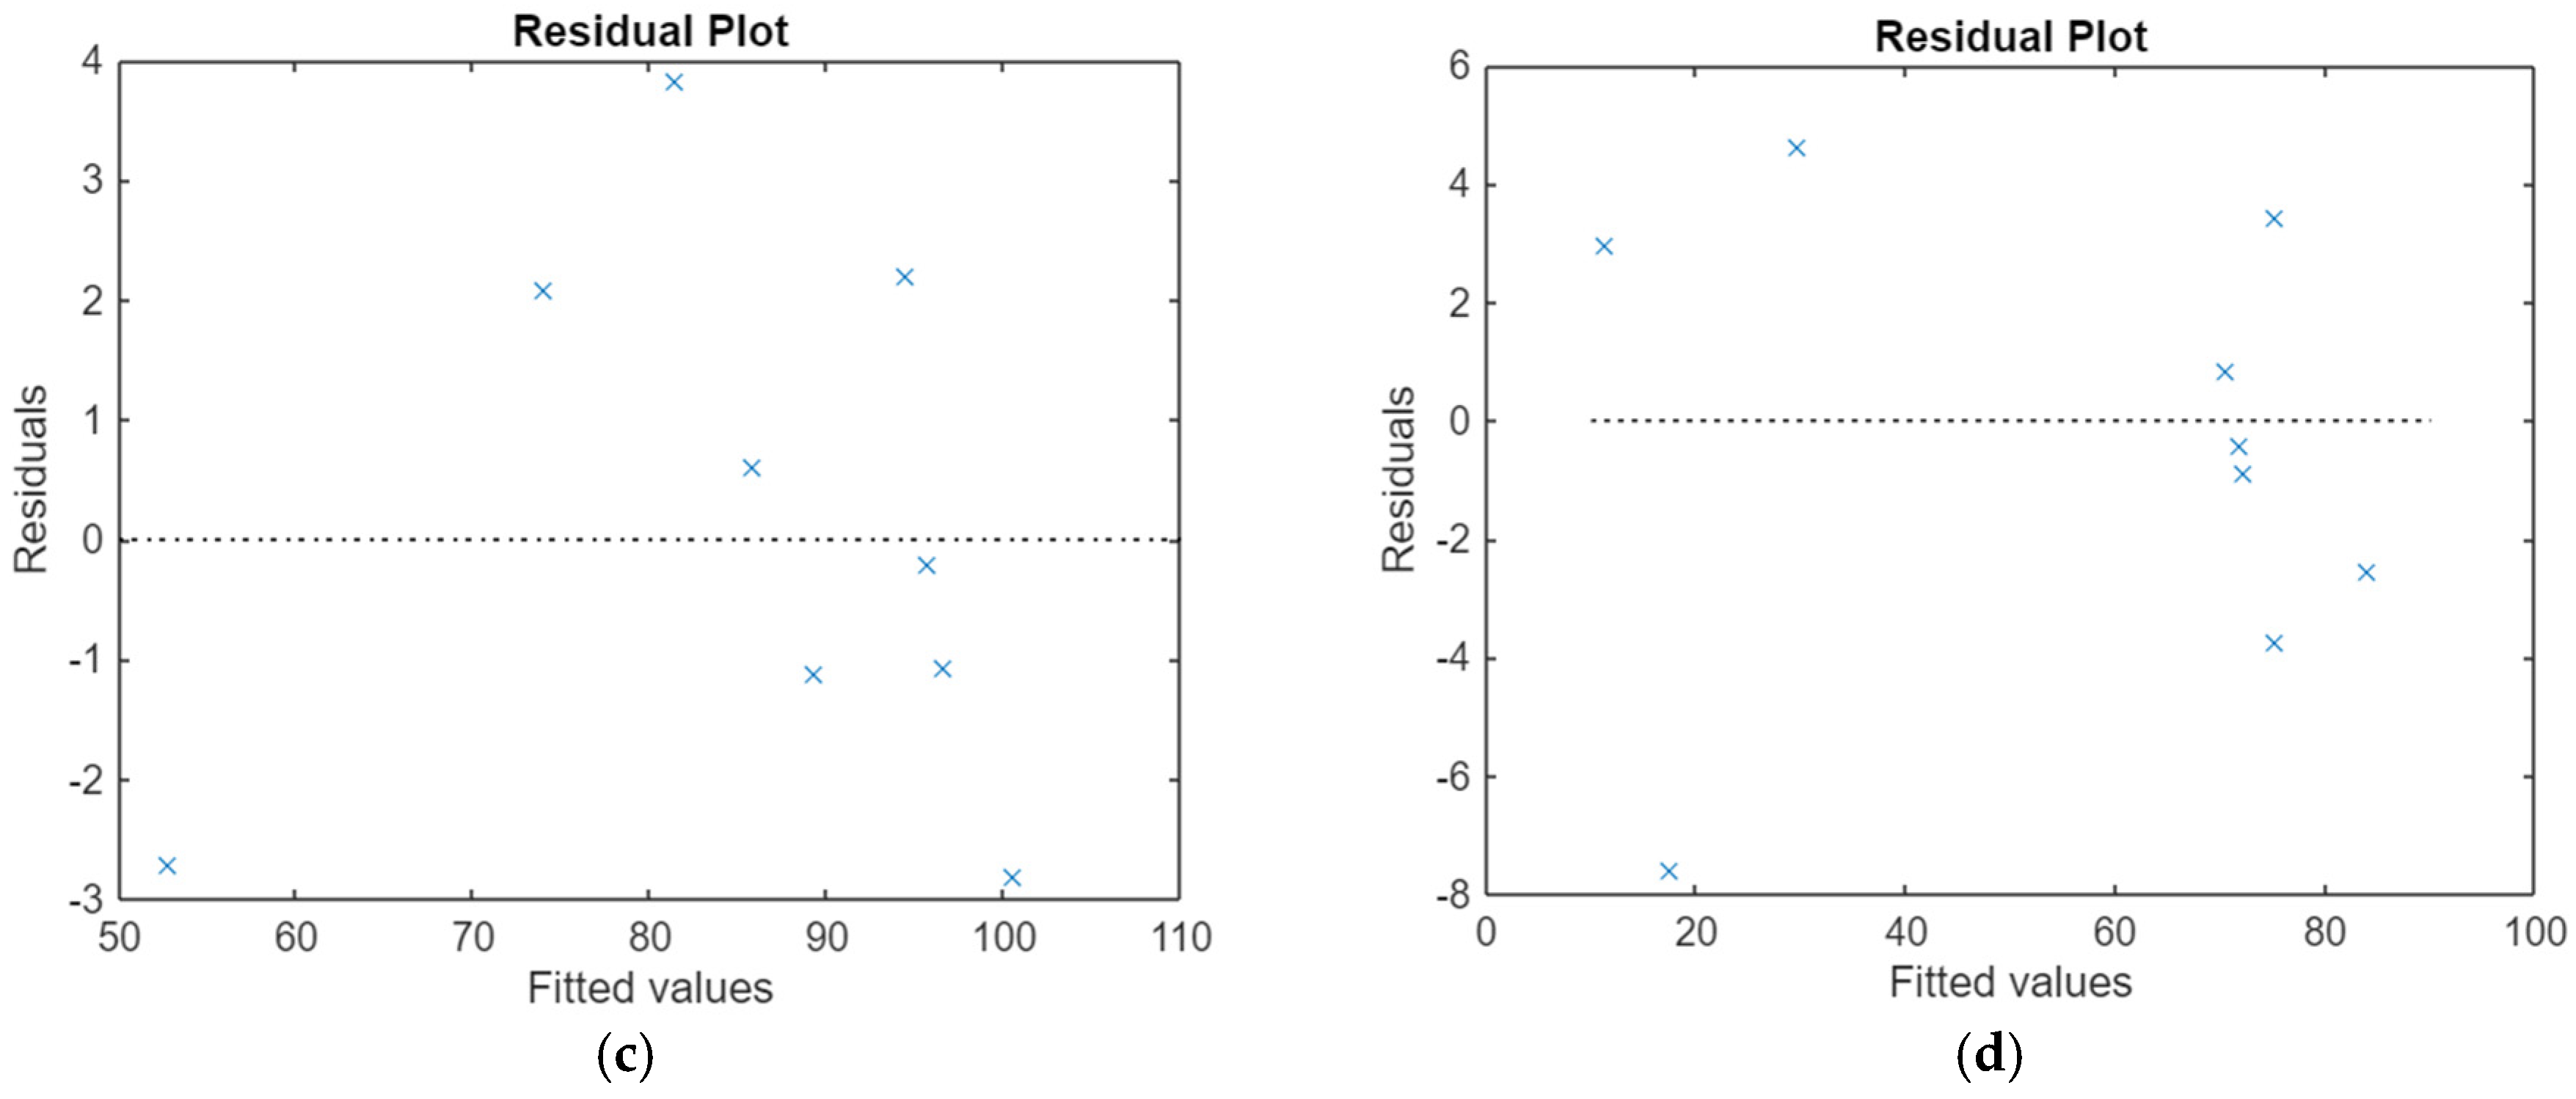
Residual Analysis (Figure 3 and Figure 4)
3.4. Optimization
3.4.1. Single Optimization
- 1.
- Identify Operational Limits:
- pH Range: Usually, pH adjustment is constrained by the buffering capacity of water and corrosion considerations. The typical pH range in coagulation processes is 5.0 to 9.0.
- Coagulant Dosage: Based on experimental data and safety limits, the dosage should be within a feasible range (e.g., 10 mg/L to 100 mg/L).
- 2.
- Chemical and Process Constraints:
- Maximum Dosage: To prevent chemical wastage or sludge overload, set upper bounds based on laboratory or pilot plant data.
- pH Adjustment Limits: Constraints on pH adjustment are based on the neutralization capacity and cost (e.g., limits for acid/base addition).
- 3.
- Physicochemical Validation:
- This can be achieved by using literature values or pilot data to set bounds for pollutant removal rates and operational parameters.
- 4.
- Environmental and Regulatory Constraints:
- The main aim is to ensure that effluent parameters meet regulatory standards for discharge (e.g., maximum allowable COD, TSS, BOD).
- 5.
- Technical and Economic Constraints:
- At this stage the objective is to incorporate constraints on energy usage, chemical consumption, and sludge production limits.
- 1.
- Pollutant-Specific Optimal Conditions: Each parameter optimization curve suggests distinct operational conditions:
- Turbidity removal (5a): Achieves optimal performance at a pH around 6.65 with a moderate coagulant dose (~60 mg/L), indicating that near-neutral pH enhances aggregation of colloidal particles effectively.
- TSS removal (5b): Shows a higher optimal coagulant dosage (~61 mg/L) with a similar pH, pointing to the need for increased chemical input to target suspended solids successfully.
- BOD removal (5c): The optimal conditions favor a slightly lower pH (~5) and coagulant dose (~50 mg/L), implying organic matter removal benefits from more acidic conditions.
- COD removal (5d): Finds its optimum near pH 6.93 with a higher coagulant dose (~64 mg/L), suggesting that organic compound removal may require slightly alkaline conditions.
- 2.
- Trade-offs and Conflicting Trends: The diverse optimal conditions underscore inherent conflicts:
- Higher coagulant doses favor TSS and COD removal but may not be optimal for BOD.
- Slight variations in pH influence different pollutants differently: acidic for BOD, neutral or slightly alkaline for TSS and COD.
- 3.
- Implications for Operational Strategies: The clear differences in optimal conditions suggest that treatment facilities aiming to target multiple pollutants need to balance these parameters or prioritize certain removals based on water quality goals. The visual data provide practical reference points for process tuning, emphasizing that a one-size-fits-all approach may be suboptimal.
- 4.
- Validation of Natural Coagulants’ Effectiveness: The optimization results demonstrate that Citrullus lanatus can achieve significant pollutant reductions under specific and tenable conditions, reinforcing its potential as a sustainable, eco-friendly alternative to conventional chemical coagulants.
Single Objective Optimization Analysis
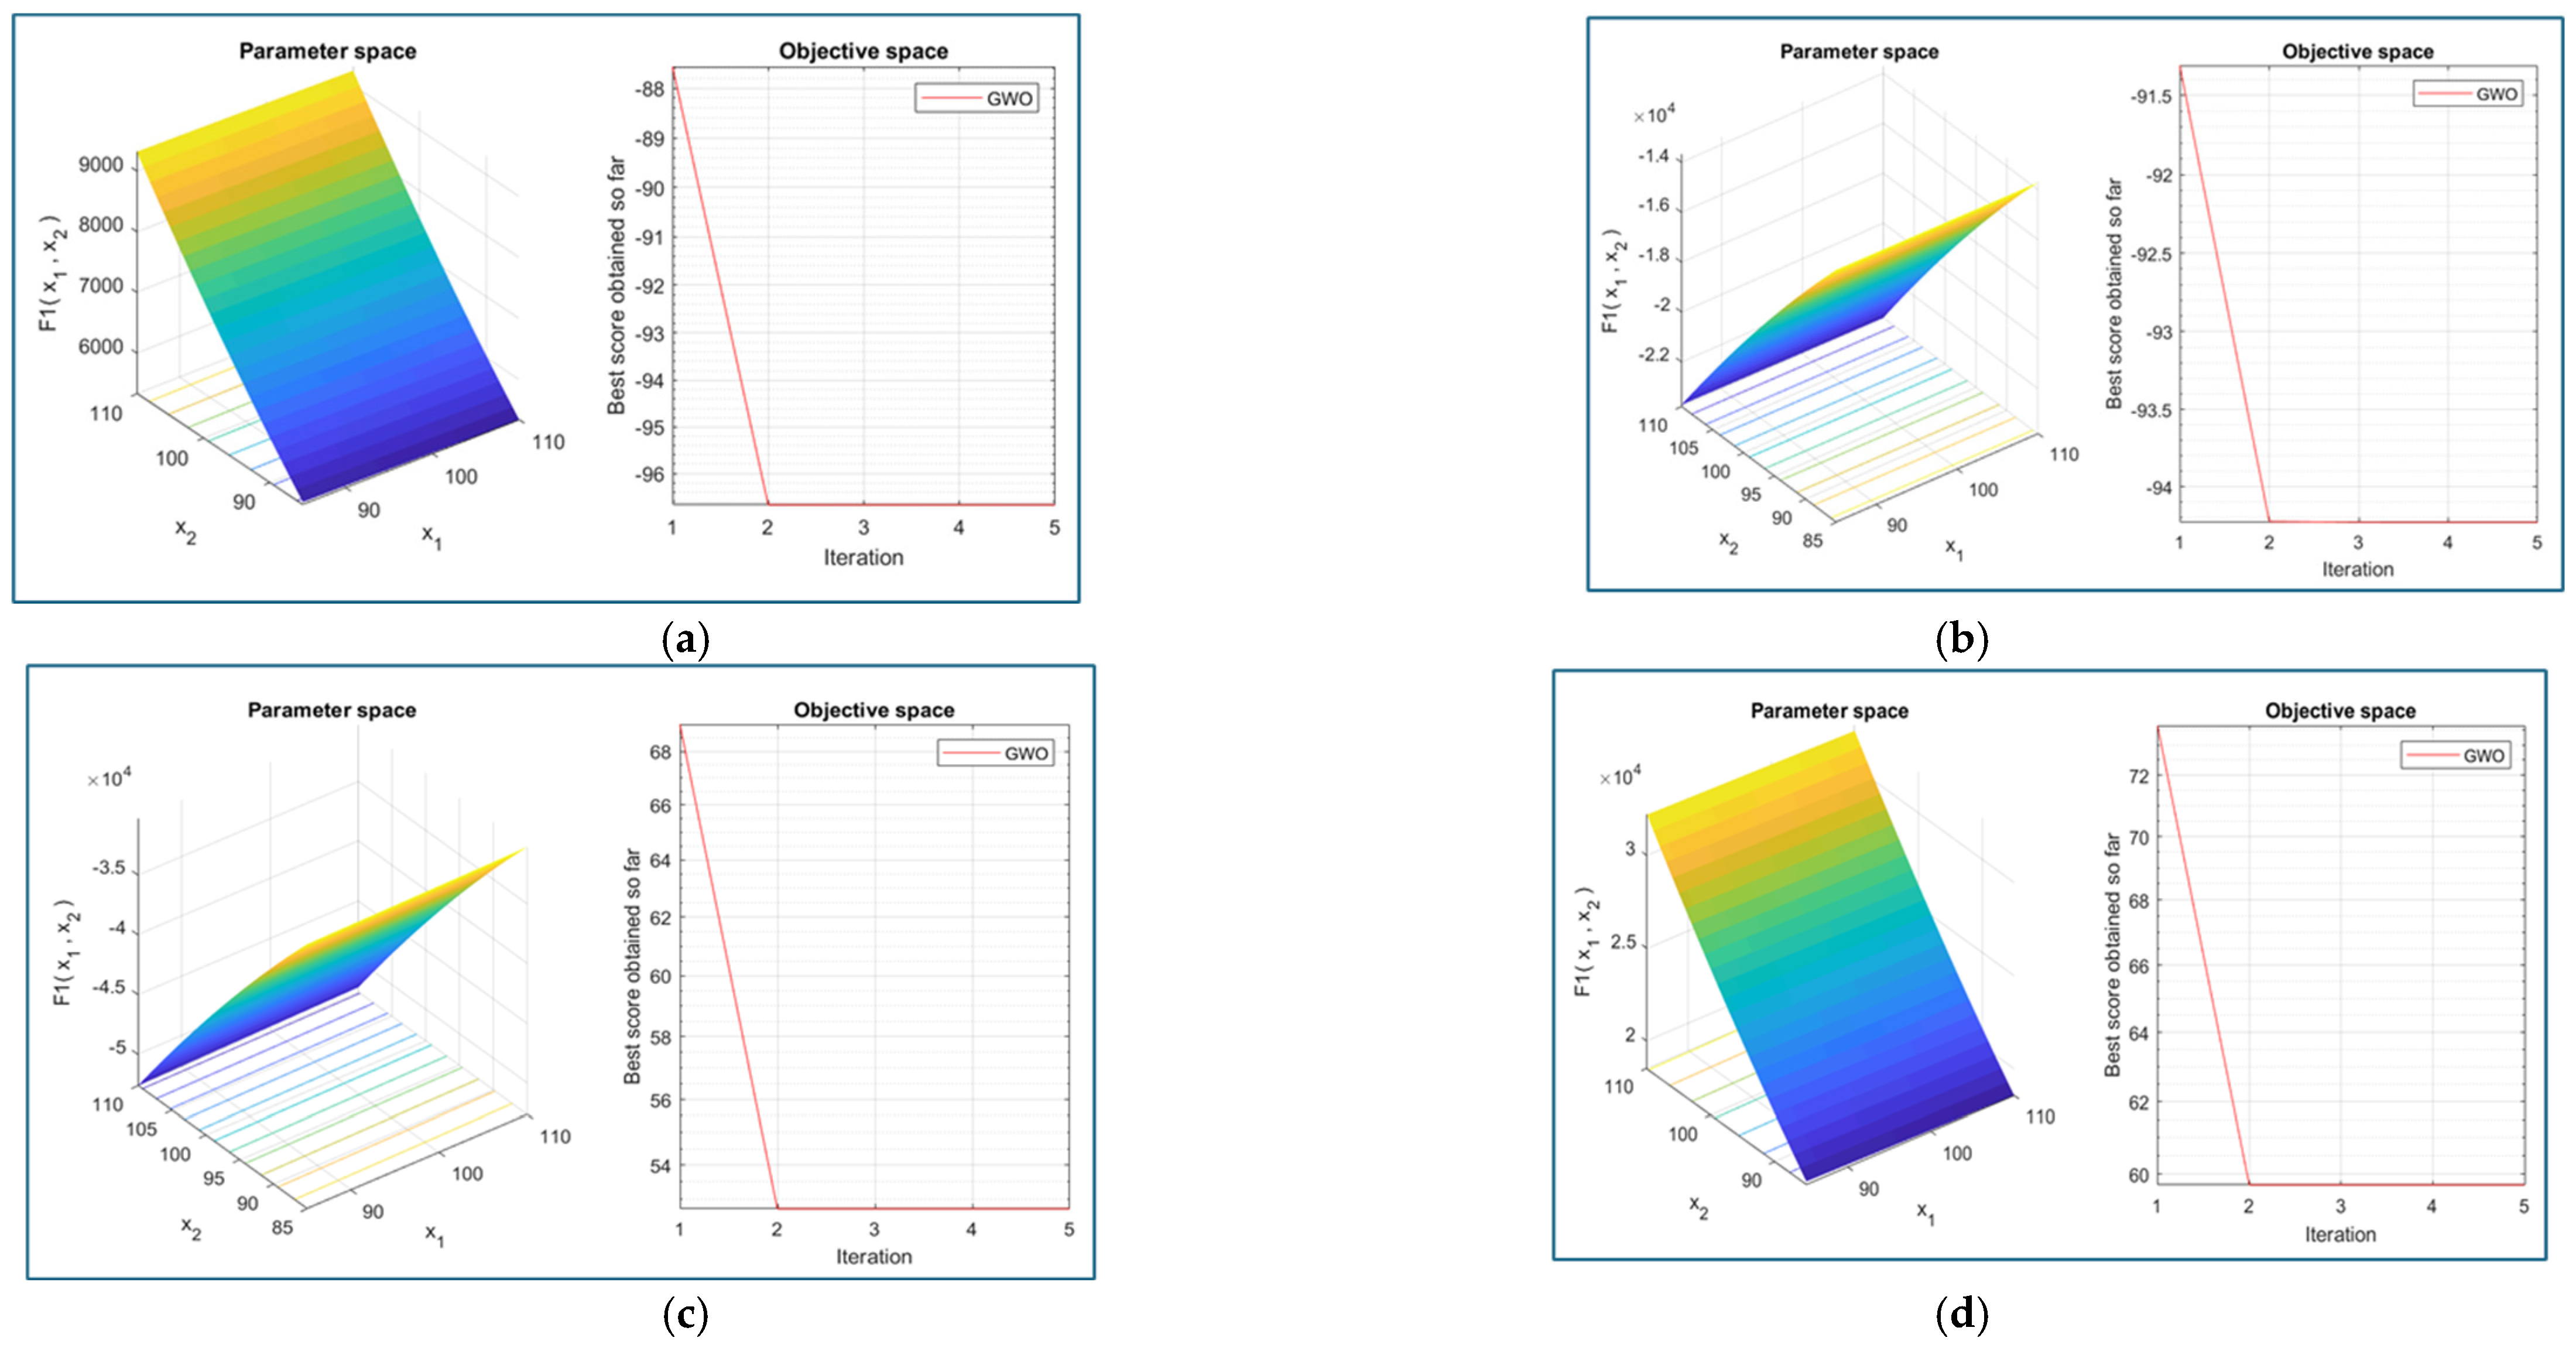
Single Objective Optimization Results
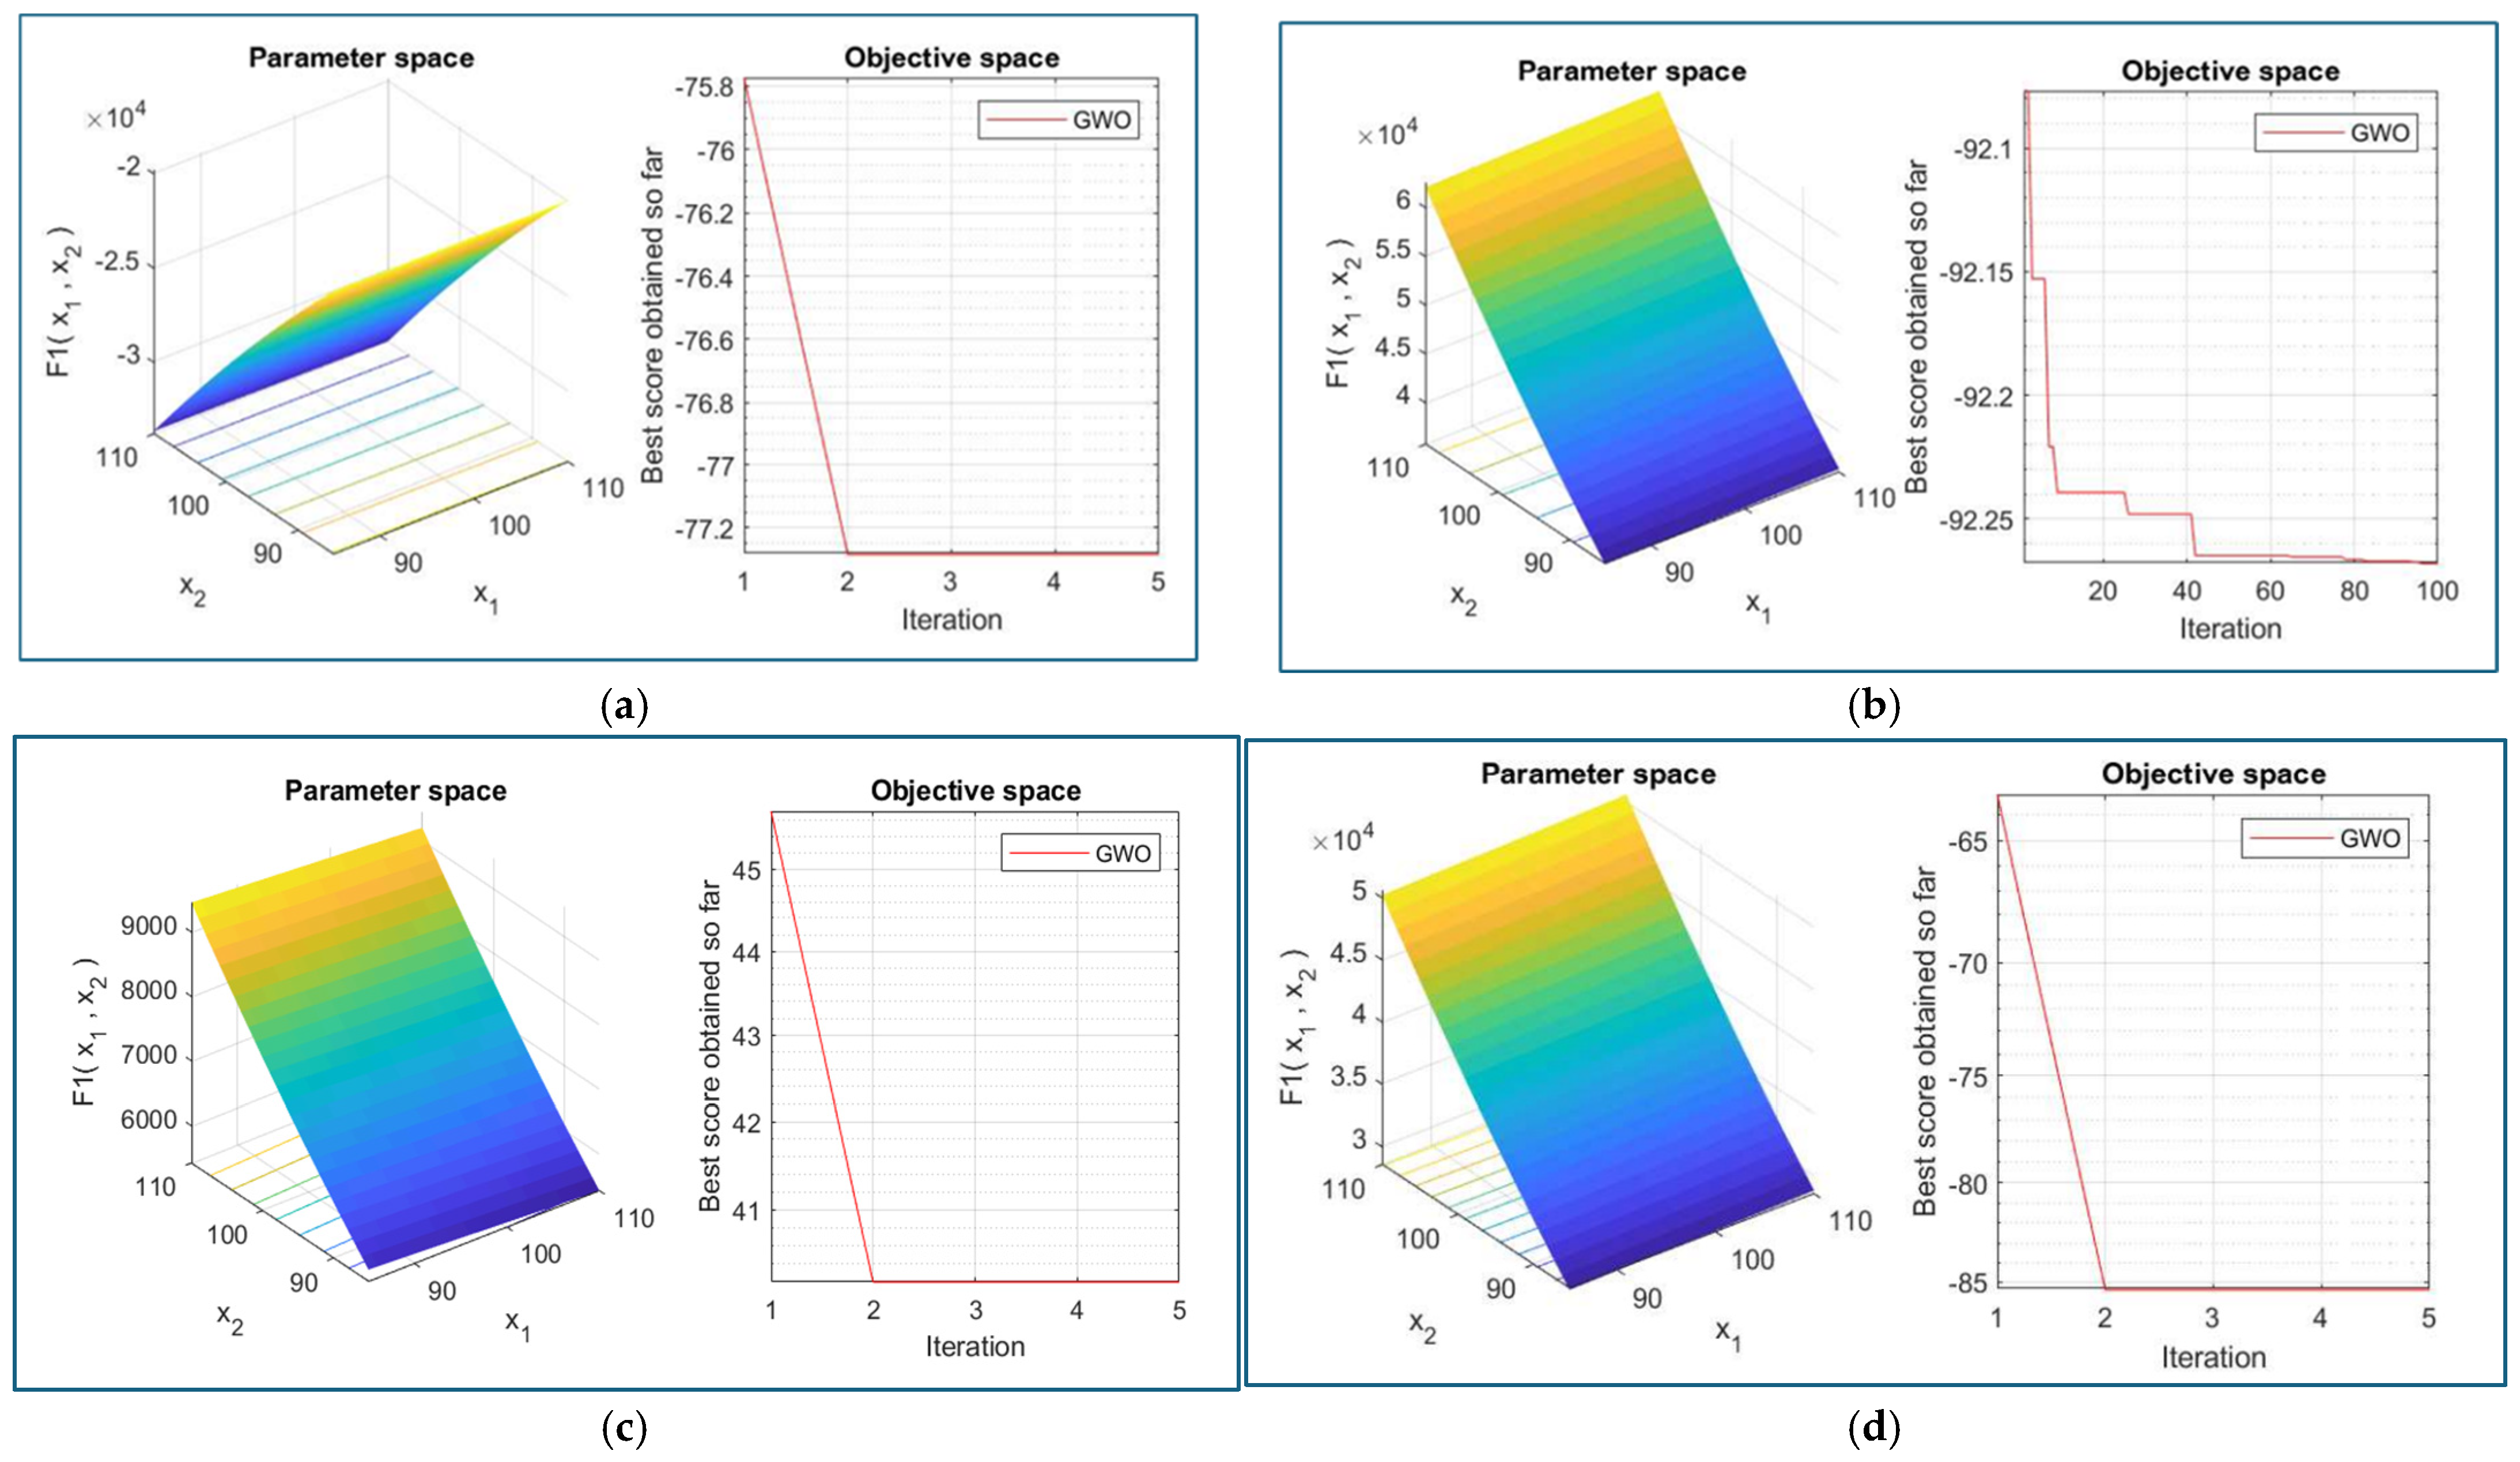
- Distinct Optimal Conditions for Different Parameters: The optimization results demonstrate that each pollutant exhibits a unique set of optimal conditions. For example, turbidity and TSS reductions achieve their peaks at near-neutral pH values (~5.99 to 6.36) with relatively moderate coagulant dosages (around 54–72 mg/L). Conversely, BOD and COD removals reach their optimal at slightly different pH levels and dosage parameters, reflecting the multifaceted nature of coagulation mechanisms.
- Trade-offs and Conflicting Trends: The varied optimal points highlight inherent trade-offs; conditions favoring maximal turbidity and TSS removal may not be optimal for BOD and COD reduction, which are affected differently by pH and coagulant dosage. For instance, while a pH around 6.36 optimizes turbidity removal, BOD reduction appears to favor lower pH values (~5). These conflicts suggest that a single set of conditions cannot simultaneously maximize all pollutant removals, underscoring the need for multi-objective balancing.
- Relationship Between Coagulant Dosage and Removal Efficiency: Generally, higher coagulant dosages correlate with greater removal efficiencies up to a certain point, beyond which additional dosage yields diminishing returns or potential destabilization. The optimized points reflect a balance where a sufficient chemical dose achieves effective pollutant aggregation without unnecessary excess that could increase cost or sludge production.
- Implications for Process Design: The visual trends in Figure 6 serve as practical guidelines for operational parameter setting. Operators aiming for targeted pollutant removal can tune pH and coagulant dosage based on these results, considering the specific water quality objectives and operational constraints.
Single Objective Optimization Discussion (Figure 5 and Figure 6; Table 7 and Table 8)
3.4.2. Multi-Objective Optimization
Multi-Objective Optimization by Coagulation Using Cucumis melo Coagulant
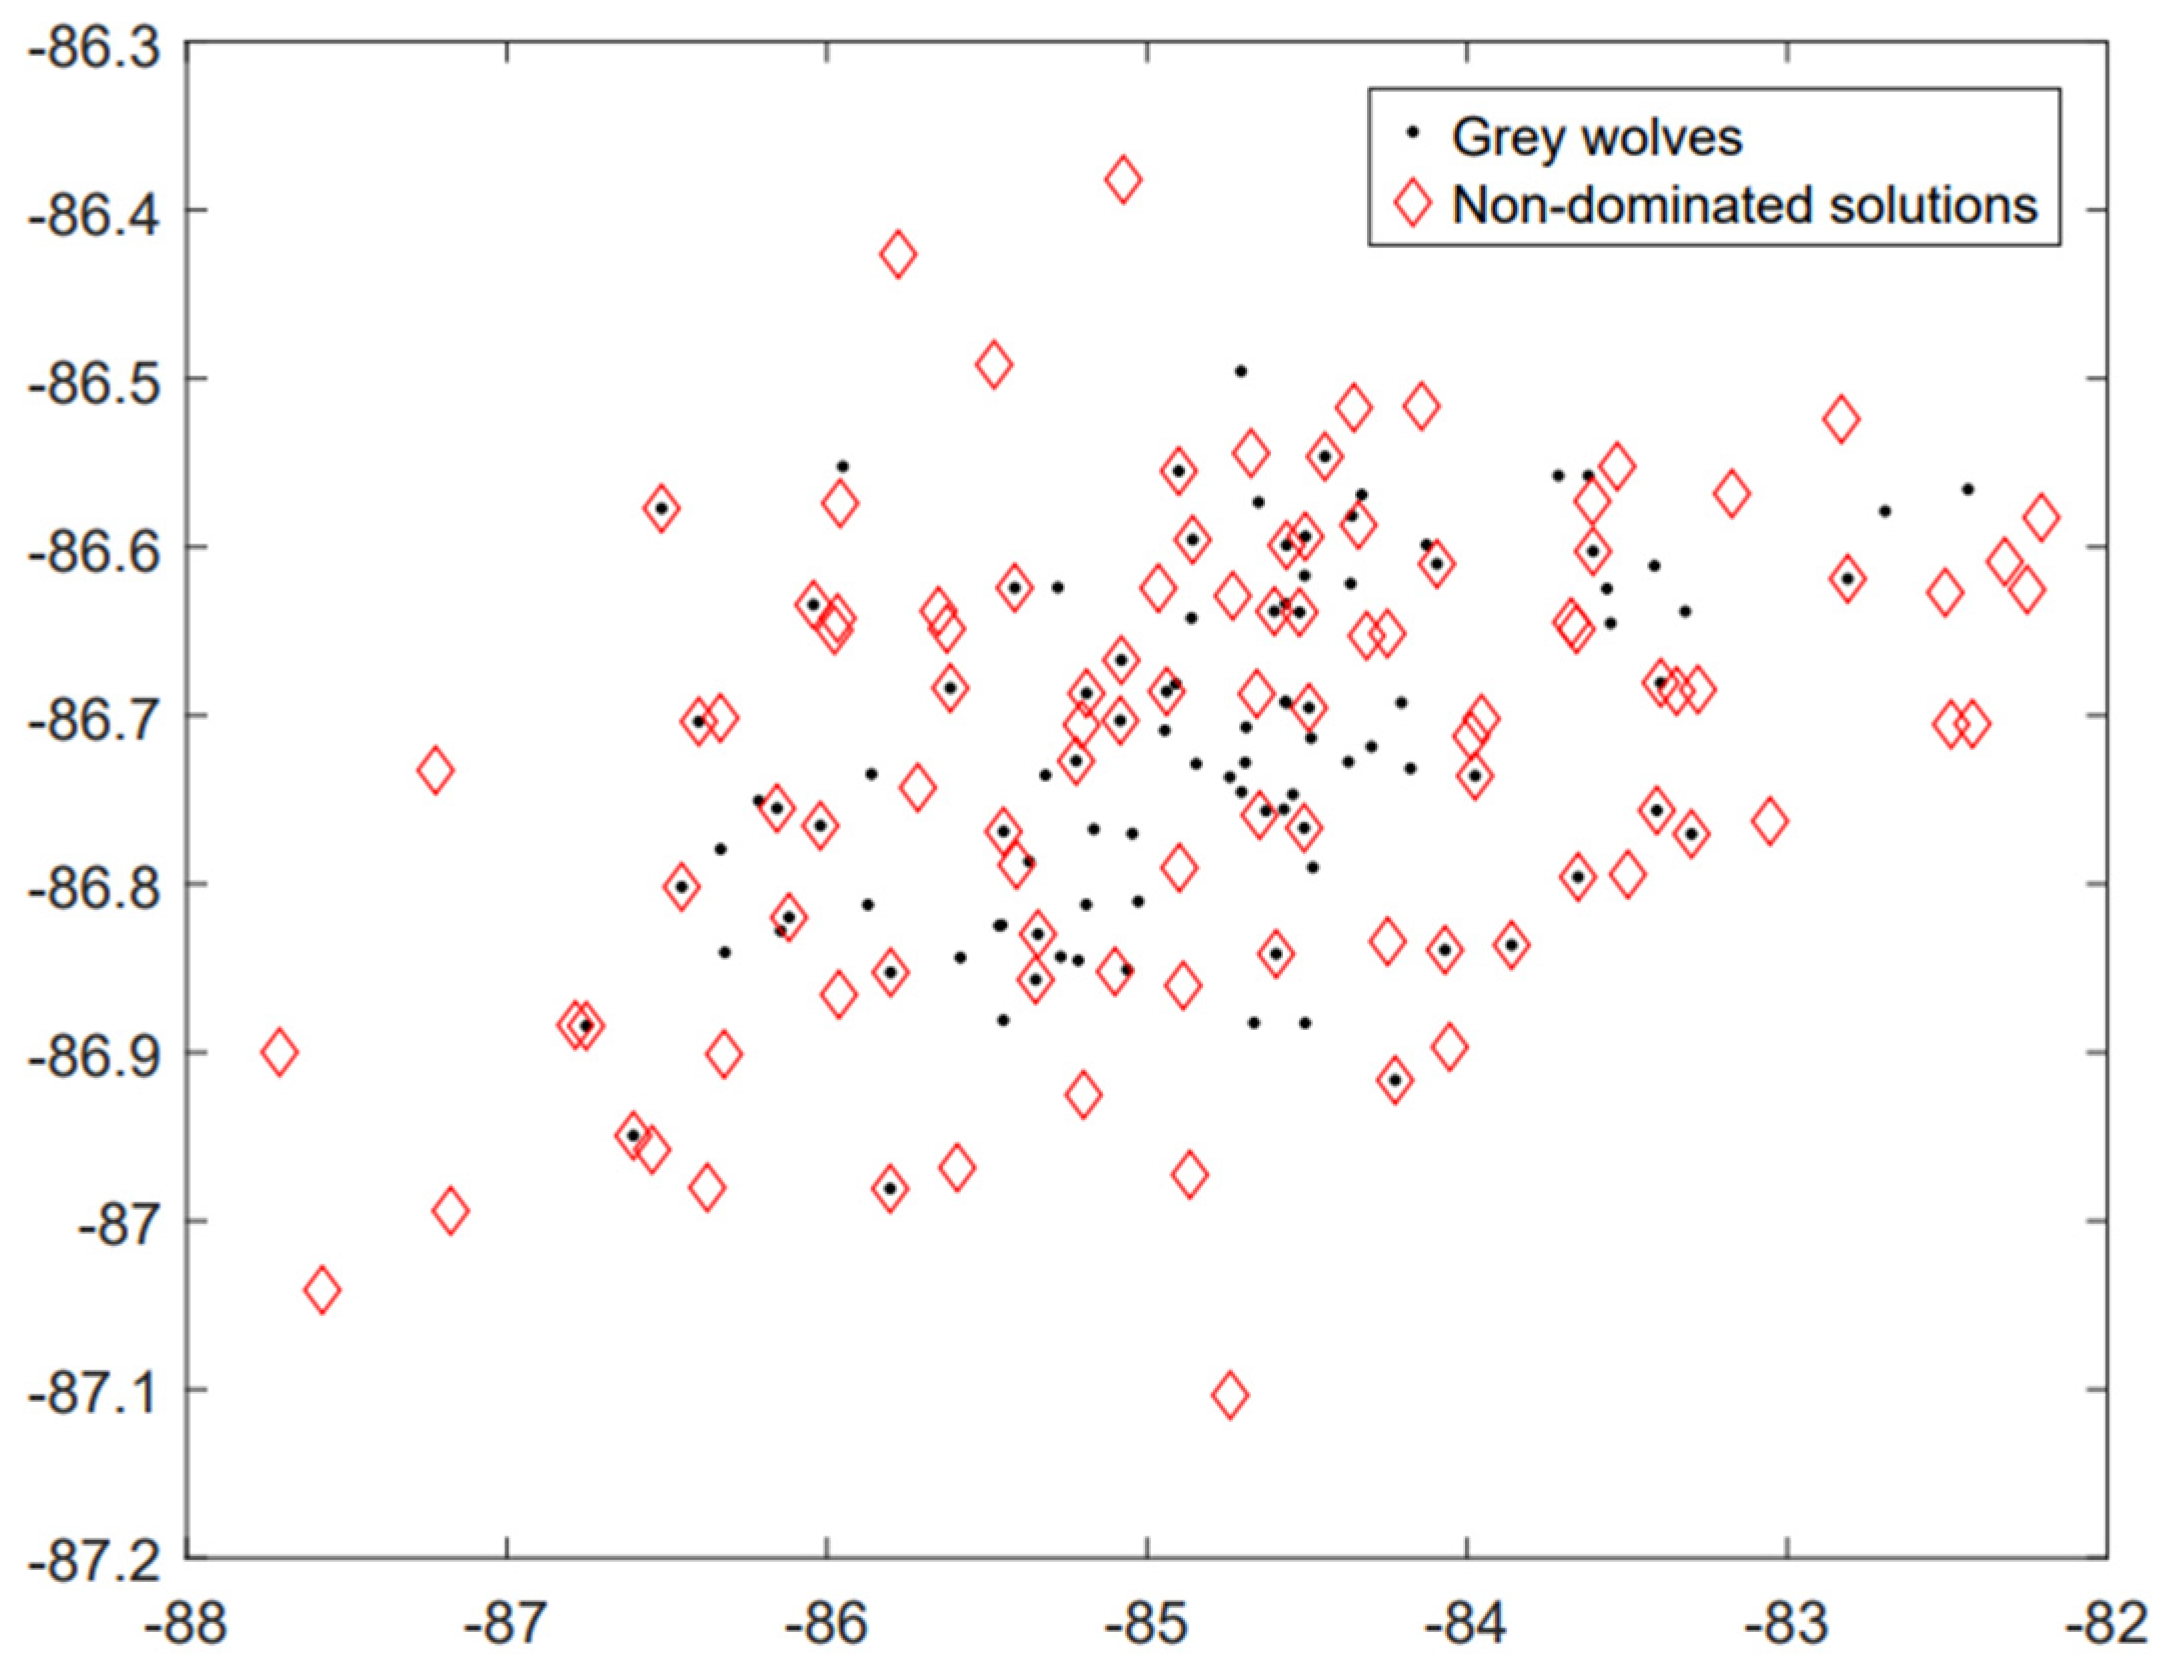
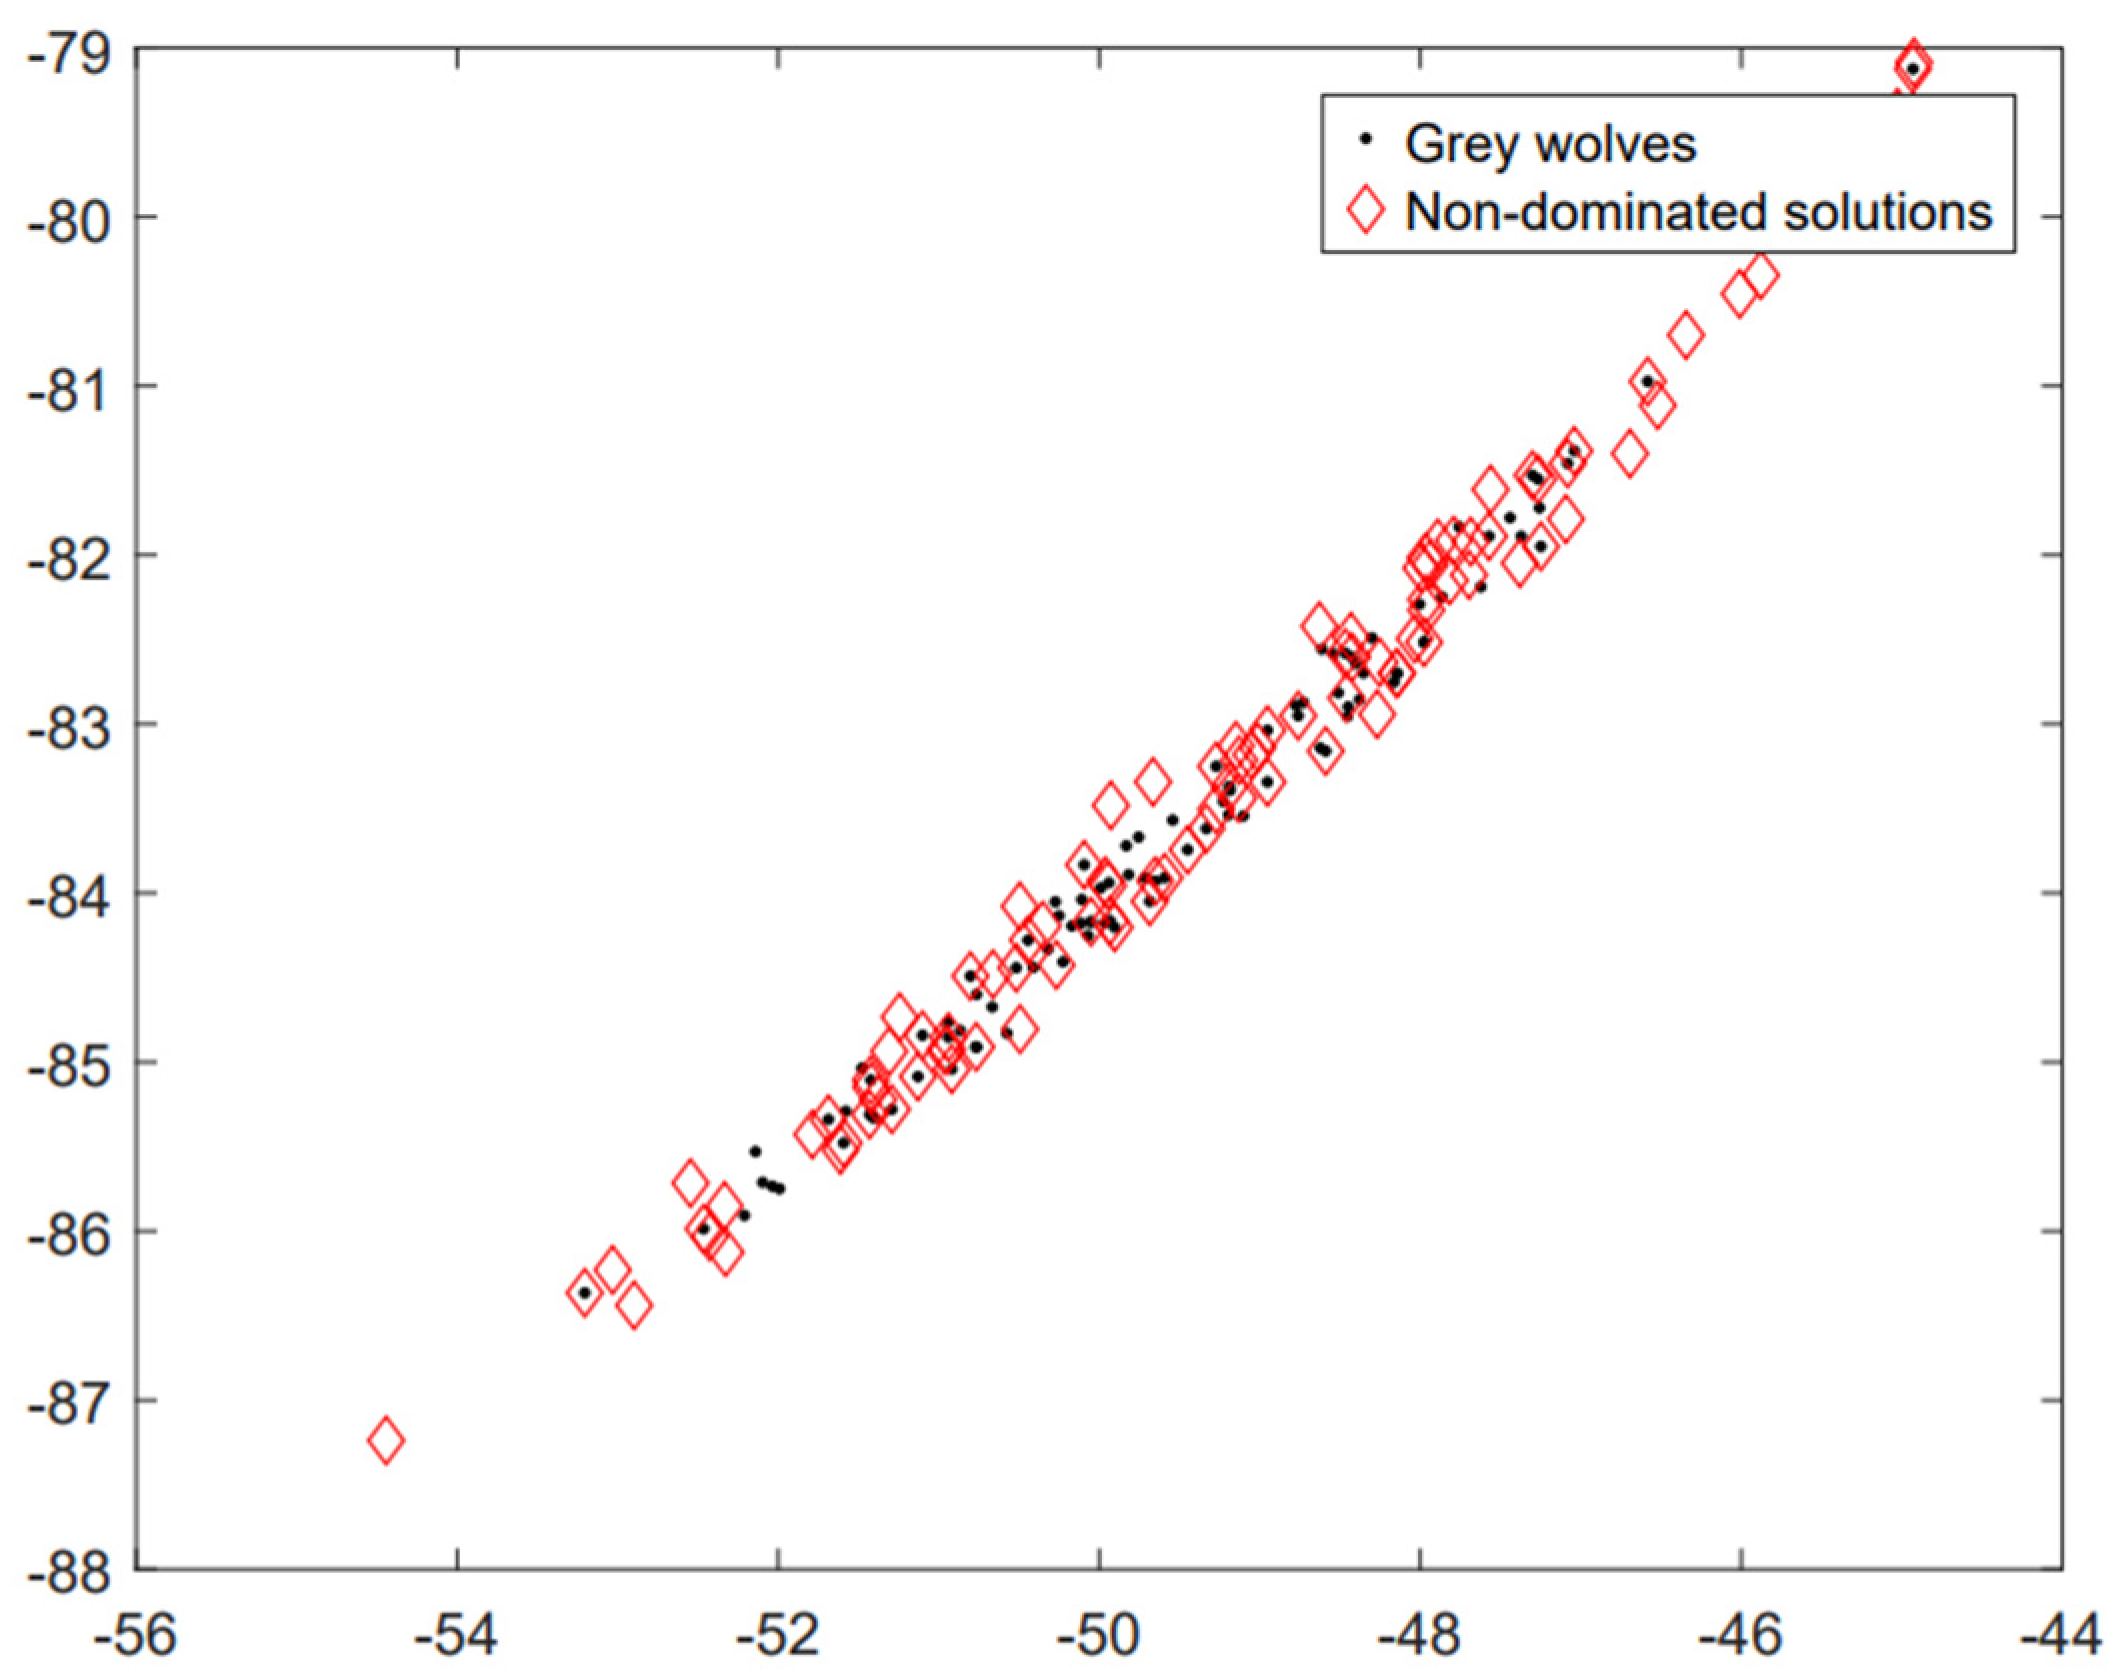
- The non-dominated solutions (red diamonds in the plot) show that GWO effectively explored a broad range of optimal trade-offs.
- The selected points (X1–X3) represent different strategies:
- ➢
- X1 prioritizes balance between efficiency and dosage.
- ➢
- X2 leans slightly toward enhanced performance.
- ➢
- X3 may be chosen when maximum removal is desired, regardless of higher dosage.
Multi-Objective Optimization by Coagulation Using Cucumis melo Coagulant
- X1 (pH: 6.65, dosage: 60.47 mg/L): A well-balanced solution offering good treatment efficiency with moderate chemical input.
- X2 (pH: 6.87, dosage: 60.88 mg/L): Slightly higher pH and dosage, potentially enhancing removal efficiency.
- X3 (pH: 6.93, dosage: 64.03 mg/L): Highest pH and dosage, likely maximizing treatment performance but at a higher resource cost.
3.4.3. Mechanistic Insights into Coagulation Processes
Charge Neutralization
Bridging Mechanism
Adsorption
Sweep Flocculation
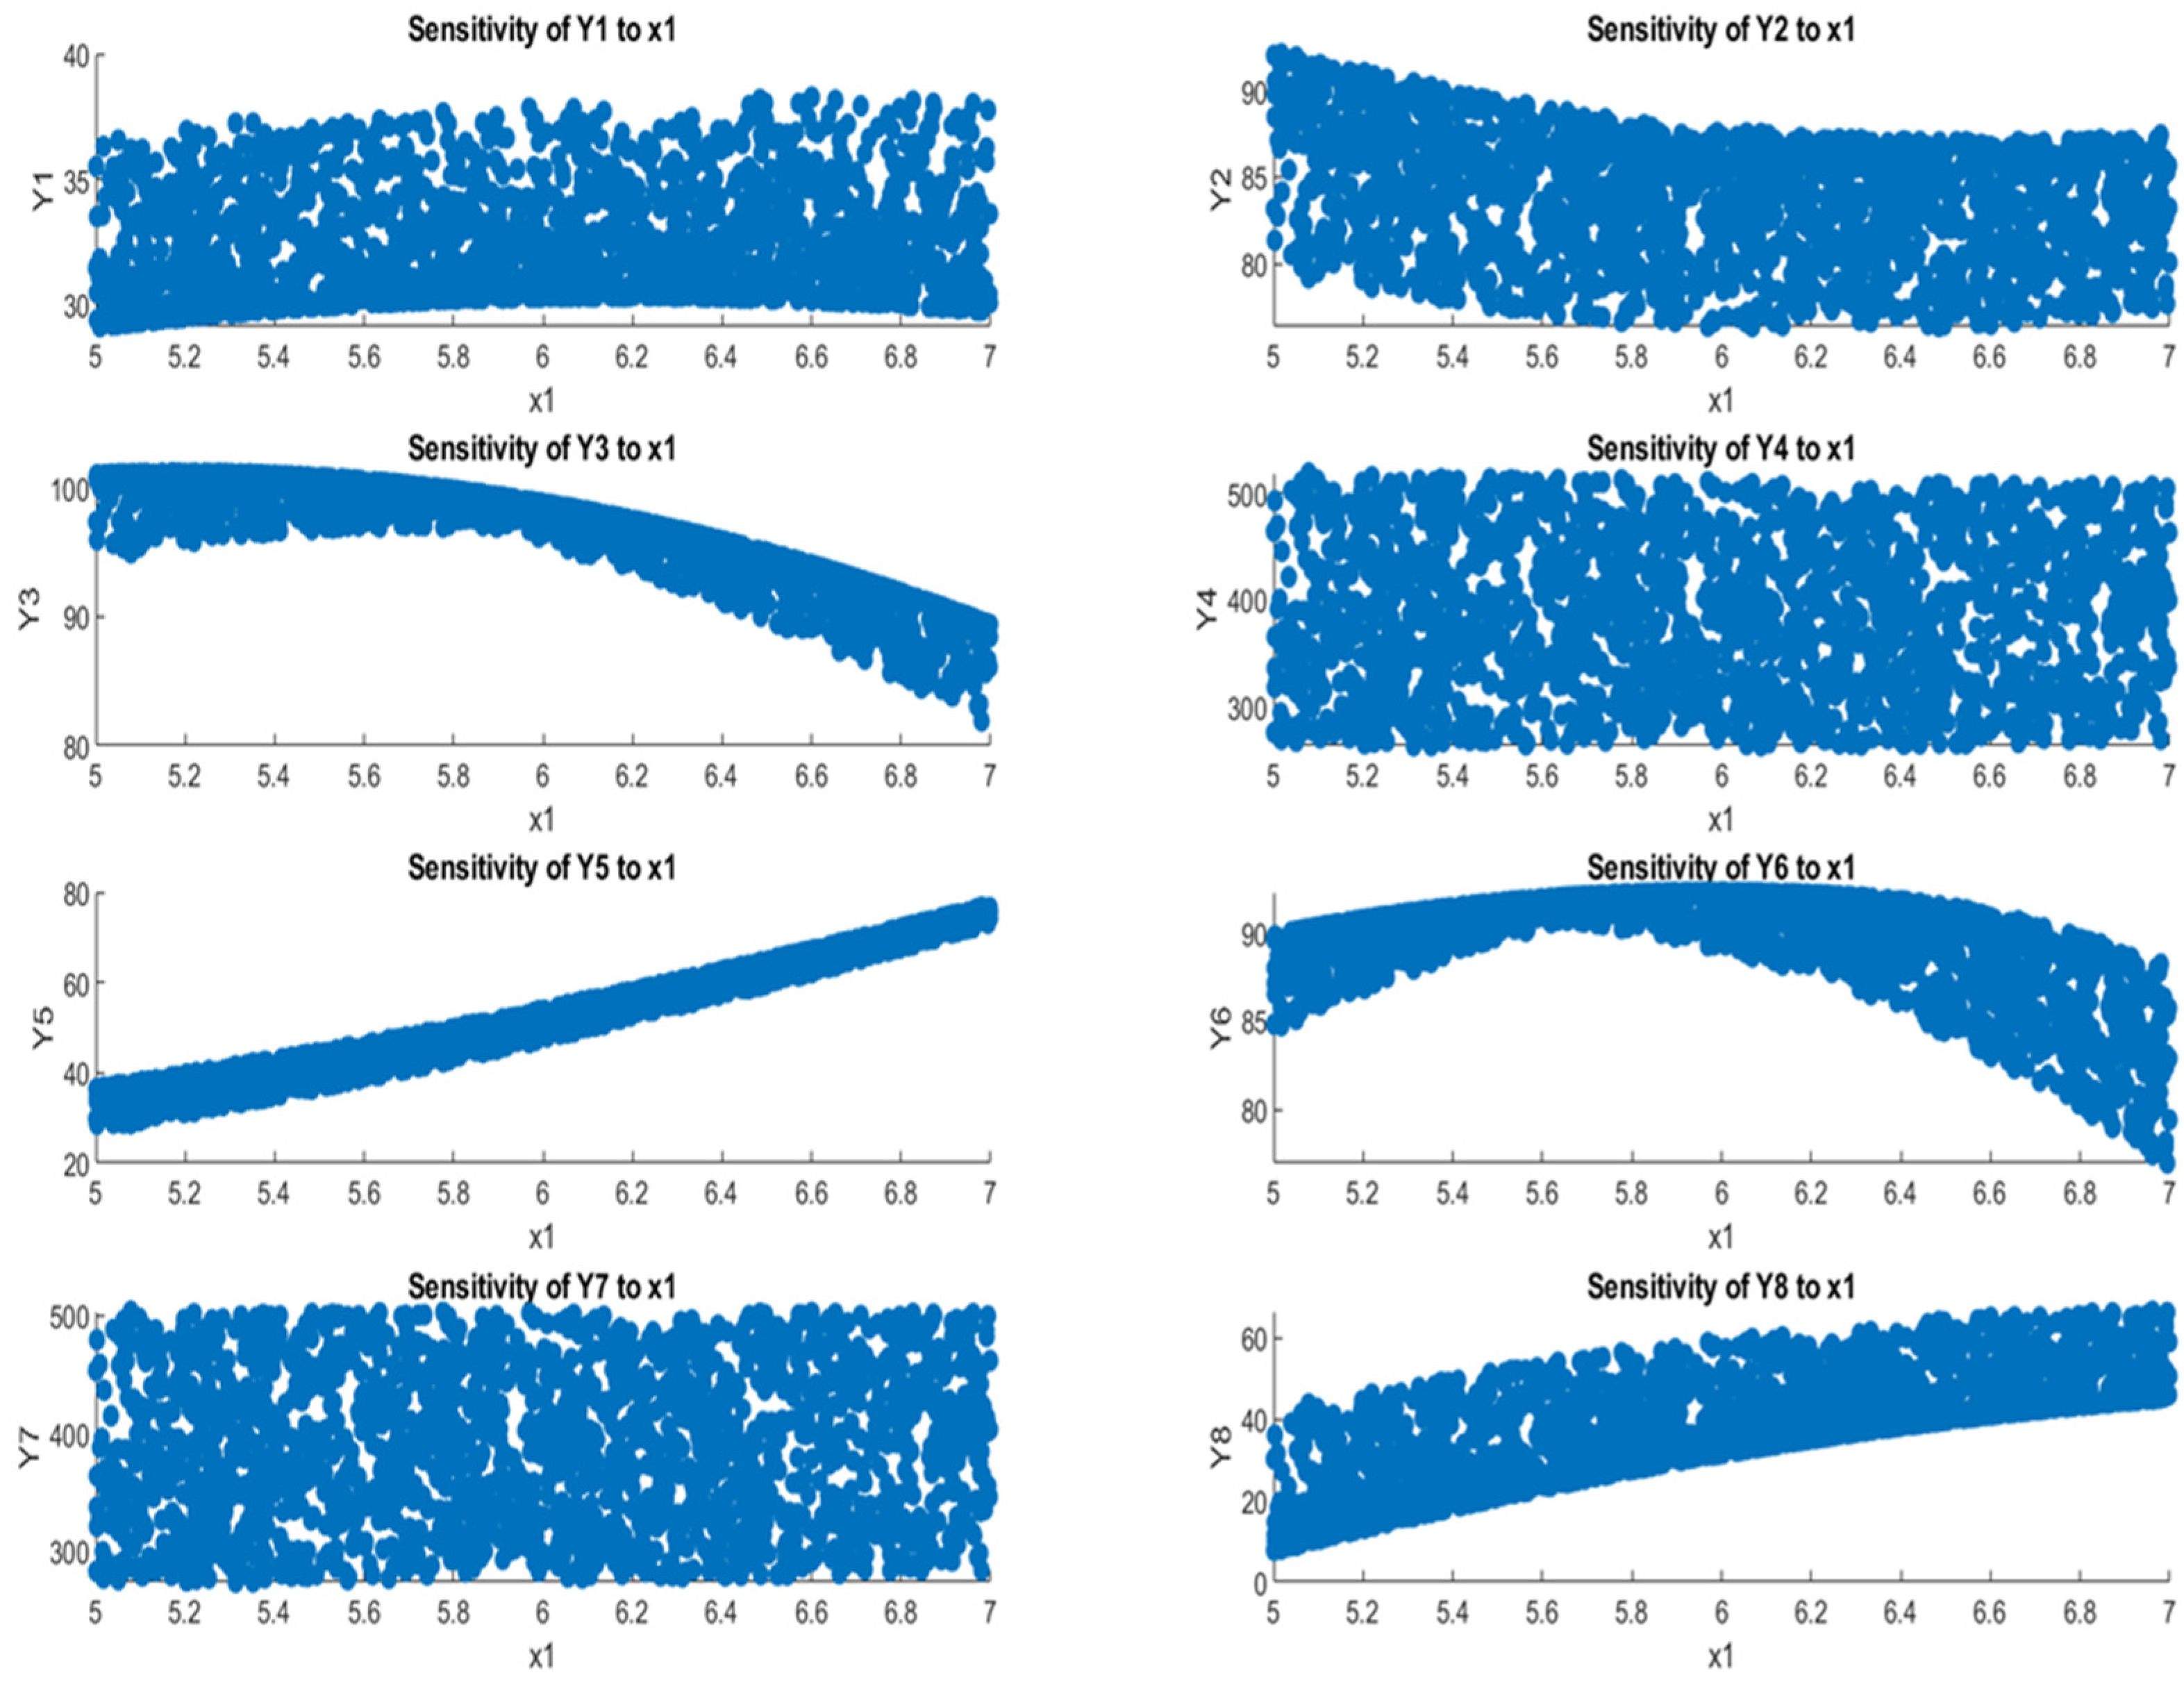
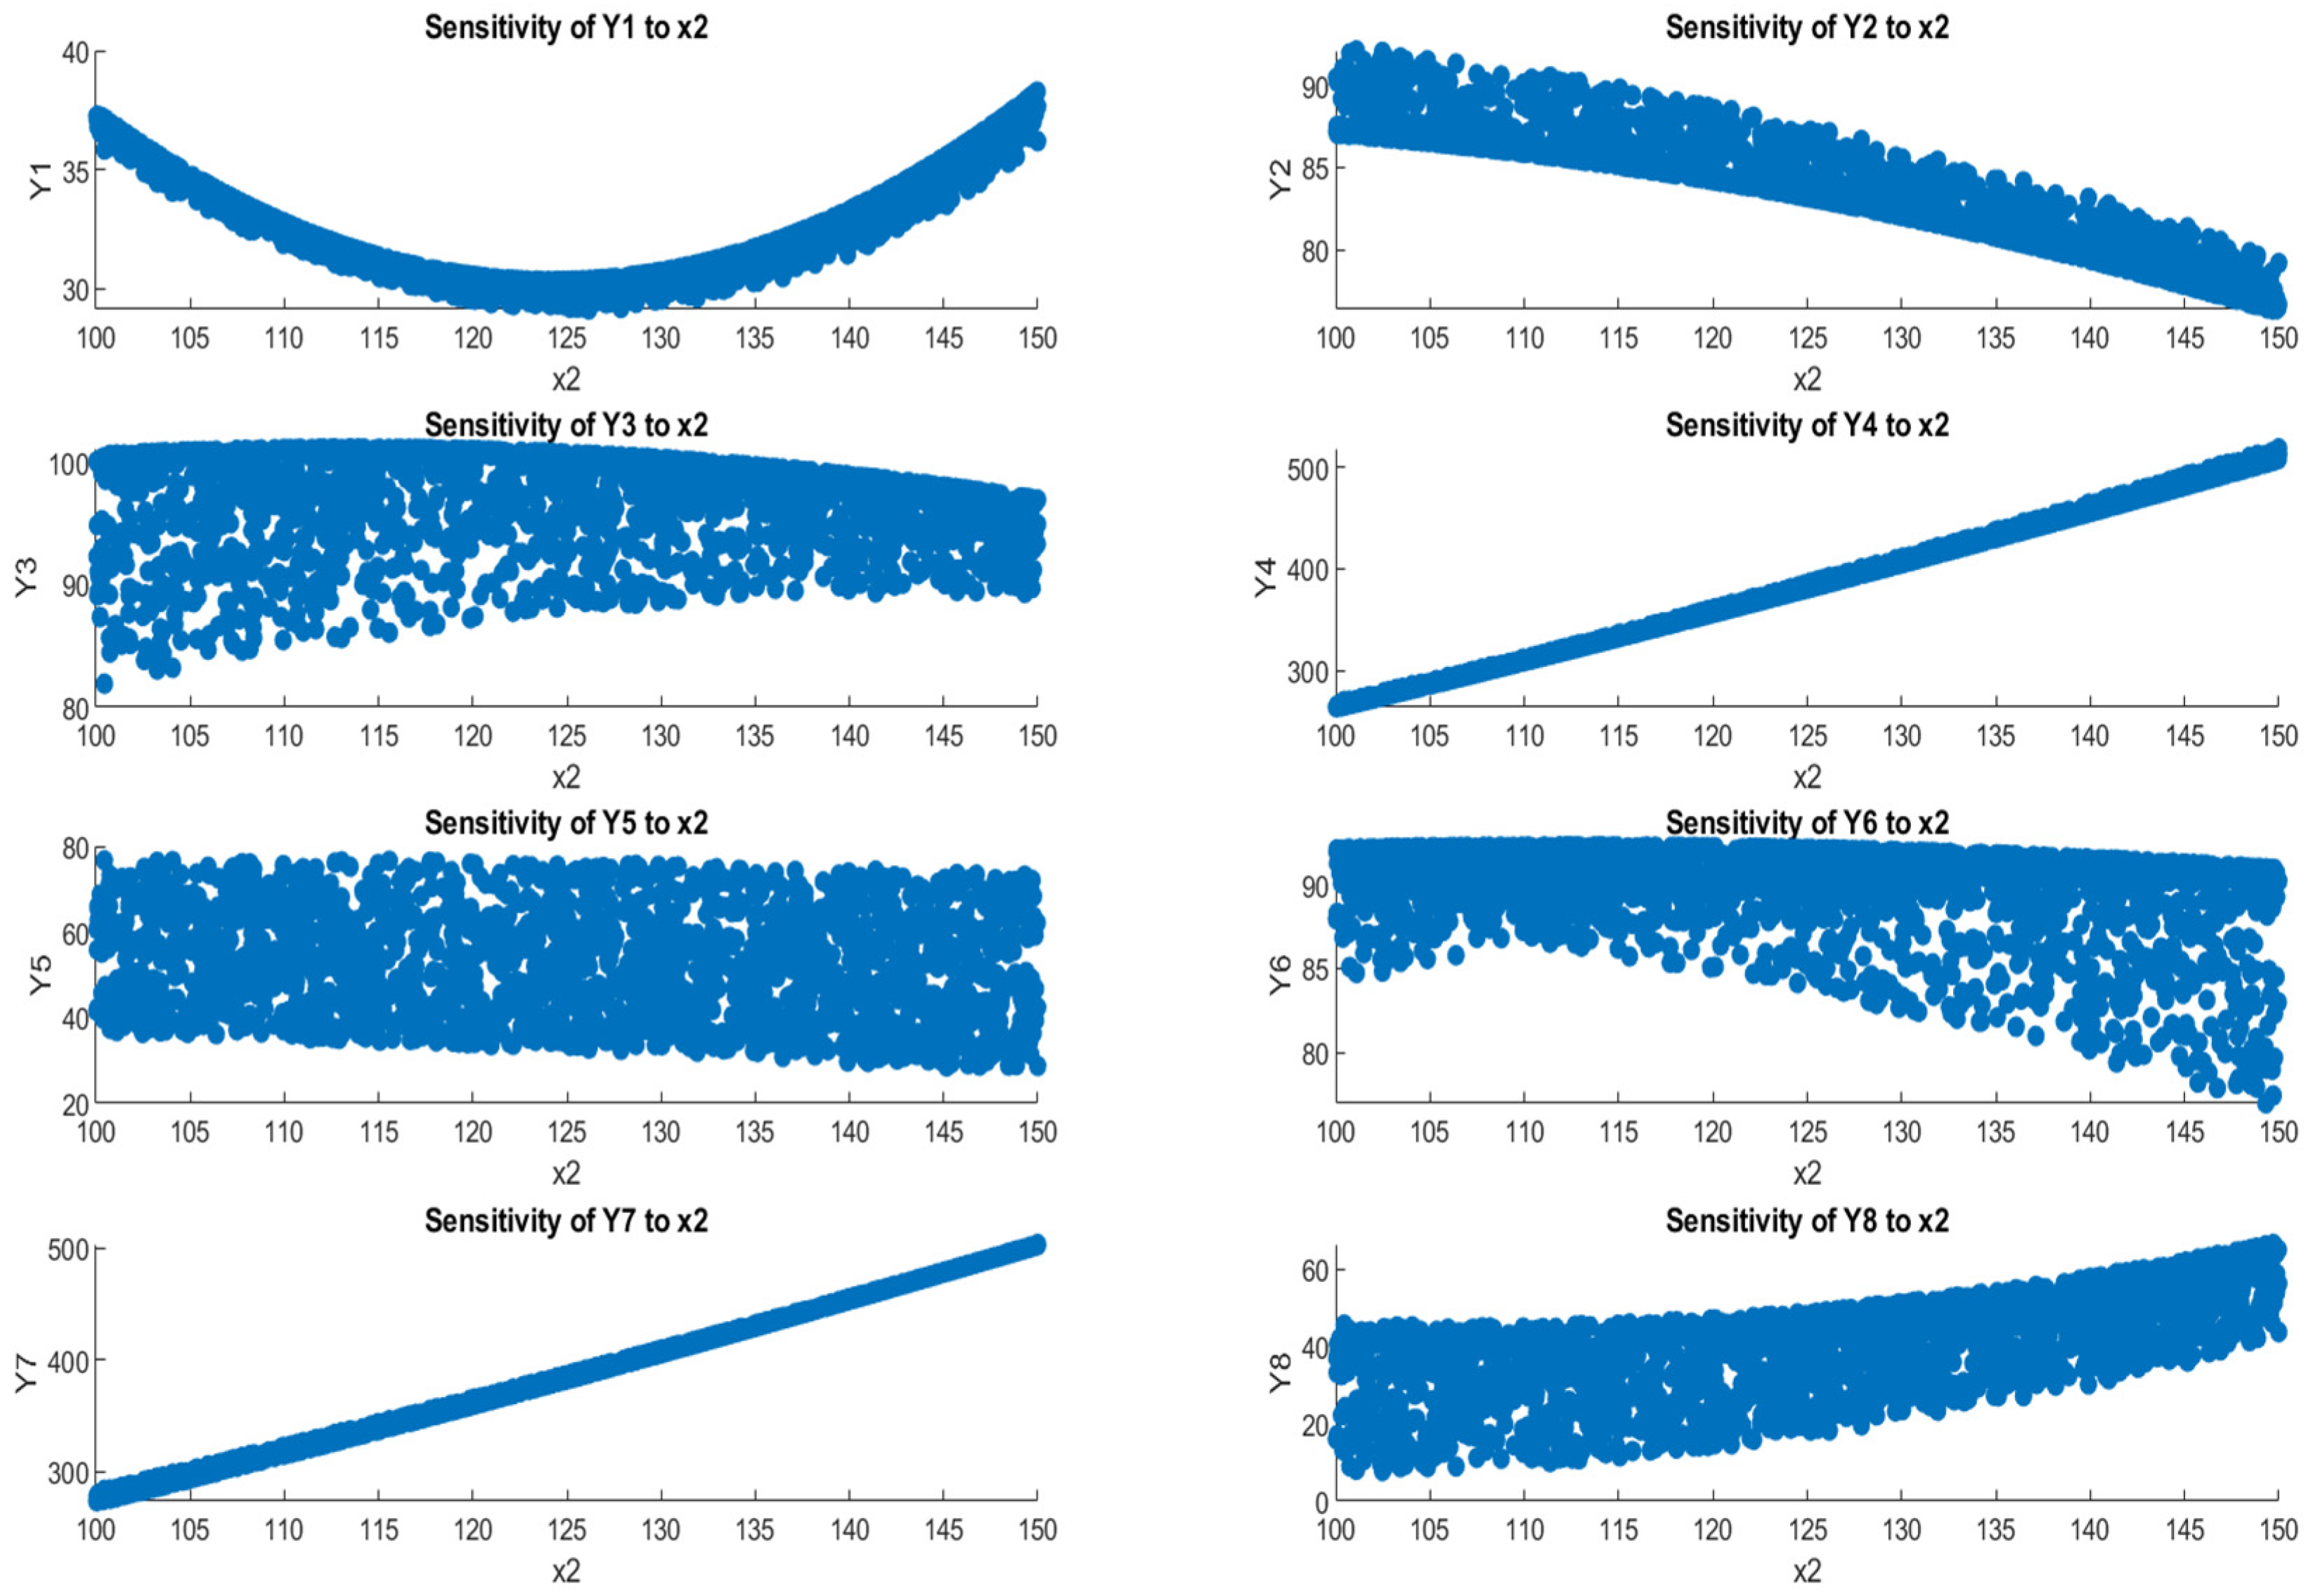
3.5. Sensitivity Analysis
3.6. Implications for Water Treatment Using Citrullus lanatus
4. Conclusions
Author Contributions
Funding
Data Availability Statement
Acknowledgments
Conflicts of Interest
References
- Bolto, B.; Gregory, J. Organic polyelectrolytes in water treatment. Water Res. 2007, 41, 2301–2324. [Google Scholar] [CrossRef]
- Chen, M.; Xu, R.; Wu, Y.; Xiong, J.; Keleş, S.Z.; Hankins, N.P. Application of polyelectrolytes for contaminant removal and recovery during water and wastewater treatment: A critical review. J. Water Process Eng. 2024, 64, 105528. [Google Scholar] [CrossRef]
- Bina, B.; Mehdinejad, M.H.; Dalhammer, G.; Attar, H.M. Effectiveness of natural coagulants in treating wastewater. J. Environ. Manag. 2009, 90, 341–347. [Google Scholar]
- Wang, K.-J.; Wang, P.-S. Coagulation-flocculation process optimization for industrial wastewater treatment: A multi-objective computational solution. J. Water Process Eng. 2025, 78, 108703. [Google Scholar] [CrossRef]
- Miller, S.M.; Fugate, E.J.; Craver, V.O.; Smith, J.A.; Zimmerman, J.B. Toward understanding the efficacy and mechanism of Opuntia spp. as a natural coagulant for potential application in water treatment. Environ. Sci. Technol. 2008, 42, 4274–4279. [Google Scholar] [CrossRef]
- Ribeiro, K.S.; Lima, C.R.; Dos Santos, F.A. Natural coagulants in water treatment: A review. Environ. Technol. Rev. 2018, 7, 20–38. [Google Scholar]
- Choy, S.Y.; Prasad, K.M.N.; Wu, T.Y.; Raghunandan, M.E.; Ramanan, R.N. Utilization of plant-based natural coagulants for wastewater treatment: A review. Environ. Sci. Pollut. Res. 2015, 22, 5676–5690. [Google Scholar]
- Okuda, T.; Baes, A.U.; Nishijima, W.; Okada, M. Coagulation mechanism of Moringa oleifera seed extract. Water Res. 2001, 35, 830–834. [Google Scholar] [CrossRef]
- Joaquin, A.A.; Nirmala, G.; Kanakasabai, P. Response Surface Analysis for Sewage Wastewater Treatment Using Natural Coagulants. Pol. J. Environ. Stud. 2021, 30, 1215–1225. [Google Scholar] [CrossRef]
- Sinha, P. Multivariate polynomial regression in data mining: Methodology, problems and solutions. Int. J. Sci. Eng. Res. 2013, 4, 962–965. [Google Scholar]
- Deb, K.; Pratap, A.; Agarwal, S.; Meyarivan, T.A.M.T. A fast and elitist multiobjective genetic algorithm: NSGA-II. IEEE Trans. Evol. Comput. 2002, 6, 182–197. [Google Scholar] [CrossRef]
- Coello Coello, C.A. Theoretical and numerical constraint-handling techniques used with evolutionary algorithms: A survey of the state of the art. Comput. Methods Appl. Mech. Eng. 2002, 191, 1245–1287. [Google Scholar] [CrossRef]
- Coello Coello, C.A.; Van Veldhuizen, D.A.; Lamont, G.B. Evolutionary Algorithms for Solving Multi-Objective Problems, 2nd ed.; Springer: Boston, MA, USA, 2004. [Google Scholar]
- Zitzler, E. Evolutionary Algorithms for Mult Objective Optimization: Methods and Applications. Ph.D. Thesis, Swiss Federal Institute of Technology (ETH), Zurich, Switzerland, 1999. [Google Scholar]
- Pandya, S.B.; Kalita, K.; Jangir, P.; Ghadai, R.K.; Abualigah, L. Multi-objective geometric mean optimizer (MOGMO): A novel metaphor-free population-based math-inspired multi-objective algorithm. Int. J. Comput. Intell. Syst. 2024, 17, 91. [Google Scholar] [CrossRef]
- Abbass, H.; Sarker, R.; Newton, C. PDE: A Pareto-frontier differential evolution approach for multi-objective optimization problems. In Proceedings of the 2001 Congress on Evolutionary Computation (IEEE Cat. No. 01TH8546); IEEE: New York, NY, USA, 2001; Volume 2, pp. 971–978. [Google Scholar]
- Wolpert, D.H.; Macready, W.G. No free lunch theorems for optimization. IEEE Trans. Evol. Comput. 1997, 1, 67–82. [Google Scholar] [CrossRef]
- Mirjalili, S.; Mirjalili, S.M.; Hatamlou, A. Multi-Verse Optimizer: A nature-inspired algorithm for global optimization. Neural Comput. Appl. 2016, 27, 495–513. [Google Scholar] [CrossRef]
- Mirjalili, S.; Mirjalili, S.M.; Lewis, A. Grey Wolf Optimizer. Adv. Eng. Softw. 2014, 69, 46–61. [Google Scholar] [CrossRef]
- Yin, C.-Y. Emerging usage of plant-based coagulants for water and wastewater treatment. Process Biochem. 2010, 45, 1437–1444. [Google Scholar] [CrossRef]
- Benalia, A.; Derbal, K.; Amrouci, Z.; Baatache, O.; Khalfaoui, A.; Pizzi, A. Application of plant-based coagulants and their mechanisms in water treatment: A review. J. Renew. Mater. 2024, 12, 667–698. [Google Scholar] [CrossRef]
- Alazaiza, M.Y.D.; Alzghoul, T.M.; Nassani, D.E.; Bashir, M.J.K. Natural coagulants for sustainable wastewater treatment: Current global research trends. Processes 2025, 13, 1754. [Google Scholar] [CrossRef]
- Ndabigengesere, A.; Narasiah, K.S.; Talbot, B.G. Active agents and mechanism of coagulation of turbid waters using Moringa oleifera. Water Res. 1995, 29, 703–710. [Google Scholar] [CrossRef]
- Shah, A.; Manning, G.; Zakharova, J.; Arjunan, A.; Batool, M.; Hawkins, A.J. Particle size effect of Moringa oleifera Lam. seeds on the turbidity removal and antibacterial activity for drinking water treatment. Environ. Chem. Ecotoxicol. 2024, 6, 370–379. [Google Scholar] [CrossRef]
- Bediako, J.K.; El Ouardi, Y.; Mouele, E.S.M.; Mensah, B.; Repo, E. Polyelectrolyte and polyelectrolyte complex-incorporated adsorbents in water and wastewater remediation–A review of recent advances. Chemosphere 2023, 325, 138418. [Google Scholar] [CrossRef] [PubMed]
- Bratby, J. Coagulation and Flocculation in Water and Wastewater Treatment; IWA Publishing: London, UK, 2016. [Google Scholar]
- Nurminen, A. Improving Effluent Quality at UPM Rauma Mill Raw Water Treatment Facility. Master’s Dissertation, Lappeenranta–Lahti University of Technology, Lappeenranta, Finland, 2025. [Google Scholar]
- Bhatia, S.; Othman, Z.; Ahmad, A.L. Pretreatment of palm oil mill effluent (POME) using Moringa oleifera seeds as natural coagulant. J. Hazard. Mater. 2007, 145, 120–126. [Google Scholar] [CrossRef] [PubMed]
- Teh, C.Y.; Wu, T.Y.; Juan, J.C. Potential use of rice starch in coagulation–flocculation process of agro-industrial wastewater: Treatment performance and flocs characterization. Ecol. Eng. 2014, 71, 509–512. [Google Scholar] [CrossRef]
- Asharuddin, S.M.; Othman, N.; Al-Maqtari, Q.A.; Al-Towayti, W.A.H.; Arifin, S.N.H. The assessment of coagulation and flocculation performance and interpretation of mechanistic behavior of suspended particles aggregation by alum assisted by tapioca peel starch. Environ. Technol. Innov. 2023, 32, 103414. [Google Scholar] [CrossRef]
- Pillai, S.B.; Thombre, N.V. Coagulation, flocculation, and precipitation in water and used water purification. In Handbook of Water and Used Water Purification; Springer International Publishing: Cham, Switzerland, 2024; pp. 3–27. [Google Scholar]
- Lwasa, A.; Mdee, O.J.; Ntalikwa, J.W.; Sadiki, N. Performance analysis of plant-based coagulants in water purification: A review. Discov. Water 2024, 4, 108. [Google Scholar] [CrossRef]
- Zaki, N.; Hadoudi, N.; Charki, A.; Bensitel, N.; El Ouarghi, H.; Amhamdi, H.; Ahari, M. Advancements in the chemical treatment of potable water and industrial wastewater using the coagulation–flocculation process. Sep. Sci. Technol. 2023, 58, 2619–2630. [Google Scholar] [CrossRef]






| Source | Sum of Squares (SS) | Degrees of Freedom (df) | Mean Squares (MS) | F-Statistic |
|---|---|---|---|---|
| Regression | SSR | p | MSR = SSR/p MSE = SSE/n-p-1 | F = MSR/MSE |
| Residual (Error) | SSE | n-p-1 | - | |
| Total | SST | n-1 | - |
| Reduction in Turbidity | Reduction in TSS | Reduction in BOD | Reduction in COD | |||||||||||||
|---|---|---|---|---|---|---|---|---|---|---|---|---|---|---|---|---|
| Term | Estimate | SE | tStat | p Value | Estimate | SE | tStat | p Value | Estimate | SE | tStat | p Value | Estimate | SE | tStat | p Value |
| (Intercept) | 202.97 | 32.874 | 6.1741 | 0.00045666 | 185.06 | 5.63 | 32.871 | 6.2431 × 10⁻⁹ | 1.154 | 53.11 | 0.0217 | 0.98327 | −78.607 | 91.353 | −0.8605 | 0.41802 |
| A | 6.7328 | 11.073 | 0.6081 | 0.56235 | −31.749 | 1.8963 | −16.743 | 6.6322 × 10⁻⁷ | 33.628 | 17.888 | 1.8799 | 0.10218 | −18.382 | 30.769 | −0.5974 | 0.56905 |
| B | −3.1134 | 0.11732 | −26.539 | 2.7621 × 10⁻⁸ | 0.2109 | 0.020091 | 10.497 | 1.5527 × 10⁻⁵ | 0.22163 | 0.18953 | 1.1694 | 0.28053 | 3.4103 | 0.32601 | 10.461 | 1.5883 × 10⁻⁵ |
| A:B | 0.031 | 0.015166 | 2.0441 | 0.080231 | 0.0275 | 0.0025973 | 10.588 | 1.4662 × 10⁻⁵ | 0.1395 | 0.024501 | 5.6936 | 0.00074026 | −0.15 | 0.042144 | −3.5593 | 0.0092287 |
| A2 | −0.8569 | 0.91257 | −0.939 | 0.37899 | 2.2138 | 0.15628 | 14.165 | 2.0743 × 10⁻⁶ | −4.7621 | 1.4743 | −3.2301 | 0.014451 | 2.9207 | 2.5359 | 1.1517 | 0.28724 |
| B2 | 0.011757 | 0.000365 | 32.209 | 7.1915 × 10⁻⁹ | −0.0024145 | 6.2514 × 10⁻⁵ | −38.623 | 2.0301 × 10⁻⁹ | −0.0041648 | 0.00058972 | −7.0624 | 0.00020018 | −0.0096717 | 0.0010144 | −9.5349 | 2.926 × 10⁻⁵ |
| RMSE | 1.52 | 0.26 | 2.45 | 4.21 | ||||||||||||
| R2 | 0.998 | 0.999 | 0.98 | 0.982 | ||||||||||||
| Adj. R2 | 0.996 | 0.997 | 0.966 | 0.97 | ||||||||||||
| p-value | 3.19 × 10⁻⁹ | 1 × 10⁻⁹ | 8.66 × 10⁻⁶ | 5.44 × 10⁻⁶ | ||||||||||||
| Reduction in Turbidity | Reduction in TSS | Reduction in BOD | Reduction in COD | |||||||||||||
|---|---|---|---|---|---|---|---|---|---|---|---|---|---|---|---|---|
| Term | Estimate | SE | tStat | p Value | Estimate | SE | tStat | p Value | Estimate | SE | tStat | p Value | Estimate | SE | tStat | p Value |
| (Intercept) | 64.56 | 138.11 | 0.4675 | 0.65438 | −257.4 | 60.552 | −4.2509 | 0.0037889 | −102.52 | 113.7 | −0.9016 | 0.39721 | −214.5 | 286.4 | −0.7490 | 0.47829 |
| A | −20.165 | 46.517 | −0.4335 | 0.6777 | 88.417 | 20.395 | 4.3352 | 0.0034159 | 5.4546 | 38.297 | 0.1424 | 0.89075 | 91.05 | 96.463 | 0.9439 | 0.37666 |
| B | −0.14232 | 0.49286 | −0.2888 | 0.78112 | 1.5158 | 0.21609 | 7.0146 | 0.00020883 | 2.8763 | 0.40576 | 7.0885 | 0.00019562 | −1.648 | 1.022 | −1.6124 | 0.1509 |
| A:B | 0.0535 | 0.063713 | 0.8397 | 0.42882 | −0.17 | 0.027935 | −6.0857 | 0.00049808 | −0.103 | 0.052454 | −1.9636 | 0.090335 | −0.136 | 0.13212 | −1.0293 | 0.33757 |
| A2 | 2.9207 | 3.8338 | 0.7618 | 0.47104 | −5.7931 | 1.6809 | −3.4465 | 0.010743 | 0.80517 | 3.1563 | 0.2551 | 0.80598 | −4.85 | 7.9501 | −0.6101 | 0.5611 |
| B2 | −0.0012517 | 0.0015335 | −0.8163 | 0.44125 | −0.0022172 | 0.00067235 | −3.2977 | 0.013162 | −0.0090979 | 0.0012625 | −7.2062 | 0.0001765 | 0.01208 | 0.0031801 | 3.7987 | 0.0067264 |
| RMSE | 6.37 | 2.79 | 5.25 | 13.2 | ||||||||||||
| R2 | 0.901 | 0.921 | 0.961 | 0.807 | ||||||||||||
| Adj. R2 | 0.831 | 0.865 | 0.933 | 0.669 | ||||||||||||
| p-value | 0.00207 | 0.00097 | 8.59 × 10⁻⁵ | 0.0193 | ||||||||||||
| Parameter | Justification/Source |
|---|---|
| 5.0 ≤ pH ≤ 9 | Typical coagulation pH range; prevents pipe corrosion and ineffective coagulation |
| 10 mg/L ≤ Coagulant Dose ≤ 100 mg/L | Based on experimental optimization and safety limits |
| 0 ≤ Turbidity Reduction % ≤ 100 | Physically bounded between no removal and full clarity |
| 0 ≤ COD Reduction % ≤ 100 | Based on experimental maximum; cannot exceed total removal |
| 0 ≤ TSS Reduction % ≤ 100 | Physical limit; no more than total solids removal |
| 0 ≤ BOD Reduction % ≤ 100 | Based on experimental maximum; cannot exceed total removal |
| Dependent Variable | Optimal Solution [%] | Variable A (pH) | Variable B (Coagulant Dosage) |
|---|---|---|---|
| Reduction in turbidity (maximize the turbidity removal) | 96.684 | 5 | 50 |
| Reduction in TSS (maximize the TSS removal) | 94.2306 | 5 | 71.9497 |
| Reduction in BOD (maximize the BOD removal) | 52.7011 | 7 | 50 |
| Reduction in COD (maximize the COD removal) | 59.6998 | 5 | 50 |
| Reduction in Turbidity | Reduction in TSS | Reduction in BOD | Reduction in COD | |
|---|---|---|---|---|
| Variable A (pH) | ↑ | ↑ | ↑ | ↓ ≠ |
| Variable B (Coagulant dosage) | ↑ | ↑ | ↓ ≠ | ↑ |
| Dependent Variable | Optimal Solution [%] | Variable A (pH) | Variable B (Coagulant Dosage) |
|---|---|---|---|
| Reduction in turbidity (maximize turbidity removal) | 77.2862 | 7 | 92.7467 |
| Reduction in TSS (maximize TSS removal) | 92.2685 | 5.986748 | 100 |
| Reduction in BOD (maximize BOD removal) | 40.198 | 5 | 50 |
| Reduction in COD (maximize COD removal) | 85.4 | 7 | 50 |
| Reduction in Turbidity | Reduction in TSS | Reduction in BOD | Reduction in COD | |
|---|---|---|---|---|
| Variable A (pH) | ↑ | ↓ ≠ | ↓ | ↑ ≠ |
| Variable B (Coagulant dosage) | ↑ | ↑ | ↓ ≠ | ↑ |
| Parameter Name | Description | Value |
|---|---|---|
| Variables | Number of variables | 2 |
| Population Size | Number of grey wolves | 100 |
| Max Iterations | Maximum number of iterations | 1000 |
| Alpha | Alpha coefficient | 0.1 |
| Grid Count | Number of grids | 10 |
| Beta | Beta coefficient | 4 |
| Gamma | Gamma coefficient | 2 |
Disclaimer/Publisher’s Note: The statements, opinions and data contained in all publications are solely those of the individual author(s) and contributor(s) and not of MDPI and/or the editor(s). MDPI and/or the editor(s) disclaim responsibility for any injury to people or property resulting from any ideas, methods, instructions or products referred to in the content. |
© 2026 by the authors. Licensee MDPI, Basel, Switzerland. This article is an open access article distributed under the terms and conditions of the Creative Commons Attribution (CC BY) license.
Share and Cite
Bwapwa, J.K.; Mukuna, J.G. Metaheuristic Optimization of Treated Sewage Wastewater Quality Parameters with Natural Coagulants. Water 2026, 18, 885. https://doi.org/10.3390/w18080885
Bwapwa JK, Mukuna JG. Metaheuristic Optimization of Treated Sewage Wastewater Quality Parameters with Natural Coagulants. Water. 2026; 18(8):885. https://doi.org/10.3390/w18080885
Chicago/Turabian StyleBwapwa, Joseph K., and Jean G. Mukuna. 2026. "Metaheuristic Optimization of Treated Sewage Wastewater Quality Parameters with Natural Coagulants" Water 18, no. 8: 885. https://doi.org/10.3390/w18080885
APA StyleBwapwa, J. K., & Mukuna, J. G. (2026). Metaheuristic Optimization of Treated Sewage Wastewater Quality Parameters with Natural Coagulants. Water, 18(8), 885. https://doi.org/10.3390/w18080885