Article

The Financial Burden of Boil Water Advisories on Public Water Utilities

Department of Agribusiness and Consumer Sciences, College of Agricultural and Food Sciences, King Faisal University, Al-Ahsa 31982, Saudi Arabia
*
Author to whom correspondence should be addressed.
Water 2026, 18(7), 770; https://doi.org/10.3390/w18070770
Submission received: 3 February 2026 / Revised: 21 March 2026 / Accepted: 22 March 2026 / Published: 24 March 2026

Abstract

Aging drinking water infrastructure and persistent underinvestment have increased the frequency of service disruptions across public water systems in the United States, yet empirical evidence on the financial implications of such disruptions for water utilities remains limited. This study examines the relationship between boil water advisory (BWA) exposure and operating costs incurred by public water utilities using a cross-sectional dataset of 239 publicly owned community water systems in West Virginia during the 2023 fiscal year. Utility costs are measured using operating revenue deductions, an accounting measure capturing operating expenses, taxes, and depreciation. Regression results indicate a statistically significant positive association between cumulative BWA exposure and utility costs. Specifically, a one-day increase in advisory exposure is associated with approximately a 0.08% increase in operating deductions, implying an average cost increase of $1020 per utility for each day under advisory. Duration-based measures of BWA exposure explain cost variation more consistently than simple advisory counts, highlighting the importance of capturing persistence rather than frequency alone. These findings demonstrate that service reliability disruptions impose financial burdens on public water utilities and highlight the need to incorporate reliability considerations into infrastructure investment decisions, rate setting, and long-term financial planning, particularly for small and resource-constrained systems.

1. Introduction

Drinking water infrastructure in the United States (U.S.) is widely recognized as aging and increasingly vulnerable to failure [1]. Much of the nation’s water distribution network was constructed in the 1950s and is now approaching or exceeding its intended service life [2]. Longstanding underinvestment, combined with rising operation and maintenance costs and increasing exposure to extreme weather events, has contributed to frequent system disruptions, including main breaks, pressure losses, and water quality violations [3,4]. According to the Environmental Protection Agency (EPA), more than 9 million lead service lines remain in service nationwide, posing significant health concerns, and meeting U.S. drinking water infrastructure needs will require an estimated $625 billion in investment over the next 20 years [5].
Aging infrastructure results in substantial system inefficiencies. For example, an estimated 126 billion cubic meters (about 33.3 trillion gallons) of treated water are lost annually, corresponding to more than $187 billion in foregone revenue [6]. In addition, nearly 20% of installed water mains have exceeded their expected useful lives but remain in operation due to inadequate funding [7], contributing to approximately 240,000 water main breaks every year and more than $2.6 billion in annual repair and maintenance costs [8]. These structural challenges have direct implications for regulatory compliance, with more than 20 million people served by community water systems that violated health-based drinking water standards in recent years [9]. As a result, ensuring reliable service delivery and protecting public health have become central concerns in U.S. drinking water policy, particularly in rural and economically distressed regions [10,11,12].
One of the most visible consequences of aging and unreliable drinking water infrastructure in the U.S. is the widespread use of boil water advisories (BWAs). BWAs are public health notices issued by water utilities or regulatory agencies when drinking water is suspected to be unsafe due to actual or potential contamination arising from source water contamination, inadequate treatment, or infrastructure failures [13,14]. Advisories are commonly triggered by events such as water main breaks, equipment malfunctions, power outages, flooding, or violations of drinking water quality standards [15,16,17]. Although typically intended as short-term precautionary measures, they occur frequently across many systems and, in some cases, remain in effect for extended periods [11].
BWAs impose substantial burdens on affected communities, requiring households, schools, and businesses to alter daily activities, incur additional costs for bottled water or boiling, and face heightened health risks, particularly for vulnerable populations [18,19,20]. Prior studies have documented a range of associated impacts, including lower residential property values, increased bottled water sales, reduced student academic performance, and higher rates of emergency room and urgent care visits in areas experiencing more frequent BWAs [21,22,23,24]. At the same time, advisories reflect underlying operational challenges faced by water utilities, including emergency response, infrastructure repair, and compliance with regulatory requirements [25,26]. Despite their prevalence and importance as indicators of system reliability, BWAs have received limited empirical attention in the literature, particularly with respect to their direct financial implications for public water utilities.
Since the 1970s, many studies have assessed the performance (i.e., efficiency) of water utilities worldwide [27]. A large body of this literature examines how utility characteristics such as ownership structure, system size, regulatory environment, and geographic conditions influence operational efficiency and cost performance [28,29,30]. These studies also highlight that water utility costs are largely driven by expenditures associated with infrastructure operation, maintenance, and system management. In particular, maintaining aging distribution networks and responding to infrastructure failures can represent a significant component of utility operating expenditures.
A smaller number of studies have incorporated measures of system reliability or operational disruptions into analyses of utility performance [31,32,33,34]. For example, Bhattacharyya et al. [33] included emergency breakdowns as an explanatory variable in models of water utility inefficiency, finding that breakdowns are associated with poorer economic performance. While this literature highlights the importance of infrastructure failures for utility efficiency, it does not directly examine the financial costs associated with service disruptions from the utility’s accounting perspective. In particular, no empirical work has assessed how short-term but recurring disruptions, such as boil water advisories, translate into observable operating cost burdens for public water utilities.
Therefore, the goal of this study is to estimate the relationship between BWA exposure and operating costs incurred by public water utilities. Using a cross-sectional dataset of public water utilities in West Virginia, this study examines how alternative measures of advisory exposure, capturing both the frequency and duration of advisories, relate to operating revenue deductions, a comprehensive measure of utility costs. By focusing on the proportion of the year that utilities spend under advisory, the analysis captures cumulative exposure that is directly comparable across systems of different sizes.
This study contributes to the literature in three ways. First, it provides one of the first utility-level empirical assessments of the financial implications of boil water advisories. Second, it moves beyond simple advisory counts by emphasizing duration-based measures that better reflect the intensity and persistence of service disruptions. Third, by focusing on a predominantly rural state with fragmented water service provision, the study offers insights into the financial vulnerabilities faced by small and resource-constrained public water utilities. Together, these findings inform ongoing policy discussions about infrastructure investment, rate setting, and the fiscal sustainability of public drinking water systems.

2. Materials and Methods

2.1. Study Area

The study area for this research is the state of West Virginia, located in the Appalachian region in the eastern part of the United States. West Virginia was selected because of the availability of detailed, publicly accessible data on BWAs, which enables a systematic examination of advisory exposure across public water utilities.
West Virginia consists of 55 counties, with a total population of about 1.8 million residents [35]. The population is predominantly rural (55% of total population) and demographically homogeneous (90% white), with relatively low median household income (25% less) and elevated poverty rates (4.6% higher) compared to national statistics. According to the U.S. Census Bureau [35], median household income in West Virginia was $60,798, and nearly 17% of the population lived below the federal poverty threshold.
Public water service provision in West Virginia is characterized by a large number of community water systems operating under diverse governance structures. More than 400 community water systems serve over 1.5 million residents, representing roughly 85% of the state’s population, while the remaining residents rely on private water sources such as wells, cisterns, or springs [36]. Approximately 77% of community water systems are classified by the EPA as very small (serving 500 or fewer people) or small (serving up to 3300 people), reflecting the fragmented and decentralized nature of water service provision in the state [37].
West Virginia’s water infrastructure faces persistent challenges related to aging assets, mountainous terrain, and financial constraints. State agencies estimate that current and future funding needs for water infrastructure exceed $3 billion, while only 10% of the current needs have been funded [38]. In addition, about 17% of the state’s water systems are considered inadequate with respect to technical, managerial, or financial capacity [36].
These characteristics make West Virginia a relevant setting for examining how BWA exposure relates to the financial performance of public water utilities.

2.2. Data

This study draws on several publicly available data sources to construct a cross-sectional dataset of public water utilities operating in West Virginia. Financial data were obtained from the Public Service Commission of West Virginia (PSC) annual statistical reports. Information on BWAs was collected from the West Virginia Office of Environmental Health Services (OEHS) data portal. Water system characteristics were obtained from the West Virginia Drinking Water Viewer (WVDWV) and the U.S. Environmental Protection Agency’s Safe Drinking Water Act Information System (SDWIS). Socioeconomic characteristics of utility service area were drawn from the U.S. Census Bureau’s American Community Survey (ACS) and U.S. Department of Agriculture (USDA) Rural-Urban Continuum Codes (RUCC).
All data were assembled for the 2023 fiscal year and include all active community water systems operated by public water utilities in West Virginia.

2.2.1. Public Water Utilities Costs and Water Charges

The PSC publishes annual statistical reports for all regulated utilities in the state. For water utilities, these reports include information on gross utility plant (capital investment), operating revenues, operating revenue deductions, and the average number of customers served. For the purposes of this study, we focus on operating revenue deductions (hereafter, operating deductions) as the primary measure of utility costs. Deductions include operating expenses, taxes, and depreciation and amortization.
Operating deductions are used as the primary financial outcome because they capture the broad set of financial obligations faced by public water utilities during the study period. In addition to routine operating expenses, operating deductions include taxes and depreciation and amortization, which reflect longer-term capital costs associated with maintaining and repairing water infrastructure. BWAs may be associated with increases in both short-run operating costs (e.g., labor, treatment, emergency response) and longer-term capital-related costs arising from infrastructure failures and system repairs. While operating deductions do not isolate the direct costs attributable to BWA events, they capture the broader financial obligations faced by utilities in maintaining reliable service and responding to infrastructure disruptions. As a result, operating deductions provide a comprehensive indicator of the financial burden associated with advisory exposure, even when such costs are not fully reflected in annual operating expenses alone.
The analysis is limited to publicly owned water utilities, as fiscal years differ across ownership types. Public utilities report financial information for fiscal years ending June 30, whereas private utilities and water associations report on a calendar-year basis. In addition, BWA data for 2023 were only available through September at the time of data collection, making fiscal-year alignment necessary. As a result, the final sample includes 239 public water utilities. For a small number of utilities with missing values for average number of customers, data from the 2022 PSC reports were used to fill in missing observations.
The PSC also provides information on residential water charges. For each utility, we obtained the water charge per 4500 gallons published on 12 May 2023, which represents a commonly used benchmark for household water use. For utilities that reported multiple residential charges applicable to different service areas, an average charge was calculated to obtain a single representative charge for each utility. Water charges are included in the analysis as a control variable to account for differences in pricing structures across utilities.

2.2.2. Boil Water Advisories

Information on BWAs was obtained from the OEHS data portal, which provides detailed records for all advisories issued by public water systems in West Virginia. For each advisory, available information includes the public water system identification code (PWSID), system name, public health sanitation district, county, issue and lift dates, reported reason for the advisory, and descriptive details that often include affected areas, street names, or number of affected customers.
To align with the financial data, BWAs were collected for the 2023 fiscal year, covering the period from 1 July 2022, to 30 June 2023. After removing advisories issued by systems that did not meet the study’s inclusion criteria (e.g., private or non-community systems), the final dataset includes 900 boil water advisories across 239 water utilities.
Using these data, six measures of BWA exposure were constructed. Three measures capture advisory frequency: (i) the total number of advisories issued by each utility, (ii) the number of advisories per 1000 customers, and (iii) a binary indicator equal to one if the utility issued at least one advisory during the study period. Three additional measures capture advisory duration: (iv) the average duration of advisories (in days), (v) the total number of days the utility was under advisory, and (vi) the proportion of the fiscal year during which the utility was subject to a BWA.
Because publicly available advisory records are reported at the public water system level, BWA exposure is measured at the utility level rather than at the level of specific service areas or populations affected by each advisory. As a result, the exposure measures used in this study reflect the overall advisory experience of each utility rather than the precise number of customers impacted by individual advisory events.

2.2.3. Water Systems’ Characteristics

Water system characteristics are expected to influence the costs incurred by public water utilities. To control for these factors, data were drawn from the SDWIS databases. Variables included in the analysis capture utility size (number of billed customer connections), ownership structure (municipality or public service district), whether the utility operates more than one public water system, system age, infrastructure intensity (number of facilities), operator certification level, and primary water source.
For utilities operating multiple public water systems, selected characteristics, such as system age and operator certification, were aggregated using customer-weighted averages to better reflect the operational scale of each system. All water system characteristics were linked to the main dataset using the PWSID.

2.2.4. Service Area Characteristics

Socioeconomic characteristics of utility service areas may also affect water utility costs. To account for these factors, county level data from the ACS were used based on the counties served by each utility. Variables included are median household income and population density. Rural status was captured using a binary indicator based on Rural–Urban Continuum Codes (RUCC) published by the U.S. Department of Agriculture, in which counties with codes 1 to 3 were considered urban and those with codes 4 to 9 were considered rural.

2.3. Methods

This study employs a combination of descriptive and econometric methods to examine the relationship between BWA exposure and the financial outcomes of public water utilities in West Virginia.

2.3.1. Descriptive Analysis

Descriptive statistics are first used to summarize key characteristics of public water utilities, BWA exposure, and service area conditions. Summary measures include means, standard deviations, and ranges for financial variables, advisory frequency and duration measures, utility characteristics, and socioeconomic indicators. In addition, descriptive analyses are used to examine the distribution of BWA across utilities and to characterize the reported reasons for advisories. These descriptive results provide context for the empirical analysis and highlight variation in advisory exposure and utility characteristics across the study sample.

2.3.2. Econometric Specification

To assess the association between BWA exposure and utility financial outcomes, we estimate cross-sectional regression models of the following general form:
l n ( Y i ) =   α +   β B W A i +   X i γ + ε i
where Y i represents the financial outcome for utility i measured as operating deductions. The primary variable of interest B W A i captures boil water advisory exposure using alternative measures of advisory frequency and duration, including the proportion of the year under advisory, total advisory days, advisory counts, and average advisory duration in days. The vector X i includes set of control variables capturing utility size, infrastructure characteristics, governance structure, operator certification level, water source, and service area socioeconomic conditions. Specifically, controls include the number of customers served, gross utility plant, water charges, system age, infrastructure intensity, ownership type, rural status, median household income, and population density.
All continuous financial- and scale-related variables are specified in logarithmic form to reduce skewness and to allow coefficients to be interpreted as semi-elasticities. All models are estimated using ordinary least squares (OLS). Robust standard errors are used to account for heteroskedasticity.

3. Results

3.1. Descriptive Analysis Results

Table 1 presents summary statistics for the variables included in the analysis. On average, water utilities in West Virginia reported operating deductions of $1.24 million, although the distribution is highly skewed, with deductions ranging from $44,000 to more than $15.5 million. Utilities served an average of about 1900 customers, reflecting the predominance of small systems in the state, and the average utility age exceeded 50 years, highlighting the aging nature of water infrastructure in West Virginia.
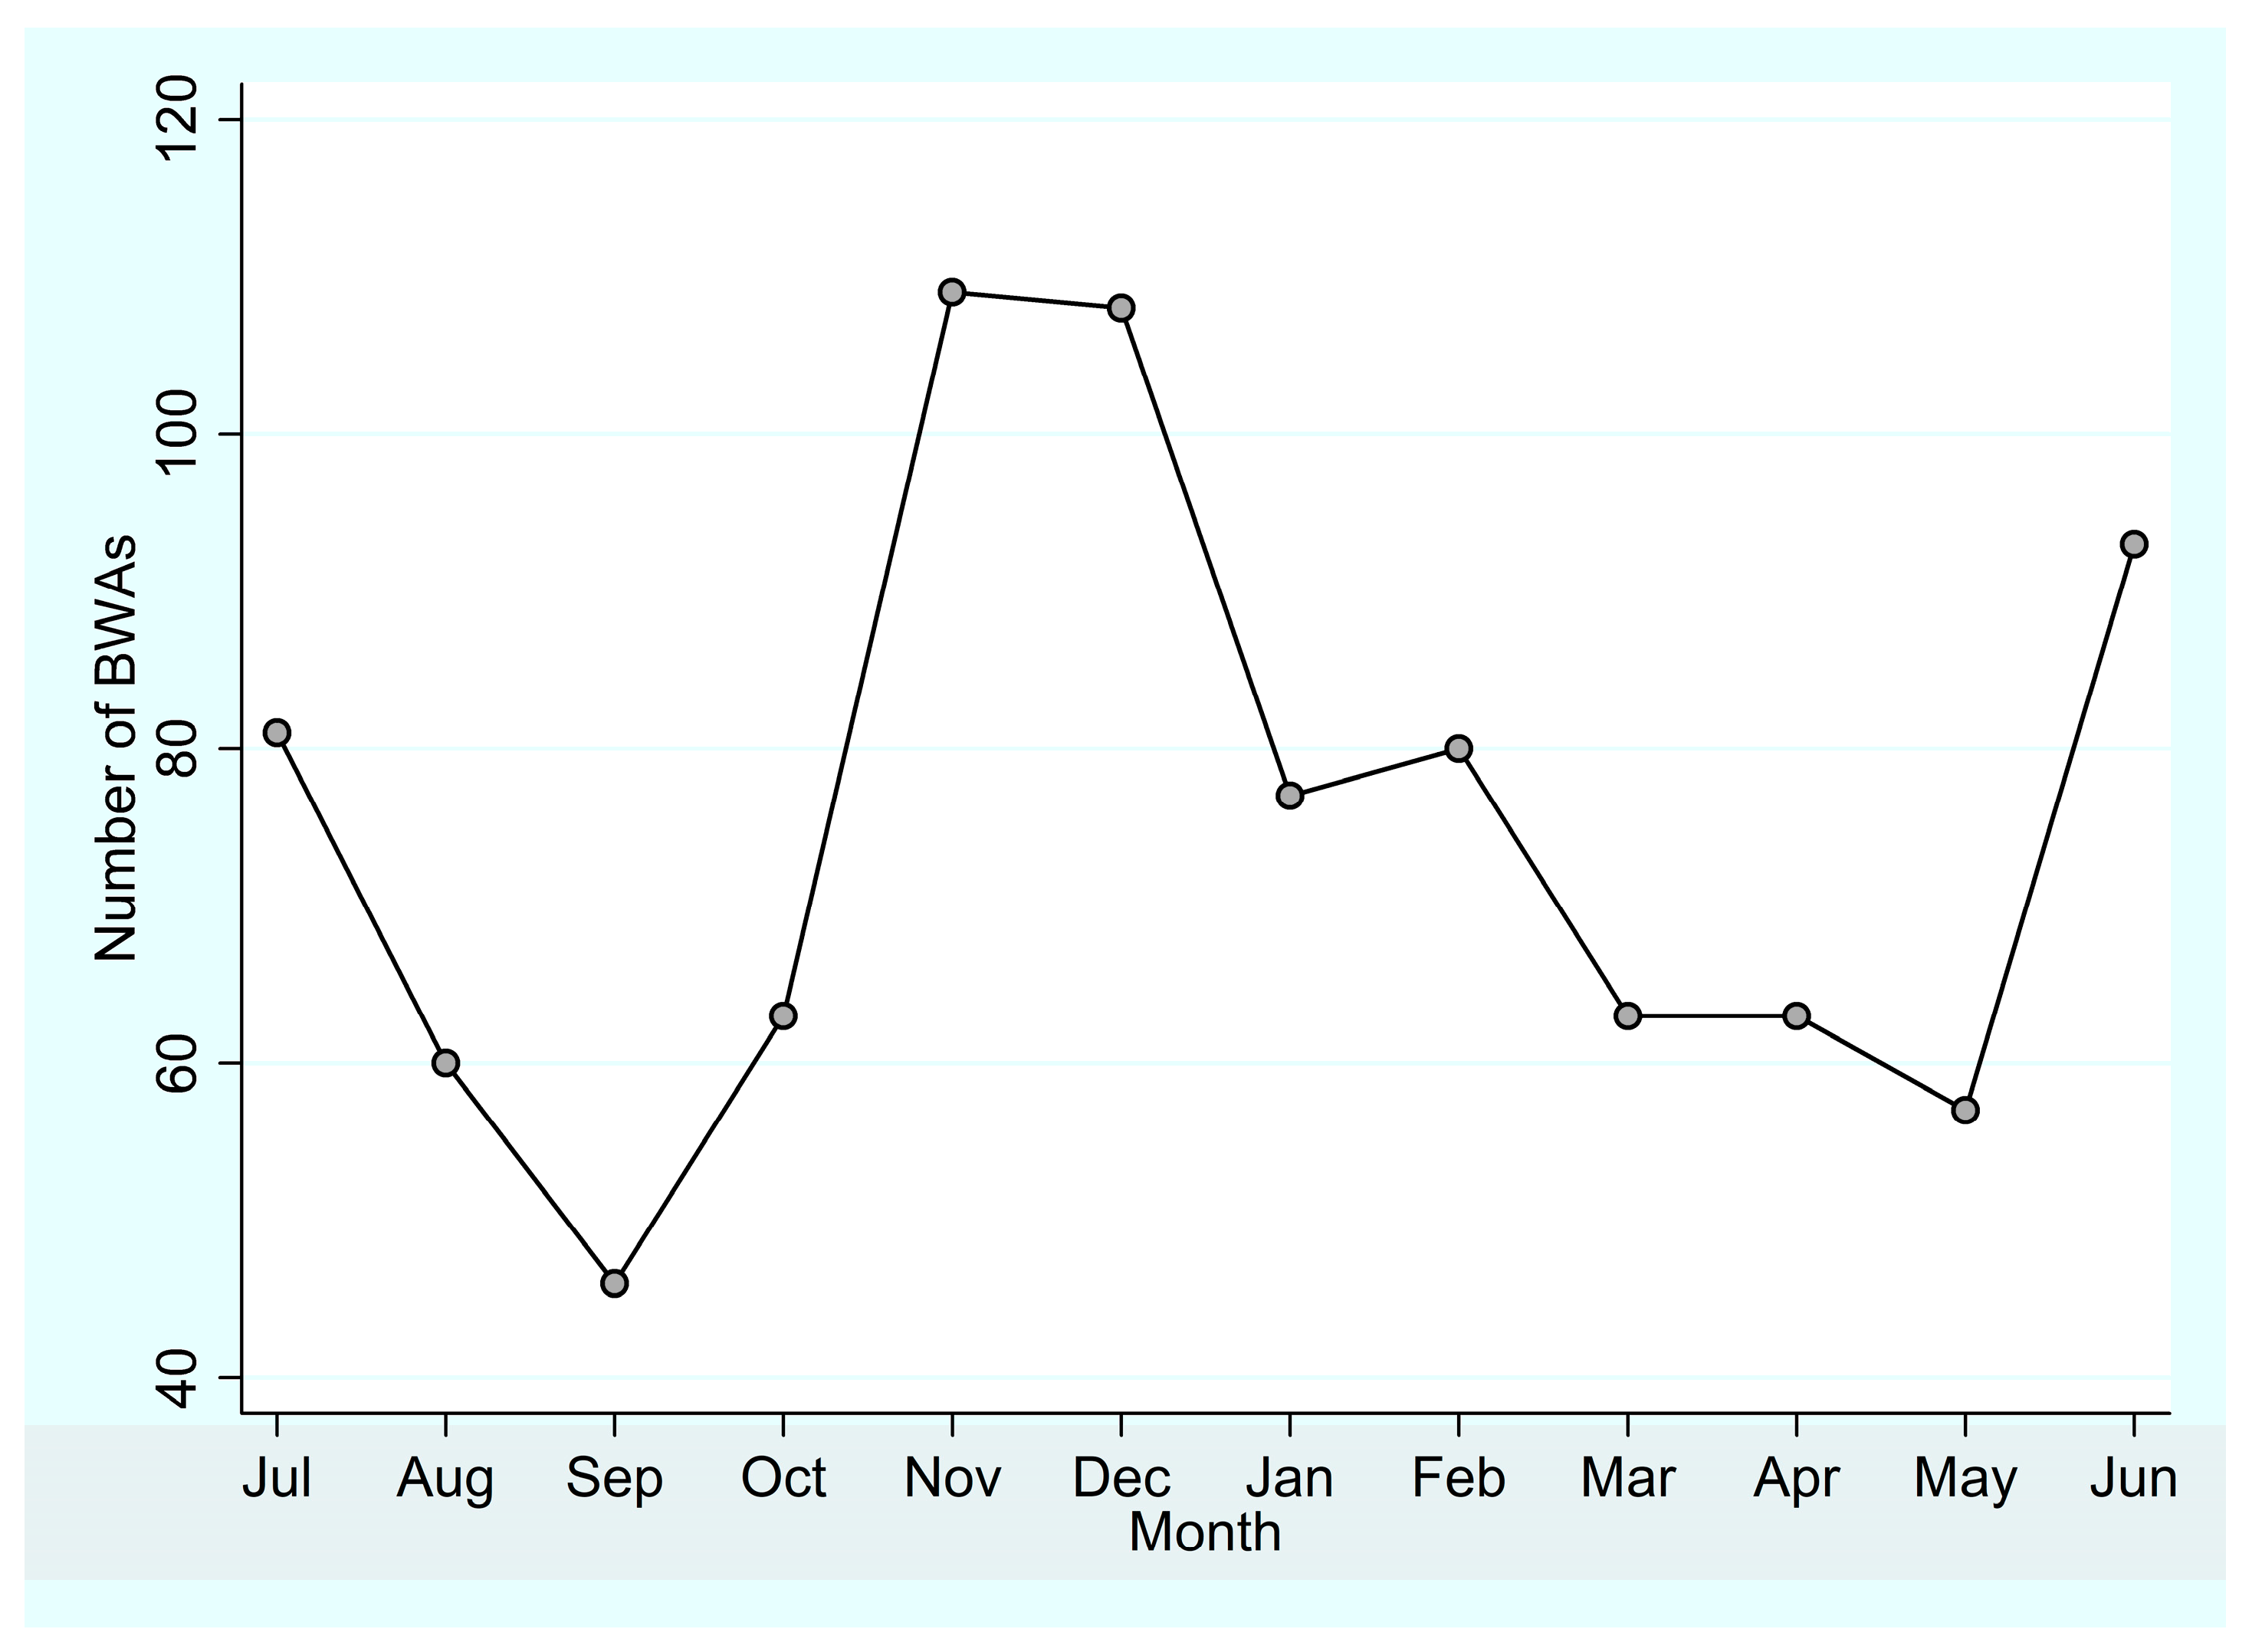
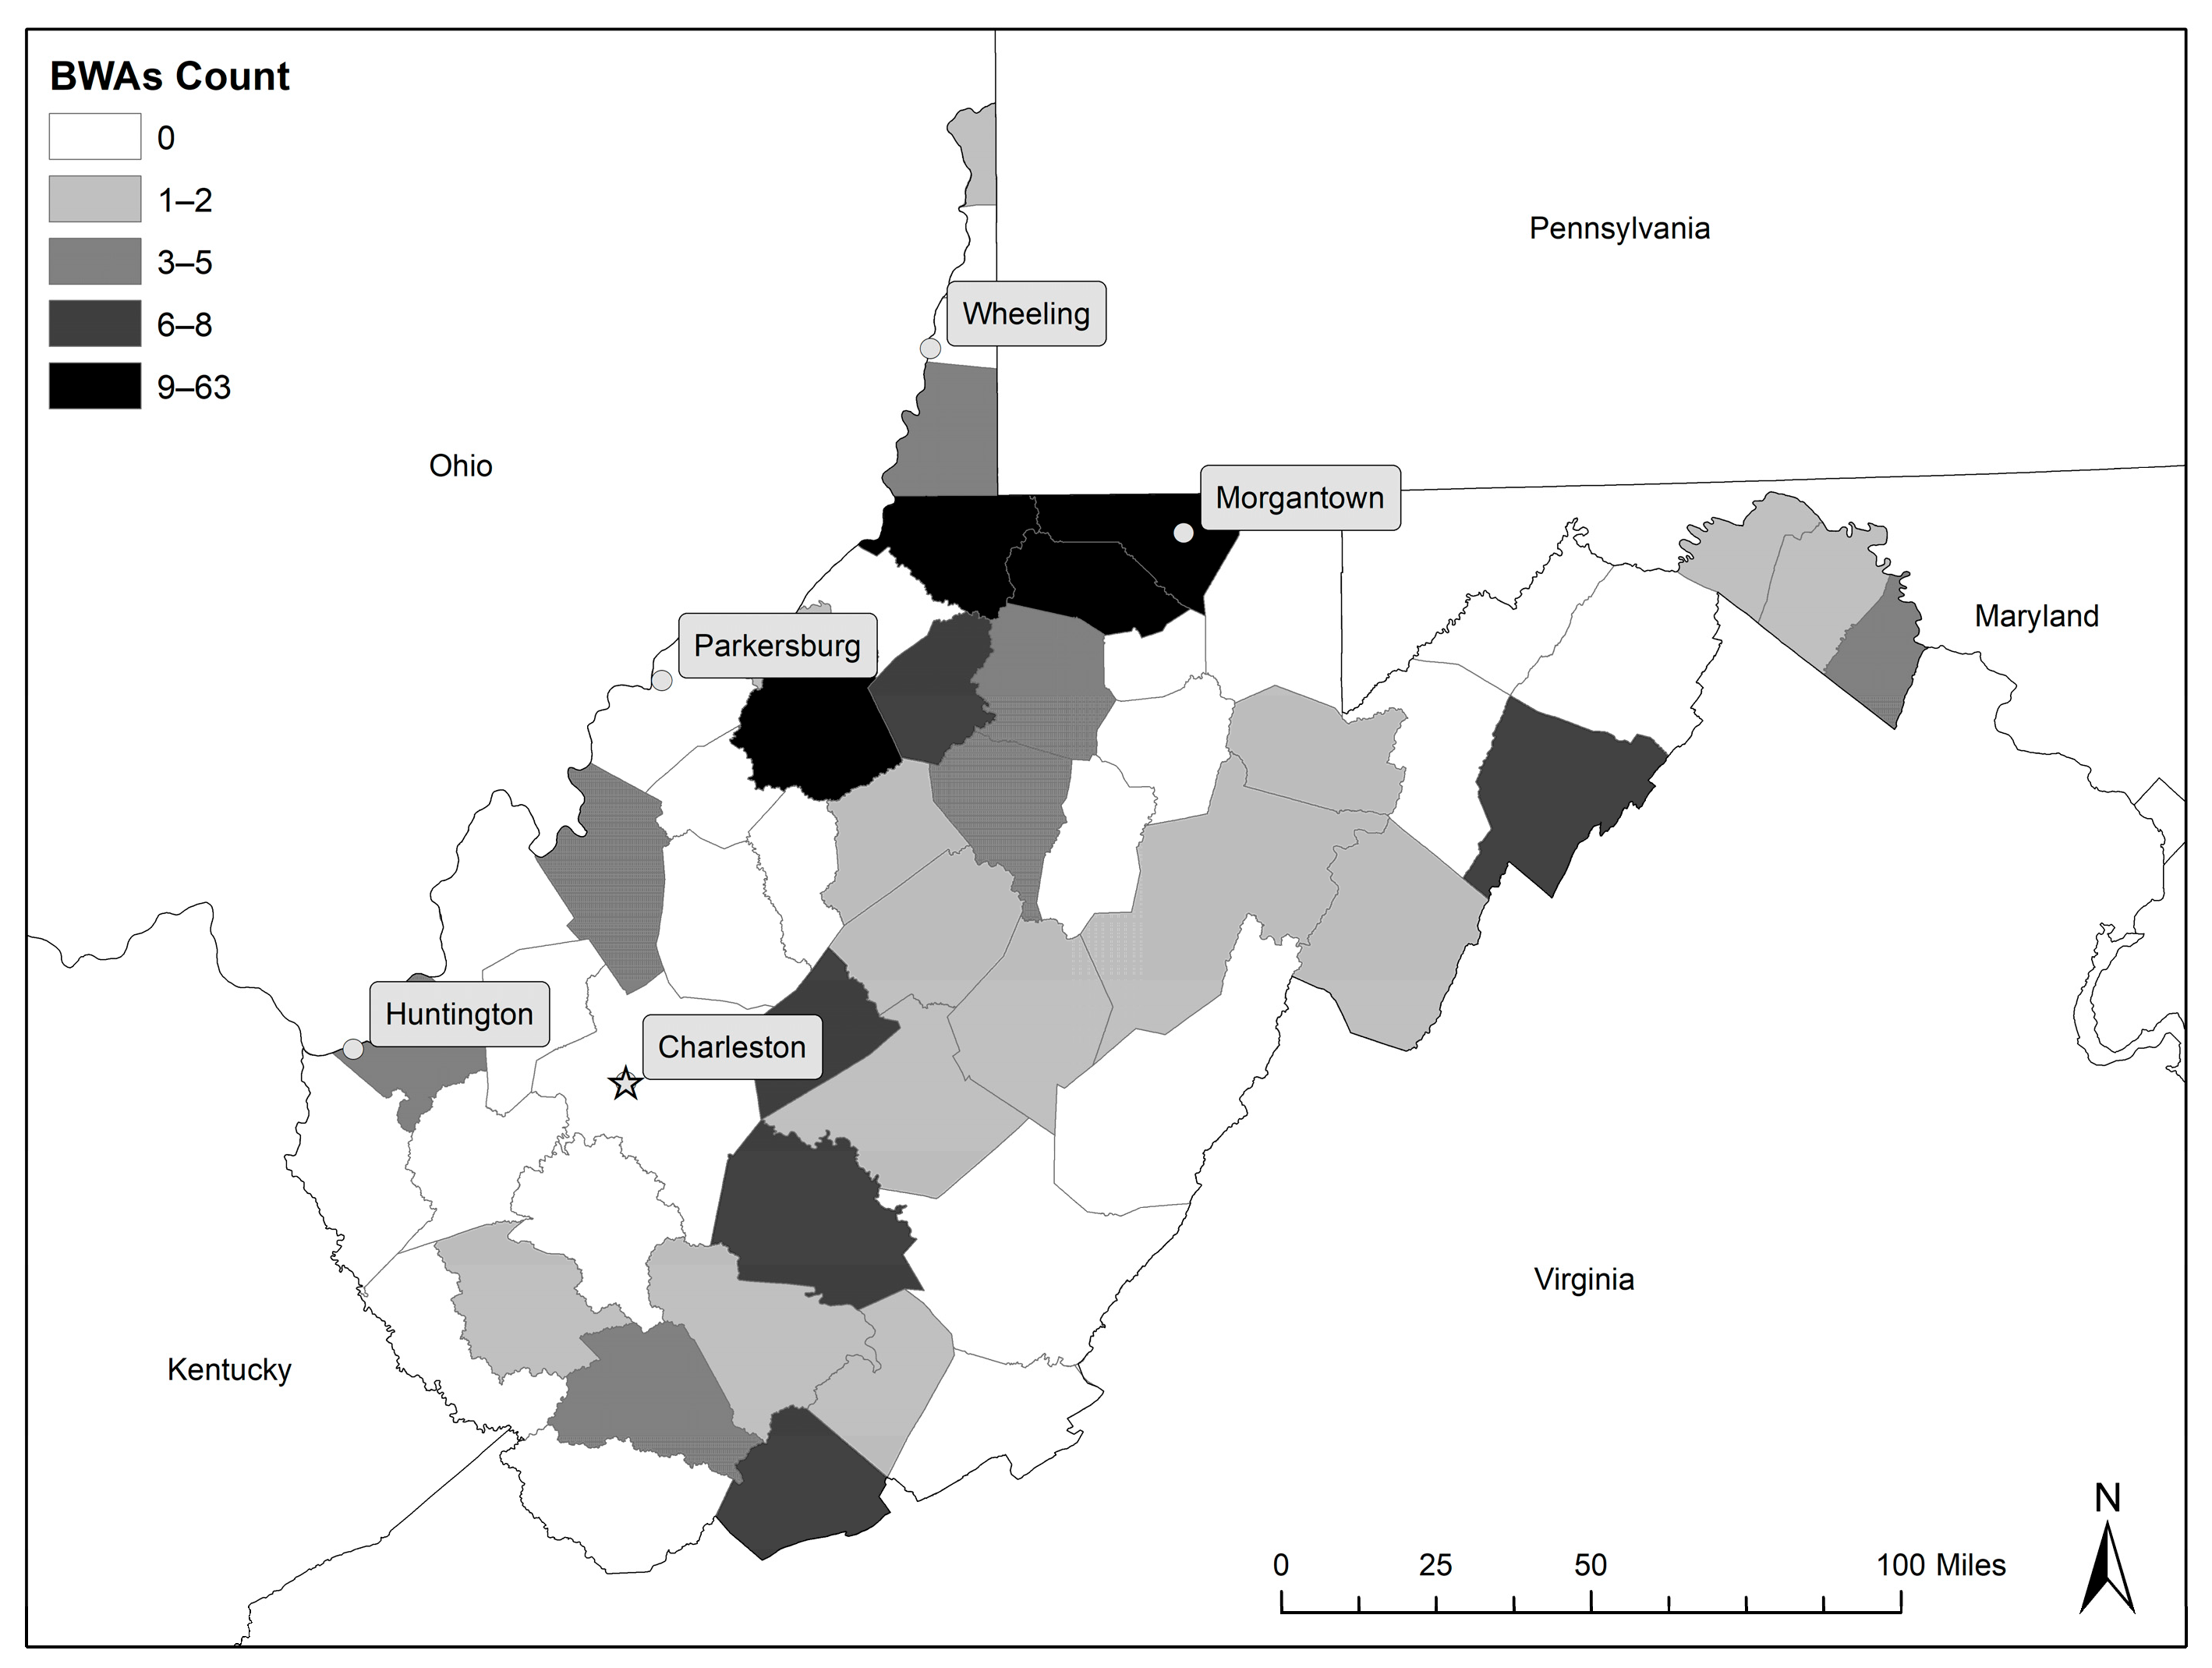
BWA exposure varies substantially across utilities. Figure 1 displays the monthly number of BWAs issued during the study period, showing noticeable month-to-month variation in advisory occurrence. The average utility issued 3.8 advisories during the study period, and 57% of utilities issued at least one BWA. Across all public water utilities, the average BWA duration was 6.3 days. Conditional on issuing at least one advisory, however, the average duration increased to approximately 11 days, indicating that advisories tend to persist for extended periods once they occur. When aggregated across the year, utilities spent an average of about 20 days under advisory, corresponding to approximately 5.4% of the year. However, maximum exposure reached more than 75% of the year for some systems, highlighting pronounced heterogeneity in advisory burden across utilities. This heterogeneity is shown in Figure 2, which illustrates the spatial distribution of BWAs across counties in West Virginia during the study period.
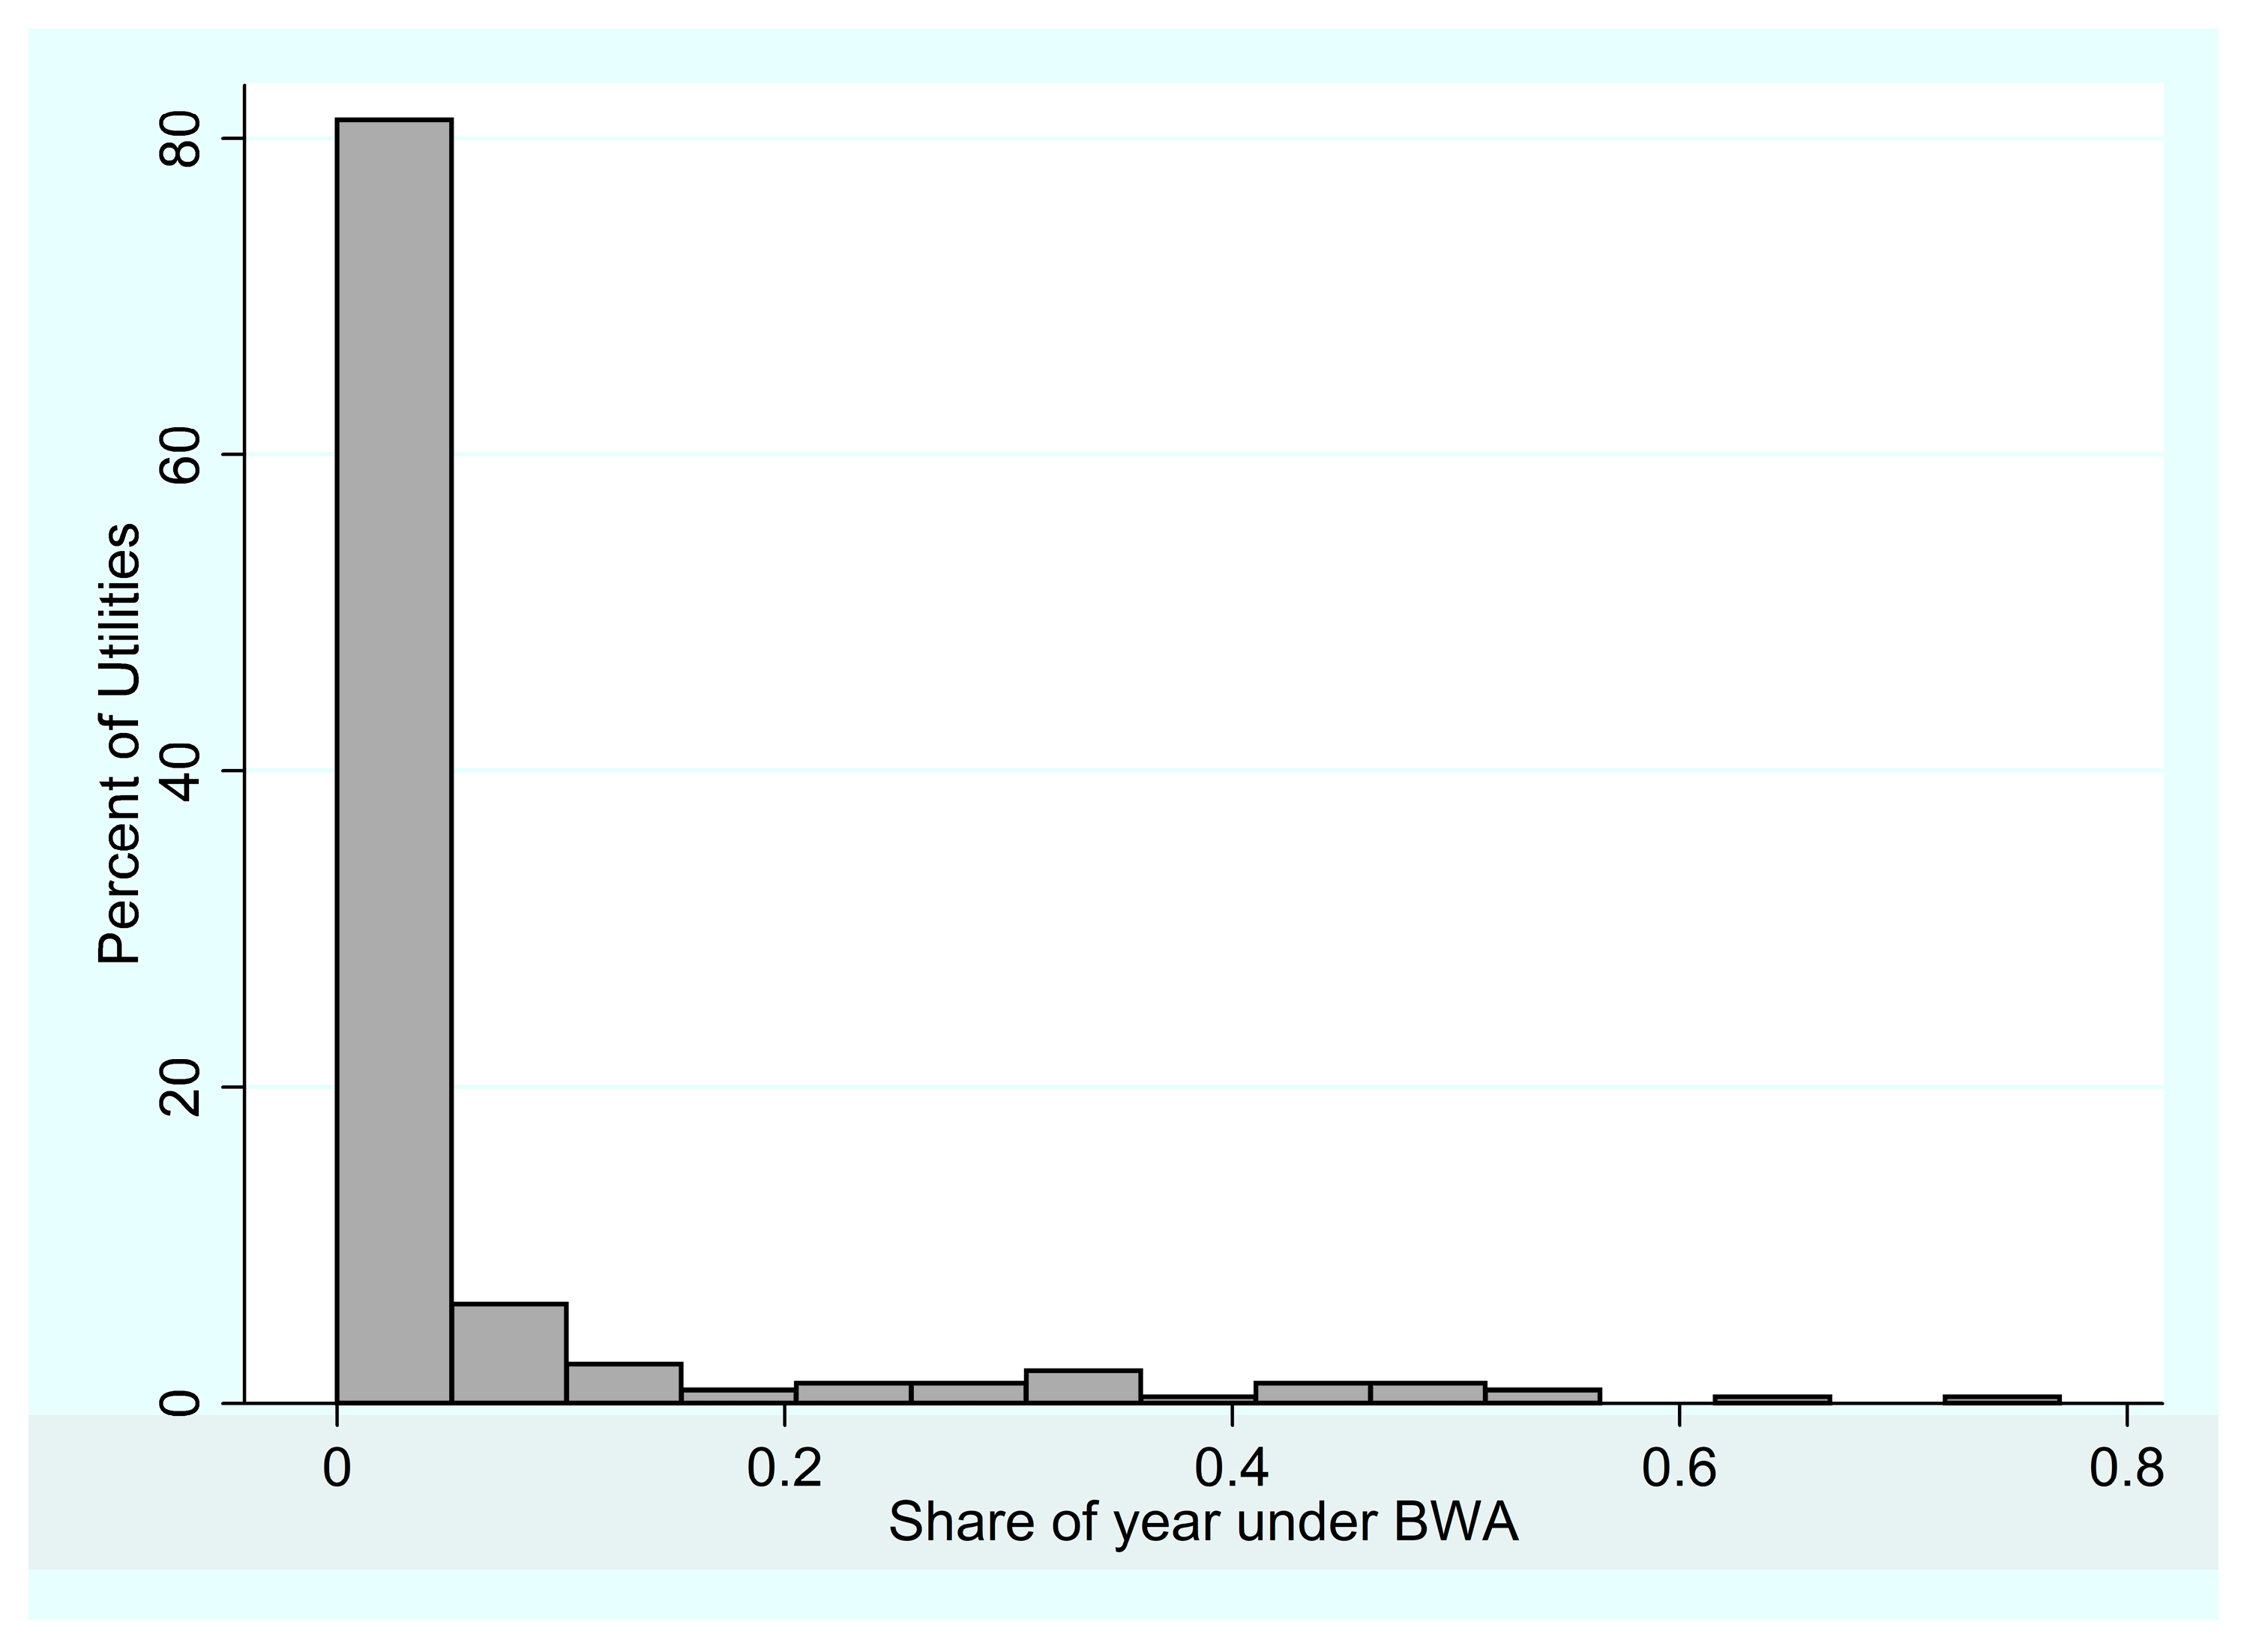
Figure 3 illustrates the distribution of the share of the year under BWA across public water utilities. The distribution is highly right-skewed, with a large mass at zero reflecting utilities that did not issue any advisories during the study period. Overall, nearly 80% of utilities spent less than about 5% of the year under BWA, while a smaller subset faced sustained or repeated advisories that accounted for a substantial portion of the year.
Table 2 summarizes the reported reasons for BWAs, grouped into broad categories based on keyword classification of advisory descriptions. Distribution system failures, such as main and line breaks, leaks, and ruptures, account for the majority of advisories, representing approximately 80% of all BWAs. Maintenance and planned repairs (other than water mains) constitute the second largest category (11.4%), followed by mechanical, power, or facility failures (4.1%). Water quality or regulatory issues, including turbidity exceedances and positive samples, account for less than 2% of advisories, while external or unknown causes represent approximately 2.6%.
Despite differences in underlying causes, the average advisory duration is relatively similar across categories, ranging from approximately 7 to 8 days. This suggests that while most advisories originate from infrastructure-related failures, the length of service disruption may be influenced by broader operational and logistical constraints rather than the specific triggering event alone. Overall, the descriptive results highlight the dominance of infrastructure-related failures in driving advisory incidence and highlight substantial variation in both advisory exposure and financial scale across public water utilities.

3.2. Regression Results

Table 3 report estimates of Equation (1) using alternative measures of BWA exposure while holding the same set of control variables ( X i ) constant across specifications. t Column (6) presents the preferred specification, which uses the share of the year under BWA as a comprehensive measure of exposure. This measure captures both the frequency and duration of advisories and is directly comparable across utilities of different sizes. All models are estimated using OLS with robust standard errors. Statistical significance is indicated using conventional notation (* p < 0.10, ** p < 0.05, and *** p < 0.01). Across specifications, indicators of BWA exposure are positively associated with operating deductions, though the magnitude and statistical significance vary by how exposure is measured. Models using simple counts or rates of advisories (columns 1–3) yield positive but generally imprecise estimates. In contrast, measures that capture the duration and cumulative intensity of advisories (columns 4–6) show more consistent and statistically significant relationships with utility costs.
Column (2) indicates that utilities issuing at least one BWA during the study period reported significantly higher operating deductions than utilities with no advisories. Specifically, the presence of any BWA is associated with approximately a 7.9% increase in operating deductions, holding other factors constant. While informative, this binary measure does not capture variation in advisory intensity across utilities.
Duration-based measures provide clearer evidence of the relationship between advisory exposure and operating deductions. Column (4) shows that longer average advisory duration is positively associated with operating deductions, with each additional day associated with approximately a 0.11% increase in operating deductions. Similarly, Column (5) indicates that cumulative advisory days are positively associated with operating deductions, with an additional day under advisory corresponding to a statistically significant increase in operating deductions.
The estimated coefficient in Column (6) for BWA exposure is 0.3005. In a log-linear specification, this coefficient implies that a one-unit increase in the share of the year under advisory (i.e., a utility spending an entire year under BWA) is associated with approximately a 35% increase in operating deductions ( e 0.3005 1 ) . For small changes in exposure, the semi-elasticity approximation implies that a one-day increase in advisory exposure is associated with an approximate 0.082% increase in operating deductions (1/365 × 0.3005). Evaluated at the sample mean of operating deductions reported in Table 1 ($1,235,350), this corresponds to roughly $1020 in additional operating deductions per utility for each additional day under advisory. This estimate is statistically significant at the 5% level and indicates that sustained or repeated advisories are associated with higher financial burdens for public water utilities.
Control variables behave largely as expected. Utility size, measured by the number of customers served, is strongly and positively associated with operating deductions across all models. Larger utilities also incur higher costs due to greater infrastructure scale, as reflected in the positive and statistically significant coefficients on gross utility plant. Residential water charges are positively associated with operating deductions, consistent with higher cost utilities charging higher rates. Utilities that rely on purchased water exhibit significantly higher operating deductions, reflecting contractual or wholesale supply costs.
Other utility characteristics, including utility age, governance structure, rural service area, and service area socioeconomic variables, are not consistently statistically significant. The operator certification level is positive and significant in some specifications, suggesting that higher certification may be associated with higher operating costs, though this relationship is not robust across all models.
Overall, the regression results indicate that BWA exposure is associated with higher operating deductions for public water utilities, even after accounting for scale, infrastructure, pricing, and service area characteristics. While count- and rate-based measures of BWA exposures are generally positive, their estimates are imprecise and statistically insignificant. In contrast, duration-based measures yield more consistent and statistically significant estimated associations with operating deductions, suggesting that the persistence of advisories may be more informative than simple frequency. These findings highlight the financial implications of water supply unreliability for utility operations.

4. Discussion

BWAs are not only public health alerts but also operational indicators of underlying financial pressures within public water systems. Across the different model specifications, cumulative BWA exposure is positively associated with operating deductions, and the relationship becomes strongest when exposure is measured in terms of duration rather than simple counts. In the preferred specification, each additional day under advisory is associated with an average increase of about $1020 in operating deductions per utility. For smaller and resource-constrained utilities, this magnitude may represent a meaningful financial burden.
The stronger statistical association observed for duration-based measures relative to advisory counts suggest that persistence in service disruptions may be more informative than the mere occurrence of BWA events. This finding is consistent with earlier work showing that duration-based unreliability indicators better reflect economic and welfare impacts than event counts [21]. A similar emphasis on persistence appears in the broader service interruption literature, where prolonged disruptions are often associated with costs that accumulate quickly and unevenly, far beyond what short, isolated events would suggest [31].
A closer look at the data provides some context for the large number of BWAs observed in the study period. Most advisories are reported to be triggered by distribution system failures (80%) such as water main breaks, pipe leaks, or ruptures, while maintenance activities account for another notable share (11%). These patterns suggest that advisories are frequently linked to the physical condition and operation of distribution network rather than to persistent contamination events. This interpretation is consistent with the broader infrastructure context in West Virginia, where water systems are often decades old, with an average utility age exceeding 50 years. State infrastructure assessments also indicate substantial investment needs exceeding $3 billion, of which only about 10% has been funded [38].
Frequent maintenance activities may also help explain why advisories recur in many utilities. Water distribution systems in fragmented, rural settings such as West Virginia operate under several structural constraints that could increase the likelihood of service interruptions. Mountainous terrain can place additional stress on pipelines and complicate repair logistics, while extreme weather events periodically impose demands on systems with limited redundancy. In addition, small utilities often operate with limited technical staff, constrained operator certification levels, and minimal monitoring capacity. During infrastructure repairs, such as fixing a broken main, connecting new pipeline sections, or conducting flushing operations, temporary pressure fluctuations may occur. In such situations, utilities may issue precautionary advisories until laboratory testing confirms that the water supply remains safe. Although these advisories are temporary, repeated infrastructure failures or repair activities may result in a relatively high number of advisories over time.
The results also align with the established literature on water utility cost structures. The positive associations between operating deductions, customer base, and gross utility plant are consistent with evidence that fragmented systems with aging infrastructure often experience diseconomies of scale, particularly when operating under limited managerial and financial capacity [27,29,39]. In such settings, emergency repairs, compliance activities, and advisory-related operational responses cannot easily be spread across a large customer base, amplifying per-unit costs. Evidence from a range of institutional contexts similarly indicates that unplanned service interruptions and infrastructure failures are associated with higher operating and capital expenditures [8,34].
Much of the existing work on BWAs, however, has looked outward (e.g., bottled water purchases [22], health outcomes [24], school absenteeism [23], and property values [21]) rather than inward, focusing on household behavior, compliance, and welfare impacts rather than utility accounting costs. For example, a meta-analysis on public compliance to BWAs synthesizes evidence on community-level costs and notes substantial per-household or per-person burdens during disruptions, including the well-documented costs associated with outbreak and advisory responses [14]. Those impacts matter, of course, but they leave the utility side in the background. BWAs have nontrivial, multi-channel costs (e.g., administrative response, communication, field operations, flushing, monitoring, and corrective actions), highlighting the need for better measurement of both direct and indirect consequences [40]. The per-day cost estimates presented here are not directly comparable to household welfare losses, yet they fill an important gap by showing that advisories impose parallel burdens on providers as well as users of water services [9,24]. From this perspective, BWAs are not simply short-lived warnings but operational events that may also have economic implications across different parts of the drinking water system.
In practical terms, much of the financial burden associated with BWAs is borne by water utilities and municipalities through increased operational expenditures. Responding to a BWA is not simply a matter of issuing a public notice. Utilities must mobilize staff, conduct additional water quality testing, flush affected sections of the distribution system, and communicate with residents and local institutions. These operational steps require time, equipment, and laboratory capacity. Some of the associated costs may later be reflected in regulated water rates, yet utilities frequently absorb much of the immediate burden within their operating budgets. For smaller systems with limited revenue bases, repeated advisories can therefore place noticeable pressure on operational finances.
The findings also suggest that BWAs may have an operational and financial dimension beyond their role as a compliance or public communication mechanisms. Explicitly recognizing reliability-related costs in rate cases and infrastructure funding decisions may help improve financial sustainability while maintaining transparency for customers. From a policy perspective, addressing the infrastructure conditions associated with repeated advisories could potentially reduce both the frequency of BWAs and the operational pressures faced by utilities. Municipalities typically rely on a combination of local utility revenues, state infrastructure programs, and federal funding initiatives to support large-scale upgrades of water systems. However, when such investments are delayed or insufficient, utilities may continue to rely on temporary repairs and precautionary advisories as part of routine system management. In this context, improving infrastructure reliability may represent an important pathway for reducing both the operational pressures associated with repeated advisories and the financial burdens faced by public water utilities.
Several limitations should be acknowledged, and they point to clear directions for future research. First, the analysis focuses on publicly owned utilities; private utilities were not included even though they accounted for roughly 60% of BWAs issued in West Virginia during the study period. At the same time, private systems serve a comparatively small share of the state population (about 15%), so the results remain highly relevant for the majority of residents served by public systems, although generalizability to the full universe of utilities is limited. Second, the cross-sectional design limits causal interpretation and may be subject to omitted variable bias if unobserved factors correlate with both advisory exposure and operating deductions. Accordingly, the results should be interpreted as associations rather than causal effects. Future work using panel data and utility fixed effects or quasi-experimental designs could improve identification and allow clearer separation of short-run advisory-response costs from longer-run infrastructure-related cost dynamics. Third, BWA exposure is measured at the utility level; more granular measures (e.g., the percentage of the served population or number of connections affected by each advisory) would improve measurement, particularly where advisories are geographically localized within service areas. Linking spatial advisory data with customer records or census information may help clarify who ultimately bears the costs of service unreliability, both within and across utilities. Fourth, the dependent variable, operating deductions, is a broad financial measure that captures overall utility expenditures and does not isolate the direct costs attributable specifically to BWA events. Finally, while the results indicate a statistically significant association between BWA exposure and operating deductions, the analysis does not identify a specific operational channels (e.g., labor, compliance, or emergency repairs) through which advisories may be associated with higher costs. Future research could explore the heterogeneous cost effects of BWAs across these expenditure categories to better understand how advisory exposure relates with utility costs.

5. Conclusions

This study provides evidence of a measurable association between BWA exposure and the financial outcomes of public water utilities. Using data from 239 publicly owned community water systems in West Virginia, the analysis finds a statistically significant positive association between cumulative BWA exposure and operating revenue deductions, with duration-based exposure measures outperforming simple advisory counts. The results suggest that service reliability disruptions may have financial implications for water utilities in addition to their well-recognized public health dimension, particularly for small and resource-constrained systems.
The findings may also reflect broader challenges related to operational practices and long-term system sustainability. In many systems, BWAs appear to be issued repeatedly in response to infrastructure failures or routine maintenance activities, rather than being prevented through proactive infrastructure renewal. While advisories serve an important precautionary role in protecting public health, their frequent use may indicate underlying structural pressures within the distribution network.
Several directions for policy consideration and future research are suggested by these findings. First, utilities and regulatory agencies may benefit from prioritizing infrastructure rehabilitation programs that address aging pipelines and distribution system failures, which account for the majority of advisories. Second, water utilities could consider incorporating reliability indicators into infrastructure planning and financial decision-making. In particular, monitoring cumulative advisory duration may provide a more informative signal of system vulnerability than simply counting advisory events. Third, policymakers may consider expanding financial support mechanisms for small and rural utilities that lack the resources needed for major infrastructure upgrades. Finally, improving data collection on BWAs could help strengthen future policy responses.
Overall, incorporating reliability considerations into infrastructure investment planning, regulatory oversight, and rate-setting processes may help enhance both the resilience and financial sustainability of public drinking water systems. Future research using panel data, broader geographic coverage, and disaggregated cost outcomes will be needed to establish the causal mechanisms and policy-relevant magnitudes that the present design can only begin to suggest.

Author Contributions

Conceptualization, F.A. and R.T.; methodology, F.A.; software, F.A.; validation, R.T.; formal analysis, F.A.; data curation, F.A.; writing—original draft preparation, F.A. and R.T.; writing—review and editing, F.A. and R.T.; visualization, F.A. All authors have read and agreed to the published version of the manuscript.

Funding

This work was supported by the Deanship of Scientific Research, Vice Presidency for Graduate Studies and Scientific Research, King Faisal University, Saudi Arabia [Grant No. KFU260472].

Data Availability Statement

Data derived from public domain resources, [Public Service Commission of West Virginia] [https://www.psc.state.wv.us/] accessed on 2 November 2025; [West Virginia Office of Environmental Health Services Boil Water Advisory Data Portal] [https://oehsportal.wvdhhr.org/boilwater] accessed on 15 December 2025; [U.S. Environmental Protection Agency’s Safe Drinking Water Act Information System] [https://sdwis.epa.gov/ords/sfdw_pub/f?p=SDWIS_FED_REPORTS_PUBLIC] accessed on 28 October 2025; [U.S. Census Bureau’s American Community Survey] [https://www.census.gov/programs-surveys/acs.html] accessed on 31 December 2025; [U.S. Department of Agriculture (USDA) Rural-Urban Continuum Codes (RUCC)] [https://www.ers.usda.gov/data-products/rural-urban-continuum-codes] accessed on 31 December 2025.

Conflicts of Interest

The authors declare no conflicts of interest.

References

  1. Wakhungu, M.J.; Abdel-Mottaleb, N.; Wells, E.C.; Zhang, Q. Geospatial Vulnerability Framework for Identifying Water Infrastructure Inequalities. J. Environ. Eng. 2021, 147, 04021034. [Google Scholar] [CrossRef]
  2. Grigg, N. Aging Water Infrastructure in the United States. In Resilient Water Services and Systems: The Foundation of Well-Being; Juuti, P., Mattila, H., Rajala, R., Schwartz, K., Staddon, C., Eds.; IWA Publishing: London, UK, 2019; pp. 31–45. ISBN 978-1-78040-977-1. [Google Scholar]
  3. Alzahrani, F.; Tawfik, R. Factors Associated with Public Water Supply Unreliability. Water 2024, 16, 1446. [Google Scholar] [CrossRef]
  4. Seeger, M.; McElmurry, S.P. Larger Lessons from the Jackson Mississippi and Flint Water Crises. Nat. Water 2023, 1, 317–318. [Google Scholar] [CrossRef]
  5. American Society of Civil Engineers. Drinking Water Infrastructure Report Card. 2025. Available online: https://infrastructurereportcard.org/wp-content/uploads/2025/03/Drinking-Water.pdf (accessed on 4 January 2026).
  6. Burke, E.B.; Burks, B.; Poree, J. Lost Water: Challenges and Opportunities; S&P Global Ratings: New York, NY, USA, 2023. [Google Scholar]
  7. Utah Water Research Laboratory. Water Main Break Rates in the USA and Canada: A Comprehensive Study; Utah State University: Logan, UT, USA, 2023. [Google Scholar]
  8. Baird, G.M. Fasten Your Seat Belts: Main Breaks and the Issuance of Precautionary Boil-water Notices. J. AWWA 2011, 103, 24–28. [Google Scholar] [CrossRef]
  9. Allaire, M.; Wu, H.; Lall, U. National Trends in Drinking Water Quality Violations. Proc. Natl. Acad. Sci. USA 2018, 115, 2078–2083. [Google Scholar] [CrossRef]
  10. Bandala, E.R.; Ayoko, G.A.; Goonetilleke, A. Disparities in Drinking Water Security: Implications for Achieving SDG 6 in Native American Nations in the United States. Environ. Justice 2026, 19394071251414501. [Google Scholar] [CrossRef]
  11. Alzahrani, F.; Tawfik, R. Public Water Service Disruptions: A Descriptive Analysis of Boil Water Advisories. Water 2024, 16, 443. [Google Scholar] [CrossRef]
  12. Tomko, B.; Nittrouer, C.L.; Sanchez-Vila, X.; Sawyer, A.H. Disparities in Disruptions to Public Drinking Water Services in Texas Communities during Winter Storm Uri 2021. PLoS Water 2023, 2, e0000137. [Google Scholar] [CrossRef]
  13. Moghaddam-Ghadimi, S.; Tam, A.; Khan, U.T.; Gora, S.L. How Might Climate Change Impact Water Safety and Boil Water Advisories in Canada? FACETS 2023, 8, 1–21. [Google Scholar] [CrossRef]
  14. Vedachalam, S.; Spotte-Smith, K.T.; Riha, S.J. A Meta-Analysis of Public Compliance to Boil Water Advisories. Water Res. 2016, 94, 136–145. [Google Scholar] [CrossRef]
  15. U.S. Environmental Protection Agency. National Occurrence and Causes of Boil Water Advisories in the United States: Report to Congress. 2024. Available online: https://www.epa.gov/system/files/documents/2025-01/10586_boil-water-advisories_final_rtc_20240603_admin.pdf (accessed on 4 January 2026).
  16. Safarpour, H.; Spearing, L.A. Temporal Public Perceptions and Experiences during Water Service Disruptions: The Case of Jackson, Mississippi. Environ. Res. Infrastruct. Sustain. 2024, 4, 015003. [Google Scholar] [CrossRef]
  17. Li, D.; Saigal, R.; Adriaens, P. Impact of Flooding and Drought Risks on the Cost of Bond Financing for Water Utilities. Environ. Sci. Technol. 2024, 58, 14068–14077. [Google Scholar] [CrossRef] [PubMed]
  18. Blette, V. Drinking Water Public Right-to-Know Requirements in the United States. J. Water Health 2008, 6, 43–51. [Google Scholar] [CrossRef] [PubMed]
  19. Lane, K.; Tobiason, J.; Reckhow, D.; Kumpel, E. Comparing the Economic, Environmental, and Exposure Impacts of Options for Coming into Compliance with Drinking Water Regulations in Very Small Water Systems in the US. Environ. Res. Infrastruct. Sustain. 2025, 5, 015024. [Google Scholar] [CrossRef]
  20. Ailes, E.; Budge, P.; Shankar, M.; Collier, S.; Brinton, W.; Cronquist, A.; Chen, M.; Thornton, A.; Beach, M.J.; Brunkard, J.M. Economic and Health Impacts Associated with a Salmonella Typhimurium Drinking Water Outbreak−Alamosa, CO, 2008. PLoS ONE 2013, 8, e57439. [Google Scholar] [CrossRef]
  21. Alzahrani, F.; Collins, A.R. Impact of Public Water Supply Unreliability on Residential Property Prices in Marion County, West Virginia. Agric. Resour. Econom. Rev. 2022, 51, 105–129. [Google Scholar] [CrossRef]
  22. Alzahrani, F.; Erfanian, E.; Collins, A.R. Drinking Water Contamination and Avoidance Behavior: Do Bottled Water Sales Adequately Measure the Cost of This Behavior? Urban Water J. 2023, 20, 112–122. [Google Scholar] [CrossRef]
  23. Kim, M.; De Vito, R.; Duarte, F.; Tieskens, K.; Luna, M.; Salazar-Miranda, A.; Mazzarello, M.; Showalter Otts, S.; Etzel, C.; Burks, S.; et al. Boil Water Alerts and Their Impact on the Unexcused Absence Rate in Public Schools in Jackson, Mississippi. Nat. Water 2023, 1, 359–369. [Google Scholar] [CrossRef]
  24. Rothenberg, S.E.; Furrer, J.M.; Ingram, L.A.; Ashford-Carroll, T.S.; Foster, S.A.; Hystad, P.; Hynes, D.M.; Navab-Daneshmand, T.; Branscum, A.J.; Kruearat, P. Sanitary Sewage Overflows, Boil Water Advisories, and Emergency Room and Urgent Care Visits for Gastrointestinal Illness: A Case-Crossover Study in South Carolina, USA, 2013–2017. J. Expo. Sci. Environ. Epidemiol. 2023, 33, 102–110. [Google Scholar] [CrossRef]
  25. Lane, K.; Gagnon, G. Evaluating the Use and Intent of Drinking Water Advisories in Atlantic Canada. Water Policy 2020, 22, 908–924. [Google Scholar] [CrossRef]
  26. Blokus-Dziula, A.; Dziula, P.; Kamedulski, B.; Michalak, P. Operation and Maintenance Cost of Water Management Systems: Analysis and Optimization. Water 2023, 15, 3053. [Google Scholar] [CrossRef]
  27. Guerrini, A.; Romano, G.; Campedelli, B. Factors Affecting the Performance of Water Utility Companies. Int. J. Public Sect. Manag. 2011, 24, 543–566. [Google Scholar] [CrossRef]
  28. Worthington, A.C. A Review of Frontier Approaches to Efficiency and Productivity Measurement in Urban Water Utilities. Urban Water J. 2014, 11, 55–73. [Google Scholar] [CrossRef]
  29. Ferro, G.; Lentini, E.J.; Mercadier, A.C. Economies of Scale in the Water Sector: A Survey of the Empirical Literature. J. Water Sanit. Hyg. Dev. 2011, 1, 179–193. [Google Scholar] [CrossRef]
  30. Berg, S.; Marques, R. Quantitative Studies of Water and Sanitation Utilities: A Benchmarking Literature Survey. Water Policy 2011, 13, 591–606. [Google Scholar] [CrossRef]
  31. Molinos-Senante, M.; Porcher, S.; Maziotis, A. Impact of Regulation on English and Welsh Water-Only Companies: An Input-Distance Function Approach. Environ. Sci. Pollut. Res. 2017, 24, 16994–17005. [Google Scholar] [CrossRef]
  32. Maziotis, A.; Villegas, A.; Molinos-Senante, M.; Sala-Garrido, R. Impact of External Costs of Unplanned Supply Interruptions on Water Company Efficiency: Evidence from Chile. Util. Policy 2020, 66, 101087. [Google Scholar] [CrossRef]
  33. Bhattacharyya, A.; Harris, T.R.; Narayanan, R.; Raffiee, K. Specification and Estimation of the Effect of Ownership on the Economic Efficiency of the Water Utilities. Reg. Sci. Urban Econ. 1995, 25, 759–784. [Google Scholar] [CrossRef]
  34. Molinos-Senante, M.; Maziotis, A.; Sala-Garrido, R. Benchmarking the Economic and Environmental Performance of Water Utilities: A Comparison of Frontier Techniques. Benchmarking Int. J. 2022, 29, 3176–3193. [Google Scholar] [CrossRef]
  35. U.S. Census Bureau West Virginia Profile. Available online: https://data.census.gov/profile/West_Virginia?g=040XX00US54 (accessed on 31 December 2025).
  36. Plance, V.A. Report to the Governor: West Virginia Public Water System Capacity Development Program; West Virginia Department of Environmental Protection: Charleston, WV, USA, 2023. [Google Scholar]
  37. U.S. Environmental Protection Agency SDWIS Federal Reporting Services. Available online: https://sdwis.epa.gov/ords/sfdw_pub/r/sfdw/sdwis_fed_reports_public/200 (accessed on 31 December 2025).
  38. West Virginia Infrastructure and Jobs Development Council. 2023 Needs Assessment. 2023. Available online: http://www.wvinfrastructure.com/project-dashboard/pdf/policiesGuidelines/2023NeedsAssessment.pdf (accessed on 4 January 2026).
  39. Baranzini, A.; Faust, A.-K. The Cost Structure of Water Utilities in Switzerland; Haute École de Gestion de Genève: Genève, Switzerland, 2010; 13p. [Google Scholar]
  40. Identifying the Gaps in Understanding the Benefits and Costs of Boil Water Advisories. Available online: https://www.waterrf.org/research/projects/identifying-gaps-understanding-benefits-and-costs-boil-water-advisories (accessed on 24 January 2026).
Figure 1. Monthly BWAs in West Virginia (July 2022–June 2023).
Water 18 00770 g001
Figure 2. Spatial distribution of BWAs by county in West Virgina (July 2022–June 2023).
Water 18 00770 g002
Figure 3. Histogram of the Share of the Year Under Boil Water Advisory (BWA).
Water 18 00770 g003
Table 1. Summary Statistics.
Variable (Unit)MeanStd. Dev.MinMax
Utility Financial Variables
Operating deductions ($M)1.2351.7820.04415.553
Residential water charge ($)56.20415.47118.75099.140
Gross utility plant ($M)14.83423.8350.276213.257
BWAs Related Variables
Number of BWAs3.7669.357071
BWA event (0/1)0.5730.49601
BWAs per 1000 customers2.2974.610056.250
Average BWA duration (days)6.34123.1990281
Total BWA days19.68645.0860281
Share of year under BWA0.0540.12400.770
Water Utility Characteristics
Customers served (connections)1905.8743333.3241729,992
Utility age (years)54.01715.803483
Facilities per 1000 customers31.874257.9991.3554000
Operator certification level (1–5)2.1591.08515
Surface water source (0/1)0.3770.48601
Purchased water source (0/1)0.4020.49101
Public service district (0/1)0.4390.49701
Multiple PWSs operated (0/1)0.1260.33201
Service Area Characteristics
Rural service area (0/1)0.6650.47301
Median household income ($000)55.2829.51829.98095.523
Population density (per sq. mile)101.65396.2818.354395.956
Table 2. Reported Reasons for Boil Water Advisories (Percent of total advisories, N = 900).
Reason CategoryShare of BWAs (%)Average Duration (Days)
Distribution system failures
(main/line breaks, leaks, ruptures)
80.0%7.1
Maintenance and planned repairs
(repairs, replacements, tie-ins, flushing)
11.4%7.7
Mechanical, power, or facility failures
(pumps, tanks, booster stations, power outages)
4.1%7.2
Water quality or regulatory issues
(turbidity, chlorine, violations, positive samples)
1.9%7.5
External or unknown causes
(contractor damage, storms, flooding, unknown)
2.6%8.2
Total100.0%
Notes: Categories are based on reported advisory descriptions and grouped using keyword classification. Average duration reflects the mean number of days for advisories within each category.
Table 3. Regression Results—Boil Water Advisory Exposure and Operating Deductions.
Dep. Variable: ln (Operating Deductions)(1)(2)(3)(4)(5)(6)
Number of BWAs0.0034
(0.0022)
BWA event 0.0790 *
(0.0407)
BWAs per 1000 customers 0.0083
(0.0058)
Average BWA duration 0.0011 *
(0.0007)
Total BWA days 0.0008 **
(0.0004)
Share of year under BWA 0.3005 **
(0.1419)
ln (Customers served)0.4870 ***0.4807 ***0.4899 ***0.4876 ***0.4852 ***0.4852 ***
(0.1402)(0.1378)(0.1392)(0.1393)(0.1382)(0.1382)
ln (Residential Water charge)0.2132 **0.1915 **0.1927 **0.1898 **0.1921 **0.1921 **
(0.0902)(0.0912)(0.0908)(0.0932)(0.0914)(0.0914)
ln (Gross utility plant)0.3493 ***0.3586 ***0.3667 ***0.3590 ***0.3584 ***0.3584 ***
(0.0670)(0.0676)(0.0684)(0.0691)(0.0679)(0.0679)
Utility age0.00140.00110.00110.00130.00140.0014
(0.0016)(0.0016)(0.0016)(0.0016)(0.0016)(0.0016)
ln (Facilities per 1000 customers)−0.0625−0.0555−0.0560−0.0575−0.0570−0.0570
(0.1132)(0.1106)(0.1121)(0.1111)(0.1102)(0.1102)
Operator certification level0.06350.0916 **0.07220.0826 *0.07000.0700
(0.0463)(0.0454)(0.0471)(0.0444)(0.0455)(0.0455)
Surface water source0.09770.06810.10200.08600.09690.0969
(0.0649)(0.0617)(0.0625)(0.0638)(0.0642)(0.0642)
Purchased water source0.1591 **0.1890 **0.1757 **0.1770 **0.1586 **0.1586 **
(0.0796)(0.0764)(0.0785)(0.0762)(0.0773)(0.0773)
Public service district0.03310.02090.03280.03820.03790.0379
(0.0619)(0.0600)(0.0616)(0.0620)(0.0619)(0.0619)
Multiple PWSs operated0.08810.09680.08200.08360.07050.0705
(0.0916)(0.0913)(0.0924)(0.0916)(0.0914)(0.0914)
Rural service area−0.0219−0.0196−0.0119−0.0260−0.0157−0.0157
(0.0425)(0.0424)(0.0418)(0.0427)(0.0430)(0.0430)
ln (Median household income)−0.1894−0.1757−0.1728−0.1842−0.1651−0.1651
(0.2011)(0.2055)(0.2053)(0.2021)(0.2031)(0.2031)
ln (Population density)0.02090.02650.03270.02760.02750.0275
(0.0462)(0.0468)(0.0468)(0.0472)(0.0466)(0.0466)
Constant−4.7677 ***−4.8279 ***−4.8982 ***−4.7924 ***−4.8487 ***−4.8487 ***
(1.7260)(1.7084)(1.7256)(1.7126)(1.6969)(1.6969)
Observations236236233236236236
Adjusted R-squared0.89470.89540.89480.89470.89530.8953
Note 1: Robust standard errors in parentheses; *** p < 0.01, ** p < 0.05, * p < 0.1. Note 2: Column (6) uses the preferred measure of BWA exposure—share of the year under advisory—which captures cumulative exposure and is directly comparable across utilities. Note 3: The facilities intensity variable is defined as the number of facilities per 1000 customers. Because some utilities report zero facilities per 1000 customers, this variable is specified as ln(facilities per 1000 customers + 1) to retain zero observations and reduce skewness.
Disclaimer/Publisher’s Note: The statements, opinions and data contained in all publications are solely those of the individual author(s) and contributor(s) and not of MDPI and/or the editor(s). MDPI and/or the editor(s) disclaim responsibility for any injury to people or property resulting from any ideas, methods, instructions or products referred to in the content.