Article

Urban Expansion and Flood-Relevant Runoff Responses in Data-Limited Catchments

1
Department of Construction and Geoengineering, Poznań University of Life Sciences, Wojska Polskiego 28, 60-637 Poznań, Poland
2
Department of Land Improvement, Environmental Development and Spatial Management, Poznań University of Life Sciences, Wojska Polskiego 28, 60-637 Poznań, Poland
3
Department of Geography, University of Pristina, Eqrem Çabej Str, No 51, 10 000 Pristina, Kosovo
*
Author to whom correspondence should be addressed.
Water 2026, 18(5), 639; https://doi.org/10.3390/w18050639
Submission received: 23 January 2026 / Revised: 25 February 2026 / Accepted: 3 March 2026 / Published: 8 March 2026

Abstract

Rapid land-cover transformations associated with urban expansion have increasingly altered hydrological processes, modifying runoff generation and flood response at the catchment scale. This study applied the Hydrologic Engineering Center–Hydrologic Modeling System (HEC-HMS) to examine rainfall–runoff dynamics in the Prosna River catchment (Poland) and the Morava e Binçës River catchment (Kosovo) for 2006–2021. Land-use changes were quantified using CORINE Land Cover (CLC) data from 2006, 2012, and 2018, and their hydrological effects were evaluated through changes in the Curve Number (CN) parameter. The model was calibrated and validated for the Prosna catchment, achieving satisfactory performance (NSE = 0.72 during calibration and 0.56 during validation), confirming its reliability under varying hydrometeorological conditions. Due to the lack of continuous discharge data in Kosovo, a parameter-transfer approach was used, applying calibrated parameters from the Prosna to the Morava e Binçës. Scenario-based simulations assessed the combined effects of urban growth and meteorological variability. Under wetter conditions, increased precipitation and expanded impervious surfaces markedly amplified simulated discharge, with maximum daily differences reaching 86.9 m3 s−1. These findings underscore the sensitivity of catchment response to interacting land-use and precipitation changes and highlight the need for improved hydrological monitoring in data-scarce regions.

1. Introduction

Climate change is closely linked to the physiographic parameters of catchments, including land cover, which shapes the interactions between terrain, climate, and soils [1,2,3,4]. Land cover provides biophysical insights into environmental dynamics and the drivers of change [5,6,7]. These parameters are fundamental in hydrological modelling [8,9]. Over recent decades, researchers have developed numerous modeling frameworks to simulate hydrological processes [10,11]. Such models are applied in flood forecasting, flood frequency analysis, overflow prediction, and in evaluating the impacts of climate and land-use changes within integrated basin management [12,13]. Globally, many studies have investigated the effects of climate change and urban development on water environments [14,15,16]. Across Europe, urbanization is accelerating, leading to extensive landscape transformation. This phenomenon is also evident along the Prosna River catchment in Poland, though the pace of change differs markedly from Kosovo, where urbanization has been more dynamic [17,18].
Kosovo has experienced an unprecedented construction boom since 1999, characterized by rapid, often unregulated urban expansion in flood-prone zones without adherence to building codes. Kosovo’s physiographic features, including elongated basins, transitional plain–mountain settlements, and unregulated land use, contribute significantly to flood risk. The lack of adequate spatial planning, combined with erosion and illegal logging, further exacerbates surface degradation and sediment transport [19]. In contrast, Poland benefits from extensive hydrometeorological monitoring, with publicly available data across numerous stations. Kosovo, however, faces chronic data scarcity: only limited water-level records exist for a few hydrometric stations, which constrains hydrological modeling and long-term flood assessment. To address this challenge, this study applies a transfer approach using a calibrated model from the Prosna River catchment in Poland to simulate hydrological behavior in the Morava e Binçës River catchment in Kosovo. Based on historical precipitation and air-temperature data obtained from the Kosovo Hydrometeorological Institute, hydrological modeling was performed using the Hydrologic Engineering Center’s Hydrologic Modeling System (HEC-HMS). The analysis focuses on how physiographic parameters influence river flow and evaluates land-cover impacts through time. Although the Prosna and Morava e Binçës catchments differ in terms of climatic regime, soil permeability, slope distribution, hydrological intensity, and data availability, they exhibit several important similarities, including comparable catchment scale, predominance of agricultural and forest land in the land-use structure, and reliance on similar runoff generation mechanisms, represented by the CN method. Analysing the monthly flows of the Prosna River and the Morava e Binçës River, numerous similarities can be observed in both the flow patterns and the hydrological character of the rivers. These similarities justify the transfer of selected parameter groups, while the documented differences require careful validation and partial correction.
River basins across Central and Southeastern Europe exhibit diverse hydro-climatic regimes ranging from temperate lowland systems dominated by moderate precipitation variability to transitional continental–Mediterranean environments characterized by higher rainfall intensity and pronounced interannual variability. These regional contrasts strongly influence runoff generation processes, flood dynamics, and the applicability of different hydrological modeling approaches. While physically based distributed models provide a detailed representation of hydrological processes, their application often requires extensive long-term datasets that are rarely available in developing monitoring environments. Consequently, conceptual rainfall–runoff models, including HEC-HMS, HBV, and similar semi-distributed frameworks, are widely adopted for comparative basin analysis and flood-response assessment in data-limited regions due to their lower data requirements and robust performance in event-scale simulations. This regional hydro-climatic contrast provides the conceptual basis for the comparative modeling framework adopted in the present study.
The HEC-HMS model, widely used for watershed hydrology, has been successfully applied in flood-frequency and flood-warning studies [20,21,22,23,24]. Its integration with the Soil Conservation Service Curve Number (SCS-CN) method enables efficient estimation of stormwater runoff from rainfall inputs [25]. The CN parameter is derived using standard tables that account for land use and hydrologic soil groups A–D [26,27].
Despite substantial progress in hydrological modeling, significant uncertainty remains in assessing runoff responses and flood dynamics in data-limited catchments where long-term hydrometeorological observations are incomplete or unavailable. In particular, the transferability of rainfall–runoff modeling approaches between well-monitored and poorly monitored basins remains insufficiently evaluated, especially under conditions of rapid land-cover change and urban expansion. Addressing this gap is essential for improving flood-risk assessment and hydrological prediction in regions characterized by limited monitoring infrastructure and evolving land-use pressures. To address this research gap, a comparative basin framework was adopted. The selection of the Prosna River and Morava e Binçës River catchments was motivated by their complementary hydro-climatic, geomorphological, and data-availability characteristics, which together provide an appropriate framework for comparative hydrological analysis. The Prosna River basin represents a well-monitored lowland catchment typical of Central European hydrological conditions, enabling model calibration and evaluation using long-term discharge records [28]. It is worth noting that even well-monitored regions such as Poland historically experienced substantial hydrometeorological data gaps [29], particularly in the period following World War II, when monitoring networks were disrupted, and long-term observational continuity was limited. In contrast, the Morava e Binçës basin represents a data-scarce catchment [30], characterized by more complex topographic variability and rapid land-use transformation, typical of transitional Southeastern European environments. This contrast allows evaluation of rainfall–runoff model transferability between well-gauged and data-limited basins and supports broader assessment of hydrological responses across differing physiographic and monitoring conditions. Together, these contrasting characteristics provide a scientifically grounded basis for testing the robustness and transferability of rainfall–runoff modeling approaches across basins representing both well-instrumented Central European lowland systems and data-limited transitional Southeastern European environments [30,31].
The main objective of this study is to investigate how urban expansion influences flood-relevant runoff responses in data-limited catchments through a comparative analysis of the Morava e Binçës (Kosovo) and Prosna (Poland) river basins. Specifically, the study aims to: (i) quantify land-cover changes between 2006, 2012, and 2018; (ii) evaluate rainfall–runoff relationships using the HEC-HMS model; (iii) identify the hydrological parameters that most strongly influence runoff generation and peak discharge; and (iv) develop scenario-based simulations to assess the potential effects of continued urban expansion on future runoff responses, particularly in the Morava e Binçës catchment. By integrating land-cover change analysis with rainfall–runoff modeling, the study provides a methodological framework for assessing urbanization-driven flood risk and evaluating model transferability between well-monitored and data-limited river basins.

2. Materials and Methods

2.1. Study Area

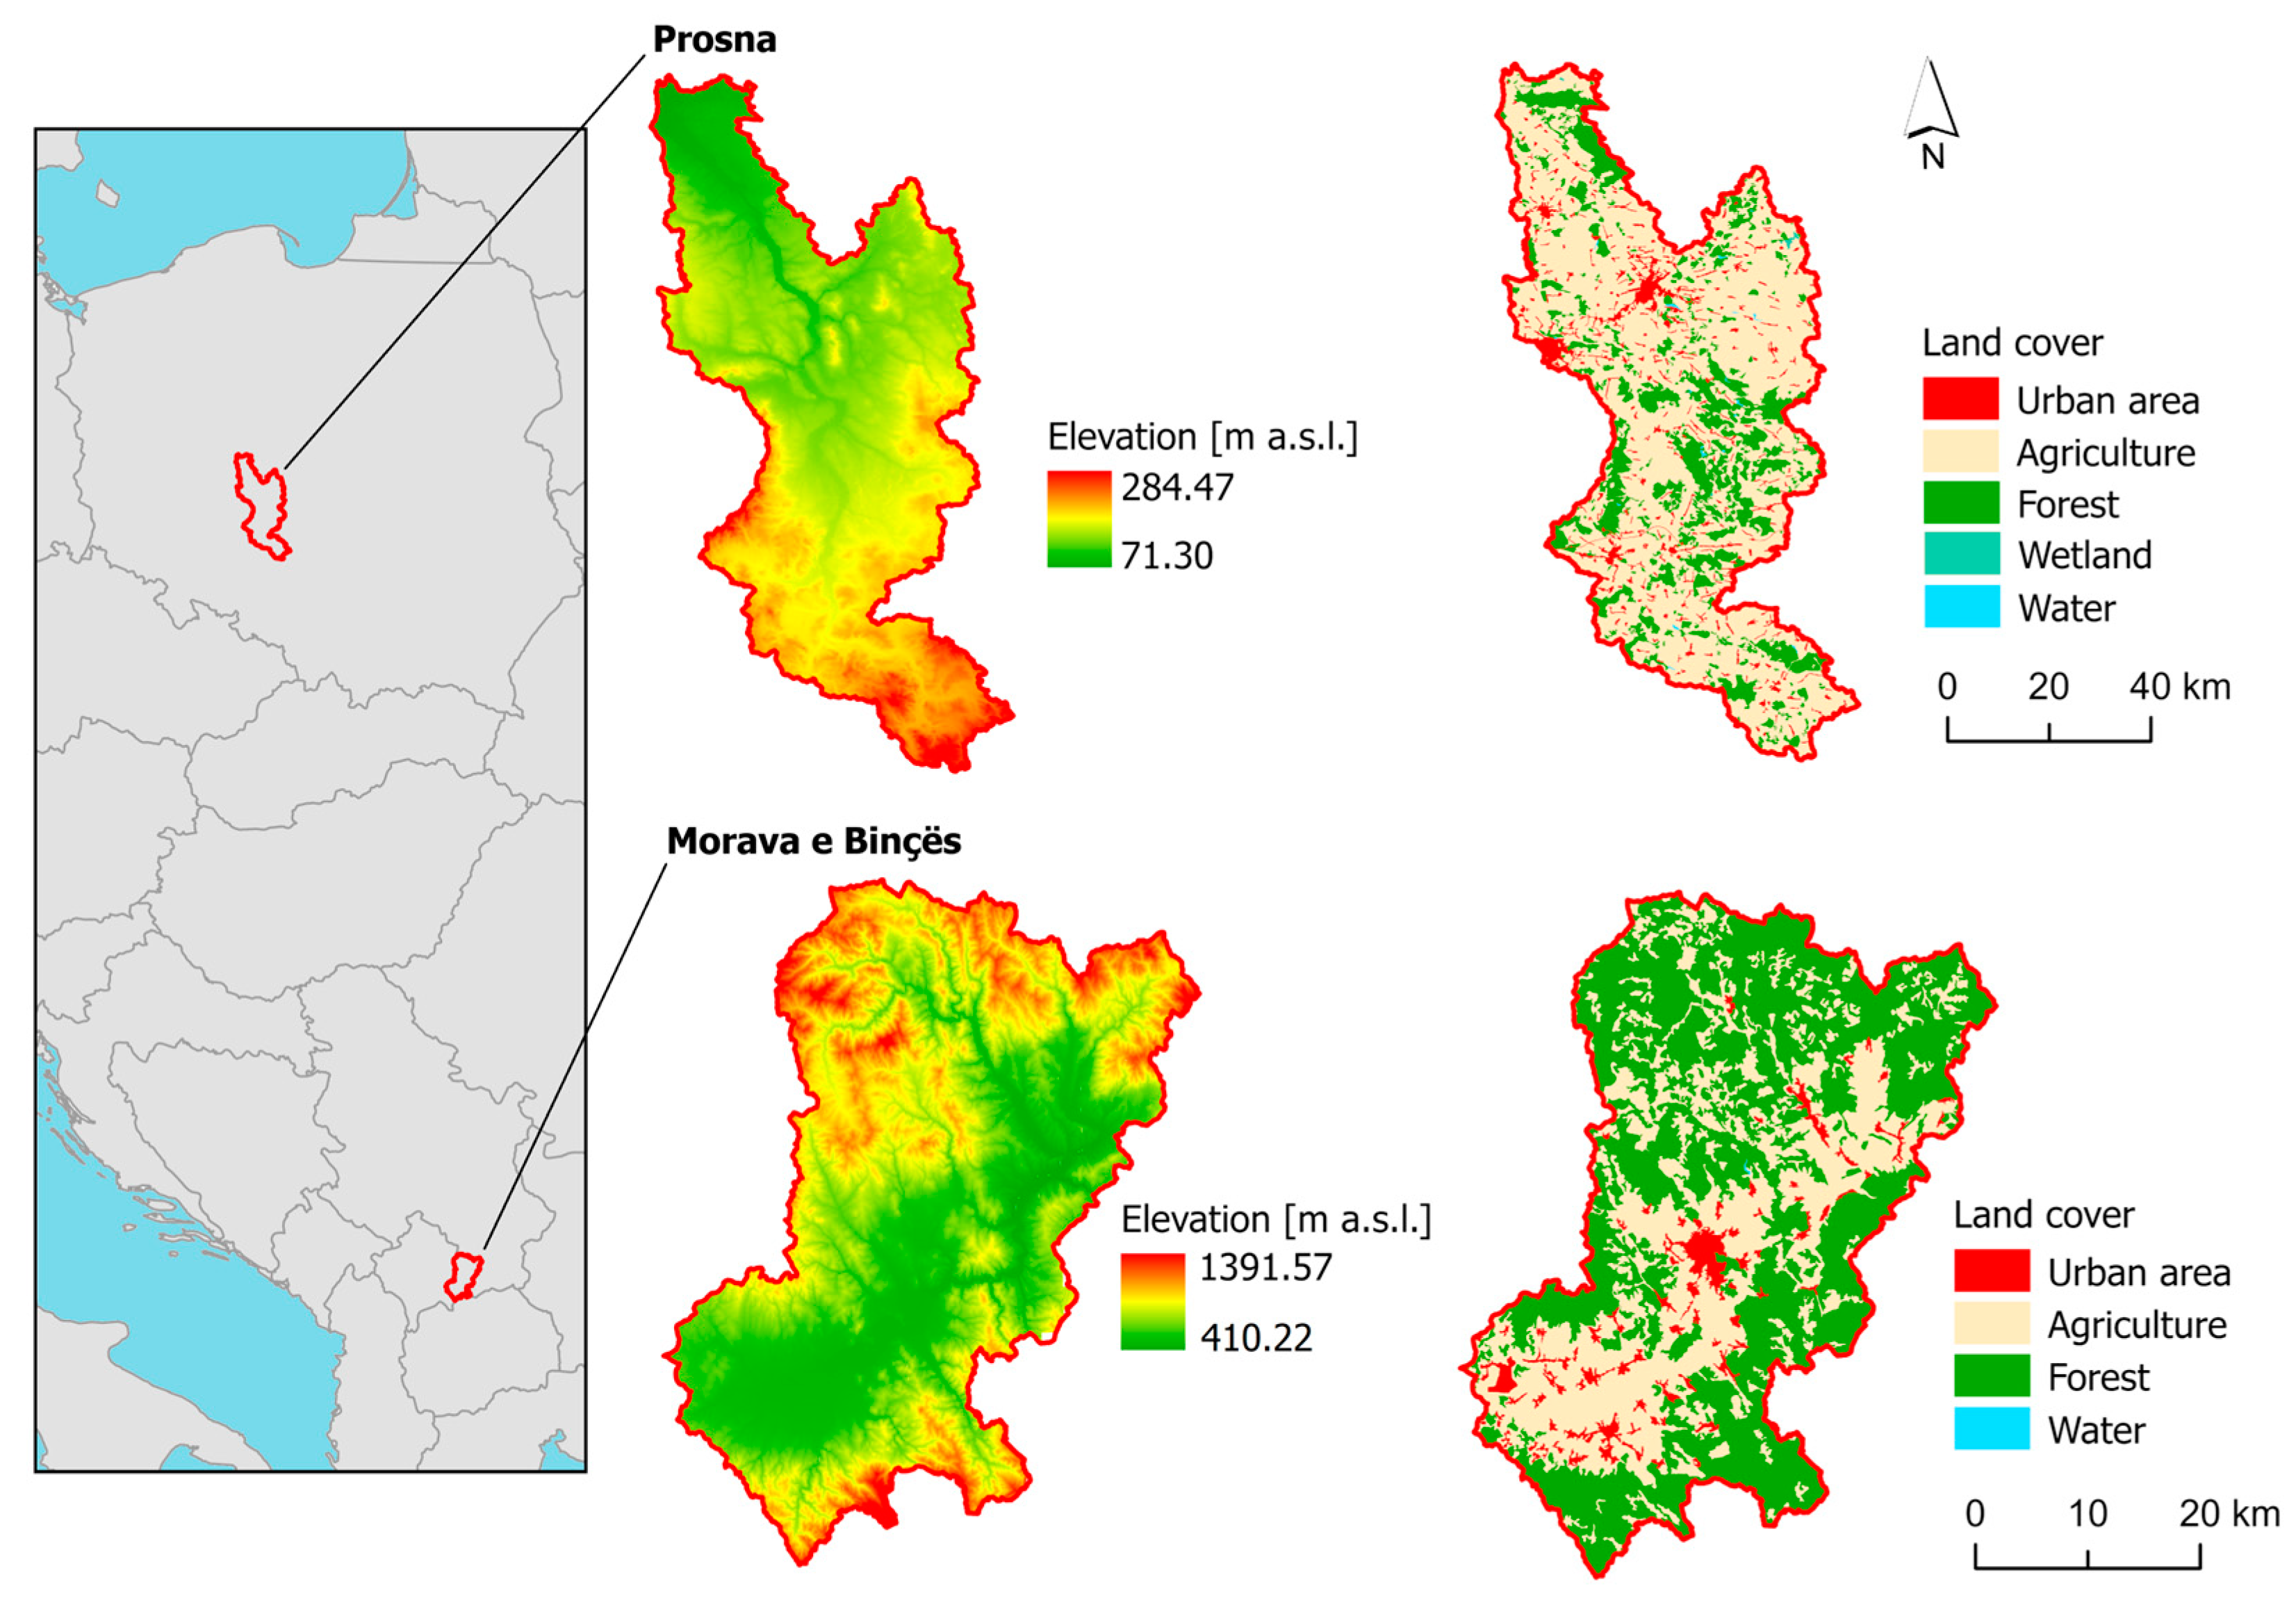
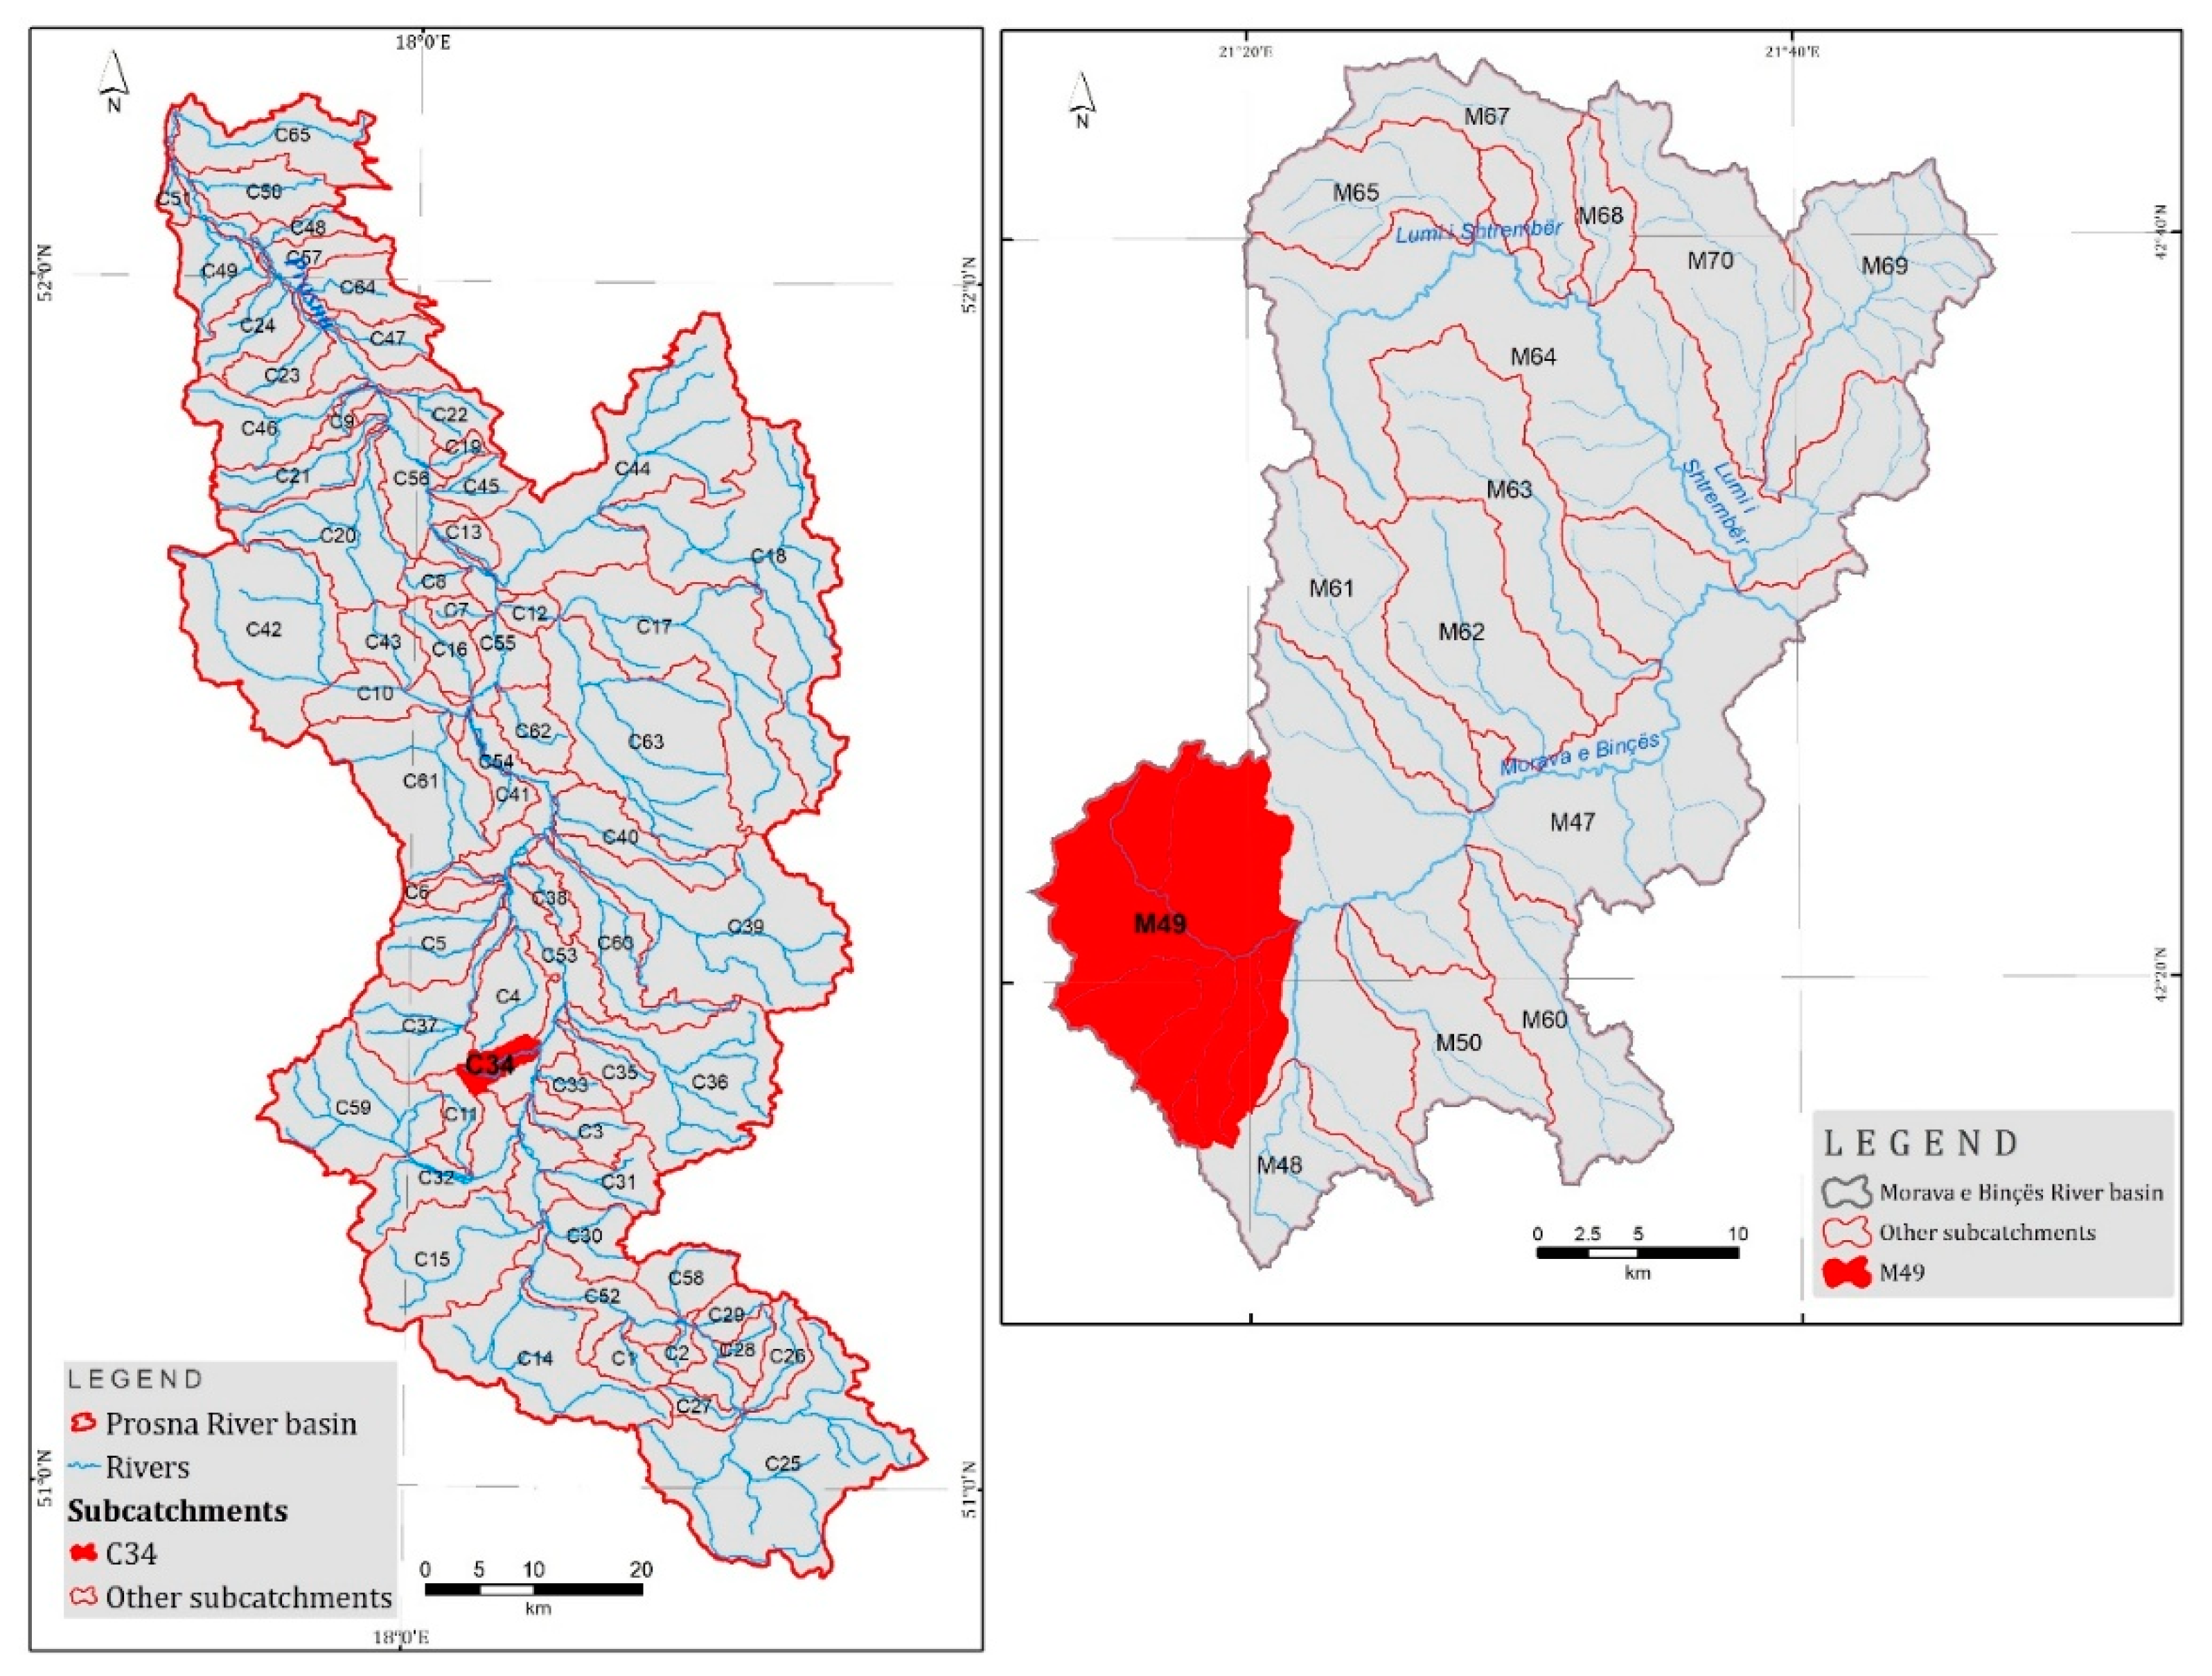
This study focuses on two river basins located in Poland and Kosovo (Figure 1 and Supplementary Table S1). The Prosna River catchment, covering an area of 4913.07 km2, is situated in central Poland. The river has a total length of 227.5 km (MPHP) and a longitudinal gradient of 1.29‰. The catchment exhibits substantial geomorphological, geological, and hydrogeological diversity, particularly in its upper reaches. The upper section of the Prosna River catchment (approximately 80 km long) displays upland characteristics, whereas the middle and lower sections correspond to lowland terrain. The average discharge of the Prosna River catchment is estimated at 10.7 m3 s−1 during dry years and about 32.0 m3 s−1 in wet years [32]. The basin is characterized by considerable variability of hydrological phenomena and pronounced irregularity in average monthly and annual flows [33].
Kosovo, surrounded by high and moderate mountains with plains in between, lies within a transitional zone between Mediterranean and continental climates, which strongly influences river regimes [34]. The Morava e Binçës River catchment, the principal river system in southeastern Kosovo, belongs to the Black Sea drainage basin (Figure 1). It is formed by the confluence of two smaller tributaries originating from the northern slopes of Karadaku Mts. The catchment area of the Morava e Binçës River is 1545.18 km2, with an approximate river length of 60 km within Kosovo and a longitudinal gradient of 1.9 ‰. The Morava e Binçës River basin is characterized by two distinct physiographic and hydrological units. The southern and northern parts of the basin are dominated by hilly to mountainous terrain, where steep slopes and shallow soils promote rapid runoff generation and higher flow velocities. In contrast, the central part of the basin consists of a low-relief alluvial plain with a gentle elevation gradient, where most settlements are concentrated. The central plain is composed predominantly of unconsolidated sediments (sand, silt, and clay), which favor groundwater storage and the development of productive aquifers while also influencing infiltration–runoff processes. Surface flow in this area is generally slower due to the low channel slope, leading to increased flow accumulation and locally elevated flood susceptibility. The river network draining the mountainous zones exhibits steep longitudinal profiles upstream, transitioning to smoother gradients within the central valley. In its upper reaches, the river possesses a steep gradient, a deep and narrow valley, and pronounced vertical erosion, whereas downstream, through the Gjilan area (approximately 24 km), it develops a wider channel and a gentler slope [35].
The selection of the Prosna and Morava e Binçës catchments enables a comparative assessment of hydrological behavior under contrasting environmental and data conditions. Both catchments are characterized by a similar proportion of agricultural and forest land and diverse geomorphological structure. However, they differ substantially in terms of data accessibility, infrastructure, and monitoring capacity. The Prosna River catchment benefits from long-term hydrometric observations and well-documented physiographic records, whereas the Morava e Binçës River catchment suffers from limited and fragmented hydrological data. This contrast provides a valuable framework for testing model transferability and for evaluating the influence of land-cover changes on runoff dynamics in regions characterized by differing data availability and degrees of urbanization.
The two catchments are characterized by distinct but broadly comparable hydro-climatic regimes. The Prosna River basin is located within a temperate transitional climate zone, with mean annual precipitation typically ranging between approximately 550 and 700 mm and moderate seasonal variability dominated by summer convective rainfall events [33]. Mean annual air temperature generally ranges between 8 and 10 °C, with winter snow accumulation contributing to early spring runoff generation [33]. In contrast, the Morava e Binçës catchment is influenced by a transitional continental–Mediterranean climate characterized by warmer summers, colder winters, and higher interannual precipitation variability [36]. Mean annual precipitation generally ranges between approximately 600 and 850 mm, with short-duration high-intensity rainfall events during late spring and summer representing the dominant flood-generating mechanism [37,38]. These climatic contrasts provide a suitable framework for examining hydrological model behavior under differing precipitation regimes and hydrometeorological forcing conditions.
To ensure comparability between the two basins, both catchments were characterized using consistent physiographic and hydrological descriptors, including catchment area, elevation distribution, drainage network density, dominant land-use composition, and longitudinal river gradient. Despite differences in basin size, both catchments exhibit mixed agricultural–urban land use and heterogeneous geomorphological conditions, enabling controlled comparative analysis of runoff generation and hydraulic response. The selection of these catchments was therefore motivated by their contrasting monitoring capacity and hydro-climatic settings while maintaining broadly comparable land-use structure, allowing evaluation of methodological transferability between well-instrumented and data-scarce river systems.

2.2. Data Collection

The spatial and hydrological framework of this study was developed using a combination of national and international datasets for Poland and Kosovo, ensuring data comparability and enabling the analysis of topography, land use, soil properties, and hydro-climatic conditions.
For Poland, spatial data included the Map of the Hydrographic Division of Poland and the Raster Hydrographical Map at a scale of 1:50,000 obtained from the Head Office of Geodesy and Cartography [39], in cooperation with the Institute of Meteorology and Water Management. Terrain characteristics were derived from a Digital Elevation Model (DEM) with a spatial resolution of 100 m, while soil properties were represented by the Map of Soil Categories from the Agricultural Drought Monitoring System [40].
For Kosovo, cartographic sources comprised the Topographic Map produced by the Military-Geographic Institute of Yugoslavia (1979), topographic maps at a scale of 1:25,000 from the Kosovo Cadastral Agency [41], and the Soil Map of Kosovo at a scale of 1:50,000 developed by the “Jaroslav Černi” Institute (1974). A high-resolution DEM (12.5 m) provided by the Alaska Satellite Facility [42], and orthophotomaps from Google Earth [43] were used to enhance spatial accuracy. Land cover data for both catchments were obtained from the CLC datasets for 2006, 2012, and 2018, sourced from the Copernicus Land Monitoring Service [44].
Hydrometeorological data were acquired from national institutions in both countries. For Poland, daily discharge data from the Prosna–Bogusław station and precipitation records from the Kalisz station were provided by IMGW for the years 2006–2021 [33]. For Kosovo precipitation records from the Morava e Binçës–Kamenicë/Desivojcë station were obtained from the Hydrometeorological Institute of Kosovo (HMIK) [37]. Potential evapotranspiration for both regions was estimated using the Thornthwaite method based on monthly mean air temperature data [45]. In addition, the Standardized Precipitation Index (SPI) for Kosovo was calculated using the SPEI package in R, allowing the identification and classification of years with extreme precipitation conditions for subsequent scenario-based hydrological analyses.

2.3. Hydrological Modeling

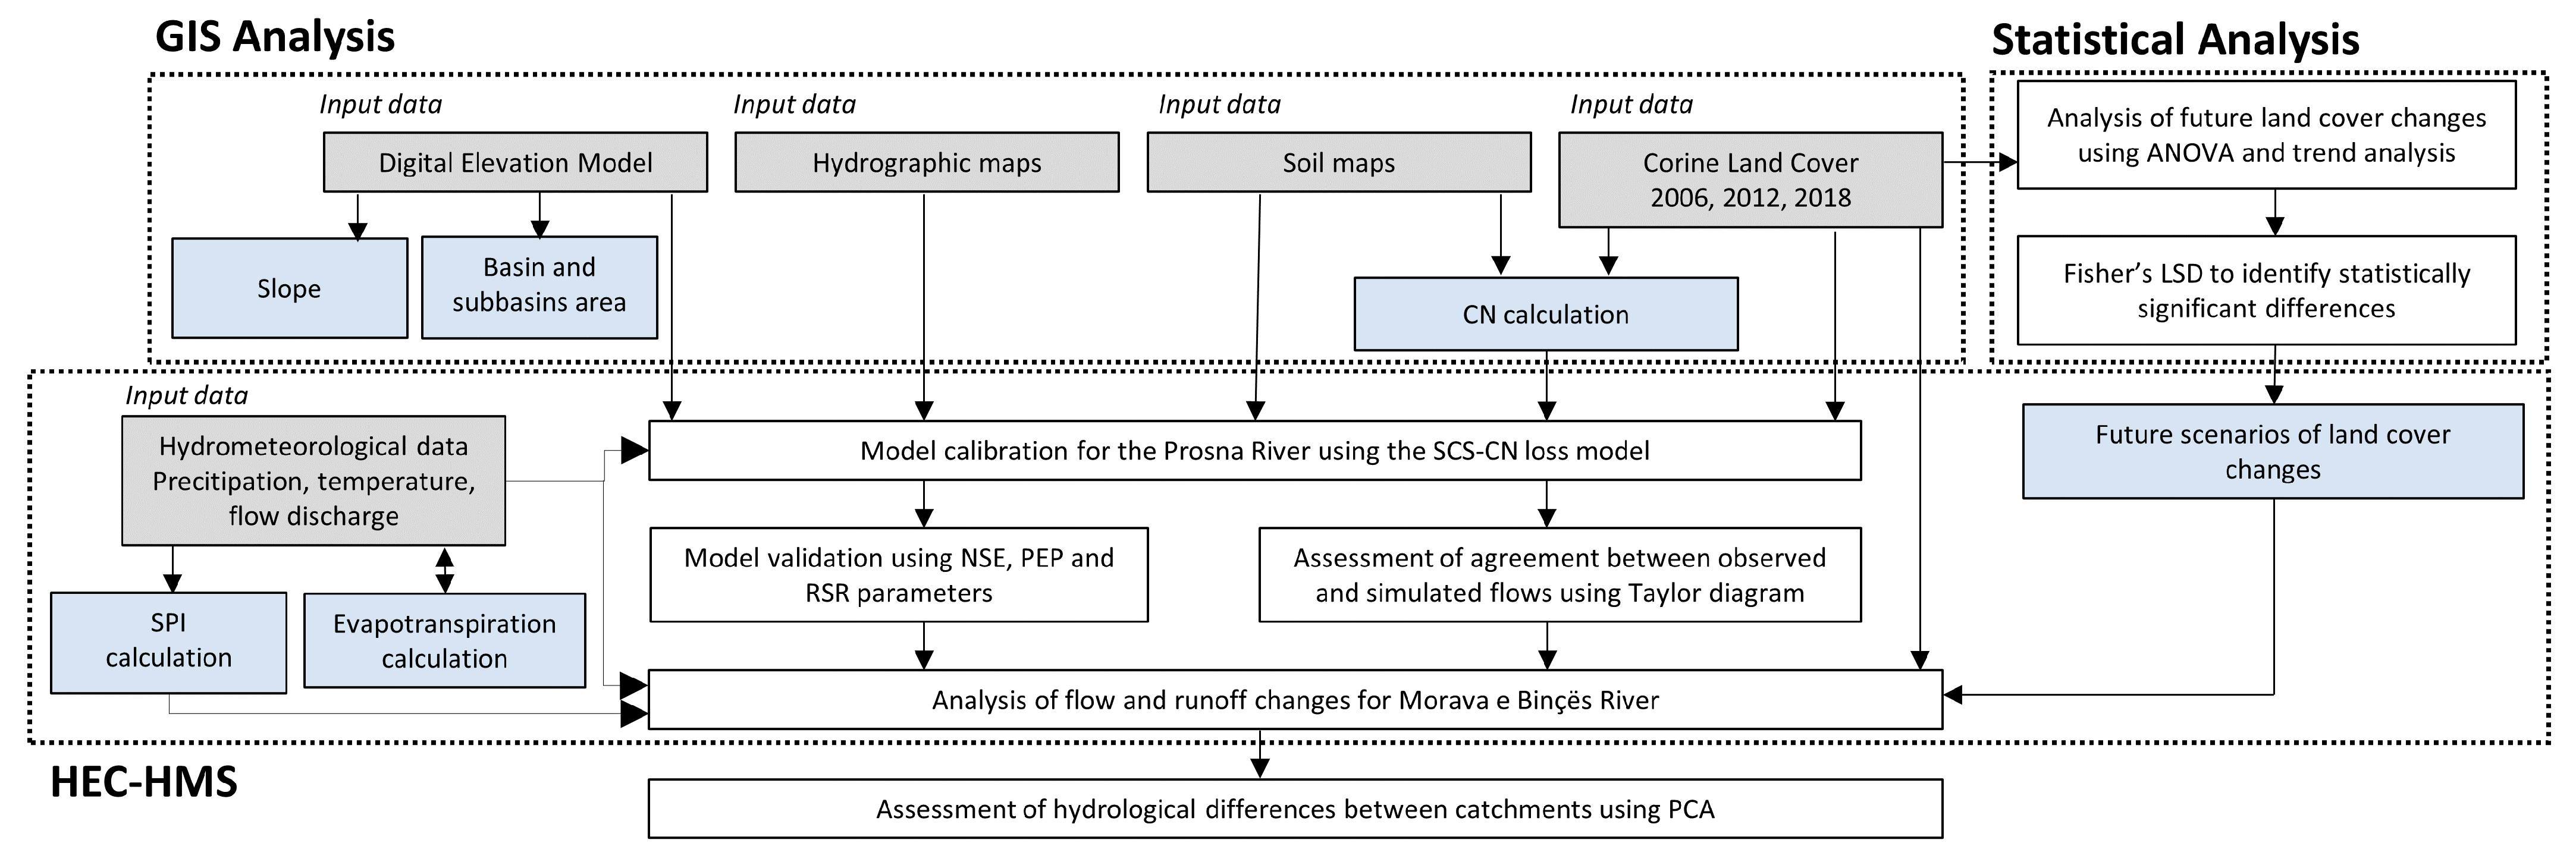
The methodological framework of this study consists of four sequential stages: (i) preparation of spatial and hydrometeorological datasets and derivation of land-use change information for the years 2006, 2012, and 2018; (ii) estimation of hydrological parameters, including CN, based on land-use and soil characteristics; (iii) rainfall–runoff modeling using the HEC-HMS model, including calibration and validation procedures; and (iv) scenario-based simulations assessing the influence of urban expansion and meteorological variability on runoff responses. The sequential workflow is illustrated in Figure 2.
Following the derivation of land-use and hydrological parameters, rainfall–runoff modeling was performed for two rivers: the Prosna River catchment in Poland, comprising 65 sub-catchments, and the Morava e Binçës River catchment in Kosovo, consisting of 13 sub-catchments. Hydrological modeling was carried out in HEC-HMS 4.13 for both catchments. The DEM constituted the primary topographic input used to delineate the catchment and sub-catchment boundaries and to derive terrain descriptors required for basin discretization. DEM-based elevation information supported the extraction of slope characteristics and spatial parameterization of sub-catchments applied in the HEC-HMS model setup (Figure 2; Supplementary Table S1). In addition, the digital land-use maps were used as key inputs for Curve Number (CN) estimation, linking land-cover patterns directly to runoff-loss representation in the simulations. The performance of the hydrological model was assessed using several statistical indicators applied across distinct evaluation stages. The evaluation metrics included NSE (Nash–Sutcliffe Efficiency), PEP (Percentage Error in Peak), and RSR (RMSE–Standard Deviation Ratio), which together quantify model accuracy, peak-flow reproduction, and residual error performance. The predictive capability was first examined for the Prosna River catchment, using observed data for model calibration (January 2006–December 2012) and validation (January 2013–December 2021). Model accuracy was quantified through the NSE (Equation (1)), which measures the relative magnitude of residual variance compared to observed data variance, the PEP (Equation (2)), and RSR (Equation (3)). These indices were calculated for both calibration and validation periods to assess the model’s predictive robustness. Additionally, the model’s overall agreement between observed and simulated flows was evaluated using the Taylor diagram approach [46]. This diagram provides a comprehensive visual assessment of model performance by simultaneously representing the correlation coefficient between observed and simulated river discharge, the Root Mean Square Error (RMSE), and the standard deviation (σ). In this framework, the observed dataset serves as the reference field, while the simulated flow represents the test field, allowing an integrated comparison of accuracy, variability, and correlation strength Equation (1).
N S E = 1 i = 1 n ( Q o i Q s i ) 2 i = 1 n ( Q o i Q ¯ o ) 2
where Qoi is the observed discharge at the i’th time step, Qsi is the simulated discharge at time i based on an estimated set of model parameters, and Q ¯ o is mean flow. The NSE value of 1 indicates a perfect fit, meaning the model accurately predicts the observed values. The NSE of 0 implies that the model performs no better than using the mean of the observed data, while negative values indicate poor predictive capability, showing that the model’s predictions are not representative of the observed values.
E P = 1 Q p c Q p o × 100
where Q p o is the observed peak discharge and Q p c is the computed peak discharge. The value of the PEP Equation (2) shows that the smaller value has better performance in capturing peak flows. PEP quantifies the percentage error specifically for peak values, such as peak flow rates in rainfall–runoff models. The negative value of the PEP Equation (2) is overestimated, and the positive value is underestimated. The acceptable criteria for calibration and validation are −30% ≤ PEP ≤ 30% [47].
The RSR statistic (Equation (3)) represents the ratio of the root mean square error to the standard deviation of observed data, where lower values indicate better model performance.
R S R = i = 1 n Q o i Q s i 2 i = 1 n Q o i Q ¯ o 2
where Qoi is the observed discharge at the i’th time step, Qsi is the simulated discharge at time i based on an estimated set of model parameters. RSR ranges from 0 (perfect fit) to higher values, with performance ratings classified as very good (0–0.50), good (0.50–0.60), satisfactory (0.60–0.70), and unsatisfactory (>0.70). Its scale-independent nature makes it particularly useful for comparing model performance across different catchments or datasets.
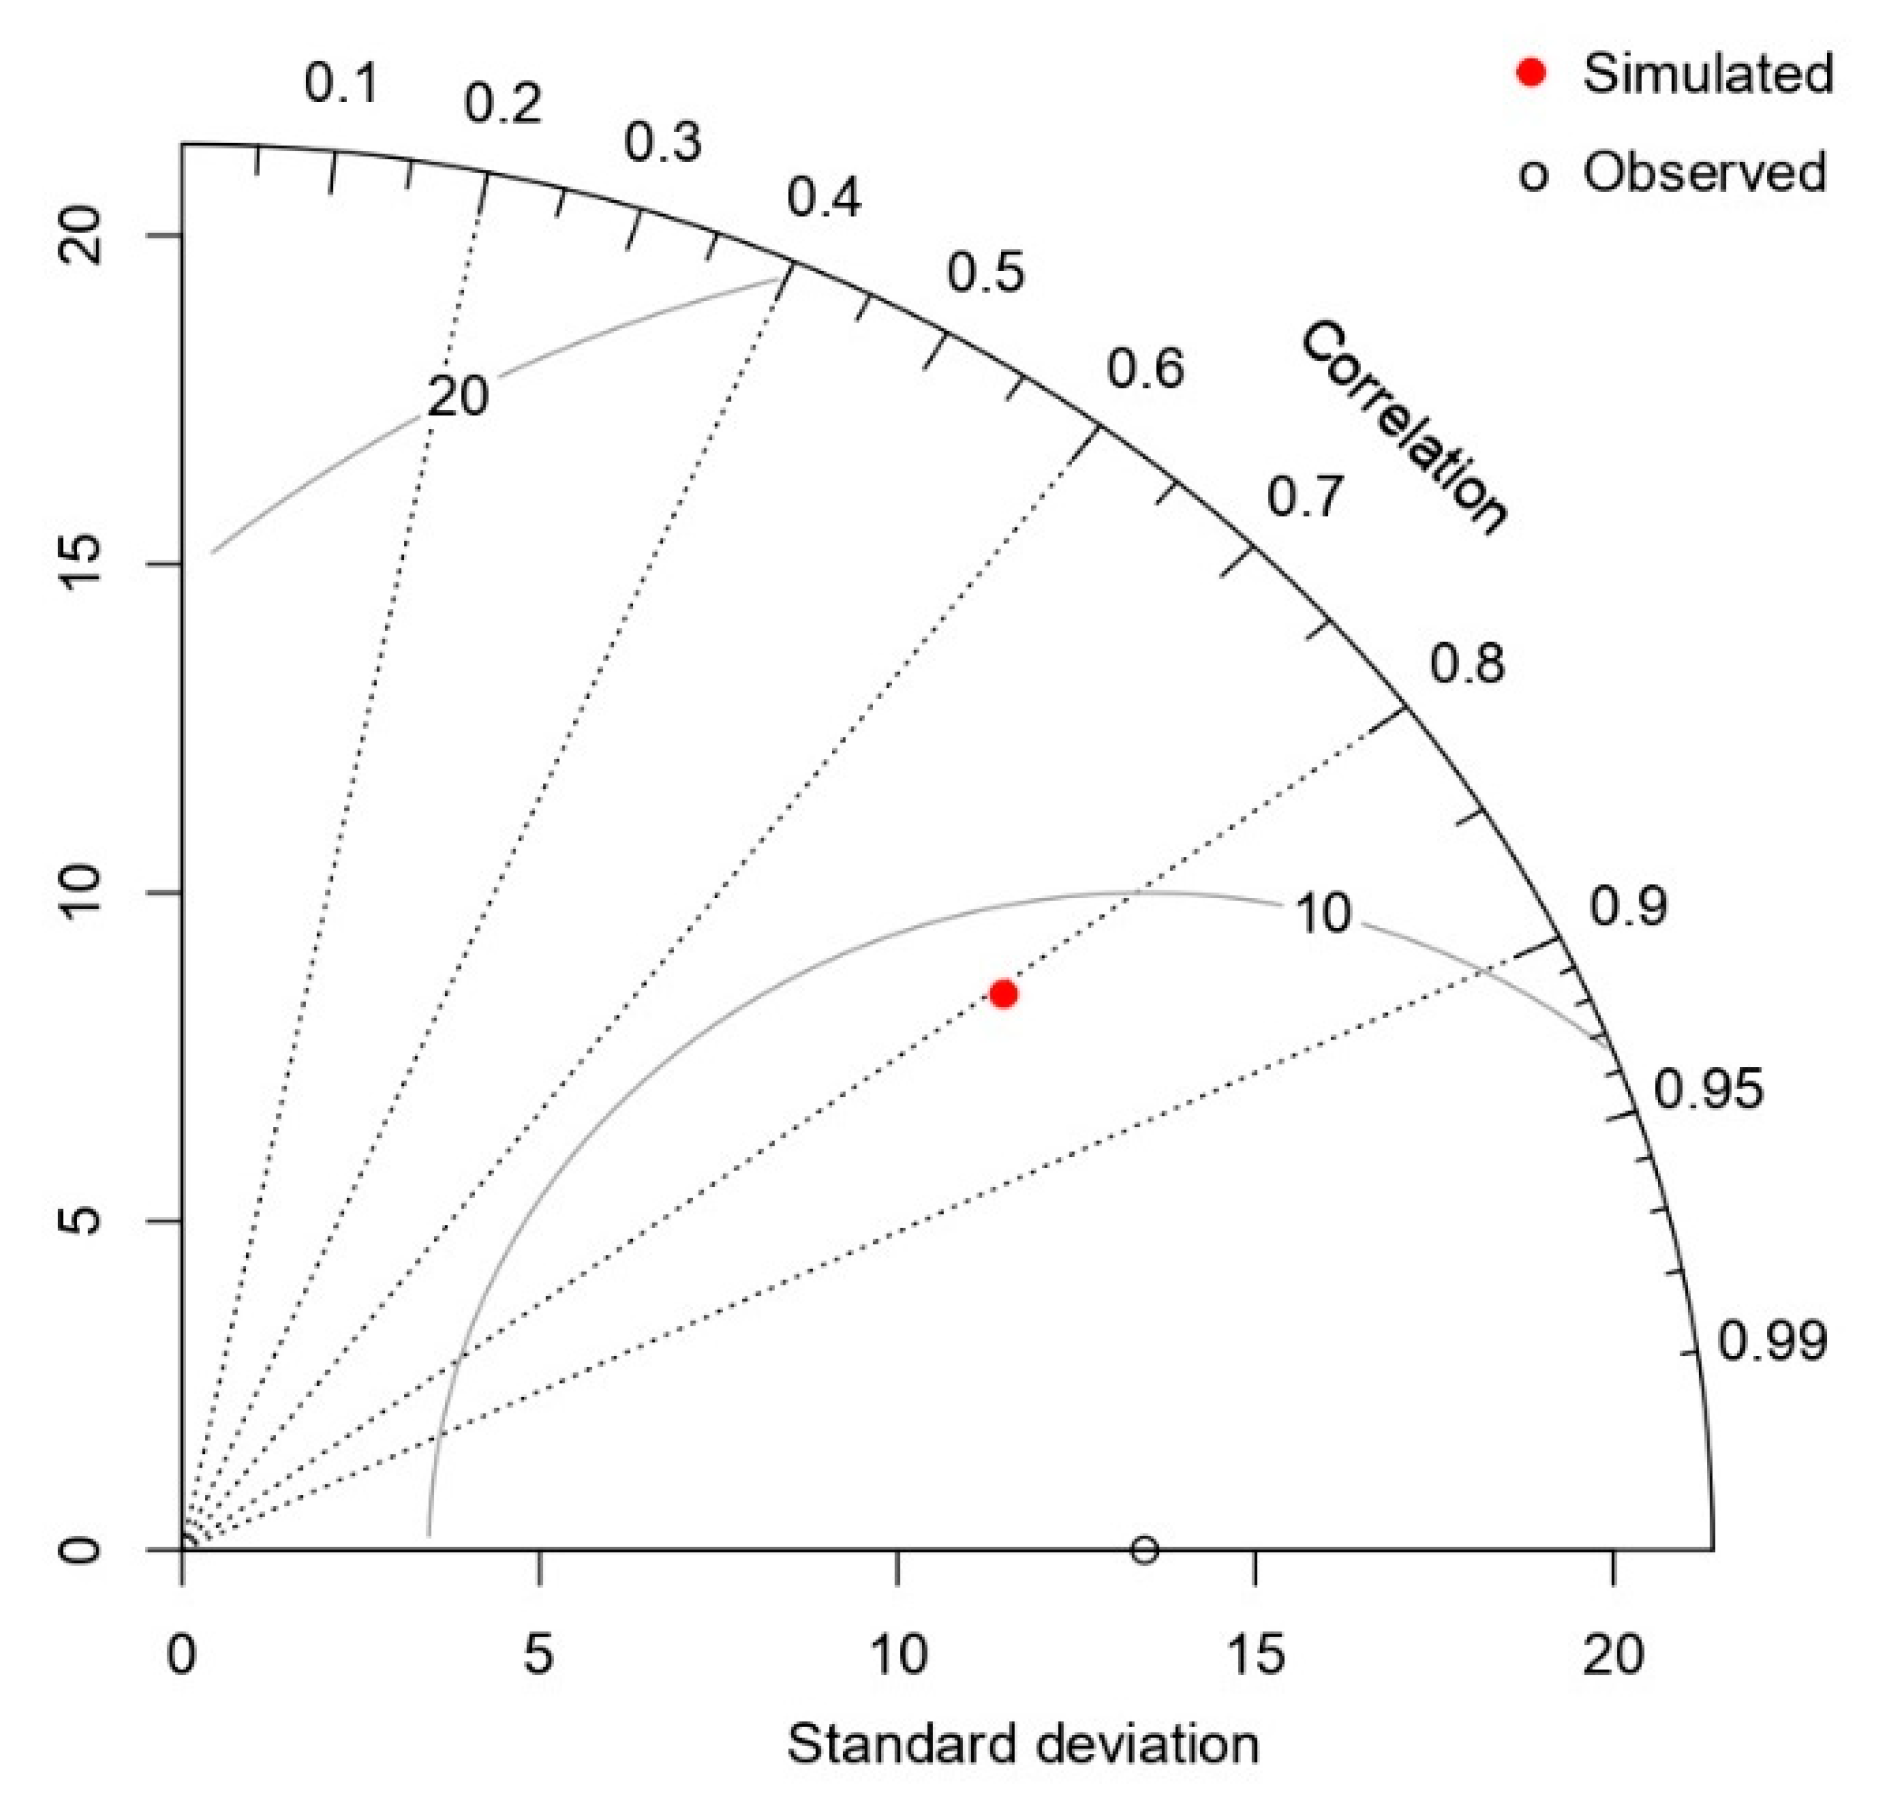
Model performance was evaluated using the Taylor diagram, integrating the correlation coefficient, standard deviation, and root mean square error to assess agreement between observed and simulated streamflow. The diagram was constructed in the R environment using paired observed–simulated discharge values, with observations serving as the reference dataset. The Taylor diagram proved particularly effective in evaluating the Prosna River catchment simulations due to its ability to capture the relative importance of multiple performance metrics within a single framework. In the subsequent stage, the calibrated and validated model was applied to simulate flow for the Morava e Binçës River catchment in Kosovo. To further explore hydrological differences between catchments and sub-catchments, a Principal Component Analysis (PCA) was conducted using three parameters: CN, the highest annual high flow (WWQ), and the mean annual flow (SSQ). These parameters characterize peak-flow behavior and overall water availability in each sub-catchment. The PCA method, formulated as a set of linear equations, applies an orthogonal transformation of correlated variables into a new set of uncorrelated components [48,49]. Since CN, WWQ, and SSQ are expressed in differing units and magnitudes, the PCA was based on the correlation matrix to ensure comparability among variables. This analysis elucidated similarities and differences between the catchments in terms of hydrological response characteristics. The Taylor diagram was constructed following the procedures implemented in the R 4.2.2 environment [50]. The PCA was performed using STATISTICA 13.3 [51], while the ANOVA and trend analyses were conducted using PQStat Software (2023) [52].

2.4. CN Parameter for Catchments

The influence of land-use and soil characteristics on catchment runoff was then simulated using the SCS-CN loss model (Figure 2). This model was selected for its ability to incorporate key runoff-generating factors, including soil type, land use and treatment, surface condition, and antecedent moisture condition into a single CN value [53]. The SCS-CN model also performs well with incomplete datasets, particularly relevant for the Kosovo catchment, and provides more reliable runoff estimation than the initial and constant loss models while requiring fewer input parameters [54]. The relationship between maximum retention and basin characteristics was expressed through the CN Equation (4). The CN was computed by integrating soil and land cover data for each sub-catchment in 2006, 2012, and 2018. Direct runoff was simulated using the Clark Unit Hydrograph method, baseflow was modeled through the Recession method, and channel flow routing was performed using the Muskingum method Equation (4).
C N = i = 1 n C N i × A i A
where C N i is Curve Number from 1 to n’th of land uses; A i is an area with Curve Number C N i ; A is the total area of the sub-catchment; i is an index of the sub-catchment.

2.5. Change in Land Use in the Years 2006–2018

The geographical and physiographic parameters of both catchments were derived from the compiled geospatial datasets. Land-use dynamics were characterized using CLC vector layers for the years 2006, 2012, and 2018, while soil properties were obtained from national soil maps for each country. The CLC datasets for the years 2006, 2012, and 2018 were selected because they represent the standardized Copernicus reference mapping periods, ensuring methodological consistency and spatial comparability across Europe. These datasets provide the only harmonized long-term land-cover information available for both study catchments, which is particularly important for comparative analysis involving data-limited regions such as Kosovo. The selected time steps also capture key phases of post-2000 urban expansion, allowing assessment of progressive land-cover transformation while maintaining compatibility with officially validated European monitoring datasets. These datasets were used to calculate the CN parameter for each sub-catchment, which constitutes a key input to the applied hydrological modeling framework. All spatial and attribute data were processed and integrated within a geospatial database using ArcGIS 10.8.1 software. To evaluate temporal changes in land-use composition, a single-factor repeated-measures analysis of variance (ANOVA) was applied to the areas of land-use classes within each sub-catchment across the three reference years (2006, 2012, and 2018). The null hypothesis assumed no significant differences in the mean land-use classes over time, whereas the alternative hypothesis posited that at least one time period differed significantly [55]. To further investigate the direction and magnitude of temporal changes, linear trend analyses were performed. Pairwise contrasts between successive years were additionally examined using Fisher’s Least Significant Difference (LSD) test to identify statistically significant differences between land-use classes [56]. The derived land-use change information and updated CN values were subsequently used as inputs to the rainfall–runoff simulations described in Section 2.3.

2.6. Scenario Setting

Following hydrological model implementation for the Morava e Binçës River catchment in HEC-HMS version 4.13, a set of scenario simulations was developed to assess the potential impacts of land cover change and meteorological variability on catchment hydrological response. The baseline scenario (S0) represents current conditions, incorporating land cover data from 2018 (CLC) and observed meteorological inputs, including precipitation and evapotranspiration, for the period 2018–2021. Based on S0, five alternative urban expansion scenarios (S1–S5) were formulated, assuming incremental increases in urbanized area of 0.7%, 1.4%, 2.1%, 5%, and 10% relative to the total catchment area. All scenarios were evaluated under two meteorological conditions: (i) constant inputs from 2018–2021 and (ii) extreme precipitation identified via SPI analysis. Urban expansion zones were delineated in ArcGIS 10.8.1. using CLC 2018 data refined with recent orthophotomaps. Potential urban growth zones were delineated primarily in agricultural areas adjacent to existing built-up zones, reflecting typical urban expansion processes. Particular emphasis was placed on proximity to road infrastructure, which facilitates development through improved accessibility and construction logistics. Agricultural land parcels classified in CLC 2018 that coincided with newly observed buildings on orthophotomaps were considered most susceptible to future conversion. Scenario S1 includes agricultural areas directly adjacent to the 2018 urban extent, where initial building clusters were already present along the road network. Scenarios S2–S5 represent successive outward expansions beyond the S1 boundary, maintaining spatial continuity and reflecting observed urban development patterns within the catchment. Collectively, these scenarios encompass a realistic range of urban growth trajectories and allow evaluation of how varying degrees of land cover transformation, under both stable and extreme meteorological conditions, influence runoff generation and flood potential in the Morava e Binçës River catchment. Scenario outputs were used to quantify differences in runoff response and peak discharge.

3. Results

3.1. Hydrometeorological Characteristics of the Study Period

The hydrometeorological conditions in the Morava e Binçës catchment during the analyzed period (2006–2021) were characterized by pronounced interannual variability in precipitation totals and runoff generation. Based on the precipitation records used for hydrological modeling and the SPI classification, the study period included both wet and dry hydrological phases. Very wet conditions were observed in 2009, 2010, 2012, and 2014, whereas extremely dry conditions occurred in 2011, followed by predominantly dry years during 2019–2021. The alternation of wet and dry periods resulted in substantial variability in annual runoff conditions, providing a suitable basis for evaluating the sensitivity of runoff responses to land-use change and meteorological variability within the analyzed catchments.

3.2. Hydrological Modeling

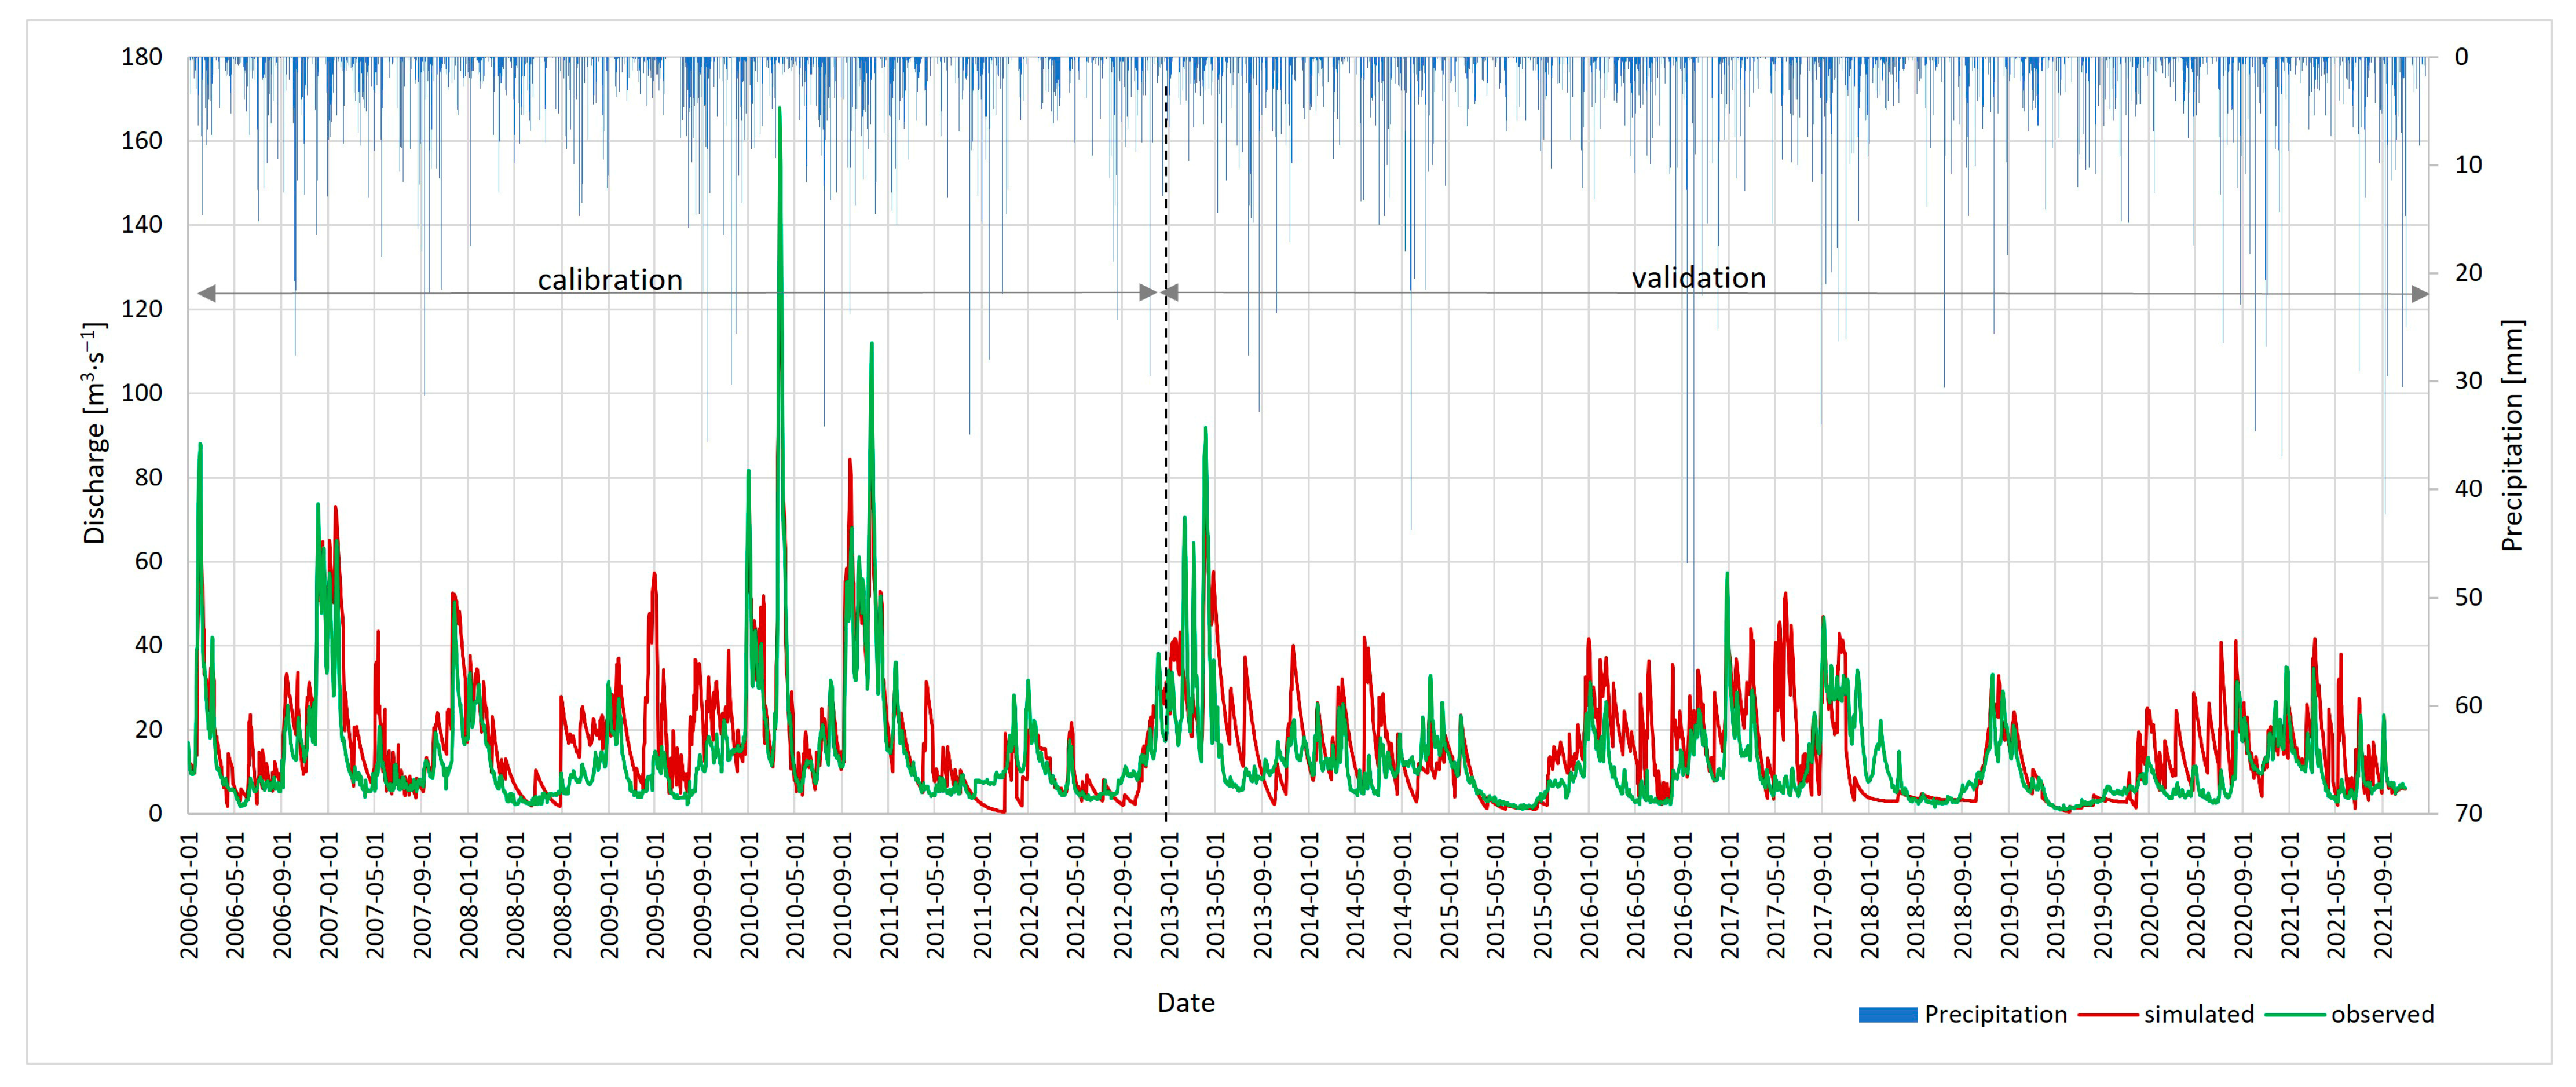
The simulated and observed hydrographs for the Prosna River catchment at the Bogusław gauging station during the calibration and validation periods are presented in Figure 3. The comparison demonstrates that the HEC-HMS model adequately reproduces the temporal variability of daily streamflow over the analyzed period.
During the calibration phase, the model achieved NSE, PEP, and RSR values of 0.72, 7.74%, and 0.53, respectively. For the validation period, these values improved to 0.56, 4.24%, and 0.66, indicating a high level of agreement between observed and simulated flows. The model satisfies commonly applied performance criteria and can therefore be regarded as suitable for hydrological analyses and flow forecasting. The obtained NSE, PEP and RSR values, together with the stability of the results during the validation period, indicate that the model may be applied to catchments with similar physiographic and hydrological characteristics. The optimized parameter values used during calibration and validation are summarized in Table 1.
Figure 4 presents a Taylor diagram summarizing the agreement between observed (reference) and simulated (test) streamflow based on 5783 paired values. The observed dataset is represented by the reference point at r = 1 with a standard deviation of σo = 13.45, while the simulated discharge is characterized by σs = 14.26 and a correlation coefficient of r = 0.81. The close agreement between σs and σoso ≈ 1.06) indicates that the model accurately reproduces streamflow variability, with a slight overestimation of dispersion. The high correlation confirms strong consistency in temporal dynamics between the observed and simulated series. The simulated point lies near the RMSE isoline of 9.38, indicating a moderate overall deviation. This discrepancy is primarily associated with differences in event-scale amplitudes and structural limitations rather than systematic bias or failure to capture general hydrological dynamics. Overall, the Taylor diagram confirms that the HEC-HMS model provides a reliable representation of streamflow behavior, supporting the results obtained during calibration and validation.
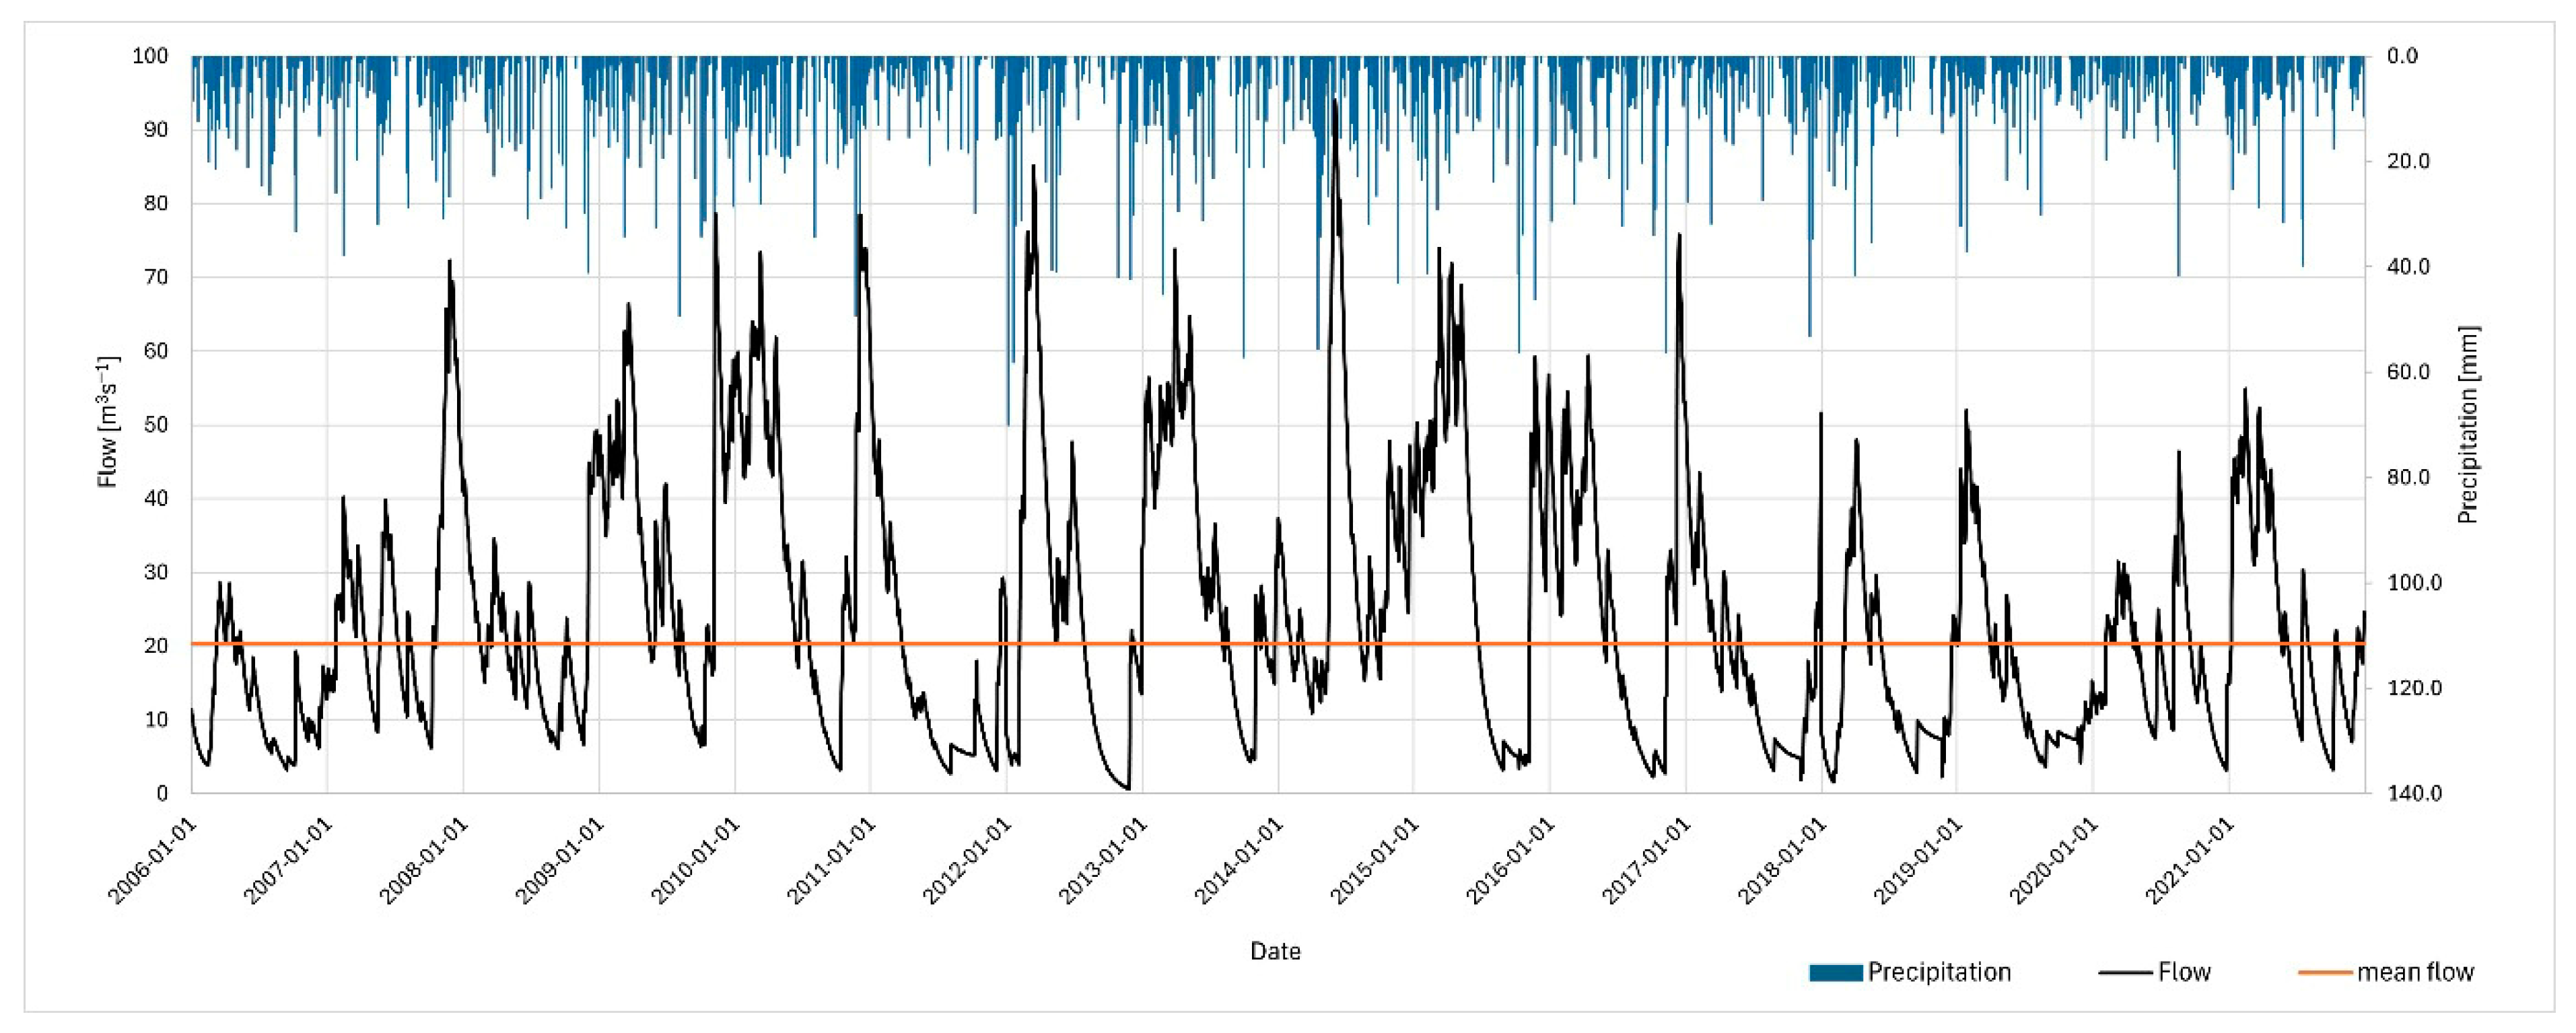
Kosovo faces a significant challenge due to the lack of continuous hydrometric monitoring. Available hydrometric data are often incomplete and subject to considerable uncertainty. Records of river discharge in Kosovo provide only maximum, minimum, and mean flow values (in m3 s−1), measured at hydrometeorological stations. Moreover, frequent interruptions in station operation and gaps in observational records limited the possibility of accurately capturing peak flood discharges during several extreme events. Therefore, using this information and the parameters of a model developed for the Prosna catchment, hydrological modelling was carried out for the Morava e Binçës River catchment in Kosovo. The transfer of the model enabled the generation of a daily discharge hydrograph for this river for the hydrological years 2006–2021 (Figure 5). The highest observed discharge was 94 m3 s−1 recorded on 5 June 2014, while the long-term mean discharge was 20.4 m3 s−1. According to local reports, the year 2014 was particularly significant due to the occurrence of Cyclone Tamara over the Balkan region. This atmospheric event was associated with intense and persistent precipitation, which led to widespread flooding in several areas. Therefore, it is highly probable that the peak discharge identified in our analysis for that period was driven by the extreme rainfall induced by Cyclone.

3.3. CN Parameter for Catchments

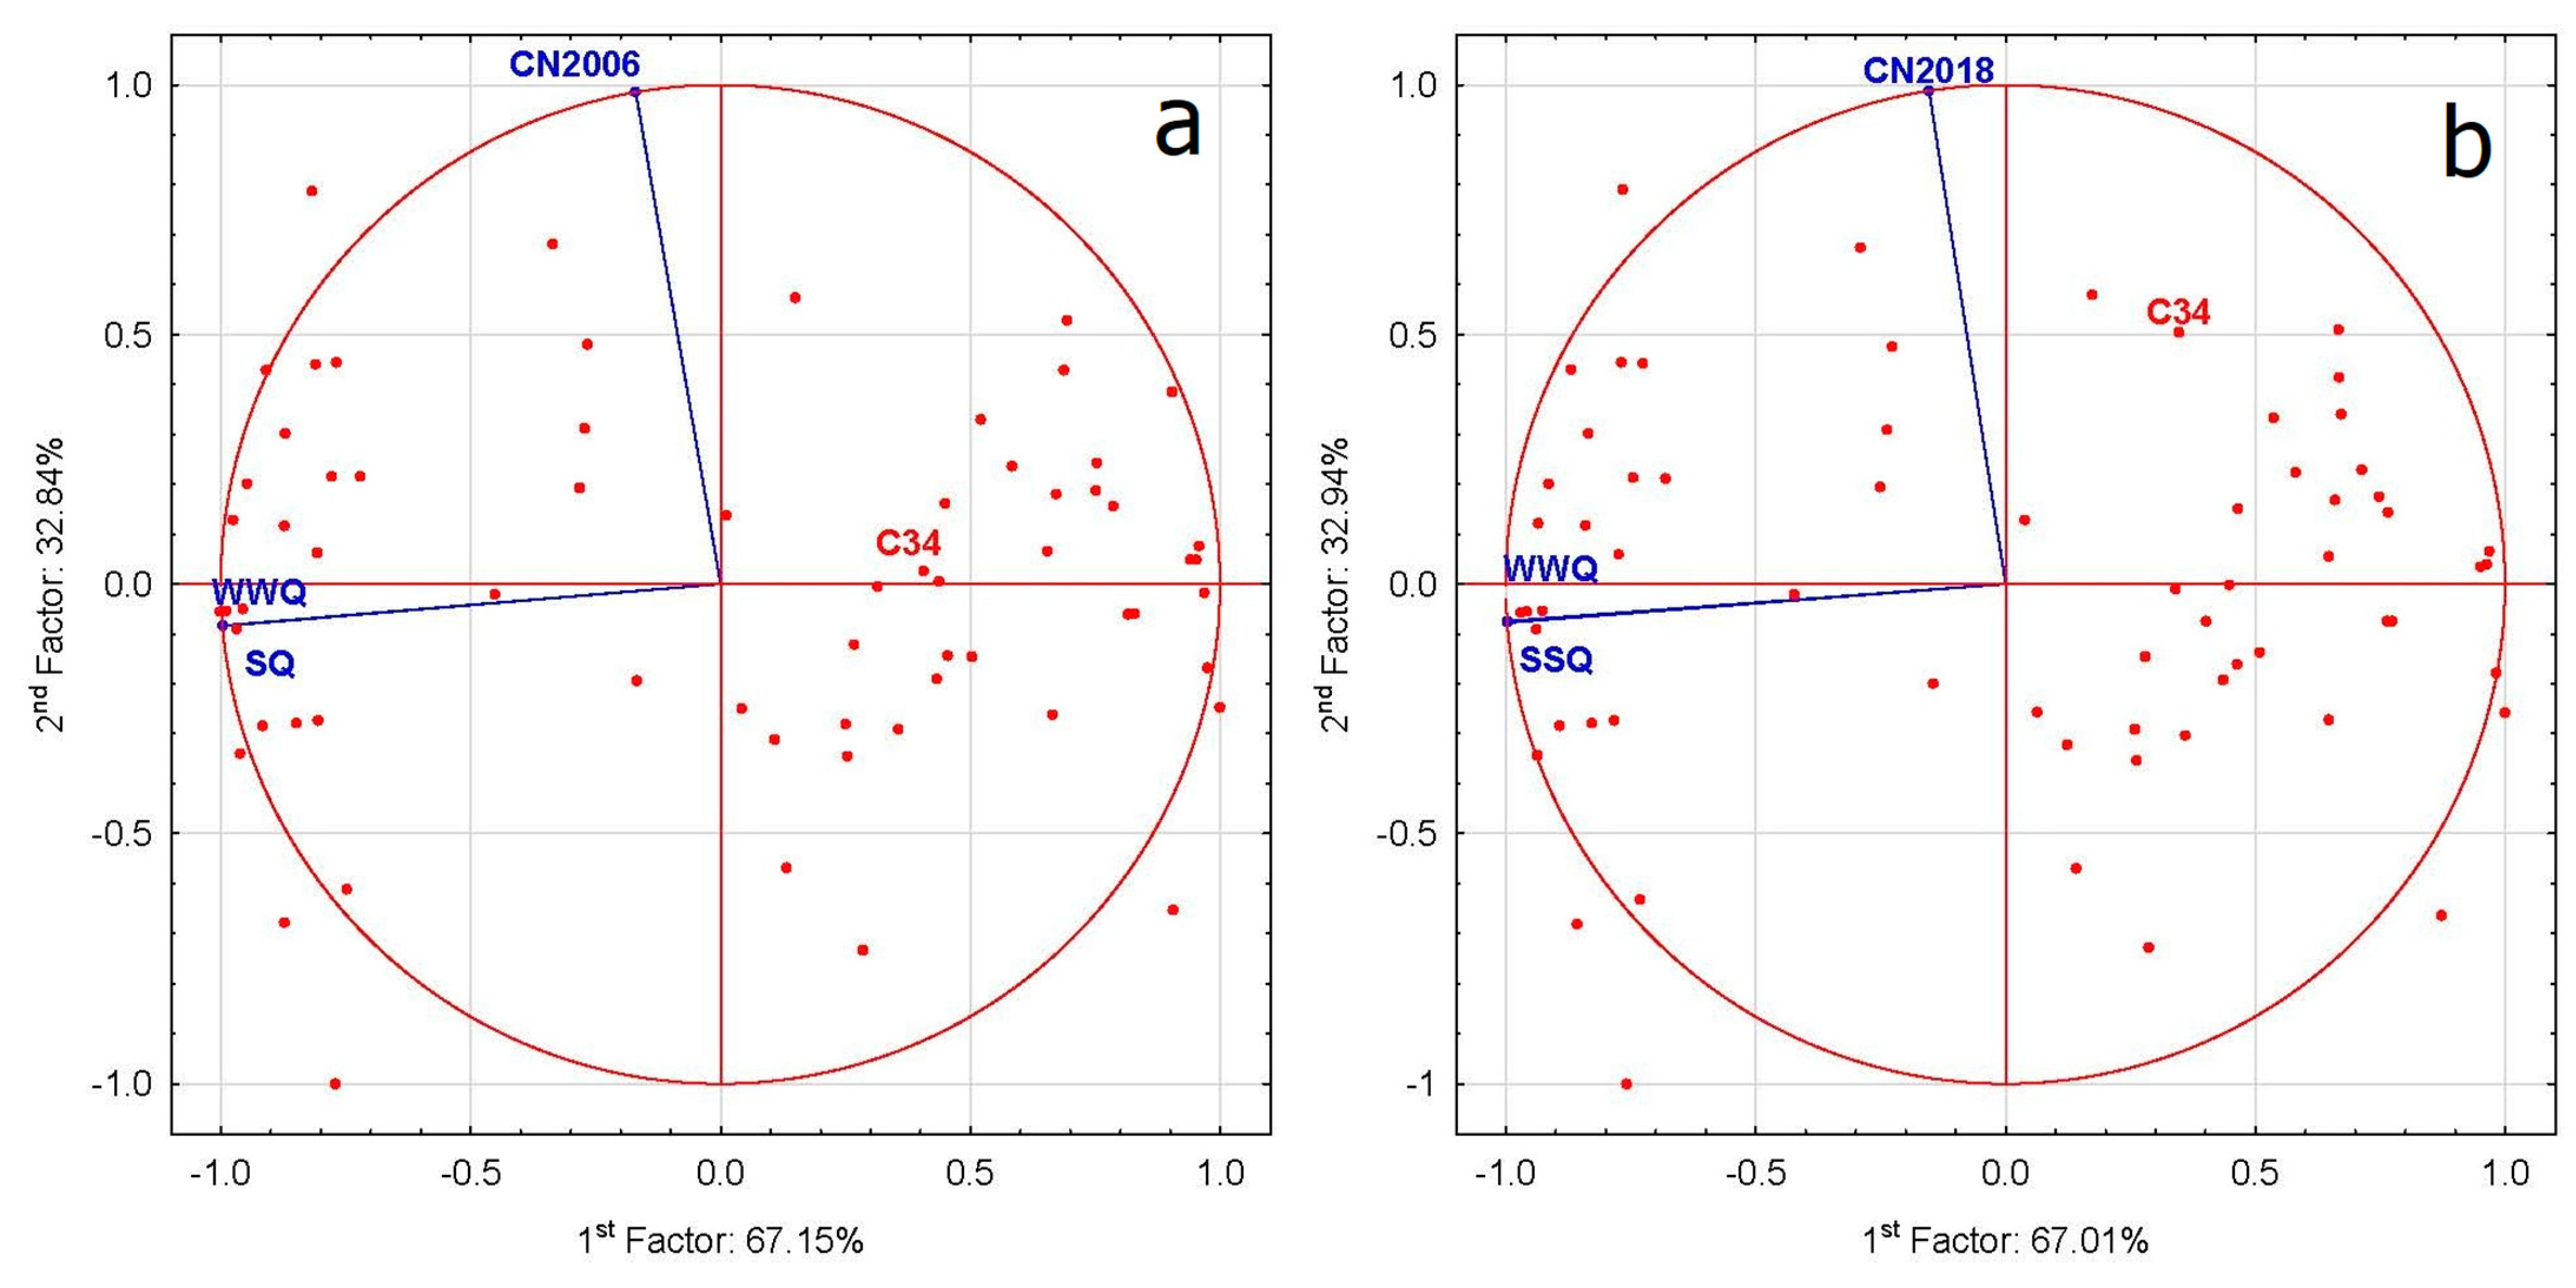
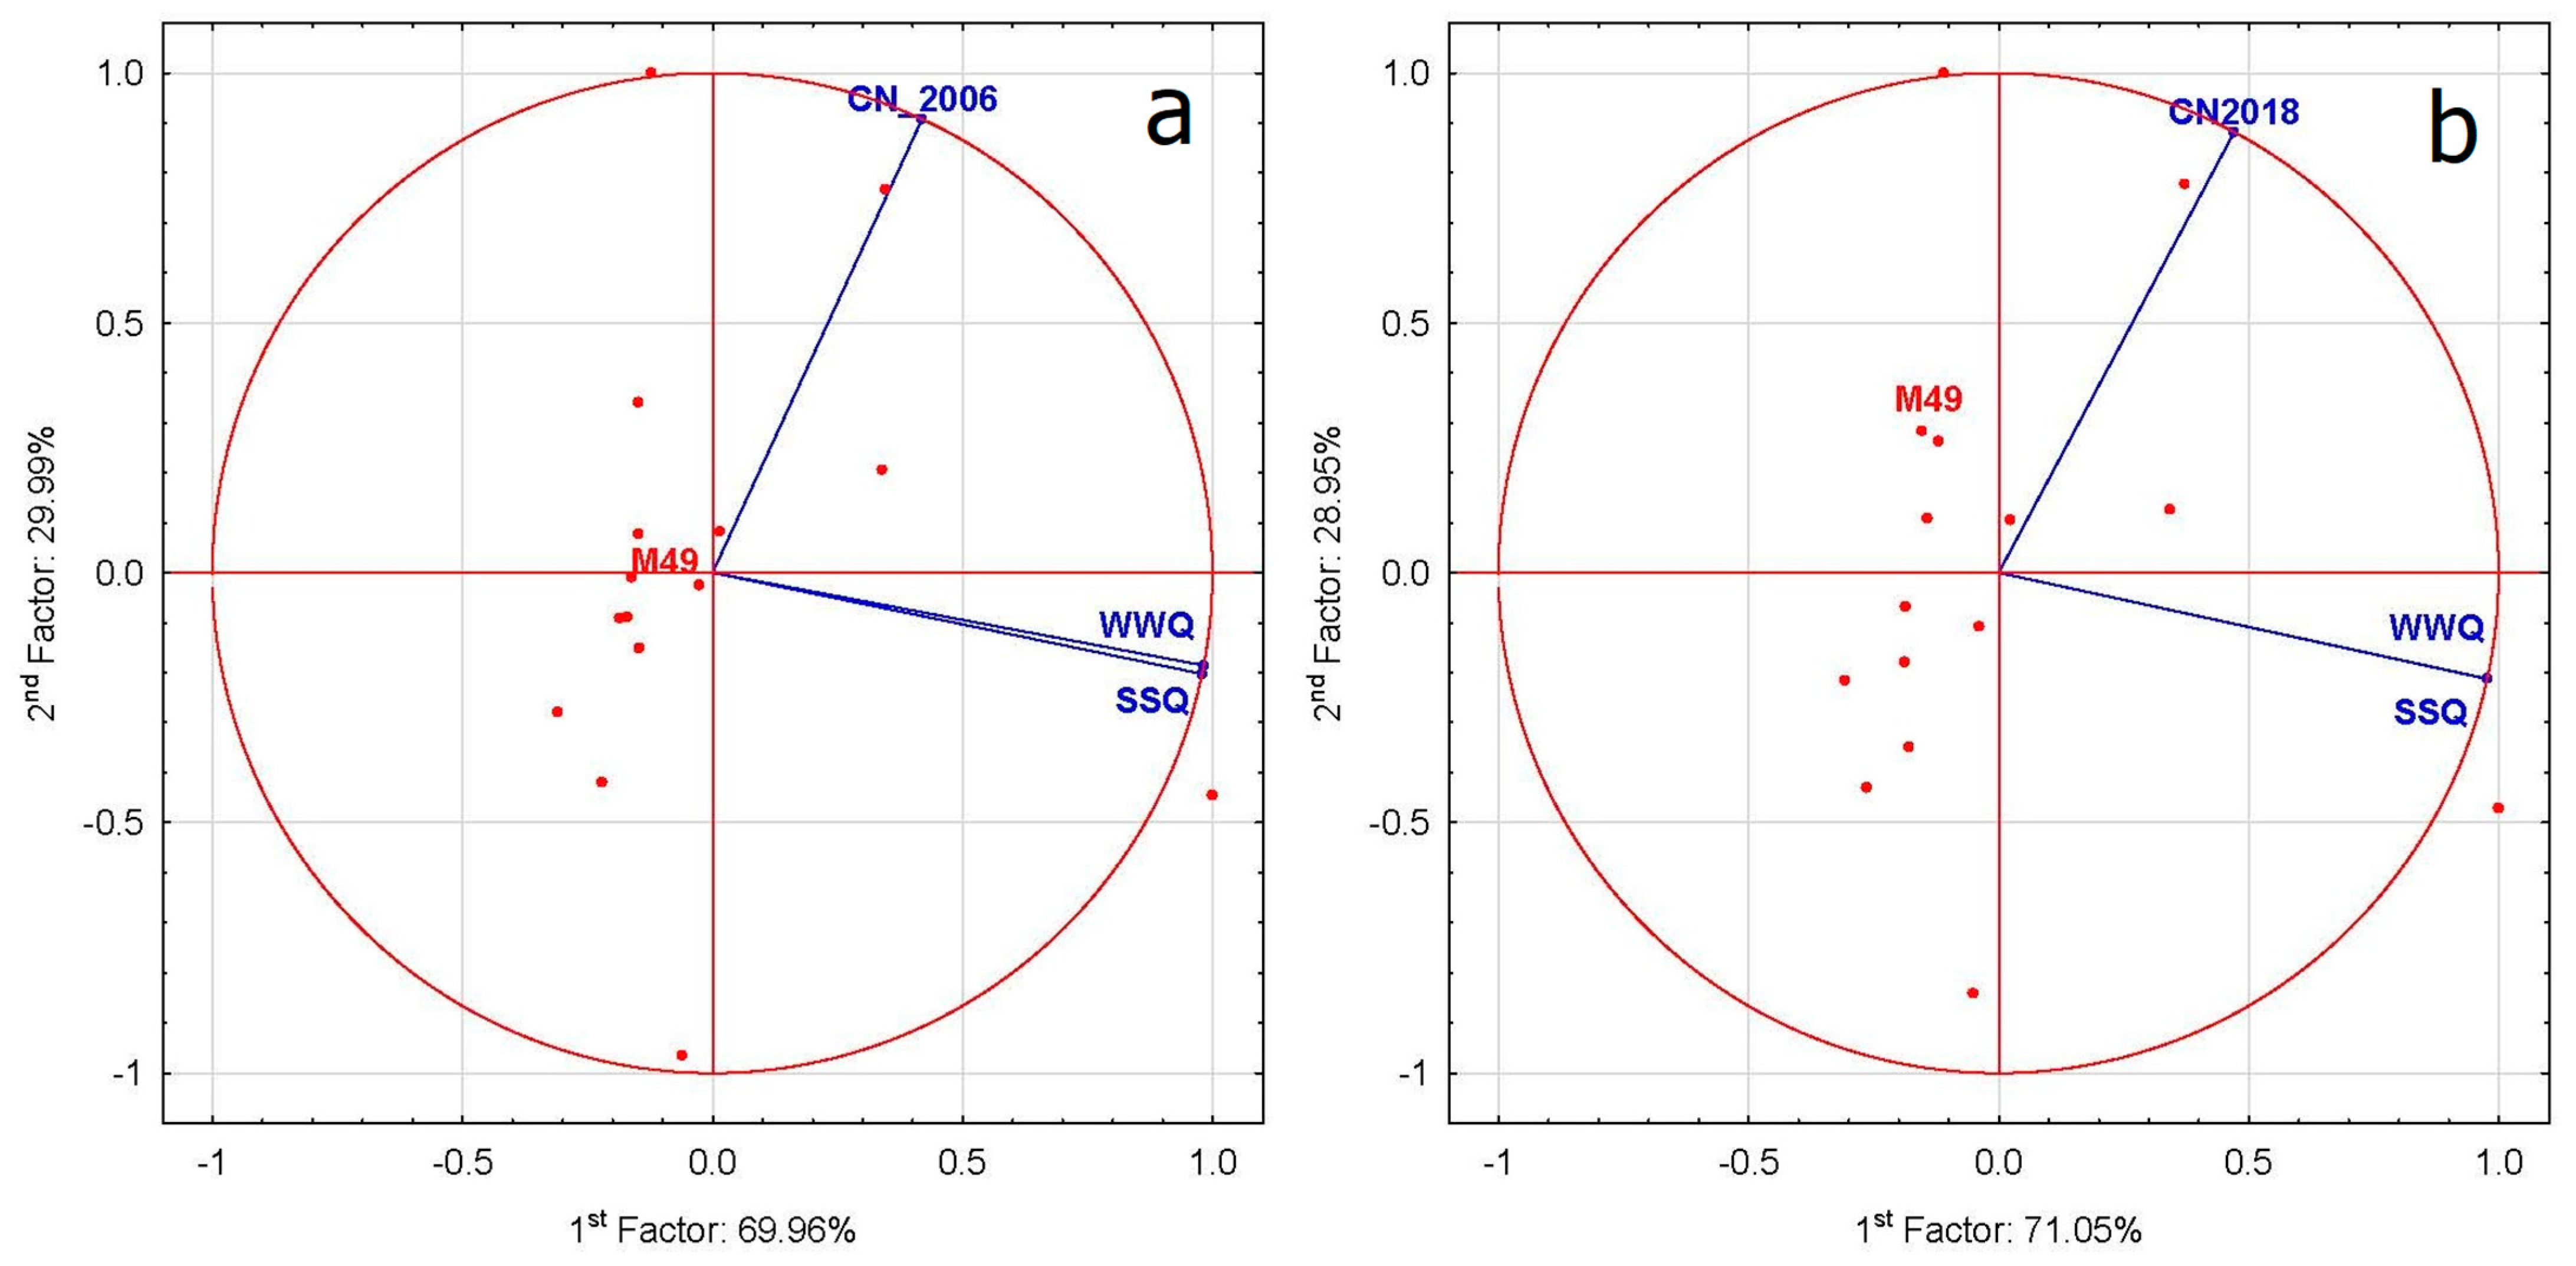
To examine spatial and hydrological variability across the catchments and their sub-catchments, a Principal Component Analysis (PCA) was performed using CN, WWQ, and SSQ as key input parameters. The results showed that, for the Prosna River catchment, the first two principal components explained 100% (73.62 + 26.38) of the total variance in 2006 and 99.95% (73.25 + 26.70) in 2018. In the Morava e Binçës River catchment, the corresponding components accounted for 99.96% (70.01 + 29.95) of the total variance in 2006 and 100% (71.06 + 28.94) in 2018, indicating that the new coordinate system effectively represents nearly all variability in the dataset (Figure 6 and Figure 7). In both catchments, WWQ and SSQ were strongly correlated and showed limited dependence on CN. However, the distinct shifts in the positions of C34 (Prosna) and M49 (Morava e Binçës) within the PCA space were primarily associated with variations in CN values. Comparative analyses using multiple physiographic variables confirmed that CN exerts the greatest influence on the hydrological characteristics of these sub-catchments. The spatial variability of CN across the analyzed units reflects differences in land use, soil composition, and surface conditions that collectively determine infiltration and surface-runoff behavior.

3.4. Change in Land Use in the Years 2006–2018

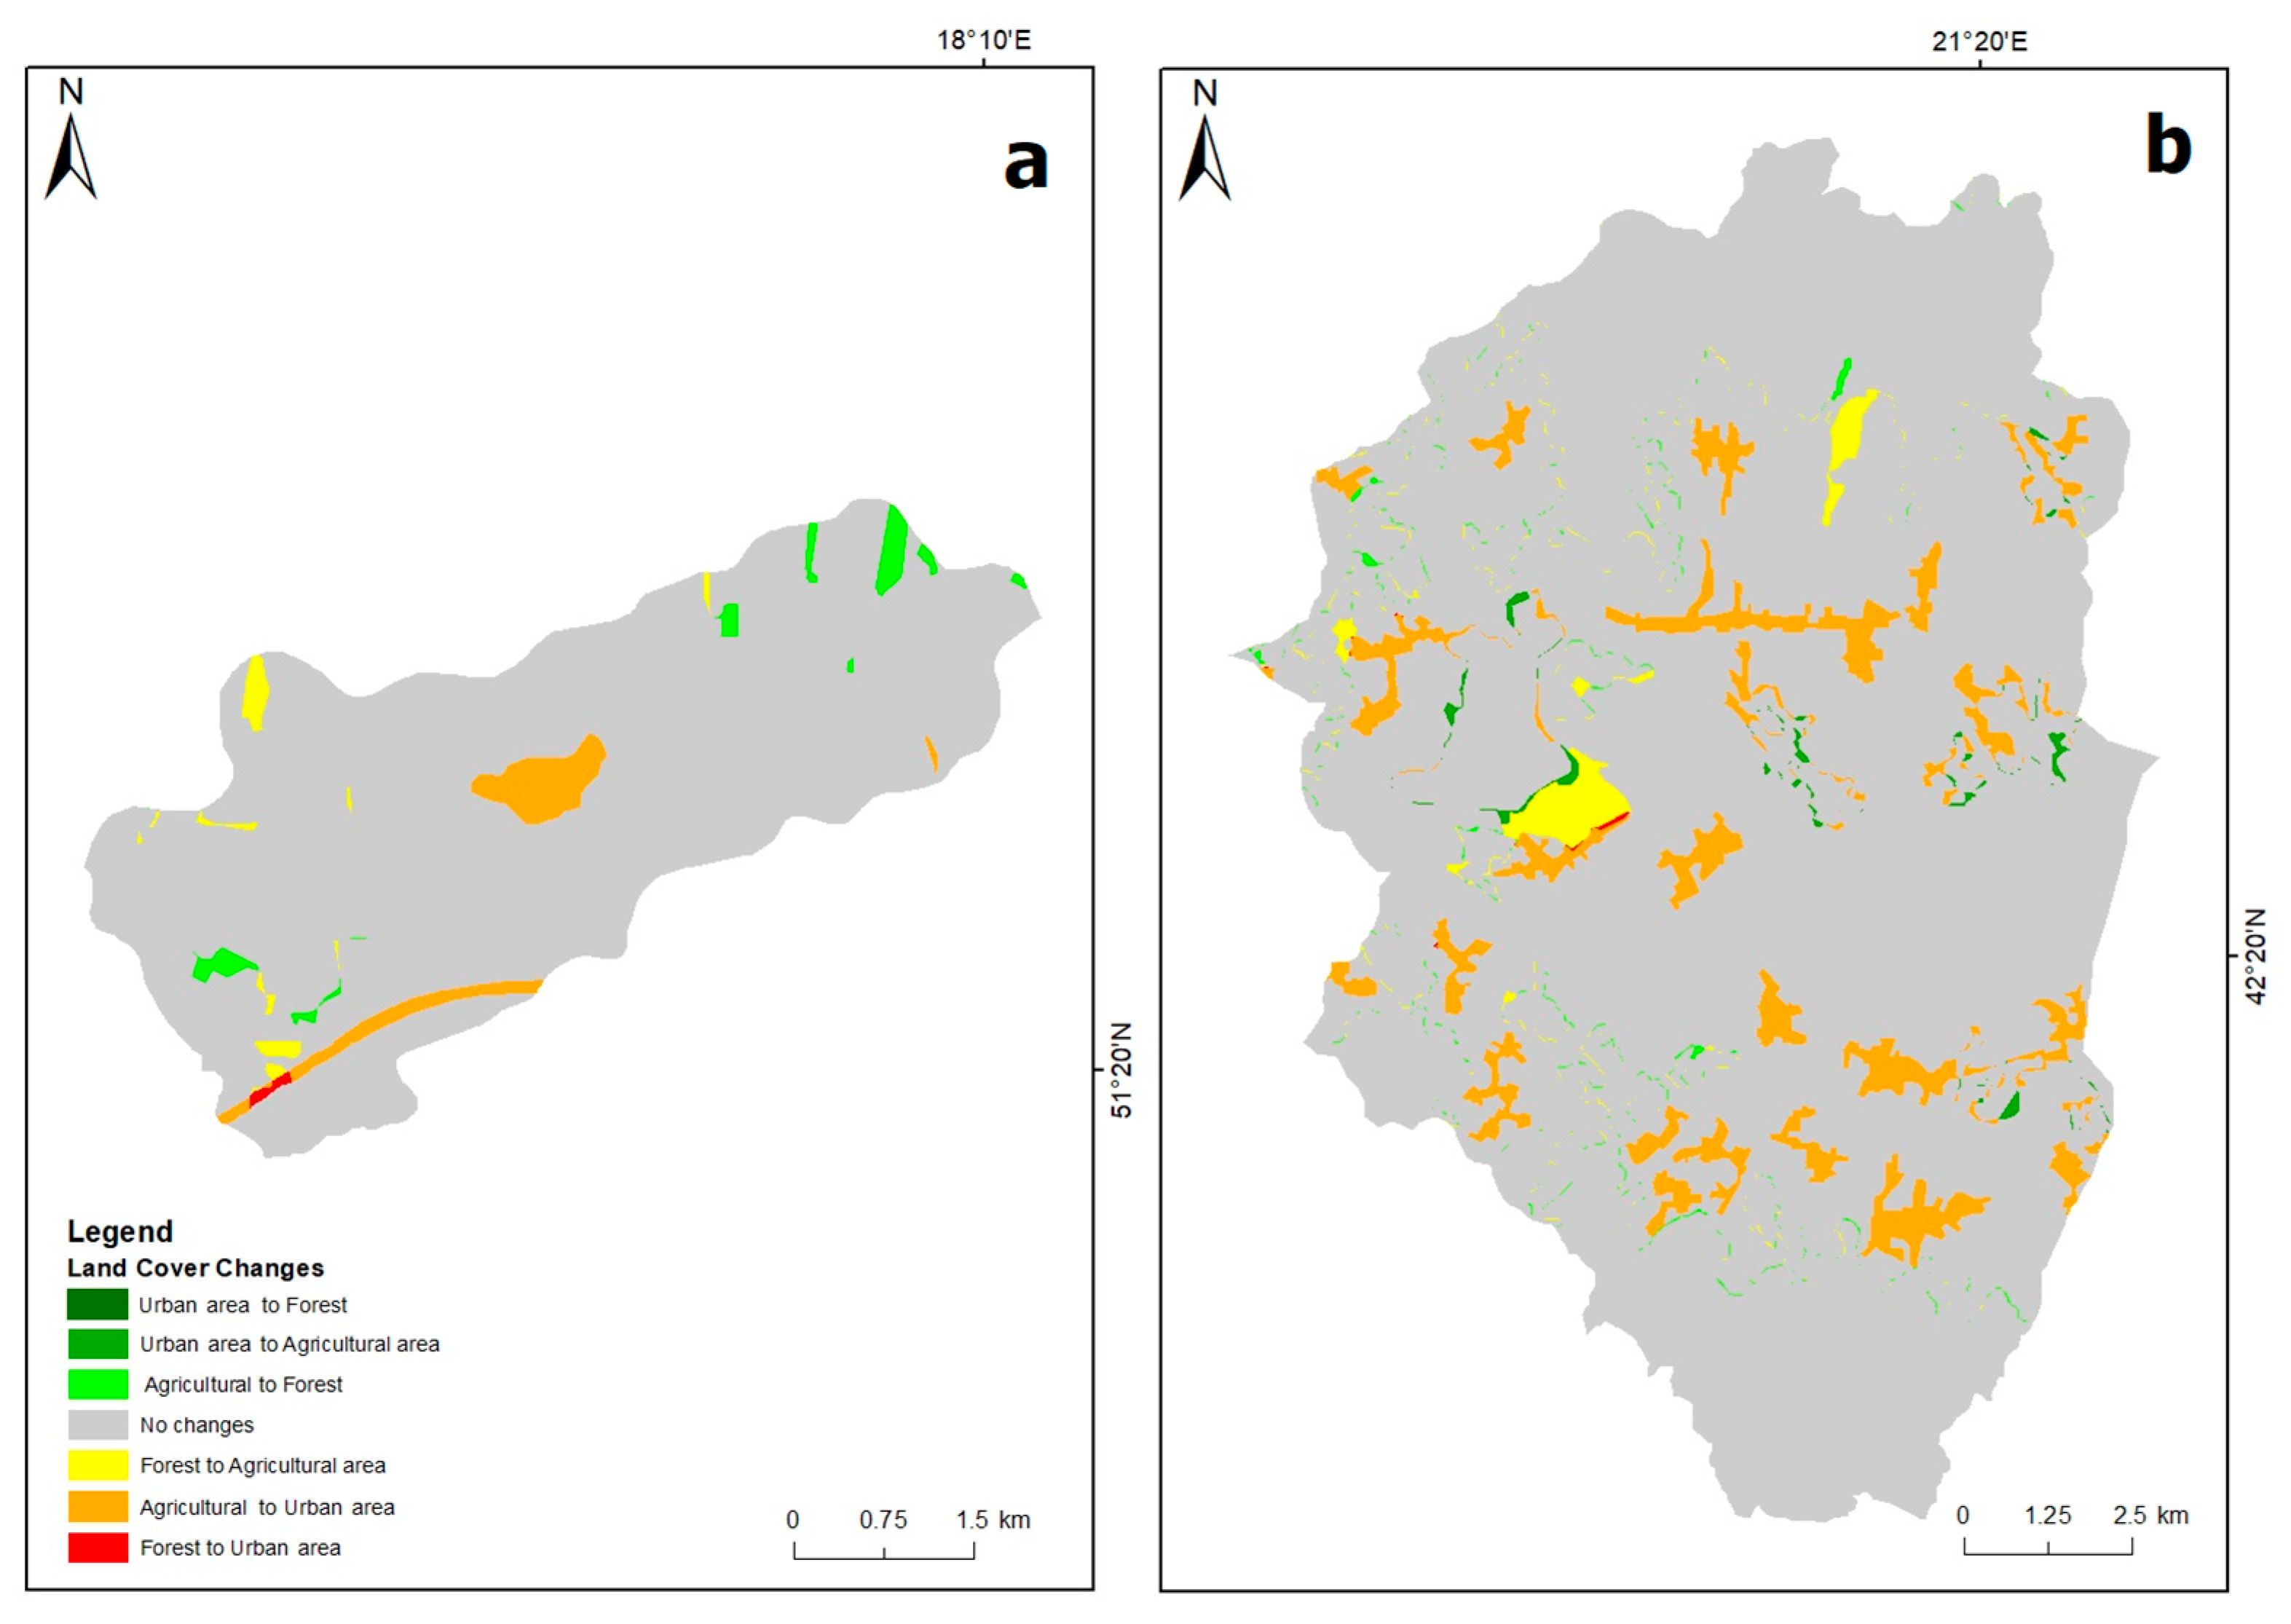
Analysis of land-cover dynamics between 2006 and 2018 revealed a progressive expansion of urban areas in both study regions, reflecting broader processes of land-use transformation. Using CLC data for 2006, 2012, and 2018, land-use changes were assessed for the Prosna River catchment (Poland) and the Morava e Binçës River catchment (Kosovo), with particular emphasis on changes in artificial surfaces and their implications for hydrological response. In the Prosna River catchment, land-cover modification was relatively limited compared to the more rapid changes observed in Kosovo (Supplementary Figure S1). Nevertheless, statistical analysis indicated a significant temporal trend. Linear trend testing of the annual mean CN, consistent with the repeated-measures ANOVA results, showed a statistically significant increase over time (Fisher’s LSD test: F = 6.823, p = 0.0083; Supplementary Figure S2). The most pronounced increase in anthropogenic influence was observed in sub-catchment C34 (Dopływ z Jutrkowa River; Figure 8 and Figure 9), where the CN value increased by 10.13 points. In contrast, the Morava e Binçës River catchment exhibited substantially more intensive urban development during the same period. Among its sub-catchments, the Smira basin (M49) showed the largest increase in CN (Figure 8 and Figure 9), reflecting extensive conversion of agricultural land into built-up areas, particularly along transportation corridors and peri-urban zones. This marked increase in CN indicates a significant reduction in infiltration capacity and a corresponding intensification of surface runoff potential. Detailed analysis of CLC data for sub-catchments C34 (Dopływ z Jutrkowa, Poland) and M49 (Smira, Kosovo) highlights distinct land-use transformation pathways (Figure 9). In the Dopływ z Jutrkowa sub-catchment, approximately 5% of the area transitioned from urban fabric to forest, while 0.14% was converted from forest to urban fabric. The most substantial change involved agricultural land, with 3.43% converted into urban areas. In the Smira sub-catchment, land-use change was dominated by urban expansion, with 6.29% of agricultural land converted into urban fabric and only marginal forest-to-urban transitions (0.03%), without evidence of reverse conversion. These results provide quantitative evidence of spatially differentiated land-use change and its implications for hydrological response across the studied catchments.
Beyond the quantitative changes described above, Figure 9 illustrates the spatial concentration of land-cover transitions within the analyzed sub-catchments, highlighting the clustering of agricultural-to-urban conversions primarily along transportation corridors and near existing settlement zones. This spatial pattern indicates that urban growth has occurred in a contiguous rather than dispersed manner, progressively expanding impervious surfaces outward from existing built-up areas. Temporally, the comparison between 2006 and 2018 demonstrates a steady intensification of these transitions, particularly in the Smira sub-catchment, where urban expansion occupies a larger proportion of previously agricultural land compared with the Dopływ z Jutrkowa sub-catchment. From a hydrological perspective, the observed concentration of land-cover change in valley-bottom and low-slope areas is especially relevant, as these zones contribute significantly to runoff generation and flow accumulation processes. Consequently, even relatively moderate spatial increases in impervious cover may disproportionately influence peak discharge formation and local flood susceptibility within these sub-catchments.

3.5. Scenario Simulation Results Analysis

Scenario-based simulations were carried out for the period 2018–2021, based on the assumptions for scenarios S1–S5, with S0 as the reference condition. Each scenario was simulated under two meteorological variants: (i) baseline conditions, using meteorological data for 2018–2021, and (ii) extreme conditions, based on precipitation anomalies from SPI analysis. The land-cover modifications introduced in the scenarios reflected realistic spatial development trends and were limited to selected sub-catchments characterized by high potential for urban growth, primarily along transportation corridors and near existing residential zones (Supplementary Figure S3 online). The modeled land-cover changes resulted in corresponding adjustments of the CN parameter within the affected catchments, reflecting the hydrological consequences of urban expansion (Table 2). The variation in CN values across scenarios S1–S5 illustrates the progressive effect of increasing imperviousness on runoff potential and catchment response.
The analysis of precipitation records for the multi-year period 2006–2021 showed that 2018 represented a year of average precipitation (SPI = −0.27), while 2019–2021 were classified as dry years, with SPI values of −1.27, −0.74, and −0.50, respectively. In contrast, the earlier period exhibited markedly different conditions; therefore, the years 2012–2015 were selected as the alternative meteorological variant for the scenario simulations. Within this interval, two wet years (2012, SPI = 1.13; 2014, SPI = 1.36) and two near-normal (average) years (2013, SPI = 0.25; 2015, SPI = 0.15) were identified (Table 3). Using a shorter precipitation record reflects a key methodological challenge in hydrological analyses conducted in data-limited environments, and the adopted modeling framework was intentionally designed to evaluate runoff responses under conditions where long-term continuous observations required for standard climatological reference periods are not available.
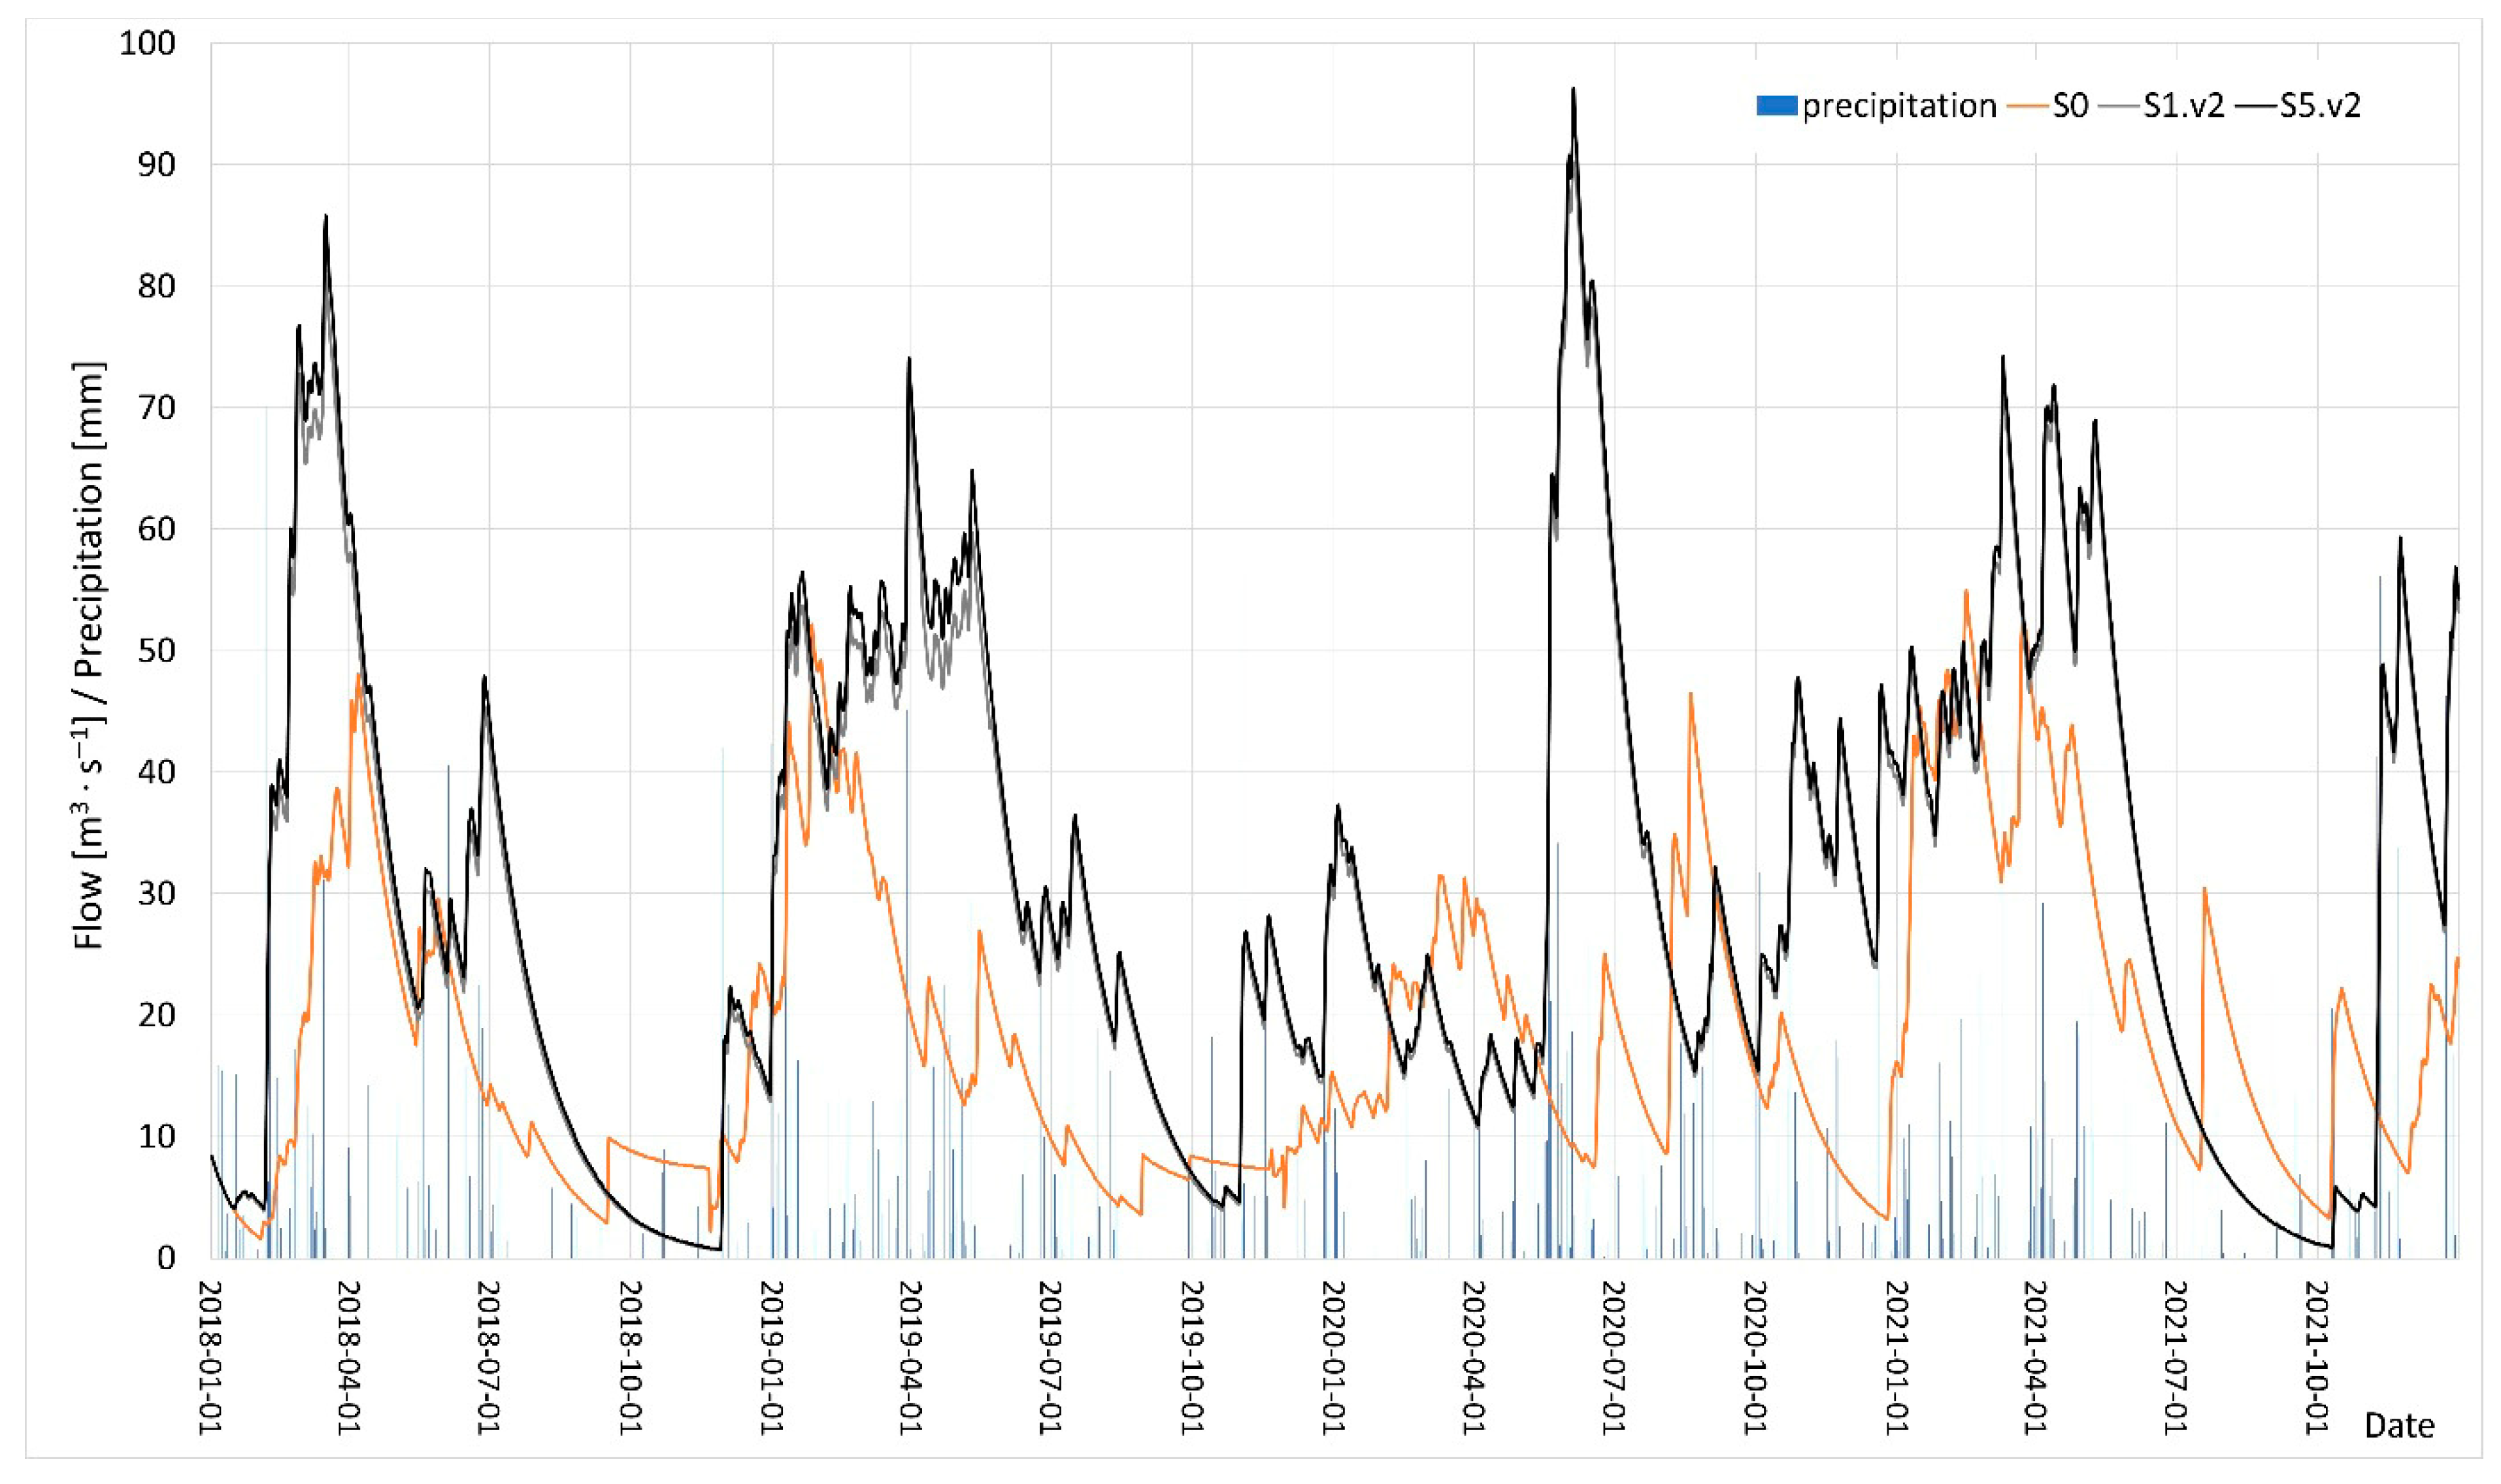
The simulation results indicate that the land-cover changes proposed in scenarios S1–S5 produced no substantial alterations in modeled discharge under meteorological conditions characteristic of normal and dry years (variant 1—v1). The maximum daily difference between S0 and the scenario flows did not exceed 5.9 m3 s−1, while the average daily differences remained below 0.129 m3 s−1 (Table 4). These findings suggest that, under low-precipitation conditions, moderate urban expansion exerts only a limited influence on catchment runoff.
However, when the same land-use assumptions (S1–S5) were simulated under alternative meteorological conditions (variant 2—v2) representing wetter years, the hydrological response changed markedly. With higher precipitation totals, the difference between baseline (S0) and scenario flows increased significantly. The maximum daily difference reached 86.89 m3 s−1, while the mean daily difference increased to a maximum of 12.038 m3 s−1. These results clearly demonstrate that the combined effect of increased precipitation and expanded built-up areas substantially amplifies surface runoff. The progressive increase in the CN parameter across scenarios S1–S5 corresponds to an upward trend in the average daily flow differences between S0 and the modified land-use scenarios, observed consistently in both variants (Figure 10).

4. Discussion

The simulations demonstrate that HEC-HMS with SCS-CN can achieve robust flow predictions for the Prosna River catchment and Morava e Binçës River catchment, consistent with prior applications of SCS-CN for runoff volume estimation and HEC-HMS for combined loss/transform schemes [56,57,58,59,60]. Parallel advances in land-cover products have reduced earlier methodological and institutional barriers to operational mapping [61], enabling national and regional monitoring programs that support science and management [62,63]. For Prosna, validation metrics were excellent (NSE = 0.56; PEP = 4.24%; RSR = 0.66), and calibration performance was satisfactory (NSE = 0.72) while capturing most peak flows, including the 2010 Central Europe flood signal [64]. Reported performances are within ranges documented elsewhere (e.g., NSE ≈ 0.64–0.955; RMSE magnitudes context-dependent), supporting the adequacy of the chosen setup [65,66,67,68]. Comparative studies further indicate that lower RSR denotes better fit and that error magnitudes typically improve after calibration, with acceptable relative percentage errors often <±20% [69,70]. The close agreement between simulated and observed Prosna flows thus provides a sound basis for model transfer. The Prosna River catchment represents a typical lowland river system of central Poland, characterized by low longitudinal gradients, extended floodplain zones, and a significant contribution of groundwater storage to baseflow formation, similar to other Polish lowland rivers such as the Noteć and Warta [71,72]. Recent studies in Polish catchments have demonstrated that climate change is increasing precipitation variability and strengthening the relationship between extreme precipitation and river discharge, thereby elevating flood risk and altering hydrological regimes [73]. These characteristics place the Prosna River within the class of typical Central European lowland rivers, allowing comparison with previously documented hydrological behavior of Polish lowland systems despite the acknowledged modeling simplifications. Previous hydrological studies indicate that groundwater exchange processes and anthropogenic water abstraction for agricultural and industrial purposes may influence seasonal discharge variability in such lowland systems [74]. Conceptual rainfall–runoff models such as HEC-HMS primarily represent surface and near-surface runoff processes and therefore do not explicitly simulate groundwater recharge dynamics or water withdrawals, which may introduce additional uncertainty when applied to lowland river environments. Nevertheless, despite these structural limitations, the Prosna River catchment provides a suitable representative lowland test basin because runoff dynamics in the catchment remain strongly controlled by rainfall-event responses and soil-moisture variability, allowing conceptual rainfall–runoff approaches to adequately reproduce event-scale discharge behavior.
Although physically based distributed hydrological models can provide a more detailed representation of groundwater–surface water interactions and anthropogenic abstractions, their application requires extensive long-term hydro-meteorological and subsurface datasets that are currently unavailable for many basins, particularly in data-limited environments such as Kosovo. In contrast, conceptual rainfall–runoff frameworks such as HEC-HMS offer a robust balance between process representation and data requirements, making them suitable for comparative catchment-scale analyses where the primary objective is to evaluate rainfall-driven runoff responses and land-use impacts. These findings are consistent with previous studies in Polish river basins demonstrating that climate change has altered water balance conditions through increased evaporation and temperature, resulting in measurable changes in river flow regimes and hydrological responses [75].
For meso-scale lowland and mixed physiographic basins such as the Prosna and Morava e Binçës catchments, event-based runoff dynamics remain largely controlled by precipitation variability and surface retention processes, allowing semi-distributed conceptual models to adequately reproduce hydrological behavior despite simplified groundwater representation. Previous studies in Poland have demonstrated that climate change has altered precipitation patterns, including changes in annual totals and seasonal distribution, directly affecting hydrological processes and water availability [76].
In data-scarce Kosovo, continuous discharge series are unavailable, and records are limited to summary statistics at hydrometric stations. Previous studies have demonstrated that hydrological models such as HEC-HMS are widely used and effective for simulating runoff and discharge in ungauged or data-scarce basins, providing a reliable representation of hydrological processes when direct discharge measurements are limited [77].
The transfer of parameters from the Prosna catchment to the Morava e Binçës catchment is supported by a combination of structural similarities and comparable hydrological behaviour, despite clear differences in climate, slope characteristics, and data availability. Both catchments are dominated by agricultural land use and share elongated catchment forms with mixed upland–lowland geomorphology, which influences runoff connectivity and surface processes in a comparable manner. Monthly flow analyses for both rivers indicate a reactive hydrological regime characterized by strong month-to-month variability, extended low-flow periods, and irregular high-flow peaks rather than a uniform seasonal pattern. Similar hydroclimatic variability has been widely assessed using standardized indicators such as the SPI, which has demonstrated strong relationships with runoff variability and hydrological response in Polish river basins under changing climate conditions [78,79].
In both catchments, average discharges remain relatively low while peak flows occur episodically, reflecting limited catchment retention and a dominant event-based runoff-generation mechanism. These similarities support the application of conceptual rainfall–runoff models and the cautious regionalization of selected parameter groups, particularly those related to CN representation. However, differences in precipitation seasonality, river and catchment slopes, soil heterogeneity, and hydrometric infrastructure introduce additional uncertainty, emphasizing that parameter transfer should be treated as a first-order approximation and reinforcing the need for improved monitoring in the Morava e Binçës catchment. This need for improved hydrometeorological monitoring and hydrological assessment is also emphasized in national flood risk evaluations, which highlight increasing flood risk and the importance of hydrological modelling for effective flood risk management in Kosovo [80].
This strategy supports regionalization to ungauged or sparsely gauged basins [81] while acknowledging uncertainty from limited flow observations.
Land-cover analyses highlight how spatial transformations influence hydrologic response. In the Prosna River catchment, sub-catchment C34 (Dopływ z Jutrkowa) exhibited the largest rise in anthropogenic area and a CN increase of 10.13, implying higher runoff potential. In the Morava e Binçës River catchment, the Smira sub-catchment (M49) showed the greatest CN increase, consistent with rapid expansion along transport corridors and conversion of agricultural land. PCA corroborates these patterns: WWQ and SSQ covary strongly, whereas shifts in C34 and M49 positions are primarily associated with CN, underscoring its dominant role in shaping runoff and catchment response [71]. In addition to hydrological implications, contrasting land-use trajectories between the two catchments also suggest differing secondary environmental effects. In the Prosna River catchment, the localized increase in forest cover may contribute to improved microclimatic regulation and potentially influence precipitation-related processes, indicating a localized ecological co-benefit accompanying relatively modest urban expansion. These two sub-catchments (C34 and M49) are highlighted because they represent the most extreme cases of land-cover change within their respective basins, exhibiting the highest CN increases and thus the strongest expected hydrological sensitivity. They are therefore used to illustrate the upper bound of land-use impact rather than to represent the average behavior of all sub-catchments. The scenario behavior observed in the Morava e Binçës catchment is consistent with fundamental hydrological mechanisms governing runoff generation in mixed natural–urban systems. Under predominantly agricultural or semi-natural conditions, much of the rainfall is absorbed through infiltration and stored within the soil profile, resulting in limited runoff during average or low precipitation events (v1). In contrast, increasing coverage of impervious surfaces reduces infiltration capacity, lowers depression storage, and enhances the dominance of infiltration-excess (Hortonian) overland flow. These findings are consistent with previous studies demonstrating that urbanization increases impervious surface area, reduces infiltration, and enhances surface runoff, leading to measurable changes in catchment flow regimes and increased discharge response [82]. This transition explains why only marginal differences in discharge emerge under dry conditions, yet pronounced increases occur under wet-year conditions (v2), when precipitation intensities and antecedent moisture exceed soil retention thresholds. The simulations, therefore, do not simply reflect model sensitivity to CN adjustments; rather, they highlight a shift in the critical precipitation thresholds required to initiate substantial runoff. Urbanization mechanisms documented widely imperviousness, reduced infiltration, higher peaks, alters hydrological dynamics explain the observed tendencies toward increased surface runoff, erosion, and sediment transport, and potential channel modifications that affect flow velocities, bank stability, and ecohydrological quality [83,84].
In Poland, modest urban growth coincided with local reforestation, whereas in Kosovo, rapid post-war development led to extensive urban expansion. Following the 1999 conflict, when many hilly and mountainous settlements were destroyed, population migration toward the plains accelerated. In the Smira sub-catchment, this demographic shift is clearly reflected in census data, with a 16.6-fold increase in population since 1948 and rapid expansion of built-up land by 2018. The 16.6-fold urbanization trajectory in Kosovo is shaped by structural drivers: post-war migration from hilly/mountainous settlements toward plains and along major roads; declining agricultural labor share; diaspora investments concentrated in housing; and limited municipal zoning that enables diffuse expansion wherever private parcels occur. Regional projections suggest European urban land may grow by ~3% annually to 2030 [30], while scenario S1–S5 changes for Morava e Binçës River catchment exceed that pace. Despite a declining national population (2024 preliminary census), urban footprints continue to expand, intensifying hydrologic pressures [85]. The scenario outcomes indicate that hydrological sensitivity in the Morava e Binçës catchment is primarily driven by the magnitude of meteorological forcing. The minimal differences observed in S1–S5 under baseline precipitation reflect the small CN increments applied, which are insufficient to overcome infiltration capacity during dry and average years. In contrast, the large hydrological responses under the wet-year variant arise because high precipitation intensities exceed soil storage thresholds much more frequently. To clarify this distinction, it is important to note that a scenario with modified precipitation, but unchanged land use, would likely produce a similar magnitude of flow increase to that seen in S1–S5 under wet conditions. This confirms that precipitation is the dominant control on runoff generation, while land-use changes act as an amplifying factor rather than the primary driver of discharge differences. The results, therefore, demonstrate interaction rather than pure land-use control: urbanization lowers the threshold at which precipitation extremes translate into large hydrological responses, but extreme rainfall remains the initiating mechanism. Limitations and improvements are clear: refining soil and subsurface information (e.g., targeted surveys/drilling) and enhancing hydro-meteorological monitoring would reduce parameter and structural uncertainty and improve peak-flow reproduction [86]. A number of limitations should be noted when interpreting the results. Transferring parameters from the Prosna catchment to the Morava e Binçës catchment introduces uncertainty due to differences in climate, soils, and monitoring density, even though both catchments share similar land-cover patterns and rainfall-driven hydrological regimes. The validation in Kosovo relies on a rating curve built from limited water-level data, which may not capture full seasonal or extreme-flow variability. The scenario simulations also use simplified CN-based land-use adjustments and assume spatially uniform precipitation, meaning they do not fully reflect infiltration heterogeneity or storm-scale variability. These uncertainties highlight the need for improved hydrometric data and should be considered when evaluating the magnitude of simulated changes. Given the demonstrated sensitivity under wet conditions, sustainable land management, stormwater controls, and riparian restoration emerge as priority measures to mitigate the impacts of urbanization and strengthen flood forecasting capacity [87,88,89,90].

5. Conclusions

This study evaluated the applicability of the HEC-HMS rainfall–runoff modeling framework for analyzing runoff responses to land-cover change in the Prosna River (Poland) and Morava e Binçës River (Kosovo) catchments. The main findings of the study can be summarized as follows. First, the HEC-HMS model reproduced observed streamflow in the Prosna River catchment with satisfactory accuracy during both calibration and validation periods, confirming the suitability of conceptual rainfall–runoff approaches for representing hydrological processes in both monitored and data-limited basins. Second, land-cover analyses indicated progressive expansion of urban areas between 2006 and 2018, leading to measurable increases in CN values and reductions in infiltration capacity. Third, sensitivity analyses demonstrated that CN is the dominant physiographic parameter controlling runoff response in both catchments, reflecting the combined influence of soil properties and land-use structure. Fourth, scenario simulations showed that discharge variability is primarily driven by meteorological forcing, while land-cover changes act as an amplifying factor that significantly increases runoff responses under wet-year conditions. The analysis of precipitation variability using SPI further confirmed the strong influence of hydroclimatic conditions on runoff generation, highlighting the importance of extreme wet and dry periods in controlling hydrological response and discharge dynamics. Finally, the transfer of calibrated model parameters from the Prosna River catchment enabled a preliminary hydrological assessment of the Morava e Binçës catchment, demonstrating the feasibility of applying regionalized modeling approaches in data-limited environments. The model performance metrics obtained during calibration and validation, including satisfactory NSE, low error indicators, and strong agreement between observed and simulated hydrographs, further confirm the reliability of the applied modeling framework for representing hydrological dynamics and runoff variability. These findings contribute to improving the understanding of runoff sensitivity to land-cover change and hydroclimatic variability in contrasting European catchments and demonstrate the applicability of conceptual rainfall–runoff models for hydrological assessment in both gauged and data-scarce environments.
Given the scarcity of hydrological monitoring stations in Kosovo, expanding and modernizing the hydrometric observation network remains a priority. The successful application of the regionalized model in the Morava e Binçës catchment demonstrates that hydrological modeling can provide valuable insights even in environments with limited observational data. Continuous and high-quality discharge records are essential for improving hydrological modeling accuracy, strengthening flood-risk assessment, and supporting adaptive water-management planning. In addition, sustainable land-use planning, stormwater management measures, preservation of natural vegetation, and restoration of floodplain storage areas are recommended to mitigate the hydrological impacts of ongoing urban expansion and to enhance flood resilience in rapidly developing catchments.

Supplementary Materials

The following supporting information can be downloaded at https://www.mdpi.com/article/10.3390/w18050639/s1, Figure S1: Land use in the Prosna and Morava e Binçës River catchments for the years 2006, 2012, and 2018; Figure S2: Evaluation of CN dynamics using trend tests to identify linear, quadratic, and higher-order trends, with contrast values assigned based on Fisher’s LSD test; Figure S3: Scenarios of changes in land use; Table S1.

Author Contributions

Conceptualization, T.A., E.J.-K. and A.B.; methodology, T.A., E.J.-K. and A.B.; software, T.A., E.J.-K. and A.B.; validation, T.A., E.J.-K. and A.B.; formal analysis, T.A., E.J.-K. and A.B.; investigation, T.A.; resources, T.A., E.J.-K. and V.B.; data curation, T.A., E.J.-K. and V.B.; writing—original draft preparation, T.A.; writing—review and editing, T.A., E.J.-K. and A.B.; visualization, T.A. and E.J.-K.; supervision, T.A.; project administration, T.A.; funding acquisition. All authors have read and agreed to the published version of the manuscript.

Funding

This research received no external funding.

Data Availability Statement

The original contributions presented in this study are included in the article/Supplementary Materials. Further inquiries can be directed to the corresponding author.

Acknowledgments

We are sincerely grateful to the Hydrometeorological Institute of Kosovo for providing data and for their support in our article.

Conflicts of Interest

The authors declare no conflicts of interest.

References

  1. Dore, M.H.I. Climate change and changes in global precipitation patterns: What do we know? Environ. Int. 2005, 31, 1167–1181. [Google Scholar] [CrossRef] [Scilit] [PubMed]
  2. Portmann, R.W.; Solomon, S.; Hegerl, G.C. Spatial and seasonal patterns in climate change, temperatures, and precipitation across the United States. Proc. Natl. Acad. Sci. USA 2009, 106, 7324–7329. [Google Scholar] [CrossRef] [Scilit] [PubMed]
  3. Trenberth, K.E. Changes in precipitation with climate change. Clim. Res. 2011, 47, 123–138. [Google Scholar] [CrossRef] [Scilit]
  4. Keller, A.A.; Garner, K.; Rao, N.; Knipping, E.; Thomas, J. Hydrological models for climate-based assessments at the watershed scale: A critical review of existing hydrologic and water quality models. Sci. Total Environ. 2023, 867, 161209. [Google Scholar] [CrossRef] [Scilit]
  5. DeFries, R.S.; Houghton, R.A.; Hansen, M.C.; Field, C.B.; Skole, D.; Townshend, J. Carbon emissions from tropical deforestation and regrowth based on satellite observations for the 1980s and 1990s. Proc. Natl Acad. Sci. USA 2002, 99, 14256–14261. [Google Scholar] [CrossRef] [Scilit]
  6. Franklin, S.E.; Wulder, M.A. Remote sensing methods in medium spatial resolution satellite data land cover classification of large areas. Prog. Phys. Geogr. 2002, 26, 173–205. [Google Scholar] [CrossRef] [Scilit]
  7. Abdeta, D.; Begna, R.; Zerfu, H.; Alemayehu, A.; Ayana, A.N.; Tsegaye, N.T. Analyzing the extent and drivers of land use/land cover change in Southwestern Ethiopia. Discov. Sustain. 2024, 5, 505. [Google Scholar] [CrossRef] [Scilit]
  8. Shadmehri Toosi, A.; Batelaan, O.; Shanafield, M.; Guan, H. Land use–land cover and hydrological modeling: A review. Wiley Interdiscip. Rev. Water 2025, 12, e70013. [Google Scholar] [CrossRef] [Scilit]
  9. Nath, N.K.; Das, P.; Mishra, L.R.; Kumar, A.; Suryawanshi, S.L.; Gautam, V.K. Hydrological modeling and simulation for water resource assessment. In Integrated Management of Water Resources in India: A Computational Approach; Yadav, A.K., Yadav, K., Singh, V.P., Eds.; Water Science and Technology Library; Springer: Cham, Switzerland, 2024; Volume 129, pp. 43–58. [Google Scholar] [CrossRef] [Scilit]
  10. Razavi, S.; Duffy, A.; Eamen, L.; Jakeman, A.J.; Jardine, T.D.; Wheater, H.; Hunt, R.J.; Maier, H.R.; Abdelhamed, M.S.; Ghoreishi, M.; et al. Convergent and transdisciplinary integration: On the future of integrated modeling of human–water systems. Water Resour. Res. 2025, 61, e2024WR038088. [Google Scholar] [CrossRef] [Scilit]
  11. Dong, C. Remote sensing, hydrological modelling and in situ observations in snow cover research: A review. J. Hydrol. 2018, 561, 573–583. [Google Scholar] [CrossRef] [Scilit]
  12. Wurbs, R.A. Dissemination of generalized water-resources models in the United States. Water Int. 1998, 23, 190–198. [Google Scholar] [CrossRef] [Scilit]
  13. Janicka, E.; Kanclerz, J. Assessing the effects of urbanization on water flow and flood events using the HEC-HMS model in the Wirynka River catchment, Poland. Water 2023, 15, 86. [Google Scholar] [CrossRef] [Scilit]
  14. He, B.-J.; Miao, C.; Cheshmehzangi, A.; Mohaghegh, L. Advancement in urban climate change assessment and mitigation technologies. Int. J. Environ. Sci. Technol. 2025, 22, 10979–10990. [Google Scholar] [CrossRef] [Scilit]
  15. Jain, S.; Srivastava, A.; Khadke, L.; Chatterjee, U.; Elbeltagi, A. Global-scale water security and desertification management amidst climate change. Environ. Sci. Pollut. Res. 2024, 31, 58720–58744. [Google Scholar] [CrossRef] [Scilit] [PubMed]
  16. Saxena, V. Water Quality, Air Pollution, and Climate Change: Investigating the Environmental Impacts of Industrialization and Urbanization. Water Air Soil Pollut. 2025, 236, 73. [Google Scholar] [CrossRef] [Scilit]
  17. Sonet, M.S.; Hasan, M.Y.; Kafy, A.; Shobnom, N. Spatiotemporal analysis of urban expansion, land use dynamics, and thermal characteristics in a rapidly growing megacity using remote sensing and machine learning techniques. Theor. Appl. Climatol. 2025, 156, 79. [Google Scholar] [CrossRef] [Scilit]
  18. Tang, Z.; Wang, P.; Li, Y.; Chen, C.; Lou, Y.; Hu, T. Contributions of urbanization and population growth to changes in urban flood exposure in recent decades. Sustain. Cities Soc. 2025, 112, 106592. [Google Scholar] [CrossRef] [Scilit]
  19. Bytyqi, V.; Ramadani, I.; Agaj, T. Challenges of soil resource protection: A case study from Sitnica River Basin (Kosovo). J. Ecol. Eng. 2019, 20, 215–224. [Google Scholar] [CrossRef] [Scilit]
  20. Han, Z.; Li, F.; Liu, C.; Zhang, X.; Hu, C. Influence of Geomorphological Parameters on Flash Flood Susceptibility Analyzed using a Coupled Approach of HEC-HMS Model and Logistic Regression. Water Resour. Manag. 2025, 39, 3031–3051. [Google Scholar] [CrossRef] [Scilit]
  21. Admas, M.; Asrade, T.M.; Cherie, W.D. Application of the HEC-RAS and HEC-HMS models for flood risk analysis in the Gumara River, Upper Blue Nile Basin, Ethiopia. Adv. Meteorol. 2025, 2025, 5092932. [Google Scholar] [CrossRef] [Scilit]
  22. Hagras, A. Hydrological Modeling of Rainfall-Runoff in the Watir Valley Basin, Nuweiba Area, Southeast Sinai, Egypt, Using the HEC-HMS Model Through GIS. In Hydrological Modelling and Assessment in Arid Region Using Remote Sensing and GIS: A Case Study in Southeast Sinai, Egypt; Springer Hydrogeology; Springer: Cham, Switzerland, 2025. [Google Scholar] [CrossRef] [Scilit]
  23. Sarkar, P.; Gayen, S.K. Prioritization and Regionalisation of Sub-watershed for Flash Flood Susceptibility in the Upper Teesta River Basin, North Sikkim, India. J. Indian Soc. Remote Sens. 2025, 53, 1627–1645. [Google Scholar] [CrossRef] [Scilit]
  24. Zhang, K.; Shalehy, M.H.; Ezaz, G.T.; Chakraborty, A.; Mohib, K.M.; Liu, L. An integrated flood-risk-assessment approach based on coupled hydrological–hydraulic modelling and bottom-up hazard-vulnerability analysis. Environ. Model. Softw. 2022, 148, 105279. [Google Scholar] [CrossRef] [Scilit]
  25. SCS. Hydrology, National Engineering Handbook; Supplement A, Section 4, Chapter 10; Soil Conservation Service: Washington, DC, USA, 1956. [Google Scholar]
  26. Natural Resources Conservation Service (NRCS). Estimation of direct runoff from storm rainfall. In National Engineering Handbook, Part 630 Hydrology; United States Department of Agriculture: Washington, DC, USA, 2004; Chapter 10. [Google Scholar]
  27. Natural Resources Conservation Service (NRCS). Hydrologic soil groups. In National Engineering Handbook, Part 630 Hydrology; United States Department of Agriculture: Washington, DC, USA, 2009; Chapter 10. [Google Scholar]
  28. Wojtalak, A.; Sokołowski, R.J.; Moska, P. Morphology, Sedimentology and OSL Chronology of the Lower Prosna River System Evolution—A Case Study in Rokutów, West-Central Poland. Geochronometria 2023, 50, 166–179. [Google Scholar] [CrossRef] [Scilit]
  29. Wypych, A.; Ustrnul, Z.; Kopaczka-Lepa, D.; Walus, K. Weather conditions in southern Poland at the turn of the 20th century—Insights from archived observational records. J. Hist. Geogr. 2024, 86, 191–203. [Google Scholar] [CrossRef] [Scilit]
  30. Agaj, T. Integrating AHP and MCDA for flood risk assessment in Kosovo: A catchment-based perspective. Nat. Hazards 2025, 121, 10711–10747. [Google Scholar] [CrossRef] [Scilit]
  31. Eagleson, P.S. The emergence of global-scale hydrology. Water Resour. Res. 1986, 22, 6S–14S. [Google Scholar] [CrossRef] [Scilit]
  32. Wrzesiński, D. Typology of the river regime in Poland in the supervised and unsupervised approach. Badania Fizjogr. Geogr. 2017, 68, 253–264. (In Polish) [Google Scholar] [CrossRef]
  33. Institute of Meteorology and Water Management (IMGW). Development of a National Plan for the Integrated Development of Water Management in Poland: Study for the Prosna Catchment; IMGW: Kraków, Poland, 2004. [Google Scholar]
  34. Živković, N.; Gavrilović, L. About the high-flow regime of the rivers of Kosovo and Metohia. Bull. Serb. Geogr. Soc. 2009, 89, 225–253. [Google Scholar] [CrossRef] [Scilit]
  35. Musliu, M.; Bilalli, A.; Durmishi, B.; Ismaili, M.; Ibrahimi, H. Water quality assessment of the Morava e Binçës River based on the physicochemical parameters and water quality index. J. Ecol. Eng. 2018, 19, 104–112. [Google Scholar] [CrossRef] [Scilit]
  36. Krasniqi, V. Water Resources Usage in Kosovo and North Macedonia: Patterns, Trends and Socio-Environmental Drivers. J. Water Land Dev. 2025, 13–19. [Google Scholar] [CrossRef] [Scilit]
  37. Hydrometeorological Institute of Kosovo (HMIK). Official Website of the Hydrometeorological Institute of Kosovo. Available online: https://ihmk-rks.net/?page=2,1 (accessed on 21 October 2025).
  38. Bytyqi, V.; Agaj, T. Spatio-temporal distribution of renewable freshwater resources and their availability in Kosovo—An analysis from the Eastern Region. J. Bulg. Geogr. Soc. 2024, 50, 35–52. [Google Scholar] [CrossRef] [Scilit]
  39. Head Office of Geodesy and Cartography (GUGiK). National Geoportal of Poland (Geoportal 2)—Spatial Data and Map Services. Available online: https://www.gov.pl/web/gugik-en (accessed on 21 October 2025).
  40. Institute of Soil Science and Plant Cultivation (IUNG-PIB). Polish Drought Monitoring System. Available online: https://susza.iung.pulawy.pl/en/ (accessed on 21 October 2025).
  41. Kosovo Cadastral Agency (KCA). Official Website of the Kosovo Cadastral Agency. Available online: https://akk.rks-gov.net/en/kca (accessed on 21 October 2025).
  42. Alaska Satellite Facility (ASF). ASF DAAC—NASA Distributed Active Archive Center for SAR Data. Available online: https://asf.alaska.edu/ (accessed on 21 October 2025).
  43. Google LLC. Google Earth Web. Available online: https://earth.google.com/web/ (accessed on 21 October 2025).
  44. Copernicus Land Monitoring Service (CLMS). European Copernicus Land Monitoring Service. Available online: https://land.copernicus.eu/en (accessed on 21 October 2025).
  45. Anggraini, N.; Slamet, B. Thornthwaite models for estimating potential evapotranspiration in Medan City. IOP Conf. Ser. Earth Environ. Sci. 2021, 912, 012095. [Google Scholar] [CrossRef] [Scilit]
  46. Taylor, K.E. Summarizing multiple aspects of model performance in a single diagram. J. Geophys. Res. 2001, 106, 7183–7192. [Google Scholar] [CrossRef] [Scilit]
  47. Joo, J.; Kjeldsen, T.; Kim, H.J.; Lee, H. A comparison of two event-based flood models (ReFH–rainfall–runoff model and HEC-HMS) at two Korean catchments, Bukil and Jeungpyeong. KSCE J. Civ. Eng. 2014, 18, 330–343. [Google Scholar] [CrossRef] [Scilit]
  48. Falniowski, A. The Numerical Methods in Taxonomy. In Metody Numeryczne w Taksonomii; Wydawnictwo Uniwersytetu Jagiellońskiego: Kraków, Poland, 2003. [Google Scholar]
  49. Hervé, A.; Lynne, J.W. Principal component analysis. Wiley Interdiscip. Rev. Comput. Stat. 2010, 2, 433–459. [Google Scholar]
  50. The R Foundation for Statistical Computing. R: A Language and Environment for Statistical Computing; The R Foundation for Statistical Computing: Vienna, Austria, 2022. [Google Scholar]
  51. StatSoft. STATISTICA, version 13.3; StatSoft Inc.: Tulsa, OK, USA, 2020; Available online: https://www.statsoft.com (accessed on 21 October 2025).
  52. PQStat Software. PQStat, version 1.8.6; PQStat: Poznań, Poland, 2023; Available online: http://manuals.pqstat.pl (accessed on 21 October 2025).
  53. Fanta, S.S.; Feyissa, T.A. Performance evaluation of HEC-HMS model for continuous runoff simulation of Gilgel Gibe watershed, Southwest Ethiopia. J. Water Land Dev. 2021, 50, 85–97. [Google Scholar] [CrossRef] [Scilit]
  54. Khaniya, B.; Wanniarachchi, S.; Rathnayake, U. Importance of hydrologic simulation for LIDs and BMPs design using HEC-HMS: A case demonstration. Int. J. Hydrol. 2017, 1, 138–146. [Google Scholar] [CrossRef] [Scilit]
  55. Greenhouse, S.W.; Geisser, S. On methods in the analysis of profile data. Psychometrika 1959, 24, 95–112. [Google Scholar] [CrossRef] [Scilit]
  56. Huynh, H.; Feldt, L.S. Estimation of the Box correction for degrees of freedom from sample data in randomized block and split-plot designs. J. Educ. Stat. 1976, 1, 69–82. [Google Scholar] [CrossRef] [Scilit]
  57. Alizadeh, S.; Nouri, A.Z.; Aminnejad, B. Event-based hydrological modeling using HEC-HMS with a focus on the infiltration mechanism: A case study in Iran. Acta Geophys. 2025, 73, 4741–4760. [Google Scholar] [CrossRef] [Scilit]
  58. Meer, M.S. A Review on Enhancing Flood Mitigation Strategies: A Comparative Study of SCS-CN and ANN Model Integration with GIS for Rainfall–Runoff Simulation. Water Conserv. Sci. Eng. 2025, 10, 51. [Google Scholar] [CrossRef] [Scilit]
  59. Mulu, A.; Kassa, S.B.; Wossene, M.L.; Meshesha, T.M.; Fenta, A.A.; Hailu, Y.B. Runoff estimation using the SCS-CN method and GIS: A case study in the Wuseta watershed, upper blue Nile Basin, Ethiopia. Discov. Water 2025, 5, 32. [Google Scholar] [CrossRef] [Scilit]
  60. Jawale, P.S.; Thube, A.D. Rainfall–runoff modeling of urban floods using GIS and HEC-HMS. MethodsX 2025, 12, 103437. [Google Scholar] [CrossRef] [Scilit] [PubMed]
  61. Kotti, M.L.; Hermassi, T. Accuracy of HEC-HMS and artificial neural network models in simulating runoffs in the upper valley of the Medjerda, Tunisia. J. Hydrol. Reg. Stud. 2025, 61, 102639. [Google Scholar] [CrossRef] [Scilit]
  62. Townshend, J.R.G. Land cover. Int. J. Remote Sens. 1992, 13, 1319–1328. [Google Scholar] [CrossRef] [Scilit]
  63. Said, Y.; Saidani, O.; Algarni, A.D.; Algarni, M.H.; Flah, A. Lightweight multiscale information aggregation network for land cover land use semantic segmentation from remote sensing images. Sci. Rep. 2025, 15, 30265. [Google Scholar] [CrossRef] [Scilit]
  64. Marey, A.; Wang, L.L.; Goubran, S. Developing accurate land cover projection to accelerate the realization of SDG 11 in urbanized cities: A comparative study. Clean Technol. Environ. Policy 2025, 27, 8379–8409. [Google Scholar] [CrossRef] [Scilit]
  65. Bissolli, P.; Friedrich, K.; Rapp, J.; Ziese, M. Flooding in eastern central Europe in May 2010—Reasons, evolution and climatological assessment. Weather 2011, 66, 147–153. [Google Scholar] [CrossRef] [Scilit]
  66. Choudhary, R.; Kumar, A.; C., P.; Naik, M.M.; Choudhury, M.; Khan, N.A. Predicting water quality index using stacked ensemble regression and SHAP based explainable artificial intelligence. Sci. Rep. 2025, 15, 31139. [Google Scholar] [CrossRef] [Scilit]
  67. Banimfreg, B.; Damiani, E.; Gorooh, V.A.; Axisa, D.; Monache, L.D.; Wehbe, Y. Innovative approach for gauge-based QPE in arid climates: Comparing neural networks and traditional methods. J. Big Data 2025, 12, 177. [Google Scholar] [CrossRef] [Scilit]
  68. Agaj, T.; Budka, A.; Janicka, E.; Bytyqi, V. Using ARIMA and ETS models for forecasting water level changes for sustainable environmental management. Sci. Rep. 2024, 14, 22444. [Google Scholar] [CrossRef] [Scilit] [PubMed]
  69. Najim, M.M.M.; Babel, M.S.; Loof, R. AGNPS model assessment for a mixed forested watershed in Thailand. ScienceAsia 2006, 32, 53–60. [Google Scholar] [CrossRef]
  70. Willmott, C.J.; Matsuura, K. On the use of dimensioned measures of error to evaluate the performance of spatial interpolators. Int. J. Geogr. Inf. Sci. 2006, 20, 89–102. [Google Scholar] [CrossRef] [Scilit]
  71. Graf, R. Distribution properties of a measurement series of river water temperature at different time resolution levels (based on the example of the Lowland River Noteć, Poland). Water 2018, 10, 203. [Google Scholar] [CrossRef] [Scilit]
  72. Wicher-Dysarz, J.; Szałkiewicz, E.; Jaskuła, J.; Dysarz, T.; Rybacki, M. Possibilities of controlling the river outlets by weirs on the example of Noteć Bystra River. Sustainability 2020, 12, 2369. [Google Scholar] [CrossRef] [Scilit]
  73. Wypych, A.; Ustrnul, Z. Precipitation and hydrological extremes during the warm season in response to climate change: The example from the Polish Carpathians. Reg. Environ. Change 2024, 24, 90. [Google Scholar] [CrossRef] [Scilit]
  74. Yang, X.; Dai, C.; Jing, J.; Liu, G.; Ru, Q.; Li, J.; Liu, P. Study on the relationship between surface water and groundwater transformation in the middle and lower reaches of Songhua river basin. Sci. Rep. 2025, 15, 8088. [Google Scholar] [CrossRef] [Scilit]
  75. Wrzesiński, D.; Marsz, A.A.; Sobkowiak, L.; Styszyńska, A. Response of low flows of Polish rivers to climate change in 1987–1989. Water 2022, 14, 2780. [Google Scholar] [CrossRef] [Scilit]
  76. Ilnicki, P.; Farat, R.; Górecki, K.; Lewandowski, P. Impact of climatic change on river discharge in the driest region of Poland. Hydrol. Sci. J. 2014, 59, 1117–1134. [Google Scholar] [CrossRef] [Scilit]
  77. Sahu, M.K.; Shwetha, H.R.; Dwarakish, G.S. State-of-the-art hydrological models and application of the HEC-HMS model: A review. Model. Earth Syst. Environ. 2023, 9, 3029–3051. [Google Scholar] [CrossRef] [Scilit]
  78. Osuch, M.; Romanowicz, R.J.; Lawrence, D.; Wong, W.K. Trends in projections of standardized precipitation indices in a future climate in Poland. Hydrol. Earth Syst. Sci. 2016, 20, 1947–1969. [Google Scholar] [CrossRef] [Scilit]
  79. Kubiak-Wójcicka, K.; Bąk, B. Monitoring of meteorological and hydrological droughts in the Vistula basin (Poland). Environ. Monit. Assess. 2018, 190, 691. [Google Scholar] [CrossRef] [Scilit] [PubMed]
  80. Western Balkans Investment Framework (WBIF). Flood Hazard and Flood Risk Maps for All River Basins in Kosovo; Technical Assistance Report WB25-KOS-ENV-02; European Investment Bank: Luxembourg; Western Balkans Investment Framework (WBIF): Brussel, Belgium, 2025. [Google Scholar]
  81. Gacu, J.G.; Monjardin, C.E.F.; Mangulabnan, R.G.T.; Mendez, J.C.F. Application of artificial intelligence in hydrological modeling for streamflow prediction in ungauged watersheds: A review. Water 2025, 17, 2722. [Google Scholar] [CrossRef] [Scilit]
  82. Oudin, L.; Salavati, B.; Furusho-Percot, C.; Ribstein, P.; Saadi, M. Hydrological impacts of urbanization at the catchment scale. J. Hydrol. 2018, 559, 774–786. [Google Scholar] [CrossRef] [Scilit]
  83. Ge, L.; Zheng, H.; Fu, Z.; Cai, C.; Wei, Y. Uncovering interactive impacts of climate extremes and land use change on soil erosion using a coupled RUSLE-OPGD framework. Catena 2025, 261, 109507. [Google Scholar] [CrossRef] [Scilit]
  84. Agaj, T.; Jaskuła, J.; Bytyqi, V.; Agaj, S. Understanding flood in Kosovo: Spatial patterns, urban influences and implications for resilience in Lumbardhi i Pejës and Klina catchments. Int. J. Disaster Risk Reduct. 2024, 113, 104830. [Google Scholar] [CrossRef] [Scilit]
  85. European Environment Agency (EEA). CORINE Land Cover Database. 2013. Available online: http://www.eea.europa.eu/data-and-maps (accessed on 1 March 2013).
  86. European Environment Agency (EEA). Landscapes in Transition—An Account of 25 Years of Land Cover Change in Europe. EEA Report No. 10. 2017. Available online: https://www.eea.europa.eu/publications/landscapes-in-transition (accessed on 2 January 2024).
  87. Fleming, M.; Neary, V. Continuous hydrologic modelling study with the hydrologic modelling system. J. Hydrol. Eng. 2004, 9, 175–183. [Google Scholar] [CrossRef] [Scilit]
  88. Granata, F.; Di Nunno, F. Pathways for Hydrological Resilience: Strategies for Adaptation in a Changing Climate. Earth Syst. Environ. 2025, 10, 203–231. [Google Scholar] [CrossRef] [Scilit]
  89. Azhar, M.; Kane, B.; Vahedifard, F. Comprehensive portfolio of adaptation measures to safeguard against evolving flood risks in a changing climate. Commun. Earth Environ. 2025, 6, 824. [Google Scholar] [CrossRef] [Scilit]
  90. Afandi, G.E.; Moustafa, A.; Ibrahim, S. An In-Depth Analysis of Approaches for Forecasting Extreme Rainfall Events Leveraging Artificial Intelligence, Machine Learning, and Deep Learning Techniques. Earth Syst. Environ 2025. [Google Scholar] [CrossRef] [Scilit]
Figure 1. Location of the Prosna (Poland) and the Morava e Binçës (Kosovo) Rivers catchments.
Water 18 00639 g001
Figure 2. Methodology flow chart for modeling.
Water 18 00639 g002
Figure 3. Comparison of daily observed and simulated streamflows at Bogusław station for the Prosna River, the 2006–2021 period from the HEC-HMS.
Water 18 00639 g003
Figure 4. Taylor diagram illustrating the comparison between observed and simulated streamflow for the analyzed dataset (N = 5783). The diagram presents the correlation coefficient r (angle), standard deviation σ (radial distance), and root mean square error (RMSE; concentric arcs). Observations constitute the reference point (σo = 13.45; r = 1), whereas simulations correspond to the test point (σs = 14.26; r = 0.81; RMSE = 9.38).
Water 18 00639 g004
Figure 5. Simulated water flow for the Morava e Binçës River catchment (2006–2021).
Water 18 00639 g005
Figure 6. PCA for the studied sub-catchments showing changes in CN, SSQ, and WWQ: (a) 2006 and (b) 2018 for the Prosna River.
Water 18 00639 g006
Figure 7. PCA for the studied sub-catchments showing changes in CN, SSQ, and WWQ: (a) 2006 and (b) 2018 for the Morava e Binçës River catchment.
Water 18 00639 g007
Figure 8. Location of sub-catchments C34 (Dopływ z Jutrkowa) of the Prosna River catchment and M49 (Smira) of the Morava e Binçës River catchment.
Water 18 00639 g008
Figure 9. Land-cover transitions indicating urban expansion over agricultural and forest lands between 2006 and 2018 for the analyzed sub-catchments: (a) C34 (Dopływ z Jutrkowa) and (b) M49 (Smira).
Water 18 00639 g009
Figure 10. Comparison of extreme scenarios for the Morava e Binçës River catchment.
Water 18 00639 g010
Table 1. Optimized parameters of the HEC-HMS model.
MethodParameterUnitOptimized Value
Clark Unit HydrographTime of Concentrationh20
Storage Coefficienth850
RecessionInitial Dischargem3 s−10.42
Recession Constant-0.95
Ratio to Peak-0.4
x-0.3
Simple CanopyMax Storagemm25
Crop Coefficient-1
Table 2. Changes in CN parameter based on scenarios S1-S5.
SubchatmentS0S1S2S3S4S5
M4764.3864.3864.3964.3964.4764.61
M6166.4666.5466.5866.5866.5866.58
M6266.9166.9266.9467.0267.0267.02
M6364.6964.6964.6964.6964.6964.69
Table 3. SPI in 2006–2021 for Kosovo (P- sum of precipitation).
YearP [mm]SPIClassificationYearP [mm]SPIClassification
2006727−0.653dry201410541.36wet
20078830.312average20158570.147average
2008756−0.472average20169170.521wet
200910401.28very wet2017777−0.346average
201010581.39very wet2018789−0.272average
2011485−2.15extremely dry2019627−1.27dry
201210161.13wet2020714−0.735dry
20138740.254average2021752−0.5dry
Table 4. Differences between scenario S0 and the adopted alternative scenario (S1–S5).
Scenariosv 1v 2
Average Daily Difference
[m3 s−1]
Maximum Daily Difference
[m3 s−1]
Average Daily Difference
[m3 s−1]
Maximum Daily Difference
[m3 s−1]
S10.0490.4510.88681.00
S20.0622.712.03382.90
S30.0673.812.03483.89
S40.1154.412.03785.58
S50.1295.912.03886.89
Disclaimer/Publisher’s Note: The statements, opinions and data contained in all publications are solely those of the individual author(s) and contributor(s) and not of MDPI and/or the editor(s). MDPI and/or the editor(s) disclaim responsibility for any injury to people or property resulting from any ideas, methods, instructions or products referred to in the content.