Article

The Transformation of P, Fe, and Mn Fractions in Sediment Cores of a Highly Eutrophic Estuary in Northern Taiwan


1
Department of Marine Environmental Informatics, National Taiwan Ocean University, Keelung 202, Taiwan
2
Institute of Marine Biology, National Dong Hwa University, Pingtung 944, Taiwan
*
Author to whom correspondence should be addressed.
Water 2026, 18(5), 604; https://doi.org/10.3390/w18050604
Submission received: 19 December 2025 / Revised: 5 February 2026 / Accepted: 13 February 2026 / Published: 2 March 2026
(This article belongs to the Section Oceans and Coastal Zones)

Abstract

The Danshuei River Estuary (DRE), located in northern Taiwan, is severely polluted by dissolved N (ammonium exceeding 500 μM) and P (dissolved phosphate exceeding 10 μM) due to the domestic wastewater discharging into the river system. However, the knowledge of nutrient pollution in the estuarine sediment is very limited. Three sediment cores (SCs) were collected from the DRE to study P pollution status, and five fractions of sedimentary P, Fe, and Mn were analyzed by Ruttenberg’s sequential extraction method. The analyzed results indicate that the total P concentrations and P fractions in the sediment core of the upper estuary differed significantly from those of the lower estuary. The total p-values in the SC of the upper estuary generally exceeded 2000 mg/kg and were dominated by ferric iron-bound P (PCDB), accounting for 80% of total P pools. This result indicates that the mobilization of the PCDB fraction in the SC was significant and dominated the geochemical P cycle rather than the remineralization of organic P. Meanwhile, the corresponding values decreased to 650 mg/kg and 50% in the SC of the lower estuary. The dominance of the PCDB fraction decreased seaward. Meanwhile, the other four fractions, especially for the PDET fraction, increased seaward. The transformations of the P fractions differed across the different depth intervals in the three sediment cores. The sequence of the dominant fractions of sedimentary P and Fe was similar but differed from the Mn fractions in the three sediment cores.

1. Introduction

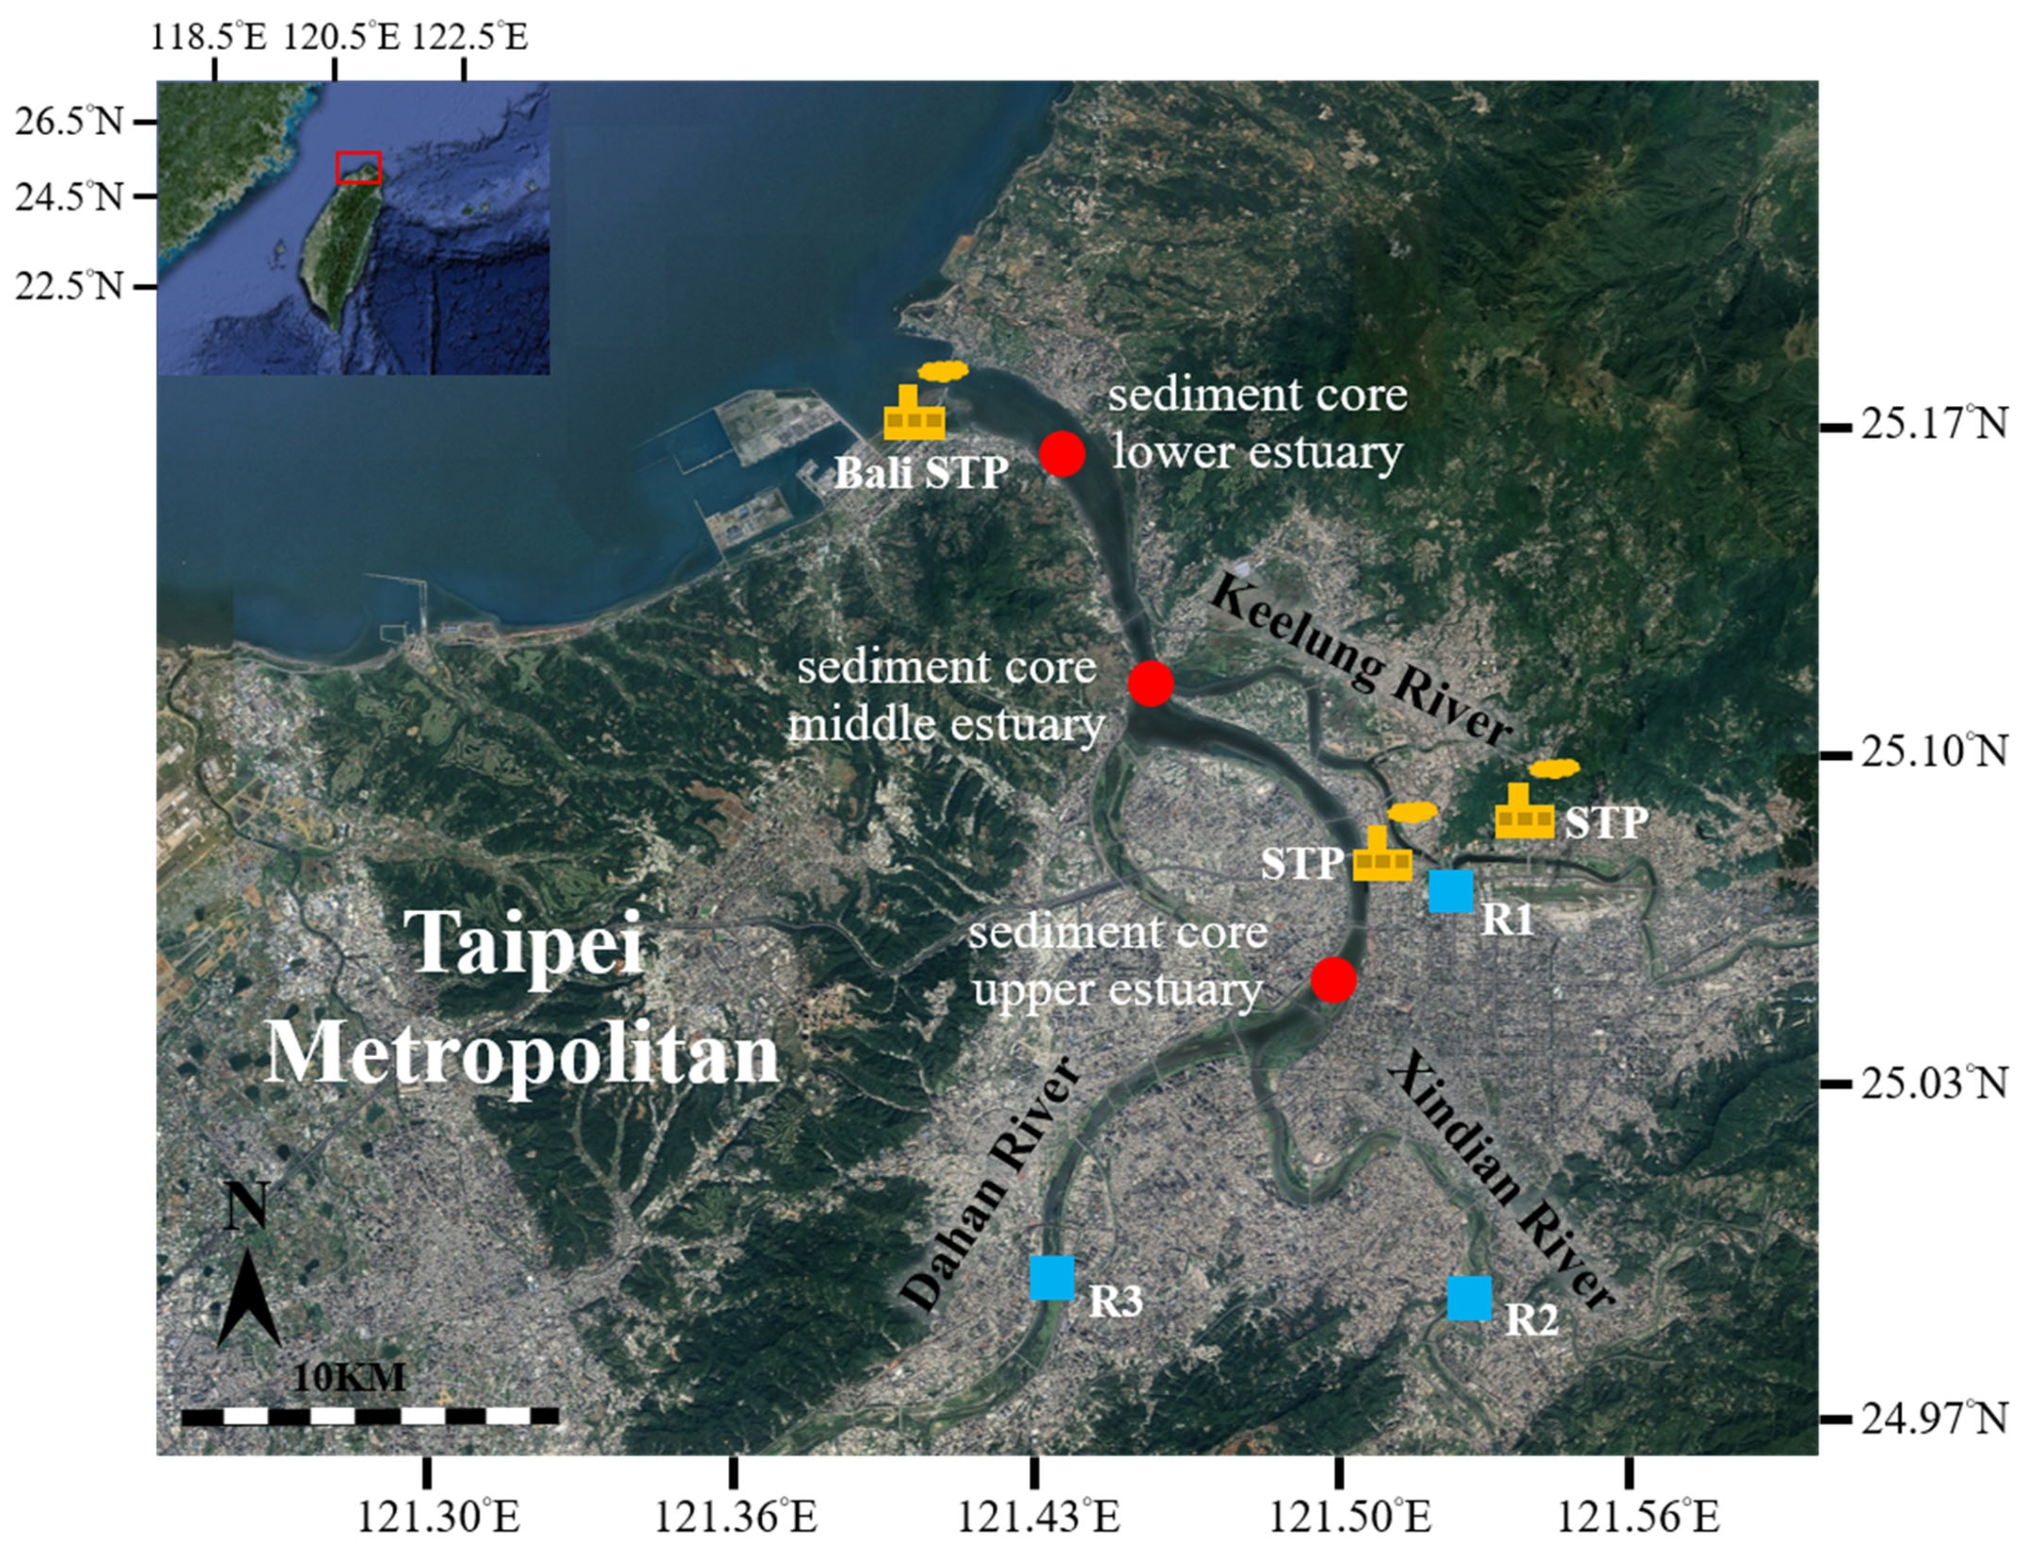
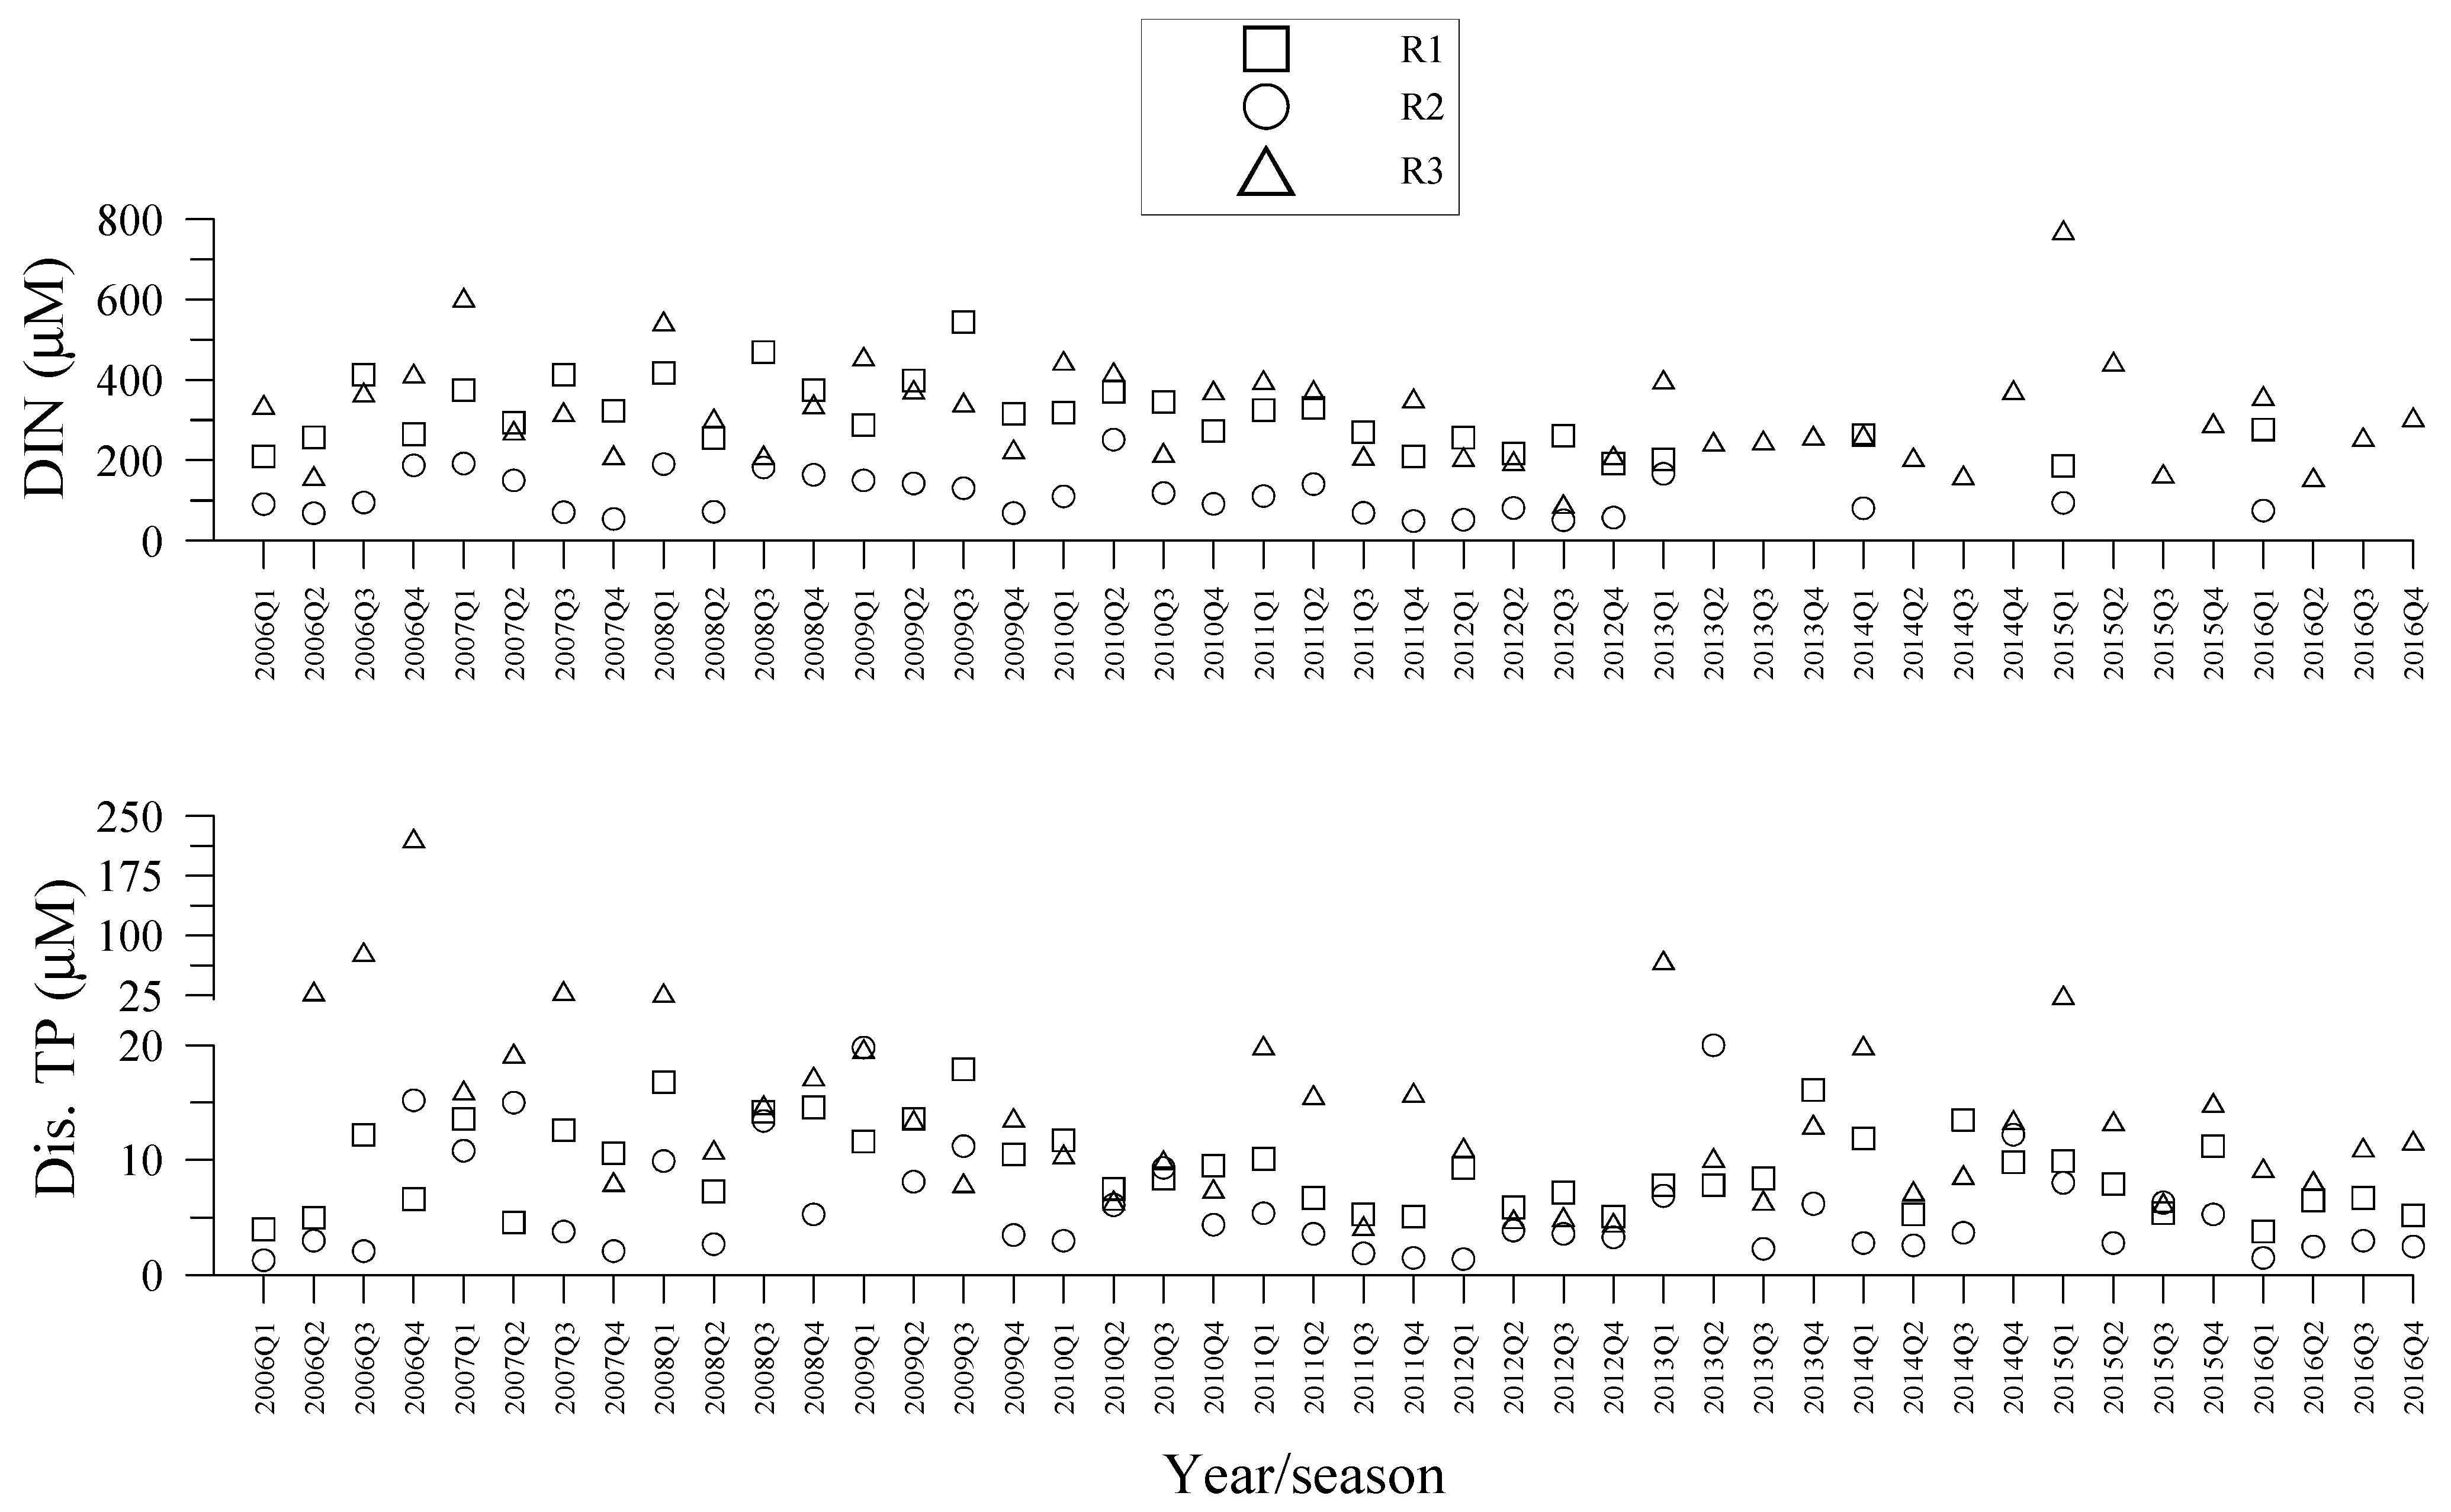
The Danshuei River Estuary (DRE), consisting of three major tributaries namely the Keelung, the Dahan, and the Xindian Rivers located in northern Taiwan, embraces the Taipei metropolitan basin (Figure 1). Over seven million people reside in the catchment area of the DRE, which is severely polluted by nutrients from the discharge of the domestic wastewaters into the DRE [1,2]. Figure 2 shows the recorded concentrations of dissolved total inorganic N (DTIN = NH4+ + NO2 + NO3) and dissolved total P (DTP) in the three river systems during the period of 2006–2016 [1,2]. The DTIN and DTP concentrations recorded in these three tributaries ranged between 49 and 774 μM (average: 240 μM) and between 1.30 and 222.1 μM (average: 12.14 μM), respectively. The DTIN, dominated by ammonium, and DTP concentrations generally exceed 400 μM and 10 μM in the upper estuary, where it commonly exists in hypoxic/anoxic conditions [1,2,3,4]. Thus, the DRE is seriously polluted by nutrients and is considered a highly eutrophic estuary [5]. Compared with the study of nitrogen [2,6,7,8], the study of the P geochemical cycle in the DRE is limited [1,9]. This limitation may partly explain why P is not a redox-sensitive element, and why orthophosphate is the major DTP species in seawater [10]. Thus, the transformation of dissolved P in a marine environment influenced by the ambient environment is not as complicated as that of DIN [1,2].
DIP has a high affinity with particles, especially iron and Mn (hydro)oxides, which play an important role as adsorbents for anions in the water column [11,12]. The reaction of DIP with particles in the marine environment and laboratory experiments has been comprehensively reviewed by Fitzsimons et al. [11]. The geochemical behavior of P in the marine environment, especially in estuarine environments, is strongly influenced by suspended particulate matter (SPM), which can be found everywhere [1,13,14,15]. Once SPM adsorbs DIP and settles into the sediment, it becomes an important reservoir of P in sediments [16,17]. However, sedimentary P could be released during the diagenetic process due to the dissolution of Fe (oxyhydroxides) [17,18,19,20]. Despite the mobilization of sedimentary P bound by Fe oxides, the remineralization of organic matter also releases P into the pore water during the diagenetic process [20,21,22]. The non-refractory fraction, including the exchangeable, reducible, and organic species, of sedimentary phosphorus plays a crucial role in controlling P recycling due to its mobilization during the burial process [13,14,15,22,23,24]. In contrast, authigenic carbonate fluorapatite and detrital species of sedimentary phosphorus are considered to be a non-labile fraction that is not mobilized during the burial process [17,25]. Thus, it is necessary to quantify sedimentary P speciation to better understand the geochemical cycle of P in sediment during the burial process.
The study of P geochemical behavior in the DRE has generally focused on estuarine water [1,2,3]. The knowledge of the geochemical cycle of phosphorus within the DRE sediment is scarce. The purpose of this work was to investigate the transformation, mobilization, and remineralization of phosphorus in the DRE sediment cores by using the SEDEX method [25] to identify sedimentary P fractions. As mentioned above, Fe and Mn (hydro) oxides generally play crucial roles in regulating the P geochemical cycle in the marine environment. Thus, the Fe and Mn concentrations in the extracted solutions were also determined to examine their role in the environment. Hopefully, the results obtained from the present study can fill the gap in the understanding of the P geochemical cycle in the DRE.

2. Materials and Methods

2.1. Study Area

The Xindian, Dahan, and Keelung Rivers are the three major tributaries of the Danshuei River estuarine system. These rivers flow through the great Taipei metropolitan basin and ultimately flow into the Taiwan Strait in northern Taiwan. Owing to the domestic sewage effluents discharged into these rivers, it is very common to find that the upper estuary contains higher concentrations of nitrogen, especially for ammonium (up to 500 µM) and phosphate (up to 12 µM). Higher nutrient concentrations frequently cause algal blooms, and the chlorophyll a concentration can approach 50 µg/L in the upper estuary. However, the distributions of nutrients and chlorophyll a generally exhibit a decrease with increasing salinity due to dilution of tidal seawater [1,2,3,4]. The tidal intrusion into the upper estuary is about 25 km from the estuarine mouth, and the tide ranges between 4 and 8 m with an average tide of 2.2 m [26,27].
The southwest and northeast monsoons strongly influence Taiwan’s climate. The southwest monsoon occurs from May to June. It is the rainy season, which generally contributes 80% of the annual precipitation, ranging between 1500 and 2500 mm over the last four decades, in northern Taiwan [28]. The northeast monsoon, originating from Siberia and Mongolia, generally starts from October to March, and is the cold season with less precipitation. However, the Pacific Northwest tropical typhoon typically hits Taiwan during the summer season. The typhoon can bring heavy rain, and the heavy precipitation may exceed 1000 mm/day for a few days in northern Taiwan. The heavy precipitation may persist for 2–3 days and induce suspended particulate matter (SPM) concentrations in river water exceeding 40 g/L, a condition known as a hyperpycnal event [29,30]. More descriptions of the topography, hydrodynamics, weather conditions, river discharge, suspended loads, and water quality of the Danshuei River Estuary can be found in many studies [1,2,3,4,26,27].

2.2. P Fraction Analysis in Sediment Cores

In order to understand the variation in sedimentary P fractions in different estuarine sections, the divers collected the sediment cores from the upper, middle and lower estuary, respectively, by sailing a small fishing boat to reach the sampling locations of the DRE on 14 May 2021 (Figure 1). The sediment core samples analyzed in the present study were the same sediment cores published in our recent work, which studied the N geochemical variation in sediment cores in the DRE [8]. The detailed analytical processes for the sediment core samples and the interpretations of the analyzed results are presented in this study. Here, we present the analysis of the sedimentary P fractions in the sediment core samples. The phosphorus fractions in the sediment core samples were analyzed by Ruttenberg’s sequential extraction method (SEDEX) [25], which chemically divided the sedimentary P into five fractions: loosely sorbed P, hereafter referred to as PSORB; ferric iron-bound P (PCDB); authigenic carbonate fluorapatite + biogenic apatite + CaCO3-bound P (PCFA); detrital apatite P (PDET); and organic P (PORG). Detailed descriptions of the SEDEX analytical procedure of sedimentary P fractions in our laboratory were presented in our recent study [9]. The P content in each extracted solution was determined by the molybdenum blue spectrophotometric method [31]. The Fe and Mn contents in each extracted solution were also determined by flame atomic absorption spectrophotometry (FAAS) using a Perkin Elmer Analyst 900 (Perkin Elmer, Springfield, IL, USA) and the analyzed species were referred to as the same fraction as P.
To trace the analytical quality, two reference materials (MESS-3 and BCSS-1, purchased from the National Research Council of Canada, Ottawa, ON, Canada) were used to evaluate the SEDEX method in sediment samples. The analytical accuracy of P in the MESS-3 and BCSS-1 reference materials was 100.2 ± 8.4% and 86.8 ± 8.4% (n = 6, one standard deviation), respectively, suggesting that the analytical accuracy was reliable. However, the corresponding values were 76.6 ± 6.2% and 73.9 ± 2.7% for Fe and 90.0 ± 5.3% and 87.4 ± 2.6% for Mn. The analytical results for Fe and Mn obtained in this study are in good agreement with those reported by Kryc et al. [32]. Their study showed that the analytical accuracy of the sequential extraction method for Fe and Mn in the BCSS and MESS-1 reference materials was approximately 80% and 90%, respectively, which was attributed to the sediment lithology of the reference materials. Thus, the total concentrations of Fe and Mn in the sediment core samples of the present study were underestimated. The detailed interpretation of the analytical quality assurance (QA) and quality control (QC) of the SEDEX method carried out in our laboratory can be found in our previous study [9].

3. Results

3.1. Total P in Sediment Cores

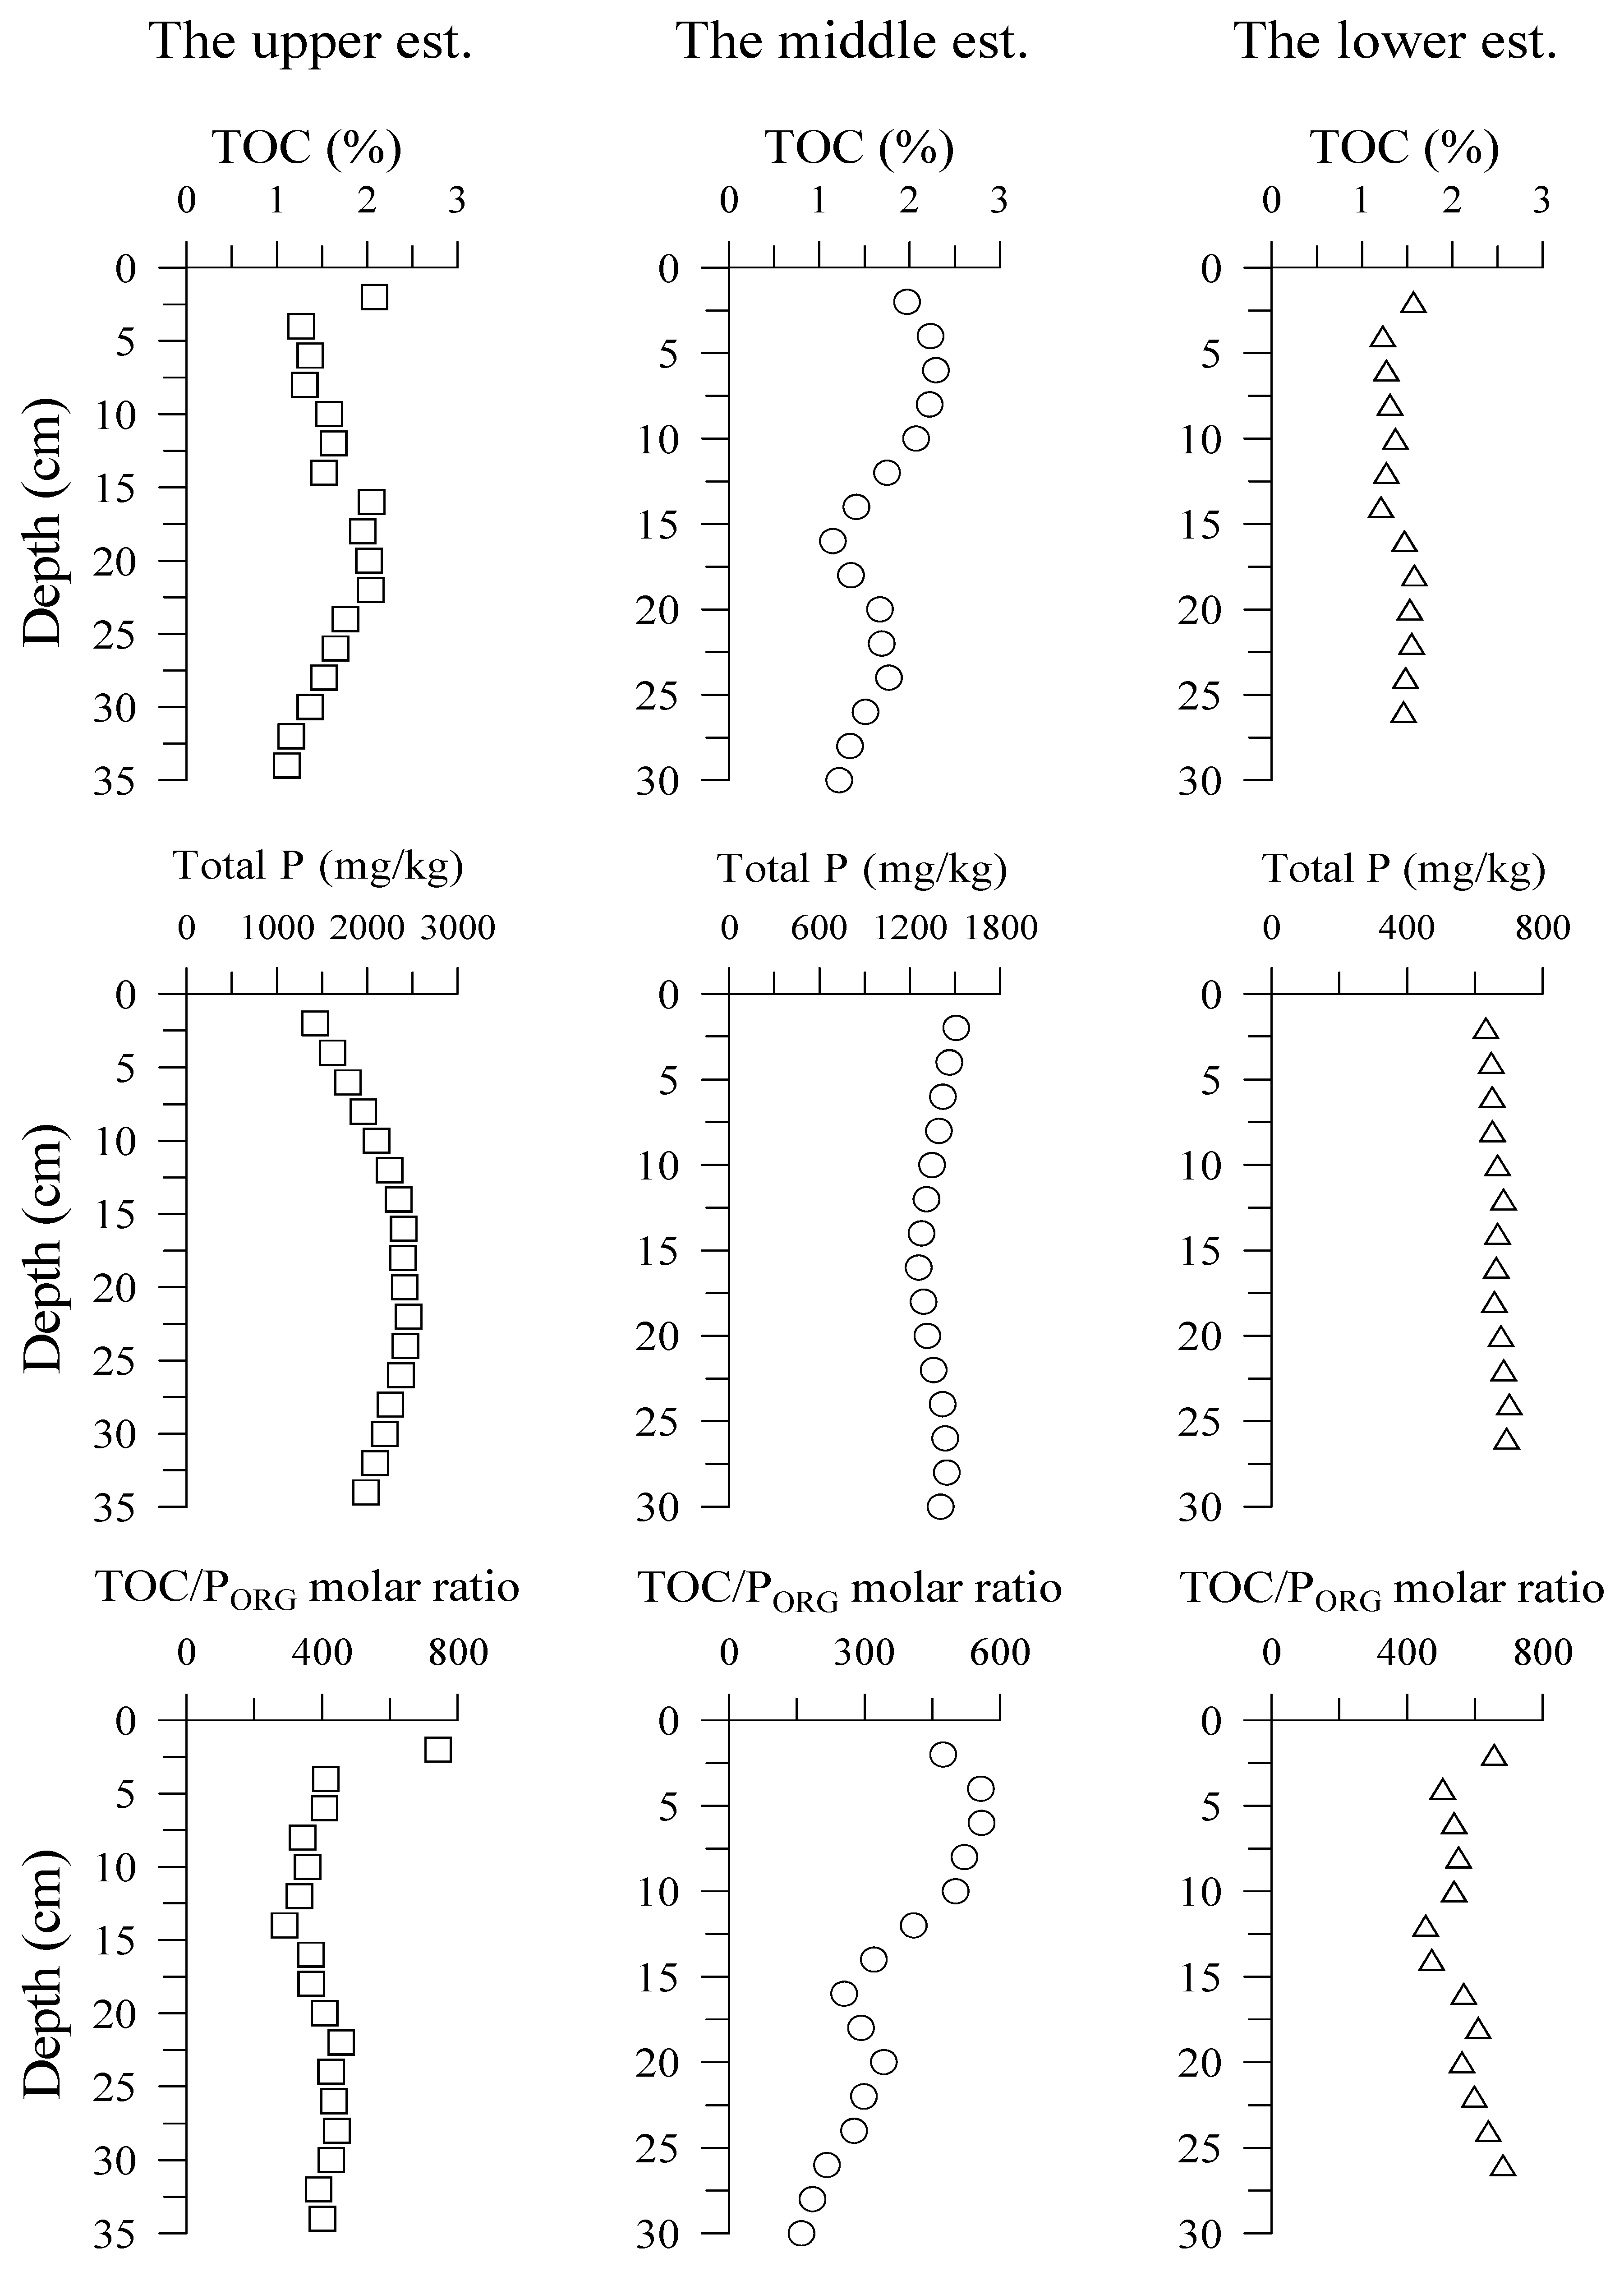
The profiles of TOC, total P (TP), and the molar C/P ratio of the three sediment cores are shown in Figure 3. The TOC and TP concentrations in the three sediment cores ranged between 1.11~2.29% and 631.7–2458.7 mg/kg (20.40–79.38 μmol/g). The interpretation of the TOC distribution in the three sediment cores has been addressed well in our recent study [8]. The present study will focus on the interpretation of P fractions in the three sediment cores. The total P (TP) concentrations in the surface sediment core of the upper estuary were much higher than those of the middle and the lower estuary. The average TP concentrations were 2063 mg/kg in the upper estuary and decreased to 685 mg/kg in the lower estuary. This result resembled our recent study, which indicated that the TN concentrations in the surface sediment core of the upper estuary were two and four times higher than those of the middle and the lower estuary [8]. The TP profile in the sediment core of the upper estuary seemed to increase with depth at 2–16 cm depth intervals. Afterward, the TP concentrations slightly decreased with increasing depth. Such a profile suggests that the TP mineralization occurred obviously in the sediment during the burial process. In contrast, the TP profile in the sediment core of the middle estuary slightly decreased with depth at depth intervals of 2–16 cm. Afterward, the TP concentrations increased slightly with depth. The TP profile in the sediment core of the lower estuary remained relatively constant.

3.2. Phosphorus Fraction

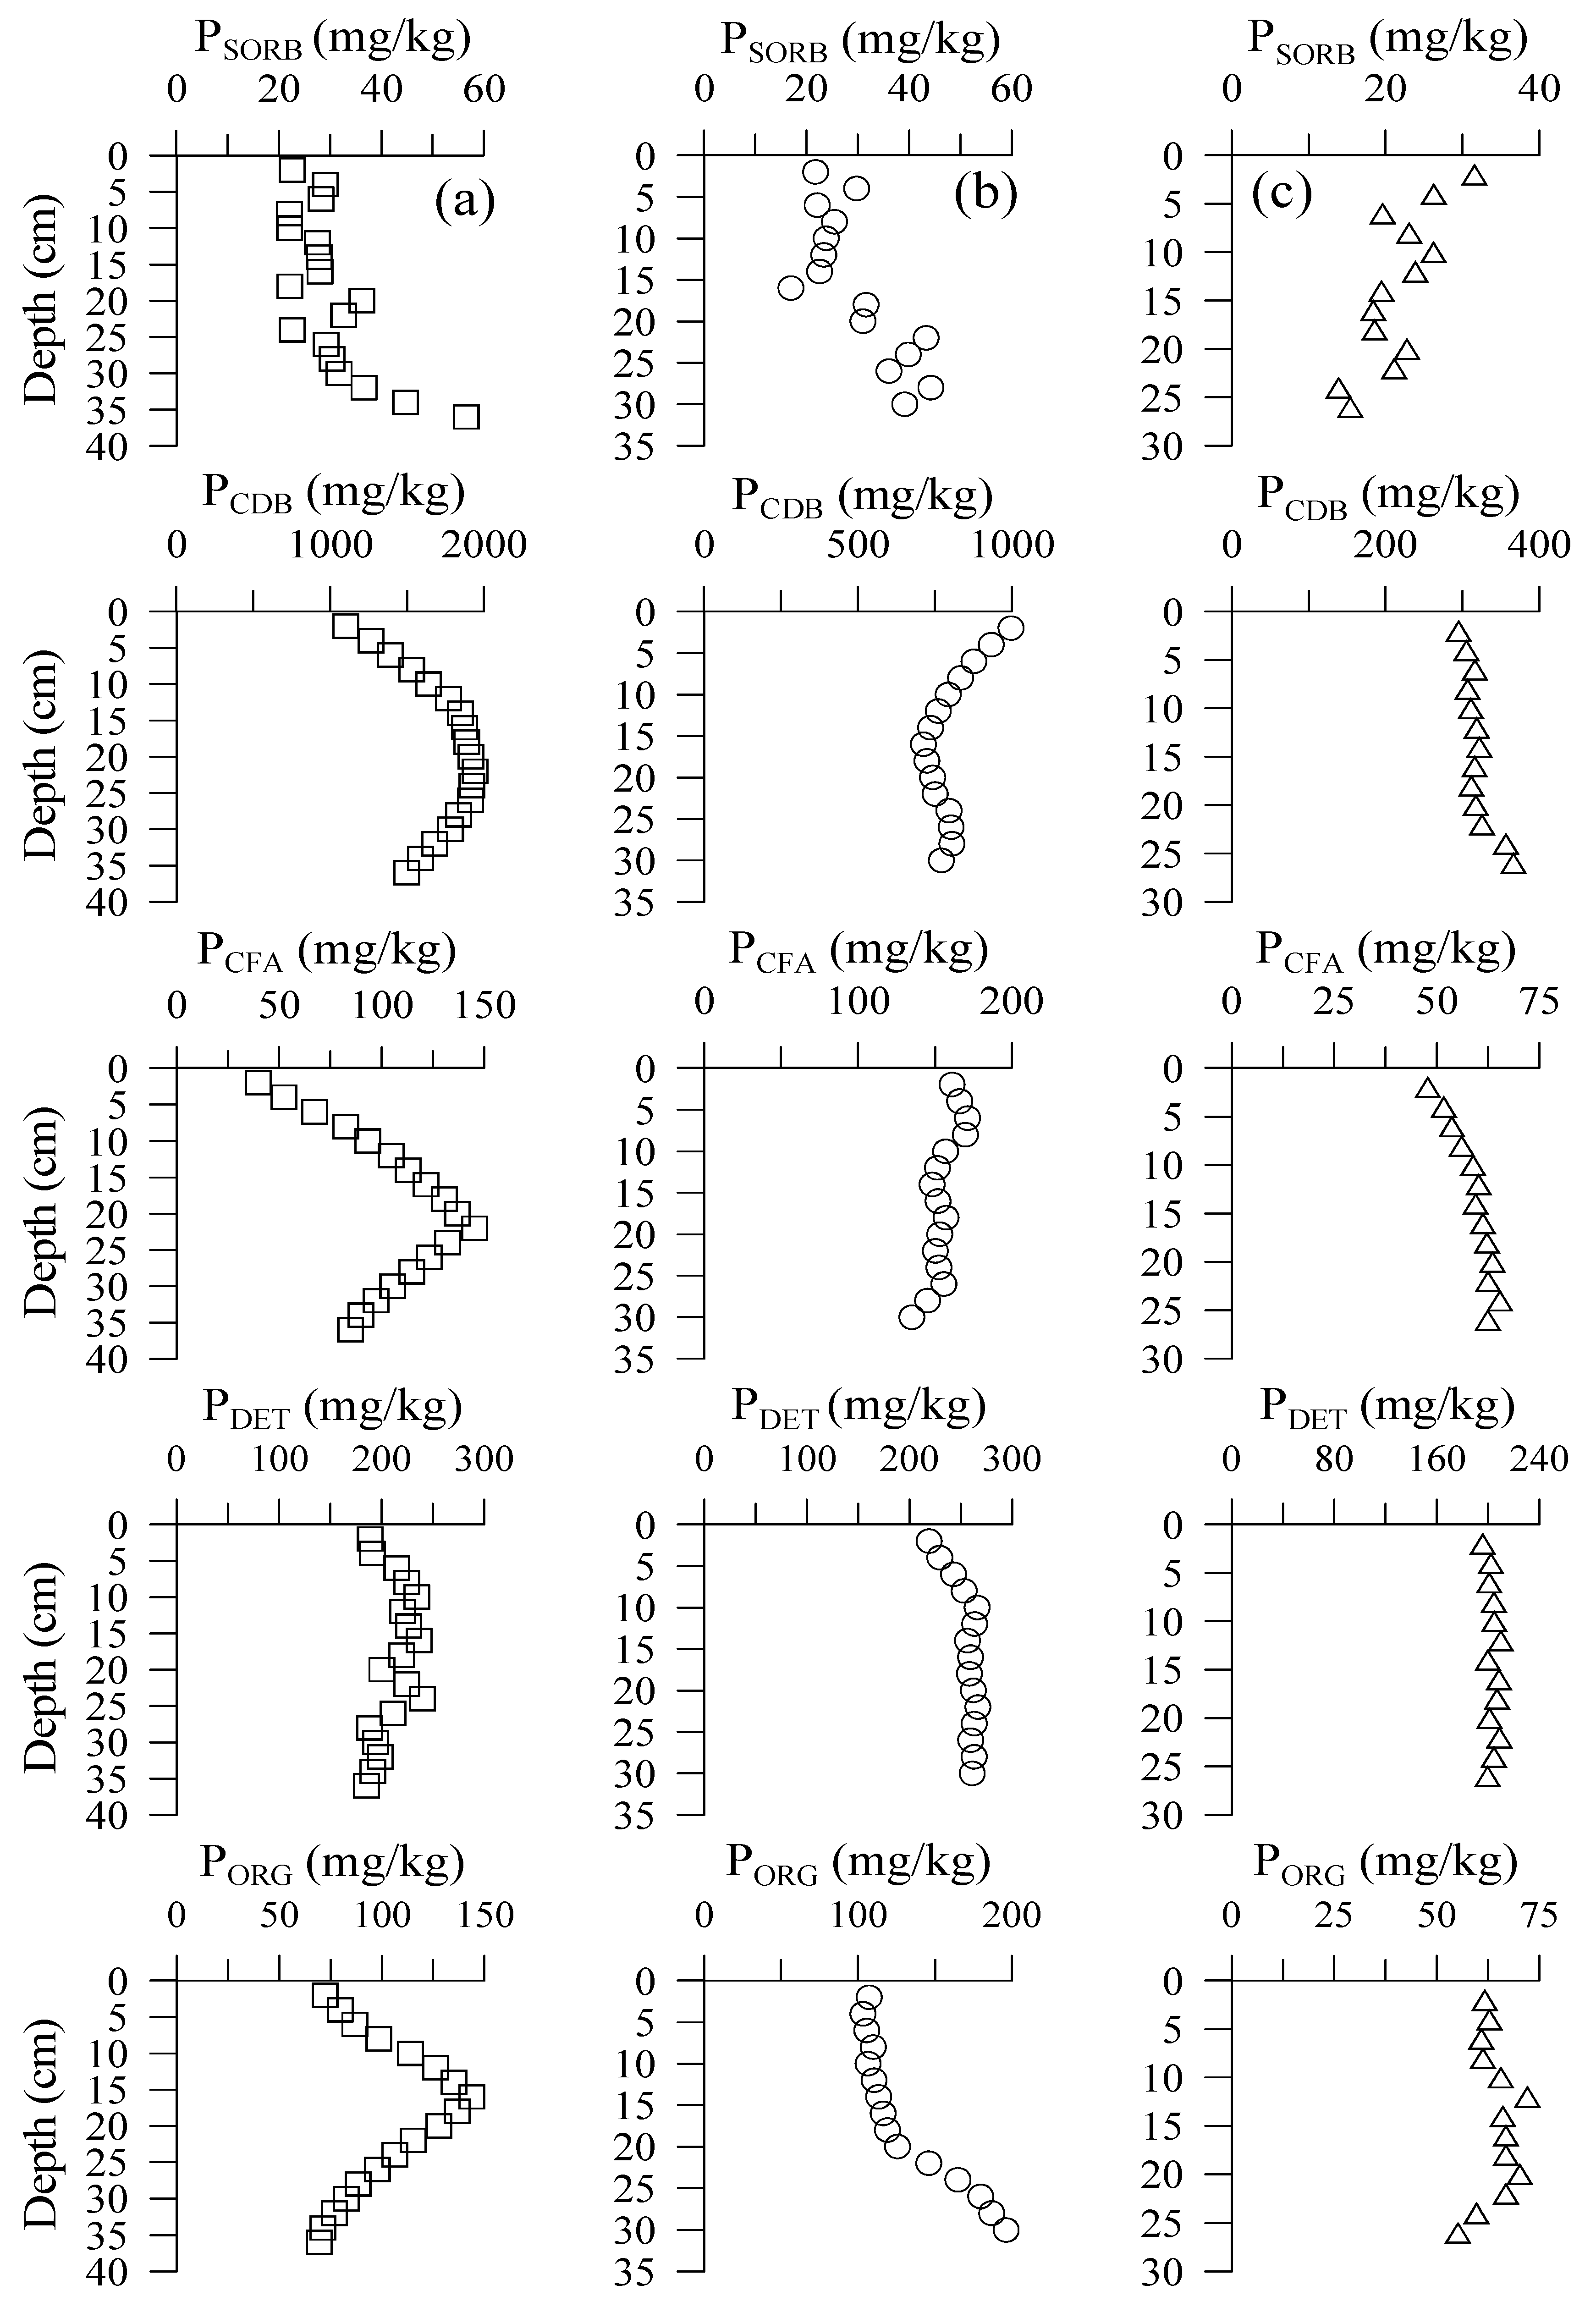
The P five-fraction concentration ranges, the percentage ranges of TP concentrations, and the TP concentrations in the present study are tabulated in Table 1. The P five-fraction concentrations in each sediment core are plotted in Figure 4. Table 1 indicates that the PCDB fraction (F2) chiefly dominated the TP concentrations in the three sediment cores. However, the dominance of the PCDB fraction decreased seaward. The percentage occupied 77–81% of the TP pools in the upper estuary, decreasing to 55–66% and 47–53% in the middle and lower estuary, respectively. The PDET fraction (F4) was the second most important species, and its dominance increased seaward: from 8.3–13.3%, rising to 28.4–31.5% of TP pools in the upper estuary to the lower estuary. The dominance of the PCFA fraction (F3) was comparable to that of the PORG fraction (F5), and both fractions generally accounted for <10% of the TP pools in the core samples. The PSORB fraction in the core samples was relatively minor, but its contribution increased to 2–5% of the TP pools in the sediment core of the lower estuary.
Figure 4 indicates that the depth profiles of the different P fractions in the sediment core from the upper estuary varied significantly, especially for the PCDB, PCFA, and PORG fractions. The PCDB profile showed an increase in concentration between 2 and 14 cm, followed by relatively minor variations at 16–24 cm, and a subsequent gradual decrease at depths of 26–36 cm. Both the PCFA and PORG profiles showed a gradual increase in concentration to depths of 2–24 cm and 2–16 cm, respectively, after which concentrations declined with depth. The PSORB profile showed a gradual increase in concentration with depth, with some scatter. In contrast, the PDET profile showed an increase in concentration at 2–16 cm intervals, followed by a decrease at greater depths. In the meantime, the PDET profile variation was less significant than that of the other P fractions.
The PSORB and PORG profiles in the sediment core of the middle estuary indicate that the concentrations of both fractions increased with depth. In contrast, the PCDB profile showed a decreasing concentration from 2 to 18 cm, followed by only minor variations at greater depths. The PDET profile showed an increase in concentration within the 2–10 cm depth interval, with concentrations remaining fairly constant with increasing depth. Compared with the upper estuary, the profile of P fractions in the lower estuary sediment core showed relatively slight variations. Overall, the observed profile variations in P fractions among the three sediment cores suggest that sedimentary P mineralization occurred during the burial, with this process being particularly pronounced in the upper estuary.

3.3. Iron and Mn Fractions

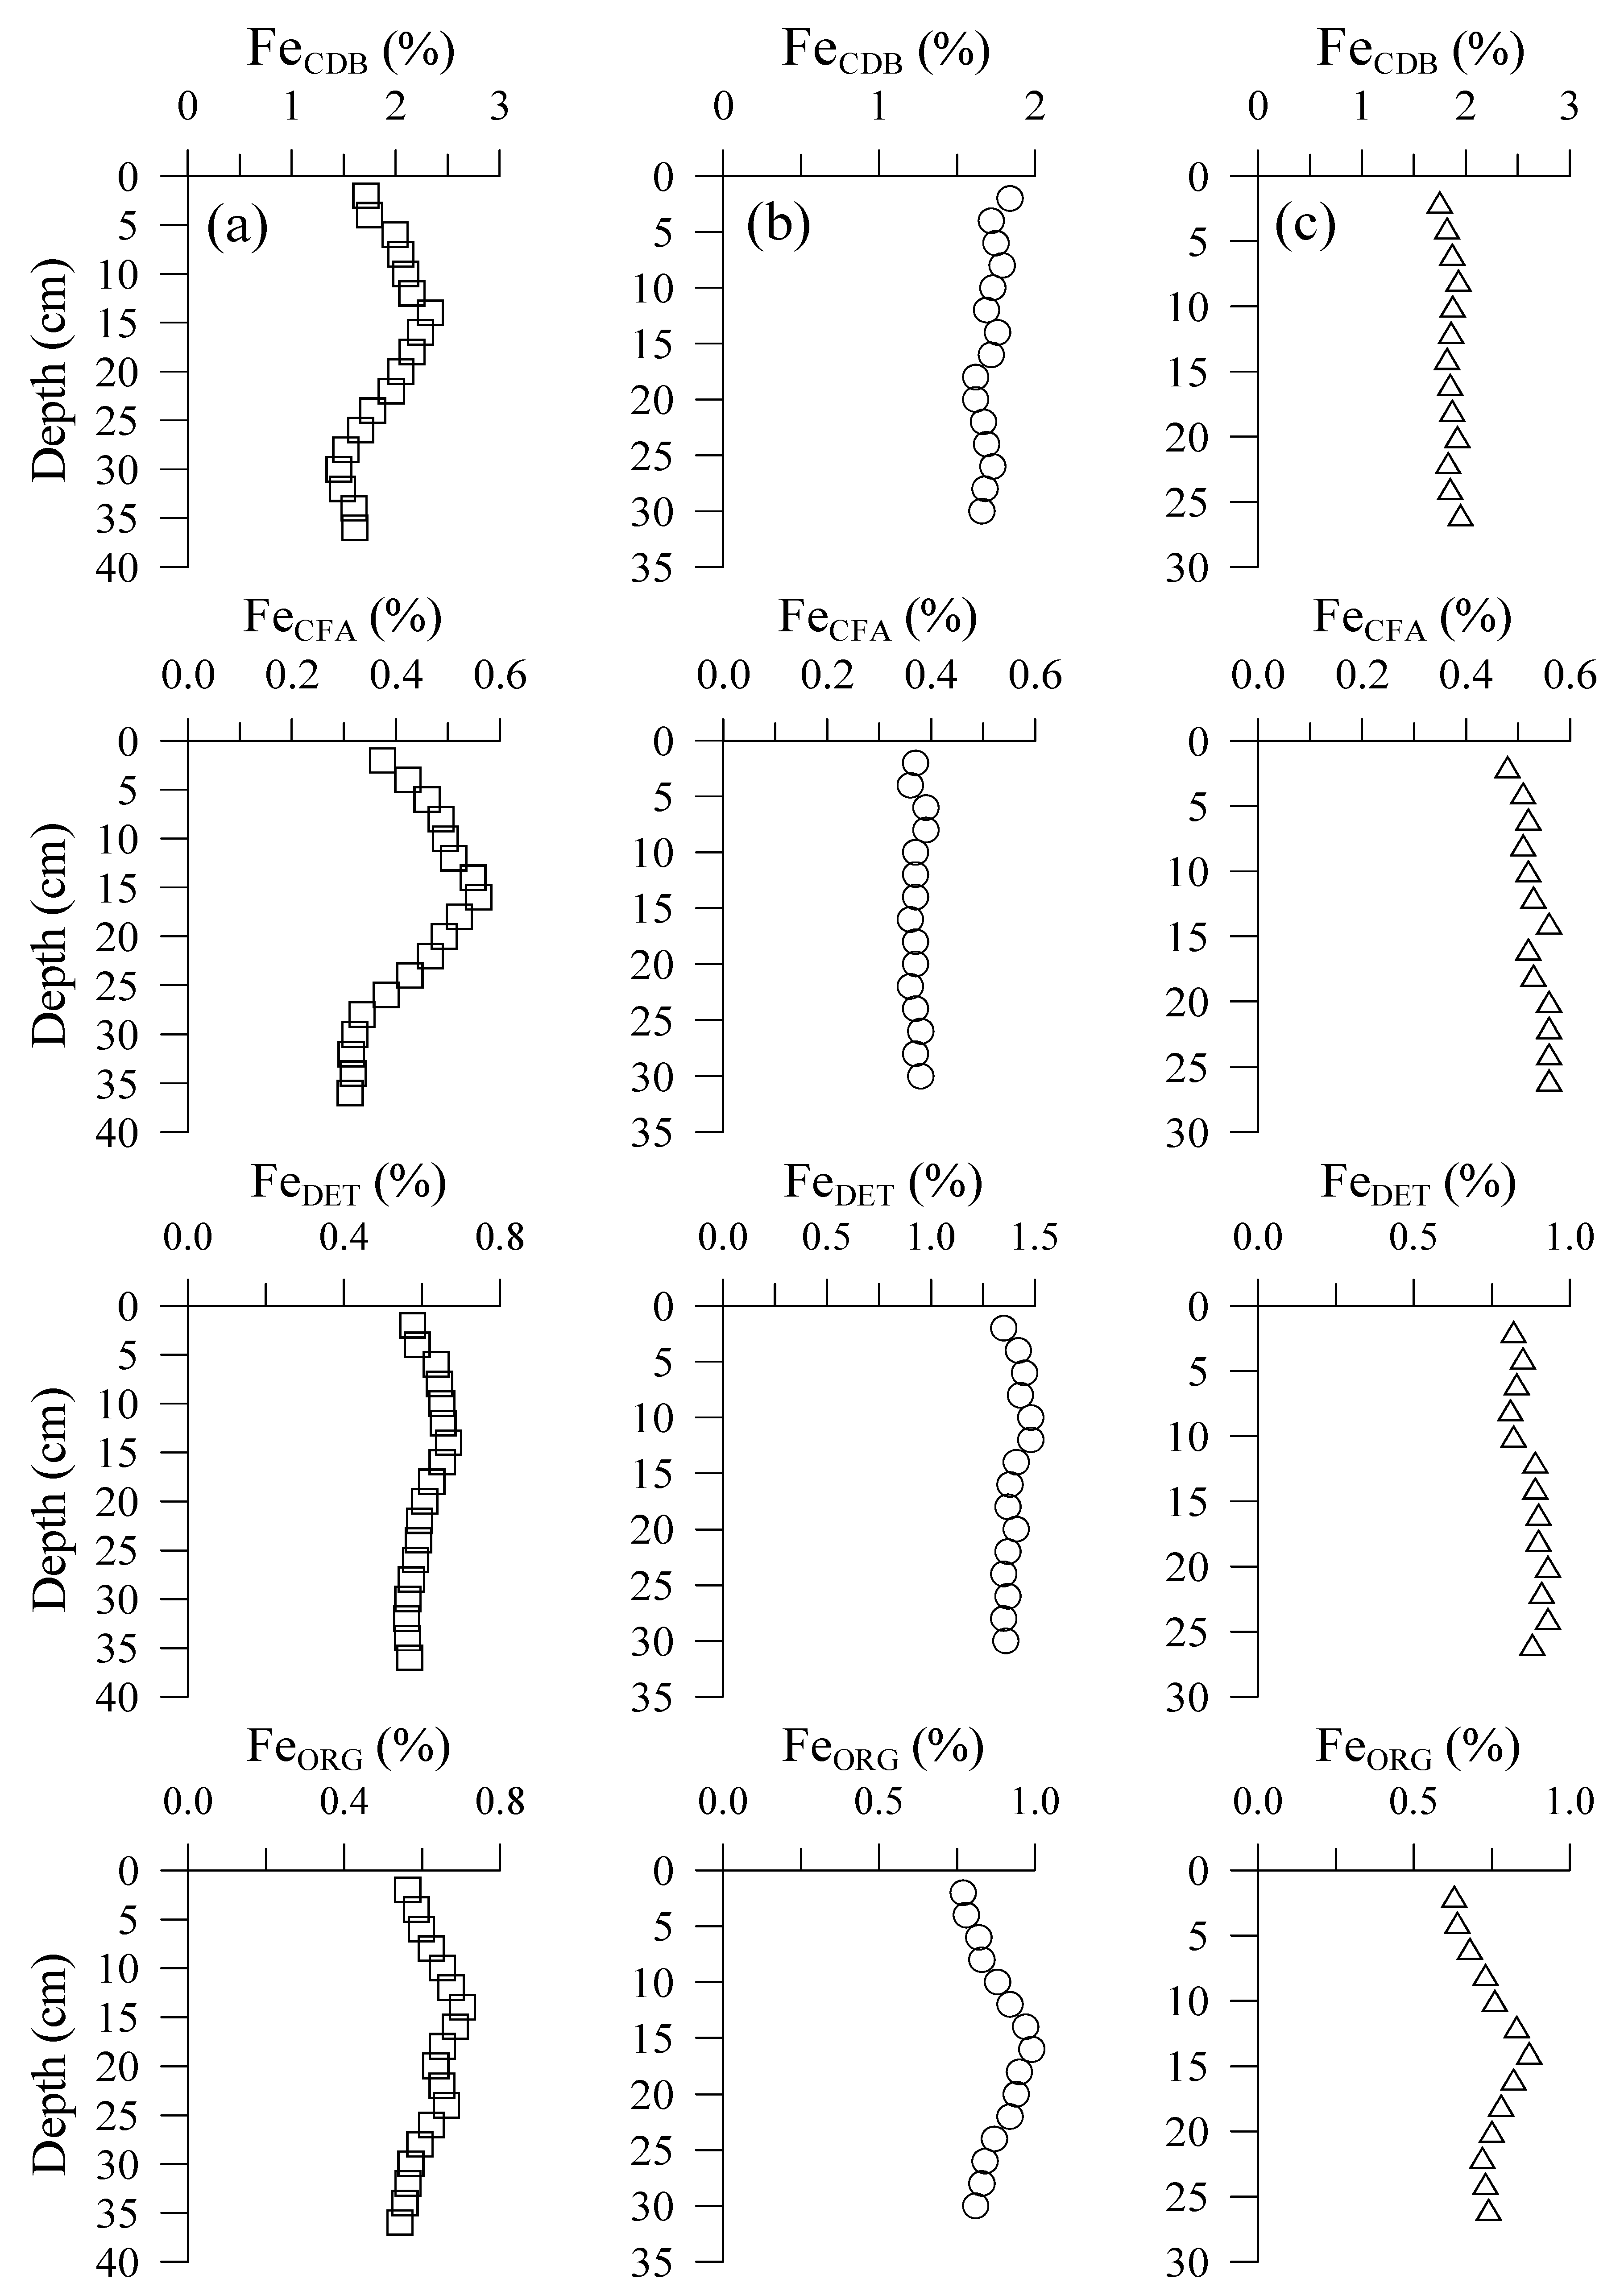
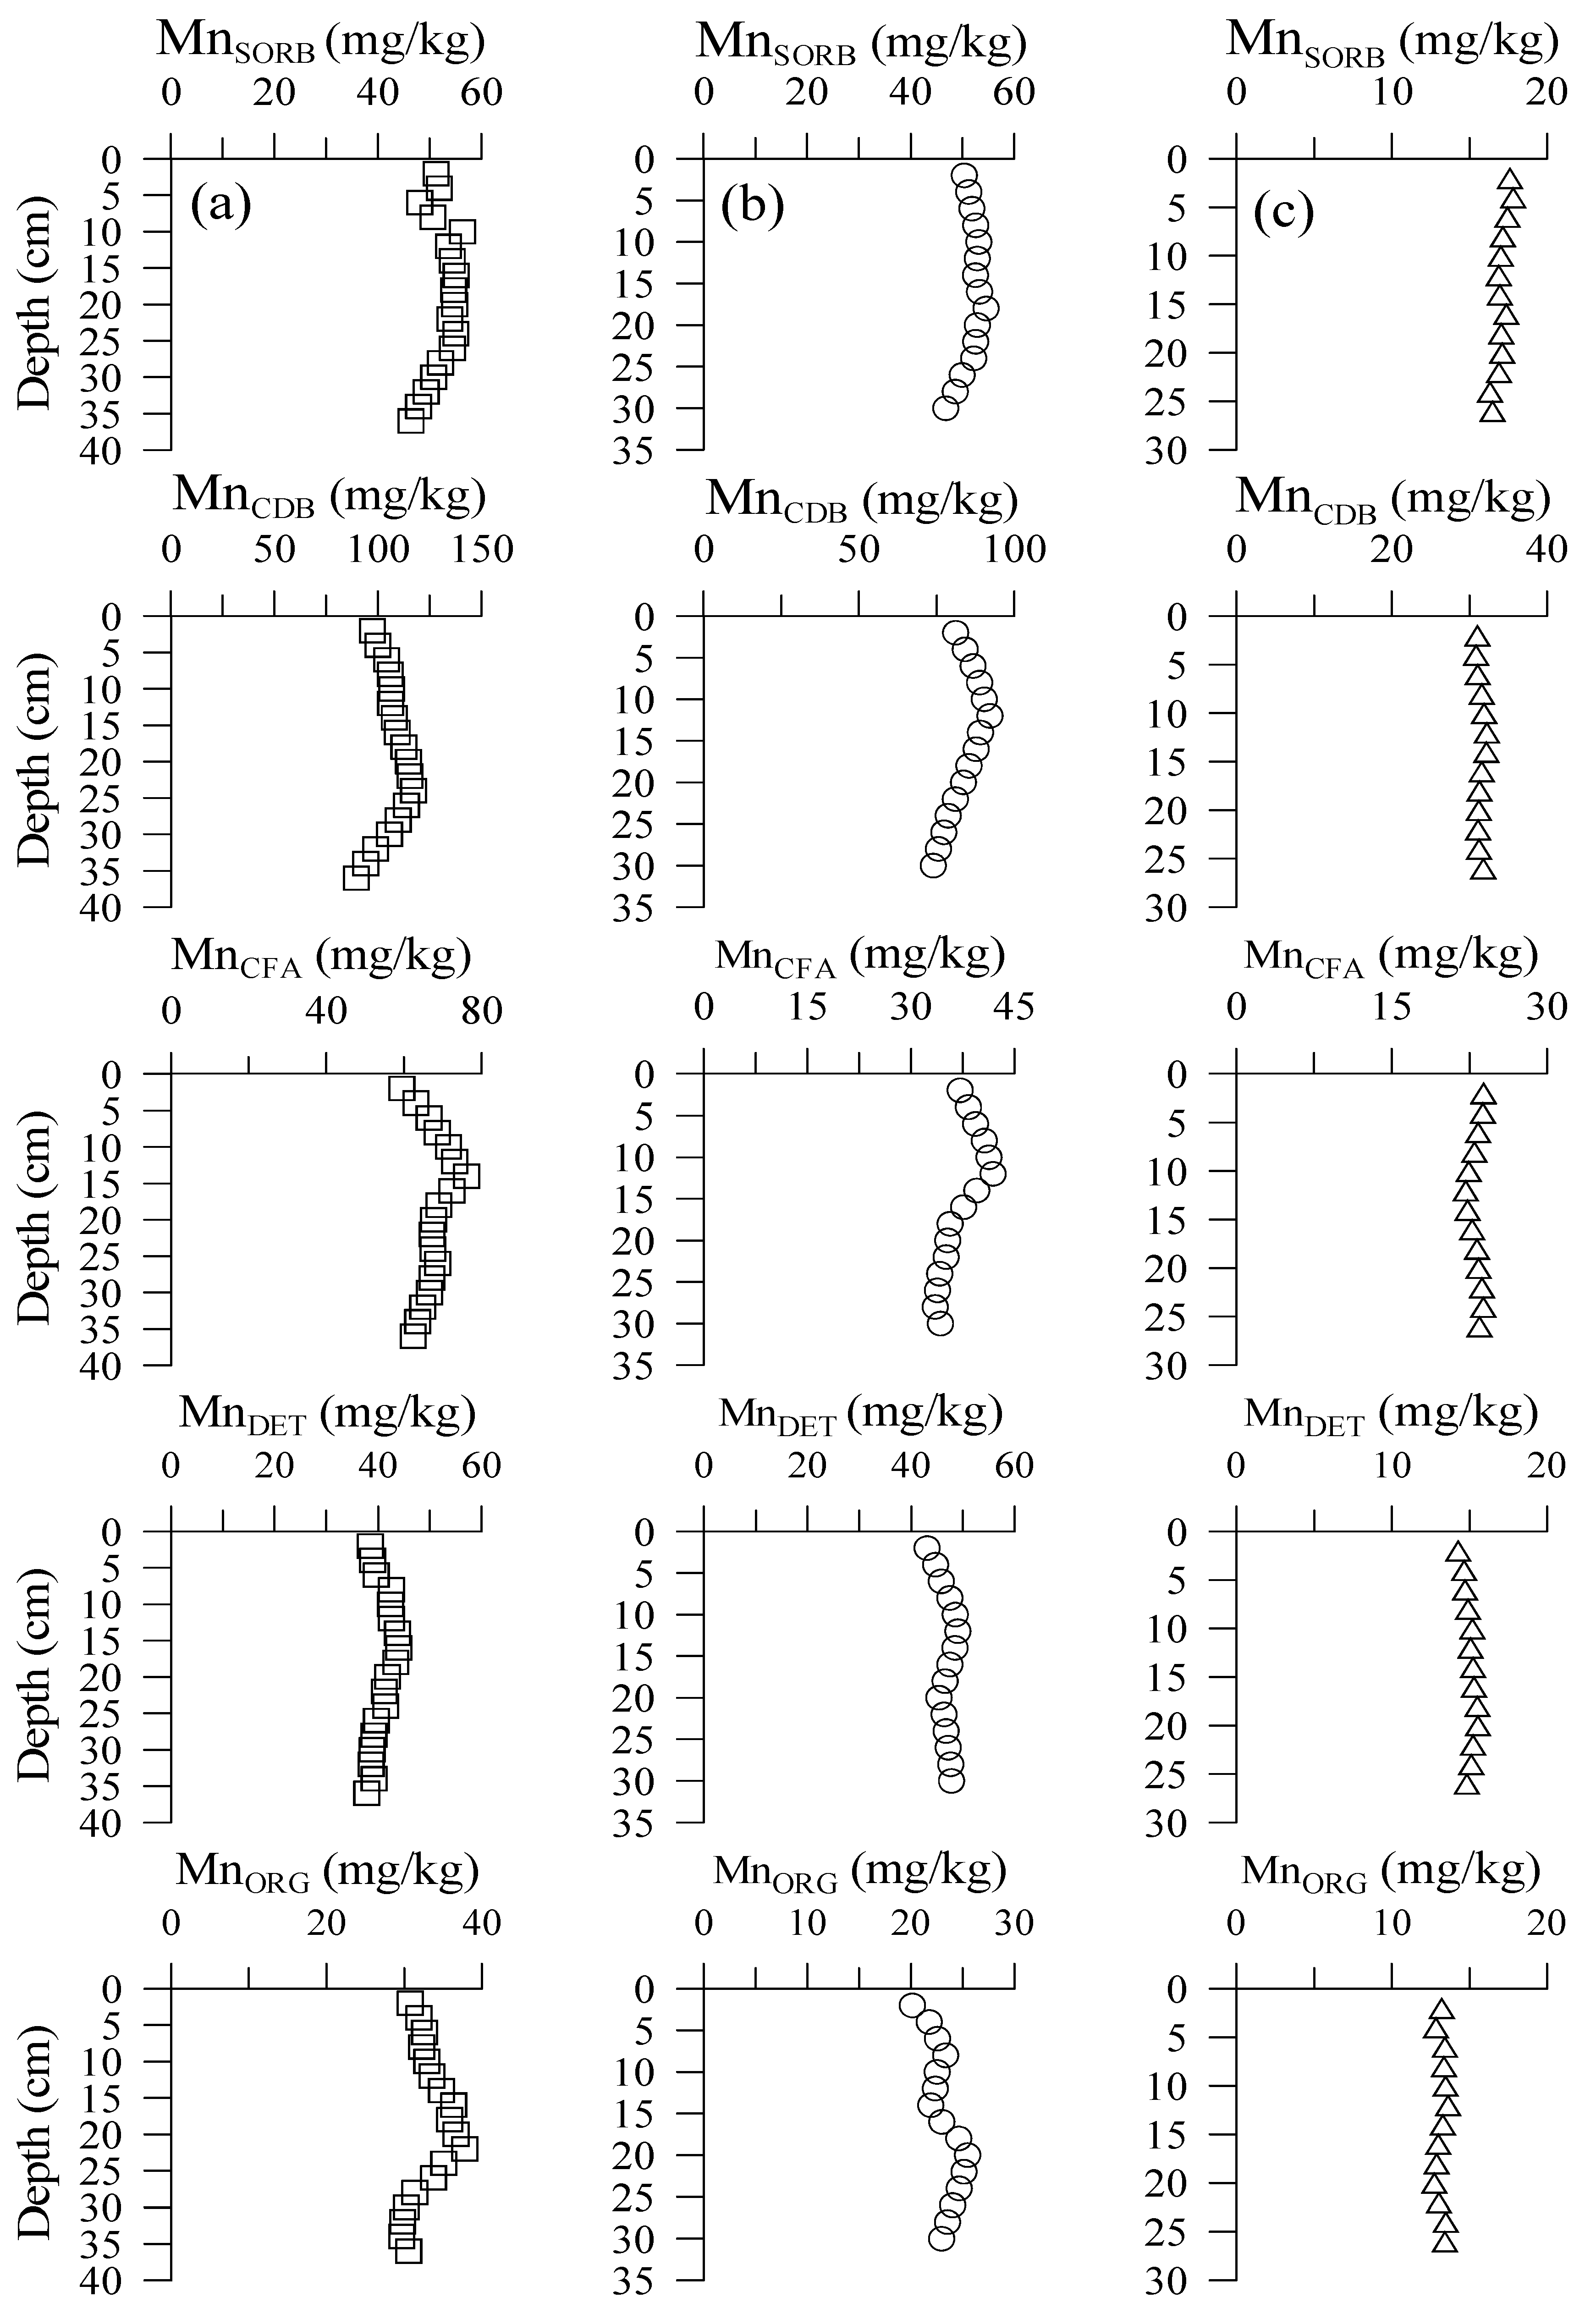
The five-fraction concentration percentage ranges and total concentrations of Fe (TFe) and Mn (TMn) in the three sediment cores of the DRE are tabulated in Table 2 and Table 3, respectively. The TFe and TMn concentrations in the core samples ranged between 2.92–4.51% and 226–317 mg/kg, respectively. The Fe four-fraction and Mn five-fraction concentrations in each sediment core are shown in Figure 5 and Figure 6, respectively. The concentration of the FeSORB fraction in the extracted solution was generally below the detection limit of the FAAS, Perkin Elmer Analyst 900. Thus, the FeSORB fraction is not plotted in Figure 5. Table 2 shows that the contribution sequence of each Fe fraction to the TFe pools was quite similar to the sequence of P fractions. The FeCDB fraction also dominated the TFe pools in the three sediment cores. However, the FeCDB fraction’s privilege was lower than that of the PCDB fraction, and its percentage ranged from 40% to 50% of the TFe pools in the three sediment cores. The FeDET and FeORG fractions were the second- and third-most important species, accounting for 15.7–33.2% and 16.2–22.2% of the TFe pools in the three sediment cores. The contribution of the FeCFA fraction and FeSORB generally approached 10% and <0.5% of the TFe pools of the three sediment cores, respectively. The tendency of each Fe fraction to increase or decrease seaward was not as clear as that of the P fraction in the three sediment cores. In contrast with the results for the P and Fe fractions, the percentage of the Mn fraction in the core samples generally followed the following sequence: MnCDB (31–37%) > MnCFA (14.5–24.0%) > MnSORB (16.5–22.1%) > MnORG (8.7–13.6%). Like Fe, the percentage variation in the Mn fraction in the core samples was not as significant as that in the P fraction.

4. Discussion

4.1. Phosphorus

The TP concentrations in the three sediment cores of the DRE on average exceeded 2060 mg/kg and 1310 mg/kg in the upper and middle estuary, respectively, and decreased to an average of 685 mg/kg. The sediment quality of TP concentrations has been suggested by many studies [33,34,35]. Baturin et al. [33] and Teodoro et al. [34] suggest that TP concentrations in sediment exceed 700 mg/kg, indicating that anthropogenic impact significantly influences the environment. Berbel et al. [35] suggest that the environment is moderately to highly polluted by P when sedimentary TP concentrations range from 495 to 1300 mg/kg, and highly polluted when concentrations exceed 1300 mg/kg. Thus, the upper and middle estuary of the DRE can be classified as highly polluted by P, based on the classification by Berbel et al. [35]. Fang and Wang [9] tabulated the TP concentrations in the estuarine sediments worldwide reported in the literature and indicated that the total p-values in the different estuarine sediments may vary 5–10-fold, from the lowest concentration of TP (316–582 mg/kg) in the Laizhou Bay, China [36], to the highest concentration of TP (1510–4340 mg/kg) in the Yamuna River Estuary, India [37]. Riverine suspended particulate matter (SPM) is the major source of estuarine sediments, and other sources, such as atmospheric input and tidal water intrusion, also contribute as minor sources to the sediment [38]. The TP concentrations of the riverine SPM of the world’s rivers vary widely and range between 560 and 2000 mg/kg with a mean value of 1146 mg/kg [39]. As a result, TP concentrations in the estuarine sediments worldwide may differ 2–4-fold, regardless of whether the estuary is contaminated or not, due to the variation in the riverine SPM source.
Table 1 clearly shows that the PCDB fraction chiefly dominated TP concentrations and contributed approximately 80% of the TP pools in the upper estuary core sample, decreasing to ca. 50% in the lower estuary. However, the PDET fraction was the second-most important species in the three sediment cores. Its dominance was much lower than the PCDB fraction in the three sediment cores, but it increased two-fold in the lower estuary sediment core compared with the upper estuary. The PCDB fraction, which dominates sedimentary TP pools, has rarely been reported in estuarine environments [40]. Most of the literature indicates that the sedimentary TP pools are either dominated by the PDET fraction in the in the Laizhou Bay, China [36] and the Changjiang River Estuary [41], or dominated by the PORG fraction in the Qinzhou Bay, China [42], the Pearl River Estuary, China [43], and in the Mondego River Estuary, Portugal [44]. The PCFA fraction, which is the most important species, has been observed in the Seine River Estuary, France [45]. One of the general phenomena of the sedimentary P fraction is probably that the contribution of PSORB to TP pools in sediment is generally <5% in the literature. However, such a phenomenon is not followed in some estuarine environments, such as the Seine River Estuary, France [41,42,43,44], and the Yamuna River Estuary, India [37]. In the Santos-Sao Vicente River Estuary, Brazil [33], and the Seine River Estuary, France [45], the PSORB fraction could exceed 15% or more of the total P pools, which was attributed to that dissolved P is highly adsorbed by Fe oxides [45] and the sewage effluent discharge [33]. It has been well addressed that the PSORB fraction is easily desorbed from the suspended particulate matter in the water column or from the re-suspended sediment when salinity increases due to the salting-out effect [46]. In addition, the decomposition of sedimentary organic matter and the decay of bacterial biomass may enhance the release of the sedimentary PSORB fraction [45,47]. As a result, the sedimentary PSORB fraction is generally relatively minor in the marine environment, as mentioned above. However, Table 1 shows that the percentage of the PSORB fraction in the three sediment cores obviously increased seaward, confirming the desorption of particulate P due to the salinity effect in the estuarine mixing [46].
The result for the PCDB fraction, which chiefly dominated the sedimentary total P pools in the DRE sediment cores, was consistent with our previous study of surface sediments within the DRE [9]. The mechanism underlying such a high proportion of sedimentary PCDB in the DRE remains unclear in the present study. The PCDB fraction is generally associated with Fe oxides, which have a high affinity to adsorb dissolved inorganic P (DIP) in the water column [13,25,48]. The anthropogenic source of domestic wastewater discharge into the DRE should play a crucial role in this result, as observed in the Patuxent River Estuary and the Chesapeake Bay [40]. It is well established that wastewater treatment plants commonly use Fe as a coagulant to improve sludge dewatering and prevent hydrogen sulfide emissions during anaerobic digestion [12]. Our recent study found that the water column of the upper estuary of the DRE was enriched with particulate inorganic P (PIP) and Fe (PIFe), extracted by 1N HCl, of which concentrations ranged between 3590–7860 mg/kg and 2.87–3.37%, respectively, during the four surveys from April 2018 to April 2019. The PIP concentration generally correlated well with the PIFe concentration, suggesting that Fe played a crucial role in determining the particulate P content within the DRE [1]. Many studies indicate that the DIP in the water column adsorbed by Fe(III) oxides, which settle down to surface sediment or burial in sediment, will be released to surface water or to pore water in sediment under hypoxic or anoxic conditions due to the reductive dissolution of Fe(III) oxides [13,21,22,23,24,25,43,49]. Meanwhile, the dissolution of dissolved phosphate that diffuses into the oxic water column can be re-adsorbed by Fe oxides, which prevents the excess P from escaping into the overlying seawater [13,21,22,43]. The strong coupling between Fe and P cycling in hypoxic and anoxic sediments is commonly found in the marine environment [21,22,23,24,49,50].
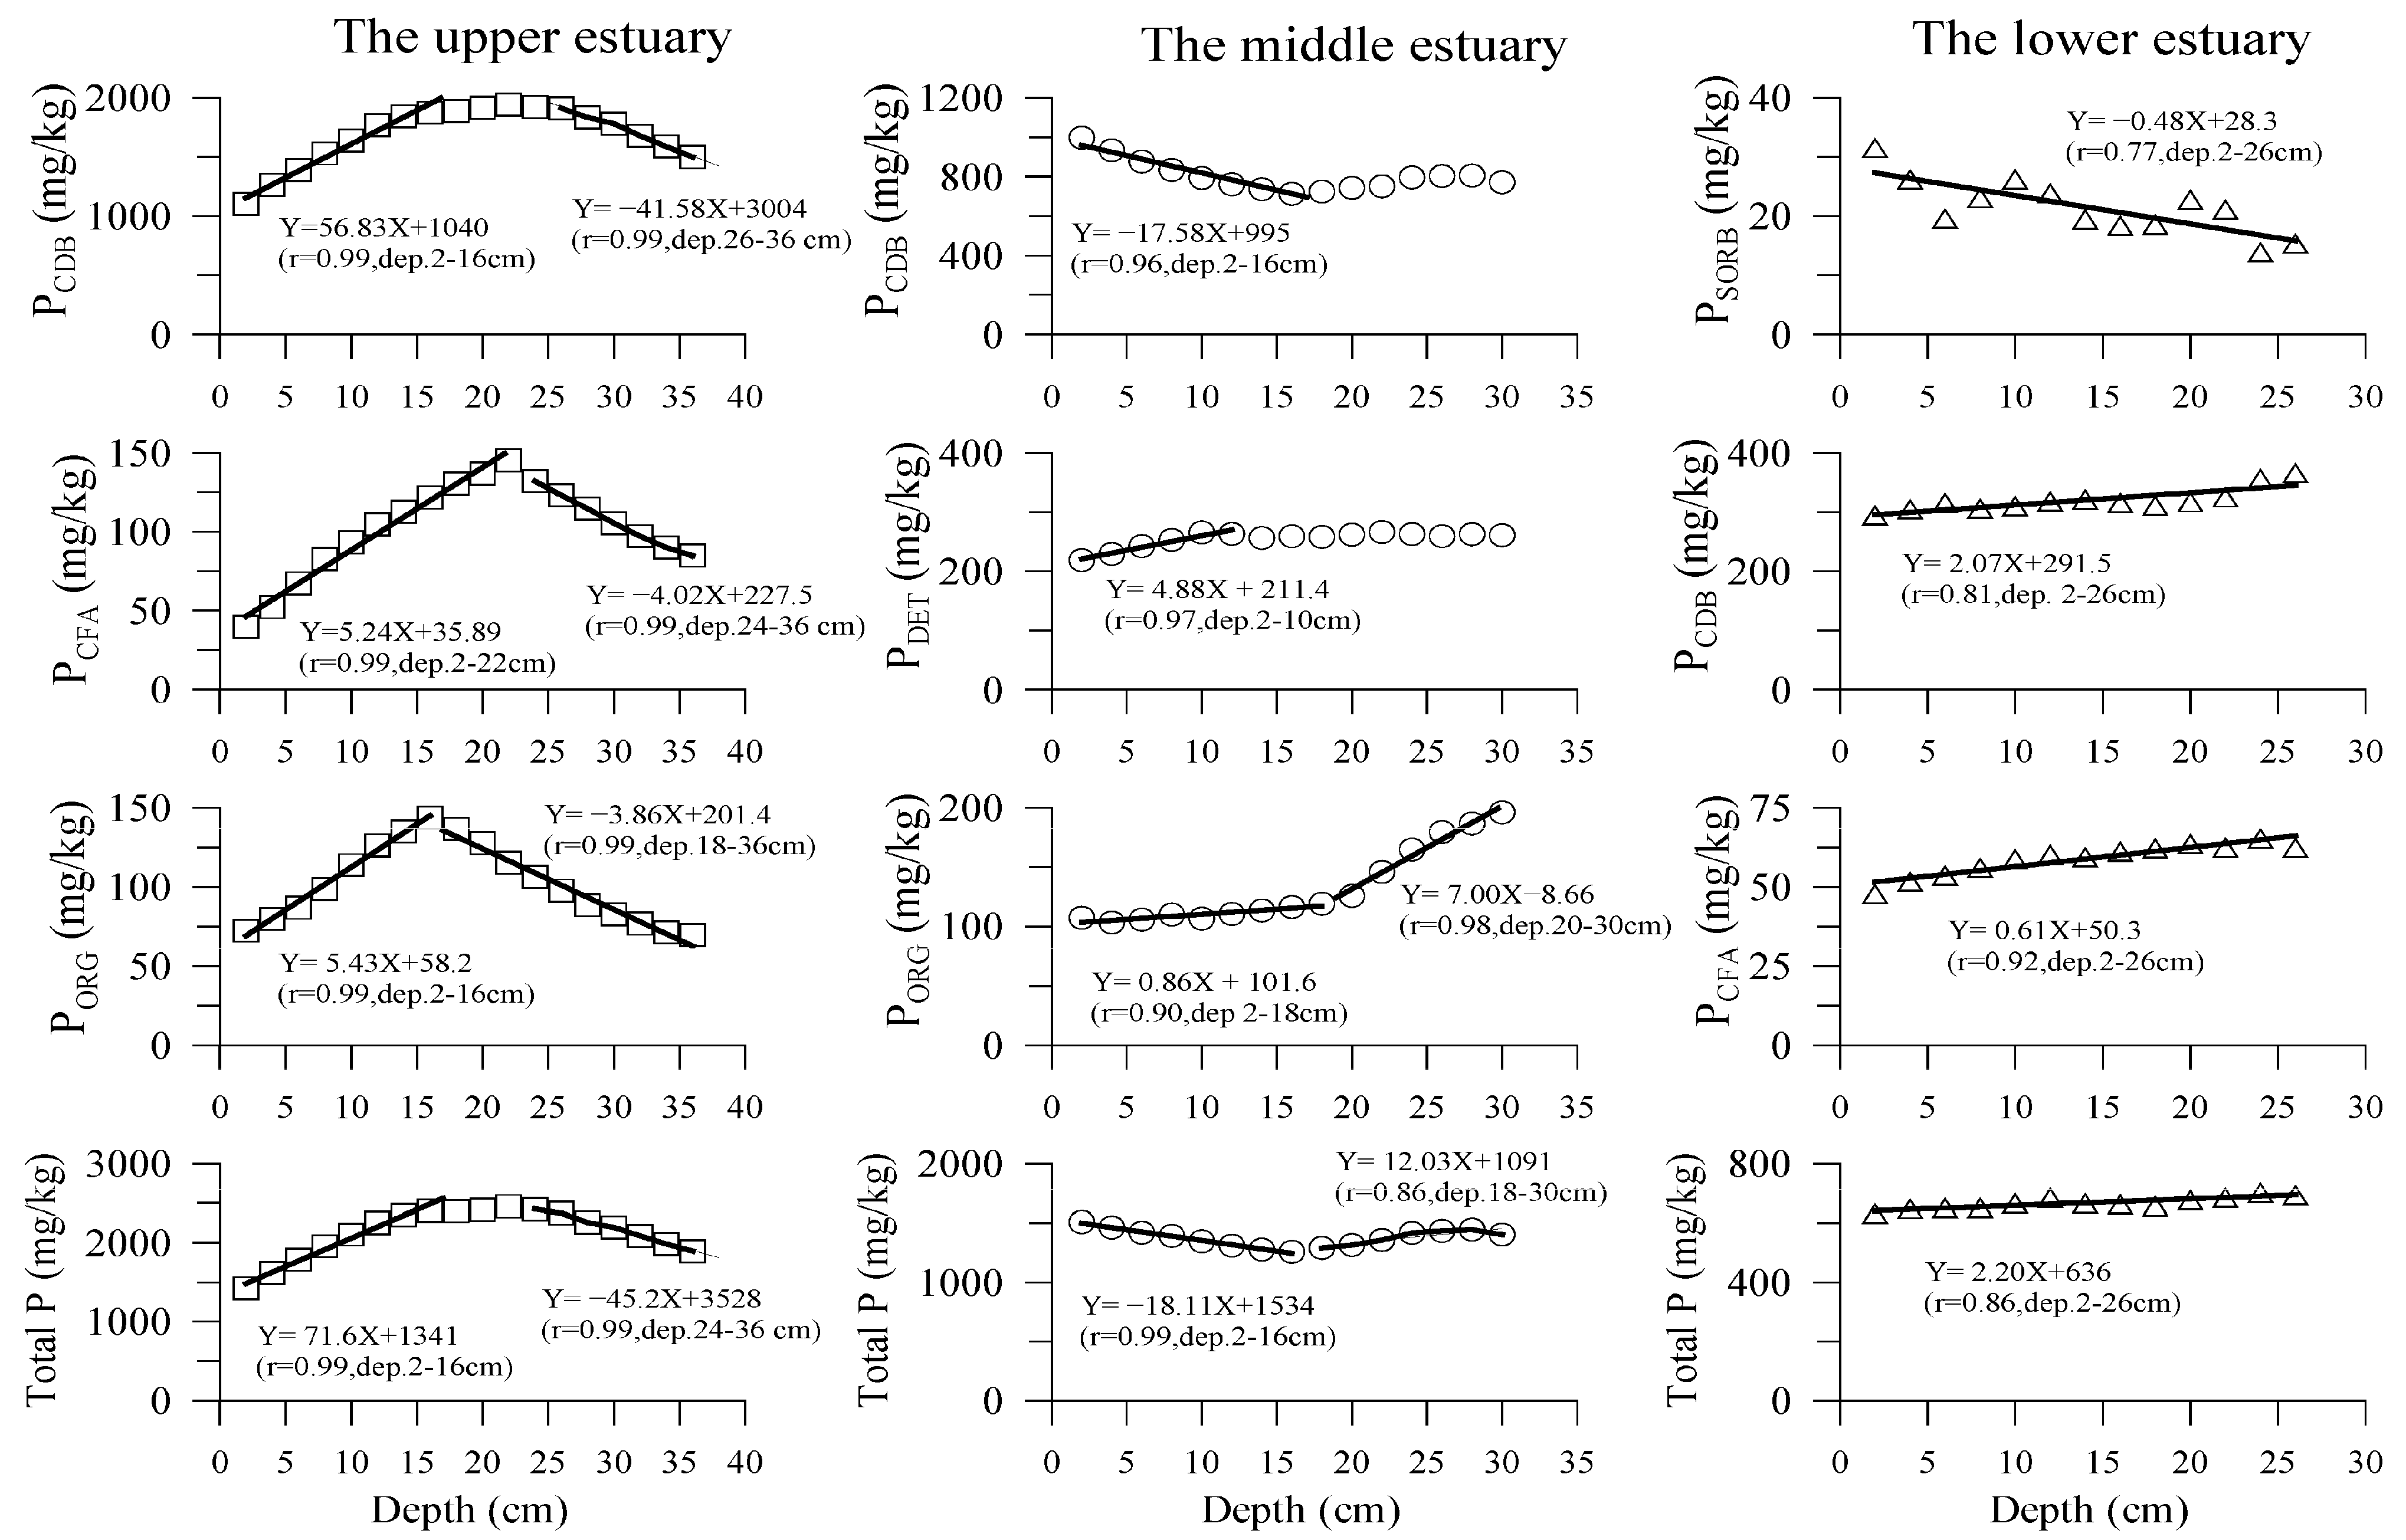
Figure 4 shows that the profiles of each P fraction in the three sediment cores were generally nonlinear with depth. However, Figure 7 shows that the distributions of some P fractions in the three sediment cores could be divided into distinct segments, and each exhibited a linear depth profile. The slope of total P in the upper estuary core sample could be divided into two segments at 2–16 cm and 24–36 cm depth intervals, and both segments exhibited a linear relationship with depth. Both slope values were 71.6 mg P/kg/cm and −45.2 mg P/kg/cm, respectively. The corresponding values were −18.11 mg P/kg/cm and 13.13 mg P/kg/cm at 2–16 cm and 18–30 cm depth intervals, respectively, in the middle estuary, and 2.20 mg P/kg/cm at 2–26 cm depth intervals in the lower estuary. The two slope values of the PORG fraction of the upper estuary were 5.53 mg P/kg/cm and −3.86 mg P/kg/cm, and those of the middle estuary were 0.86 mg P/kg/cm and 7.00 mg P/kg/cm. The different P fractions in the three sediment cores exhibited positive and negative slopes with varying depth intervals, indicating that preserving sedimentary P in the DRE was more complicated.
The transformation of different fractions of sedimentary P during diagenetic processes may alter the contents of different P fractions. For example, the decomposition of PORG and the dissolution of PCDB can favor the formation of PCFA in sediments during diagenesis [51,52]. Anthropogenic inputs, such as domestic sewage effluent and agricultural activities, may enhance the PORG content in sediments [36,43]. In addition, the PDET content in the marine sediment is strongly influenced by the sediment grain size (GS). The content of the PDET fraction is inversely proportional to GS in marine sediment [41,53]. Our previous study indicated that the GS of these three sediment cores ranged from 3.86 to 63.94 μm. The mud and very fine sand completely dominated the GS, and the contributions of medium sand and fine sand to the GS were relatively minor in the middle and lower estuary sediments. Additionally, the dominance of mud decreased to a range between 25 and 74% in the upper estuary core sample, and the other three fractions of GS also contributed a significant portion [8]. The GS results of the three core sediments may indicate that the PDET concentration in the sediment core of the upper estuary was more scattered than that of the middle and the lower estuary, as shown in Figure 4. Overall, the profiles of each P fraction in the three sediment cores were the integrated results of riverine and anthropogenic inputs, sedimentation flux, and geochemical transformation of P under the diagenetic processes during the burial process. The DRE is a highly hydrodynamic area with daily high nutrient inputs, commonly intense algal blooms, and episodic extremely heavy rain and sediment production during western Pacific typhoons that hit Taiwan. These characteristics of the DRE enhance the interpretation of the more complex profile variations in the P fractions across the three DRE sediment cores.
The present results suggest that P cycling in the DRE sediment was dominated by the mobilization of the PCDB fraction, which generally exceeded 50% of the total sedimentary P pools in the three sediment cores. In contrast, the PORG fraction was less than 10% of the sedimentary total P pools. Thus, the influence of the remineralization of the PORG fraction on the P cycling in the DRE sediment should be much less than the PCDB fraction, which is indicated by the slope values of PCDB and PORG fractions, as shown in Figure 7. This result agrees well with the recent studies, which illustrated that the dissolution of the iron-bound fraction of sedimentary P dominated P cycling in the hypoxia and anoxic marine environment [43,50,54,55,56]. In contrast, many studies indicate that the remineralization of organic matter governs P cycling when the PORG fraction exceeds the PCDB fraction in anoxic marine environments [15,20,22,57,58]. These results suggest that the iron-bound P or organic P dominates sedimentary P cycling in anoxic marine environments, depending on which fraction is predominant in the marine sediment.
The FeCDB/PCDB mole ratios observed in the three sediment cores ranged between 4.53–8.63, 10.2–13.7, and 28.8–34.9, respectively, from the upper to the lower estuary of the DRE. The profile variation in the FeCDB/PCDB mole ratio with depth in the three sediments was insignificant. However, the mole ratio in the three sediment cores increased significantly from the upper to the lower estuary. This result agreed well with our previous study, which showed that the FeCDB/PCDB mole ratio in surface sediments within the DRE ranged from 5.42 to 20.83 and increased gradually seaward [9]. This result can be attributed to the fact that dissolved inorganic P (DIP) in the DRE water column significantly decreased seaward due to dilution by intruding seawater [3]. This result indicates that total sedimentary P also decreased seaward, as shown in Table 1. It is suggested that the mole ratio of FeCDB/PCDB in marine sediment can be used to estimate the sorption capacity of Fe oxyhydroxides. The ratio value, approximately 6.7, is used to determine whether the sorption capacity of Fe oxyhydroxides approaches saturation [14,49]. The mole ratio value of the upper estuary core sample seems to imply that the adsorption of dissolved inorganic P (DIP) by the Fe oxyhydroxides in the water column approached super-saturation due to the water column enriching with DIP (>10 µM) [3]. Many studies indicate that the FeCDB/PCDB molar ratio for newly buried iron oxides ranged from 20 to 26 in the marine sediment [14,59,60]. The FeCDB/PCDB ratio in the marine sediments reported in the literature varies widely, ranging between <2 and 45 ([53], and references cited therein), because many factors, such as the anthropogenic source, the GS, the sediment texture, the redox condition in the sediment, and the diagenetic processes during the sediment burial processes, significantly influence the ratio.
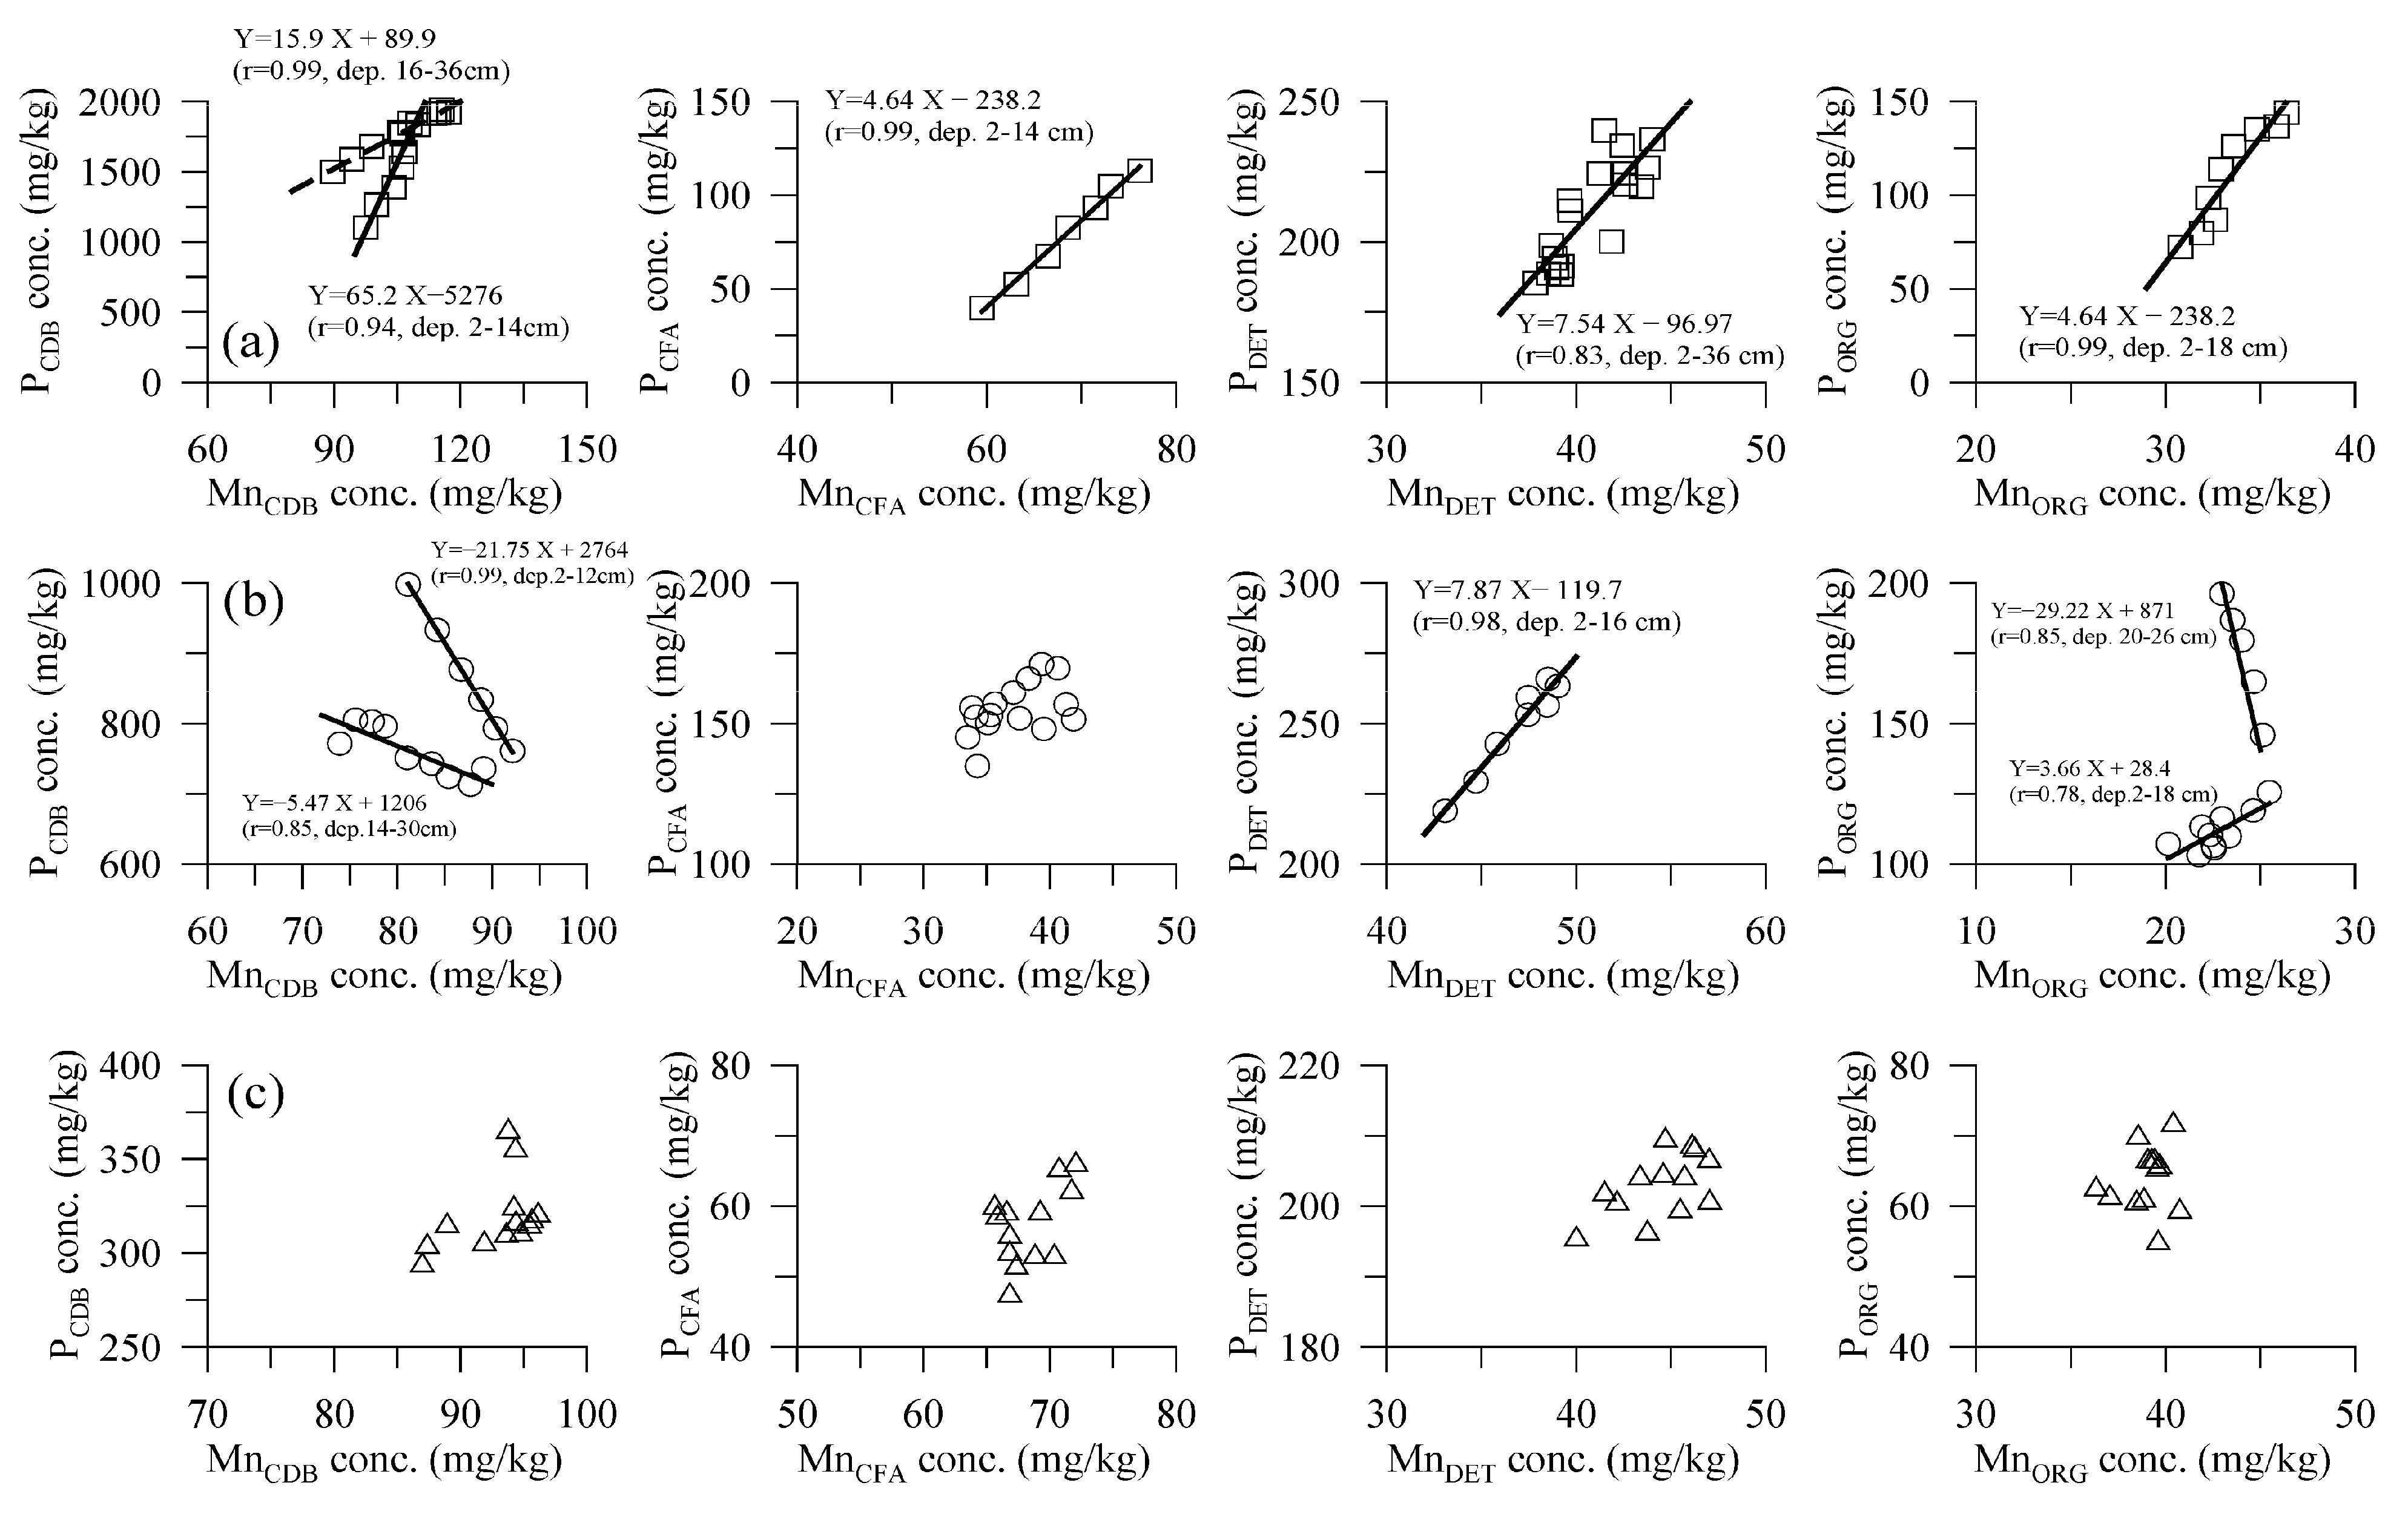
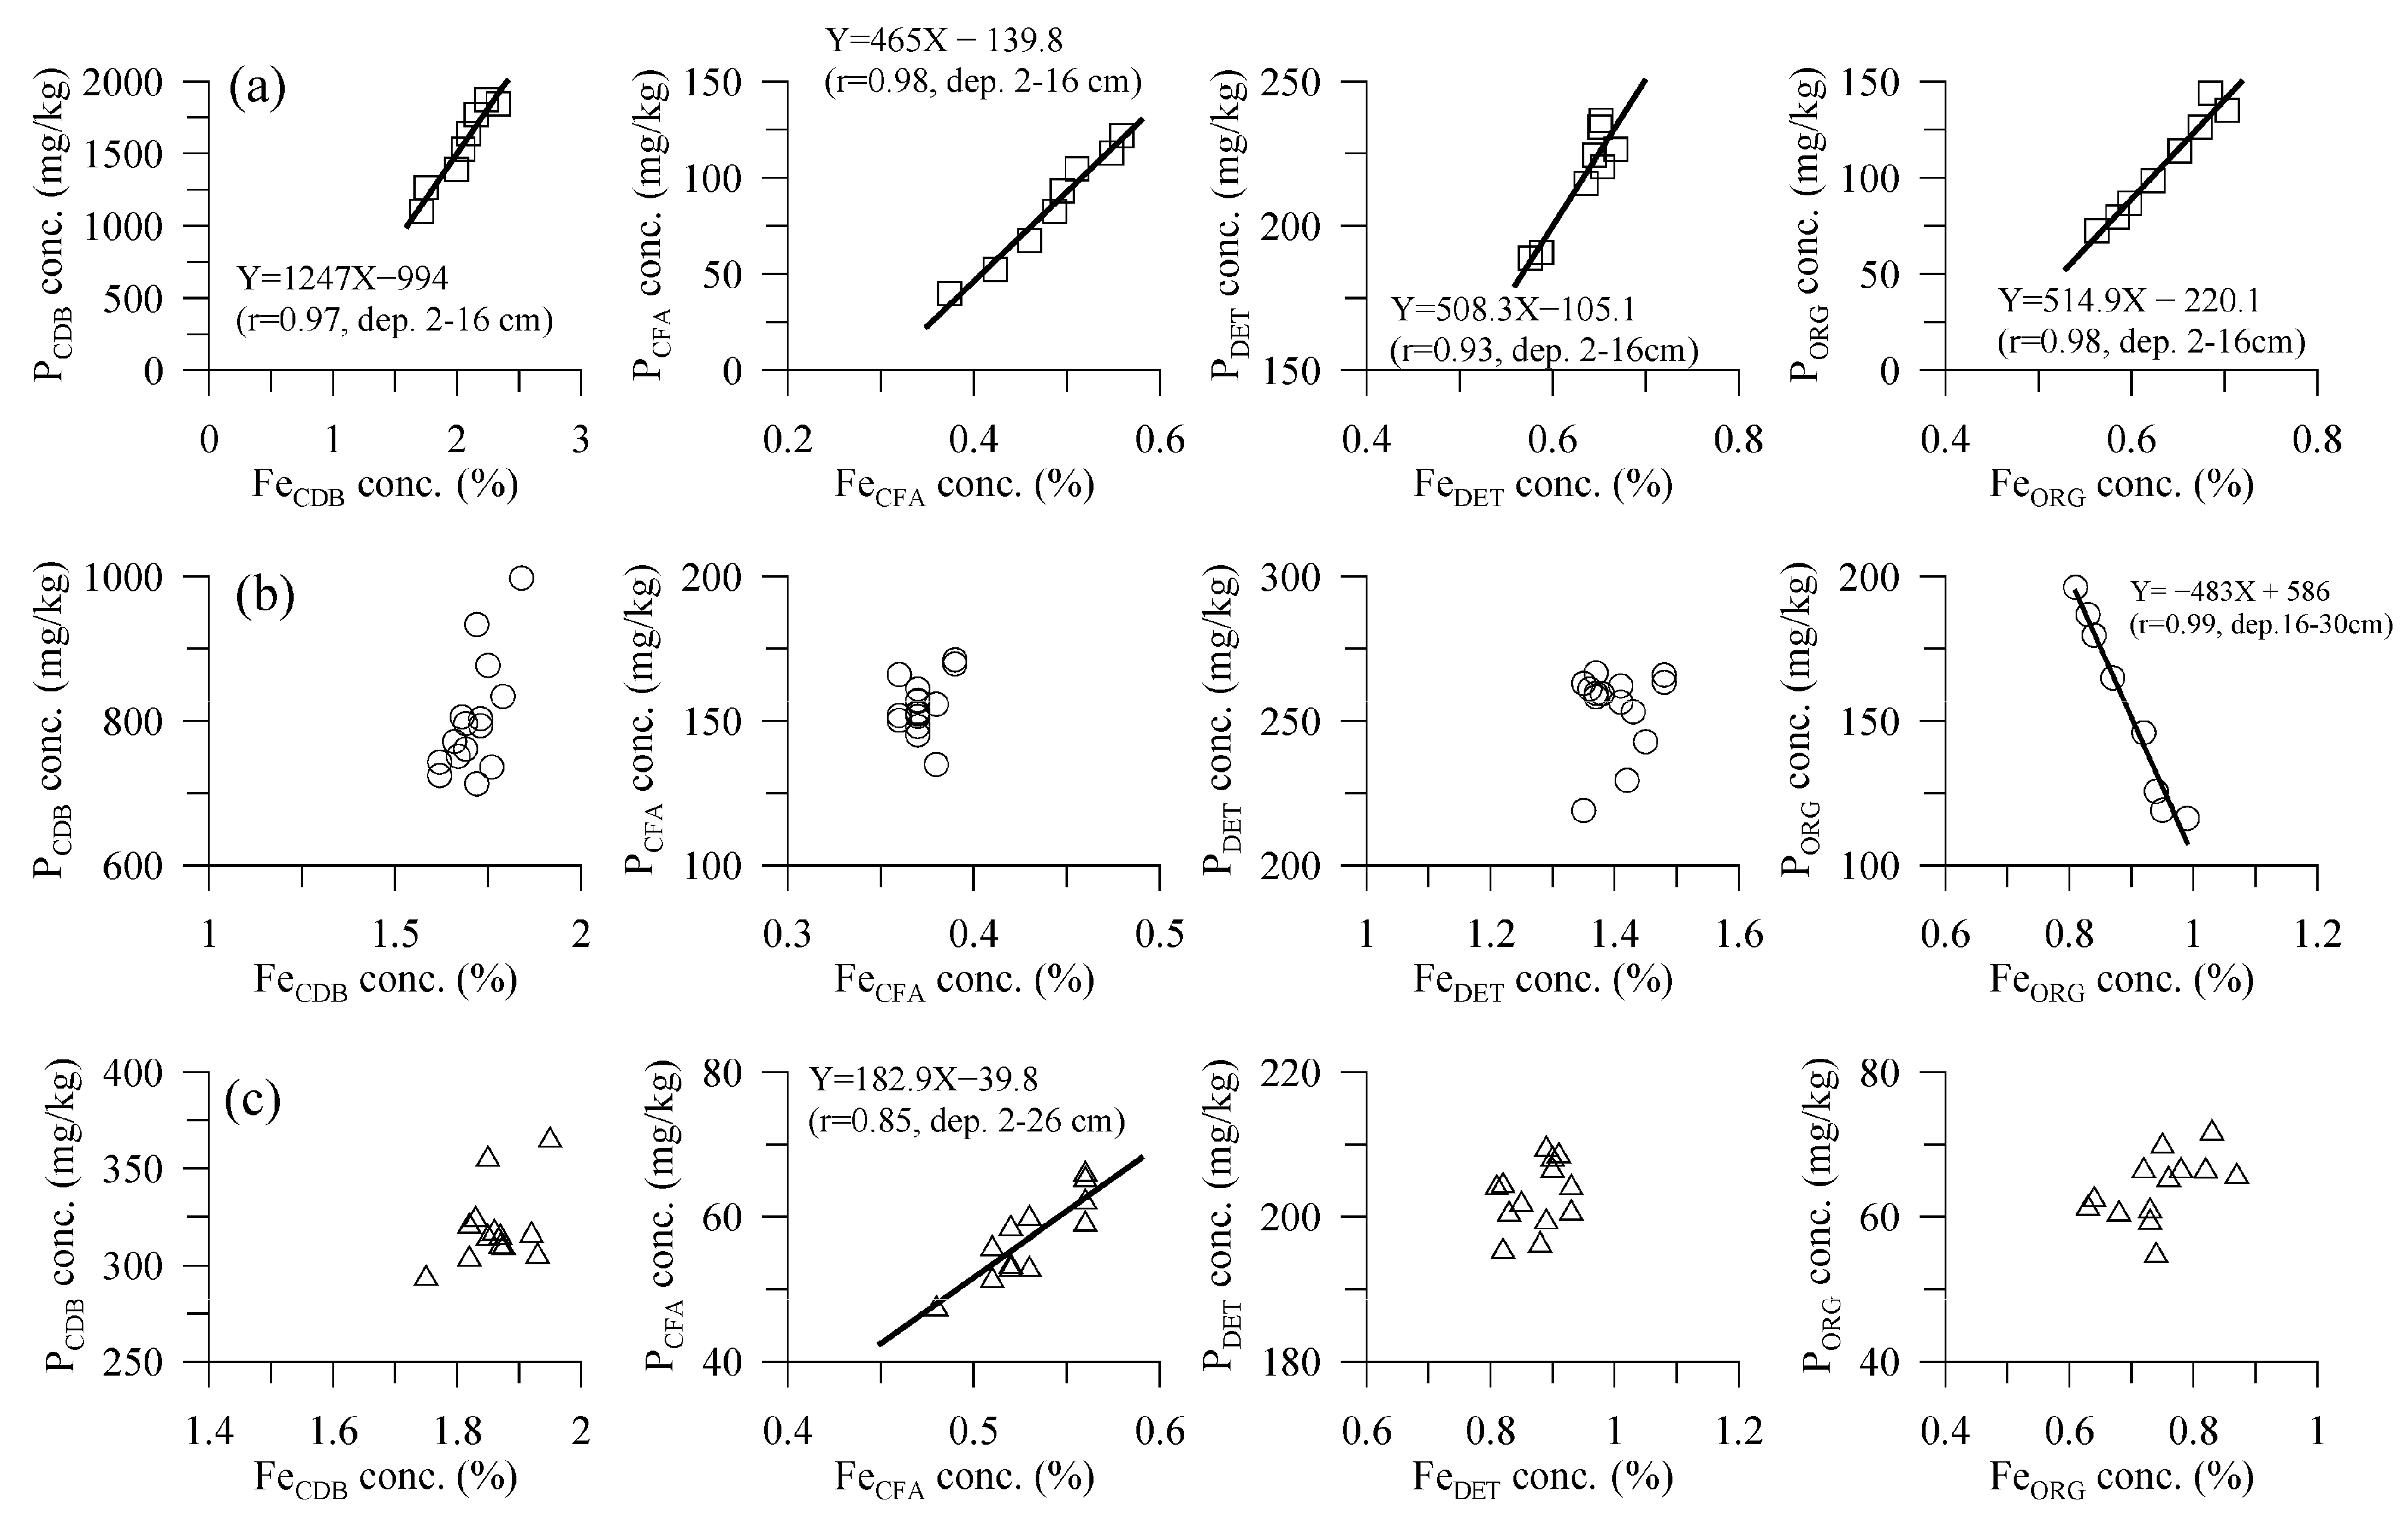
Figure 8 and Figure 9 show plots of the sedimentary P fractions against Fe and Mn in the three sediment cores of the DRE. Figure 8 clearly indicates that four-fraction sedimentary P concentration generally correlated well with the same Fe fraction at some depth interval of the sediment core of the upper estuary. Nevertheless, such a strong correlation was observed only for the PORG and PCFA fractions in the middle and lower estuary, respectively. A similar result was also seen for sedimentary P and Mn in the upper and the middle estuary core samples, as shown in Figure 9. These results suggest that Fe and Mn play important roles in regulating the geochemical cycle of sedimentary P in the sediment core of the DRE, especially in the upper estuary.

4.2. Iron

The Fe fraction concentration extracted by the SEDEX method in the three sediment cores of the DRE generally followed the following sequence: FeCDB > FeDET > FeORG > FeCFA > FeSORB. The FeCDB fraction concentration was typically <50% of the total Fe pool and FeSORB, where the fraction concentration was usually lower than the detection limit of the flame AAS. The FeDET and FeORG fractions in the three sediment cores roughly accounted for 20% of the total Fe pool, except for a relatively higher percentage, 31–33%, of FeDET observed in the middle estuary. The FeCDB fraction, which participates in the redox reaction and strongly influences the dissolution of PCDB in sediment, is probably the most concerning fraction among the sedimentary Fe fractions in marine sediment, as mentioned above. Ruttenberg [25] demonstrated that the citrate–dithionite–bicarbonate (CDB) reagent can completely dissolve iron compounds, including ferrihydrite, lepidocrocite, goethite, and hematite. This result was also confirmed by Slomp et al. [13], who used various chemical reagents to attack common Fe-containing standard minerals. Their experimental results indicated that the CDB reagent is a stronger chemical that completely dissolves the ferrihydrite (Fe5HO8 ·4H2O), amorphous (FeS), goethite (α-FeOOH), hematite (α-Fe2O3), and magneite (Fe3O4) in Fe-containing minerals. Thus, the FeCDB fraction is commonly recognized as a measure of total Fe oxides in marine sediment [21].
Figure 5 shows that the profile of the FeCDB fraction of the upper estuary core sample varied significantly with depth, and the concentration increased with a 2–16 cm depth interval, which resembled the profile of PCDB. Afterward, the concentration decreased with depth at 18–34 m intervals. Like the PCDB fraction, both segments exhibited a linear relationship with depth, with slope values of 490 mg Fe/kg/cm and −590 mg Fe/kg/cm, respectively. A similar result was also found for the FeCFA and FeORG fractions, and the slope values reduced to 120 mg Fe/kg/cm (2–16 cm) and −180 mg Fe/kg/cm (18–30 cm) for the FeCFA fraction and to 120 mg Fe/kg/cm (2–14 cm) for the FeORG fraction. These results suggest that the transformation of FeCDB, FeCFA, and FeORG fractions occurred in the upper estuary core sample during the burial processes.
Compared with the FeCDB fraction, discussions of FeDET in the literature are minimal, likely because it is a residual fraction and is not involved in redox reactions in the environment [25]. Figure 5 shows the profile variation in the FeDET fraction in the DRE core samples, with less significant results, confirming that the FeDET fraction was the least reactive sedimentary Fe. The FeDET fraction attacked by 1N HCl is regarded as the labile fraction and is available to marine organisms [61]. The experimental results suggest that the uptake of mineral-bound Fe(III) by marine organisms in estuarine sediment is weaker than that of the chemical extraction [62]. However, benthic organisms’ uptake of the FeDET fraction should not be ruled out during sediment burial processes.
The FeORG fraction in the DRE core samples accounted for 16–22% of the total Fe pool. Many studies indicate that the FeORG fraction in marine sediment analyzed by the Tessier sequential extraction method was generally <5% of the total Fe pools, and the residual fraction mostly exceeded 80% of the total Fe pools [63,64,65,66,67,68,69,70]. As mentioned above, the SEDEX method optimum digests are approximately 80% of the total Fe content in marine sediment, thereby increasing the FeORG fraction percentage and decreasing the FeDET fraction percentage. Thus, it is not surprising to see that the FeORG fraction in the DRE core samples has a higher proportion of the total Fe pools, which is induced by the different analytical protocols. The sedimentary trace metals that have the highest percentage of the organic fraction are probably Hg and Cu [64,70,71]. Both elements rank first and second in the Irving–Williams order of stability constants for organic compounds [72]. The transport of dissolved iron in rivers is accompanied by colloidal material stabilized by organic matter, and the removal of colloidal material due to flocculation/aggregation in the estuarine mixing zone. Such an effect induces the removal behavior of dissolved Fe in the estuary [73]. In addition, the remineralization of organic C in anoxic sediments utilizes Fe2O3 as the oxidant [72]. Thus, the geochemical cycle of iron always accompanies the OC and vice versa in the marine environment ([74], and references cited therein).
Figure 3 shows that the TOC content in these three sediment cores of the DRE ranged between 1.11 and 2.29%, values that paralleled those reported for some worldwide eutrophic estuaries [75,76,77,78,79]. Due to the anthropogenic sources, especially from the domestic discharge, the sedimentary TOC content in the eutrophic estuary was significantly higher in the coastal environment, where the TOC concentration range was 0.2–1.0%, and the average value was 0.4–0.6% [76,79,80]. Thus, the higher TOC content may induce a higher percentage of FeORG fraction in the three sediment cores of the DRE in the present study. Figure 5 shows that the profiles of the FeORG fraction in the three sediment cores and the concentration increased with depth at a 2–16 cm depth interval. Afterward, the concentration generally decreased with depth, suggesting that the FeORG fraction was remineralized during the burial process in these three sediment cores. More discussion of the profile variations in different Fe fractions was addressed above.

4.3. Manganese

In contrast with the results of sedimentary P and Fe, each Mn fraction contributed significantly to the total Mn pools in the DRE core samples. However, the MnCDB fraction slightly prevailed and accounted for 31–37% of the total Mn pools. Basically, more than 80% of total Mn concentrations were present in the non-residual fraction, and the MnDET fraction on average accounted for 15% of the total Mn pools across the three sediment cores. This result agreed well with our recent study focused on the surface sediments of the DRE [9], and with the recent reports that employed the sequential extraction method, such as Tessier or the BCR method, to study the sedimentary trace metals in the inshore environment [70,81,82,83,84,85]. These studies indicated that Mn was mainly present in the non-residual fraction, including the exchangeable carbonate (Fe, Mn)-oxyhydroxide and sulfides/organic species in marine sediments. As mentioned above, our previous study found that the analytical accuracy of the SEDEX method for analyzing Mn concentrations in the two reference materials, MESS-3 and BCSS-1, was 90% [9]. Thus, the Mn concentration in the residual fraction in the three sediment cores of the present study may be underestimated because the sediment core samples were analyzed using the SEDEX method.
The reason that sedimentary Mn is mainly present in the non-residual fraction may be due to Mn’s geochemical characteristics. Manganese is a redox-sensitive element. Mn generally has two oxidation states: Mn(II) and Mn(IV) [72]. In a reducing environment, Mn(II) is the thermodynamically stable oxidation state and is mainly present in the solid phase, while Mn(II) exists in the soluble phase. Mn(II) is easily oxidized from the dissolved phase into a particulate phase to Mn(IV), which has low solubility, in an oxic environment and vice versa. Thus, the geochemical cycle of Mn in the aquatic environment is clearly influenced by phase transformations between dissolved and particulate phases in an anoxic environment with redox variation [86]. The dissolved Mn+2 in seawater, in addition, can react with carbonate to form rhodochrosite (MnCO3), and particulate Mn in seawater can be adsorbed onto the CaCO3 surface due to the interactions between the Mn+2, Ca+2, and CaCO3 systems in seawater [87,88]. The reaction of dissolved Mn with organic ligands to form organic complexation in the water column is weak because the stability constant of Mn–organic complexes is relatively low [72]. In addition, the remineralization of organic C in anoxic sediments utilizes Mn oxides, accompanied by nitrate, Fe oxides, and sulfate, which are among the oxidants that provide the electron donor to oxidize organic carbon in anoxic sediment during diagenetic processes [72,89]. Thus, the privilege of the non-residual labile fraction of Mn gradually decreases with increasing depth due to the dissolution of the labile Mn, which is generally observed in deeper marine sediment, where anoxic conditions prevail in cores [85,89,90].
The profile variations of the Mn fraction in the core samples were similar to those of sedimentary Fe. The MnCDB, MnCFA, and MnORG fractions in the upper estuary sediment core generally exhibited a concentration increase at 2–16 cm depth intervals. Afterward, the concentration slightly decreased with depth. The middle estuary core sample exhibited a similar profile. Meanwhile, the profile variations in sedimentary Mn in the lower estuary’s sediment core were insignificant. As seen in Figure 9, the four-fraction sedimentary P concentration generally correlated well with the same fraction of sedimentary Mn at some depth intervals in sediment cores from the upper and middle estuary. However, such a strong correlation was not observed in the sediment core from the lower estuary. This result fairly agrees well with our previous study, which showed that particulate Mn significantly correlated well with particulate P within the DRE [1]. This result suggests that particulate Mn may play an important role in influencing the P distribution of sedimentary P in the DRE.

5. Conclusions

The present study is a pioneering work on sedimentary P fractions in DRE sediment cores. The total P concentrations in the upper and the middle estuary core samples averaged 2060 mg/kg and 1310 mg/kg, suggesting that the upper estuary extending to the middle estuary of the DRE was highly polluted by the P element, and the pollution obviously decreased seaward. Domestic wastewater discharged into the DRE catchment area contributes to nutrient pollution. One of the most important results of this study is that the PCDB fraction concentration in the upper estuary core sample accounted for 80% of the total P pools. Such a high percentage of the PCDB fraction in marine sediment is rarely reported in the literature. Nevertheless, the dominance of the PCDB fraction decreased seaward, while the PDET fraction significantly increased seaward. The PSORB, PCFA, and PORG fractions also increased seaward, but the variation was not as profound as for the PCDB and PDET fractions.
The profile variations in the P fractions in the DRE upper estuary core sample reflect that the mobilization of the PCDB and PCFA fractions and remineralization of the PORG fraction occurred during the diagenetic processes. The mobilization reaction played a more important role than the remineralization of organic matter in influencing the geochemical cycle of sedimentary P in the DRE because the PCDB fraction was much more concentrated than the PORG fraction. This result was confirmed by the linear slopes of the PCDB and PORG fractions in the DRE core samples. Additionally, the mobilization and remineralization of the sedimentary P in the upper estuary core sample provided the upward and the downward source at the upper layer depth (2–16 cm) and the deeper layer depth (>16 cm), respectively. The mobilization and remineralization rates of the different P fractions in the three core samples differed significantly across depth intervals. Finally, further work should be carried out to analyze the dissolved inorganic and organic P concentrations in pore water to know the diffusive flux of dissolved P and provide direct evidence of the mobilization and remineralization of sedimentary P in such a P-polluted estuary.

Author Contributions

C.X.C.: Conceptualization, Methodology, Investigation, and Data Curation; T.H.F.: Conceptualization, Supervision, Resources, and Writing—Original Draft. All authors have read and agreed to the published version of the manuscript.

Funding

This research was financially supported by the Ministry of Science and Technology, Taiwan, under grants MOST 111-2611-M-019-009 and 110-2611-M-019-014.

Data Availability Statement

The original contributions presented in this study are included in this article. Further inquiries of the analyzed data can contact with the corresponding author.

Acknowledgments

The authors are grateful to the anonymous reviewers for his constructive comments and suggestions which led to significant improvements in this manuscript.

Conflicts of Interest

The authors declare no competing financial interests.

References

  1. Wen, L.S.; Jiann, K.T.; Liu, K.K. Seasonal variation and flux of dissolved nutrients in the Danshuei Estuary, Taiwan: A hypoxic subtropical mountain river. Estuar. Coast. Shelf Sci. 2008, 78, 694–704. [Google Scholar] [CrossRef]
  2. Wu, P.C.; Gong, G.C.; Cheng, J.S.; Liu, K.K.; Kao, S.J. Origins of particulate organic matter determined from nitrogen isotopic composition and C/N ratio in the highly eutrophic Danshuei Estuary, Northern Taiwan. Aquat. Geochem. 2016, 22, 291–311. [Google Scholar] [CrossRef]
  3. Fang, T.H.; Wang, C.W. Dissolved and particulate phosphorus species partitioning and distribution in the Danshuei River Estuary, Northern Taiwan. Mar. Pollut. Bull. 2020, 151, 110839. [Google Scholar] [CrossRef] [PubMed]
  4. Fang, T.H.; Chen, W.H. Dissolved and particulate nitrogen species partitioning and distribution in the Danshuei River Estuary, Northern Taiwan. Mar. Pollut. Bull. 2021, 164, 111981. [Google Scholar] [CrossRef]
  5. Lemley, D.A.; Adams, J.B.; Taljaard, S.; Strydom, N.A. Towards the classification of eutrophic condition in estuaries. Estuar. Coast. Shelf Sci. 2015, 164, 221–232. [Google Scholar] [CrossRef]
  6. Liu, K.K.; Kao, S.J.; Wen, L.S.; Chen, K.L. Carbon and nitrogen isotopic compositions of particulate organic matter and biogeochemical processes in the eutrophic Danshuei Estuary in northern Taiwan. Sci. Total Environ. 2007, 382, 103–120. [Google Scholar] [CrossRef]
  7. Lee, T.Y.; Shih, Y.T.; Huang, J.C.; Kao, S.J.; Shiah, F.K.; Liu, K.K. Speciation and dynamics of dissolved inorganic nitrogen export in the Danshui River, Taiwan. Biogeosciences 2014, 11, 5307–5321. [Google Scholar] [CrossRef][Green Version]
  8. Chang, T.C.; Lin, W.Y.; Fang, T.H. Spatial variability of nitrogen cycling in the sediments of the Danshuie River Estuary (Northern Taiwan). Mar. Pollut. Bull. 2023, 197, 115776. [Google Scholar] [CrossRef]
  9. Fang, T.H.; Wang, C.W. Distribution of Geochemical Species of P, Fe and Mn in Surface Sediments in the Eutrophic Estuary, Northern Taiwan. Water 2021, 13, 3075. [Google Scholar] [CrossRef]
  10. Statham, P.J. Nutrients in estuaries—An overview and the potential impacts of climate change. Sci. Total Environ. 2012, 434, 213–227. [Google Scholar] [CrossRef]
  11. Fitzsimons, M.F.; Lohan, M.C.; Tappin, A.D.; Millward, G.E. The role of suspended particles in estuarine and coastal biogeochemistry. In Treaties on Estuarine and Coastal Science; Shimmield, S., Ed.; Academic Press Elsevier: Amsterdam, The Netherlands, 2011; Volume 4, pp. 71–114. [Google Scholar]
  12. Wilfert, P.; Kumar, P.S.; Korving, L.; Witkamp, G.J.; Van Loosdrecht, M.C. The relevance of phosphorus and iron chemistry to the recovery of phosphorus from wastewater: A review. Environ. Sci. Technol. 2015, 49, 9400–9414. [Google Scholar] [CrossRef] [PubMed]
  13. Slomp, C.; Van der Gaast, S.; Van Raaphorst, W. Phosphorus binding by poorly crystalline iron oxides in North Sea sediments. Mar. Chem. 1996, 52, 55–73. [Google Scholar] [CrossRef]
  14. Anschutz, P.; Zhong, S.; Sundby, B.; Mucci, A.; Gobeil, C. Burial efficiency of phosphorus and the geochemistry of iron in continental margin sediments. Limnol. Oceanogr. 1998, 43, 53–64. [Google Scholar] [CrossRef]
  15. Jilbert, T.; Slomp, C.P. Iron and manganese shuttles control the formation of authigenic phosphorus minerals in the euxinic basins of the Baltic Sea. Geochim. Cosmochim. Acta 2013, 107, 155–169. [Google Scholar] [CrossRef]
  16. van der Zee, C.; Roevros, N.; Chou, L. Phosphorus speciation, transformation and retention in the Scheldt estuary (Belgium/The Netherlands) from the freshwater tidal limits to the North Sea. Mar. Chem. 2007, 106, 76–91. [Google Scholar] [CrossRef]
  17. Andrews, J.E.; Jickells, T.D.; Adams, C.A.; Parkes, D.J.; Kelly, S.D. Sediment Record and Storage of Organic Carbon and the Nutrient Elements (N, P, and Si) in Estuaries and Near-Coastal Seas. In Treaties on Estuarine and Coastal Science; Shimmield, S., Ed.; Academic Press Elsevier: Amsterdam, The Netherlands, 2011; Volume 4, pp. 9–38. [Google Scholar]
  18. Ruttenberg, K. The global phosphorus cycle. In Treatise on Geochemistry; Holland, H.D., Turekian, K.K., Eds.; Elsevier: Amsterdam, The Netherlands, 2003; pp. 585–682. [Google Scholar]
  19. Paytan, A.; McLaughlin, K. The oceanic phosphorus cycle. Chem. Rev. 2007, 107, 563–576. [Google Scholar] [CrossRef]
  20. Zhou, Z.; Henkel, S.; Kasten, S.; Holtappels, M. The “ironredox battery” in sandy sediments: Its impact on organic matter remineralization and phosphorus cycling. Sci. Total Environ. 2023, 865, 161168. [Google Scholar] [CrossRef]
  21. Jilbert, T.; Slomp, C.; Gustafsson, B.G.; Boer, W. Beyond the Fe-P-redox connection: Preferential regeneration of phosphorus from organic matter as a key control on Baltic Sea nutrient cycles. Biogeosciences 2011, 8, 1699–1720. [Google Scholar] [CrossRef]
  22. Joshi, S.R.; Kukkadapu, R.K.; Burdige, D.J.; Bowden, M.E.; Sparks, D.L.; Jsisi, D.P. Organic matter remineralization predominates phosphorus cycling in the Mid-Bay sediments in the Chesapeake Bay. Environ. Sci. Technol. 2015, 49, 5887–5896. [Google Scholar] [CrossRef]
  23. Slomp, C.P.; Mort, H.P.; Jilbert, T.; Reed, D.C.; Gustafsson, B.G.; Wolthers, M. Coupled dynamics of iron and phosphorus in sediments of an oligotrophic coastal basin and the impact of anaerobic oxidation of methane. PLoS ONE 2013, 8, e62386. [Google Scholar] [CrossRef]
  24. Egger, M.; Jilbert, T.; Behrends, T.; Rivard, C.; Slomp, C.P. Vivianite is a major sink for phosphorus in methanogenic coastal surface sediments. Geochim. Cosmochim. Acta 2015, 169, 217–235. [Google Scholar] [CrossRef]
  25. Ruttenberg, K.C. Development of a sequential extraction method for different forms of phosphorus in marine sediments. Limnol. Oceanogr. 1992, 37, 1460–1482. [Google Scholar] [CrossRef]
  26. Liu, W.C.; Hsu, M.H.; Kuo, A.Y.; Kuo, J.T. The influence of river discharge on salinity intrusion in the Tanshui estuary, Taiwan. J. Coast. Res. 2001, 17, 544–552. [Google Scholar]
  27. Liu, W.C.; Chen, W.B.; Kuo, J.T.; Wu, C. Numerical determination of residence time and age in a partially mixed estuary using three-dimensional hydrodynamic model. Cont. Shelf Res. 2008, 28, 1068–1088. [Google Scholar] [CrossRef]
  28. Water Resources Agency, Ministry of Economic Affairs, Republic of China, 2020. Available online: https://www.wra.gov.tw (accessed on 1 August 2025).
  29. Water Resources Bureau, Hydrological Year Book of Taiwan, Ministry of Economic Affairs, Republic of China, 1999. Available online: https://gweb.wra.gov.tw/wrhygis (accessed on 1 August 2025).
  30. Kao, S.; Milliman, J.D. Water and sediment discharge from small mountainous rivers, Taiwan: The roles of lithology, episodic events, and human activities. J. Geol. 2008, 116, 431–448. [Google Scholar] [CrossRef]
  31. Hansen, H.P.; Koroleff, E. Determination of nutrients. In Methods of Seawater Analysis; Grasshoff, K., Kremling, K., Ehrhardt, M., Eds.; John Wiley & Sons: Hoboken, NJ, USA, 2009; pp. 159–228. [Google Scholar]
  32. Kryc, K.; Murray, R.; Murray, D. Elemental fractionation of Si, Al, Ti, Fe, Ca, Mn, P, and Ba in five marine sedimentary reference materials: Results from sequential extractions. Anal. Chim. Acta 2003, 487, 117–128. [Google Scholar] [CrossRef]
  33. Baturin, G. Phosphorus cycle in the ocean. Lithol. Miner. Resour. 2003, 38, 101–119. [Google Scholar] [CrossRef]
  34. Teodoro, A.; Duleba, W.; Gubitoso, S.; Prada, S.; Lamparelli, C.; Bevilacqua, J. Analysis of foraminifera assemblages and sediment geochemical properties to characteristic the environment near Araçá and Saco da Capela domestic sewage submarine outfalls of São Sebastião Channel, São Paulo State, Brazil. Mar. Pollut. Bull. 2010, 60, 536–553. [Google Scholar] [CrossRef]
  35. Berbel, G.B.; Favaro, D.I.; Braga, E.S. Impact of harbour, industry and sewage on the phosphorus geochemistry of a subtropical estuary in Brazil. Mar. Pollut. Bull. 2015, 93, 44–52. [Google Scholar] [CrossRef]
  36. Zhuang, W.; Gao, X.; Zhang, Y.; Xing, Q.; Tosi, L.; Qin, S. Geochemical characteristics of phosphorus in surface sediments of two major Chinese mariculture areas: The Laizhou Bay and the coastal waters of the Zhangzi Island. Mar. Pollut. Bull. 2014, 83, 343–351. [Google Scholar] [CrossRef]
  37. Moturi, M.; Rawat, M.; Subramanian, V. Distribution and partitioning of phosphorus in solid waste and sediments from drainage canals in the industrial belt of Delhi, India. Chemosphere 2005, 60, 237–244. [Google Scholar] [CrossRef] [PubMed]
  38. Chester, R.; Jickells, T. Marine Geochemistry, 3rd ed.; John Wiley and Sons: Chichester, UK, 2012. [Google Scholar]
  39. Martin, J.M.; Meybeck, M. Elemental mass-balance of material carried by major world rivers. Mar. Chem. 1979, 7, 173–206. [Google Scholar] [CrossRef]
  40. Hartzell, J.L.; Jordan, T.E.; Cornwell, J.C. Phosphorus burial in sediments along the salinity gradient of the Patuxent River, a subestuary of the Chesapeake Bay (USA). Est. Coasts 2010, 33, 92–106. [Google Scholar] [CrossRef]
  41. Meng, J.; Yao, P.; Yu, Z.; Bianchi, T.S.; Zhao, B.; Pan, H.; Li, D. Speciation, bioavailability and preservation of phosphorus in surface sediments of the Changjiang Estuary and adjacent East China Sea inner shelf. Est. Coast. Shelf Sci. 2014, 144, 27–38. [Google Scholar] [CrossRef]
  42. Yang, B.; Zhou, J.B.; Lu, D.L.; Dan, S.F.; Zhang, D.; Lan, W.L.; Kang, Z.J.; Ning, Z.M.; Cui, D.Y. Phosphorus chemical speciation and seasonal variations in surface sediments of the Maowei Sea, northern Beibu Gulf. Mar. Pollut. Bull. 2019, 141, 61–69. [Google Scholar] [CrossRef]
  43. Gao, L.; Li, R.; Liang, Z.; Yan, C.; Zhu, A.; Li, S.; Yang, Z.; He, H.; Gan, H.; Chen, J. Remobilization mechanism and release characteristics of phosphorus in saline sediments from the Pearl River Estuary (PRE), South China, based on high-resolution measurements. Sci. Tot. Environ. 2020, 703, 134411. [Google Scholar] [CrossRef]
  44. Coelho, J.; Flindt, M.; Jensen, H.S.; Lillebø, A.; Pardal, M. Phosphorus speciation and availability in intertidal sediments of a temperate estuary: Relation to eutrophication and annual P-fluxes. Est Coast Shelf Sci. 2004, 61, 583–590. [Google Scholar] [CrossRef]
  45. Andrieux-Loyer, F.; Aminot, A. Phosphorus forms related to sediment grain size and geochemical characteristics in French coastal areas. Est Coast Shelf Sci. 2001, 52, 617–629. [Google Scholar] [CrossRef]
  46. Caraco, N.; Cole, J.; Likens, G.E. A comparison of phosphorus immobilization in sediments of freshwater and coastal marine systems. Biogeochemistry 1990, 9, 277–290. [Google Scholar] [CrossRef]
  47. Pettersson, K. Phosphorus characteristics of settling and suspended particles in Lake Erken. Sci. Total Environ. 2001, 266, 79–86. [Google Scholar] [CrossRef]
  48. Slomp, C.P.; Thomson, J.; de Lange, G.J. Controls on phosphorus regeneration and burial during formation of eastern Mediterranean sapropels. Mar. Geol. 2004, 203, 141–159. [Google Scholar] [CrossRef]
  49. Markovic, S.; Liang, A.; Watson, S.B.; Depew, D.; Zastepa, A.; Surana, P.; Byllaardt, J.V.; Arhonditsis, G.; Dittrich, M. Reduction of industrial iron pollution promotes phosphorus internal loading in eutrophic Hamilton Harbour, Lake Ontario, Canada. Environ. Pollut. 2019, 252, 697–705. [Google Scholar] [CrossRef] [PubMed]
  50. Ghaisas, N.A.; Maiti, K.; White, J.R. Coupled iron and phosphorus release from seasonally hypoxic Louisiana shelf sediment. Estuar. Coast. Shelf Sci. 2019, 219, 81–89. [Google Scholar] [CrossRef]
  51. Delaney, M. Phosphorus accumulation in marine sediments and the oceanic phosphorus cycle. Glob. Biogeochem. Cycles 1998, 12, 563–572. [Google Scholar] [CrossRef]
  52. Kim, D.; Schuffert, J.D.; Kastner, M. Francolite authigenesis in California continental slope sediments and its implications for the marine P cycle. Geochim. Cosmochim. Acta 1999, 63, 3477–3485. [Google Scholar] [CrossRef]
  53. Dan, S.F.; Liu, S.M.; Yang, B. Geochemical fractionation, potential bioavailability and ecological risk of phosphorus in surface sediments of the Cross River estuary system and adjacent shelf, South East Nigeria (West Africa). J. Mar. Syst. 2020, 201, 103244. [Google Scholar] [CrossRef]
  54. Puttonen, I.; Mattila, J.; Jonsson, P.; Karlsson, M.; Kohonen, T.; Kotilainen, A.; Lukkari, K.; Malmaeus, M.; Rydin, E. Distribution and estimated release of sediment phosphorus in the northern Baltic Sea archipelagos. Estuar. Coast. Shelf Sci. 2014, 145, 9–21. [Google Scholar] [CrossRef]
  55. Adhikari, P.L.; White, J.R.; Maiti, K.; Nguyen, N. Phosphorus speciation and sedimentary phosphorus release from the Gulf of Mexico sediments: Implication for hypoxia. Estuar. Coast. Shelf Sci. 2015, 164, 77–85. [Google Scholar] [CrossRef]
  56. Sudheesh, V.; Movitha, M.; Hatha, A.M.; Renjith, K.; Resmi, P.; Rahiman, M.; Nair, S. Effects of seasonal anoxia on the distribution of phosphorus fractions in the surface sediments of southeastern Arabian Sea shelf. Cont. Shelf Res. 2017, 150, 57–64. [Google Scholar] [CrossRef]
  57. Kang, X.; Song, J.; Yuan, H.; Shi, X.; Yang, W.; Li, X.; Li, N.; Duan, L. Phosphorus speciation and its bioavailability in sediments of the Jiaozhou Bay. Estuar. Coast. Shelf Sci. 2017, 188, 127–136. [Google Scholar] [CrossRef]
  58. Yang, B.; Song, G.D.; Liu, S.M.; Jin, J. Phosphorus recycling and burial in core sediments of the East China Sea. Mar. Chem. 2017, 192, 59–72. [Google Scholar] [CrossRef]
  59. Lucotte, M.; Mucci, A.; Hillarie-Marcel, C.; Tran, S. Early diagenetic processes in deep Labrador Sea sediment: Reactive and nonreactive iron and phosphorus. Can. J. Earth Sci. 1994, 31, 14–27. [Google Scholar] [CrossRef]
  60. Schenau, S.; De Lange, G. Phosphorus regeneration vs. burial in sediments of the Arabian Sea. Mar. Chem. 2001, 75, 201–217. [Google Scholar] [CrossRef]
  61. Luoma, S.N. Processes affecting metal concentrations in estuarine and coastal marine sediments. In Heavy Metals in the Marine Environment; Furness, R.W., Rainbow, P.S., Eds.; CRC Press: Boca Raton, FL, USA, 1990; pp. 51–66. [Google Scholar]
  62. Hyacinthe, C.; Bonneville, S.; Van Cappellen, P. Reactive iron (III) in sediments: Chemical versus microbial extractions. Geochim. Cosmochim. Acta 2006, 70, 4166–4180. [Google Scholar] [CrossRef]
  63. Ip, C.C.M.; Li, X.D.; Zhang, G.; Wai, O.W.H.; Li, Y.S. Trace metal distribution in sediments of the Pearl River Estuary and the surrounding coastal area, South China. Environ. Pollut. 2007, 147, 311–323. [Google Scholar] [CrossRef]
  64. Yu, X.; Yan, Y.; Wang, W.X. The distribution and speciation of trace metals in surface sediments from the Pearl River Estuary and the Daya Bay, southern China. Mar. Pollut. Bull. 2010, 60, 1364–1371. [Google Scholar] [CrossRef]
  65. Duan, L.; Song, J.; Yuan, H.; Li, X.; Li, N. Spatial-temporal distribution and environmental risk of arsenic in sediments of the East China Sea. Chem. Geol. 2013, 340, 21–31. [Google Scholar] [CrossRef]
  66. Liu, Z.; Pan, S.; Sun, Z.; Ma, R.; Chen, L.; Wang, Y.; Wang, S. Heavy metal spatial variability and historical changes in the Yangtze River estuary and North Jiangsu tidal flat. Mar. Pollut. Bull. 2015, 98, 115–129. [Google Scholar] [CrossRef]
  67. Gu, Y.G.; Lin, Q.; Yu, Z.L.; Wang, X.N.; Ke, C.L.; Ning, J.J. Speciation and risk of heavy metals in sediments and human health implications of heavy metals in edible nekton in Beibu Gulf, China: A case study of Qinzhou Bay. Mar. Pollut. Bull. 2015, 101, 852–859. [Google Scholar] [CrossRef]
  68. Gao, X.; Zhuang, W.; Chen, C.T.A.; Zhang, Y. Sediment quality of the SW coastal Laizhou Bay, Bohai Sea, China: A comprehensive assessment based on the analysis of heavy metals. PLoS ONE 2015, 10, e0122190. [Google Scholar] [CrossRef]
  69. Wang, Q.; Liu, R.; Men, C.; Xu, F.; Guo, L.; Shen, Z. Spatial-temporal distribution and risk assessment of mercury in different fractions in surface sediments from the Yangtze River estuary. Mar. Pollut. Bull. 2017, 124, 488–495. [Google Scholar] [CrossRef] [PubMed]
  70. Fang, T.H.; Huang, Z.T.; Chang, F.W. The geochemical and environmental characteristics of trace metals in surface sediments of the river estuarine mouths around the Taiwan Island and the Taiwan Strait. Mar. Pollut. Bull. 2022, 182, 113967. [Google Scholar] [CrossRef] [PubMed]
  71. Pejman, A.; Bidhendi, G.N.; Ardestani, M.; Saeedi, M.; Baghvand, A. Fractionation of heavy metals in sediments and assessment of their availability risk: A case study in the northwestern of Persian Gulf. Mar. Pollut. Bull. 2017, 114, 881–887. [Google Scholar] [CrossRef] [PubMed]
  72. Stumm, W.; Morgan, J.J. Aquatic Chemistry, 3rd ed.; John Wiley & Sons, Inc.: New York, NY, USA, 1996. [Google Scholar]
  73. Figueres, G.; Martin, J.; Meybeck, M. Iron behaviour in the Zaire estuary. Neth. J. Sea Res. 1978, 12, 329–337. [Google Scholar] [CrossRef]
  74. Wang, D.; Zhu, M.X.; Yang, G.P.; Ma, W.W. Reactive iron and iron-bound organic carbon in surface sediments of the river-dominated Bohai Sea (China) Versus the Southern Yellow Sea. J. Geophys. Res. Biogeosci. 2019, 124, 79–98. [Google Scholar] [CrossRef]
  75. Valdemarsen, T.; Quintana, C.O.; Kristensen, E.; Flindt, M.R. Recovery of organic-enriched sediments through microbial degradation: Implications for eutrophic estuaries. Mar. Ecol. Prog. Ser. 2014, 503, 41–58. [Google Scholar] [CrossRef]
  76. Yang, B.; Cao, L.; Liu, S.M.; Zhang, G.S. Biogeochemistry of bulk organic matter and biogenic elements in surface sediments of the Yangtze River Estuary and adjacent sea. Mar. Pollut. Bull. 2015, 96, 471–484. [Google Scholar] [CrossRef]
  77. Hong, Y.; Wu, J.; Guan, F.; Yue, W.; Long, A. Nitrogen removal in the sediments of the Pearl River Estuary, China: Evidence from the distribution and forms of nitrogen in the sediment cores. Mar. Pollut. Bull. 2019, 138, 115–124. [Google Scholar] [CrossRef]
  78. Mathew, J.; Gopinath, A.; Martin, G.D. Spatial and temporal distribution in the biochemical composition of sedimentary organic matter in a tropical estuary along the coast of India. Spring Nat. Appl. Sci. 2019, 1, 150. [Google Scholar] [CrossRef]
  79. Lu, X.; Zhou, F.; Chen, F.; Lao, Q.; Zhu, Q.; Meng, Y.; Chen, C. Spatial and seasonal variations of sedimentary organic matter in a subtropical bay: Implication for human interventions. Int. J. Environ. Res. Public Health 2020, 17, 1362. [Google Scholar] [CrossRef]
  80. Xia, J.; Han, Y.; Tan, J.; Abarike, G.A.; Song, Z. The characteristics of organic carbon in the offshore sediments surrounding the Leizhou Peninsula, China. Front. Earth Sci. 2022, 10, 648338. [Google Scholar] [CrossRef]
  81. Yuan, C.G.; Shi, J.B.; He, B.; Liu, J.F.; Liang, L.N.; Jiang, G.B. Speciation of heavy metals in marine sediments from the East China Sea by ICP-MS with sequential extraction. Environ. Int. 2004, 30, 769–783. [Google Scholar] [CrossRef] [PubMed]
  82. Gao, X.; Chen, A.C.T.; Wang, G.; Xue, Q.Z.; Tang, C.; Chen, S.Y. Environmental status of Daya Bay surface sediments inferred from a sequential extraction technique. Estuar. Coast. Shelf Sci. 2010, 86, 369–378. [Google Scholar] [CrossRef]
  83. Brady, J.P.; Kinaev, I.; Goonetilleke, A.; Ayoko, G.A. Comparison of partial extraction reagents for assessing potential bioavailability of heavy metals in sediments. Mar. Pollut. Bull. 2016, 106, 329–334. [Google Scholar] [CrossRef]
  84. Rosado, D.; Usero, J.; Morillo, J. Ability of 3 extraction methods (BCR, Tessier and Protease K) to estimate bioavailable metals in sediments from Huelva estuary (Southwestern Spain). Mar. Pollut. Bull. 2016, 102, 65–71. [Google Scholar] [CrossRef]
  85. Burgay, F.; Abollino, O.; Buoso, S.; Costa, E.; Giacomino, A.; La Gioia, C.; Garofalo, S.F.; Pecoraro, G.; Malandrino, M. Geochemical characterization of a marine sediment core from the Joides Basin, Ross Sea, Antarctica. Mar. Geol. 2020, 428, 106286. [Google Scholar] [CrossRef]
  86. Lewis, B.L.; Landing, W.M. The biogeochemistry of manganese and iron in the Black Sea. Deep Sea Res. 1991, 38, s773–s803. [Google Scholar] [CrossRef]
  87. Bougheriet, A.; Ouddane, B.; Fischer, J.C.; Wartel, M.; Leman, G. Variability of dissolved Mn and Zn in the Seine estuary and chemical speciation of these metals in suspended matter. Water Res. 1992, 26, 1359–1378. [Google Scholar] [CrossRef]
  88. Bougheriet, A.; Wartel, M.; Cordier, C.; Douez, C.; Deram, L.; Martin, E.; Ouddane, B.; Chamley, H.; Recourt, P. Chemical speciation of some particulate elements in the English Channel, and impact of human activities on the magnetic behavior of suspended matter. Mar. Pollut. Bull. 1994, 28, 541–556. [Google Scholar] [CrossRef]
  89. Froehlich, P.N.; Klinkhammer, G.P.; Bender, M.L.; Luedke, N.A.; Heath, G.R.; Cullen, D.; Dauphin, P.; Hammond, D.; Hartman, B.; Maynard, V. Early oxidation of organic matter in pelagic sediments of the eastern equatorial Atlantic: Suboxic diagenesis. Geochim. Cosmochim. Acta 1979, 43, 1075–1090. [Google Scholar] [CrossRef]
  90. Lenz, C.; Behrends, T.; Jilbert, T.; Silveira, M.; Slomp, C.P. Redox-dependent changes in manganese speciation in Baltic Sea sediments from the Holocene thermal Maximum: An EXAFS, XANES and LA-ICP-MS study. Chem. Geol. 2014, 370, 49–57. [Google Scholar] [CrossRef]
Figure 1. The sediment cores collected in the upper, middle, and lower estuary of the Danshuei River Estuary, Northern Taiwan. (STP: sewage treatment plant). R1–R3 represent the investigation stations of the water quality carried out by the EPA, Taiwan. These three stations are located in the tributaries, namely, Keelung (R1), Xindian (R2), and Dahan (R3), of the Danshuei River system.
Water 18 00604 g001
Figure 2. Seasonal concentrations of DIN (NH4+ + NO2 + NO3) and dissolved total P in the investigation stations (R1–R3) located in the tributaries, namely, Keelung (R1), Xindian (R2) and Dahan (R3), of the Danshuei River system of the DRE during the 2006–2016 period.
Water 18 00604 g002
Figure 3. The TOC, total P (TP), and TOC/PORG molar ratio profiles in the three sediment cores of the Danshuei River Estuary.
Water 18 00604 g003
Figure 4. The five-fraction P concentrations in the three sediment cores of the Danshuei River Estuary: (a) the upper estuary, (b) the middle estuary, and (c) the lower estuary.
Water 18 00604 g004
Figure 5. The four-fraction Fe concentrations in the three sediment cores of the Danshuei River Estuary: (a) the upper estuary, (b) the middle estuary, and (c) the lower estuary.
Water 18 00604 g005
Figure 6. The five-fraction Mn concentrations in the three sediment cores of the Danshuei River Estuary: (a) the upper estuary, (b) the middle estuary, and (c) the lower estuary.
Water 18 00604 g006
Figure 7. The linear distributions of different P fractions at different depth intervals in the three sediment cores of the Danshuei River Estuary.
Water 18 00604 g007
Figure 8. Scatter plots of the four-fraction P and Fe concentrations in the three sediment cores of the Danshuei River Estuary: (a) the upper estuary, (b) the middle estuary, and (c) the lower estuary.
Water 18 00604 g008
Figure 9. Scatter plots of the four fractions of P and Mn concentrations in the three sediment cores of the Danshuei River Estuary (DRE): (a) the upper estuary, there are two equations, one is in the upper for the dash-line and another is in the bottom for the sol-id-line.(b) the middle estuary, and (c) the lower estuary.
Water 18 00604 g009
Table 1. The concentration and percentage ranges of the five-fraction sedimentary P in the three sediment cores of the Danshuei River Estuary, northern Taiwan.
Concentration (mg/kg)Percentage (%)
PSORBPCDBPCFAPDETPORGTotalPSORBPCDBPCFAPDETPORG
The upper estuary (sediment core depth = 36 cm, n = 18)
Min.22.11101.639.7185.269.51425.00.9277.312.798.283.59
Max.56.51941.2145.3239.6143.92458.72.9881.305.9113.255.99
Mean30.61636.289.0212.394.72062.71.5179.194.1910.504.60
1 std8.8247.629.118.524.8301.90.501.180.811.360.81
The middle estuary (sediment core depth = 30 cm, n = 15)
Min.17.0713.1134.9219.0103.21257.71.3555.009.6214.537.06
Max.44.2997.9171.2266.6196.21506.93.1966.2212.1920.6313.99
Mean30.1792.4153.0250.9134.21360.62.2058.1611.2818.529.83
1 std8.779.99.413.933.074.40.603.330.781.752.23
The lower estuary (sediment core depth = 26 cm, n = 13)
Min.13.9295.047.8195.855.2631.71.9846.547.5728.377.96
Max.31.6366.466.3209.872.1700.94.9952.879.6931.4910.53
Mean21.6336.456.6202.967.6685.03.1549.008.2929.699.87
1 std4.819.95.14.24.619.90.791.860.620.950.72
Table 2. The concentration and percentage ranges of the five-fraction sedimentary Fe in the three sediment cores of the Danshuei River Estuary, northern Taiwan.
Concentration (%)Percentage (%)
FeSORBFeCDBFeCFAFeDETFeORGTotalFeSORBFeCDBFeCFAFeDETFeORG
The upper estuary (sediment core depth = 36 cm, n = 18)
Min<0.0051.460.310.560.542.920.0549.8310.2815.7016.19
Max0.012.330.560.670.704.260.3154.8213.5219.3219.62
Mean0.001.780.400.590.583.350.1252.8012.1017.3217.66
1 std0.000.280.090.040.050.440.061.541.011.241.21
The middle estuary (sediment core depth = 30 cm, n = 15)
Min<0.0051.620.361.350.774.210.0437.298.0931.0017.77
Max0.011.840.391.480.994.510.1142.469.0233.1622.24
Mean0.001.690.371.400.824.280.0839.658.7232.7418.95
1 std0.000.060.010.050.070.090.021.280.270.741.44
The lower estuary (sediment core depth = 26 cm, n = 13)
Min<0.0051.750.480.810.633.690.2443.8612.6820.2516.71
Max0.021.950.560.930.874.170.5048.2513.9022.7920.96
Mean0.011.880.530.870.724.010.3146.7113.1721.8017.98
1 std0.000.050.030.040.070.140.111.320.380.761.27
Table 3. The concentration and percentage ranges of the five-fraction sedimentary Mn in the three sediment cores of the Danshuei River Estuary, northern Taiwan.
Concentration (mg/kg)Percentage (%)
MnSORBMnCDBMnCFAMnDETMnORGTotalMnSORBMnCDBMnCFAMnDETMnORG
The upper estuary (sediment core depth = 36 cm, n = 18)
Min46.489.759.537.929.7266.916.5233.5921.3012.7810.36
Max56.3117.376.244.037.8317.318.4737.0724.0214.3011.97
Mean48.297.862.538.232.2278.817.4435.3822.5313.6111.04
1 std2.97.74.12.02.516.80.461.050.830.430.42
The middle estuary (sediment core depth = 30 cm, n = 15)
Min46.873.933.543.120.1225.820.4632.7514.4518.588.65
Max54.692.241.949.025.5258.322.1135.6816.2221.1710.50
Mean49.581.837.245.421.3235.221.3134.4815.3119.329.58
1 std2.05.62.91.61.410.10.530.990.720.830.74
The lower estuary (sediment core depth = 26 cm, n = 13)
Min48.787.065.740.036.3280.316.3330.8722.1414.2812.74
Max52.596.272.147.040.8302.917.8332.2623.8515.5513.63
Mean50.892.267.243.137.9291.317.0931.4723.1715.0513.21
1 std1.13.12.22.21.27.90.410.450.600.360.29
Disclaimer/Publisher’s Note: The statements, opinions and data contained in all publications are solely those of the individual author(s) and contributor(s) and not of MDPI and/or the editor(s). MDPI and/or the editor(s) disclaim responsibility for any injury to people or property resulting from any ideas, methods, instructions or products referred to in the content.