Article

Hydraulic Characteristics and the Adaptability to Water-Level Fluctuation of the Vertical-Slot Fishway


1
Hubei International Science and Technology Cooperation Base of Fish Passage, China Three Gorges University, Yichang 443002, China
2
College of Hydraulic and Environmental Engineering, China Three Gorges University, Yichang 443002, China
*
Authors to whom correspondence should be addressed.
Water 2026, 18(3), 432; https://doi.org/10.3390/w18030432
Submission received: 23 December 2025 / Revised: 2 February 2026 / Accepted: 4 February 2026 / Published: 6 February 2026
(This article belongs to the Special Issue Ecohydraulics and Fish Behavior Simulation)

Abstract

This study explored the hydraulic characteristics and the adaptability to water-level fluctuations of the vertical-slot fishway. The maximum allowable water depth difference between the entrance and exit was calculated for a one-entrance fishway and two-entrance fishways with different entrance distances (100 m, 200 m, 300 m) under insufficient entrance water depth, with a fishway slope of 2% and an exit water depth of 2.5 m. It was found that the maximum allowable water depth difference between the 1# entrance and exit of the two-entrance fishways (0.71 m, 0.85 m, 0.93 m) was greatly larger than that of the one-entrance fishway (0.48 m). Additionally, the maximum allowable water depth difference in the two-entrance fishway increased with the increased distance between the two entrances. The relationship between the maximum allowable water depth difference and the distance of the two entrances followed a logarithmic function. We suggested that the 2# entrance should be at least 1.6 m when the water depth of 1# entrance was decreased to 1.8 m. When the water depth of the 1# entrance was gradually decreased to 1.6 m, the water depth of the 2# entrance also gradually decreased to 1.2 m. The distance between the 1# entrance and 2# entrance subsequently changed. It was noteworthy that the conclusions proposed in this study were strictly limited to vertical-slot fishways with a slope of 2%, exit water depth of 2.5 m, similar geometric parameters, and target cyprinid species. Furthermore, different slopes or exit water depths should be studied to extend the relationship by introducing correction coefficients from subsequent studies. This study can provide references for the design and optimization of future fishway projects.

1. Introduction

The constructions of hydraulic structures have greatly disrupted the longitudinal connectivity of river systems and impacted the migration of fish and the exchange of gene communication [1,2,3]; fishways have been globally implemented to mitigate the impact on fish migration [4,5,6]. Fishways enable fish to migrate both upstream and downstream through them, thereby facilitating the replenishment of fish populations and the preservation of fish diversity [7,8]. Diverse types of fishway designs were proposed and explored, including vertical-slot fishways (VSFs) [9], pool–weir fishways [10], Denil fishways [11], nature-like fishways (NLFs) [12], etc. Among these, VSFs offer distinct advantages of uniform velocity distribution, moderate turbulent intensity, and strong adaptability to water level variations [13,14]. Currently, numerous studies have been carried out to design the fishway slope [15], optimize the hydraulics of fishway pools [5], and determine the location of fishway entrances [16].
Water depth at the VSF entrance section is an important factor that affects the hydraulic characteristics of fishways [17]. When the water depth at the exit section of the VSF was consistent with that at the entrance section of the VSF, uniform water depth profiles (Figure S1) could be formed in the VSF, and the water drops (ΔH) were the same in all the slots and equal to the elevation difference in the cross-walls (ΔZ); this equilibrium condition resulted in the same mean water depths (h0) in all fishway pools [18]. However, all constructed fishways were subject to the hydrological variability of the rivers, and thus uniformity is seldom observed under natural conditions [19]. Non-uniform water depth profiles (Figure S1) caused a range of different drops between all pools (ΔH ≠ ΔZ), including drawdown profiles (ΔH > ΔZ) and backwater profiles (ΔH < ΔZ). When the water depth at the fishway exit is less than that at the entrance, the water depth profile along the fishway presents a drawdown profile (M2). Furthermore, the greater the water depth difference between the exit and entrance, the more pools were affected by the drawdown profile [20]. This leads to an insufficient water depth at the fishway entrance, thereby producing high velocities [21] and turbulence [22], which may limit the fish entry or pass the fishway [23,24,25]. Therefore, when the water depth at the fishway exit is less than that at the entrance, it was important to determine the maximum allowable water depth difference between the entrance and exit that assists fish in upstream migration.
The maximum allowable water depth difference between the entrance and exit was a dynamically permissible threshold [26,27] for water depth that integrated fish migration and the hydraulic characteristics of the fishway [28,29]. It varied dynamically with factors such as the fishway slope and exit water depth (under the assumption that the fishway discharge rate varied only with changes in the exit water depth) [30]. However, if the water level fluctuated frequently, particularly in daily regulation reservoirs, the operating conditions resulted in a water depth difference between the fishway entrance and exit exceeding its maximum allowable threshold [14], which would hinder fish migration. In order to mitigate the aforementioned situation, one approach to improve the fishway adaptability to water level fluctuations and increase the maximum allowable threshold of water depth difference between the entrance and exit was to install multiple-level fishway entrances [31], which might minimize the local hydraulic conditions that impede the passage of fish [32]. Therefore, the differences in hydraulic characteristics between two-entrance and one-entrance fishways under non-uniform profile conditions should be studied.
During the operation of the fishway, an insufficient water level at the entrance and high water level at the exit are commonly observed. This study mainly focused on addressing these issues. Our research objective was to investigate the differences in adaptability to water level fluctuations of fishways with different entrance distances between the two entrances and a one-entrance fishway under non-uniform water depth conditions. To achieve this objective, this study fixed the fishway slope and exit water depth to eliminate the interference of other factors in the numerical simulation. We systematically analyzed the distribution of the hydraulic characteristics of the two types of fishways, including the water depth along the fishway, flow velocity at the vertical slots, turbulent kinetic energy and turbulent kinetic energy dissipation rate, under different working conditions. Combined with the swimming performance of the target fish species, the maximum allowable water depth difference between the entrance and exit of the two-entrance fishway under different entrance distances was obtained, and the relationship between the maximum allowable water depth difference and the entrance distance was further revealed. Our findings can serve as an important reference for optimizing the design of vertical-slot fishways with large water-level fluctuations, while proposing a reference for other hydropower stations to improve fishway efficiency.

2. Materials and Methods

2.1. The Structure of Fishway

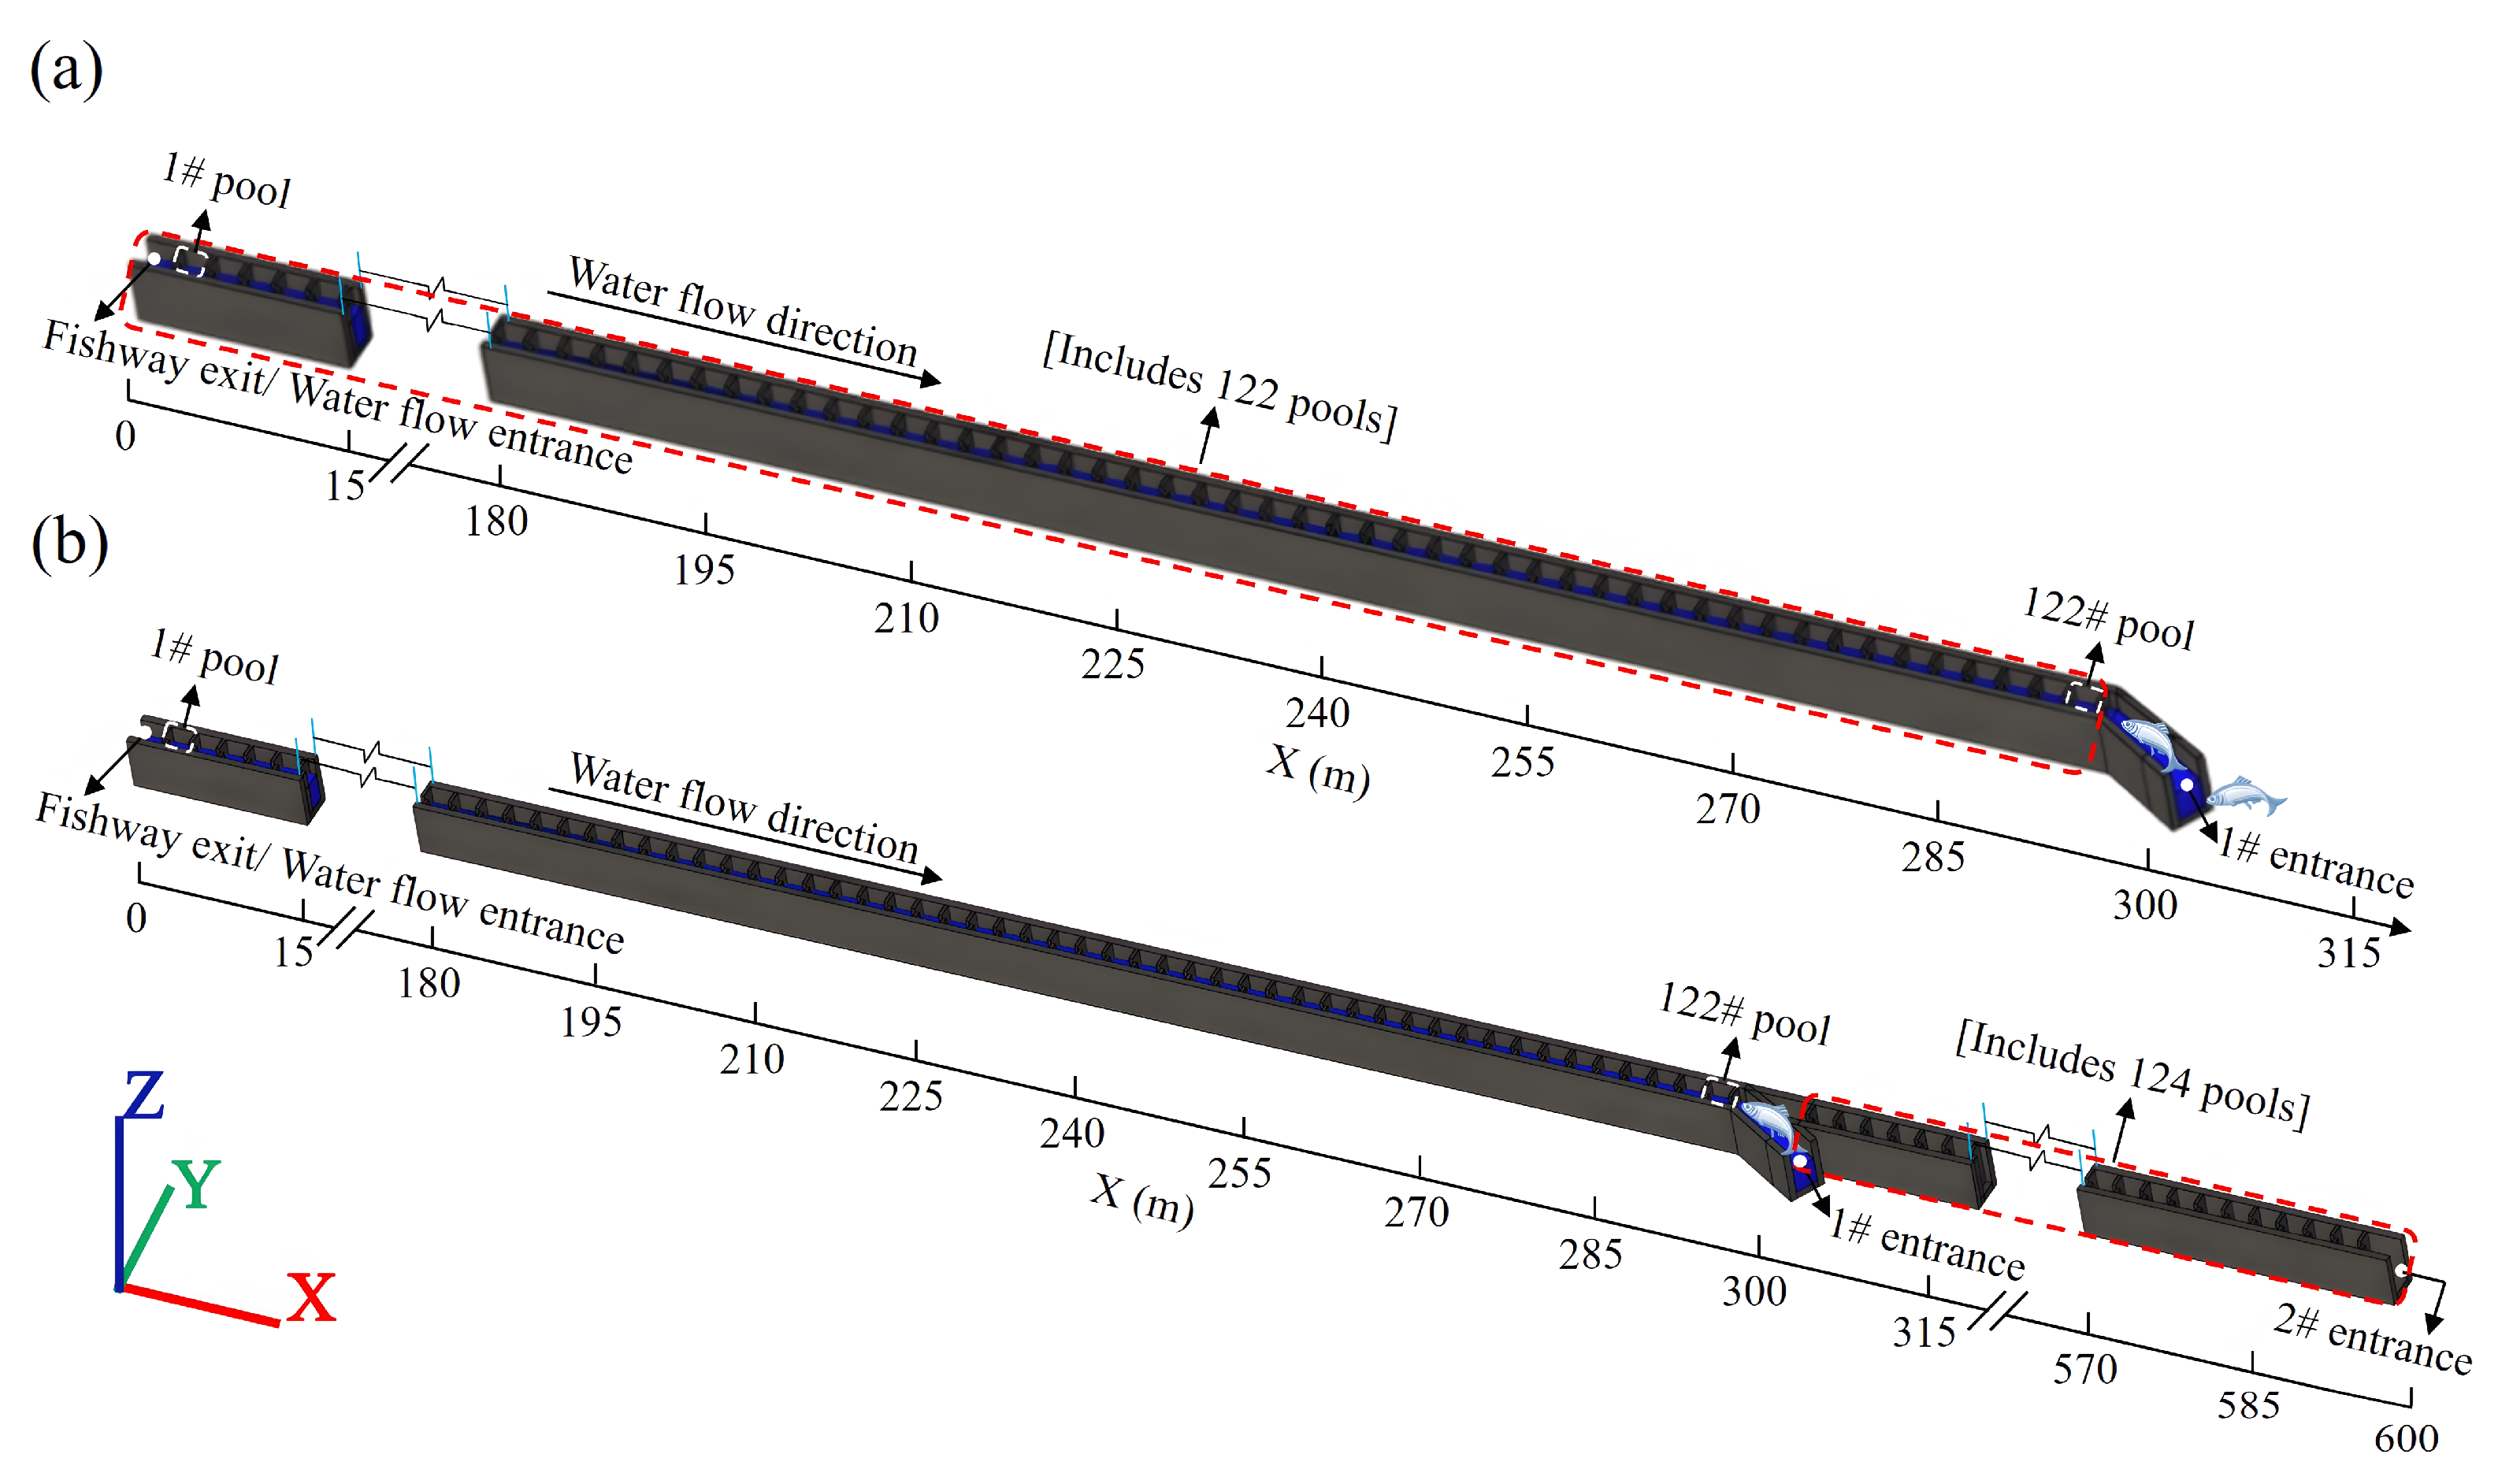
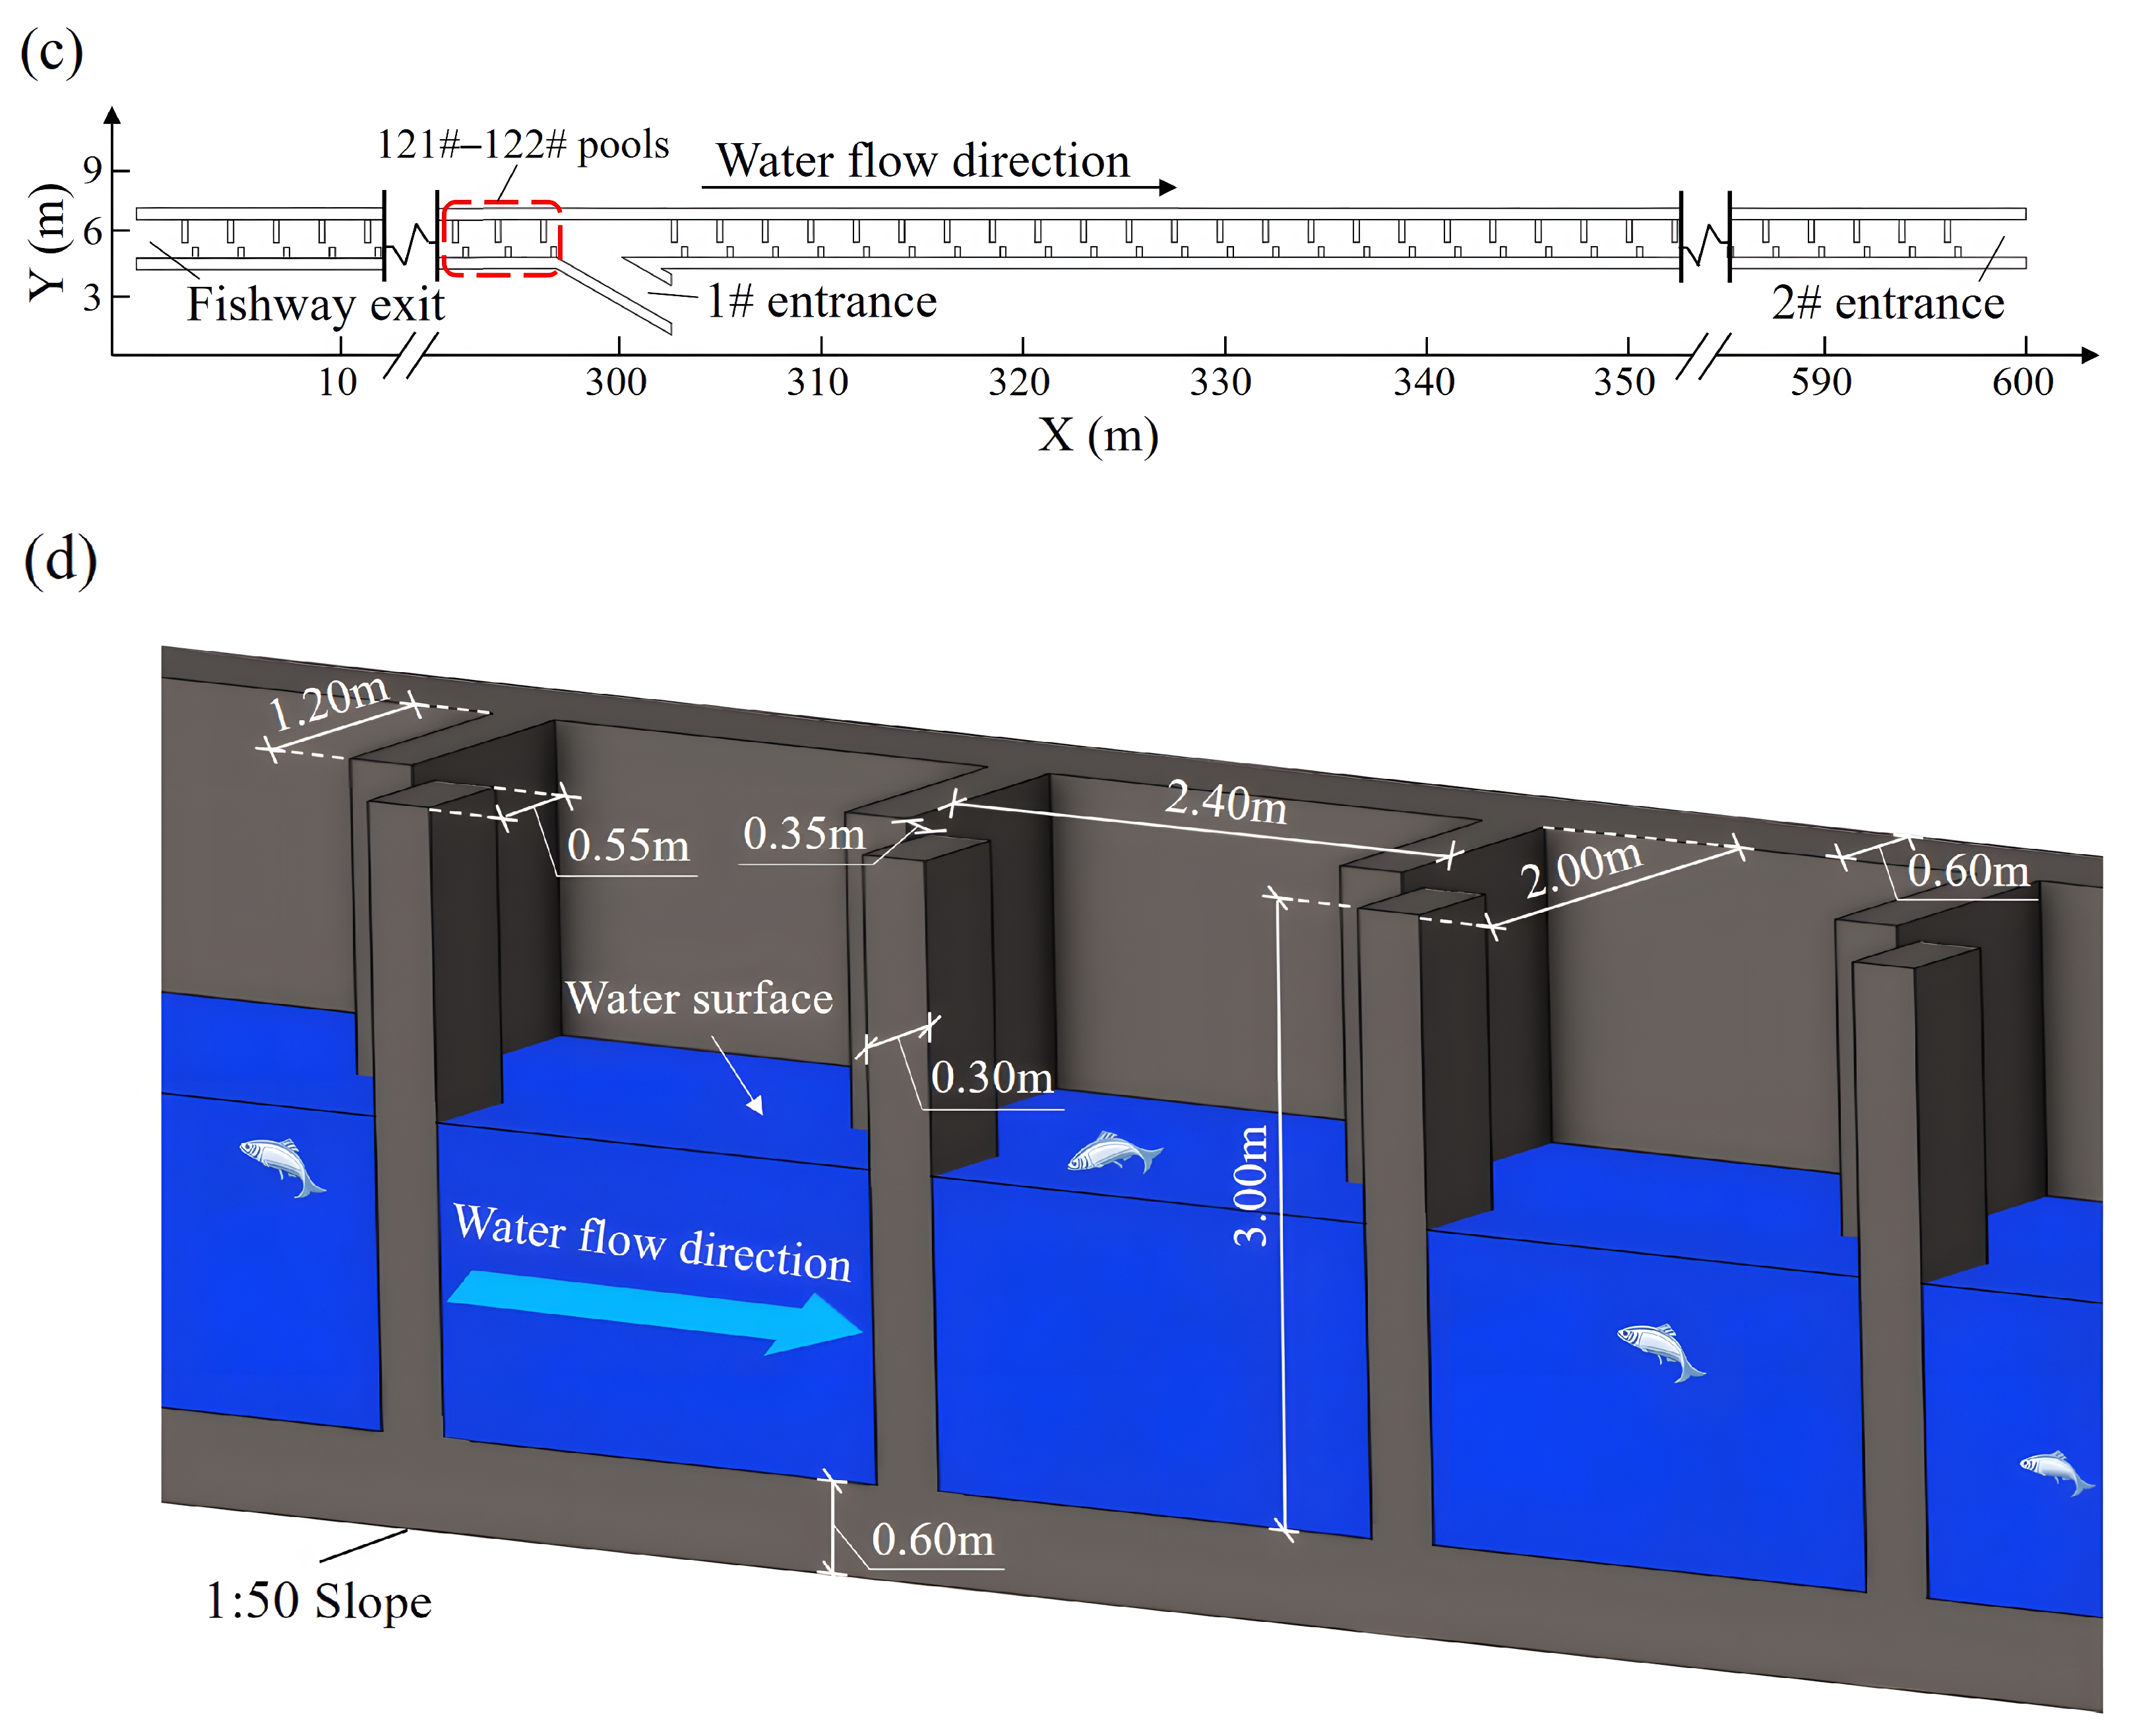
This study took the DB hydropower station for contextual framing, which is a typical representative of hydropower projects in high-altitude areas of southwestern China. The project has a high head and large water-level fluctuation [33,34]. The fishway had a total length of 300 m, consisting of 122 pools, one entrance (1# entrance), and one exit (Figure 1a). The slope of VSF was 2%; the length, width, height, and vertical-slot width of the fishway pool were 2.4 m, 2.0 m, 4.0 m, and 0.35 m, respectively (Figure 1d). To reveal the variation characteristics of the water depth profile, resting pools and turning sections were not incorporated into the fishway.
Compared with the one-entrance fishway, the two-entrance fishway exhibited an adaptability to water-level fluctuations, but the specific magnitude of this improvement remained unclear. Therefore, to quantify the difference in adaptability to water-level fluctuations between the two types of fishways, this study established a two-entrance fishway model based on the prototype of a one-entrance fishway. Specifically, an additional fishway entrance (2# entrance) will be constructed at varied downstream distances from the 1# entrance, converting it into a two-entrance system. The layout of the extended fishway including two entrances is shown in Figure 1b. Compared with the fishway shown in Figure 1a, it was extended by 300 m after the 1# entrance, thereby adding 124 additional pools and a new entrance (2# entrance), whose plan view is shown in Figure 1c.
Taking the designed water depth as a reference, the entrance water depth of the fishway was gradually reduced until the hydraulic characteristics in the fishway no longer satisfied the requirements for fish upstream migration. In this study, three different working conditions were set for the one-entrance fishway to explore the hydraulic response. All three working conditions maintained a fixed exit water depth of 2.5 m and a constant discharge to eliminate the interference of irrelevant variables on the research results. Specifically, working condition 1 (mild insufficient entrance water depth) had an entrance water depth of 2.3 m; working condition 2 (moderate insufficient entrance water depth) had an entrance water depth of 2.0 m; and working condition 3 (severe insufficient entrance water depth) had an entrance water depth of 1.8 m. These gradient working conditions allowed us to quantitatively analyze the changes in water depth profiles, slot velocities, turbulent kinetic energy (TKE), and turbulent dissipation rate (TDR) with decreasing entrance water depth, thereby determining the maximum allowable water depth difference between the entrance and exit of the one-entrance fishway.
To verify the difference in adaptability to water-level fluctuations between the two-entrance fishway and one-entrance fishway and investigate the relationship between the distance between the two entrances, this study set the operating conditions of the two-entrance fishway under different entrance distances based on the numerical simulation results of the aforementioned one-entrance fishway. It was noteworthy that the exit water depth was set to 2.5 m and the discharge was maintained at a constant value to eliminate the interference of other irrelevant factors in all working conditions in this study. The calculated working conditions were summarized in Table 1.

2.2. Thresholds of Target Fish Species to the Hydraulic Characteristics

The fishway was constructed to guarantee the migration of fish with short-distance reproductive migration demands. Three native socio-economical important species, Schizothorax oconnori, Schizothorax macropogon, and Schizothorax waltoni, were considered the target fish for the fishway [7], and the length of the targeted fish ranged from 250 to 550 mm. Usually, the flow velocity near the vertical slot was maximum, which should not exceed the burst swimming speed, and the suitable water velocity should be more than the induced swimming speed and lower than the burst swimming speed. The swimming test was carried out to get the fish to an induced swimming speed, critical swimming speed and burst swimming speed. More details about the test method and results can be found in Zeng et al.’s [35] research. Based on our swimming test, the average burst swimming velocity of the three target fish species in this study was varied. To satisfy the requirement that the smallest sexually mature individuals of all the major target fish should be able to pass through the fishway, this study aimed to select target fishes with a standard body length of 250 mm as the main objects. Table 2 presents the results of the relative swimming performances of target fish species. To meet the migration needs of fish, the maximum designed flow velocity in the fishway should be less than the burst swimming speed of fish [36,37]. Therefore, the maximum flow velocity in the fishway should be less than the burst swimming speed of Schizothorax waltoni, with the smallest body length of 250 mm in this study. Based on the above analysis, 1.20 m/s was determined as the maximum swimming speed threshold for target fishes to successfully pass through the fishway in this study [38].
Turbulence was one of the major variables that influenced the performance of fish movement behavior [39]. This was the temporally and spatially dependent heterogeneous motion of rapid flow velocity fluctuations coming from the multiple chaotic water flows [40]. Turbulent kinetic energy (TKE) is a metric that can be used to define the effect of turbulence on fish [41]; excessive turbulence made it difficult for fish to move. Romão et al. [42] reported that the average TKE value for Cyprinidae species passing through the VSF ranged between 0.050 and 0.100 m2/s2. Moreover, Schizothorax oconnori prefer zones with TKE below 0.050 m2/s2 to reduce energy expenditure [43]. Thus, we concluded that, when TKE was less than 0.050 m2/s2 in the fishway, the hydraulic environment would meet the upstream migration requirements of the three target fish species [27,44,45].
The turbulent dissipation rate (TDR) was a crucial hydraulic parameter in fishway design, which directly affected fish migration and the fishway efficiency [46]. An excessively high or inappropriate turbulent dissipation rate could not only impose physiological stress on fish, but also even cause injury or death to fish [47]. Baudoin et al. [48] studied the energy dissipation of VSF and recommended a TDR limit of 150–200 W/m3, with 200 W/m3 for salmon and 150 W/m3 for cyprinid species [49]. For the three cyprinid species selected in this study, we set the threshold of TDR at less than 150 W/m3. Therefore, when the slot velocity of the fishway exceeds 1.20 m/s, the TKE exceeds 0.050 m2/s2, or the TDR exceeds 150 W/m3, which may increase the difficulty for fish migration in this study. It should be noted that the localized exceedance of thresholds may not completely block fish migration, as fish may utilize potential resting zones or alternative paths, especially in two-entrance configurations with higher spatial heterogeneity.

2.3. Numerical Model

Numerical simulations in this study were conducted using the commercial software Flow-3D v12.0 (Flow Science, Inc., Santa Fe, NM, USA), a software that had been successfully applied by many researchers to model complex flows within fishways [50]. Flow-3D employs the FAVOR (fractional area–volume obstacle representation) method based on structured meshes, combined with a finite difference numerical model, offering simplicity in computation, fast convergence, and high stability. The turbulence models include the standard k-ε model, the renormalization group (RNG) k-ε model, and the Large Eddy Simulation (LES) model. As one of the most widely adopted numerical techniques for tracking free surfaces, this study employed the Volume of Fluid (VOF) method [51] to simulate the free surface water flow [52].
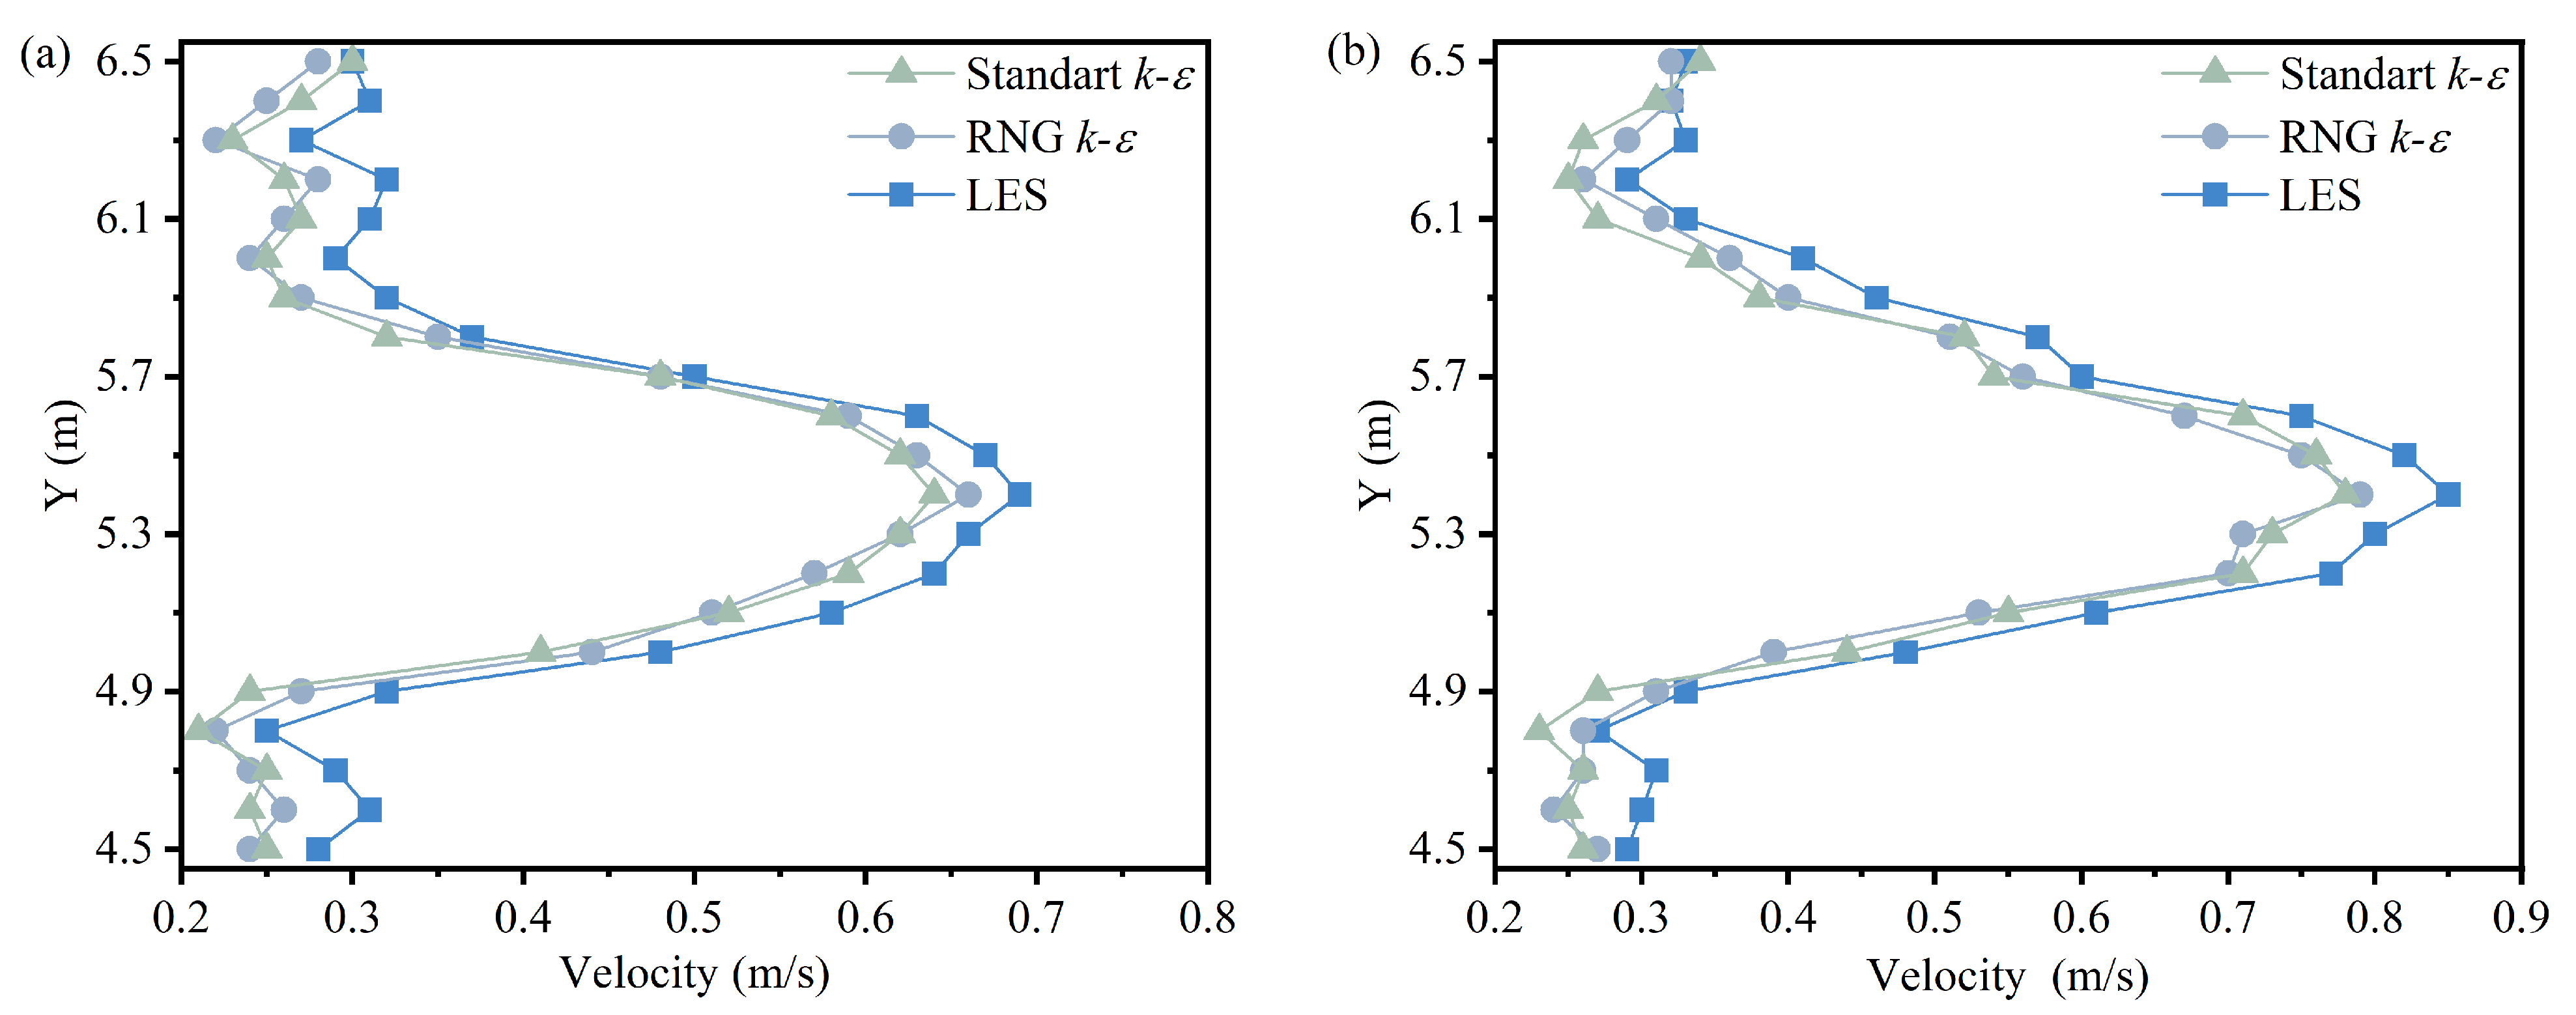
To identify the most suitable turbulence model, simulations were conducted using all three models, and the flow velocities at the cross-sections of X = 200 m and X = 240 for working condition 2 in the numerical simulation were compared (Figure 2). The comparison results showed that, at the cross-section of X = 200 m, the velocities from the LES and RNG k-ε models differed by 8.83%, and the velocities from the RNG k-ε and standard k-ε models differed by 3.89% (Figure 2a), while, at X = 240 m, the corresponding values were 9.41% and 4.03% (Figure 2b), respectively. Compared with the LES model, the standard k-ε model showed a good agreement in velocity simulation results. However, while the standard k-ε model assumed fully developed turbulence, it did not adequately account for strong shear effects. In contrast, the RNG k-ε model introduced additional terms to enhance the simulation of shear-dominated flows. Therefore, the RNG k-ε model was ultimately selected for turbulence simulation in this study, which has proven effective in capturing flow patterns in fishway simulations while maintaining computational efficiency [53,54]. The governing continuity, momentum, and RNG k-ε equations are detailed in the Supplementary Materials, along with the boundary conditions of the numerical model.
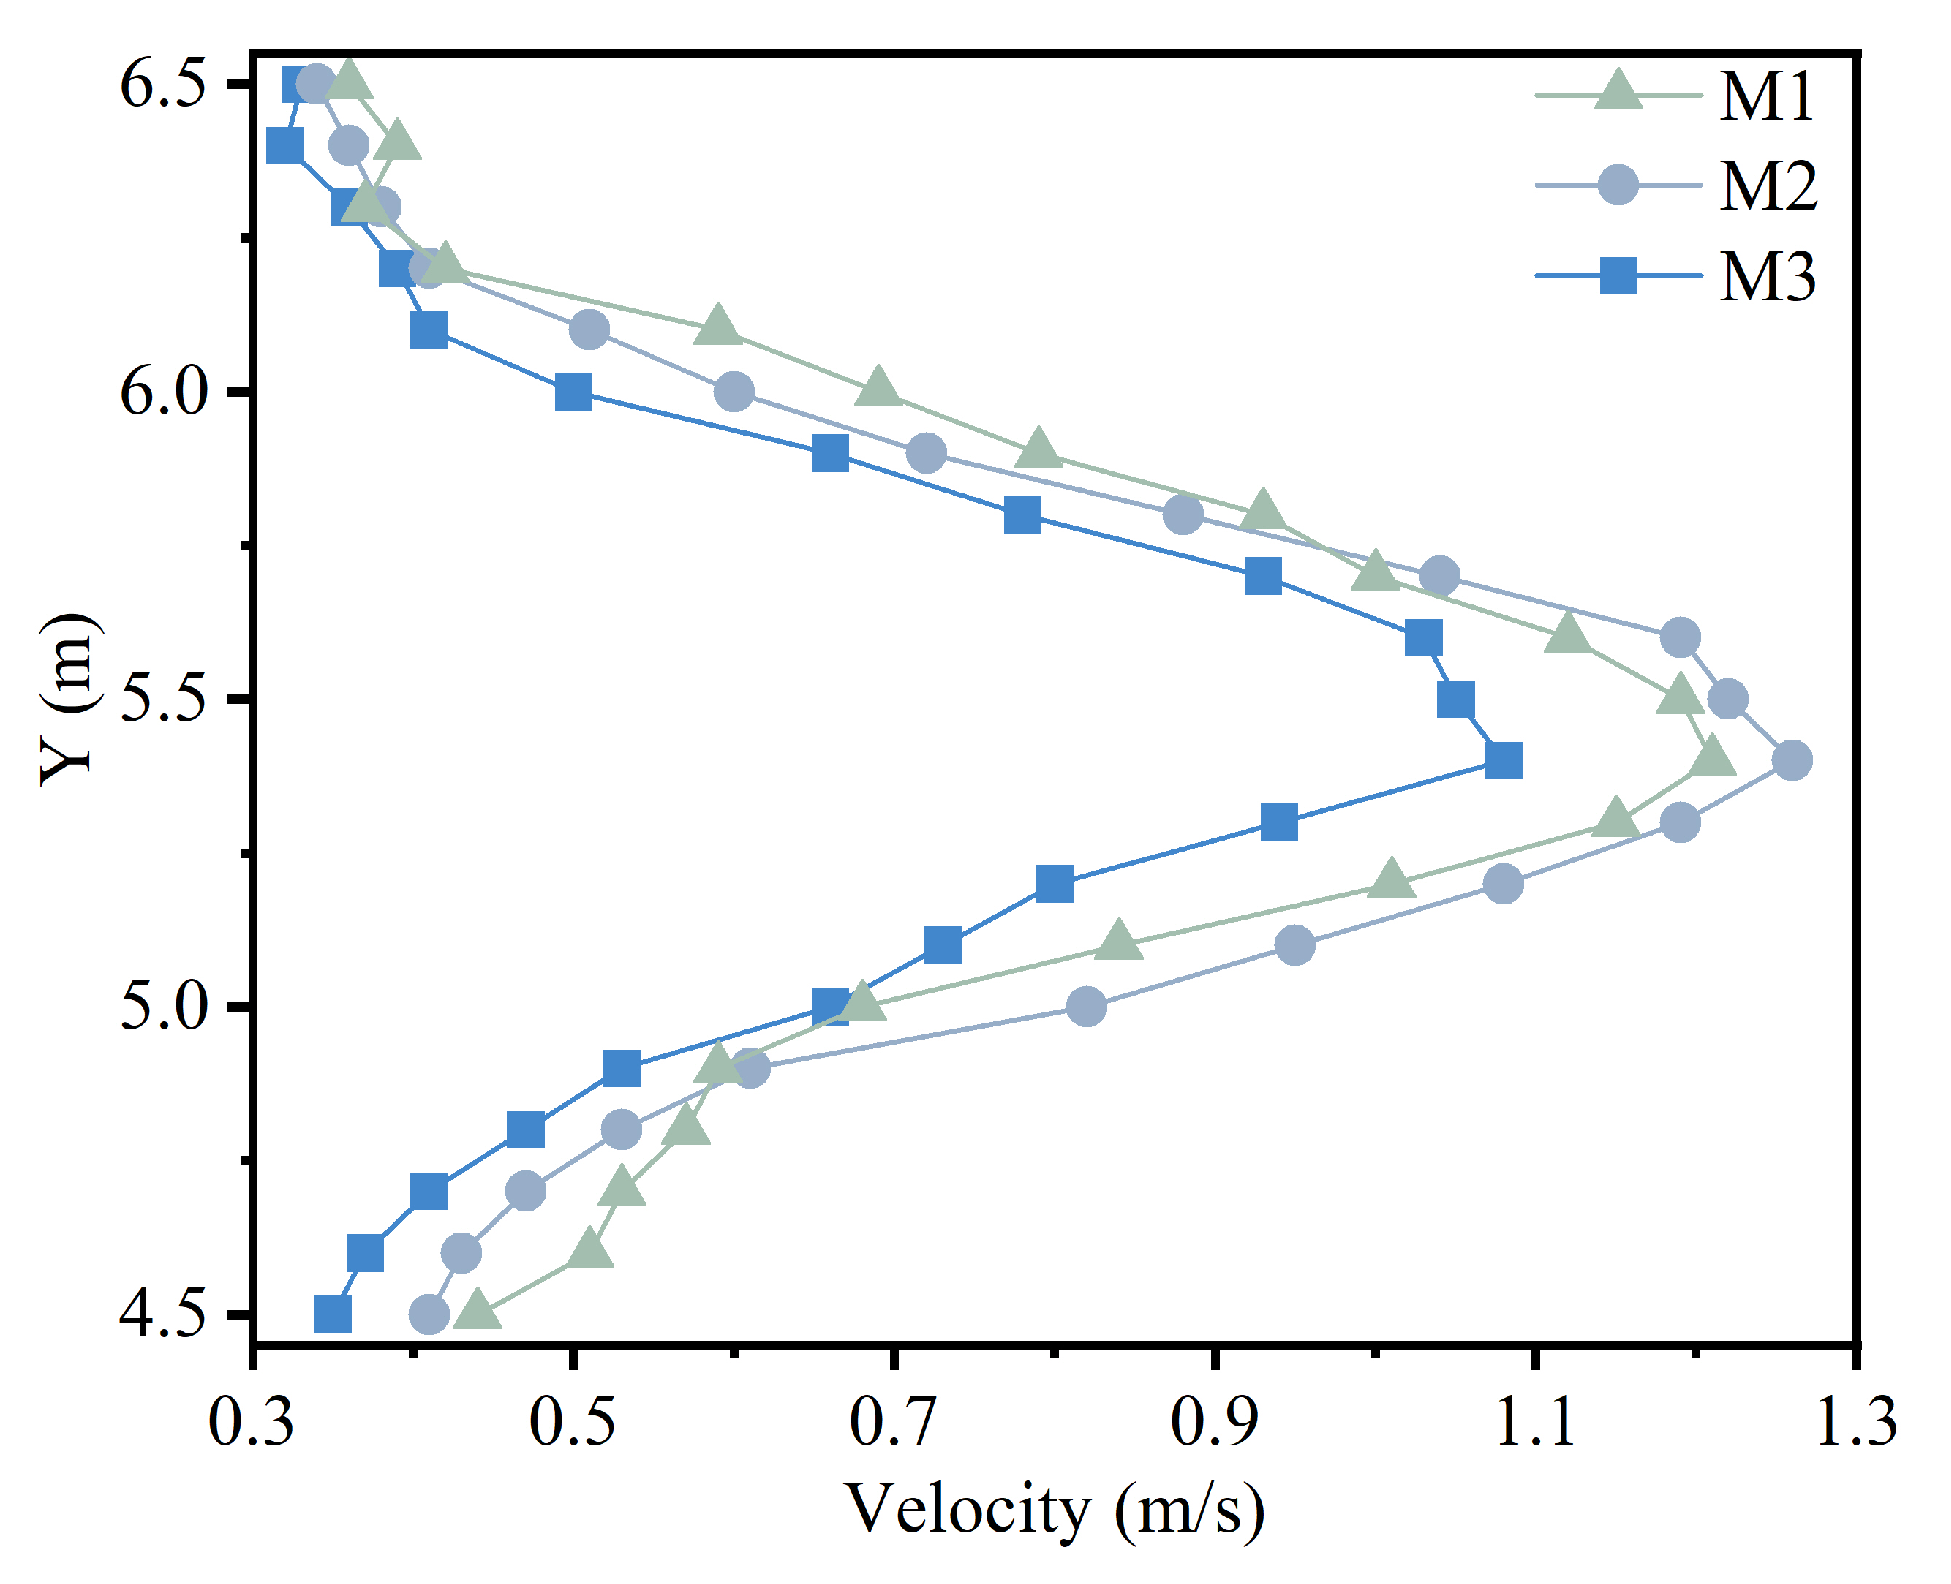
To obtain a mesh independent solution, three meshes with different spatial resolutions were tested, which were addressed as M1, M2 and M3 (Table 3). To validate the accuracy and reliability of the numerical simulation, considering that the variation in vertical slot velocity was most significant near the zone of the fishway entrance when the water depth of the fishway entrance was insufficient [14], we selected the fishway entrance cross-section to verify the model in the numerical simulation in working condition 2. Velocity measurements at 21 points were used to verify the mesh independence. Variations in velocity under different mesh sizes are shown in Figure 3. As the mesh size decreased from 0.16 to 0.12 m, the distributions of velocity gradually converged. Only minor differences were observed between the mesh sizes of 0.12 and 0.08 m, indicating that the simulation results had effectively converged. Although the 0.08 m mesh provided a slightly higher accuracy, the total number of meshes increased by approximately 94.50% (Table 3). Therefore, considering the calculation accuracy and efficiency, the M2 mesh was selected as the calculation mesh [15].
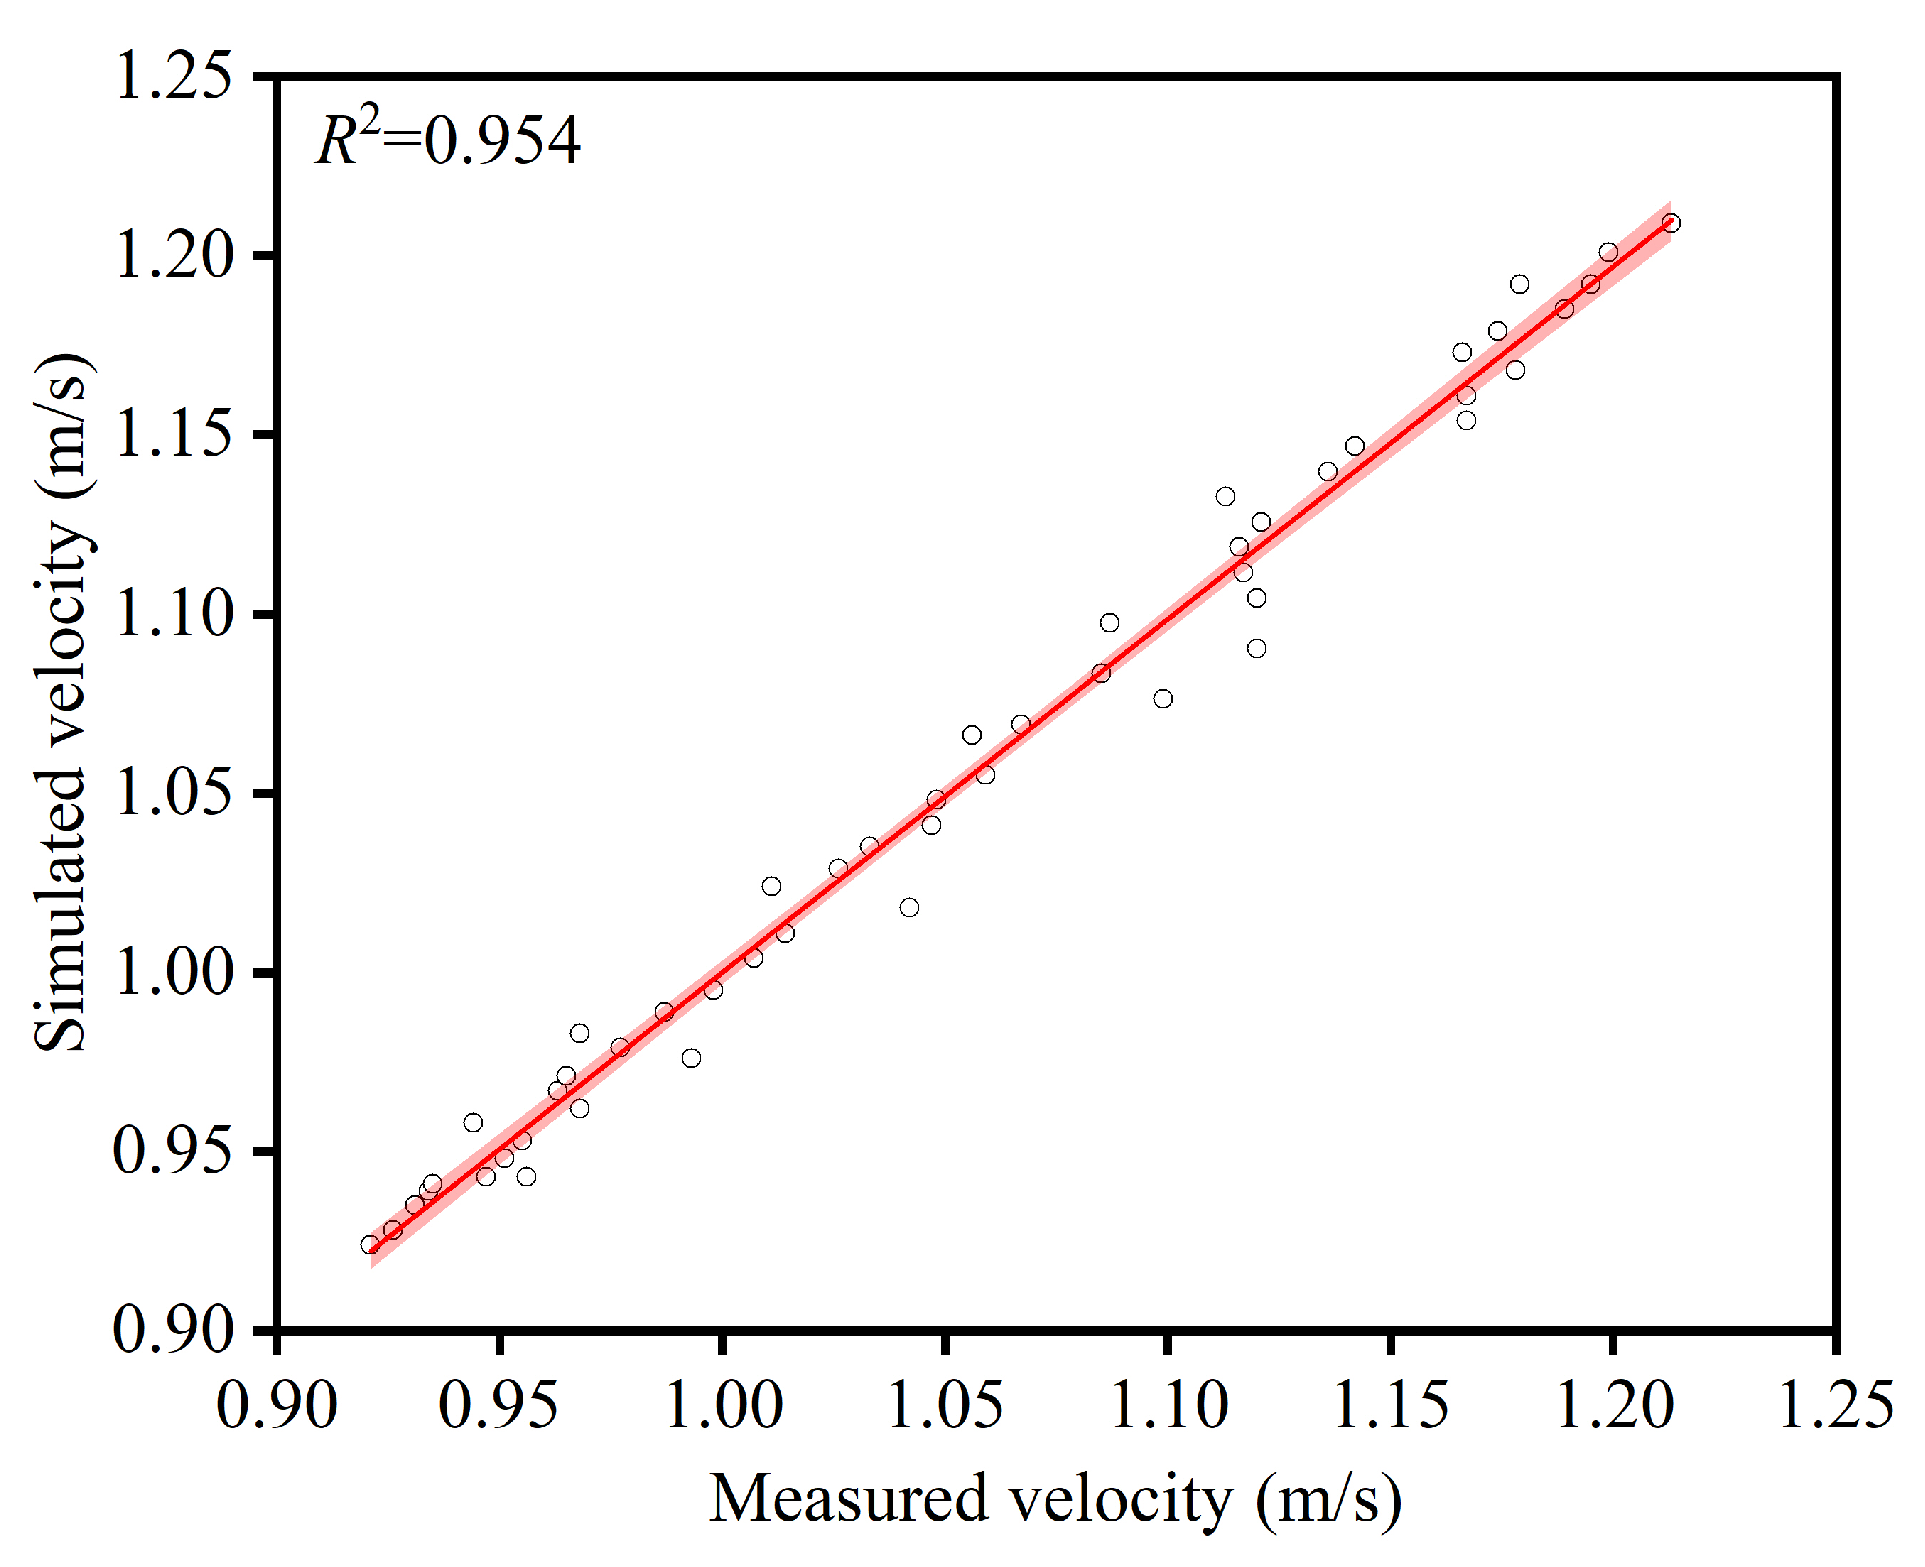
To verify the model, we compared the flow velocity of the zone (X = 180–300 m) in the numerical simulation with that of the corresponding zone measured in the field in working condition 2. To enhance the credibility of the numerical simulation results, the Root Mean Square Error (RMSE) was introduced as a quantitative evaluation index to verify the consistency between the numerical simulation and the measured values. There was a significant correlation between the measured and simulated velocity values (R2 = 0.954, RMSE = 0.65%) (Figure 4). Based on the global verification results, the RNG k-ε model was successfully validated and used to simulate the flow field distribution in this study.

3. Results

3.1. Water Depth Profiles

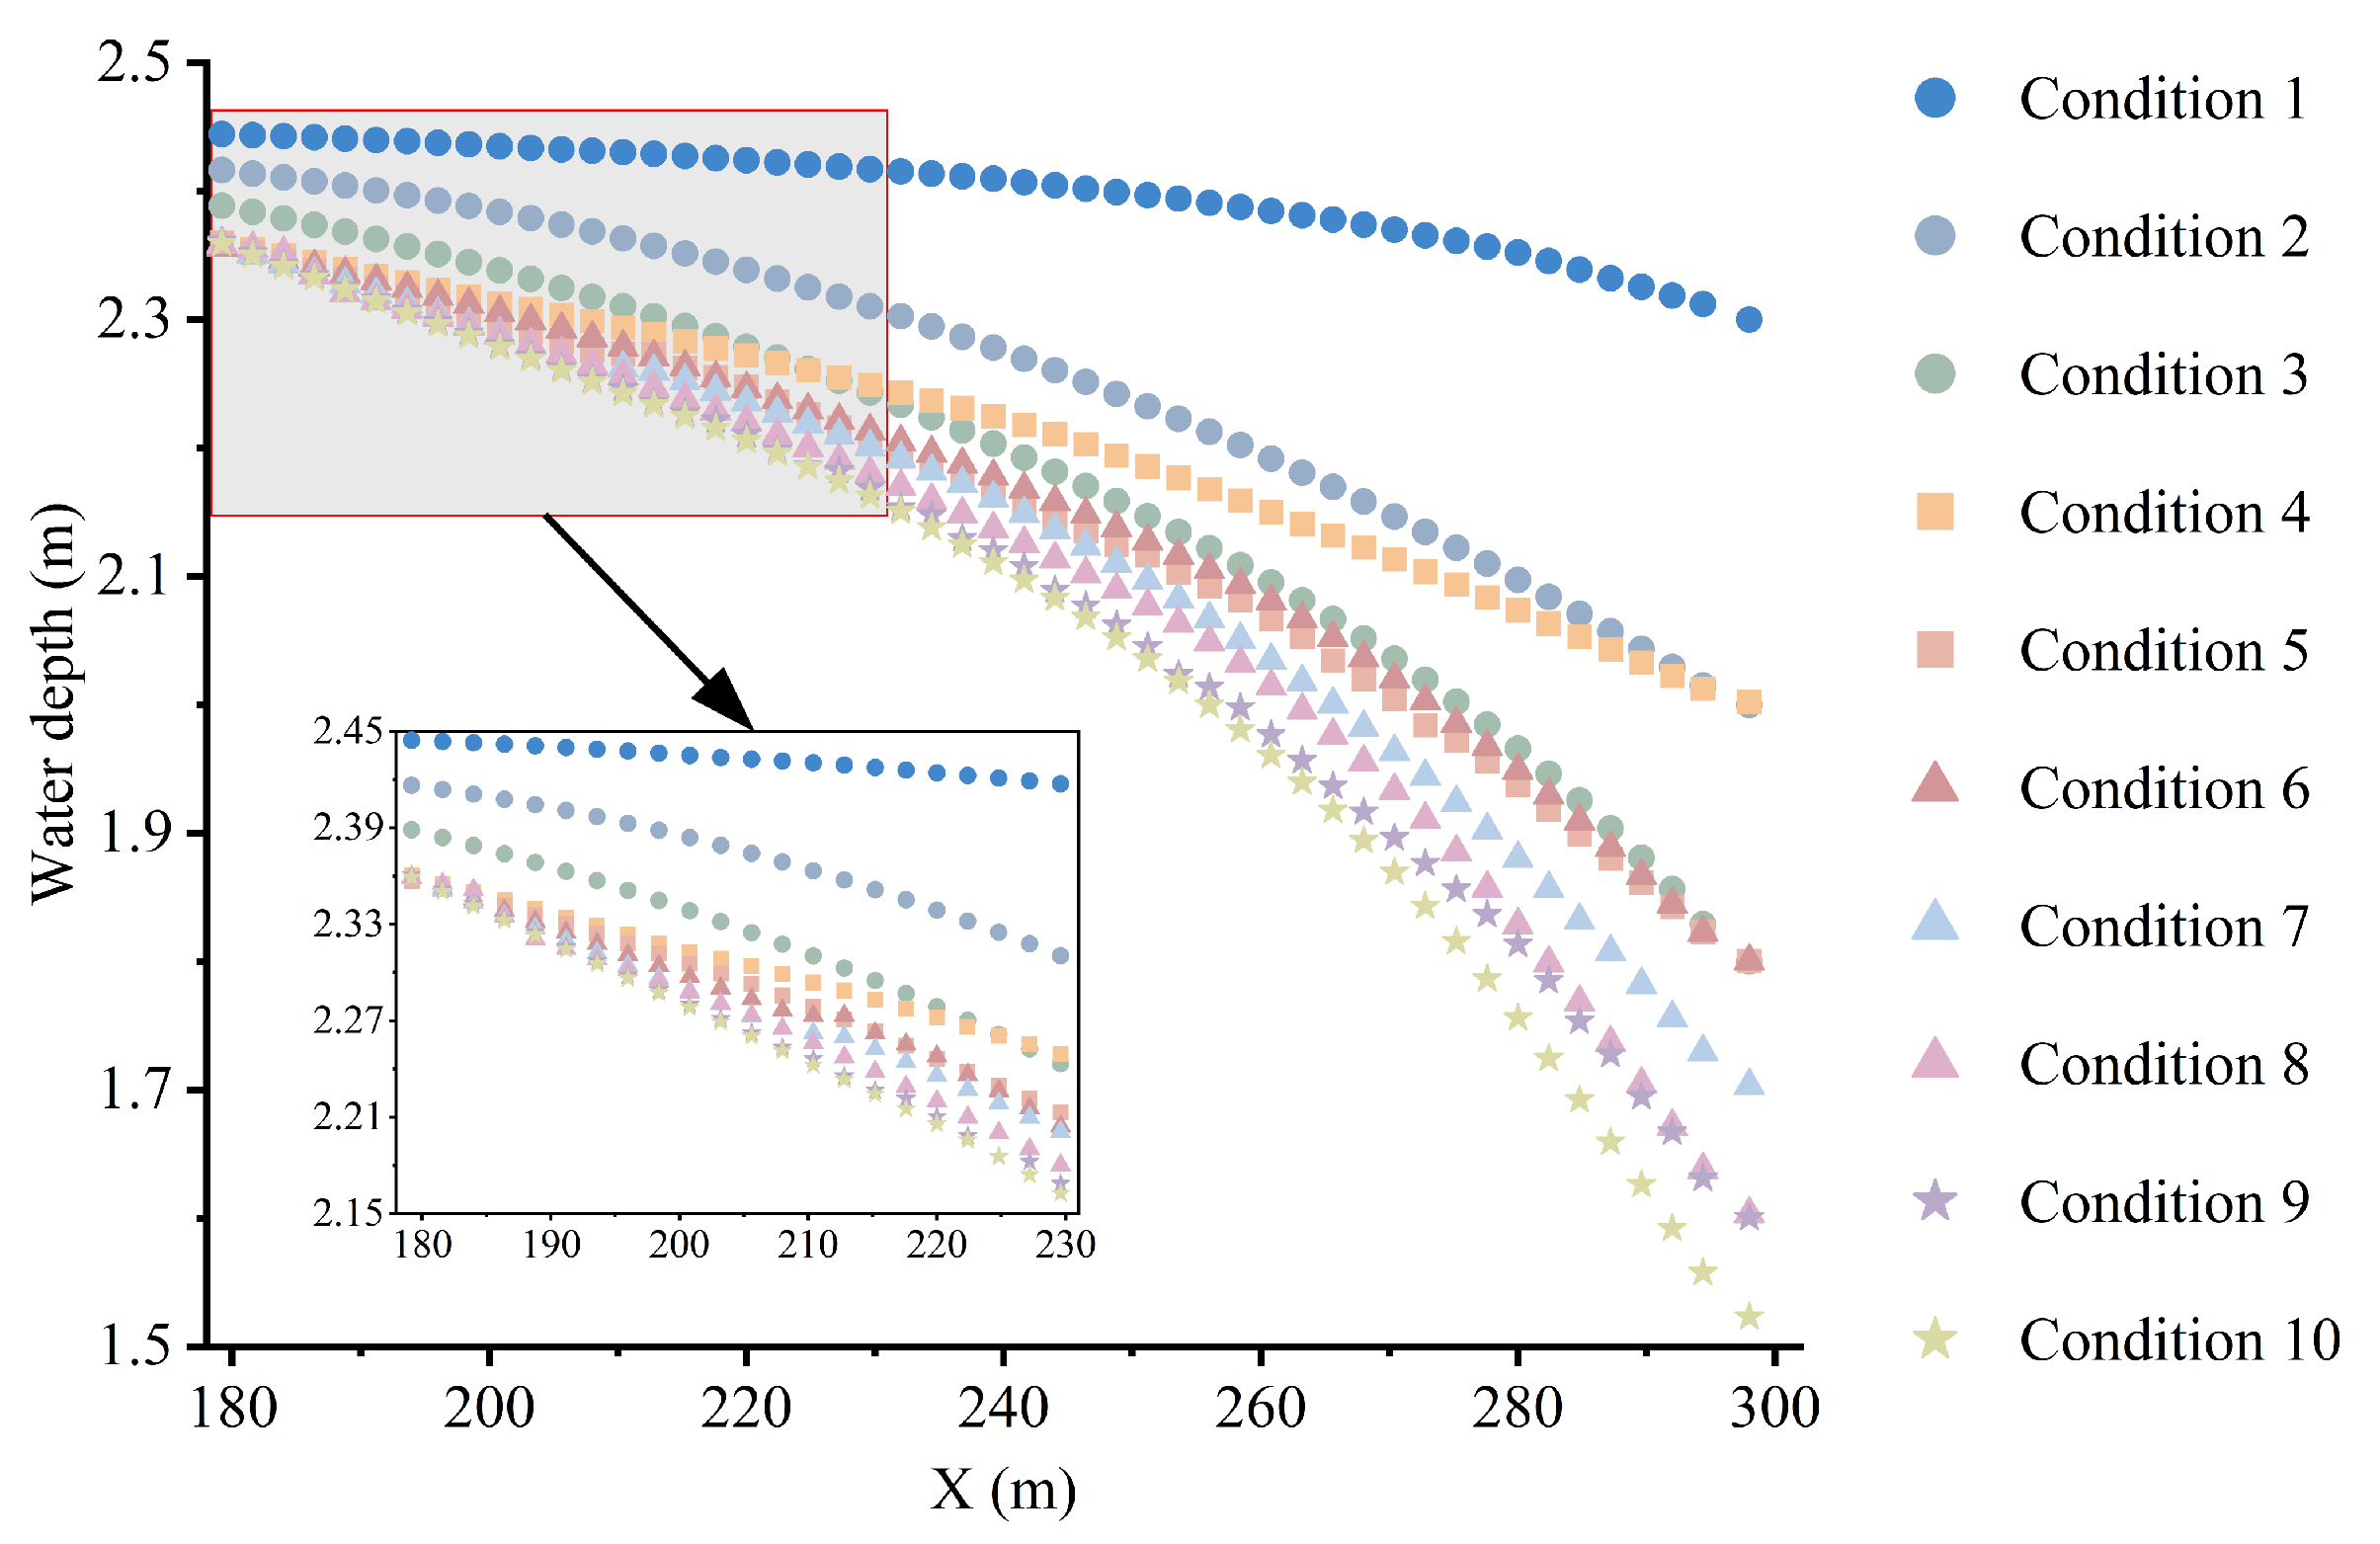
Figure 5 shows the water depth profiles along the longitudinal direction of the fishway. When the water depth of the entrance was insufficient, the longitudinal variation in the water depth profile was predominantly concentrated in the downstream section. As shown in Figure 5, the water depth significantly changed along the x-axis in working conditions 1–3. Taking working condition 3 as an example, the water depth in the VSF pools decreased from 2.39 m to 1.80 m along X = 180 m to the 1# entrance, showing a non-uniform drawdown profile. Due to the insufficient water depth at the 1# entrance, the non-uniform drawdown profile was approximately 110 m, while the affected lengths were 30 m and 80 m in working conditions 1 and 2, respectively. In working conditions 1–3, the water depth difference between two adjacent pools became greater closer to the 1# entrance, which led to a sharp decrease in the water depth of the pools near the 1# entrance, thereby causing a sharp increase in the water velocity and turbulent kinetic energy.
Compared with working conditions 1–3, working conditions 4–10 set an additional entrance (2# entrance), which was downstream of the 1# entrance. The lengths of the fishways affected by the drawdown profiles both exceeded 120 m in working conditions 4–10, and were longer than that in working condition 3, resulting in a sharp drop in the water depth profile and the formation of water drops. Therefore, we need to focus on variations in the hydraulic characteristics of the water depth drawdown section, and avoid the formation of migration barriers that hinder fish movement.
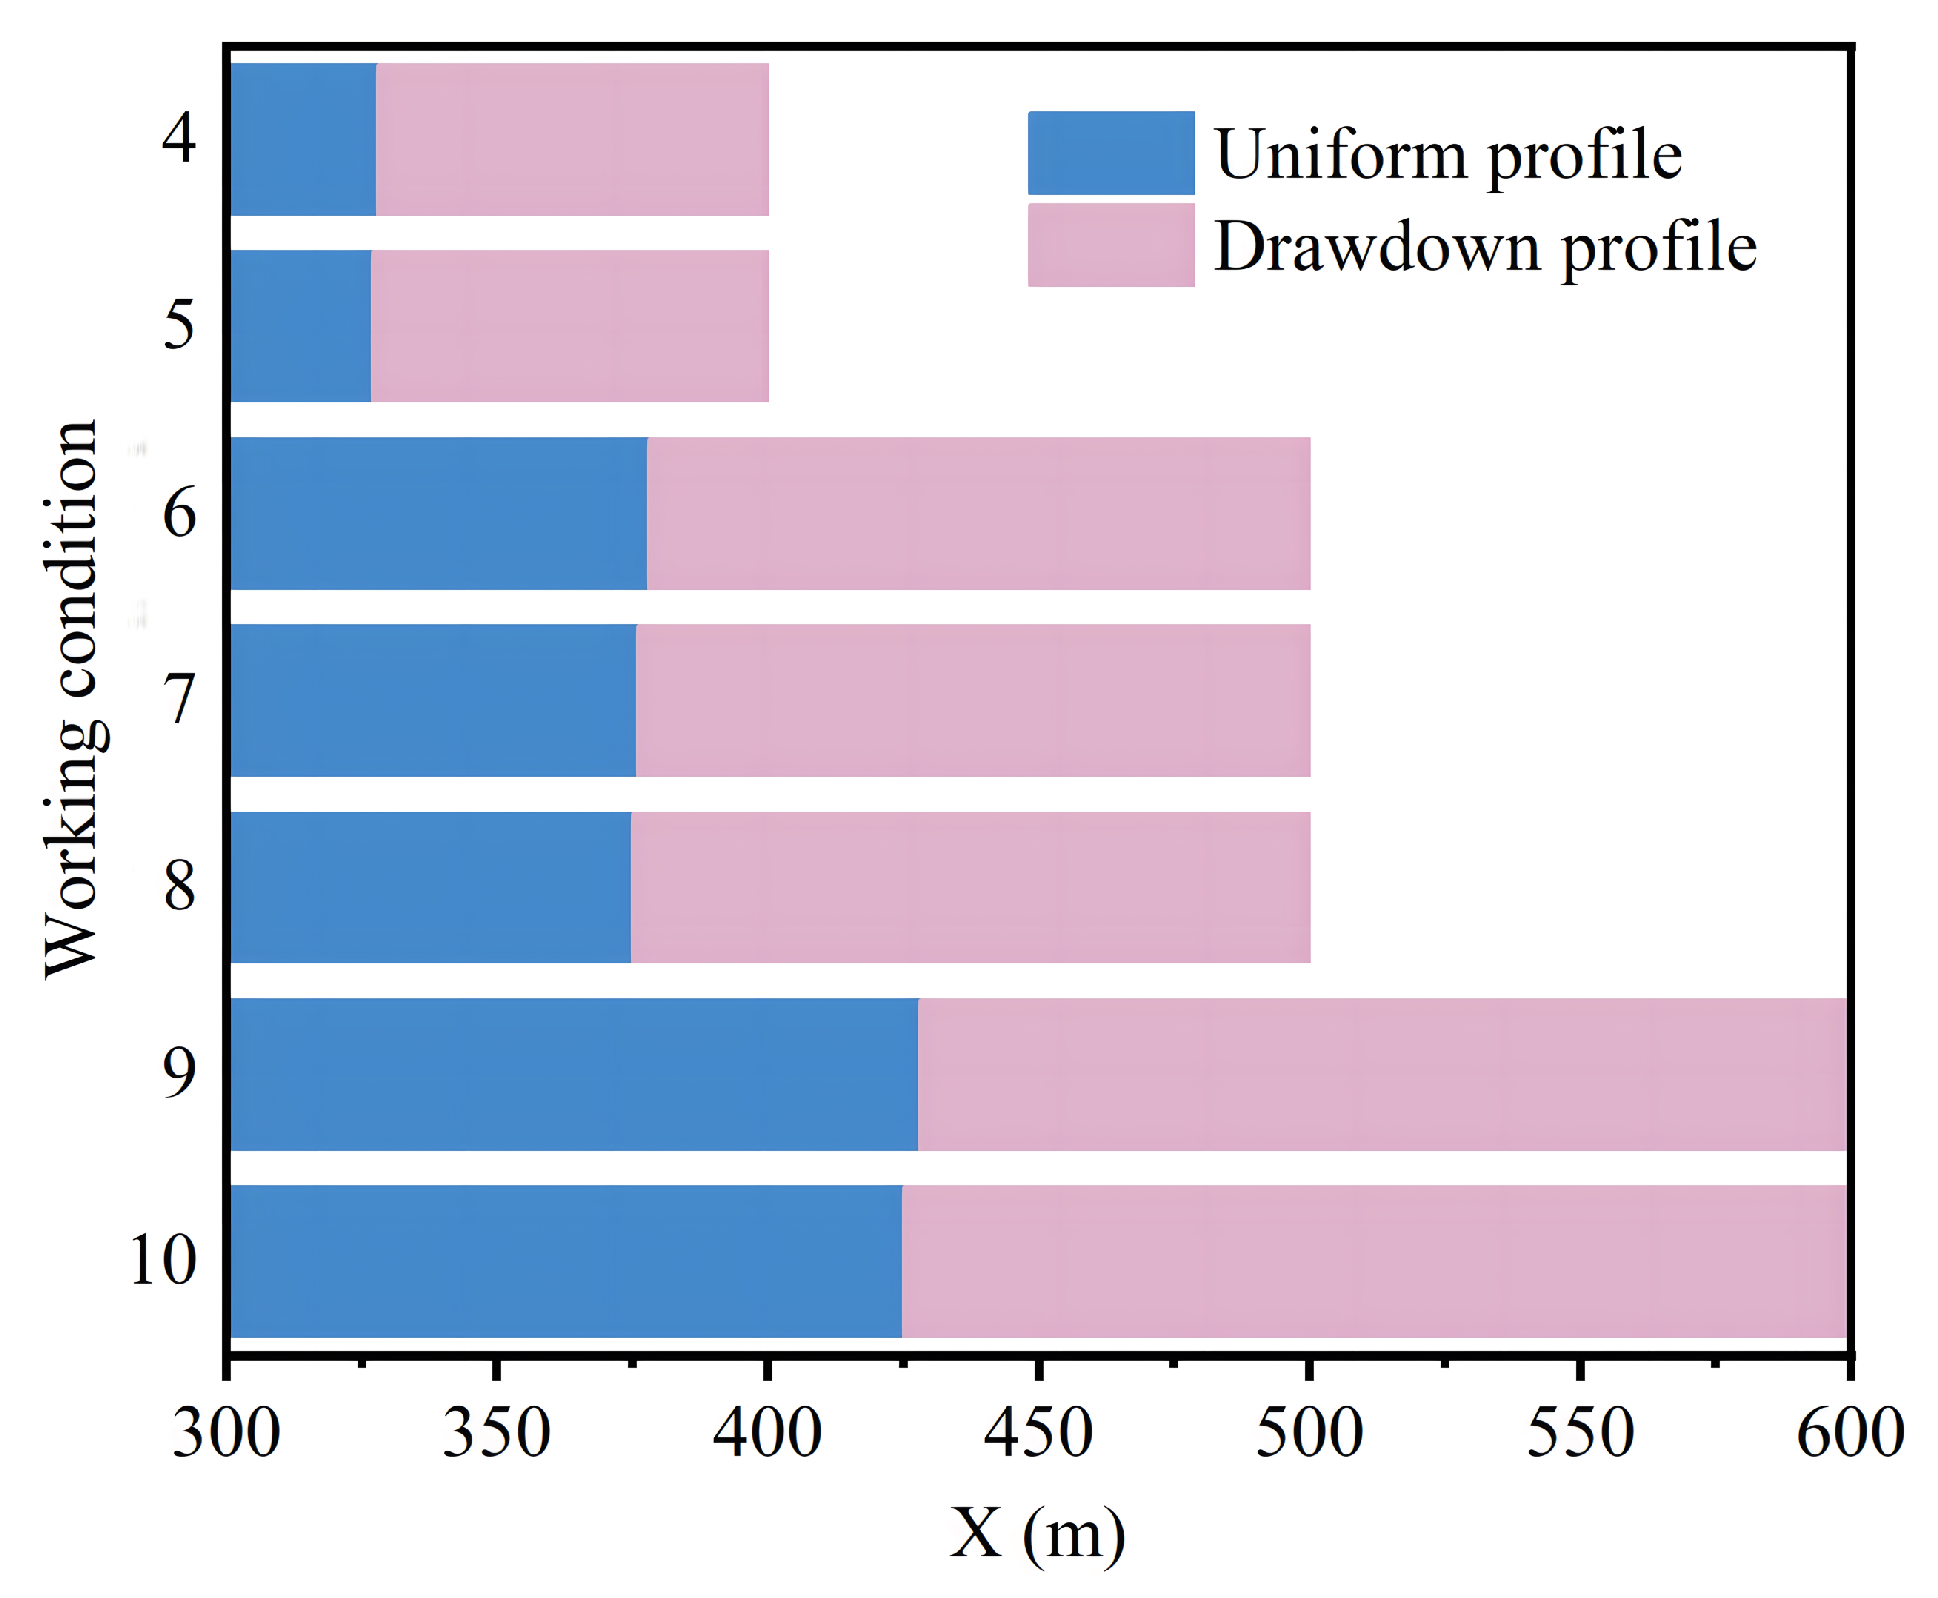
Due to the different distances between the two entrances in seven working conditions (working conditions 4–10), the length of the fishway affected by the drawdown profile varied, and the affected length increased as the distance between the two entrances increased. Taking working conditions 8 and 9 as examples, the water depth at the 1# entrance was the same, at 1.8 m, but the affected length increased from 131 m in working condition 8 to 172 m in working condition 9 (Figure 6). The length affected by the drawdown profile was also related to the water depth at the 1# entrance and 2# entrance, which was negligible compared with that of the distance between the two entrances. When the distances were different between the two entrances (100 m, 200 m, 300 m), the lengths of the fishway affected by the drawdown profile were 70 m, 130 m, and 170 m, respectively, accounting for 70%, 65%, and 57% of the corresponding distances.

3.2. Velocity in the Slots

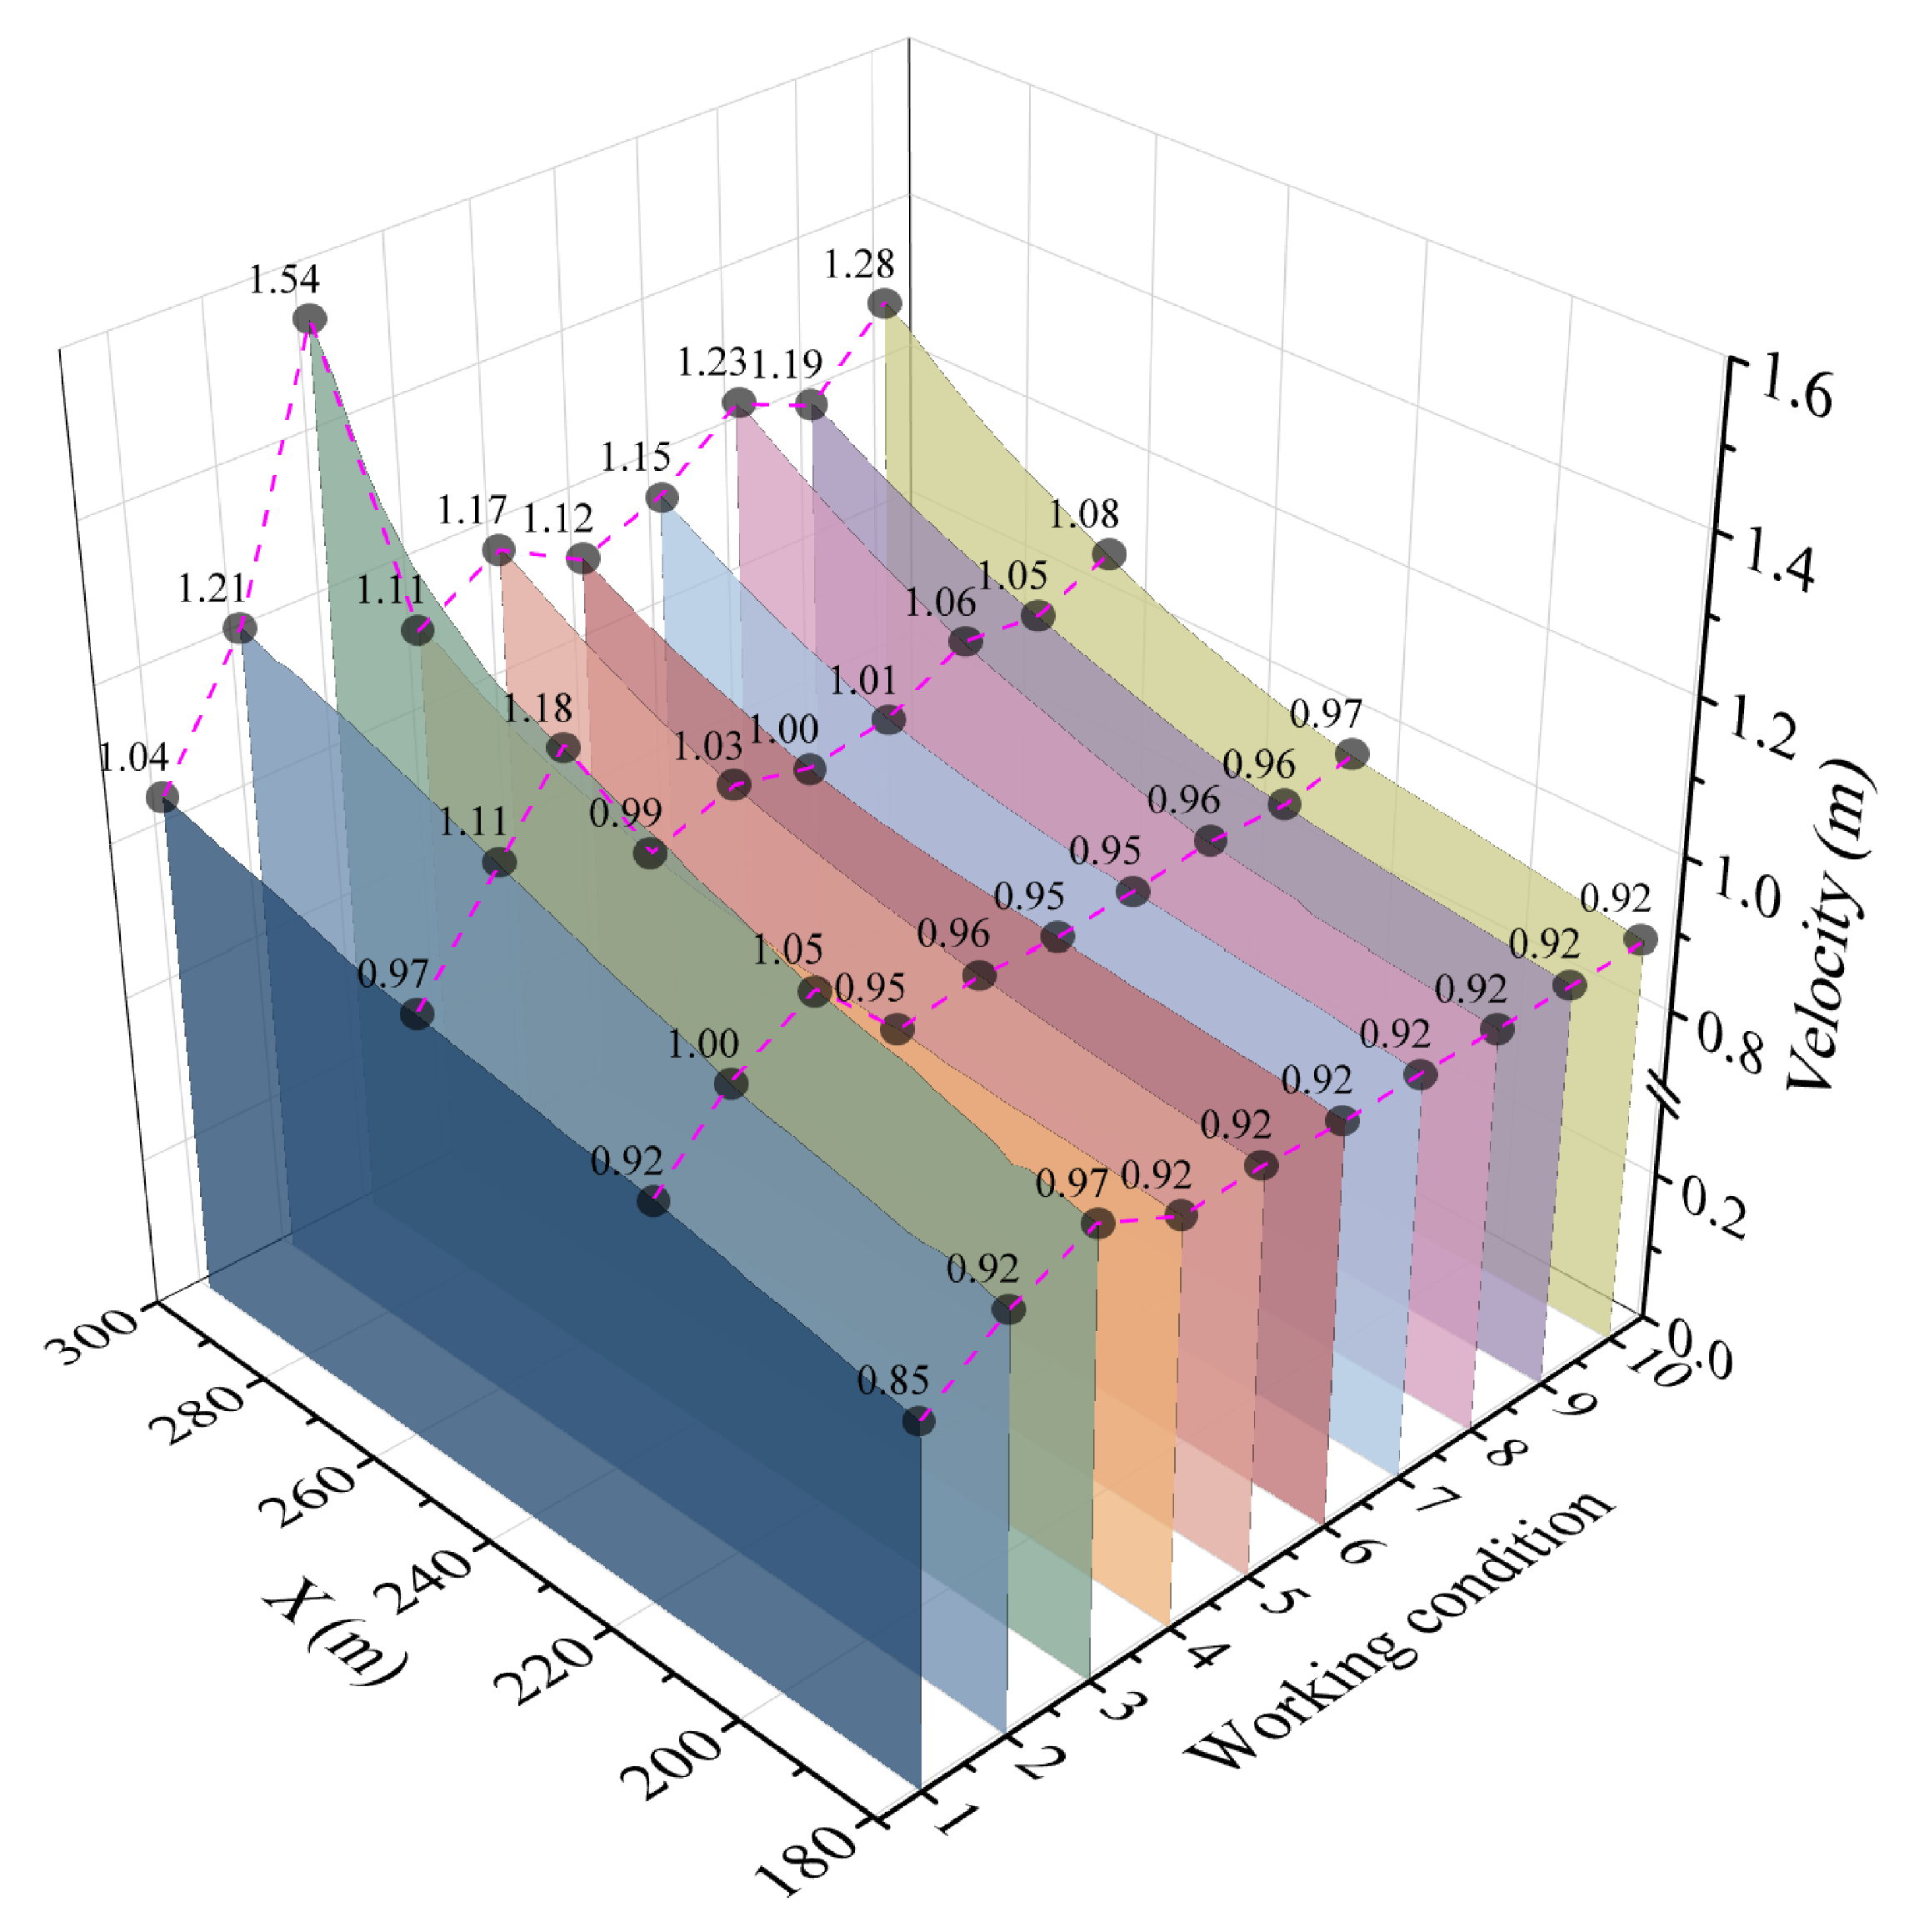
The velocities in the slots of the fishway in the water depth drawdown section in different working conditions are shown in Figure 7. The slot velocities showed an increasing trend along the flow direction in all working conditions. In working condition 1, the velocities in each pool of the fishway were below 1.20 m/s, while the velocities in some pools exceeded the maximum designed velocity of the fishway in working conditions 2 and 3. For example, the velocities in the two pools near the 1# entrance exceed 1.20 m/s in working condition 2. However, due to the significant drop in the water depth, the velocity increased progressively; the slot velocities exceeded 1.20 m/s from X = 260 m to the 1# entrance, reaching a maximum of 1.55 m/s at the 1# entrance in working condition 3, which would increase the difficulty of upstream migration for target fish. It was noteworthy that, in the one-entrance fishway, the slot velocity in some pools exceeded the set threshold (1.20 m/s) in working conditions 2–3. The maximum velocity was also located at the 1# entrance in working conditions 4–10. The maximum velocities reached 1.23 m/s and 1.28 m/s in working conditions 8 and 10, respectively, while the maximum velocities were below 1.20 m/s in working conditions 4, 5, 6, 7, and 9 (Figure 7).
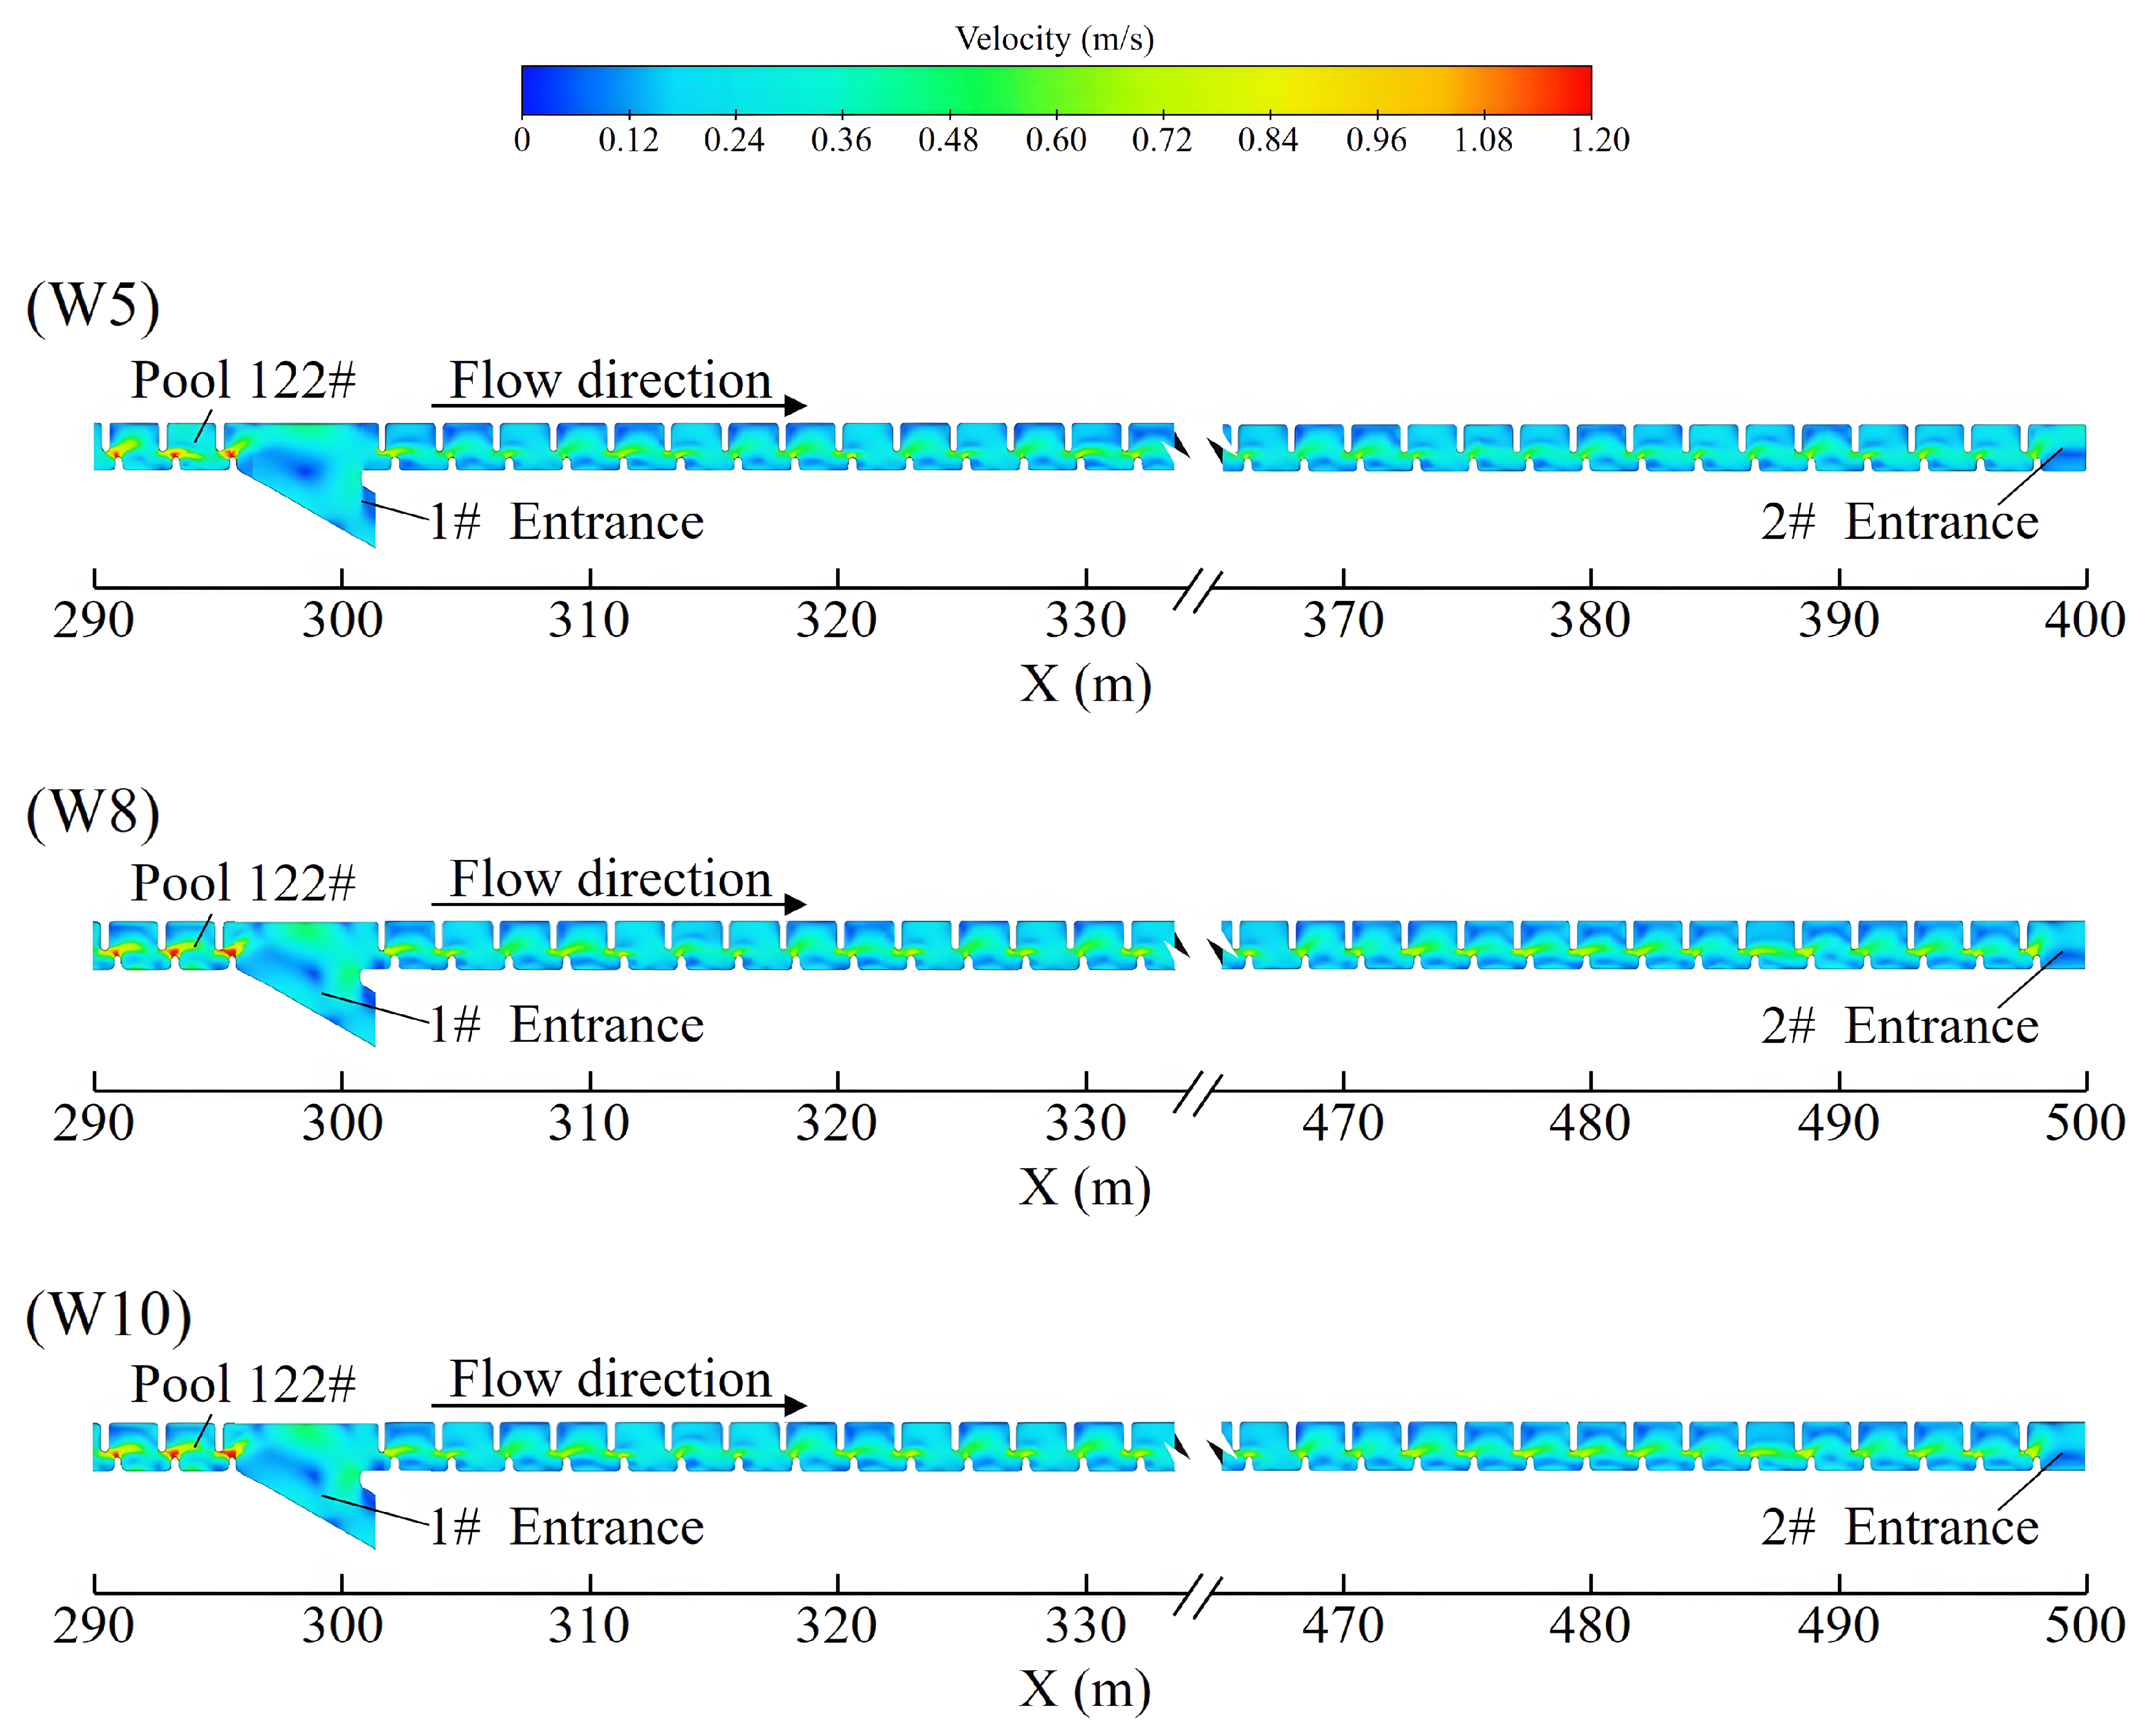
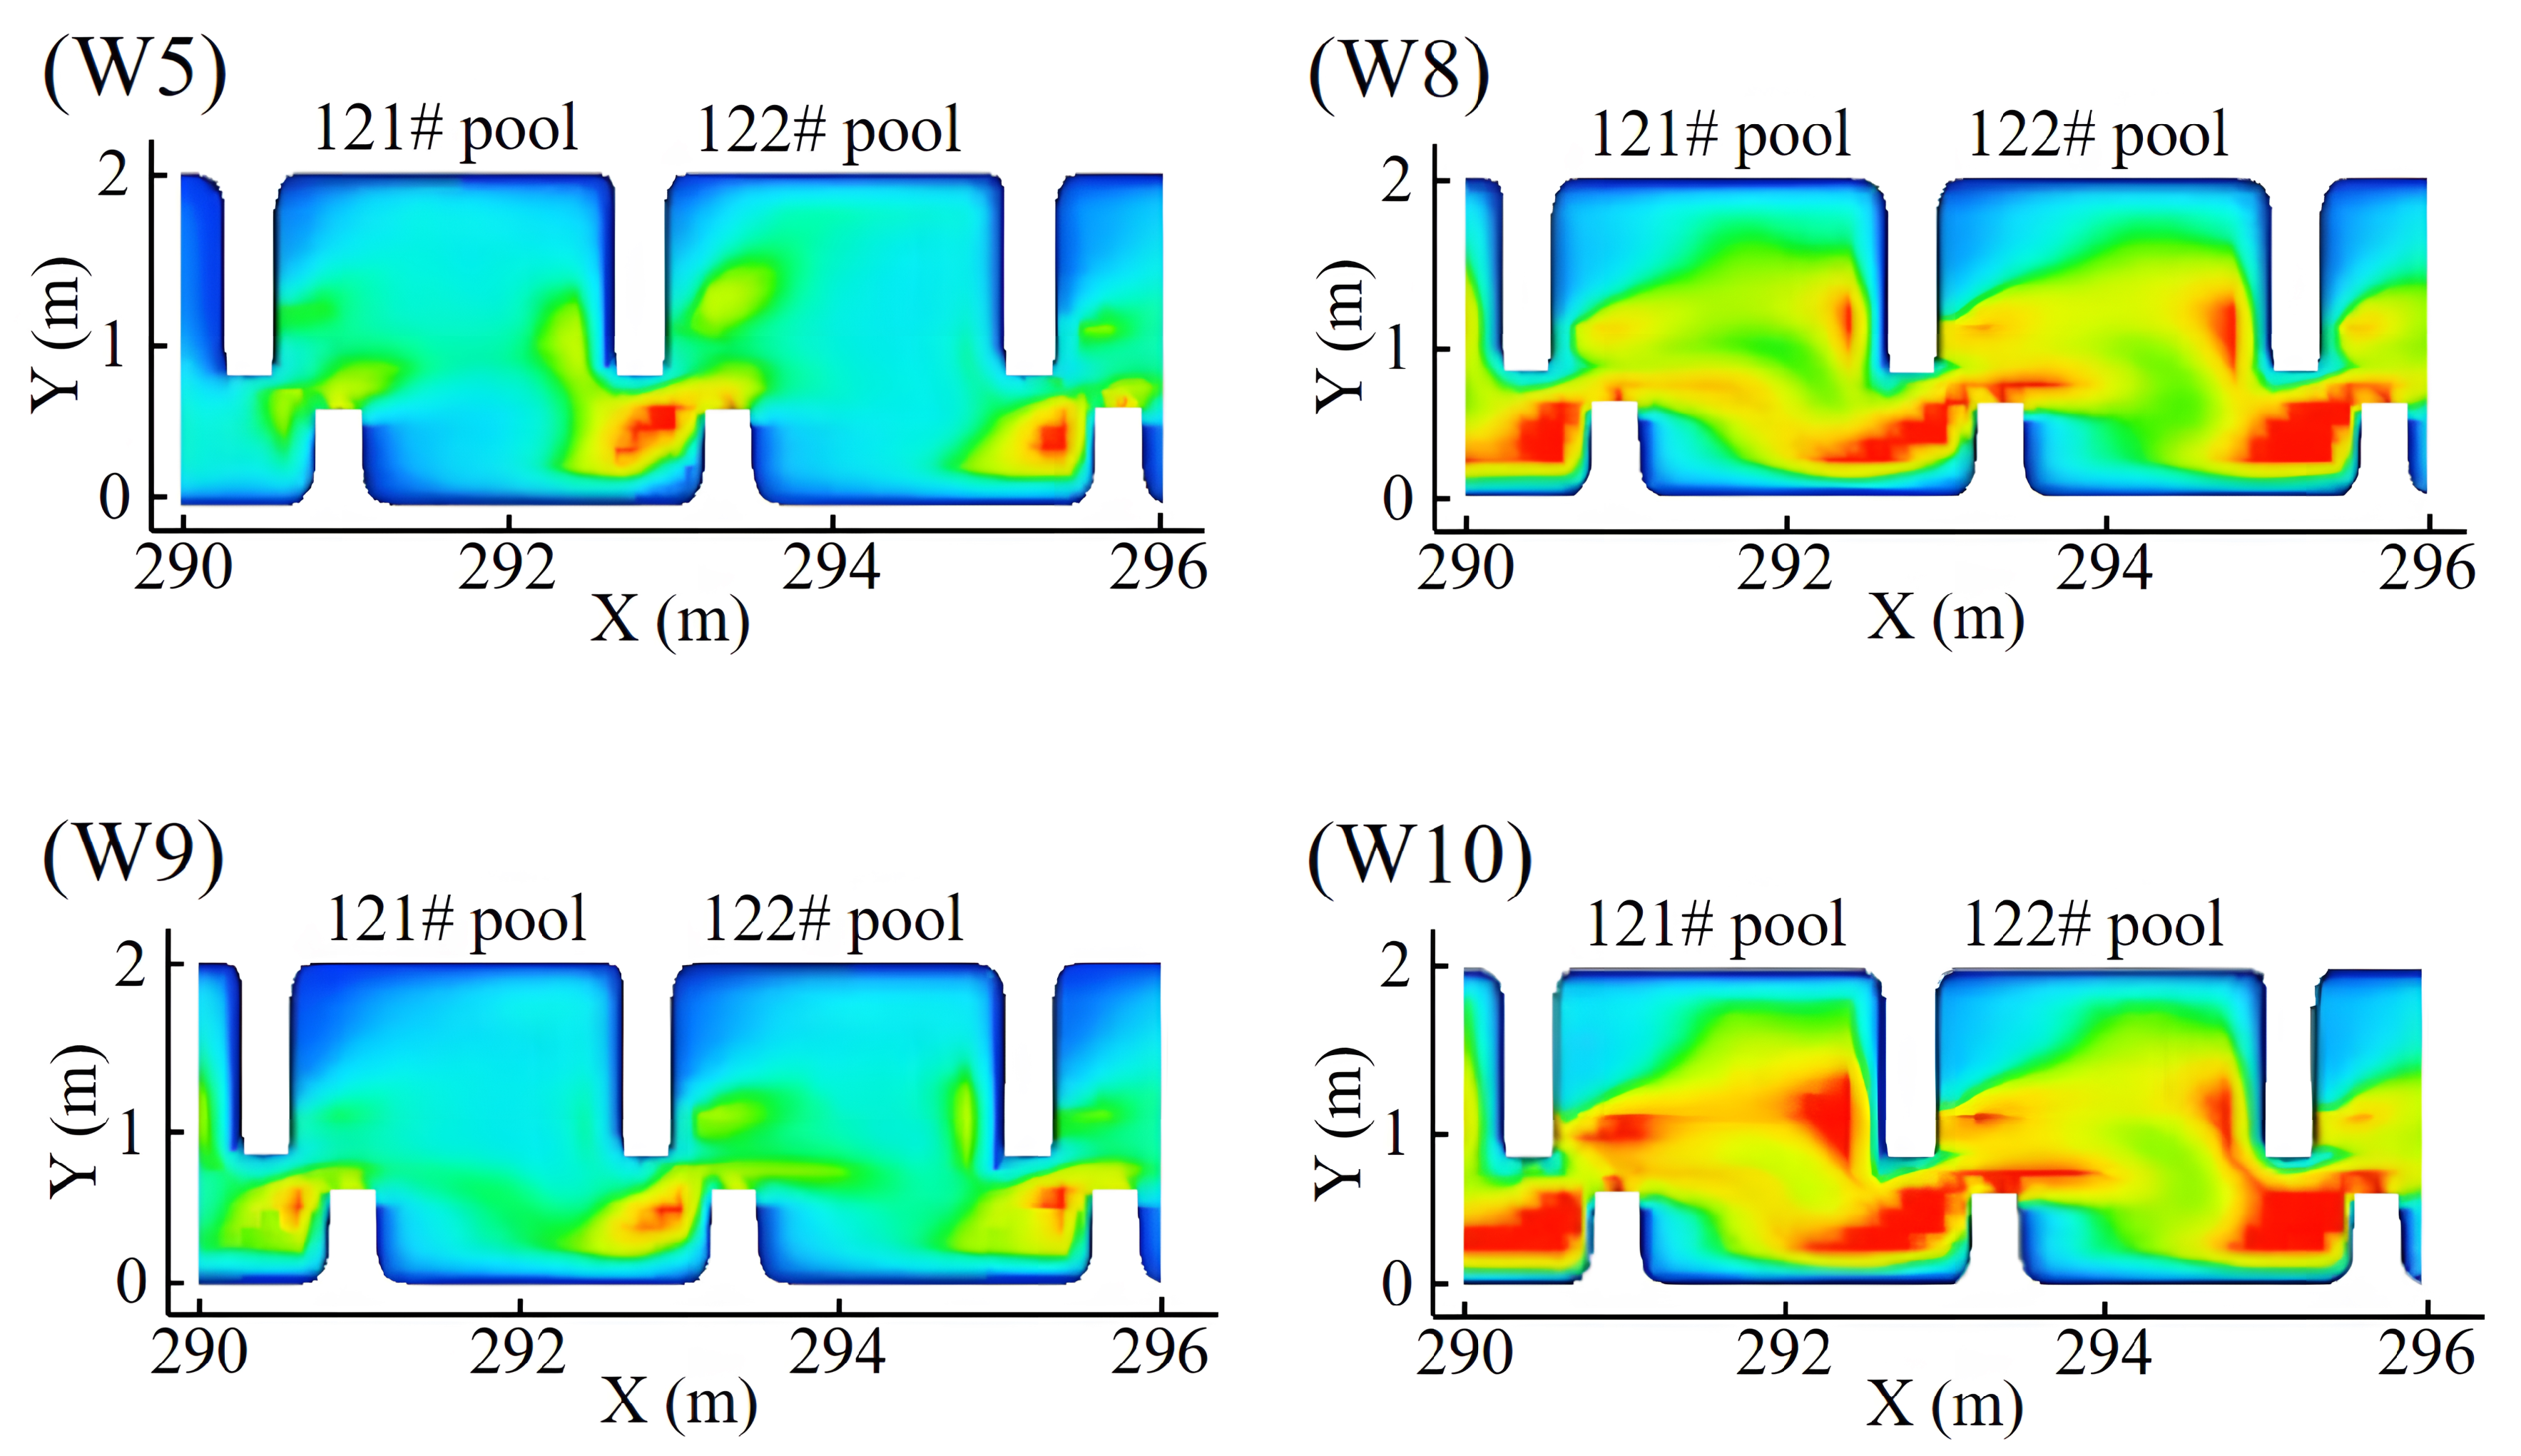
For the distribution of velocities between the two entrances in working conditions 5, 8 and 10 (Figure 8), the set water depth at the 1# entrance in these three working conditions was the minimum value corresponding to the distances between the two entrances of 100 m, 200 m, and 300 m, respectively. Parts of the fishway pools between the two entrances were affected by the drawdown profile. Taking working condition 10 as an example, it can be observed that the velocity in each pool was below 1.0 m/s between the 1# entrance and 2# entrance. Similarly, although the velocity had small fluctuations in each pool, the velocity in all pools was below 1.0 m/s in working conditions 5 and 8 (Figure 8). Therefore, we concluded that the velocity between the two entrances did not exceed 1.0 m/s in all working conditions.

3.3. Turbulent Kinetic Energy

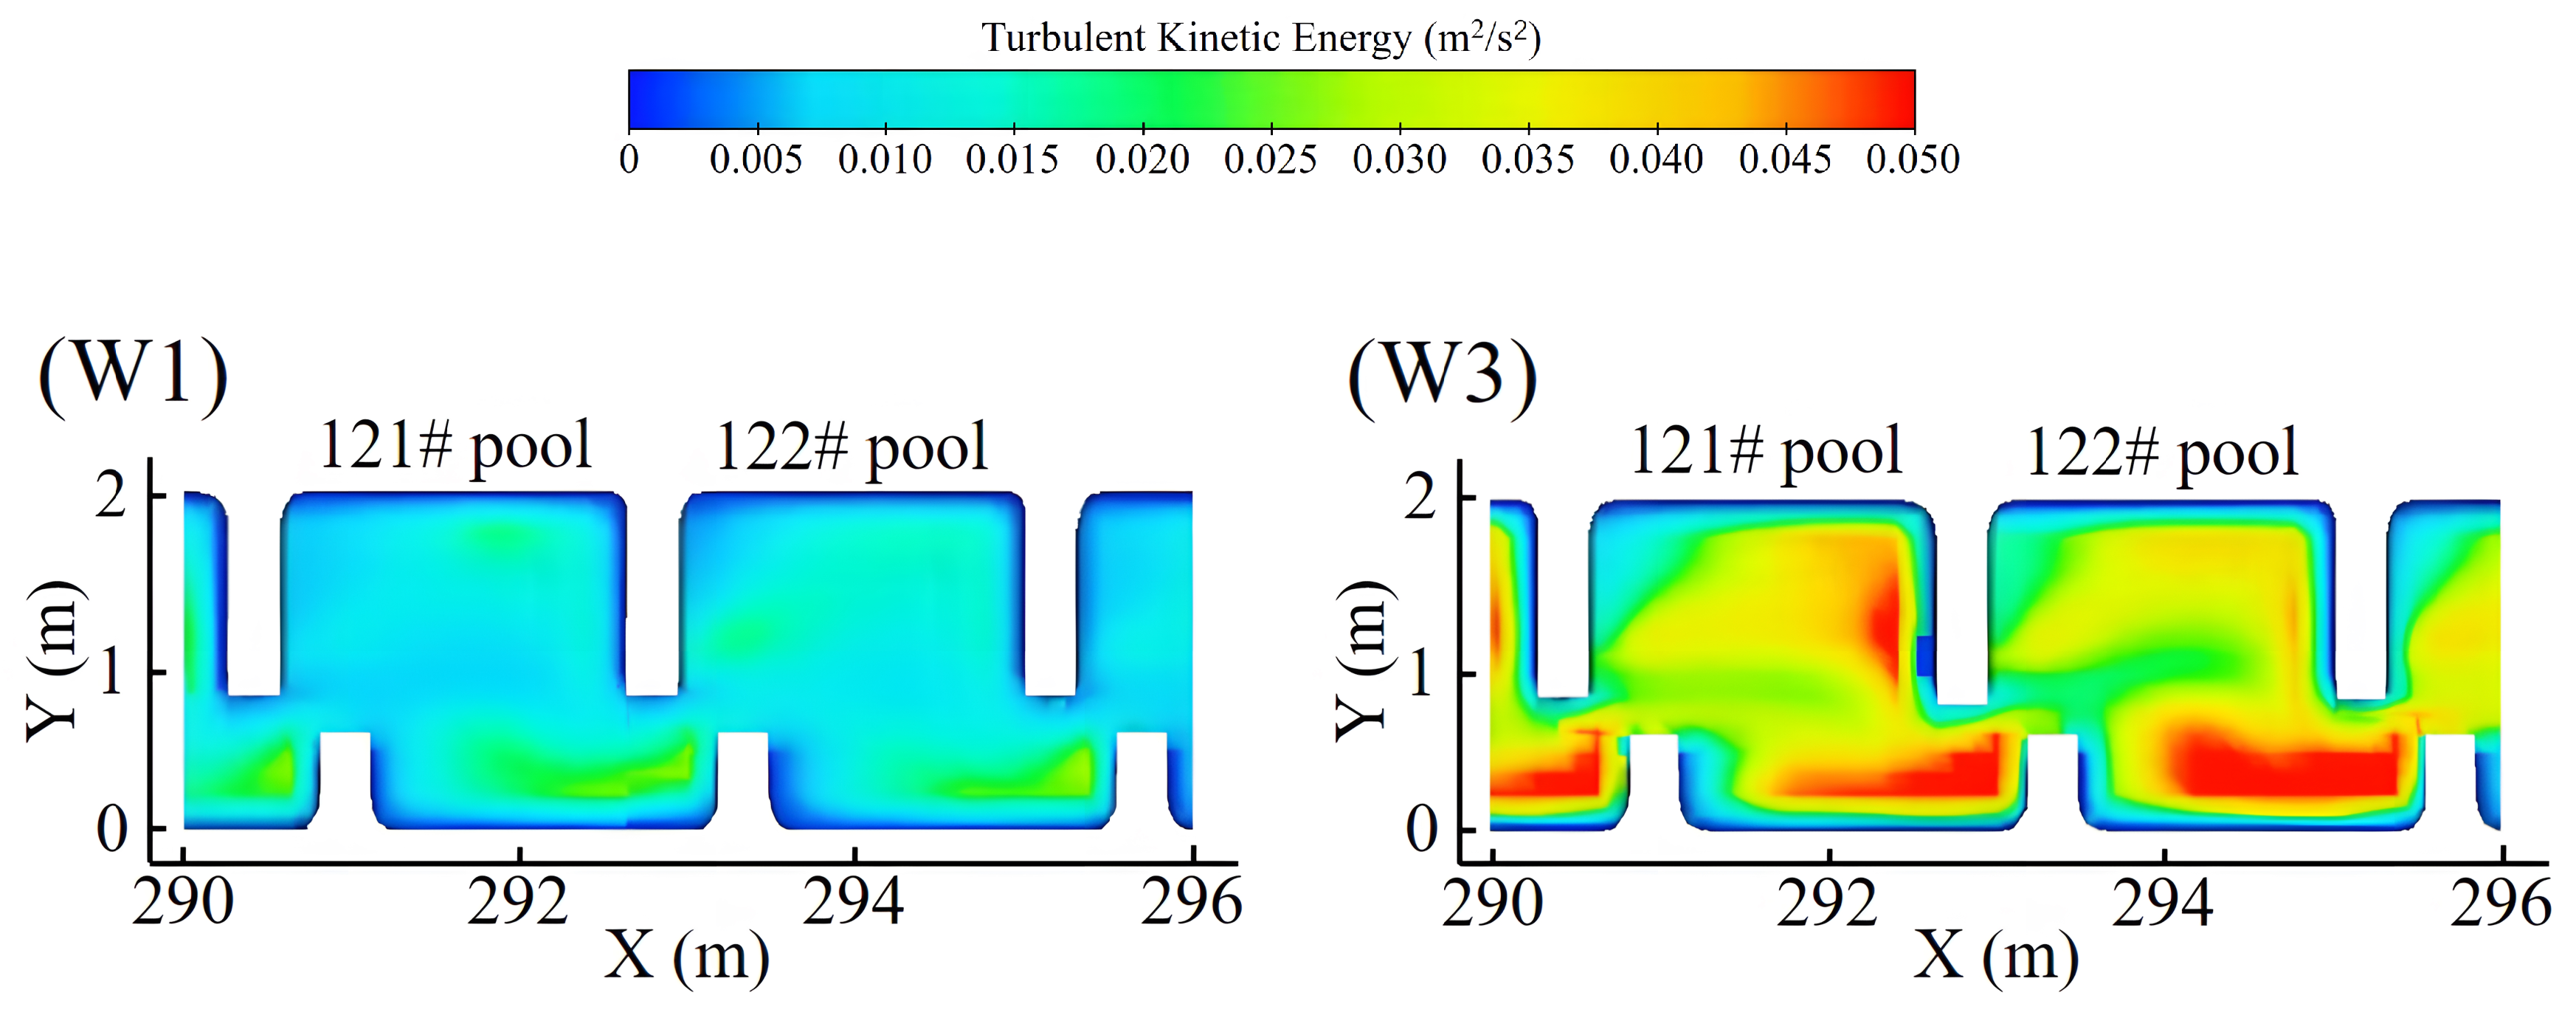
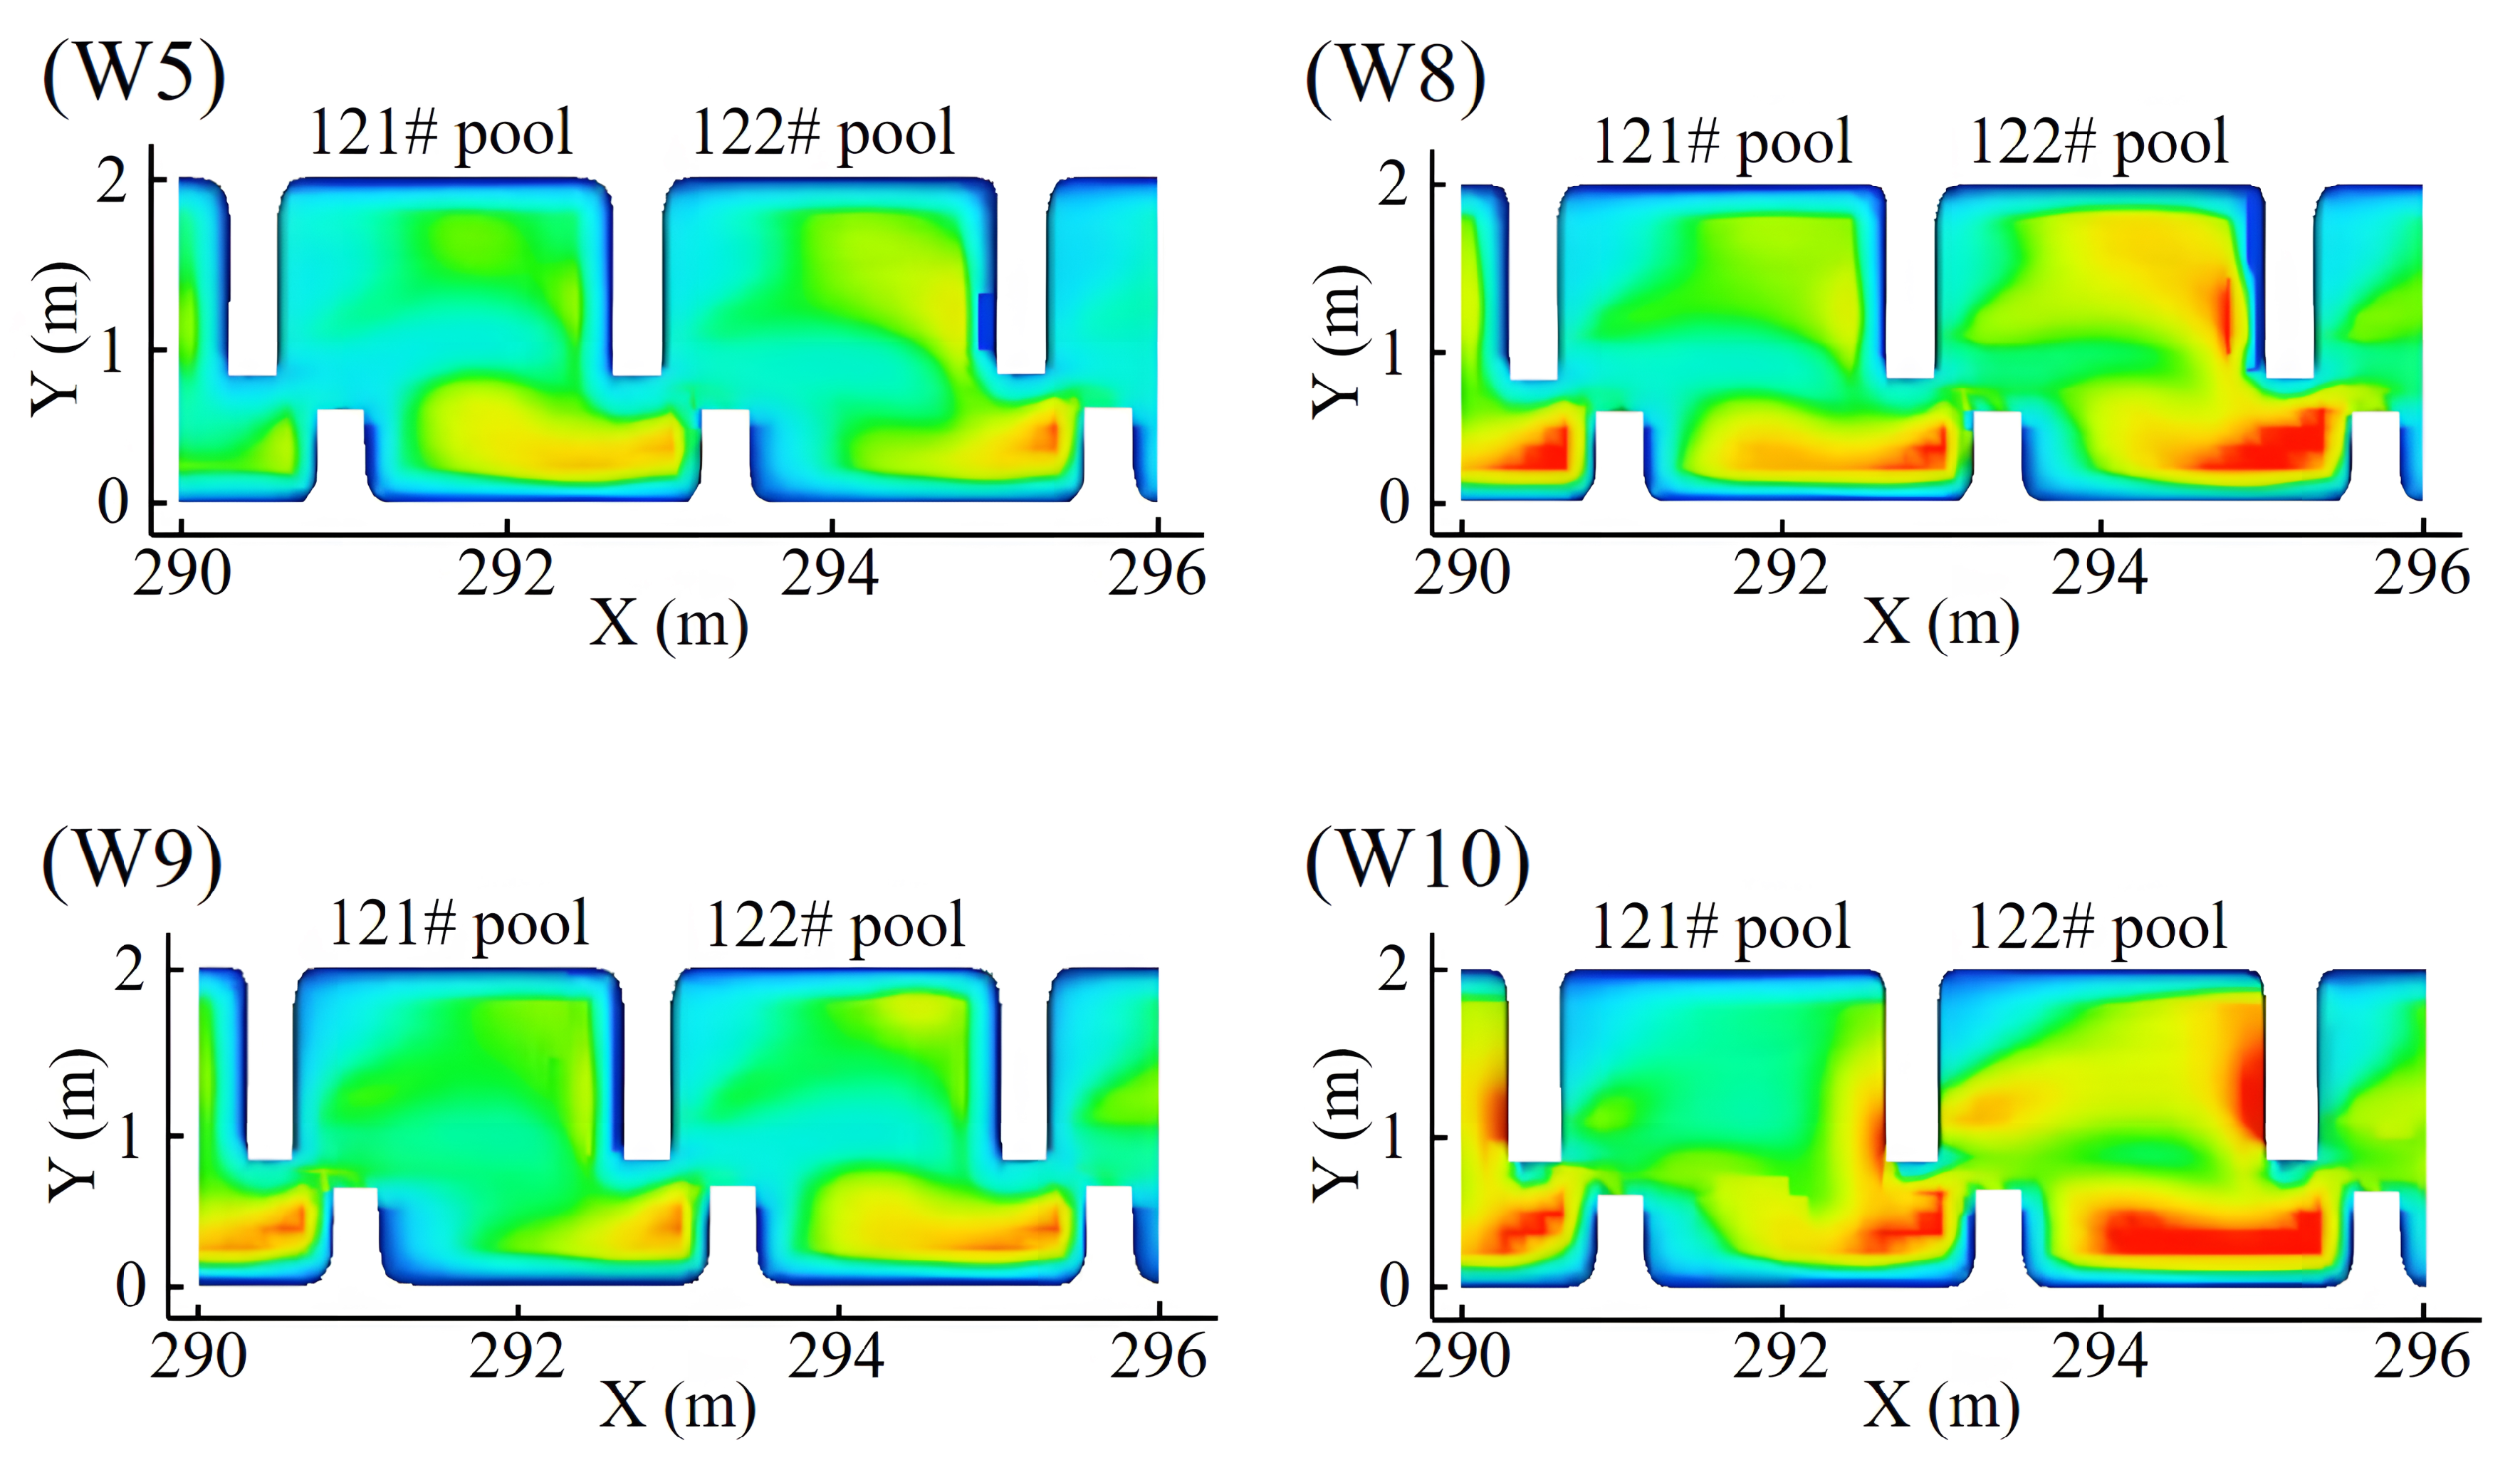
The turbulent kinetic energy (TKE) is a turbulence parameter that affects fish passing through a fishway. Working conditions 1, 3, 5, and 8–10 were selected as representative examples to reflect the worst-case distribution of TKE in the fishway. The simulated TKE at the 1# entrance is shown in Figure 9. The maximum TKE appeared at the slot of the pool near to the 1# entrance in all ten working conditions (Figure 9). For the one-entrance fishway, the TKE was maximum (0.076 m2/s2) in working condition 3. For the two-entrance fishway, the maximum TKE did not exceed 0.050 m2/s2 in all other working conditions.

3.4. Turbulent Kinetic Energy Dissipation Rate

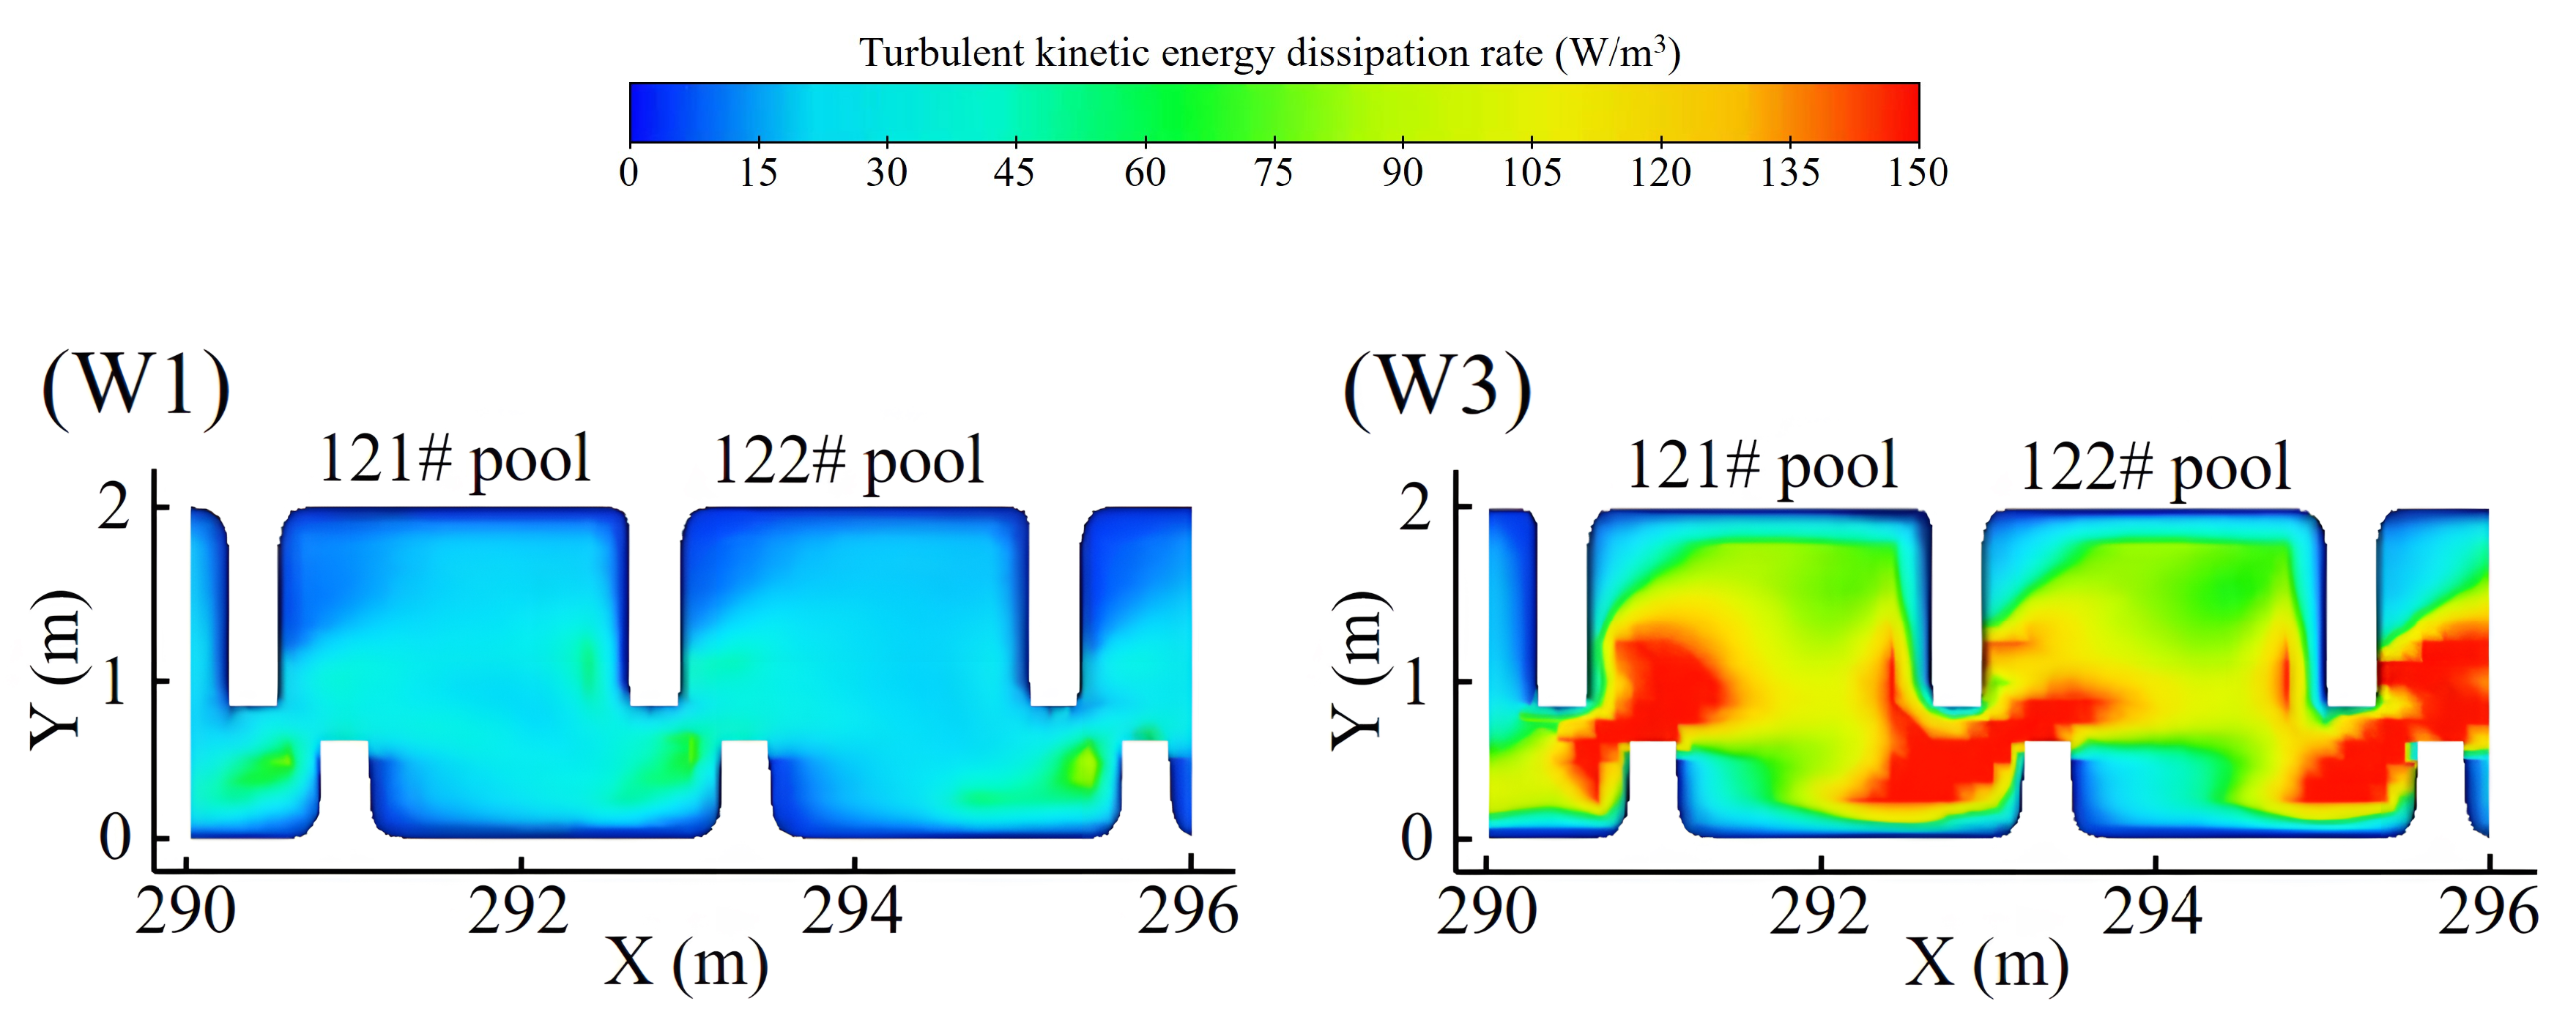
Consistent with the analysis method for the turbulent kinetic energy, we selected six representative working conditions and conducted a comparative analysis of the turbulent kinetic energy dissipation rate (TDR) at the 1# entrance. It can be seen from the results that the maximum values of TDR at the 1# entrance all exceeded the threshold (150 W/m3), reaching 237 W/m3, 183 W/m3 and 206 W/m3 in working conditions 3, 8 and 10 (Figure 10), respectively. TDR did not exceed the threshold, fully satisfying the upstream migration requirements for the target fish species in the remaining working conditions.

4. Discussion

4.1. Effects of Hydraulic Characteristics on Fish Migration Behavior

In this study, we analyzed the hydraulic factors, including velocity [27], TKE [55], and TDR [56], in the fishway. A suitable velocity was beneficial for fish passing through the fishway. The primary passing fish species in China were mostly freshwater fish that perform short-distance migrations and have a poor swimming performance [13,57]. The excessive high velocity caused fish fatigue impeded their upstream migration [38,58,59]. The excessive TKE and TDR made it hard for fish to swim [44,45] and led to an increased energy consumption and subsequent fatigue [49]. Therefore, suitable hydraulics can help fish migration.
The water depth was a key parameter with regard to fishway hydraulics [60], which can alter flow patterns, velocity, and energy dissipation, thereby affecting fish migration. When the water depth at the fishway exit was constant, the water depth at the fishway entrance was crucial for fish movement. For the one-entrance fishway, there was an allowable maximum value for the water depth difference between the entrance and exit [30]. If this value was exceeded, it created a migration barrier to hinder fish movement.

4.2. The Relationship Between Allowable Water Depth and the Distance of the Two Entrances and Its Applications

We verified the hydraulic characteristics in the fishway when extending the fishway and adding a 2# entrance. When the boundary conditions set for the fishway exit and the 1# entrance were the same, the water depth in the pools of the two-entrance fishway greatly decreased compared to the one-entrance fishway between exit and the 1# entrance (Figure 5). However, the slot velocity, TKE, and TDR in the two-entrance fishway were all lower than those in the one-entrance fishway at the 1# entrance (Figure 7, Figure 8, Figure 9 and Figure 10). This indicated that the 2# entrance can alleviate the unfavorable hydraulic conditions caused by the insufficient entrance water depth, because the two-entrance fishway exerts a flow-splitting effect compared with the one-entrance fishway. When the distance between the two entrances increased, more pools between the entrances dissipated the excess energy generated by the drawdown profile. It should be noted that this improvement was quantitative, and the TKE and TDR exceeded the set thresholds in some two-entrance scenarios (e.g., maximum TKE in working condition 10 and TDR in working conditions 8 and 10). Therefore, the hydraulic barriers could not be eliminated when the water depth difference exceeded the allowable maximum values in extreme working conditions. Additionally, the affected zone in the two-entrance fishway was limited to the zone near the 1# entrance, while the zone between the two entrances maintained suitable hydraulic conditions (velocity < 1.00 m/s, TKE ≤ 0.050 m2/s2, TDR ≤ 150 W/m3), which could provide potential passages for fish to avoid local harsh hydraulic environments. Although the two-entrance design did not eliminate hydraulic barriers, it reduced their intensity and expanded the adaptability to water-level fluctuations in the two-entrance section. Specifically, the 1# entrance can adapt to a lower water depth after adding the 2# entrance.
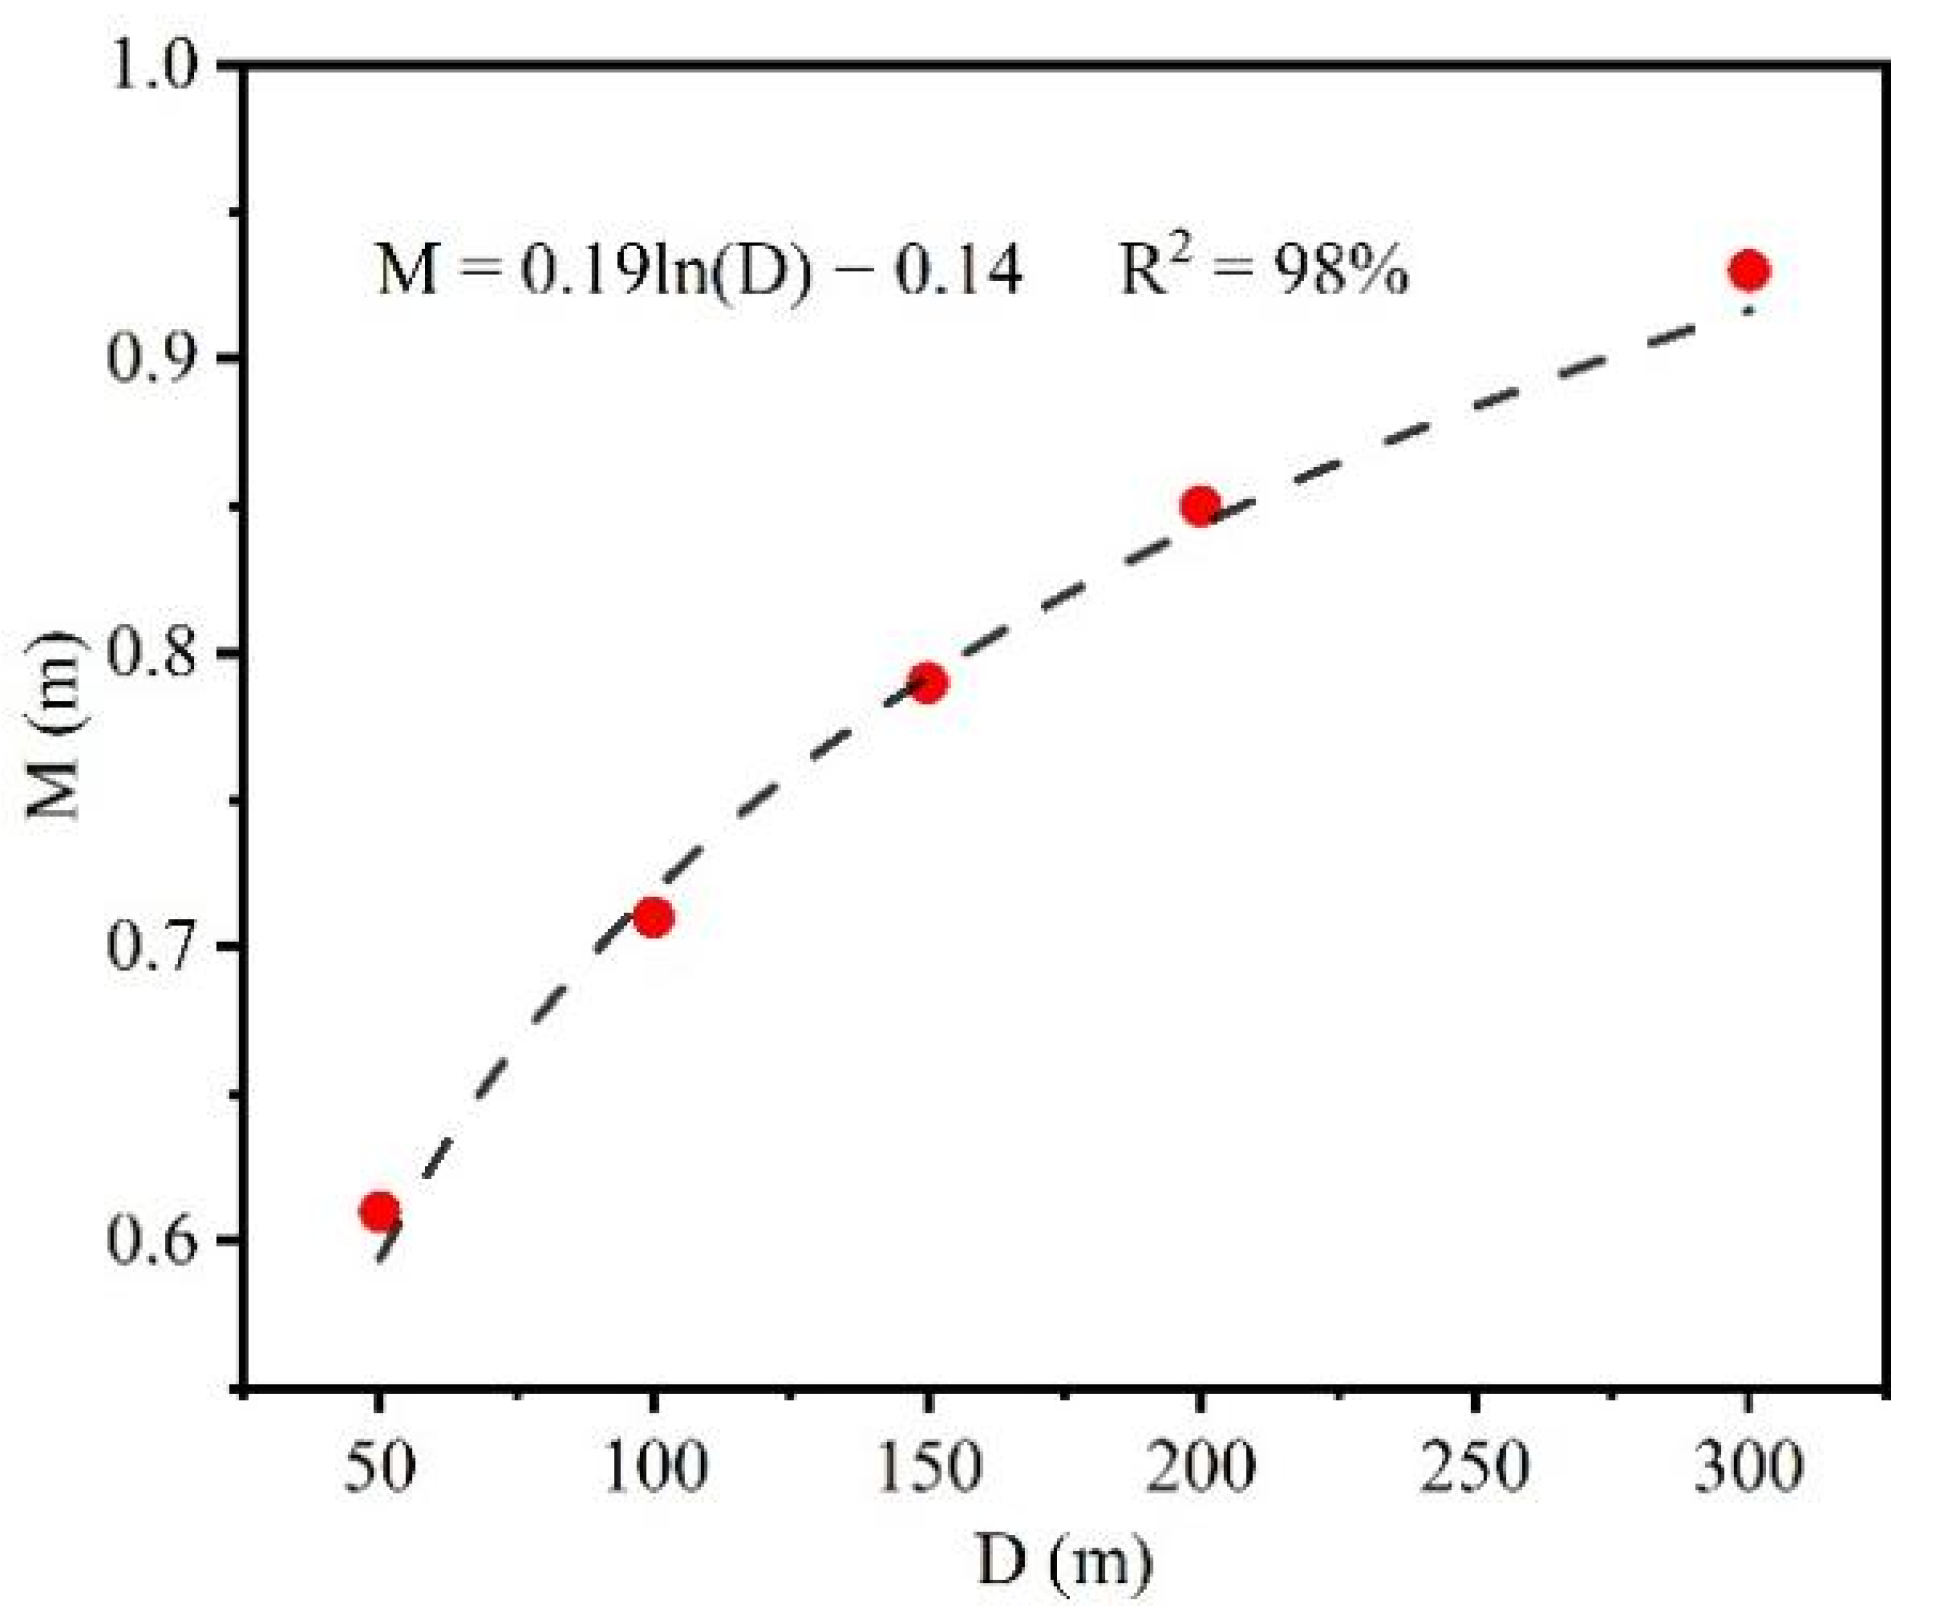
In this study, when the fishway exit water depth was 2.5 m and the slope was 2%, the allowable maximum water depth difference between the entrance and exit was 0.48 m in the one-entrance fishway. For the two-entrance fishway, the allowable maximum water depth difference between the 1# entrance and the exit was 0.71 m, 0.85 m, and 0.93 m in different distances between the two entrances (100 m, 200 m, 300 m), respectively. Meanwhile, we obtained allowable maximum water depth differences (0.61 m and 0.79 m) between the 1# entrance and the exit for the distances between the two entrances of 50 m and 150 m, respectively. Therefore, under the conditions that the water depth at the fishway exit was constant at 2.5 m and the fishway slope was 2%, the adaptability to water-level fluctuations and the distance of the two entrances exhibited a logarithmic relationship (Figure 11). The logarithmic correlation between the maximum allowable water depth difference (M) and the distance between the two entrances (D) is a comprehensive result affected by multiple hydraulic characteristics in vertical-slot fishways.
Based on the study results, when the fishway exit water depth was 2.5 m and the slope was 2%, the following design recommendations were proposed for vertical-slot fishways subject to an insufficient entrance water depth: (1) the 2# entrance should be at least 1.6 m when the water depth of the 1# entrance is 1.8 m and the distance between the two entrances is 100 m; (2) the 2# entrance should be at least 1.4 m when the water depth of the 1# entrance is 1.7 m and the distance between two entrances is 200 m; and (3) the 2# entrance should be at least 1.2 m when the water depth of the 1# entrance is 1.6 m and the distance between the two entrances is 300 m.
It was noteworthy that the 1# entrance adapted to a water-level fluctuation exceeding 1.0 m was not considered in this study, since the two-entrance distance suitable for this scenario would exceed the controllable scope of practical engineering design and construction cost, and thus alternative measures (e.g., adjusting the fishway slope [61] or modifying the fishway entrance structure [62]) should be adopted.

4.3. Study Limitations and Future Research Directions

Considering that the water level, slope, and discharge simultaneously vary during the actual operation of fishways, the quantitative logarithmic relationship may change. Therefore, the applicability of the conclusions is strictly limited to vertical-slot fishways with similar geometric parameters, boundary conditions, and target fish species. It is noteworthy that, for fishways with different slopes and exit water depths and target fish species with different swimming performances, the relationship can be extended by introducing correction coefficients from subsequent studies, and the thresholds of hydraulic characteristics should be modified.
In this study, we analyzed the distributions of hydraulic characteristics (e.g., flow velocity and turbulent kinetic energy) in one-entrance and two-entrance fishways subject to an insufficient entrance water depth; the maximum allowable water depth difference for two types of fishways were obtained. However, when the flow velocity was high, the energy consumption greatly increased; more refined work on hydraulic parameters, such as vorticity [63,64] and shear stress [65,66], should be considered. Additionally, an excessive water depth at the entrance often occurs during the operation of the fishway in practical engineering. An excessive water depth at the fishway entrance resulted in a low water velocity in the pools near the entrance, which prevented fish from going into the fishway entrance [67,68,69]. Moreover, the fishway slope is another factor that should be considered in future studies. Therefore, the adaptability of water-level fluctuations should further consider different slopes and different exit water depths. Considering that this study explored the relationship between the distance of the two entrances and the adaptability to water-level fluctuations by using numerical simulations, it is necessary to include field experiments to verify the applicability of the study conclusions in future work.

5. Conclusions

This study explored the relationship between the distance of the two entrances and the adaptability to water-level fluctuations. The maximum allowable water depth difference between the entrance and exit was calculated for a one-entrance fishway and two-entrance fishways with different entrance distances (100 m, 200 m, 300 m) under an insufficient entrance water depth, with a fishway slope of 2% and an exit water depth of 2.5 m. It was found that the maximum allowable water depth difference between the 1# entrance and exit of the two-entrance fishways (0.71 m, 0.85 m, 0.93 m) was greatly larger than that of the one-entrance fishway (0.48 m). Additionally, the maximum allowable water depth difference in the two-entrance fishways increased with the increased distance between the two entrances. The relationship between the maximum allowable water depth difference and the distance between the two entrances was found to follow a logarithmic function. We suggested that the 2# entrance should be at least 1.6 m when the water depth of the 1# entrance is decreased to 1.8 m. When the water depth of the 1# entrance was gradually decreased to 1.6 m, the water depth of the 2# entrance also gradually decreased to 1.2 m. The distance between the 1# entrance and 2# entrance subsequently changed. It is noteworthy that the conclusions proposed in this study are strictly limited to vertical-slot fishways with a slope of 2%, exit water depth of 2.5 m, similar geometric parameters, and target cyprinid species. It cannot be directly applied to other scenarios; therefore, different slopes or exit water depths should be studied to extend the relationship by introducing correction coefficients from subsequent studies. This study can provide references for the design and optimization of future fishway projects.

Supplementary Materials

The following supporting information can be downloaded at: https://www.mdpi.com/article/10.3390/w18030432/s1. Figure S1: Schematic showing three different water level profiles in a fishway. (a) Non-uniform backwater profile (M1), (b) uniform profile (U), and (c) non-uniform drawdown profile (M2). h1 was the mean water level upstream, h2 was the mean water level downstream, h0 was the mean water level in the pool, ΔH was the water drop between pools, and ΔZ was the elevation difference between cross-walls.

Author Contributions

X.H.: data curation; methodology; writing—original draft; writing—review and editing. J.T.: conceptualization; methodology; validation; project administration; writing—review and editing. Y.W.: conceptualization; software. J.S.: writing—review and editing. S.Z.: software. S.W.: data curation. X.S.: project administration. All authors have read and agreed to the published version of the manuscript.

Funding

This research was funded by the National Natural Science Foundation of China (funding numbers: 52579069, 52179070, 52279069) and the Innovative Research Group Program of the Natural Science Foundation of Hubei Province (funding number: 2023AFA005).

Data Availability Statement

The original contributions presented in this study are included in the article/Supplementary Materials. Further inquiries can be directed to the corresponding authors.

Acknowledgments

The authors have reviewed and edited the output and take full responsibility for the content of this publication.

Conflicts of Interest

The authors declare no conflicts of interest.

References

  1. He, F.Z.; Zarfl, C.; Tockner, K.; Olden, J.D.; Campos, Z.; Muniz, F.; Svenning, J.C.; Jähnig, S.C. Hydropower impacts on riverine biodiversity. Nat. Rev. Earth Environ. 2024, 5, 755–772. [Google Scholar] [CrossRef]
  2. Iaia, M.; Quadroni, S.; Brignone, S.; Piccinini, A.; Bettinetti, R.; Volta, P. Assessment of the effectiveness and efficiency of two fishways with vertical slot openings in an Alpine River (Toce River, northern Italy). Ecol. Eng. 2025, 212, 107535. [Google Scholar] [CrossRef]
  3. Romao, F.; Quaresma, A.; Simao, J.; Amaral, S.; Leite, R.; Bravo-Córdoba, F.J.; Sanz-Ronda, F.J.; Pinheiro, A.N.; Santos, J.M. Stopping invaders: Moving towards a selective vertical slot fishway to prevent the passage of non-native cyprinids. J. Environ. Manag. 2025, 380, 125004. [Google Scholar] [CrossRef]
  4. Ke, S.F.; Xiang, S.; Kattel, G.R.; Li, D.Q.; Tu, Z.Y.; Shi, X.T. Design and initial evaluation of a novel tubular fishway for the rubber dam on the Huangbai River, a tributary of the Gezhouba Reservoir. J. Environ. Manag. 2025, 381, 125301. [Google Scholar] [CrossRef] [PubMed]
  5. Liu, S.; Jian, Y.; Li, P.; Liang, R.; Chen, X.; Qin, Y.; Wang, Y.; Li, K. Optimization schemes to significantly improve the upstream migration of fish: A case study in the lower Yangtze River basin. Ecol. Eng. 2023, 186, 106838. [Google Scholar] [CrossRef]
  6. Moccetti, P.; Dodd, J.R.; Joyce, D.A.; Nunn, A.D.; Gillespie, B.; Bolland, J.D. Genetic consequences of improved river connec-tivity in brown trout (Salmo trutta L.). Evol. Appl. 2024, 17, e13660. [Google Scholar] [CrossRef]
  7. Cui, L.; Kou, X.M.; Sun, J.J.; Liu, R.; Gao, F.; Tan, J.J.; Soomro, S.; Wang, Y.Y.; Kattel, G.R.; Shi, X.T. Fishway assessment and monitoring for endemic migratory fish using multiple techniques in high-altitude river systems: A case study from the Yarlung Zangbo River, Southeastern Tibetan Plateau. Glob. Ecol. Conserv. 2024, 56, e03325. [Google Scholar] [CrossRef]
  8. Nyqvist, D.; Nilsson, P.A.; Alenäs, I.; Elghagen, J.; Hebrand, M.; Karlsson, S.; Kläppe, S.; Calles, O. Upstream and downstream passage of migrating adult Atlantic salmon: Remedial measures improve passage performance at a hydropower dam. Ecol. Eng. 2017, 102, 331–343. [Google Scholar] [CrossRef]
  9. Bao, J.; Wang, X.; Li, W.; Zhang, C.; Mi, X.; Zhang, D.; Twardek, W.M.; Lin, H.; Qiao, Y.; Cooke, S.J.; et al. Passage efficiency and behavioral performance of Schizothorax davidi through different sections of a long vertical slot fishway. Water Biol. Secur. 2025, 4, 100330. [Google Scholar] [CrossRef]
  10. Ke, S.; Goerig, E.; Pang, K.; Ji, H.; Li, D.; Xu, J.; Tan, J.; Qi, H.; Shi, X. Evaluation of pool-and-weir fishway efficiency for the upstream spawning migration of Qinghai Lake’s naked carp. Ecol. Eng. 2024, 208, 107373. [Google Scholar] [CrossRef]
  11. Daneshfaraz, R.; Ghaderi, A.; Shahini, H.; Azali, A. Hydraulic performance assessment of Denil fishway with modified bed slope and baffle spacing. Results Eng. 2025, 26, 105072. [Google Scholar] [CrossRef]
  12. Gustafsson, S.; Österling, M.; Skurdal, J.; Schneider, L.D.; Calles, O. Macroinvertebrate colonization of a nature-like fishway: The effects of adding habitat heterogeneity. Ecol. Eng. 2013, 61, 345–353. [Google Scholar] [CrossRef]
  13. Shi, X.T.; Kynard, B.; Liu, D.F.; Qiao, Y.; Chen, Q.W. Development of Fish Passage in China. Fisheries 2015, 40, 161–169. [Google Scholar] [CrossRef]
  14. Zheng, T.; Tu, C.; Zhang, Z.; Sun, S.; Dai, H.; Li, G.; Liu, H. Vertical slot fishway design for fluctuating water-level reservoir. J. Hydraul. Res. 2025, 63, 117–125. [Google Scholar] [CrossRef]
  15. Li, S.S.; Sun, Z.Y.; Li, G.D.; Zhang, Z.X.; Wu, S.; Guo, L.H.; Liu, Z.J.; Zhang, M. Numerical investigation on the hydraulic characteristics and optimal design of pool-weir stepped fishway. Phys. Fluids 2025, 37, 062105. [Google Scholar] [CrossRef]
  16. Farzadkhoo, M.; Kingsford, R.T.; Suthers, I.M.; Felder, S. Flow hydrodynamics drive effective fish attraction behaviour into slotted fishway entrances. J. Hydrodyn. 2023, 35, 782–802. [Google Scholar] [CrossRef]
  17. Zheng, T.G.; Tu, C.Y.; Sun, S.K.; Huang, W.; Ren, W.C.; Li, G.N.; Liu, H.T. Testing Three Vertical Slot Fishway Configurations for a Chinese Endemic Fish. J. Hydraul. Eng. 2023, 149, 06023005. [Google Scholar] [CrossRef]
  18. Fuentes-Pérez, J.F.; Tuhtan, J.A.; Eckert, M.; Romao, F.; Ferreira, M.T.; Kruusmaa, M.; Branco, P. Hydraulics of Vertical-Slot Fishways: Nonuniform Profiles. J. Hydraul. Eng. 2019, 145, 06018020. [Google Scholar] [CrossRef]
  19. Marriner, B.A.; Baki, A.B.M.; Zhu, D.Z.; Cooke, S.J.; Katopodis, C. The hydraulics of a vertical slot fishway: A case study on the multi-species Vianney-Legendre fishway in Quebec, Canada. Ecol. Eng. 2016, 90, 190–202. [Google Scholar] [CrossRef]
  20. Fuentes-Pérez, J.F.; Sanz-Ronda, F.J.; Martínez, D.A.P.A.; García-Vega, A. Modeling Water-Depth Distribution in Vertical-Slot Fishways under Uniform and Nonuniform Scenarios. J. Hydraul. Eng. 2014, 140, 6014016. [Google Scholar] [CrossRef]
  21. Chen, M.; An, R.; Li, J.; Li, K.; Li, F. Identifying operation scenarios to optimize attraction flow near fishway entrances for endemic fishes on the Tibetan Plateau of China to match their swimming characteristics: A case study. Sci. Total Environ. 2019, 693, 133615. [Google Scholar] [CrossRef] [PubMed]
  22. Li, P.; Zhang, W.; Burnett, N.J.; Zhu, D.Z.; Casselman, M.; Hinch, S.G. Evaluating Dam Water Release Strategies for Migrating Adult Salmon Using Computational Fluid Dynamic Modeling and Biotelemetry. Water Resour. Res. 2021, 57, e2020WR028981. [Google Scholar] [CrossRef]
  23. Goettel, M.T.; Atkinson, J.F.; Bennett, S.J. Behavior of western blacknose dace in a turbulence modified flow field. Ecol. Eng. 2015, 74, 230–240. [Google Scholar] [CrossRef]
  24. Tarrade, L.; Texier, A.; David, L.; Larinier, M. Topologies and measurements of turbulent flow in vertical slot fishways. Hydrobiologia 2008, 609, 177–188. [Google Scholar] [CrossRef]
  25. Wu, S.; Rajaratnam, N.; Katopodis, C. Structure of Flow in Vertical Slot Fishway. J. Hydraul. Eng. 1999, 125, 351–360. [Google Scholar] [CrossRef]
  26. Bice, C.M.; Zampatti, B.P.; Mallen-Cooper, M. Paired hydraulically distinct vertical-slot fishways provide complementary fish passage at an estuarine barrier. Ecol. Eng. 2017, 98, 246–256. [Google Scholar] [CrossRef]
  27. Zheng, T.; Niu, Z.; Sun, S.; Huang, W.; Tu, C.; Liu, H.; Li, G.; Wang, H. Optimizing fish-friendly flow pattern in vertical slot fishway based on fish swimming capability validation. Ecol. Eng. 2022, 185, 106796. [Google Scholar] [CrossRef]
  28. Yan, J.F.; Chu, W.H.; Cao, Y.; Zhou, Q.L. Hydrodynamic analysis of fish swimming behavior in turbulent river confluences. Phys. Fluids 2024, 36, 121904. [Google Scholar] [CrossRef]
  29. Zhou, J.; Seo, J.H.; Mittal, R. Effect of hydrodynamic wakes in dynamical models of large-scale fish schools. Phys. Fluids 2025, 37, 011912. [Google Scholar] [CrossRef]
  30. Miao, J.; WANG, X.; XIN, P.; TANG, Z. Hydraulic characteristics of vertical slot fishway and allowable maximum water depth difference between inlet and outlet subject to insufficient inlet water depth. J. Hohai Univ. (Nat. Sci.) 2023, 51, 99–105. [Google Scholar] [CrossRef]
  31. Bravo-Córdoba, F.J.; Sanz-Ronda, F.J.; Ruiz-Legazpi, J.; Fernandes Celestino, L.; Makrakis, S. Fishway with two entrance branches: Understanding its performance for potamodromous Mediterranean barbels. Fish. Manag. Ecol. 2018, 25, 12–21. [Google Scholar] [CrossRef]
  32. O’ Connor, J.; Jones, M.; Amtstaetter, F.; Cornell, G.; Danger, A.; Ewing, T.; Fanson, B.; Stuart, I. Remediating a fishway entrance to improve fish attraction: A framework for success. J. Ecohydraulics 2025, 10, 1–11. [Google Scholar] [CrossRef]
  33. Xiao, L.; Wang, J.; Wang, B.; Jiang, H. China’s Hydropower Resources and Development. Sustainability 2023, 15, 3940. [Google Scholar] [CrossRef]
  34. Lyu, L.; Hu, J.; Feng, C.; Yin, Z. Influencing factors of fish passage in fishway of Duobu Hydropower Station in Xizang. Chin. J. Ecol. 2025, 44, 2678–2688. (In Chinese) [Google Scholar] [CrossRef]
  35. Zeng, S.C.; Tan, J.J.; Sun, J.J.; Wang, Y.Y.; Kattel, G.R.; Shi, X.T. Identifying the optimal flow conditions of a fishway with two entrances for endemic fishes at a high-altitude hydropower station in the Tibetan Himalaya, China. Ecol. Eng. 2025, 219, 107698. [Google Scholar] [CrossRef]
  36. Ke, S.; Yang, S.; Tu, Z.; Soomro, S.; Ji, H.; Li, D.; Xu, J.; Qi, H.; Shi, X. Swimming performance of a threatened native fish (Gymnocypris przewalskii) informs fishway design in Qinghai Lake. Hydrobiologia 2025, 852, 3997–4012. [Google Scholar] [CrossRef]
  37. Rodríguez, T.T.; Agudo, J.P.; Mosquera, L.P.; Gonzalez, E.P. Evaluating vertical-slot fishway designs in terms of fish swimming capabilities. Ecol. Eng. 2006, 27, 37–48. [Google Scholar] [CrossRef]
  38. Chen, K.; Tao, J.; Chang, Z.; Cao, X.; Ge, H. Difficulties and prospects of fishways in China: An overview of the construction status and operation practice since 2000. Ecol. Eng. 2014, 70, 82–91. [Google Scholar] [CrossRef]
  39. Fang, X.; Kumahor, S.; Tachie, M.F.; Katopodis, C.; Ghamry, H. Comprehensive Flow Turbulence Metrics to Improve Bar Rack Guidance for Downstream Migrating Fish. Water Resour. Res. 2024, 60, e2023WR034900. [Google Scholar] [CrossRef]
  40. Liu, M.M.; Rajaratnam, N.; Zhu, D.Z. Mean flow and turbulence structure in vertical slot fishways. J. Hydraul. Eng. ASCE 2006, 132, 765–777. [Google Scholar] [CrossRef]
  41. Zhang, Y.F.; Ko, H.T.; Calicchia, M.A.; Ni, R.; Lauder, G.V. Collective movement of schooling fish reduces the costs of locomotion in turbulent conditions. PLoS Biol. 2024, 22, e3002501. [Google Scholar] [CrossRef] [PubMed]
  42. Romão, F.; Branco, P.; Quaresma, A.L.; Amaral, S.D.; Pinheiro, A.N. Effectiveness of a multi-slot vertical slot fishway versus a standard vertical slot fishway for potamodromous cyprinids. Hydrobiologia 2018, 816, 153–163. [Google Scholar] [CrossRef]
  43. Li, M.; An, R.; Chen, M.; Li, J. Evaluation of Volitional Swimming Behavior of Schizothorax prenanti Using an Open-Channel Flume with Spatially Heterogeneous Turbulent Flow. Animals 2022, 12, 752. [Google Scholar] [CrossRef] [PubMed]
  44. Li, G.N.; Sun, S.K.; Zhang, C.; Liu, H.T.; Zheng, T.G. Evaluation of flow patterns in vertical slot fishways with different slot positions based on a comparison passage experiment for juvenile grass carp. Ecol. Eng. 2019, 133, 148–159. [Google Scholar] [CrossRef]
  45. Silva, A.T.; Katopodis, C.; Santos, J.M.; Ferreira, M.T.; Pinheiro, A.N. Cyprinid swimming behaviour in response to turbulent flow. Ecol. Eng. 2012, 44, 314–328. [Google Scholar] [CrossRef]
  46. Tan, J.J.; Tan, H.L.; Goerig, E.; Ke, S.F.; Huang, H.Z.; Liu, Z.X.; Shi, X.T. Optimization of fishway attraction flow based on endemic fish swimming performance and hydraulics. Ecol. Eng. 2021, 170, 106332. [Google Scholar] [CrossRef]
  47. Gilja, G.; Ocvirk, E.; Fliszar, R. Experimental Investigation of the Reynolds Shear Stress Exceedance Rate for the Injury and Disorientation Biocriteria Boundary in the Pool-Orifice and Vertical Slot Type Fishways. Appl. Sci. 2021, 11, 7708. [Google Scholar] [CrossRef]
  48. Baudoin, J.M.; Burgun, V.; Chanseau, M.; Larinier, M.; Ovidio, M.; Sremski, W.; Steinbach, P.; Voegtle, B. The ICE Protocol for Ecological Continuity—Assessing the Passage of Obstacles by Fish; Concepts, Design and Application; Onema: Vincennes, France, 2014. [Google Scholar]
  49. DVWK; Fisheries and Aquaculture Management Division. Fish Passes: Design, Dimensions and Monitoring; FAO/DVWK: Rome, Italy, 2002; ISBN 978-92-5-104894-8. [Google Scholar]
  50. Lu, Y.; Wang, Z.; Zhao, Z.; Zhao, D.; Zhang, Y. Hydraulic Characteristics of a New Vertical Slot Fishway with Staggered Baffles Configuration. Water 2025, 17, 809. [Google Scholar] [CrossRef]
  51. Du, Z.F.; Li, J.Q. VOF method in two-stage fourth order time-stepping framework. J. Comput. Phys. 2024, 496, 112580. [Google Scholar] [CrossRef]
  52. Flow Science. FLOW-3D User’s Manual; Version 10.2; Flow Science, Inc.: Santa Fe, NM, USA, 2013. [Google Scholar]
  53. Shahabi, M.; Ahadiyan, J.; Ghomeshi, M.; Narimousa, M.; Katopodis, C.; Azizi Nadian, H. Numerical study of the effect of a V-shaped weir on turbulence characteristics and velocity in V-weir fishways. River Res. Appl. 2023, 39, 21–34. [Google Scholar] [CrossRef]
  54. Yakhot, V.; Orszag, S.A. Renormalization group analysis of turbulence. I. Basic. Theory. J. Sci. Comput. 1986, 1, 3–51. [Google Scholar] [CrossRef] [PubMed]
  55. Tan, J.J.; Gao, Z.; Dai, H.C.; Yang, Z.Y.; Shi, X.T. Effects of turbulence and velocity on the movement behaviour of bighead carp (Hypophthalmichthys nobilis) in an experimental vertical slot fishway. Ecol. Eng. 2019, 127, 363–374. [Google Scholar] [CrossRef]
  56. Vassilicos, J.C. Dissipation in Turbulent Flows. Annu. Rev. Fluid Mech. 2015, 47, 95–114. [Google Scholar] [CrossRef]
  57. Mao, X. Review of fishway research in China. Ecol. Eng. 2018, 115, 91–95. [Google Scholar] [CrossRef]
  58. Puertas, J.; Cea, L.; Bermúdez, M.; Pena, L.; Rodríguez, Á.; Rabuñal, J.R.; Balairón, L.; Lara, Á.; Aramburu, E. Computer ap-plication for the analysis and design of vertical slot fishways in accordance with the requirements of the target species. Ecol. Eng. 2012, 48, 51–60. [Google Scholar] [CrossRef]
  59. Chen, A.; Wu, M.; Chen, K.; Sun, Z.; Shen, C.; Wang, P. Main issues in research and practice of environmental protection for water conservancy and hydropower projects in China. Water Sci. Eng. 2016, 9, 312–323. [Google Scholar] [CrossRef]
  60. Ma, B.; Dong, F.; Peng, W.Q.; Liu, X.B.; Huang, A.P.; Chen, X.K.; Hou, L.; Wang, W.J.; Si, Y.; Yao, J.W. Numerical simulation of effects of inlet water depth of ecological fishway on the suitability of passing fish. IOP Conf. Ser. Earth Environ. Sci. 2019, 344, 12064. [Google Scholar] [CrossRef]
  61. Yuan, H.; Chen, B.; Sun, Q.; Xie, C.; He, X. Deciphering the effect of variation in slope on flow characteristics in a vertical slot fishway. J. Hydro-Environ. Res. 2024, 54, 1–12. [Google Scholar] [CrossRef]
  62. Mulligan, K.B.; Haro, A.; Towler, B.; Sojkowski, B.; Noreika, J. Fishway Entrance Gate Experiments with Adult American Shad. Water Resour. Res. 2019, 55, 10839–10855. [Google Scholar] [CrossRef]
  63. Shen, C.; Yang, R.; Wang, M.; He, S.; Qing, S. Application of Vortex Identification Methods in Vertical Slit Fishways. Water 2023, 15, 2053. [Google Scholar] [CrossRef]
  64. Calluaud, D.; Pineau, G.; Texier, A.; David, L. Modification of vertical slot fishway flow with a supplementary cylinder. J. Hydraul. Res. 2014, 52, 614–629. [Google Scholar] [CrossRef]
  65. Ouyang, L.; Li, D.; Cui, S.; Wu, X.; Liu, Y.; Han, X.; Zhou, S.; Xu, G.; Tu, X.; Chen, K.; et al. Fish Swimming Behavior and Strategies Under Different Hydrodynamic Conditions in Fishways with Various Vertical Slot Configurations. Fishes 2025, 10, 415. [Google Scholar] [CrossRef]
  66. Quaresma, A.L.; Romão, F.; Branco, P.; Ferreira, M.T.; Pinheiro, A.N. Multi slot versus single slot pool-type fishways: A modelling approach to compare hydrodynamics. Ecol. Eng. 2018, 122, 197–206. [Google Scholar] [CrossRef]
  67. Cai, L.; Hou, Y.; Katopodis, C.; He, D.; Johnson, D.; Zhang, P. Rheotaxis and swimming performance of Perch-barbel (Percocypris pingi, Tchang, 1930) and application to design of fishway entrances. Ecol. Eng. 2019, 132, 102–108. [Google Scholar] [CrossRef]
  68. Chen, X.F.; Liu, S.K.; Wang, Y.M.; Hao, Y.T.; Li, K.F.; Wang, H.T.; Liang, R.F. Restoration of a fish-attracting flow field downstream of a dam based on the swimming ability of endemic fishes: A case study in the upper Yangtze River basin. J. Environ. Manag. 2023, 345, 118694. [Google Scholar] [CrossRef]
  69. Elings, J.; Bruneel, S.; Pauwels, I.S.; Schneider, M.; Kopecki, I.; Coeck, J.; Mawer, R.; Goethals, P.L.M. Finding navigation cues near fishways. Biol. Rev. 2024, 99, 313–327. [Google Scholar] [CrossRef]
Figure 1. Schematic diagram of fishway layout. (a) The initial design of the fishway, (b) two-entrance fishway, (c) plan view of the section from 1# entrance to 2# entrance, and (d) the dimensions of the VSF pool. The dark gray solid structure represents the fishway walls, the blue area represents the water body.
Water 18 00432 g001aWater 18 00432 g001b
Figure 2. Comparison of flow velocities at the cross-sections of X = 200 m and X = 240 m in the fishway using different turbulence models. (a) The cross-section X = 200 m and (b) the cross-section X = 240 m.
Water 18 00432 g002
Figure 3. Variation in velocity in the entrance cross-section under different mesh sizes.
Water 18 00432 g003
Figure 4. The measured and simulated flow velocities were compared at 50 points (at x = 180–300 m near the fishway entrance); these were extracted, and linear regression was carried out for working condition 2. The value was 0.954. The dashed line represents 95% confidence intervals.
Water 18 00432 g004
Figure 5. Longitudinal water depth profiles along the flow direction in the fishway.
Water 18 00432 g005
Figure 6. The length of fishway affected by the drawdown profile distribution between the two entrances in working conditions 4–10.
Water 18 00432 g006
Figure 7. Velocity in the vertical slots along the water flow direction in the fishway.
Water 18 00432 g007
Figure 8. Velocity distributions between the two entrances in working condition 5 (W5), working condition 8 (W8), and working condition 10 (W10).
Water 18 00432 g008
Figure 9. Turbulent kinetic energy along the water flow direction in the fishway in 121–122# pools near the 1# entrance in working condition 1 (W1), working condition 3 (W3), working condition 5 (W5), working condition 8 (W8), working condition 9 (W9), and working condition 10 (W10).
Water 18 00432 g009aWater 18 00432 g009b
Figure 10. Turbulent kinetic energy dissipation rate along the water flow direction in the fishway in 121–122# pools near the 1# entrance in working condition 1 (W1), working condition 3 (W3), working condition 5 (W5), working condition 8 (W8), working condition 9 (W9), and working condition 10 (W10).
Water 18 00432 g010aWater 18 00432 g010b
Figure 11. The maximum allowable water depth difference between the 1# entrance and exit of the fishway under different distances between the two entrances, where M is the allowable maximum water depth difference between the fishway exit and 1# entrance and D is the distance between the 1# entrance and 2# entrance.
Water 18 00432 g011
Table 1. Experimental parameters of the different working conditions.
Working ConditionDistance Between the Two EntrancesWater Depth of ExitWater Depth of 1# EntranceWater Depth of 2# Entrance
W1NA2.5 m2.3 mNA
W2NA2.5 m2.0 mNA
W3NA2.5 m1.8 mNA
W4100 m2.5 m2.0 m1.8 m
W5100 m2.5 m1.8 m1.6 m
W6200 m2.5 m1.8 m1.5 m
W7200 m2.5 m1.7 m1.4 m
W8200 m2.5 m1.6 m1.3 m
W9300 m2.5 m1.6 m1.2 m
W10300 m2.5 m1.5 m1.1 m
Note: NA = not applicable.
Table 2. Relative swimming performances of target fish species.
Species of FishInduced Swimming SpeedCritical Swimming SpeedBrust Swimming Speed
Mean (Range)/(BL/s)Mean (Range)/(BL/s)Mean (Range)/(BL/s)
Schizothorax oconnori0.81 (0.69–0.87)4.13 (3.41–4.25)5.63 (4.17–6.67)
Schizothorax macropogon0.35 (0.26–0.40)3.56 (2.85–3.93)4.87 (4.31–5.47)
Schizothorax waltoni0.98 (0.84–1.05)3.31 (2.95–3.45)4.77 (3.60–5.12)
Table 3. Characteristics of numerical meshes M1, M2 and M3.
MeshCell SizeNumber of CellsMesh Resolution
M10.08 m6,135,676Fine
M20.12 m3,154,628Medium
M30.16 m1,952,352Coarse
Disclaimer/Publisher’s Note: The statements, opinions and data contained in all publications are solely those of the individual author(s) and contributor(s) and not of MDPI and/or the editor(s). MDPI and/or the editor(s) disclaim responsibility for any injury to people or property resulting from any ideas, methods, instructions or products referred to in the content.