Article

Design of a Three-Stage Membrane Brine Concentrator Using Conventional Nanofiltration Modules Toward Zero Liquid Discharge in Wastewater Reclamation

Department of Civil Engineering, Pukyong National University, 45 Yongso-ro, Nam-gu, Busan 48513, Republic of Korea
*
Author to whom correspondence should be addressed.
Water 2026, 18(17), 2204; https://doi.org/10.3390/w18172204
Submission received: 7 August 2026 / Revised: 27 August 2026 / Accepted: 3 September 2026 / Published: 4 September 2026

Abstract

A membrane brine concentrator (MBC) can reduce the concentrate volume entering thermal processes for zero liquid discharge (ZLD). Previous LSRRO-based studies have largely focused on high-salinity brines using modified or specifically selected low-salt-rejection membranes. This study examined the extent to which water recovery could be increased in wastewater reclamation using conventional nanofiltration (NF) modules in MBC processes. Two brackish water reverse osmosis (BWRO) modules and two NF modules were tested in 2000–40,000 mg/L NaCl. NE4040-90 provided the best balance between salt-concentrating performance and required pressure. An NF module model was developed using experimentally estimated water permeability, salt permeability, and mass-transfer coefficient. It reproduced permeate concentration and feed pressure with normalized root-mean-square errors of 5.73% and 1.20%, respectively. The developed NF module model was then iteratively coupled with the upstream BWRO simulation to evaluate an integrated two-stage BWRO and three-stage MBC process. Compared with conventional BWRO, the integrated system increased overall recovery from 81.0% to 95.9%, reduced concentrate flow from 32 to 7 m3/h, predicted a final concentrate concentration of 51,396 mg/L, and maintained permeate concentration at 34 mg/L while remaining below the 41.4 bar pressure limit. The reduced concentrate load lowered total specific energy consumption from 4.5 to 1.6 kWh/m3 of wastewater feed under the adopted ZLD assumptions. Conventional NF modules therefore provide a practical option for high-recovery wastewater reclamation toward ZLD.

1. Introduction

Reverse osmosis (RO) is a pressure-driven membrane process that separates ionic species, such as salts, by applying a pressure greater than the osmotic pressure difference between the feed and permeate sides [1]. Water permeating through the RO membrane forms a low-salinity product stream, while the rejected salts remain on the feed side and generate a concentrated brine. These characteristics make RO suitable for producing freshwater from seawater and brackish water [2]. Approximately 84% of desalination plants worldwide employ RO, accounting for about 69% of global desalinated water production [3].
As global water scarcity intensifies, RO applications for wastewater reclamation are expanding. The main role of RO in these applications is to remove dissolved ions, thereby reducing total dissolved solids (TDS). Industrial wastewaters exhibit a wide range of TDS concentrations. For example, wastewater streams from pulp and paper, textile, and steel industries, which often generate large wastewater volumes, commonly contain approximately 1000–3500 mg/L TDS [4,5,6,7]. Thus, brackish water RO (BWRO) is a key process for wastewater reclamation. Improving water recovery in BWRO systems is essential for reducing water demand and wastewater discharge. Increasing recovery inevitably produces a smaller volume of more concentrated wastewater containing elevated levels of dissolved and residual contaminants. Because direct discharge without proper post-treatment may adversely affect aquatic environments, the management and disposal of RO concentrate have become important challenges [8,9].
Zero liquid discharge (ZLD) has been proposed to address the challenges associated with RO concentrate disposal [10]. ZLD aims to maximize water recovery from wastewater while discharging only solid wastes. Conventional ZLD systems rely on phase-change-based thermal processes, such as evaporation and crystallization, to concentrate and solidify RO concentrate. These processes require substantial energy input. Thermal evaporation typically requires 20–30 kWh/m3 of concentrate, whereas crystallization requires approximately 50–60 kWh/m3, resulting in a considerable economic burden.
To overcome the high energy demand of conventional thermal processes, a membrane brine concentrator (MBC) has been proposed as an alternative [11,12]. MBC is a pressure-driven membrane process that recovers additional water from RO concentrate while further increasing the salt concentration of the residual concentrate. By reducing the flow rate entering downstream evaporation and crystallization processes without changing phase, MBC has the potential to lower the specific energy consumption required for concentrate volume reduction.
Applying conventional high-rejection RO membranes to high-salinity concentrates maintains a low salt concentration on the permeate side, which is desirable for permeate quality but increases the osmotic pressure difference across the membrane. Consequently, a higher applied pressure is required to sustain water permeation [13]. This pressure requirement becomes greater in later stages as the concentrate salinity increases, potentially leading to substantial pressure requirements. To overcome this limitation, several MBC configurations have been proposed, including high-pressure reverse osmosis (HPRO), osmotically assisted reverse osmosis (OARO), and low-salt-rejection reverse osmosis (LSRRO) [13,14,15]. HPRO uses membrane modules and pressure vessels designed for pressures higher than those of conventional RO to overcome the large osmotic pressure difference, whereas OARO introduces a concentrated draw solution on the permeate side to reduce the effective osmotic pressure difference.
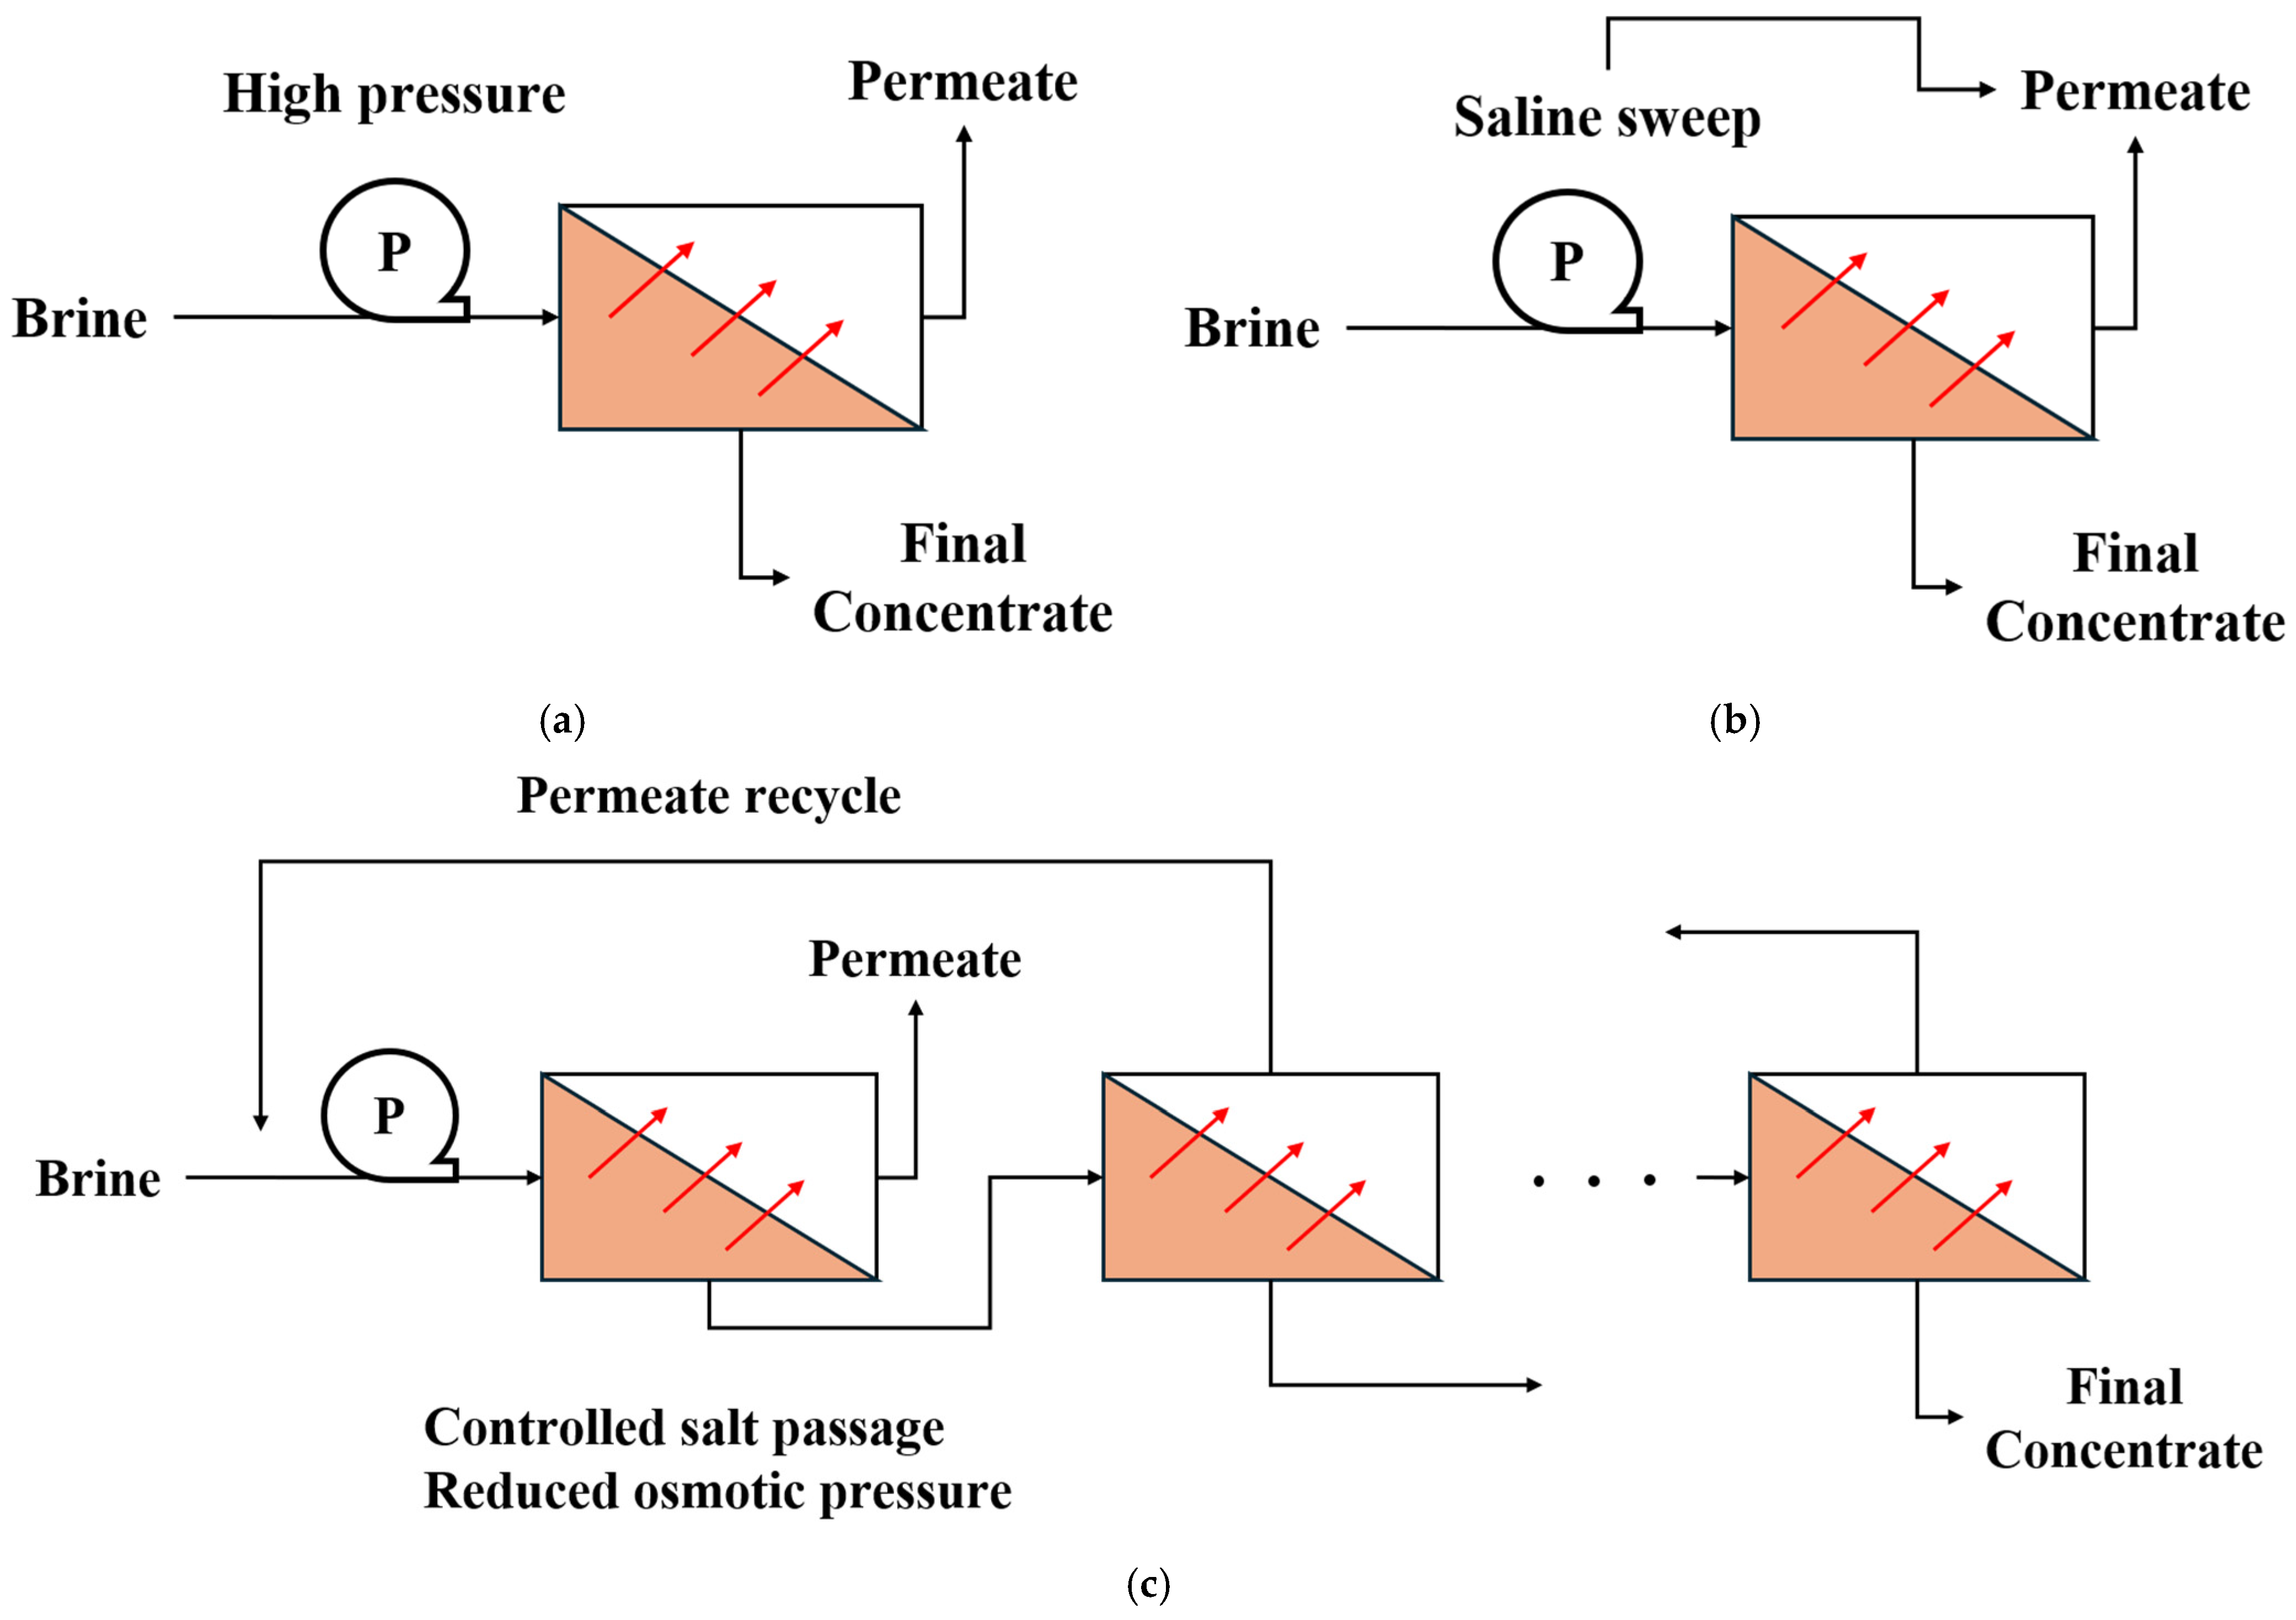
Among these approaches, LSRRO uses low-salt-rejection membranes that allow part of the salt to permeate, thereby reducing the osmotic pressure difference across the membrane [15]. In a multistage LSRRO system, the concentrate from each stage is supplied to the subsequent stage, while the permeate produced in the later stages is recycled to the feed side of the preceding stages for further treatment [16]. The elevated salt concentration on the permeate side lowers the transmembrane osmotic pressure difference, enabling high-salinity concentration at lower pressures than conventional high-rejection RO membranes and thereby reducing the load on downstream evaporation and crystallization processes. Figure 1 schematically compares HPRO, OARO, and LSRRO/MBC, highlighting their different approaches to reducing the pressure requirement for high-salinity brine concentration.
Previous LSRRO-based MBC studies have adopted two main membrane selection strategies. Some studies used conventional polyamide RO membranes whose salt rejection was intentionally reduced through chemical treatment or degradation, as reported by Du et al. (2022) and Van Houghton et al. (2024) [16,17]. Other studies directly applied commercial NF membranes with properties suitable for MBC operation, such as the TS80 membrane evaluated by del Cerro et al. (2026) [18]. In parallel, system-level modeling studies investigated process configurations, operating conditions, energy consumption, and economic optimization of LSRRO-based MBC systems [15,19,20].
Most previous LSRRO-based MBC studies focused on further concentrating seawater reverse osmosis (SWRO) concentrate. Both modeling and experimental studies demonstrated final concentrate concentrations approaching 234 g/L NaCl, indicating that LSRRO can substantially extend the concentration limit of conventional RO [15,17]. Achieving these concentration levels generally required chemically modified RO membranes or specialized low-salt-rejection membranes because of the high osmotic pressure of SWRO concentrate. By comparison, feed salinity in wastewater reclamation is typically within the BWRO range, and substantial concentrate reduction may be achievable without such specially tailored membranes. This possibility supports the use of conventional commercial BWRO and NF modules for MBC applications.
Accordingly, this study evaluated unmodified commercial 4-inch BWRO and NF modules for MBC in wastewater reclamation and ZLD applications. A 2000 mg/L NaCl solution was used as a representative model feed for moderate saline industrial wastewater. The present study should therefore be regarded as a proof-of-concept based on a simplified NaCl-dominated model feed rather than as a direct representation of the complete composition of a specific industrial wastewater. To isolate the effects of salt transport and process configuration, fouling and scaling were excluded from this work under the assumption of adequate pretreatment. Water and salt transport were experimentally characterized over a NaCl concentration range of 2000–40,000 mg/L, and the resulting water permeability, salt permeability, and mass-transfer coefficients were incorporated into a module-by-module MBC design model. The model was then iteratively coupled with the upstream BWRO simulation to compare the performance of conventional BWRO and integrated BWRO–MBC systems in terms of water recovery, concentrate generation, and overall energy consumption when coupled with downstream thermal ZLD processes. The present study integrates experimental characterization of a conventional commercial NF module with iterative BWRO–MBC process modeling and downstream ZLD energy assessment for BWRO-range wastewater reclamation.

2. Methods

2.1. Experimental Evaluation of Commercial 4-Inch Spiral-Wound BWRO and NF Modules

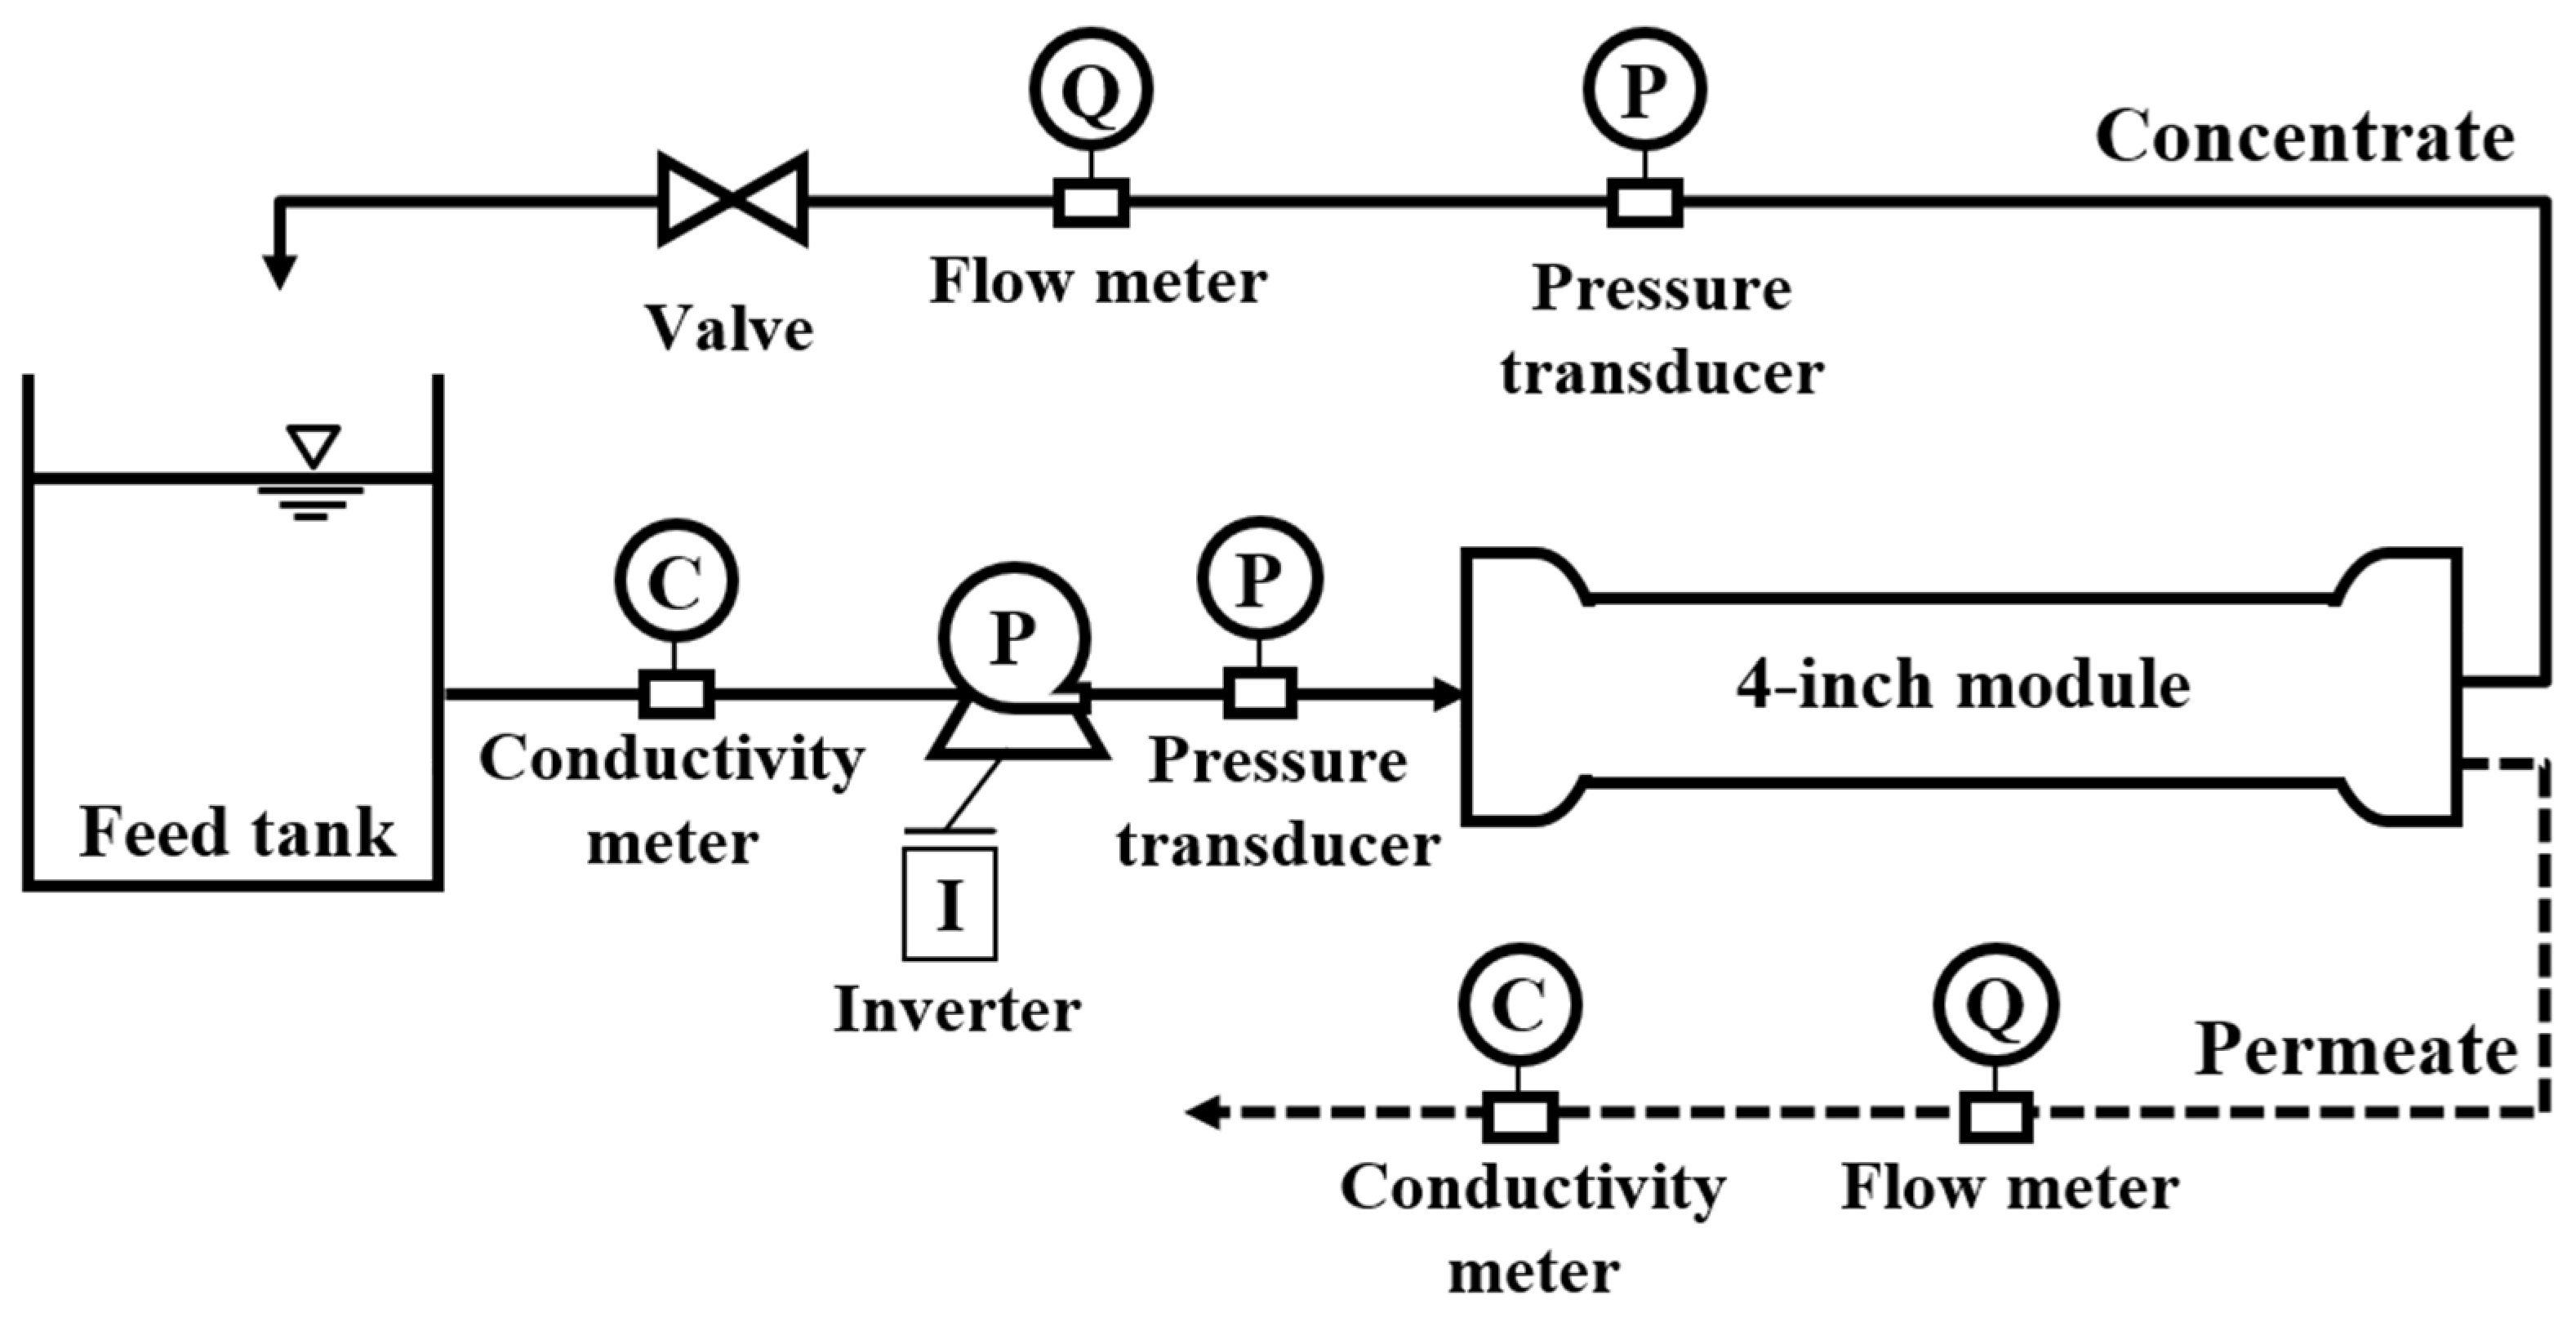
A 4-inch spiral-wound RO membrane test system was used to evaluate the applicability of commercially available membrane modules for LSRRO-based MBC (Figure 2) [1,21]. All BWRO and NF modules evaluated in this study were commercially available spiral-wound products; in this study, the term “design” refers to the process-level configuration of membrane stages and recycle streams rather than to membrane or module fabrication. The system consisted of a 500 L feed tank, a high-pressure pump, a 4-inch pressure vessel, a flow control valve, and sensors for monitoring operating conditions. The feed solution was continuously circulated through the membrane module. Permeate was discharged from the system, whereas the concentrate was returned to the feed tank to increase the feed concentration by up to fivefold. This concentrate-recycle configuration was used to generate a sequence of increasing feed concentrations within a short-term concentration-series experiment rather than to represent long-term operation at a constant feed concentration. The permeate flux and recovery were maintained constant using a variable-frequency drive (VFD). Changes in permeate salinity, salt rejection, and operating pressure were monitored as the feed concentration increased.
Feed pressure was measured using a pressure transmitter (A-10, WIKA Alexander Wiegand SE & Co. KG, Klingenberg am Main, Germany). The permeate and concentrate flow rates were monitored using inline flow meters (P525-1S and 3-2536-P0, GF Signet, Irwindale, CA, USA). Electrical conductivity and temperature sensors were installed in the feed and permeate lines for real-time monitoring during operation. Feed and permeate samples were collected for water quality analysis. The final NaCl concentrations were determined using a portable multiparameter meter (Ultrameter II 6PFCE, Myron L Company, Carlsbad, CA, USA). Conductivity values were converted to NaCl concentrations using a calibration curve established with the same instrument. All sensors were calibrated prior to the experiments.
Commercial 4-inch BWRO (RE4040-BLR and TMG10D) and NF membrane modules (NE4040-40 and NE4040-90) were evaluated for their applicability to LSRRO-based MBC. The effective membrane area, manufacturer-reported salt rejection, permeate flow rate, and standard test conditions of the membrane modules are summarized in Table 1. The BWRO and NF membranes differ primarily in salt rejection and salt permeability, which are expected to influence the osmotic pressure difference and concentration performance during MBC operation.
Tap water supplied by Busan Metropolitan City was used to prepare the feed solutions. The electrical conductivity of the tap water measured before NaCl addition was 314.10 ± 7.64 μS/cm. Sodium bisulfite (SBS; Daejung Chemical, Siheung-si, Republic of Korea) was added to remove residual chlorine and prevent oxidative damage to the polyamide active layer [22]. Purified NaCl (Daejung Chemical, Republic of Korea) was then dissolved to prepare initial feed concentrations of 2000 and 10,000 mg/L.
Before each experiment, the membrane module and test system were operated for approximately 30 min with SBS-treated tap water to stabilize performance. The experiments were conducted at a constant permeate flux of 19 LMH, recovery of 25%, and temperature of 20 °C. At each target feed concentration, pressure, flow rate, and temperature were allowed to stabilize for approximately 10 min while the feed conductivity was continuously monitored. Feed and permeate samples were then collected at the corresponding measured feed concentration. Each complete concentration-series experiment was completed within 6 h. Membrane performance was therefore compared at matched measured feed concentrations under the same permeate flux, recovery, and temperature. NaCl concentrations were then determined using the conductivity–concentration calibration curve. The water and salt transport characteristics of each membrane module were evaluated over a feed concentration range of 2000–40,000 mg/L NaCl, and the resulting transport parameters were used as inputs for the subsequent MBC process design model.

2.2. BWRO Process Design

CSMPRO (version 6.2.2, Toray Advanced Materials Korea Inc., Seoul, Republic of Korea) was used to design the upstream BWRO process and determine the initial feed conditions for the subsequent MBC process. The BWRO process consisted of two stages and employed RE4040-BE 4-inch BWRO membrane modules manufactured by Toray Advanced Materials Korea Inc., Seoul, Republic of Korea. The module has an effective membrane area of 7.9 m2, a nominal permeate flow rate of 9.1 m3/d, and a salt rejection of 99.7%. These specifications were determined under the manufacturer’s standard test conditions of 2000 mg/L NaCl, 15.5 bar, 15% recovery, 25 °C, and pH 6.5–7.0.
The simulation was performed at a feed NaCl concentration of 2000 mg/L and a temperature of 20 °C, with eight membrane modules installed in each pressure vessel. Feedwater quality, membrane array, recovery, and average permeate flux were specified as input parameters, and the program calculated permeate quality, feed pressure, and the flow rate and pressure for each membrane module [1]. The calculation procedure was repeated while adjusting the number of pressure vessels in each stage and the system array until all design constraints listed in Table 2 were satisfied.

2.3. Water and Salt Transport Models and Parameter Estimation

Water transport through the membranes was analyzed using the solution–diffusion model [1]. In pressure-driven membrane processes, the water flux is expressed as a function of the applied pressure and the osmotic pressure difference across the membrane, as shown in Equation (1):
J w = A Δ P Δ π m
where  J w  is the water flux,  A  is the water permeability coefficient,  Δ P  is the pressure difference across the membrane, and  Δ π m  is the osmotic pressure difference across the membrane.  A  was determined from the pure-water experiments to eliminate the effect of osmotic pressure. Under these conditions,  Δ π m  was assumed to be negligible.
Using the water permeability coefficient, A, determined from the pure-water experiments,  Δ π m  during the NaCl experiments was calculated from Equation (1). Because the permeate NaCl concentration,  C p , was measured, the membrane-surface concentration,  C m , was subsequently determined using the van’t Hoff equation [23]:
Δ π m = i R T C m C p
where i is the van’t Hoff factor ( i  = 2 for NaCl), R is the universal gas constant, and T is the absolute temperature. The NaCl concentrations were converted to molar concentrations for the osmotic-pressure calculations.
Salt transport through the membrane was described using the solution–diffusion model:
J s = B C m C p
where  J s  is the salt flux and B is the salt permeability coefficient. At steady state, the salt flux through the membrane is equal to the salt transported with the permeate:
J s = J w C p
Combining Equations (3) and (4), B was calculated using the experimentally measured  J w  and  C p , and the  C m  value determined from Equation (2):
B = J w C p / C m C p
Concentration polarization occurs when salts rejected by the membrane accumulate near the membrane surface, resulting in a higher salt concentration at the membrane surface than in the bulk feed [24]. This concentration increase raises the local osmotic pressure and thereby reduces the effective driving force for water permeation. Based on film theory, the relationship among the water flux and the salt concentrations in the bulk feed, at the membrane surface, and in the permeate is expressed as:
J w = k l n ( C m C p C f C p )
where the mass-transfer coefficient, k, was calculated using the experimentally measured  J w C f , and  C p , together with  C m  determined from Equation (2).
In the ideal solution–diffusion model, B is treated as a membrane constant. However, the B values estimated from the NaCl experiments using Equation (5) varied systematically with feed concentration, and a constant B could not reproduce salt transport over the entire concentration range. Therefore, B was treated as an effective salt permeability coefficient and correlated linearly with  C f :
B = a C f + b
where a and b are regression coefficients.
The mass-transfer coefficient is generally affected by hydrodynamic conditions and solute diffusivity. At a fixed feed concentration of 2000 mg/L NaCl, a baseline correlation for k was developed using the area-normalized module feed flow rate. The parameter u was calculated by dividing the module feed flow rate by the effective membrane area of 7.9 m2 and is expressed in units of m/s. The corresponding k values were calculated using Equation (6). The relationship between k and u was fitted using the following power-law correlation:
k = α u β
where  α  and  β  are regression coefficients.
However, the feed-flow-based correlation alone could not reproduce the measured feed pressures over the full NaCl concentration range. Therefore, a concentration-dependent correction factor was introduced. At each feed concentration, k was adjusted until the model-calculated water flux agreed with the experimental value at the measured feed pressure. The effective mass-transfer coefficient used in the NF module model was finally expressed as:
k = α u β γ C f + δ
where  γ C f + δ  is the concentration-correction factor, and γ and δ are regression coefficients.

2.4. MBC Process Modeling and Iterative Simulation

Conventional BWRO and NF membranes are generally not operated at high TDS concentrations. Consequently, commercial membrane projection software may provide inaccurate predictions under such conditions or may not accept highly concentrated feeds as input. Therefore, a separate NF module-performance model was developed for the MBC stages using the selected NE4040-90 module. For the integrated BWRO–MBC calculation, CSMPRO was used for the upstream BWRO simulation, whereas the high-salinity MBC stages were calculated independently using the NF module model described below. During each iteration, the updated BWRO feed flow rate and NaCl concentration were entered into CSMPRO, while the recovery and temperature were maintained at the specified values. The resulting BWRO concentrate flow rate and NaCl concentration were then transferred to the NF module model as its inlet conditions.
The NF module model was developed based on the solution–diffusion and film theories. The mass-transport parameters A, B, and k were estimated using the procedures described in Section 2.3. The model inputs were the pressure, flow rate, and concentration of the feed entering each membrane module. Using Equations (1)–(9) together with the water and salt mass balances (Equations (10) and (11)), the model calculated the pressure, flow rate, and concentration of the permeate and concentrate streams leaving the module.
Q f = Q p + Q c
Q f C f = Q p C p + Q c C c
where Q and C denote the flow rate and salt concentration, and the subscripts f, p, and c denote feed, permeate, and concentrate, respectively.
For membrane modules connected in series, the concentrate pressure, flow rate, and concentration calculated for the preceding module were used as the feed conditions for the subsequent module [25]. For modules connected in parallel, the total feed flow rate was divided by the number of parallel modules, while the feed pressure and concentration were applied equally to each module.
The same hydraulic and module-configuration constraints listed in Table 2 were retained during the configuration of the MBC stages to provide consistent limiting criteria for module arrangement. These values were applied as upper or lower operating bounds rather than as salinity-specific target conditions or as independently validated high-salinity performance limits. Specifically, the minimum concentrate flow rate, maximum permeate flux, maximum recovery, maximum pressure drop per module, and maximum pressure drop per pressure vessel were constrained according to Table 2. In addition, the feed pressure of each MBC stage was independently constrained below the manufacturer-specified maximum operating pressure of the NE4040-90 module, 41.4 bar. The concentrate from each MBC stage was used as the feed to the subsequent stage. The number of modules connected in series and parallel was selected to maintain the stage operating conditions within these design constraints.
The permeate from each MBC stage was recycled to an upstream process. Lower-salinity permeate streams were returned to the BWRO feed, whereas higher-salinity permeate streams were returned to the feed of the first MBC stage for further treatment.
The BWRO and MBC calculations were iteratively coupled. First, the upstream two-stage BWRO process was simulated using CSMPRO, and the resulting BWRO concentrate was supplied to the independently developed NF module model. The MBC stages were then calculated module-by-module using Equations (1)–(11). Next, the MBC permeate streams were assigned to their specified recycle locations, and the mixed-stream flow rates and NaCl concentrations were recalculated using water and salt mass balances. The updated BWRO feed flow rate and concentration were subsequently supplied to the next CSMPRO calculation. This procedure was repeated until the specified convergence criterion was satisfied. The calculation was terminated when the relative overall flow-balance error, defined based on the raw wastewater inflow and the combined outflow of the BWRO permeate and final MBC concentrate, fell below 0.2%.

2.5. Energy Assessment of Membrane and Thermal ZLD Processes

The energy requirements of membrane-based (i.e., BWRO and MBC) and downstream thermal processes for ZLD were assessed. All specific energy consumption (SEC) values were normalized by the external wastewater feed flow rate. The total power demand of the membrane-based process was obtained by summing the power demands of all pumps. The power demand of pump i was calculated as:
P i = Δ P i   Q i η p η m
where  P i  is the electrical power demand of pump i (W),  Δ P i  is the pressure increase across the pump (Pa),  Q i  is the pump inlet flow rate (m3/s), and  η p  and  η m  are the pump and motor efficiencies, respectively. The pump and motor efficiencies were assumed to be 0.80 and 0.90, respectively [26]. The SEC of the membrane process was calculated as:
S E C m e m = i = 1 n P i / 1000 Q 0
where  Q 0  is the external wastewater feed flow rate (m3/h), and  n  is the number of pumps included in membrane-based processes.
For ZLD, the final concentrate discharged from the membrane-based processes enters thermal evaporation followed by crystallization. The unit energy consumptions of evaporation and crystallization, denoted by  E e v a p  and  E c r y s , were assumed to be 20 and 60 kWh/m3 of the influent to each unit process, respectively [10,27]. The evaporator water recovery,  r e v a p , was assumed to be 0.98 [27]. Therefore, the flow rate entering the crystallization process,  Q c r y s  (m3/h), was calculated as:
Q c r y s = 1 r e v a p Q c , f i n a l
where  Q c , f i n a l  is the final concentrate flow rate (m3/h) discharged from the membrane-based processes. The total power demand of the thermal ZLD processes was calculated as:
P Z L D = E e v a p Q c , f i n a l + E c r y s Q c r y s = Q c , f i n a l E e v a p + 1 r e v a p E c r y s
Because the unit energy consumptions are expressed in kWh/m3 and the flow rates in m3/h,  P Z L D  is expressed in kW. The SEC of the thermal ZLD processes was then calculated as:
S E C Z L D = P Z L D Q 0
Finally, the total SEC of each process configuration was calculated by combining the membrane and thermal ZLD contributions:
S E C t o t a l = S E C m e m + S E C Z L D
Thus,  S E C m e m S E C Z L D , and  S E C t o t a l  are all expressed in kWh per cubic meter of external wastewater feed.

3. Results and Discussion

3.1. Evaluation of Conventional BWRO and NF Membrane Modules for MBC Applications

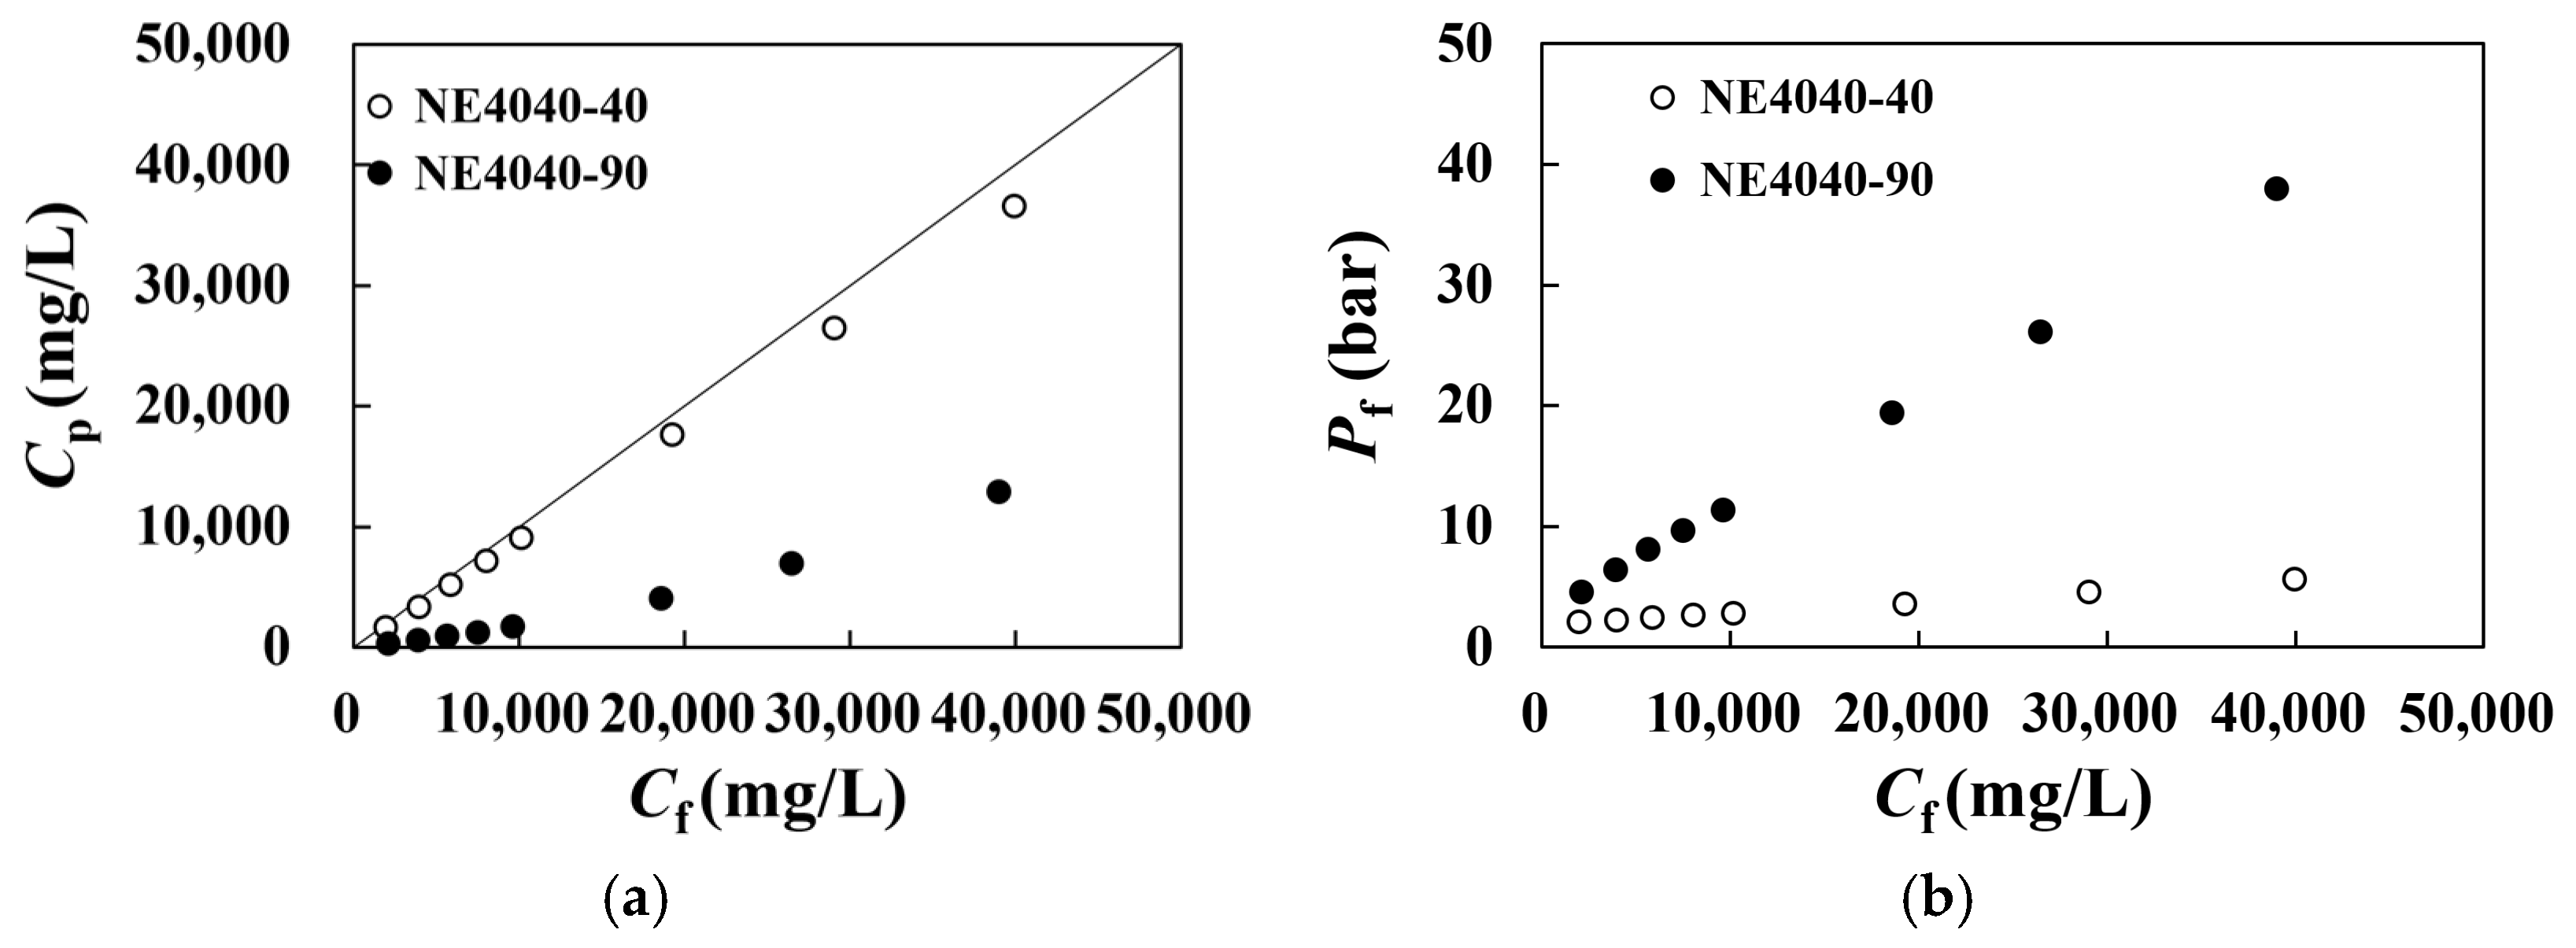
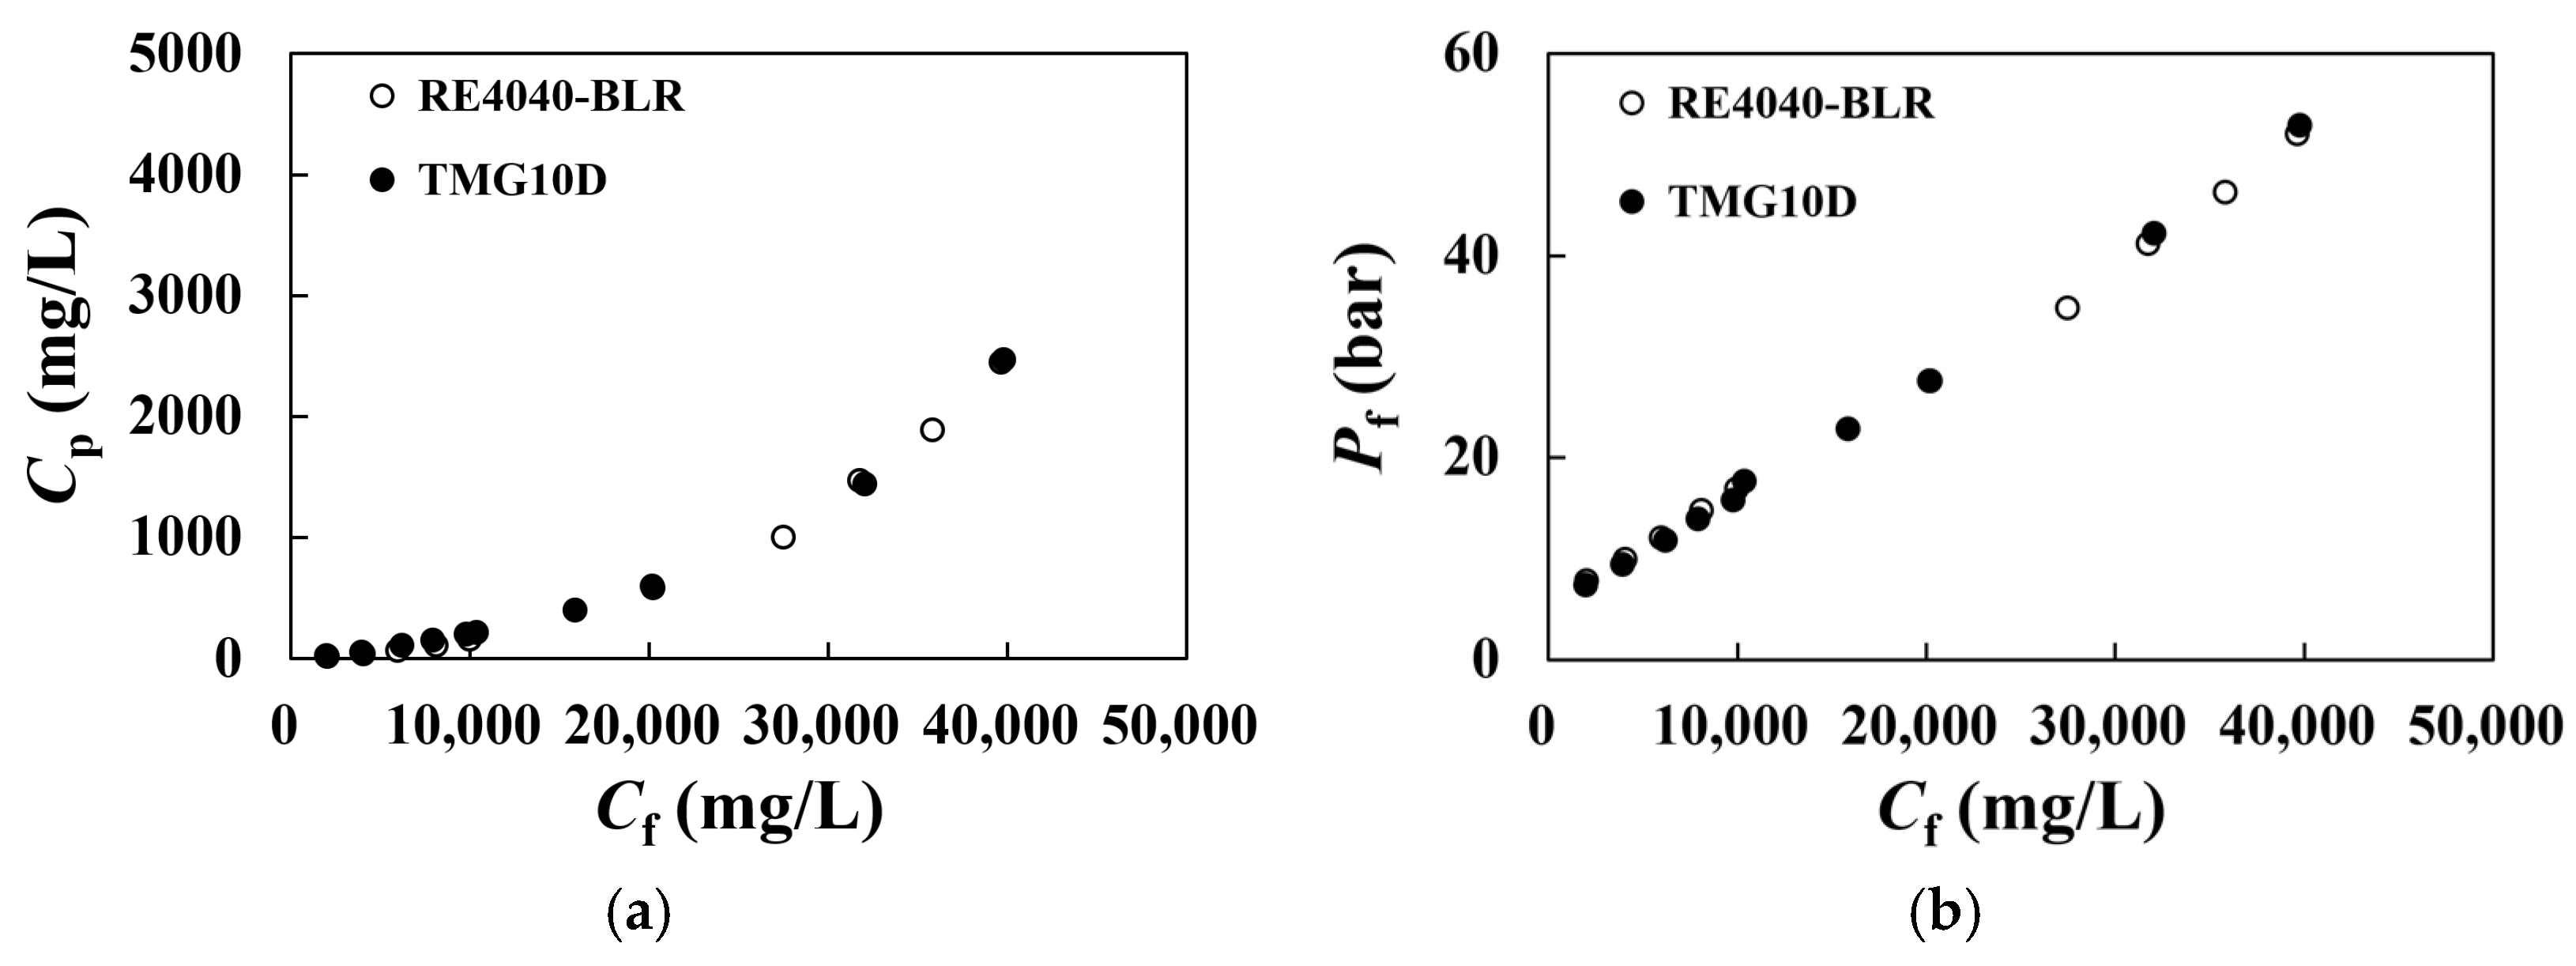
Figure 3 and Figure 4 compare the permeate concentration and required feed pressure of two BWRO and two NF membrane modules as the feed NaCl concentration increased from 2000 to 40,000 mg/L. For both BWRO modules, RE4040-BLR and TMG10D, the permeate concentration increased with the feed concentration but remained substantially lower than the feed concentration (Figure 3a). This result indicates that both membranes maintained high salt rejection even under high-salinity conditions.
The required feed pressure of the BWRO modules increased almost linearly with feed concentration (Figure 3b). At feed concentrations above approximately 30,000 mg/L, the required pressure approached or exceeded the manufacturer-specified maximum operating pressure of 41.4 bar and reached more than 50 bar at 40,000 mg/L. Thus, although the BWRO modules maintained relatively low permeate concentrations, their high salt rejection resulted in a large osmotic pressure difference and excessive pressure requirements for high-concentration MBC operation.
The two NF modules showed distinctly different salt-transport characteristics (Figure 4). For NE4040-40, the permeate concentration was close to the feed concentration over the entire concentration range and reached approximately 36,000 mg/L at a feed concentration of 40,000 mg/L (Figure 4a). Its required feed pressure remained low, ranging from 2 to 6 bar (Figure 4b). However, its very low salt rejection provided insufficient salt retention to substantially increase the concentrate salinity and would result in a high salt-recirculation load when the permeate is returned upstream in the MBC system.
In contrast, NE4040-90 exhibited intermediate salt passage between the BWRO modules and NE4040-40. At a feed concentration of 40,000 mg/L, its permeate concentration and required feed pressure were approximately 13,000 mg/L and 38 bar, respectively. Compared with the BWRO modules, its higher salt passage reduced the osmotic pressure difference and maintained the required pressure below the maximum operating pressure. At the same time, its higher salt rejection than NE4040-40 provided sufficient salt retention while limiting excessive salt passage into the permeate. Therefore, NE4040-90 provided the most appropriate balance between salt-concentrating performance and pressure reduction and was selected for MBC application.
Duplicate experiments were conducted for NE4040-90 because this module was used for subsequent transport-parameter estimation and model development for MBC system design. The relative standard deviations of the duplicate measurements ranged from 1.19% to 6.42% for permeate concentration and from 0.17% to 4.05% for feed pressure, indicating satisfactory experimental reproducibility. Duplicate tests were not conducted for the other three modules because they were excluded during the initial screening and were not used for subsequent model development. The membrane tests should be interpreted as short-term concentration-dependent performance measurements rather than long-term stability tests. Sustained operation at high pressure and salinity may induce membrane compaction, flux decline, and changes in salt passage. Because each concentration-series experiment was completed within 6 h, cumulative membrane degradation and compaction over extended operation were not quantified in this study. Therefore, long-term validation under the proposed high-pressure and high-salinity conditions is required before practical implementation.

3.2. Development and Verification of an NF Module Model for MBC Applications

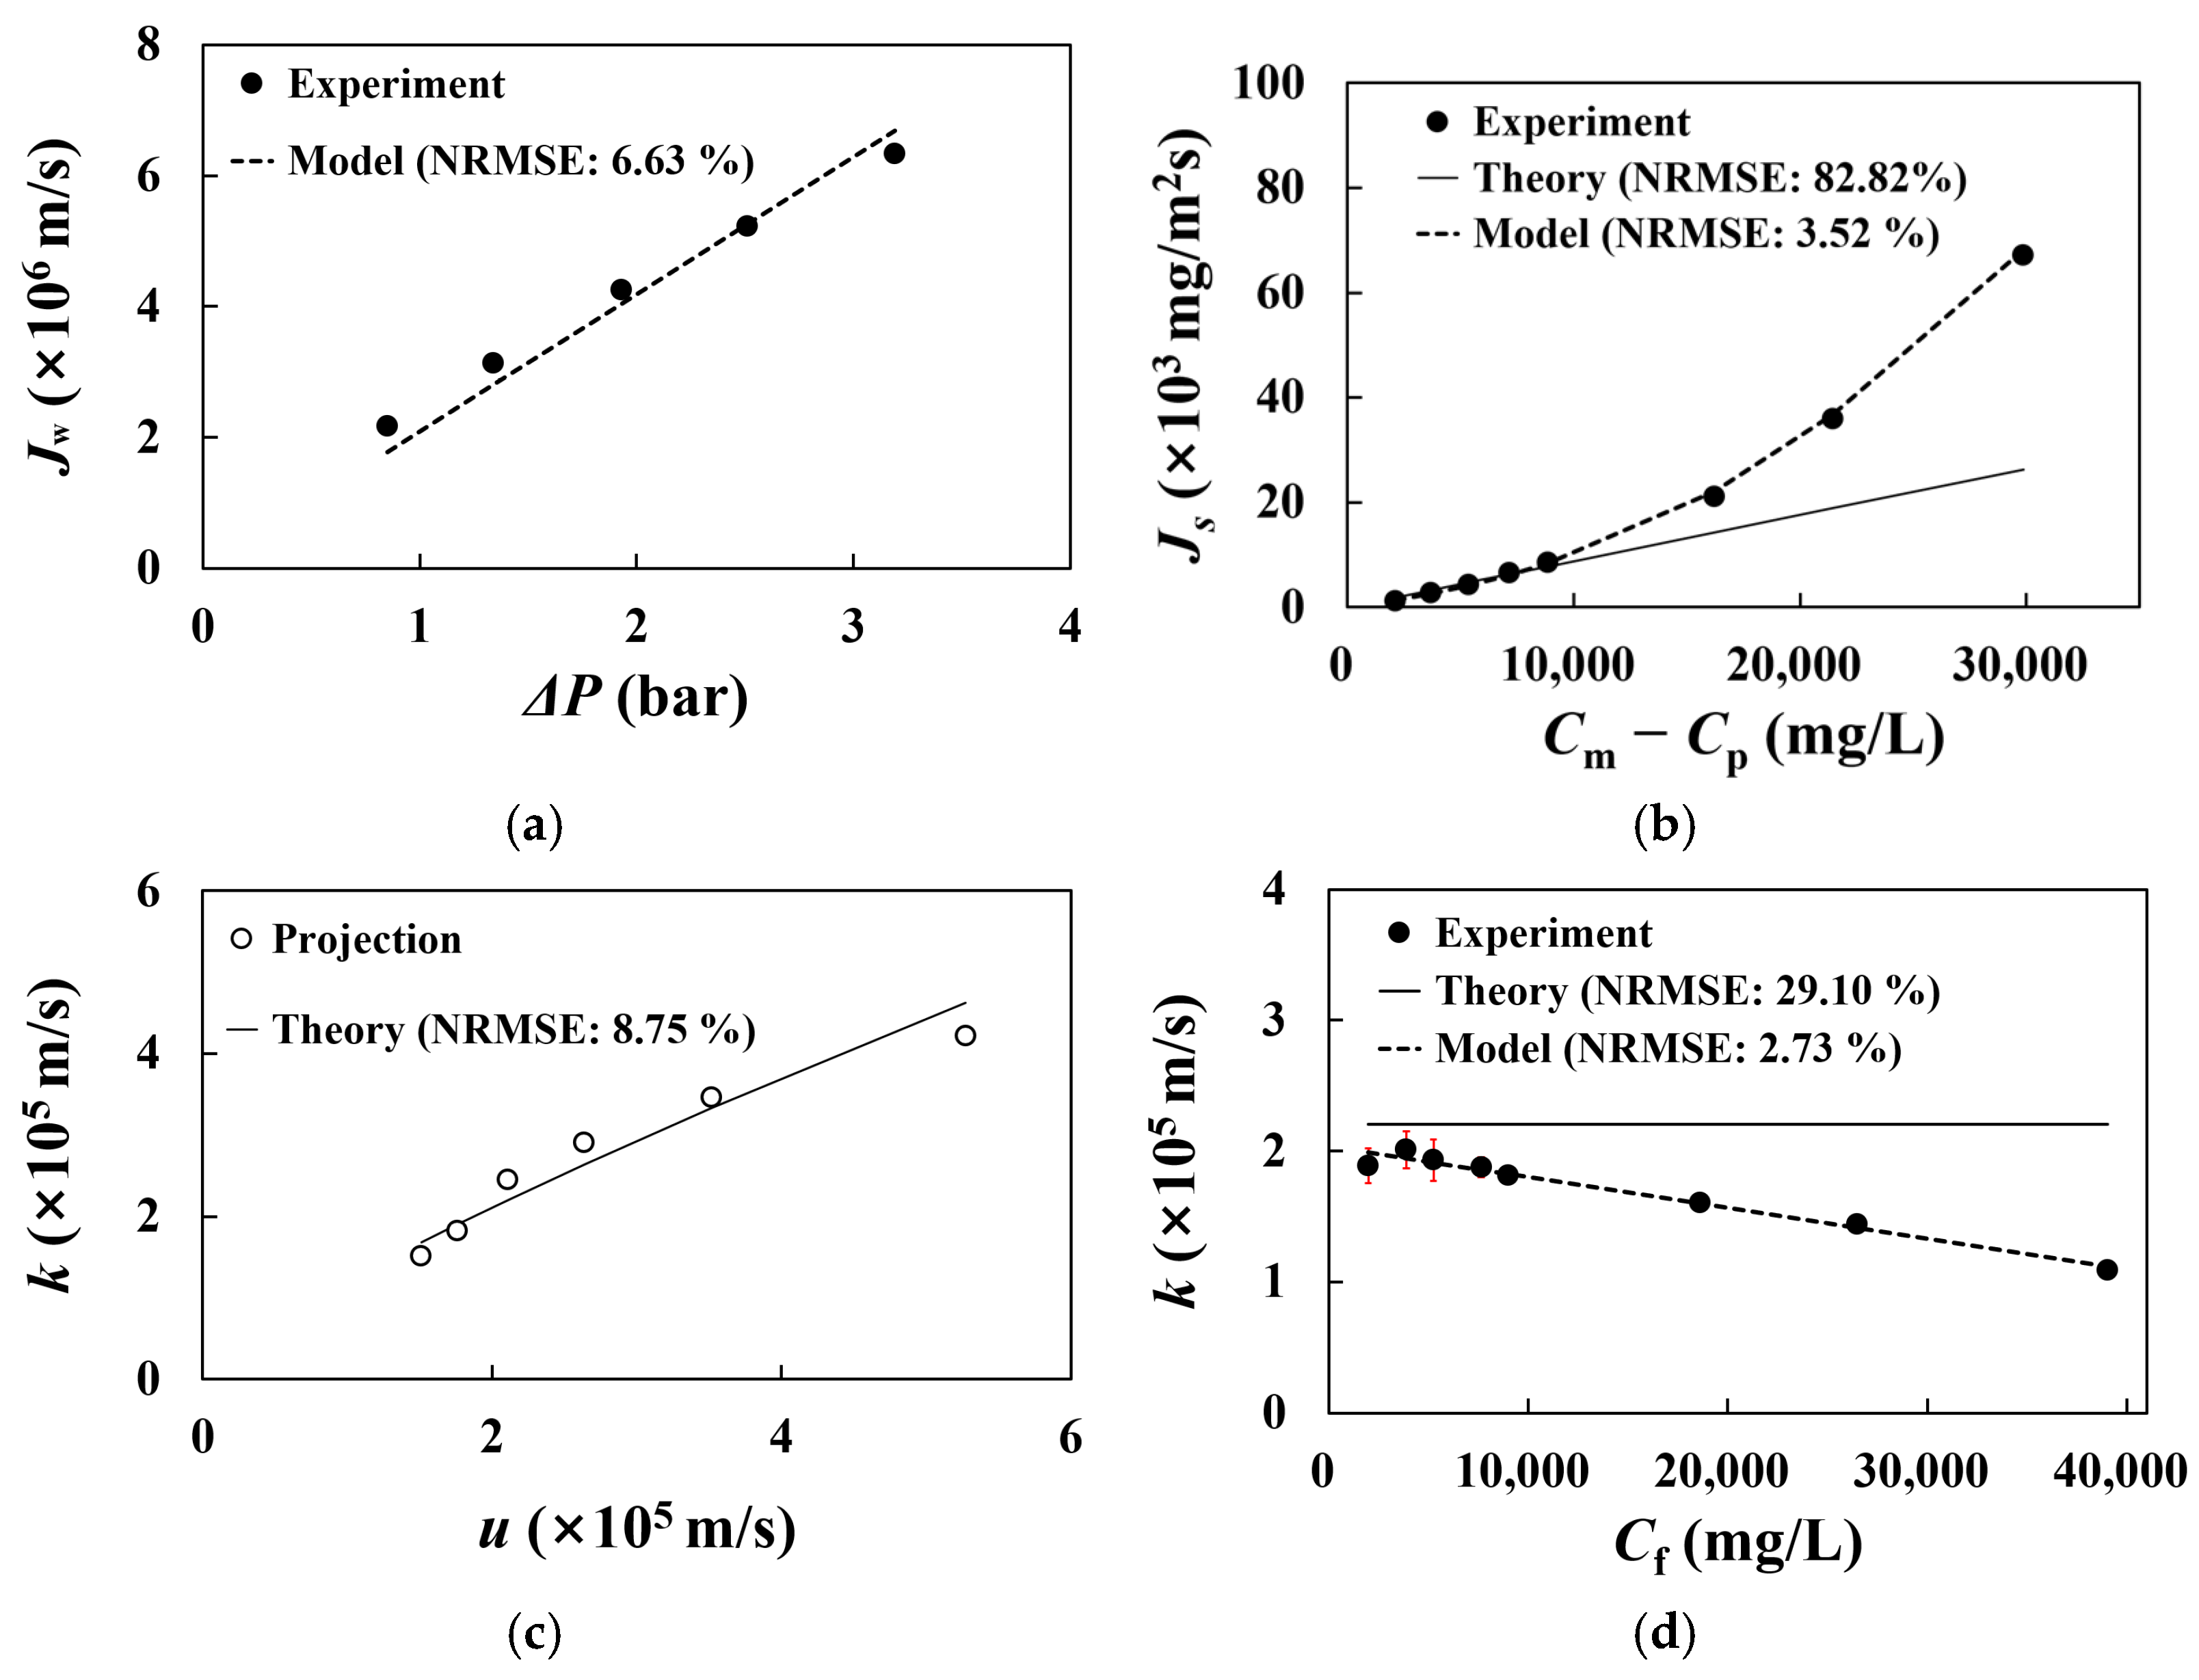
An NF module model was developed for the selected NE4040-90 module using the transport equations and parameter-estimation procedures described in Section 2.3. Figure 5 summarizes the estimation of A, B, and k, together with the empirical corrections introduced for high-salinity conditions. The pure-water flux increased linearly with the transmembrane pressure difference (Figure 5a). A constant water permeability coefficient reproduced the experimental results with a normalized root-mean-square error (NRMSE) of 6.63%. NRMSE was defined as the root-mean-square error between the modeled and experimental values normalized by the mean experimental value [28].
For the NaCl experiments, the salt flux increased more rapidly than predicted by the constant-B formulation as  C m C p  increased (Figure 5b). The constant-B formulation substantially underestimated salt transport at high feed concentrations, resulting in an NRMSE of 82.82%. The effective B value calculated at each experimental condition increased approximately linearly with  C f . Incorporating this concentration dependence reduced the NRMSE to 3.52%. Substitution of the fitted coefficients into Equation (7) gave:
B = ( 4.51 × 10 11 ) C f + 5.21 × 10 7
where  C f  is expressed in mg/L and B in m/s. Accordingly, B was treated as an effective concentration-dependent salt permeability coefficient rather than a constant membrane property. The use of larger effective B values at higher salinities is also consistent with previous LSRRO optimization studies in which different B values were assigned to individual stages [20]. The present experiments did not independently resolve changes in membrane structure or solute partitioning, so the observed increase in B cannot be attributed to a single transport mechanism. In this study, B is therefore interpreted as an effective empirical parameter representing the observed salinity-dependent salt transport rather than as direct evidence of a specific mechanism.
At a fixed feed concentration of 2000 mg/L NaCl, a feed-flow-based correlation for k was derived from the CSMPRO projection using the area-normalized module feed flow rate:
k = 0.13 u 0.81
where both k and u  are  expressed in m/s. This correlation reproduced the projection-derived values with an NRMSE of 8.75% (Figure 5c). However, when applied over the entire experimental concentration range, it did not adequately represent the effective k values back-calculated from the measured feed pressures (Figure 5d). The effective k decreased as  C f  increased, and the feed-flow-based correlation resulted in an NRMSE of 29.10%.
Because the membrane module, temperature, permeate flux, and recovery were maintained constant during the NaCl experiments, the remaining deviation was represented by an empirical concentration-correction factor. Substitution of the fitted coefficients into Equation (9) gave:
k = 0.13 u 0.81 × [ 1.12 × 10 5 ) C f + 0.97
The concentration-corrected model reduced the NRMSE to 2.73%. This correction should be interpreted as an effective parameter accounting for high-salinity effects that were not captured by feed-flow-based film-theory correlation, rather than as a universal concentration dependence of k. Because the concentration dependencies of B and k were obtained from experiments with the NE4040-90 module and NaCl solutions, the developed model should be regarded as semi-empirical. Application to other NF membranes, salt species, or mixed-salt solutions would require re-estimation and validation of the corresponding transport parameters. Physics-integrated modeling and explicit consideration of chemical transformation pathways have also been applied to complex water systems [29,30]. These approaches provide complementary directions for extending the empirical correlations used in the present model to more complex solution conditions.
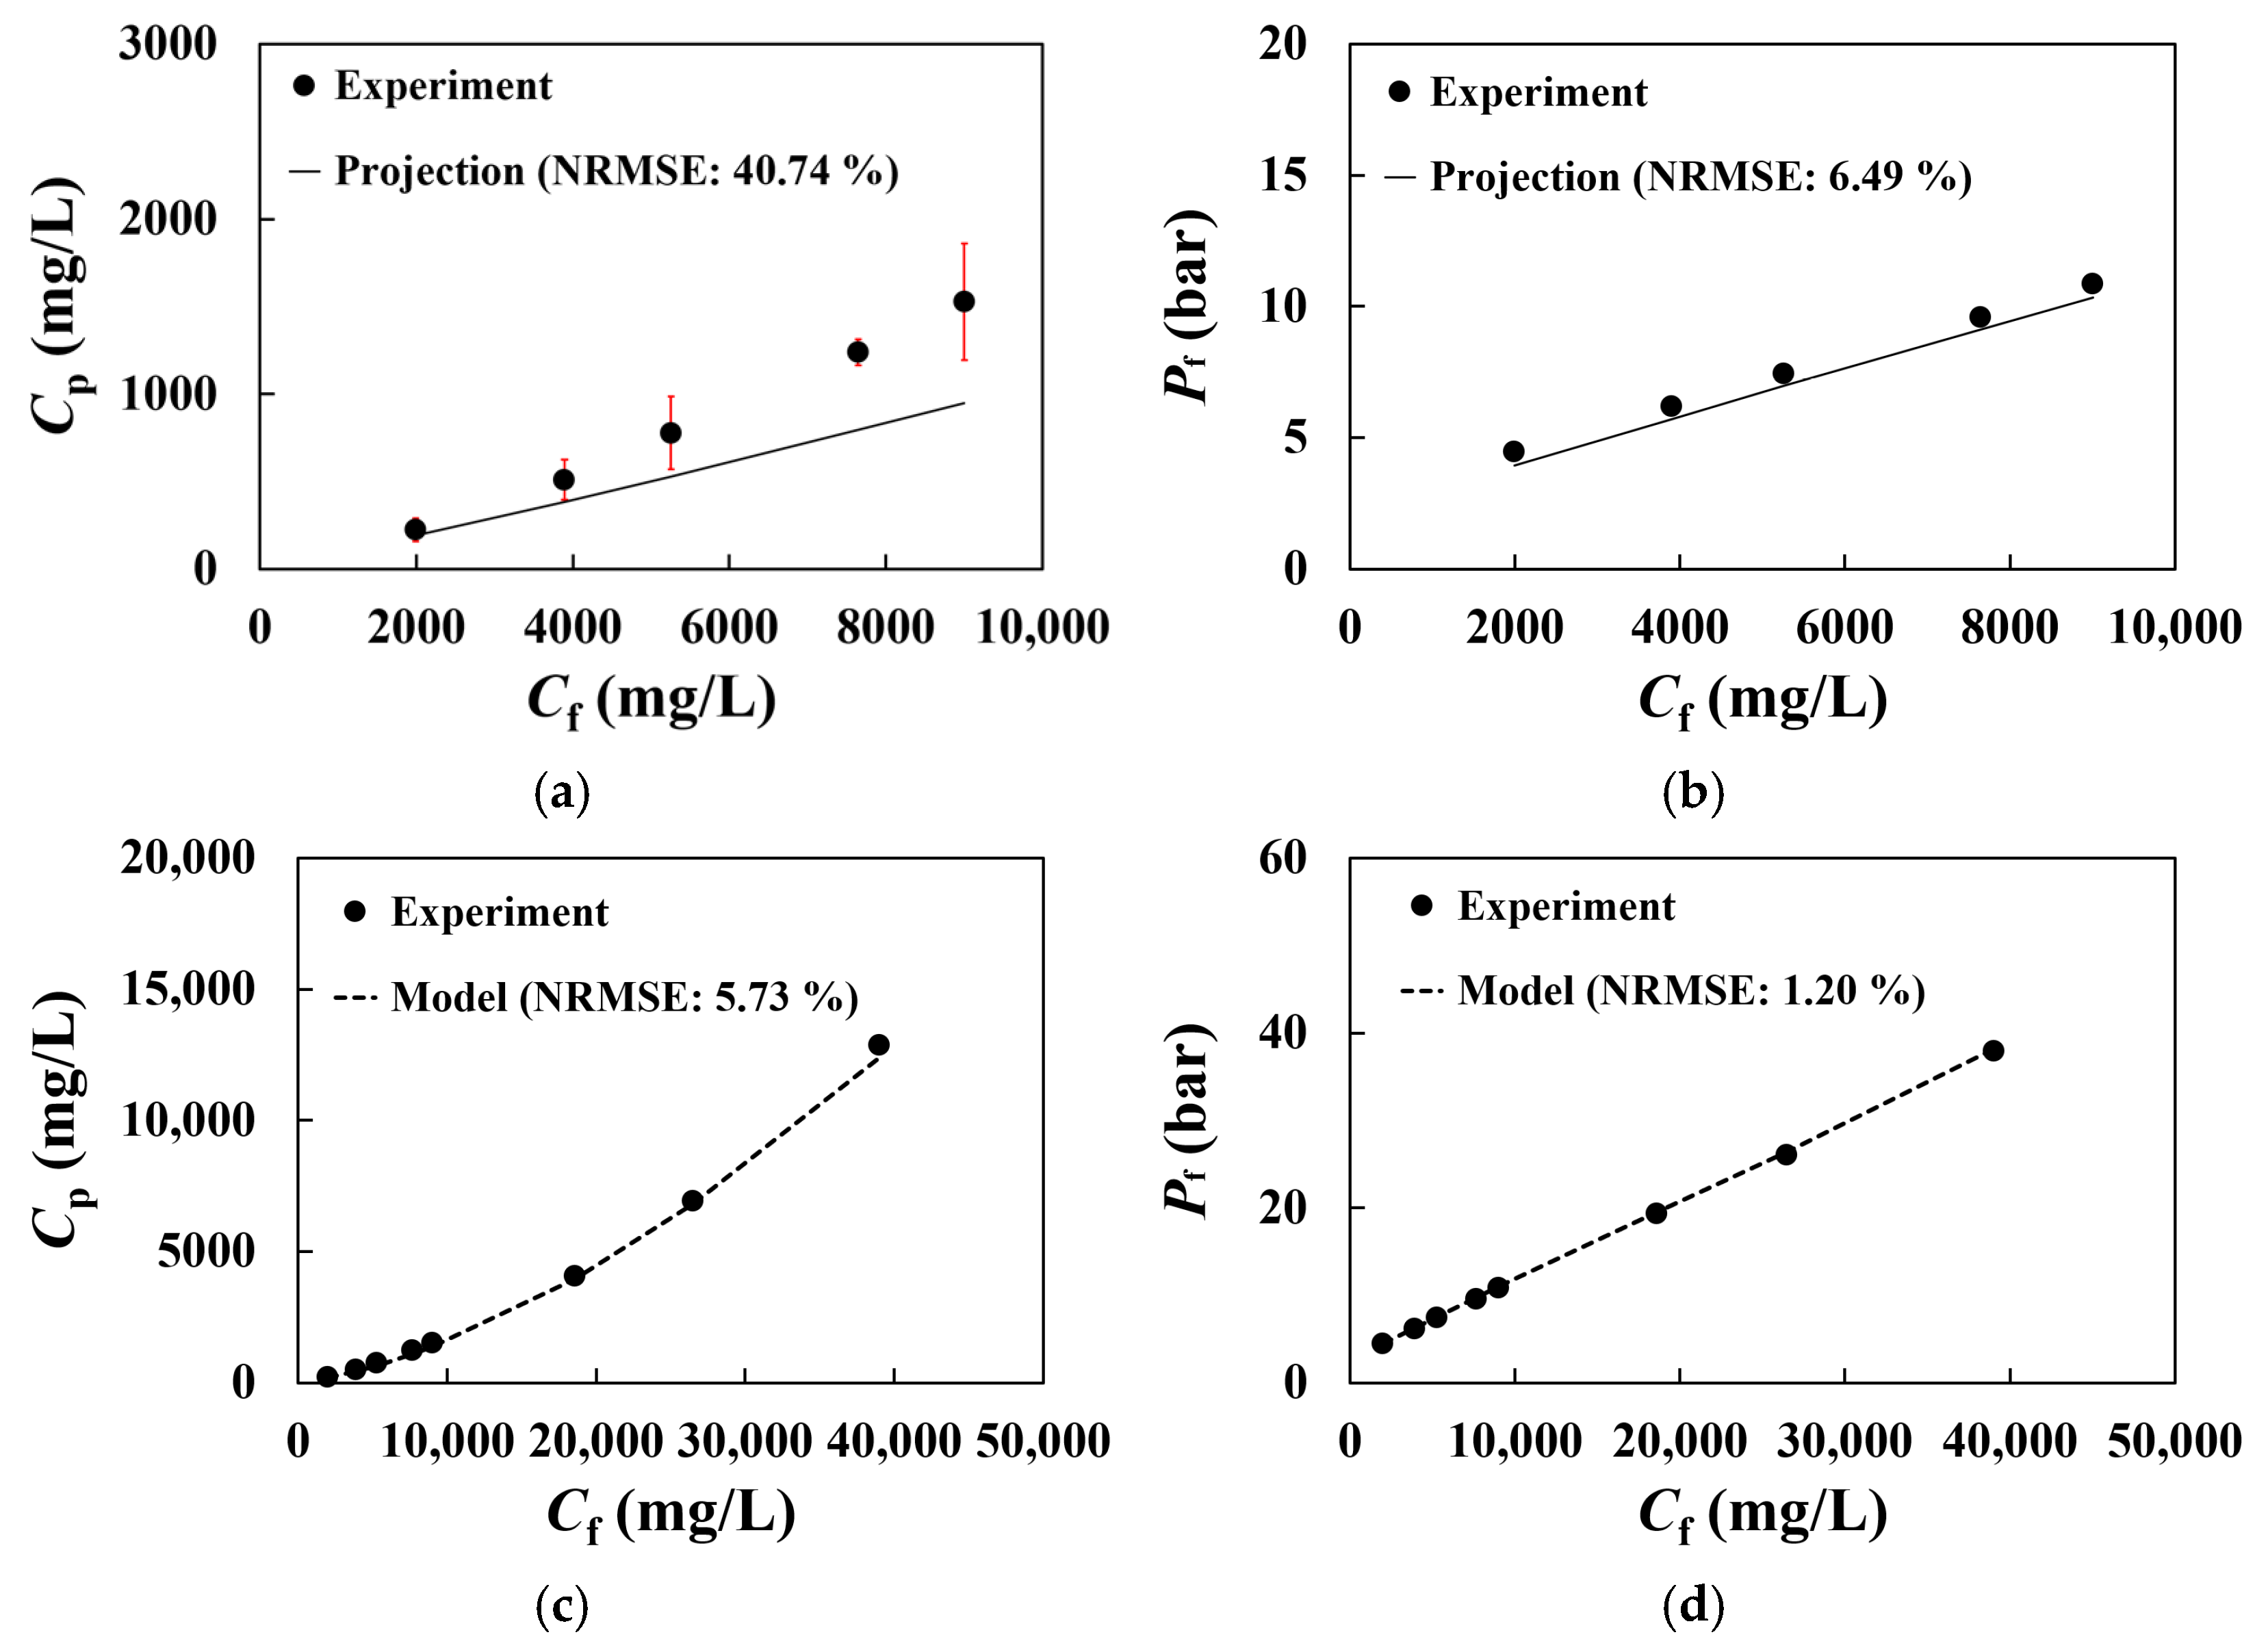
Figure 6 compares the measured permeate concentrations and required feed pressures with the CSMPRO projection and the developed NF module model. Because CSMPRO did not accept feed NaCl concentrations above 10,000 mg/L, its predictions were evaluated only over the range of 2000–10,000 mg/L. Within this range, the permeate concentration predicted by the projection showed an NRMSE of 40.74%, with the discrepancy becoming more pronounced above 4000 mg/L NaCl (Figure 6a). In contrast, the projection reproduced the required feed pressure reasonably well, with an NRMSE of 6.49% (Figure 6b). This result indicates that the salt-passage prediction provided by CSMPRO projection was not adequate for the elevated salinity conditions examined in this study.
In contrast, the developed NF module model reproduced both permeate concentration and required feed pressure over the full experimental range of 2000–40,000 mg/L NaCl (Figure 6c,d). The NRMSE values were 5.73% for permeate concentration and 1.20% for feed pressure. These results demonstrate that the developed model adequately represented the salt passage and pressure requirement of the NE4040-90 module over the experimentally tested concentration range of 2000–40,000 mg/L NaCl. The reported NRMSE values therefore represent model performance only within this experimentally validated range. The use of the van’t Hoff equation may raise concerns regarding solution non-ideality at elevated NaCl concentrations. The difference between osmotic pressures calculated using the van’t Hoff equation and OLI Stream Analyzer was reported to be negligible at NaCl concentrations below 1.5 M [23]. The NaCl concentrations considered in the present study were within this range, supporting the use of the van’t Hoff equation for the osmotic-pressure calculations.

3.3. Design of High-Recovery Membrane Systems with MBC for Wastewater Reclamation and ZLD

Three membrane process configurations were designed to maximize overall water recovery while satisfying the applicable design constraints listed in Table 2: (1) a conventional two-stage BWRO process, (2) a two-stage BWRO process with concentrate return, and (3) an integrated two-stage BWRO and three-stage MBC process using NE4040-90 modules. All configurations were evaluated at an external wastewater flow rate of 170 m3/h and an NaCl concentration of 2000 mg/L.
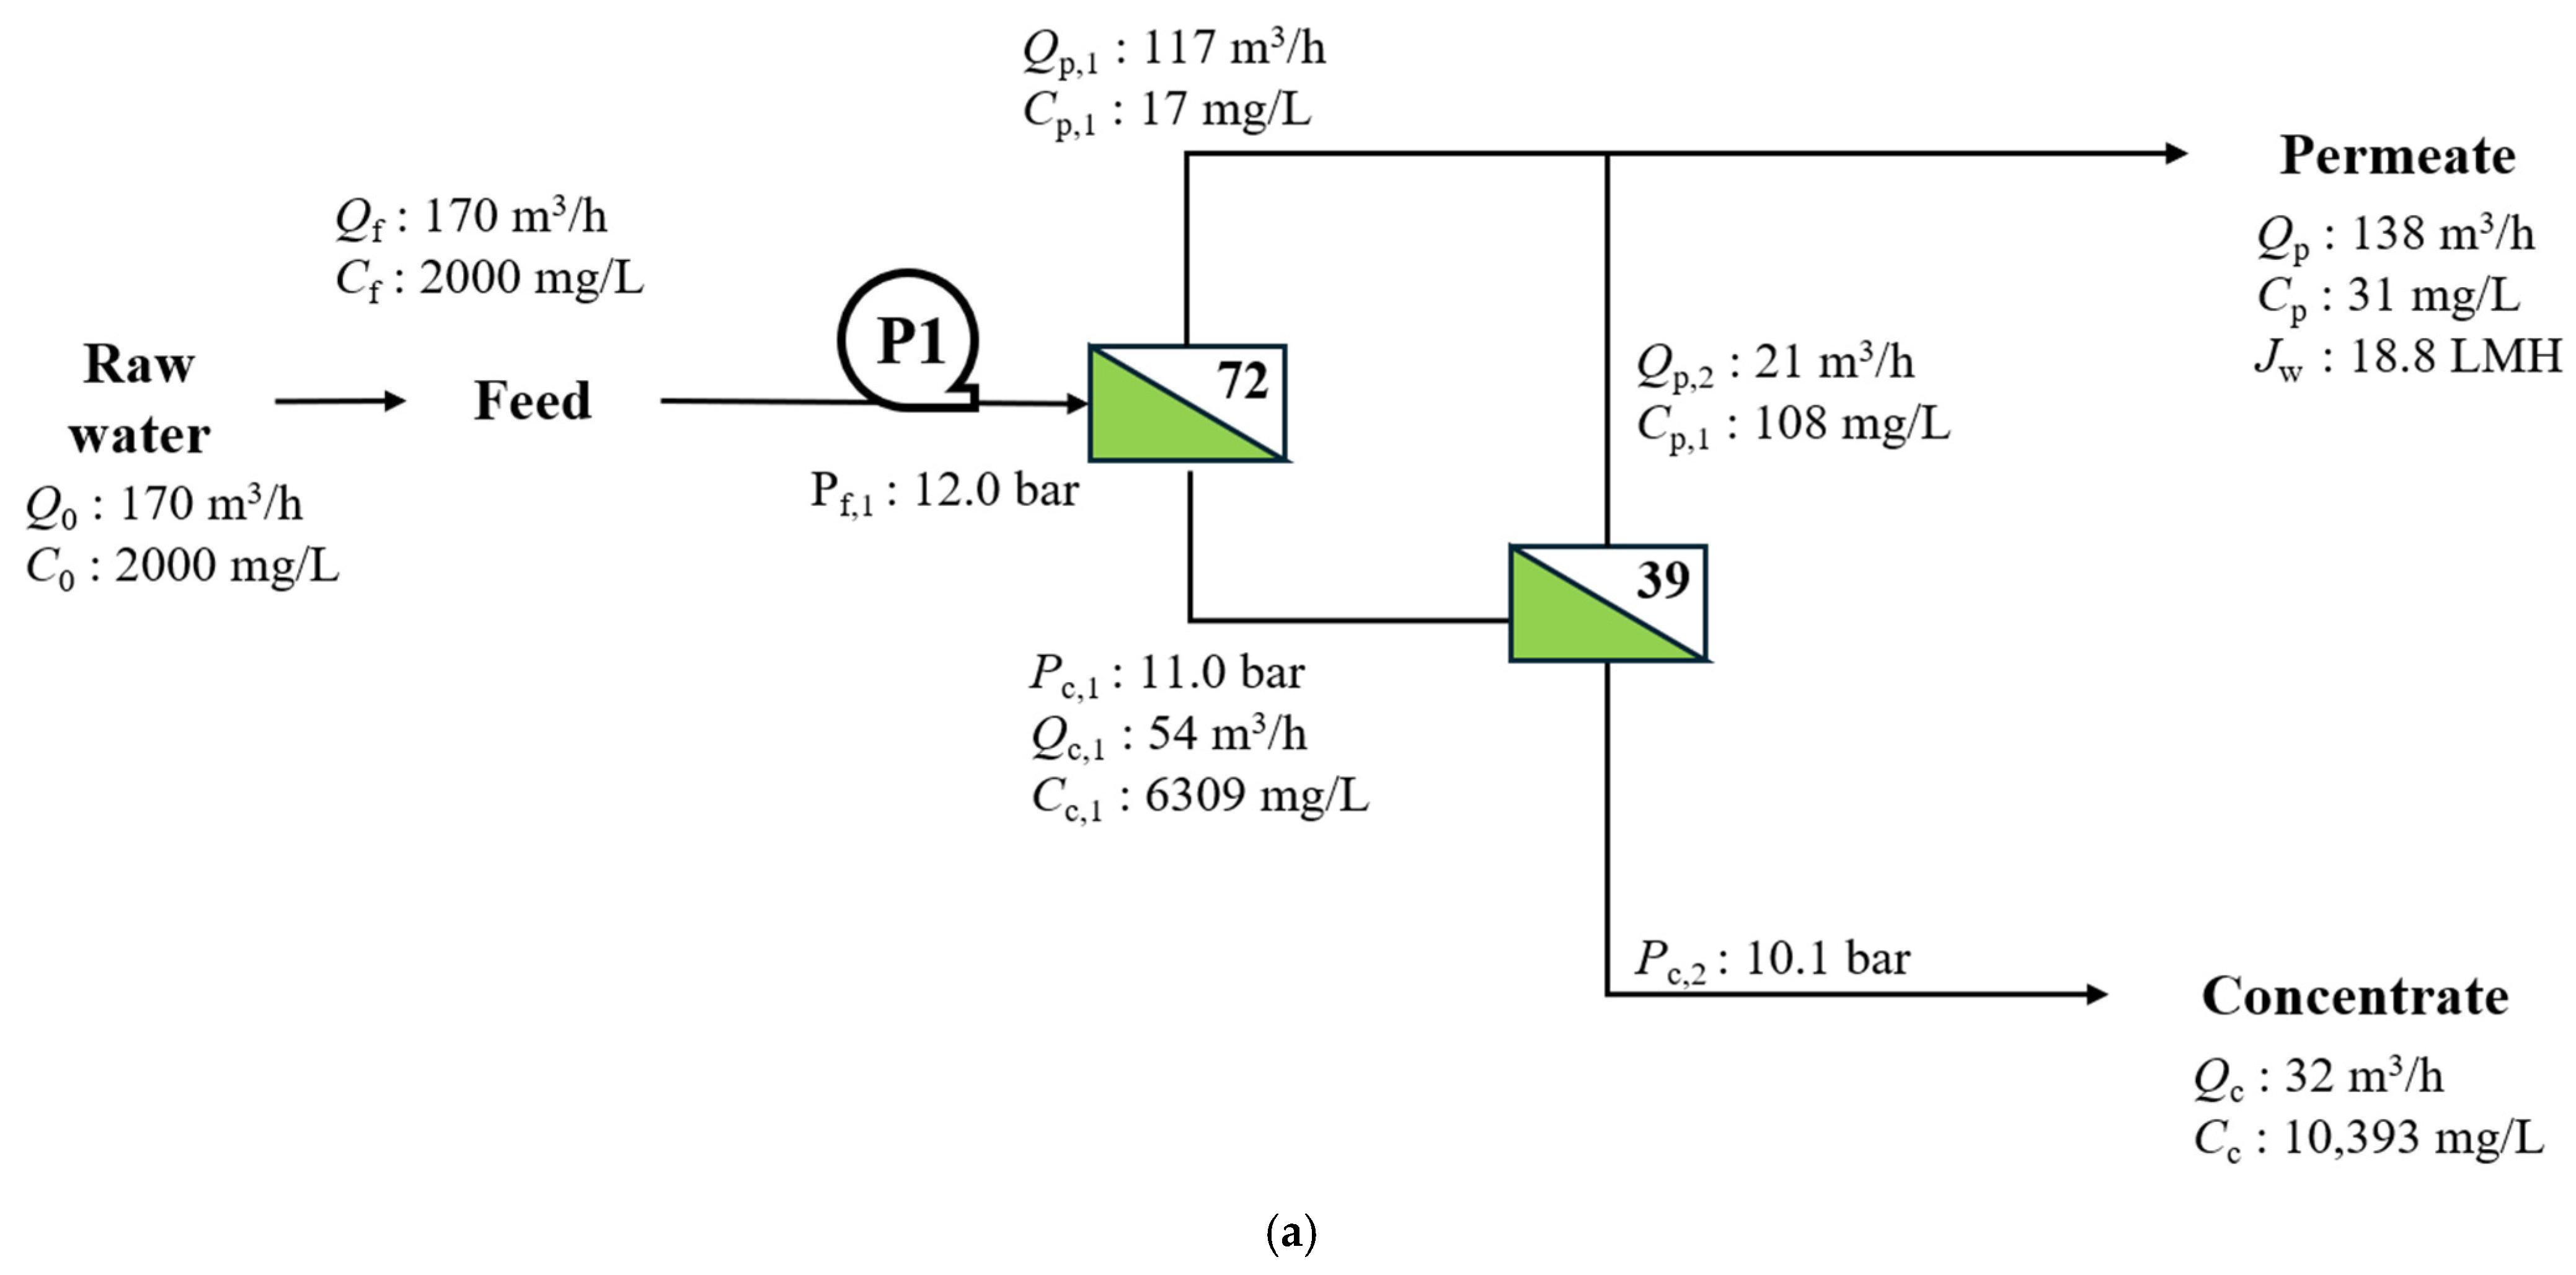
Figure 7 and Figure 8 use the same notation as that defined in Section 2. The subscripts  f p c  and  r  denote feed, permeate, concentrate, and return, respectively, whereas the subscript 0 denotes the external wastewater. A second numerical subscript, such as 1, 2, or 3, indicates the corresponding process stage. Variables without a stage number represent the overall feed, permeate, or concentrate of the system. The number shown inside each membrane symbol denotes the number of pressure vessels connected in parallel, with eight membrane modules connected in series within each pressure vessel.
In the conventional two-stage BWRO process, the external wastewater was fed to the first BWRO stage at 12.0 bar (Figure 7a). The process produced 138 m3/h of permeate with an average NaCl concentration of 31 mg/L and discharged 32 m3/h of concentrate at 10,393 mg/L. The resulting overall recovery was 81.0%.
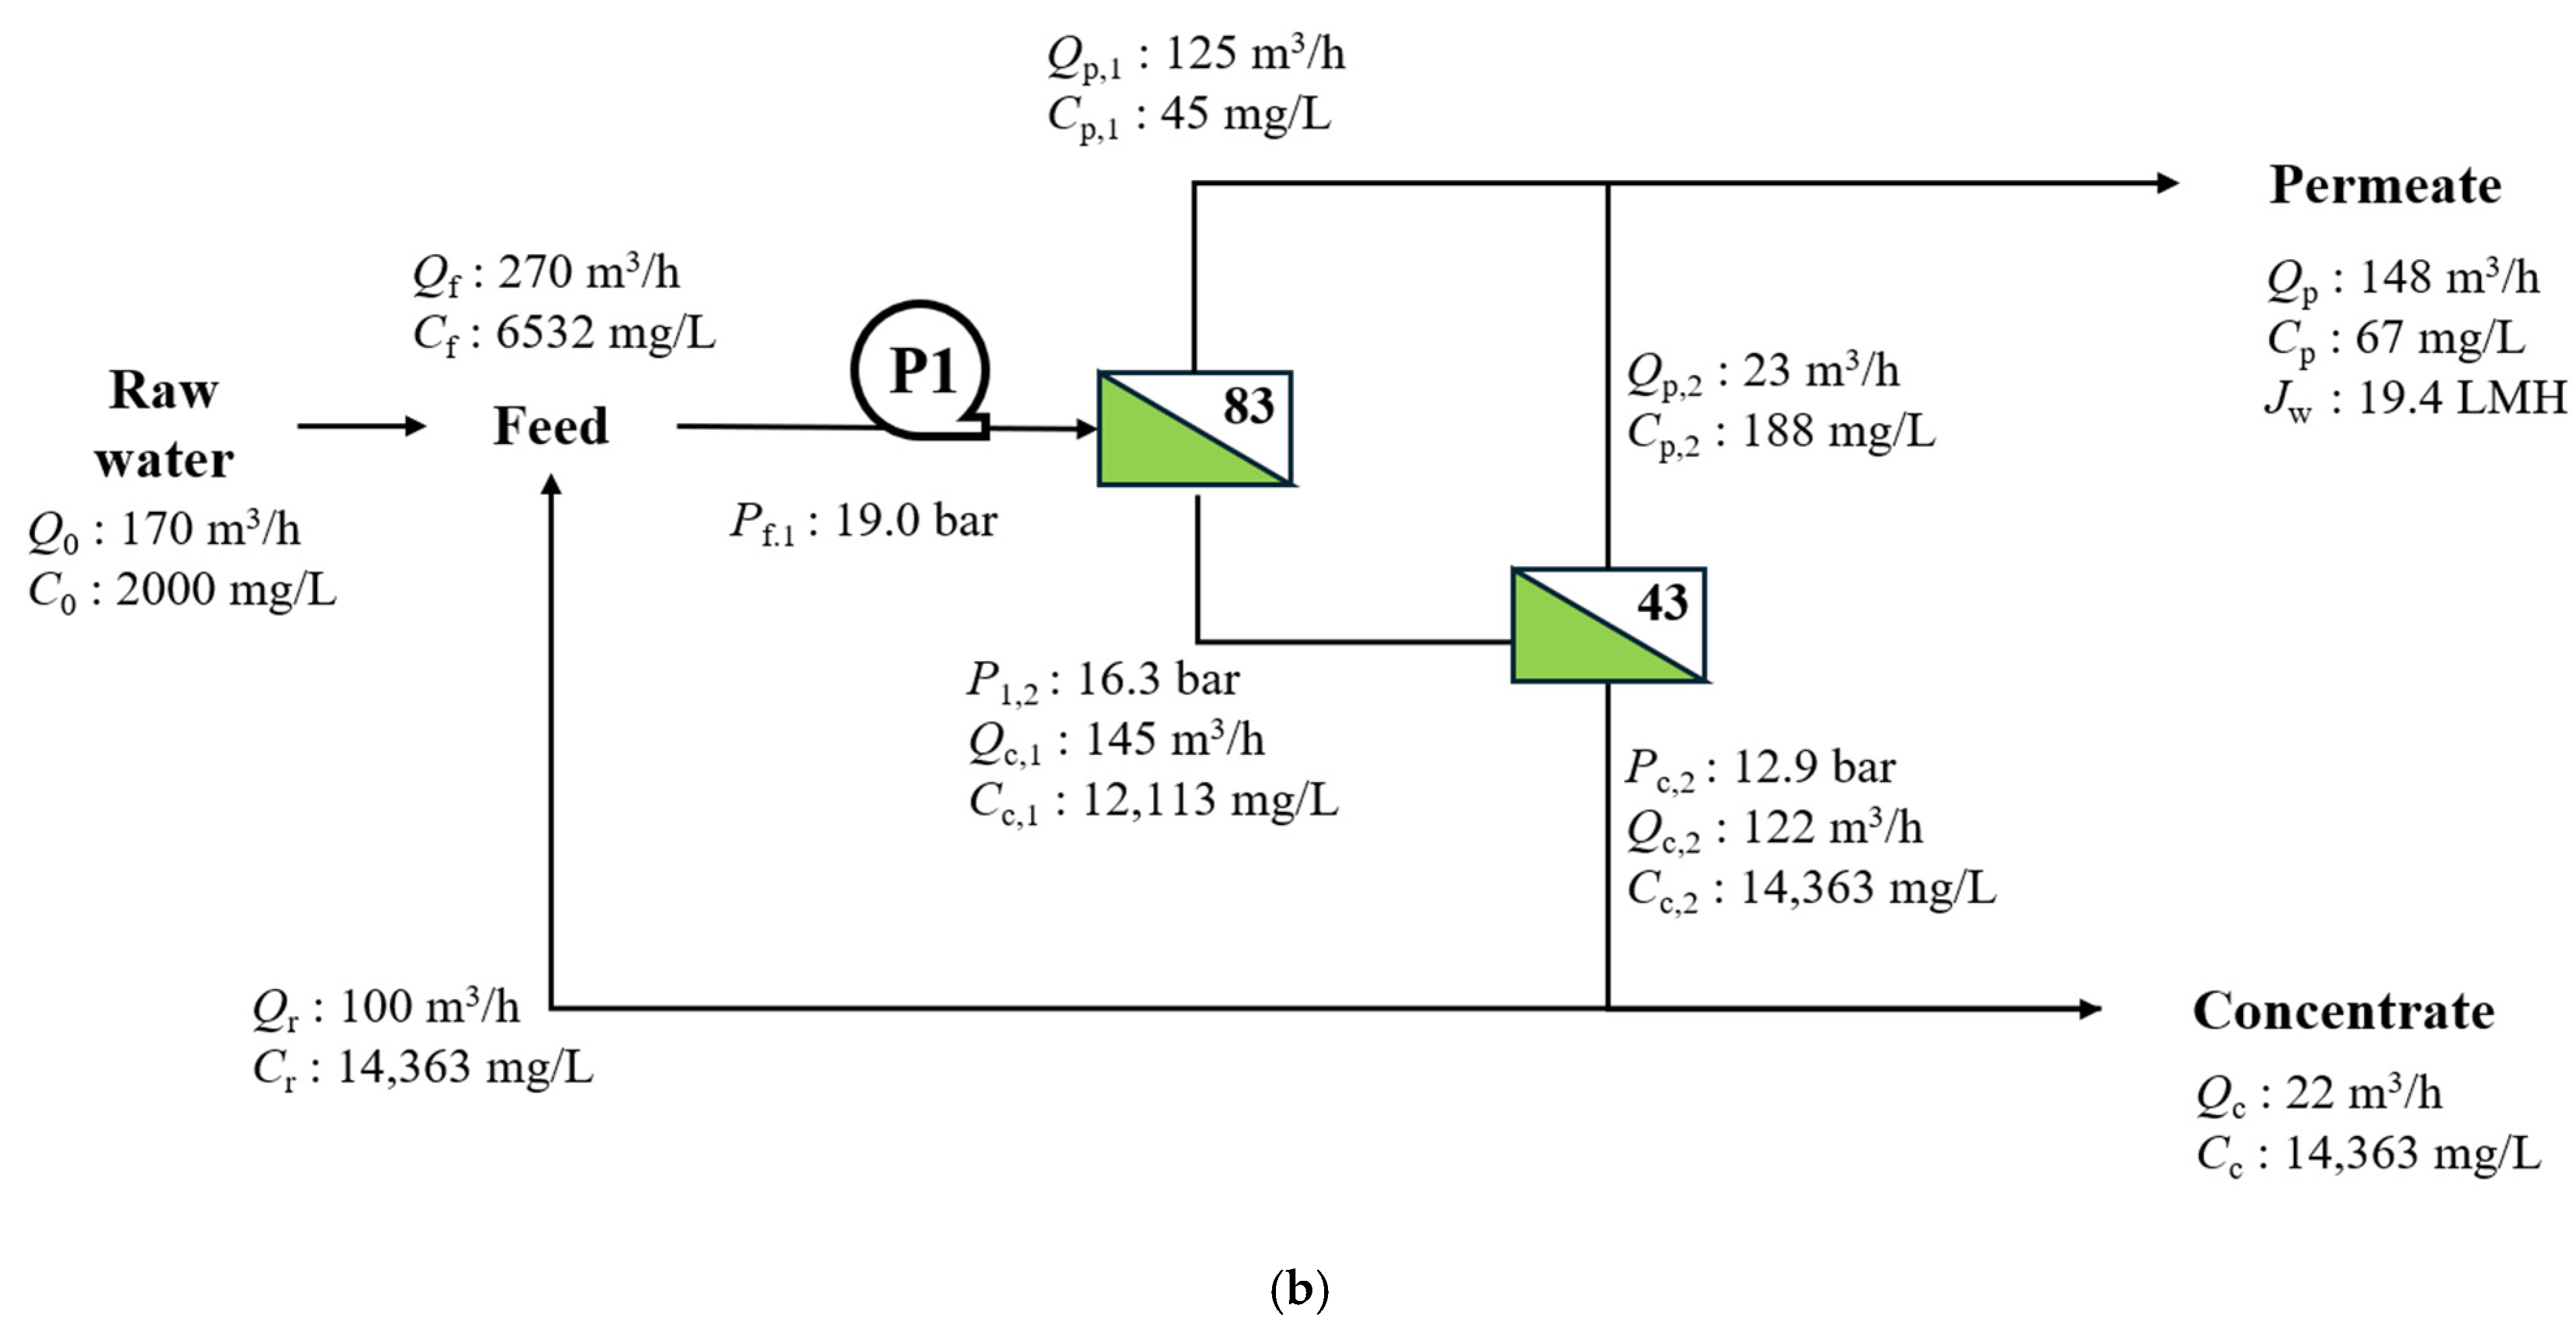
In the concentrate-return configuration, 100 m3/h of the second-stage concentrate was returned to the BWRO feed, while the remaining 22 m3/h was discharged from the system (Figure 7b). The internal BWRO feed flow rate and concentration consequently increased to 270 m3/h and 6532 mg/L, respectively, and the required feed pressure increased to 19.0 bar. Concentrate return increased the permeate flow rate to 148 m3/h and the overall recovery to 87.0%. However, the final permeate concentration also increased to 67 mg/L. Therefore, direct concentrate return reduced the external concentrate discharge but increased the BWRO feed salinity, required pressure, and final permeate concentration.
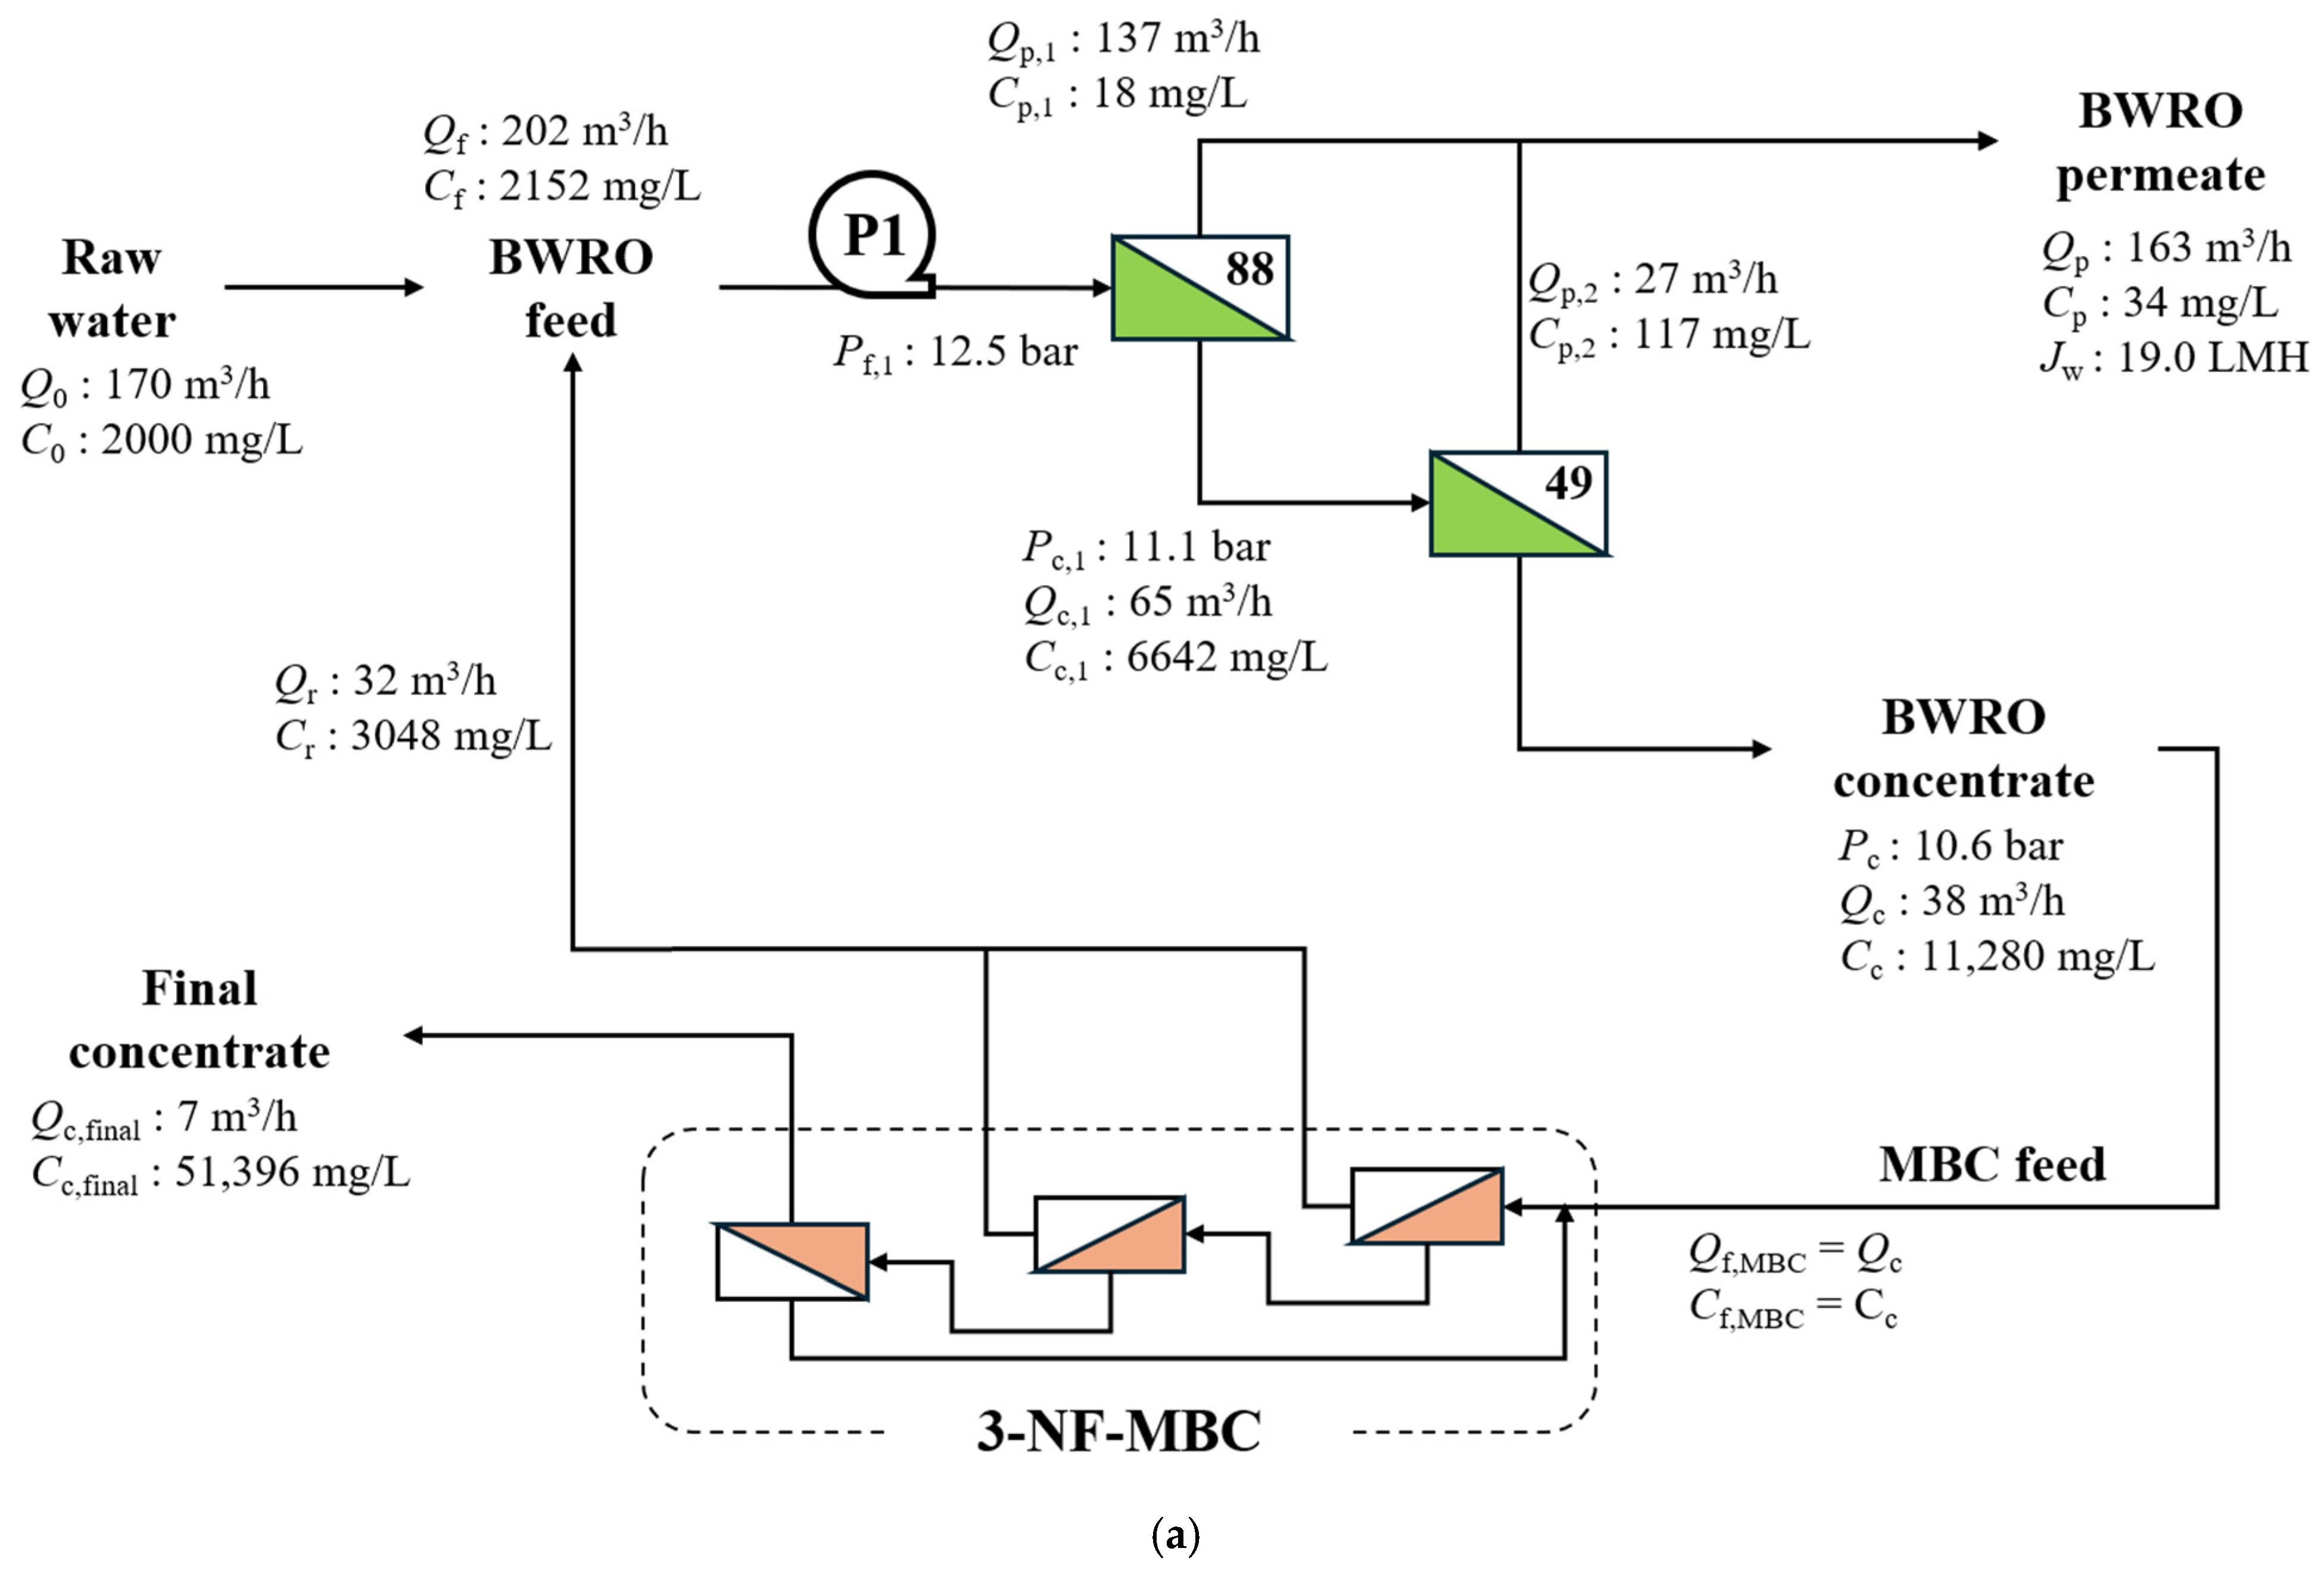
Figure 8a shows the integrated BWRO–MBC process. The BWRO concentrate, with a flow rate of 38 m3/h and an NaCl concentration of 11,280 mg/L, was supplied as the external feed to the three-stage MBC process. The relatively low-salinity permeates from the first and second MBC stages were combined and returned to the BWRO feed, whereas the higher-salinity permeate from the third stage was returned to the first MBC stage.
The return of the first- and second-stage MBC permeates increased the internal BWRO feed flow rate to 202 m3/h, but its concentration remained at 2152 mg/L. Consequently, the BWRO feed pressure was limited to 12.5 bar, and the final permeate concentration was 34 mg/L, similar to the 31 mg/L obtained from the conventional BWRO process. The integrated process produced 163 m3/h of permeate and reduced the final concentrate flow rate to 7 m3/h, corresponding to an overall recovery of 95.9%. The final concentrate concentration reached 51,396 mg/L.
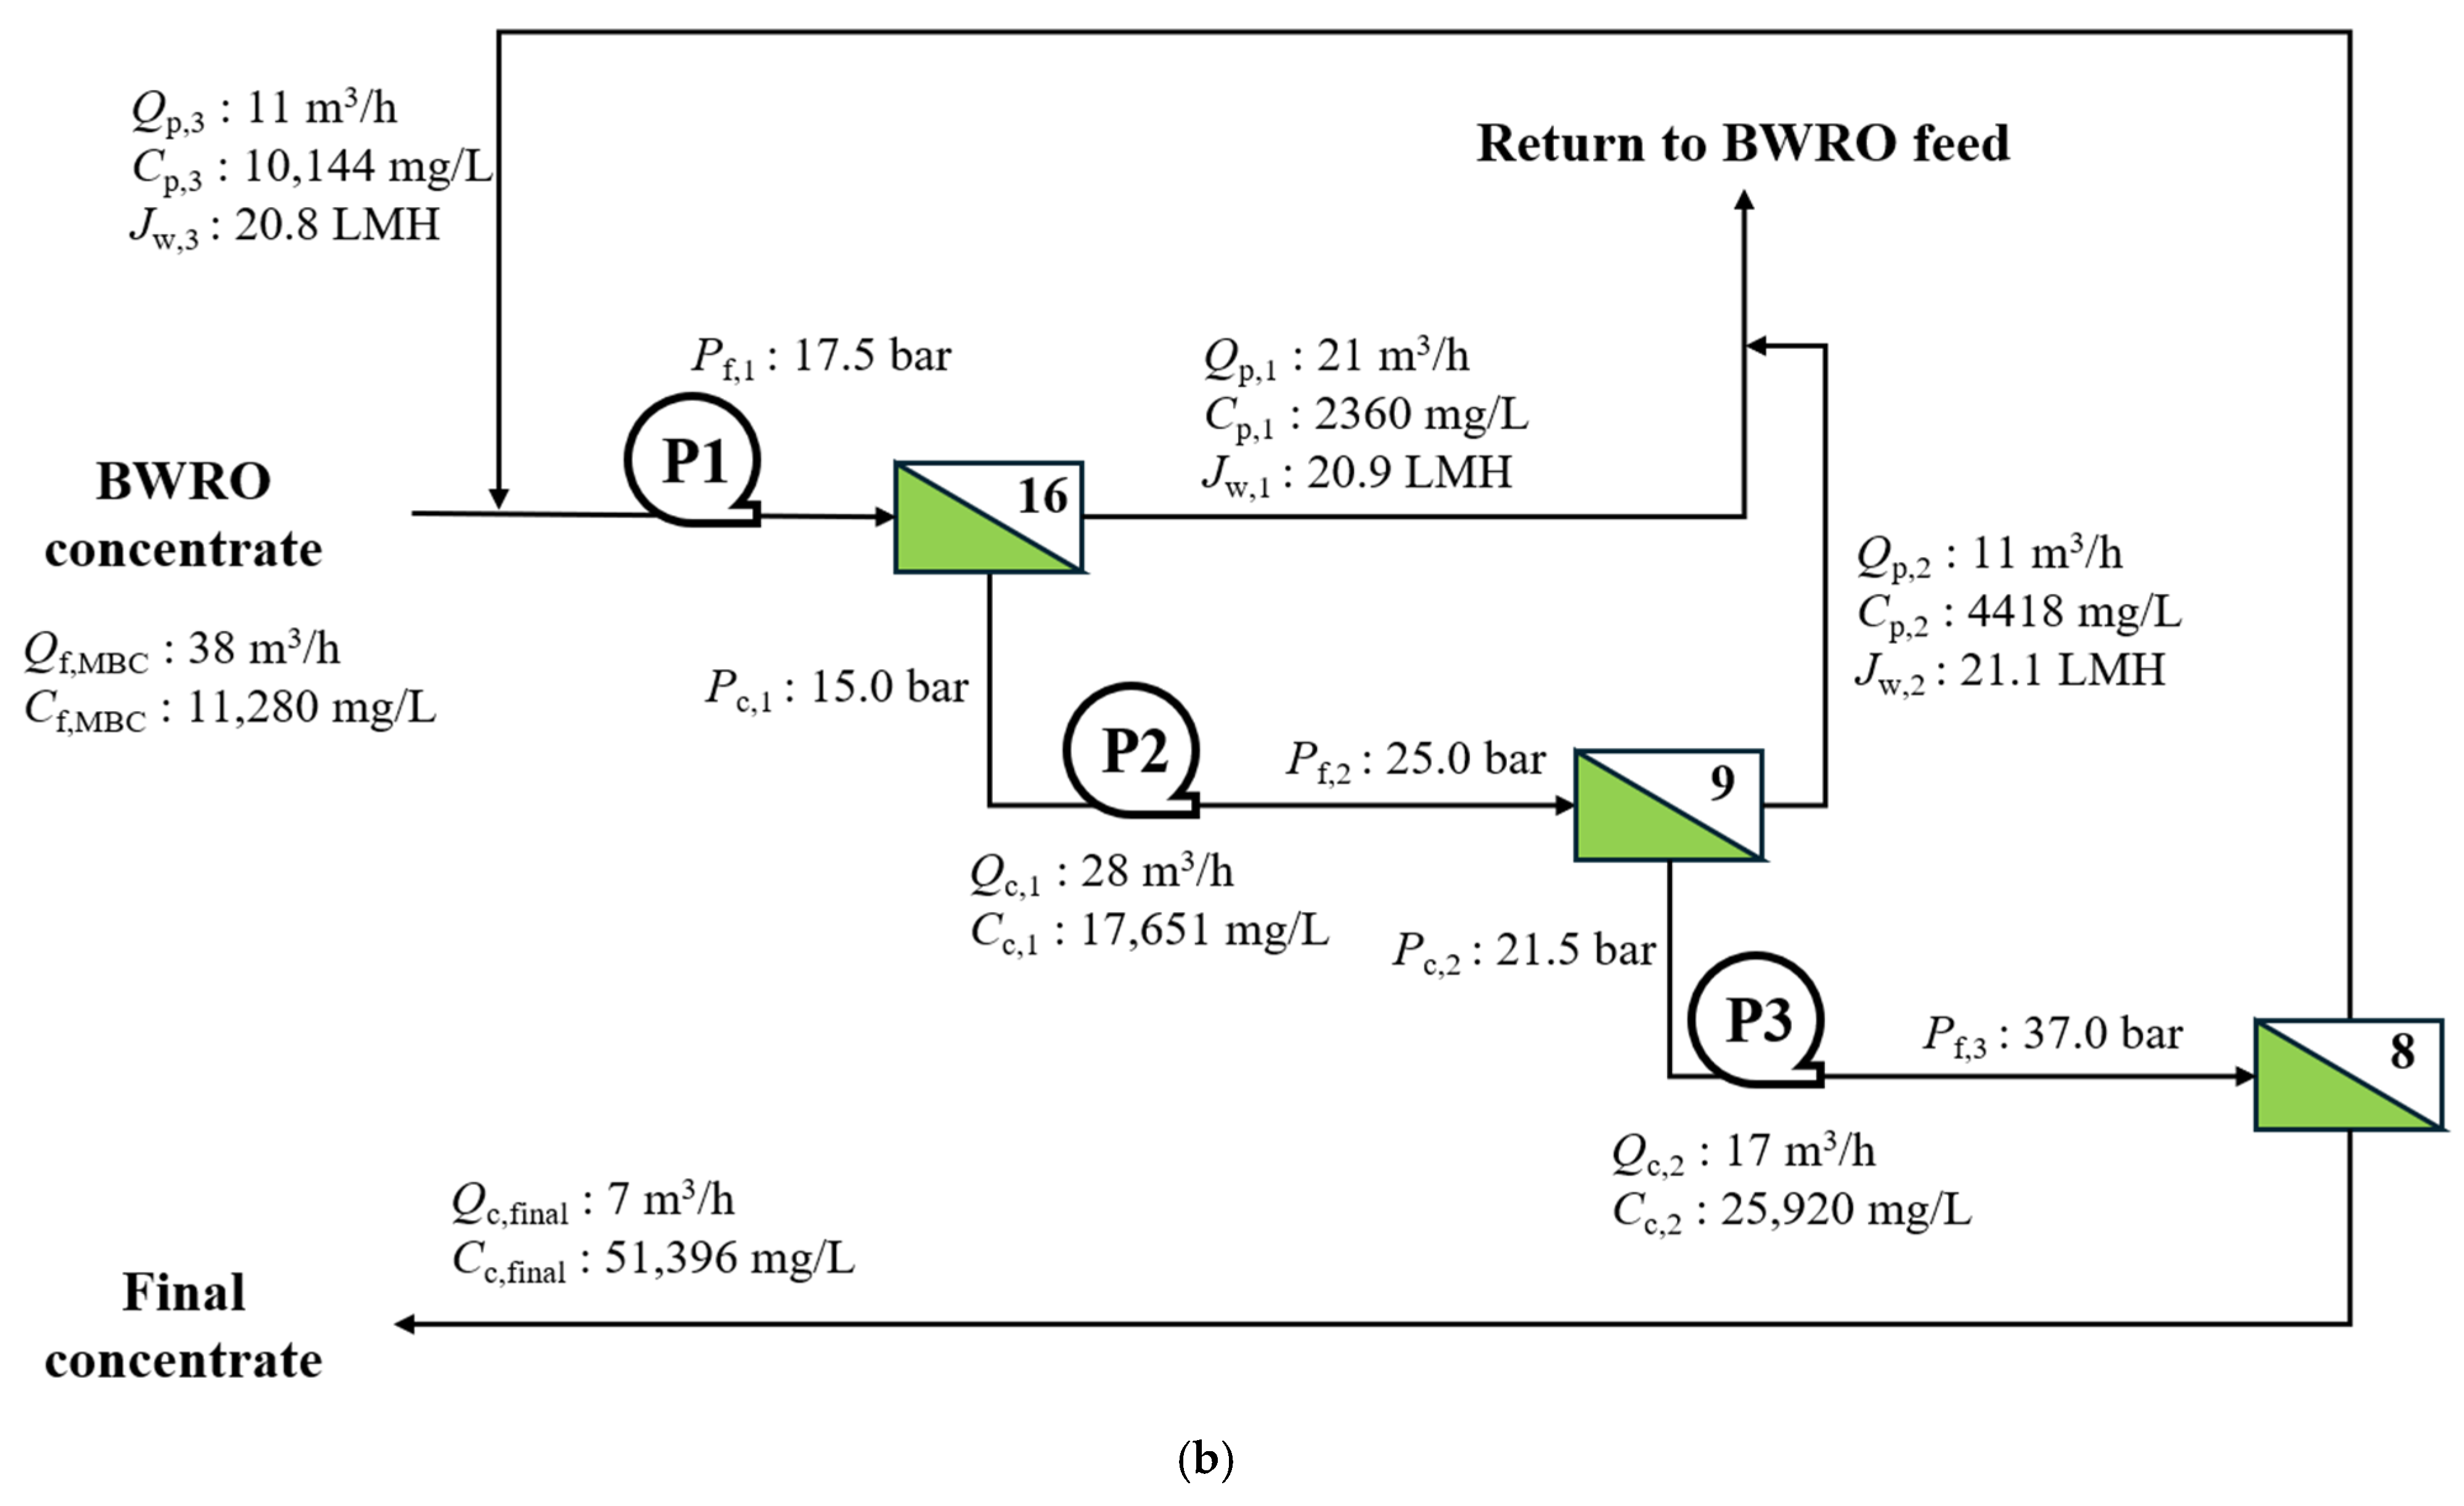
Figure 8b shows the detailed flow configuration of the three-stage MBC process. The feed pressures of the first, second, and third MBC stages were 17.5, 25.0, and 37.0 bar, respectively. The first stage produced 21 m3/h of permeate at 2360 mg/L and 28 m3/h of concentrate at 17,651 mg/L. The second stage produced 11 m3/h of permeate at 4418 mg/L and 17 m3/h of concentrate at 25,920 mg/L. The permeates from these two stages were combined into a return flow of 32 m3/h at 3048 mg/L and recycled to the BWRO feed.
The third-stage permeate, with a flow rate of approximately 11 m3/h and a concentration of 10,144 mg/L, was recycled to the first MBC stage rather than to the BWRO feed. This selective return configuration prevented the highest-salinity MBC permeate from directly increasing the salt load of the BWRO process. The final MBC stage operated at 37.0 bar, below the manufacturer-specified maximum operating pressure of 41.4 bar, and produced 7 m3/h of final concentrate at 51,396 mg/L. Thus, the proposed return configuration substantially reduced the final concentrate flow rate while maintaining BWRO permeate quality close to that of the conventional process. The final modeled concentrate concentration of 51,396 mg/L is approximately 28% higher than the experimental upper limit of 40,000 mg/L. Under the fixed-flux module-test conditions used in this study, the required feed pressure had already reached approximately 38 bar at 40,000 mg/L, approaching the 41.4 bar maximum operating pressure of the NE4040-90 module. Experimental validation at higher feed concentrations was therefore limited by the applicable module operating conditions, and extension of the model beyond 40,000 mg/L was required to evaluate the final high-salinity condition of the integrated MBC process. Accordingly, the final concentrate concentration should be interpreted as an extrapolated process-model estimate rather than an experimentally validated value. Actual industrial wastewaters contain multivalent ions, organic matter, and suspended constituents that can alter NF separation behavior compared with the NaCl-dominated model feed used in this study. Multivalent ions may exhibit different rejection and concentration behavior, whereas organic and particulate constituents may increase membrane-fouling potential and affect the practically achievable water recovery. Therefore, application of the proposed process to real wastewater would require feed-specific water-quality characterization and appropriate pretreatment, including hardness and scaling control, suspended-solids removal, and organic-fouling control. It should also be noted that the hydraulic constraints used in the present process model do not represent chemical scaling limits. In real wastewater, accumulation of sparingly soluble species such as CaSO4 and BaSO4 may impose a practical concentration limit before the hydraulic constraints are reached, requiring feed-specific scaling assessment and, where necessary, antiscalant dosing, pH adjustment, or hardness control [31,32].
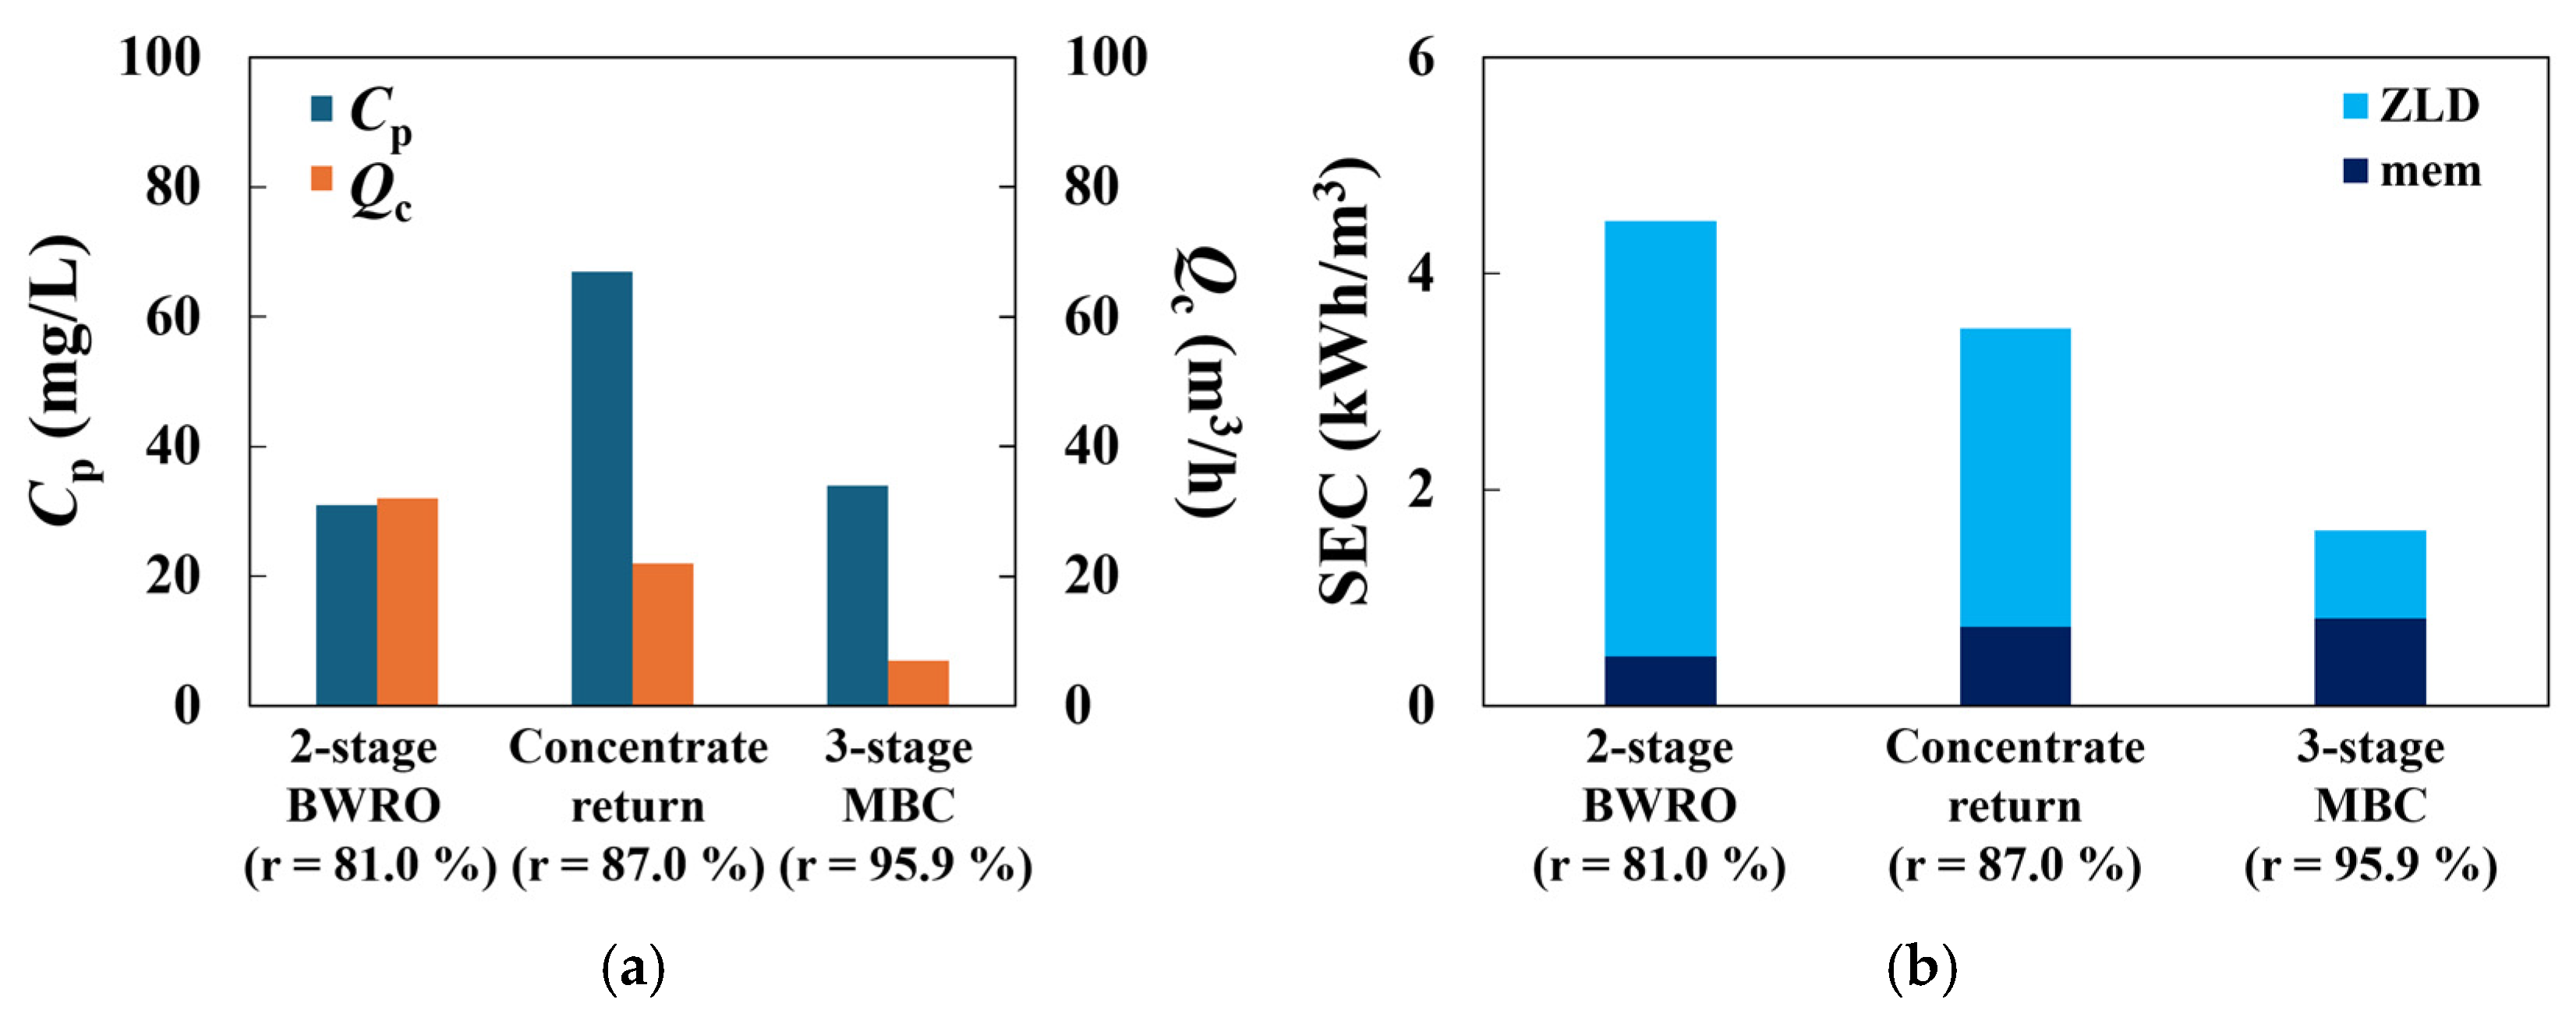
Figure 9 summarizes the trade-offs among permeate quality, concentrate discharge, and energy consumption for the three high-recovery configurations. In the conventional two-stage BWRO system, the final permeate concentration and concentrate flow rate were 31 mg/L and 32 m3/h, respectively (Figure 9a). Direct concentrate return reduced the concentrate flow rate to 22 m3/h but increased the final permeate concentration to 67 mg/L. In contrast, the integrated BWRO–MBC system reduced the final concentrate flow rate to 7 m3/h while maintaining the permeate concentration at 34 mg/L, only 3 mg/L higher than that of the conventional BWRO system. Thus, the integrated system reduced external concentrate discharge by approximately 78% relative to the conventional BWRO system without substantially affecting permeate quality. It also achieved both a lower permeate concentration and a lower concentrate flow rate than the concentrate-return configuration.
Increasing water recovery required additional recirculation and pressurization, resulting in higher energy consumption by the membrane-based process (Figure 9b). Consequently, the integrated BWRO–MBC system exhibited the highest membrane-process SEC among the three configurations. However, the substantial reduction in final concentrate flow decreased the energy demand of the downstream evaporation and crystallization processes. The total SEC values, normalized by the external wastewater feed flow rate, were approximately 4.5, 3.5, and 1.6 kWh/m3 for the conventional BWRO, concentrate-return, and integrated BWRO–MBC systems, respectively. The integrated system therefore required less than half the total energy of either alternative. Its primary energetic advantage was not a reduction in membrane-process energy consumption, but a reduction in the thermal ZLD load achieved by minimizing the final concentrate flow rate. The present process behavior is consistent with previous LSRRO studies showing that controlled salt passage through low-salt-rejection membranes can reduce the osmotic-pressure requirement while enabling further brine concentration [15,16]. Previous process-modeling studies also reported that staged LSRRO configurations can reduce the energy burden associated with thermal brine management, although direct quantitative comparison with the present results is limited by differences in feed salinity, recovery target, membrane characteristics, process configuration, and SEC calculation basis [15,19,20]. The energy comparison presented here does not constitute a full techno-economic assessment (TEA). Adding MBC stages would increase capital expenditure (CAPEX) for membrane modules, pressure vessels, pumps, and recycle piping and would also increase operating expenditure (OPEX) associated with pumping and membrane replacement. Conversely, reducing the final concentrate flow can decrease both the operating energy demand and the required capacity of downstream thermal ZLD equipment. Therefore, the lower total SEC reported here should be interpreted as an energy-performance advantage rather than evidence of economic superiority. A site-specific TEA including CAPEX, OPEX, pretreatment, membrane replacement, and thermal-system capital costs would be required for a complete economic evaluation.

4. Conclusions

This study evaluated the feasibility of designing a three-stage MBC system for wastewater reclamation using a conventional NF module rather than a specialized low-salt-rejection membrane. Among the two BWRO and two NF modules tested over a feed NaCl concentration range of 2000–40,000 mg/L, the BWRO modules required excessive pressure at high salinity, whereas NE4040-40 provided insufficient salt retention. NE4040-90 showed the most appropriate balance between salt-concentrating performance and pressure requirement and was therefore selected for MBC process design.
An NF module model was developed using the experimentally estimated water permeability and concentration-dependent effective salt permeability and mass-transfer coefficients. The model reproduced the permeate concentration and feed pressure over the experimental range with NRMSEs of 5.73% and 1.20%, respectively, and was subsequently used for module-by-module design of the three-stage MBC process.
The conventional two-stage BWRO, concentrate-return BWRO, and integrated BWRO–MBC systems achieved overall water recoveries of 81.0%, 87.0%, and 95.9%, respectively. The integrated system reduced the final concentrate flow rate from 32 to 7 m3/h while maintaining the final permeate concentration at 34 mg/L, close to the 31 mg/L obtained from the conventional BWRO system. Although the maximum operating pressure of the conventional NF module, 41.4 bar, limited the attainable concentration, an overall recovery exceeding 95% was predicted within this pressure limit. This result indicates that conventional NF modules can provide a promising strategy for maximizing water recovery in wastewater reclamation when the feed salinity is within the BWRO range. Selective recycling of the MBC permeates according to their salinities also limited the salt load returned to the BWRO process.
The integrated BWRO–MBC system required more energy for the membrane-based process because of the additional pumping and concentration stages. However, the substantial reduction in final concentrate flow decreased the energy demand of downstream evaporation and crystallization. Under the ZLD assumptions adopted in this study, the total SEC decreased from approximately 4.5 to 1.6 kWh/m3 of external wastewater feed. Thus, the principal benefit of the proposed MBC system is its ability to increase water recovery and reduce the thermal energy demand of downstream ZLD without requiring a membrane specifically developed for low-salt-rejection operation.
The model was developed using NaCl-dominated model solutions and short-term module experiments, and the predicted final concentrate condition involved extrapolation beyond the experimental upper limit of 40,000 mg/L. Further validation is therefore required under high-salinity mixed-ion conditions, together with long-term evaluations of fouling, scaling, membrane compaction, and module durability. This energy benefit does not establish economic superiority because a full techno-economic assessment (TEA) incorporating CAPEX and OPEX was outside the scope of the present study.

Author Contributions

Conceptualization, S.K.; methodology, J.P. and D.K.; validation, J.P. and S.K.; formal analysis, J.P. and S.K.; investigation, J.P.; data curation, J.P. and D.K.; writing—original draft preparation, J.P.; writing—review and editing, D.K. and S.K.; visualization, J.P.; supervision, S.K. All authors have read and agreed to the published version of the manuscript.

Funding

This research was supported by Basic Science Research Program through the National Research Foundation of Korea (NRF) funded by the Ministry of Education (RS-2025-25397043).

Data Availability Statement

The original contributions presented in this study are included in the article. Further inquiries can be directed to the corresponding author.

Conflicts of Interest

The authors declare no conflicts of interest.

Abbreviations

The following abbreviations are used in this manuscript:
BWROBrackish water reverse osmosis
CAPEXCapital expenditure
HPROHigh-pressure reverse osmosis
LSRROLow-salt-rejection reverse osmosis
MBCMembrane brine concentrator
NFNanofiltration
NRMSENormalized root-mean-square error
SBSSodium bisulfite
SECSpecific energy consumption
SWROSeawater reverse osmosis
OAROOsmotically assisted reverse osmosis
OPEXOperating expenditure
ROReverse osmosis
TDSTotal dissolved solids
TEATechno-economic assessment
VFDVariable-frequency drive
ZLDZero liquid discharge

References

  1. Jeon, J.; Kim, D.; Kim, N.; Kim, S. Applicability and limitation of the industrial reverse osmosis system simulators. Desalination 2023, 549, 116358. [Google Scholar] [CrossRef] [Scilit]
  2. Greenlee, L.F.; Lawler, D.F.; Freeman, B.D.; Marrot, B.; Moulin, P. Reverse osmosis desalination: Water sources, technology, and today’s challenges. Water Res. 2009, 43, 2317–2348. [Google Scholar] [CrossRef] [Scilit] [PubMed]
  3. Jones, E.; Qadir, M.; van Vliet, M.T.H.; Smakhtin, V.; Kang, S. The state of desalination and brine production: A global outlook. Sci. Total Environ. 2019, 657, 1343–1356. [Google Scholar] [CrossRef] [Scilit] [PubMed]
  4. Dagar, S.; Singh, S.K.; Gupta, M.K. Economics of advanced technologies for wastewater treatment: Evidence from pulp and paper industry. Front. Environ. Sci. 2022, 10, 960639. [Google Scholar] [CrossRef]
  5. Sowgath, M.T.; Sarker, N.; Mujtaba, I.M. Design of multi stage reverse osmosis process for reuse of textile wastewater. Chem. Eng. Trans. 2025, 117, 1057–1062. [Google Scholar] [CrossRef]
  6. Sharma, N.; Lemar, P.; Nimbalkar, S. Opportunities for iron and steel industrial wastewater treatment and reuse in the United States. Water Resour. Ind. 2025, 34, 100298. [Google Scholar] [CrossRef] [Scilit]
  7. Müller, S.I.; Chapanova, G.; Diekow, T.; Kaiser, C.; Hamelink, L.; Hitsov, I.P.; Wyseure, L.; Moed, D.H.; Palmowski, L.; Wintgens, T. Comparison of cooling tower blowdown and enhanced make up water treatment to minimize cooling water footprint. J. Environ. Manag. 2024, 367, 121949. [Google Scholar] [CrossRef] [Scilit] [PubMed]
  8. Panagopoulos, A.; Haralambous, K.J. Environmental impacts of desalination and brine treatment-Challenges and mitigation measures. Mar. Pollut. Bull. 2020, 161, 111773. [Google Scholar] [CrossRef] [Scilit] [PubMed]
  9. Panagopoulos, A.; Haralambous, K.J.; Loizidou, M. Desalination brine disposal methods and treatment technologies-A review. Sci. Total Environ. 2019, 693, 133545. [Google Scholar] [CrossRef] [Scilit] [PubMed]
  10. Tong, T.; Elimelech, M. The global rise of zero liquid discharge for wastewater management: Drivers, technologies, and future directions. Environ. Sci. Technol. 2016, 50, 6846–6855. [Google Scholar] [CrossRef] [Scilit] [PubMed]
  11. Park, K.; Kim, J.; Hong, S. Brine management systems using membrane concentrators: Future directions for membrane development in desalination. Desalination 2022, 535, 115839. [Google Scholar] [CrossRef] [Scilit]
  12. Abdalrhman, A.S.; Lee, S.; Ihm, S.; Alwaznani, E.S.B.; Fellows, C.M.; Li, S. Process simulation of high-pressure nanofiltration (HPNF) for membrane brine concentration (MBC): A pilot-scale case study. Membranes 2025, 15, 113. [Google Scholar] [CrossRef] [Scilit] [PubMed]
  13. Davenport, D.M.; Deshmukh, A.; Werber, J.R.; Elimelech, M. High-pressure reverse osmosis for energy-efficient hypersaline brine desalination: Current status, design considerations, and research needs. Environ. Sci. Technol. Lett. 2018, 5, 467–475. [Google Scholar] [CrossRef] [Scilit]
  14. Bartholomew, T.V.; Mey, L.; Arena, J.T.; Siefert, N.S.; Mauter, M.S. Osmotically assisted reverse osmosis for high salinity brine treatment. Desalination 2017, 421, 3–11. [Google Scholar] [CrossRef] [Scilit]
  15. Wang, Z.; Deshmukh, A.; Du, Y.; Elimelech, M. Minimal and zero liquid discharge with reverse osmosis using low-salt-rejection membranes. Water Res. 2020, 170, 115317. [Google Scholar] [CrossRef] [Scilit] [PubMed]
  16. Du, Y.; Wang, Z.; Cooper, N.J.; Gilron, J.; Elimelech, M. Module-scale analysis of low-salt-rejection reverse osmosis: Design guidelines and system performance. Water Res. 2022, 209, 117936. [Google Scholar] [CrossRef] [Scilit] [PubMed]
  17. Van Houghton, B.D.; Rosenblum, J.S.; Lampi, K.; Beaudry, E.; Herron, J.J.; del Cerro, M.; De Finnda, C.T.K.; Elimelech, M.; Gilron, J.; Cath, T.Y. Pilot scale demonstration of low-salt-rejection reverse osmosis (LSRRO) desalination of high salinity brines. ACS ES&T Water 2024, 4, 5089–5104. [Google Scholar] [CrossRef] [Scilit]
  18. del Cerro, M.; Gidey-Berhe, G.; Cath, T.Y.; Elimelech, M.; Gilron, J. Novel low-salt-rejection reverse osmosis configuration for continuous brine concentration: Pilot-scale demonstration. Desalination 2026, 631, 120186. [Google Scholar] [CrossRef] [Scilit]
  19. Wang, Z.; Feng, D.; Chen, Y.; He, D.; Elimelech, M. Comparison of energy consumption of osmotically assisted reverse osmosis and low-salt-rejection reverse osmosis for brine management. Environ. Sci. Technol. 2021, 55, 10714–10723. [Google Scholar] [CrossRef] [Scilit] [PubMed]
  20. Atia, A.A.; Allen, J.; Young, E.; Knueven, B.; Bartholomew, T.V. Cost optimization of low-salt-rejection reverse osmosis. Desalination 2023, 551, 116407. [Google Scholar] [CrossRef] [Scilit]
  21. Kim, D.; Lee, H.; Jeon, J.; Kim, S. High recovery design of reverse osmosis process with high permeate water quality and low wastewater discharge for ultra-pure water production. Desalination 2024, 592, 118149. [Google Scholar] [CrossRef] [Scilit]
  22. Verbeke, R.; Gómez, V.; Vankelecom, I.F.J. Chlorine-resistance of reverse osmosis (RO) polyamide membranes. Prog. Polym. Sci. 2017, 72, 1–15. [Google Scholar] [CrossRef] [Scilit]
  23. Lee, J.; Kim, S. Predicting power density of pressure retarded osmosis (PRO) membranes using a new characterization method based on a single PRO test. Desalination 2016, 389, 224–234. [Google Scholar] [CrossRef] [Scilit]
  24. Kim, D.; Kim, S. Effect of feed spacer geometry for high performance reverse osmosis membranes: Experimental verification. Sep. Purif. Technol. 2026, 412, 139553. [Google Scholar] [CrossRef] [Scilit]
  25. Jeon, J.; Jung, J.; Lee, S.; Choi, J.Y.; Kim, S. A simple modeling approach for a forward osmosis system with a spiral wound module. Desalination 2018, 433, 120–131. [Google Scholar] [CrossRef] [Scilit]
  26. Kim, M.; Kim, S. Practical limit of energy production from seawater by full-scale pressure retarded osmosis. Energy 2018, 158, 373–382. [Google Scholar] [CrossRef] [Scilit]
  27. Ricky, R.; Shanthakumar, S.; Ganapathy, G.P.; Chiampo, F. Zero Liquid Discharge System for the Tannery Industry—An Overview of Sustainable Approaches. Recycling 2022, 7, 31. [Google Scholar] [CrossRef] [Scilit]
  28. Khoshvaght, H.; Permala, R.R.; Razmjou, A.; Khiadani, M. A critical review on selecting performance evaluation metrics for supervised machine learning models in wastewater quality prediction. J. Environ. Chem. Eng. 2025, 13, 119675. [Google Scholar] [CrossRef] [Scilit]
  29. Ma, F.; Chen, J.; Dai, Z.; Cai, F.; Hu, Y. Autonomous inverse modeling of complex groundwater systems via a physics-integrated large language model multi-agent framework. Water Res. 2026, 299, 125886. [Google Scholar] [CrossRef] [Scilit] [PubMed]
  30. Wang, Z.; Wang, X.; Xu, S.; Zhou, R.; Zhang, M.; Li, W.; Zhang, Z.; Wang, L.; Chen, J.; Zhang, J.; et al. Off-site production of plasma-activated water for efficient disinfection: The crucial role of high valence NOx and new chemical pathways. Water Res. 2024, 267, 122541. [Google Scholar] [CrossRef] [Scilit] [PubMed]
  31. Zhang, L.; Yang, L.; Li, Z.; Yang, C.; Chen, Q. Recent development in high-salinity wastewater treatment technologies for zero liquid discharge. Water Res. 2026, 297, 125725. [Google Scholar] [CrossRef] [Scilit] [PubMed]
  32. Tariqi, A.Q.; Cruzado, L.; Straub, A.P.; Hickenbottom, K.L.; Karanikola, V. Synergistic solutions: Reverse osmosis and nanofiltration configurations for efficient brackish water desalination. npj Clean Water 2025, 8, 83. [Google Scholar] [CrossRef] [Scilit]
Figure 1. Schematic comparison of RO-based brine-concentration approaches for overcoming the pressure limitation of conventional RO: (a) high-pressure reverse osmosis (HPRO), (b) osmotically assisted reverse osmosis (OARO), and (c) low-salt-rejection reverse osmosis (LSRRO)/membrane brine concentrator (MBC).
Water 18 02204 g001
Figure 2. Schematic diagram of the 4-inch membrane module test system.
Water 18 02204 g002
Figure 3. Permeate NaCl concentration and required feed pressure of the two BWRO membrane modules over a feed NaCl concentration range of 2000–40,000 mg/L: (a) permeate concentration and (b) feed pressure.
Water 18 02204 g003
Figure 4. Permeate NaCl concentration and required feed pressure of the two NF membrane modules over a feed NaCl concentration range of 2000–40,000 mg/L: (a) permeate concentration and (b) feed pressure. The diagonal line in (a) represents  C f = C p .
Water 18 02204 g004
Figure 5. Estimation and empirical correction of transport parameters for the NE4040-90 module: (a) pure-water flux as a function of transmembrane pressure difference for estimation of the water permeability coefficient, A; (b) salt flux as a function of  C m C p , comparing the constant-B formulation (theory) with the concentration-dependent B model; (c) mass-transfer coefficients, k, derived from CSMPRO projection as a function of feed flow rate normalized by membrane area and the corresponding power-law correlation (theory); and (d) effective mass-transfer coefficients back-calculated from the experiments as a function of feed concentration, comparing the feed-flow-based correlation (theory) with the concentration-corrected model. Error bars represent the standard deviations of duplicate experiments.
Water 18 02204 g005
Figure 6. Comparison of the experimental results with CSMPRO projection and the developed NF module model for NE4040-90: (a) permeate concentration predicted by projection over a feed NaCl concentration range of 2000–10,000 mg/L; (b) required feed pressure predicted by projection over 2000–10,000 mg/L; (c) permeate concentration predicted by the NF module model over 2000–40,000 mg/L; and (d) required feed pressure predicted by the developed model over 2000–40,000 mg/L. Error bars represent the standard deviations of duplicate experiments.
Water 18 02204 g006
Figure 7. Process configurations and projected performance of two-stage BWRO systems: (a) conventional two-stage BWRO (r = 81.0%) and (b) two-stage BWRO with concentrate return (r = 87.0%).
Water 18 02204 g007aWater 18 02204 g007b
Figure 8. Configuration and modeled performance of the integrated BWRO-MBC system: (a) overall process configuration (r = 95.9%) and (b) detailed flow configuration of the three-stage NF-MBC process.
Water 18 02204 g008aWater 18 02204 g008b
Figure 9. Comparison of the three high-recovery membrane configurations: (a) permeate salt concentration and concentrate discharge rate and (b) contributions of the membrane-based and downstream thermal ZLD processes to the total SEC normalized by the external wastewater feed flow rate.
Water 18 02204 g009
Table 1. Specifications of the 4-inch BWRO and NF membrane modules.
ManufacturerModuleArea
(m2)
Salt Rejection
(%)
Permeate Flow
Rate (m3d−1)
Test
Condition
Toray Industries, Inc. (Tokyo, Japan)TMG10D8.099.710.0(a)
Toray Advanced Materials Korea, Inc. (Seoul, Republic of Korea)RE4040-BLR7.999.67.2(b)
NE4040-407.920.0–40.09.5(c)
NE4040-907.990.0–97.06.4(c)
Notes: (a) 2000 mg/L NaCl solution at 10.3 bar applied pressure, 15% recovery, 25 °C, and pH 7.0; (b) 1500 mg/L NaCl solution at 10.3 bar applied pressure, 15% recovery, 25 °C, and pH 6.5–7.0; (c) 2000 mg/L NaCl solution at 5.2 bar applied pressure, 15% recovery, 25 °C, and pH 6.5–7.0.
Table 2. BWRO process design criteria used for the CSMPRO simulation.
Design ParameterCriterion
Minimum concentrate flow rate (m3/h)0.68
Maximum permeate flux (L m−2 h−1; LMH)33.95
Maximum recovery per module (%)20
Maximum pressure drop per module (bar)1.4
Maximum pressure drop per pressure vessel (bar)4.1
Disclaimer/Publisher’s Note: The statements, opinions and data contained in all publications are solely those of the individual author(s) and contributor(s) and not of MDPI and/or the editor(s). MDPI and/or the editor(s) disclaim responsibility for any injury to people or property resulting from any ideas, methods, instructions or products referred to in the content.