Article

Regional Patterns of Dissolved Organic Carbon in Lakes and Reservoirs Across Four Major Climate Regions of China


by
Xingkui Tao
1,2,3,†,
Na Li
2,3,4,†,
Siyu Zhang
2,3,4,
Hailin Qin
3,
Wenyu Chu
3,
Ningning Wang
3,
Quanliang Jiang
2,3,4,* and
Shuaidong Li
5,*
1
School of Biological and Food Engineering, Suzhou University, Suzhou 234000, China
2
Nanjing Institute of Geography and Limnology, Chinese Academy of Sciences, Nanjing 210008, China
3
School of Geomatics and Spatial Informatics, Suzhou University, Suzhou 234000, China
4
College of Resources and Environment, Yangtze University, Wuhan 430100, China
5
School of Environmental Science, Nanjing Xiaozhuang University, Nanjing 211171, China
*
Authors to whom correspondence should be addressed.
These authors contributed equally to this work.
Water 2026, 18(17), 2183; https://doi.org/10.3390/w18172183
Submission received: 7 July 2026 / Revised: 20 August 2026 / Accepted: 31 August 2026 / Published: 3 September 2026
(This article belongs to the Section Water and Climate Change)

Abstract

Dissolved organic carbon (DOC) is a climate-sensitive component of carbon cycling in inland waters, but consistent regional comparisons of its seasonal and interannual patterns remain limited across China. Here, we conducted a secondary analysis of a published monthly DOC dataset for 60 selected lake and reservoir series (15 per climate region) spanning China’s subtropical monsoon, temperate monsoon, temperate continental, and plateau mountainous regions during 2000–2023. The source dataset was generated using random forest models constrained by 1326 DOC observations from 83 lake and reservoir stations, and with watershed-scale climate, soil, and anthropogenic variables used as predictors. Across the four regions, the long-term mean DOC concentrations were 9.78, 14.10, 16.12, and 15.14 mg L−1, respectively. Seasonal medians showed spring–summer enrichment in the two monsoon regions, nearly equal spring and summer values in the temperate continental region, and an autumn maximum in the plateau mountainous region. Interannual variability was greatest in the subtropical monsoon region (CV = 3.18%), whereas the plateau mountainous region had the lowest variability (CV = 0.95%). Mann–Kendall analysis identified a significant decline only in the temperate continental region (Z = −2.51, p = 0.012). These results provide a climate–region synthesis of model-derived DOC patterns in Chinese inland waters. Because climate variables contributed to the original random forest predictions, the present study interprets regional contrasts descriptively rather than as independent causal evidence of climatic controls.

1. Introduction

Lakes and reservoirs are important components of inland water systems and play critical roles in regional hydrology, ecological regulation, water-resource security, and biogeochemical cycling. As active interfaces linking the atmosphere, hydrosphere, lithosphere, and biosphere, they function not only as receivers of terrestrial carbon but also as sites of carbon transformation, storage, and release [1,2,3,4]. A growing body of evidence indicates that inland waters are sensitive sentinels of climate change and should be treated as integral components of the terrestrial–aquatic carbon continuum rather than isolated ecosystem units [5,6].
Among the different carbon fractions in inland waters, dissolved organic carbon (DOC) is particularly important due to its high mobility, rapid turnover, and strong sensitivity to hydrological and thermal conditions [7]. DOC links allochthonous organic matter exported from catchments with autochthonous carbon produced within aquatic ecosystems, and influences water color, light penetration, microbial respiration, nutrient cycling, and greenhouse-gas production [8,9,10]. Long-term changes in DOC have therefore received increasing attention in studies of freshwater browning, carbon retention, and climate feedbacks [11,12,13].
The distribution and variability of DOC reflect interactions among hydrology, temperature, catchment vegetation, soil organic matter, trophic condition, and land use [6,14]. Previous studies have documented long-term DOC responses to drought and changing hydrological regimes [15], broad spatial differences among Chinese lakes [16], and recent changes in lake organic carbon storage [17]. Plateau systems are additionally influenced by cryosphere processes, permafrost thaw, and thermokarst development [18,19]. At the national scale, the high-resolution water-quality dataset recently published by Luan et al. [20] provides monthly model-derived estimates of DOC and other water-quality variables in Chinese lakes and reservoirs from 2000 to 2023. Together, these studies provide a strong basis for regional synthesis, while also highlighting that DOC patterns can differ substantially among climatic and landscape settings.
Despite these advances, several questions remain pertinent to regional-scale comparisons. First, existing work has often emphasized individual lakes, specific plateau or lowland regions, or national-scale averages, whereas a consistent comparison among China’s major climate regions remains limited [16,17,18,20]. Second, seasonal and interannual DOC patterns are not necessarily parallel: regions with similar seasonal cycles may differ in terms of long-term variability and trend direction [15,18]. Third, broad climate–region synthesis must explicitly recognize within-region heterogeneity in vegetation, soils, hydrological regulation, and lake or reservoir morphology. Accordingly, a climate–region framework is most appropriately used as a first-order comparative synthesis rather than as a substitute for site-specific process attribution.
China spans strong gradients in heat, moisture, elevation, vegetation, soils, and hydrological regime, providing a natural framework for comparing inland water DOC patterns. We therefore analyzed 60 selected lake and reservoir series distributed across four major climate regions. We sought to (1) characterize seasonal DOC distributions within each climate region; (2) compare long-term regional mean levels, interannual variability, and monotonic trends during 2000–2023; and (3) interpret the observed contrasts in the context of regional hydroclimatic and landscape characteristics while explicitly recognizing the model-derived nature of the source dataset and the heterogeneity of individual water bodies.

2. Materials and Methods

2.1. Study Regions and Dataset

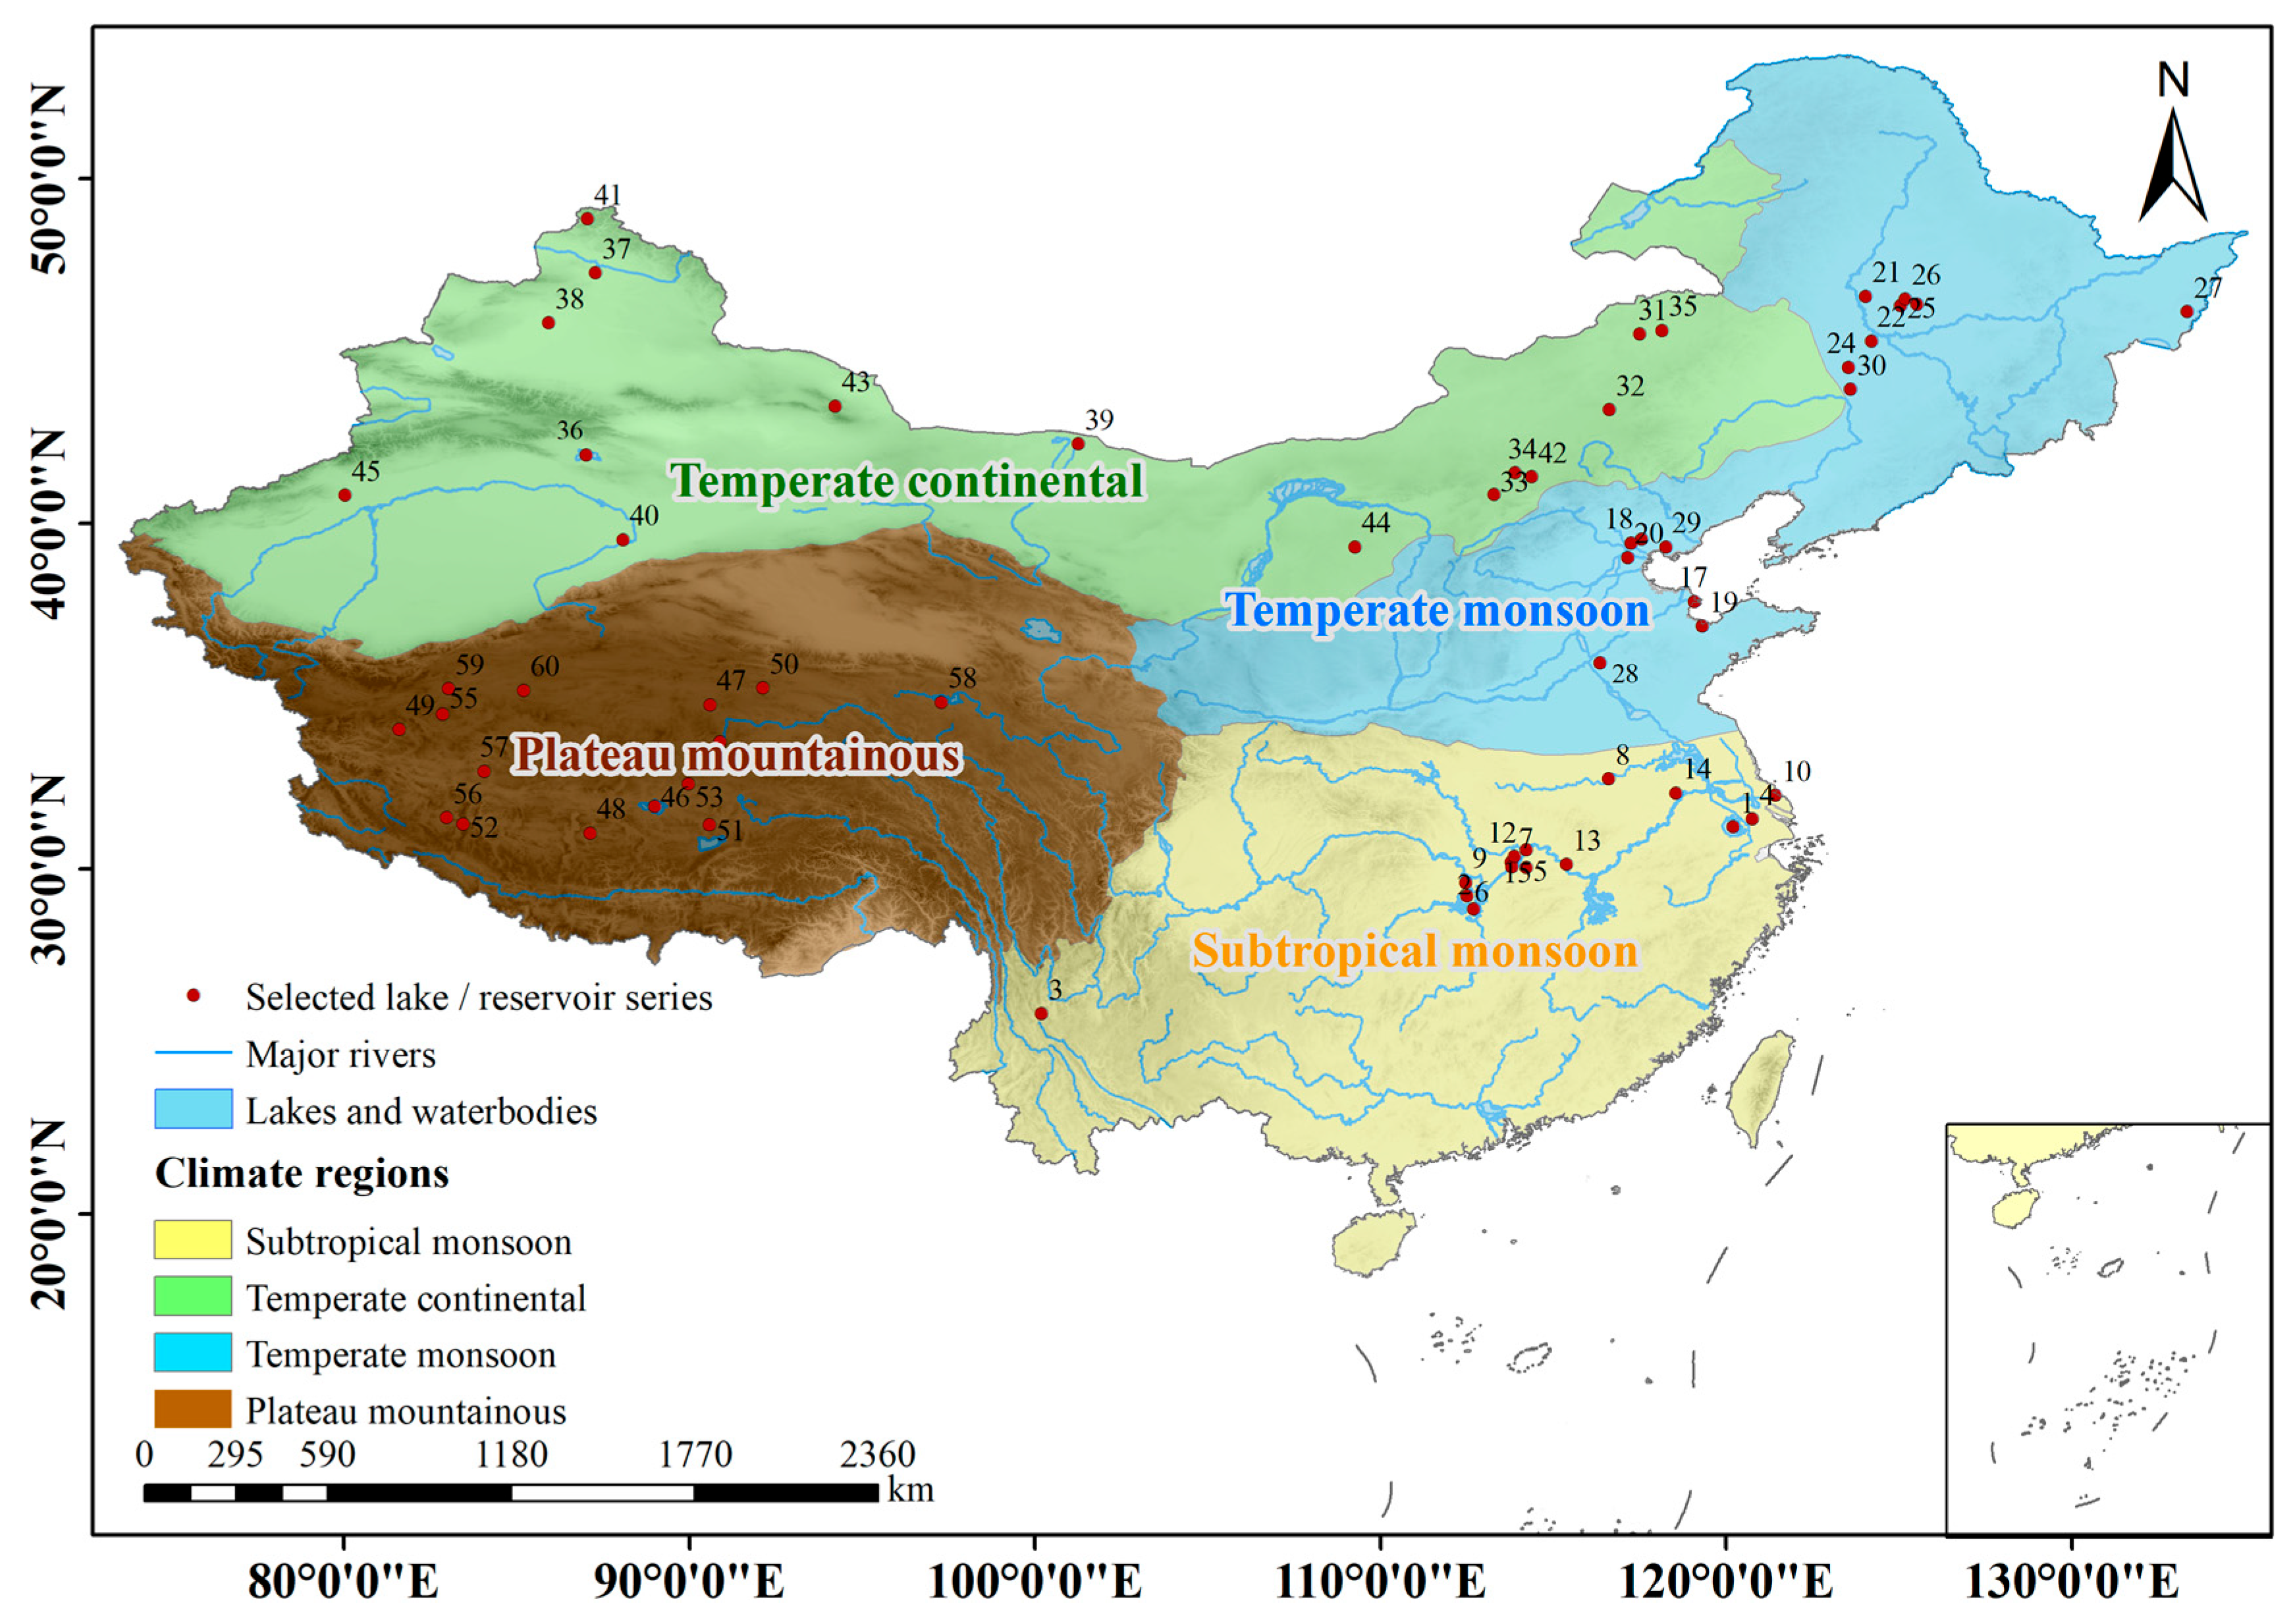
This study covered the four major climate regions of China (Figure 1): the subtropical monsoon, temperate monsoon, temperate continental, and plateau mountainous regions. The working dataset comprised 60 selected water-body series, with 15 series assigned to each climate region based on geographic location (Supplementary Materials). The analysis was designed as a regional comparison of lentic inland water DOC patterns; it did not treat natural lakes and reservoirs as equivalent ecosystem types or attempt a direct lake-versus-reservoir comparison. The source-series identifiers and coordinates used in the analysis are provided in Table 1.
The subtropical monsoon region is characterized by warm, humid conditions, abundant runoff, extensive cropland and evergreen or mixed vegetation, and strongly weathered soils. The temperate monsoon region has pronounced seasonality, widespread cropland and deciduous vegetation, and strong summer precipitation. The temperate continental region is dominated by arid and semi-arid landscapes, grassland and desert–steppe vegetation, strong evaporation, and numerous closed or weakly drained inland basins. The plateau mountainous region is characterized by high elevation, alpine meadow and steppe landscapes, widespread seasonally frozen ground or permafrost, and substantial snow- and glacier-melt contributions to hydrology. Permafrost thaw and thermokarst development may further alter carbon mobilization in plateau waters [19]. These broad landscape contrasts provide environmental context for interpreting regional DOC patterns, while substantial within-region heterogeneity remains.
The DOC series analyzed here were derived from the publicly available dataset generated by Luan et al. [20] rather than from a new 2000–2023 field-monitoring campaign conducted by the present authors. In the source study, 1326 DOC observations from 83 lake and reservoir stations, collected between October 2017 and June 2022, were used to train and evaluate a random forest model. The model incorporated watershed-scale climatic, soil, and anthropogenic predictors and was then used to generate monthly DOC estimates for Chinese lakes and reservoirs from 2000 to 2023. From this resource, the present study extracted 60 unique source series with complete monthly DOC values, yielding 17,280 model-estimated monthly DOC values (60 series × 24 years × 12 months).
Following the structure of the public dataset, DOC was analyzed in mg L−1. No additional outlier deletion or linear interpolation was applied in the present analysis because the selected source series contained complete monthly model outputs. March–May was defined as spring, June–August as summer, September–November as autumn, and December–February as winter. Site-level seasonal and annual summaries were calculated first, followed by regional aggregation. The geographic coordinates supplied with the public dataset were used to map the selected series and ensure their traceability.
The underlying random forest DOC model used climate variables, including temperature and precipitation, among its predictors [20]. Therefore, post hoc correlations between the model-derived DOC values and those same climatic variables would not constitute an independent test of climatic control. In the revised analysis, we consequently focus on seasonal distributions, regional baselines, interannual variability, and Mann–Kendall trends, and we discuss hydroclimatic mechanisms as literature-supported interpretations rather than independent causal inferences from correlation analysis.

2.2. Data Processing and Statistical Analyses

Descriptive statistics were calculated to summarize DOC distributions within each climate region. Seasonal analyses used the complete model-derived monthly values for the selected source series. For each season and climate region, medians and coefficients of variation (CVs) were calculated to describe the central tendency and dispersion. Because each region contained 15 complete series over 24 years, each seasonal distribution contained 1080 monthly values (15 series × 24 years × 3 months).
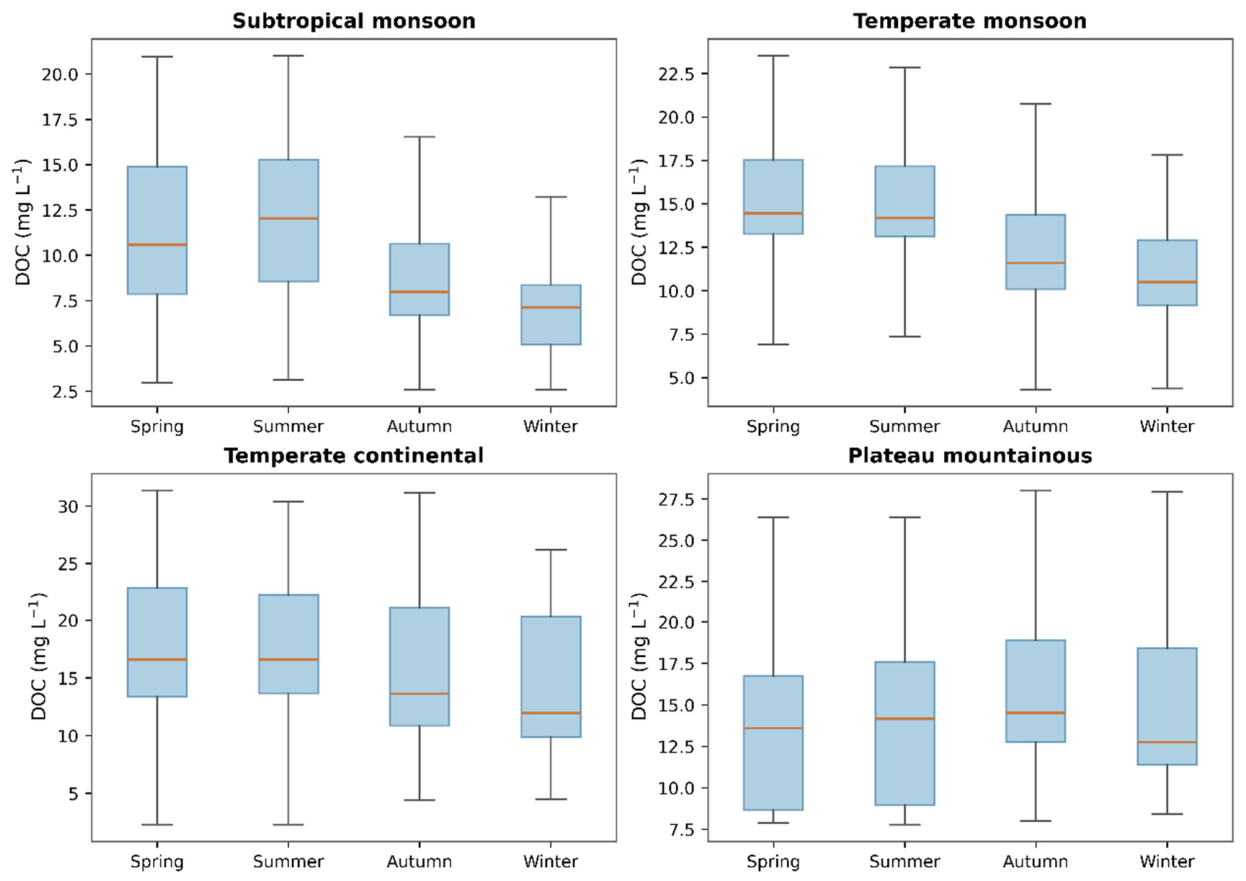
Seasonal patterns were visualized using grouped boxplots. In Figure 2, boxes show the interquartile range, center lines indicate medians, and whiskers extend to 1.5 times the interquartile range. The figure summarizes model-derived monthly DOC estimates over the full 2000–2023 period.
For interannual analysis, monthly DOC values were first averaged to annual means for each source series, and the 15 site-level annual means within each climate region were then averaged to obtain a regional annual mean. Interannual variability was expressed as the coefficient of variation across the 24 regional annual means. Long-term monotonic trends were evaluated using the Mann–Kendall non-parametric trend test [21,22]; trend direction was determined from the standardized Z statistic, and a two-sided p-value < 0.05 was considered statistically significant.
Because the DOC values are model-derived and the original random forest model included climatic predictors [20], the revised manuscript does not use post hoc DOC–climate correlations as independent evidence of climatic control. Statistical analysis and figure preparation were conducted using SPSS 26, Origin 2024, ArcGIS 10.2, and Python 3.13-based verification of the regional summary statistics.

3. Results

3.1. Seasonal DOC Patterns Across the Four Climate Regions

DOC showed distinct seasonal distributions across all four climate regions, although the magnitude and ordering of seasonal medians differed among regions.
In the subtropical monsoon region, the median DOC was 10.59 mg L−1 in spring and increased to 12.03 mg L−1 in summer before declining to 7.98 mg L−1 in autumn and 7.13 mg L−1 in winter. The corresponding seasonal CVs were 37.2%, 32.6%, 39.1%, and 29.5%, respectively. The temperate monsoon region showed a similar broad spring–summer high and autumn–winter low pattern, with seasonal medians of 14.45, 14.18, 11.59, and 10.50 mg L−1, respectively. Thus, the two monsoon regions shared the same broad seasonal ordering, although their absolute DOC levels and seasonal dispersion differed.
The temperate continental region exhibited higher seasonal DOC levels overall. Spring and summer medians were nearly identical (16.59 and 16.60 mg L−1), followed by autumn (13.63 mg L−1) and winter (11.94 mg L−1); seasonal CVs ranged from 36.6% to 41.9%. In the plateau mountainous region, the median increased from 13.58 mg L−1 in spring to 14.16 mg L−1 in summer and reached its maximum in autumn (14.51 mg L−1), before declining to 12.75 mg L−1 in winter. This autumn maximum distinguished the plateau region from the other three regional patterns.

3.2. Interannual Variability and Trend Analysis

Interannual DOC variability and trend direction differed among the four climate regions (Table 2).
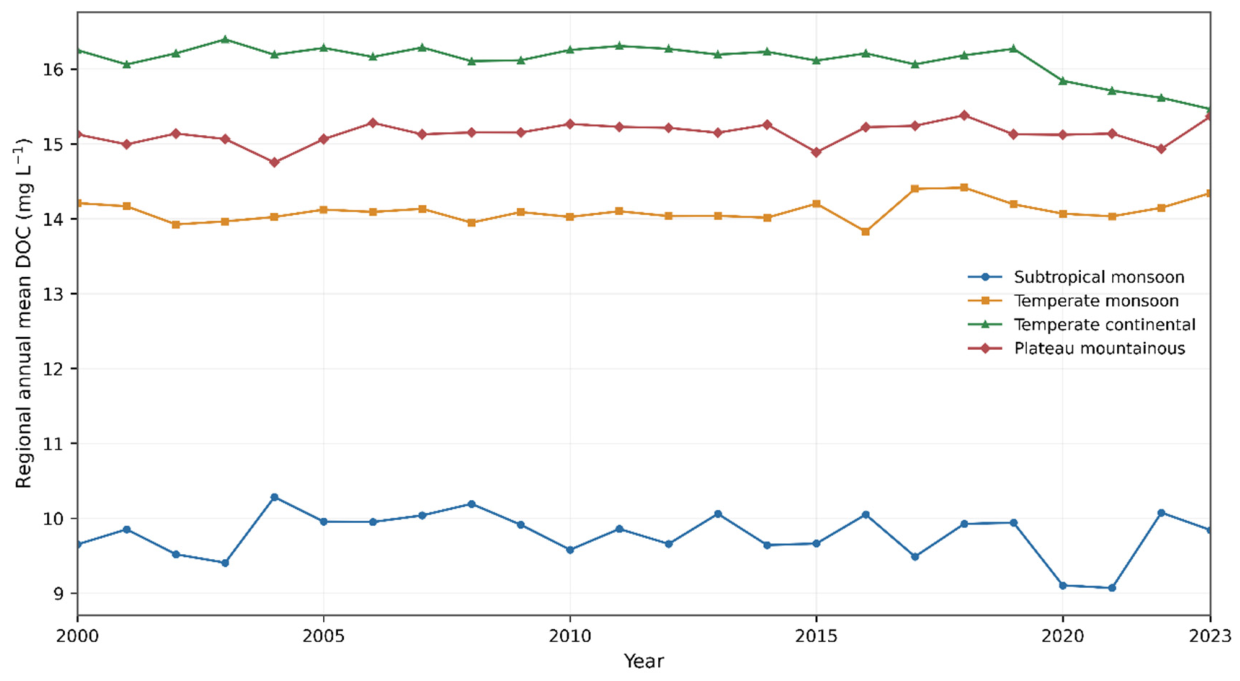
The subtropical monsoon region had the largest interannual CV (3.18%), but no significant monotonic trend was detected (Mann–Kendall Z = −0.47, p = 0.637). The temperate monsoon region showed lower interannual variability (CV = 1.01%) and likewise no significant trend (Z = 1.12, p = 0.264).
The temperate continental region had an interannual CV of 1.43% and showed the only statistically significant monotonic change among the four regions, with a decreasing trend over 2000–2023 (Z = −2.51, p = 0.012). The plateau mountainous region had the lowest interannual CV (0.95%) and no significant trend (Z = 1.31, p = 0.189).
Long-term regional mean DOC concentrations followed the order temperate continental (16.12 mg L−1) > plateau mountainous (15.14 mg L−1) > temperate monsoon (14.10 mg L−1) > subtropical monsoon (9.78 mg L−1). Relative to the subtropical monsoon region, the long-term means were approximately 65% higher in the temperate continental region and 55% higher in the plateau mountainous region (Figure 3).

4. Discussion

4.1. Regional DOC Baseline Patterns and Landscape Context

The pronounced regional gradient in long-term mean DOC is consistent with broad differences in hydrology, elevation, vegetation, soils, and basin configuration. Because the DOC series are model-derived and generated from predictors that include climate and catchment attributes [20], these mechanisms are interpreted as environmental context rather than as independent causal effects demonstrated by the present analysis.
The temperate continental region had the highest regional mean DOC. Arid and semi-arid conditions, strong evaporation, and the prevalence of closed or weakly drained inland basins can favor a concentration of dissolved constituents and reduce hydrological flushing. The national dataset from which our series were extracted also reported relatively high DOC in northwestern inland waters [20]. We therefore interpret the high regional baseline as consistent with the combined effects of basin closure, evaporation, and catchment carbon supply, rather than attributing it to saline soils alone.
The plateau mountainous region showed the second-highest regional mean DOC. Plateau waters occur across alpine meadow and steppe landscapes and are influenced by snowmelt, glacier melt, seasonally frozen ground, permafrost thaw, and thermokarst development [19,23,24]. These processes can alter both the quantity and age of carbon mobilized from catchments. At the same time, the source dataset itself notes relatively sparse observational constraints on the Tibetan Plateau [20], so the plateau results should be interpreted with additional caution.
The temperate monsoon region had an intermediate regional mean, whereas the subtropical monsoon region had the lowest long-term mean. Broad differences in runoff intensity, vegetation productivity, soil-carbon availability, decomposition environment, and hydrological residence time may contribute to this contrast [6,14,16]. Because each climate region contains diverse lake and reservoir types, these explanations should be viewed as regional-scale hypotheses rather than uniform properties of all water bodies within a region.

4.2. Seasonal and Interannual Differences Among Climate Regions

Seasonality produced the strongest contrasts in the ordering of regional medians. The two monsoon regions both showed higher DOC in spring and summer than in autumn and winter, consistent with enhanced terrestrial transport during wet periods and greater biological activity during warmer months [11,12,25]. The temperate continental region also showed spring–summer enrichment, although spring and summer medians were almost identical. In the plateau mountainous region, the autumn maximum may reflect delayed hydrological export, catchment thaw processes, and seasonal changes in internal production; however, the present dataset does not allow for these mechanisms to be separated directly [26].
At the interannual scale, the subtropical monsoon region showed the largest relative variability but no significant monotonic trend. This distinction is important; strong year-to-year fluctuations do not necessarily imply a persistent long-term increase or decrease. Hydrological extremes may contribute to short-term DOC variability in humid catchments, but the present analysis does not independently quantify that mechanism because the source DOC estimates were partly generated from climate predictors [20].
The plateau mountainous and temperate monsoon regions had comparatively low interannual CVs and no significant trends during 2000–2023. Their relatively stable regional means do not imply that all individual lakes are stable; rather, local increases and decreases may be damped during regional aggregation. This interpretation is consistent with the substantial within-region heterogeneity in lake origin, hydrological setting, catchment characteristics, and management.
The temperate continental region was the only region with a significant decreasing Mann–Kendall trend. The decline became visually more pronounced in the later part of the record. Potential explanations include changes in hydrological balance, evaporation, catchment export, and water-management conditions, but these potential mechanisms require independent observational data for attribution. The result is therefore reported as a regional trend in the model-derived DOC series, not as proof of a specific climatic mechanism.
Because precipitation and temperature were among the predictors used to construct the original random forest DOC dataset [20], we did not extend the revised manuscript with seasonal DOC–climate correlation tests. Such analyses would not provide an independent validation of climatic control and could overstate statistical evidence. Instead, seasonal mechanisms are discussed qualitatively and are explicitly separated from the descriptive regional results.

4.3. Implications and Limitations

The regional differences documented here are relevant to climate change assessment because warming, changes in precipitation regimes, increasing drought frequency, and cryosphere change can alter the timing and magnitude of carbon delivery to inland waters. The contrasting seasonal patterns and the significant temperate continental decline indicate that climate–region context should be considered when interpreting long-term DOC datasets. These results are most useful as a regional baseline for identifying where independent field observations and process studies should be prioritized.
Previous monitoring- and model-based studies have demonstrated the value of combining long-term water-quality observations, spatial comparisons, and climate-related analyses in lakes, reservoirs, and managed catchments [27,28,29,30]. The present study complements that work by emphasizing a common climate–region framework and by explicitly distinguishing descriptive patterns in a model-derived dataset from independent process attribution.
Several limitations should be emphasized. First, the DOC series used here are model-derived rather than continuous in situ measurements from 2000 to 2023; uncertainty in the source random forest model therefore propagates into the regional summaries, and observational constraints are comparatively sparse on the Tibetan Plateau [20]. Second, natural lakes and reservoirs were pooled for regional synthesis even though reservoirs may differ in residence time, operational regulation, catchment management, and seasonal water-level control. Third, morphometric variables such as depth and surface area, as well as detailed vegetation and soil characteristics, were not consistently available for the selected series and were not included as explicit covariates. Sediment thickness was not included because the response variable is water column DOC rather than sediment carbon. Fourth, substantial within-region heterogeneity means that the four climate regions should be interpreted as coarse comparative classes. Future studies should combine independent long-term field observations with information on lake type, morphometry, soils, vegetation, and hydrology at finer spatial scales.

5. Conclusions

This study conducted a secondary regional analysis of 60 selected lake and reservoir series from a published monthly DOC dataset spanning 2000–2023 across four major climate regions of China.
Seasonal DOC distributions differed among climate regions. The subtropical and temperate monsoon regions both showed higher medians in spring and summer than in autumn and winter; the temperate continental region had nearly identical spring and summer medians followed by lower autumn and winter values; and the plateau mountainous region was distinguished by an autumn maximum.
Long-term regional mean DOC concentrations followed the order: temperate continental (16.12 mg L−1) > plateau mountainous (15.14 mg L−1) > temperate monsoon (14.10 mg L−1) > subtropical monsoon (9.78 mg L−1).
Interannual variability was greatest in the subtropical monsoon region (CV = 3.18%), whereas the plateau mountainous region showed the lowest variability (CV = 0.95%). The temperate continental region was the only region with a significant monotonic decline during 2000–2023 (Mann–Kendall Z = −2.51, p = 0.012).
Overall, the results provide a climate–region synthesis of model-derived DOC patterns in Chinese inland waters. They should be interpreted as a descriptive regional baseline rather than an independent test of climatic causation, and they highlight the need for future validation using long-term field observations with information on lakes, reservoirs, catchments, and morphometry at finer scales.

Supplementary Materials

The following supporting information can be downloaded at: https://www.mdpi.com/article/10.3390/w18172183/s1, Table S1: Analysis-ready dataset containing the 60 selected model-derived monthly DOC series used to generate the figures and tables in this study.

Author Contributions

Conceptualization, Q.J.; data curation, H.Q.; formal analysis, X.T. and H.Q.; visualization, W.C., N.W., N.L. and S.Z.; writing—original draft, H.Q.; writing—review and editing, X.T., Q.J. and S.L. All authors have read and agreed to the published version of the manuscript.

Funding

This study was supported by the National Natural Science Foundation of China (42307325); the Key Natural Science Project of Anhui Provincial Education Department (2023AH052231, 2023AH052242); the Research and Development Fund Project of Suzhou University (2025fzjj01); the Provincial-level Scientific Research Platform—Collaborative Technology Service Center for the High-Value Processing of Green Agricultural Products in the Yangtze River Delta Region (2022SJPT03); and the Research Platform for Biogeochemical Processes in Subsidence Ponds (2024PTPY01).

Data Availability Statement

The DOC data analyzed in this study were derived from the public dataset generated by Luan et al., “High Resolution Water Quality Dataset of Chinese Lakes and Reservoirs from 2000 to 2023,” available at https://doi.org/10.6084/m9.figshare.27626286.v2 and described in [20]. The processed dataset used to generate the regional summaries and figures is provided as Supplementary Table S1.

Acknowledgments

The authors thank the developers of the publicly available water-quality dataset used in this secondary analysis and the institutions that supported that study. We particularly thank Chen Zhixiang for assistance in data organization. We also appreciate the research environment provided by Suzhou University, the Nanjing Institute of Geography and Limnology, the Chinese Academy of Sciences, the Research Platform for Biogeochemical Processes in Subsidence Ponds, and the College of Resources and Environment, Yangtze University.

Conflicts of Interest

The authors declare no conflict of interest.

References

  1. Cole, J.J.; Prairie, Y.T.; Caraco, N.F.; McDowell, W.H.; Tranvik, L.J.; Striegl, R.G.; Duarte, C.M.; Kortelainen, P.; Downing, J.A.; Middelburg, J.J.; et al. Plumbing the Global Carbon Cycle: Integrating Inland Waters into the Terrestrial Carbon Budget. Ecosystems 2007, 10, 172–185. [Google Scholar] [CrossRef] [Scilit]
  2. Battin, T.J.; Luyssaert, S.; Kaplan, L.A.; Aufdenkampe, A.K.; Richter, A.; Tranvik, L.J. The boundless carbon cycle. Nat. Geosci. 2009, 2, 598–600. [Google Scholar] [CrossRef] [Scilit]
  3. Raymond, P.A.; Hartmann, J.; Lauerwald, R.; Sobek, S.; McDonald, C.; Hoover, M.; Butman, D.; Striegl, R.; Mayorga, E.; Humborg, C.; et al. Global carbon dioxide emissions from inland waters. Nature 2013, 503, 355–359. [Google Scholar] [CrossRef] [Scilit]
  4. Tranvik, L.J.; Cole, J.J.; Prairie, Y.T. The study of carbon in inland waters—From isolated ecosystems to players in the global carbon cycle. Limnol. Oceanogr. Lett. 2018, 3, 41–48. [Google Scholar] [CrossRef] [Scilit]
  5. Williamson, C.E.; Saros, J.E.; Vincent, W.F.; Smol, J.P. Lakes and reservoirs as sentinels, integrators, and regulators of climate change. Limnol. Oceanogr. 2009, 54, 2273–2282. [Google Scholar] [CrossRef] [Scilit]
  6. Catalán, N.; Marcé, R.; Kothawala, D.N.; Tranvik, L.J. Organic carbon decomposition rates controlled by water retention time across inland waters. Nat. Geosci. 2016, 9, 501–504. [Google Scholar] [CrossRef] [Scilit]
  7. Kellerman, A.M.; Dittmar, T.; Kothawala, D.N.; Tranvik, L.J. Chemodiversity of dissolved organic matter in lakes driven by climate and hydrology. Nat. Commun. 2014, 5, 3804. [Google Scholar] [CrossRef] [Scilit]
  8. Ask, J.; Karlsson, J.; Persson, L.; Ask, P.; Byström, P.; Jansson, M. Terrestrial organic matter and light penetration: Effects on bacterial and primary production in lakes. Limnol. Oceanogr. 2009, 54, 2034–2040. [Google Scholar] [CrossRef] [Scilit]
  9. Kritzberg, E.S.; Hasselquist, E.M.; Škerlep, M.; Löfgren, S.; Olsson, O.; Stadmark, J.; Valinia, S.; Hansson, L.-A.; Laudon, H. Browning of freshwaters: Consequences to ecosystem services, underlying drivers, and potential mitigation measures. Ambio 2019, 49, 375–390. [Google Scholar] [CrossRef] [Scilit]
  10. Blanchet, C.C.; Arzel, C.; Davranche, A.; Kahilainen, K.K.; Secondi, J.; Taipale, S.; Lindberg, H.; Loehr, J.; Manninen-Johansen, S.; Sundell, J.; et al. Ecology and extent of freshwater browning—What we know and what should be studied next in the context of global change. Sci. Total Environ. 2022, 812, 152420. [Google Scholar] [CrossRef] [Scilit]
  11. Monteith, D.T.; Stoddard, J.L.; Evans, C.D.; de Wit, H.A.; Forsius, M.; Høgåsen, T.; Wilander, A.; Skjelkvåle, B.L.; Jeffries, D.S.; Vuorenmaa, J.; et al. Dissolved organic carbon trends resulting from changes in atmospheric deposition chemistry. Nature 2007, 450, 537–540. [Google Scholar] [CrossRef] [Scilit]
  12. de Wit, H.A.; Valinia, S.; Weyhenmeyer, G.A.; Futter, M.N.; Kortelainen, P.; Austnes, K.; Hessen, D.O.; Räike, A.; Laudon, H.; Vuorenmaa, J. Current Browning of Surface Waters Will Be Further Promoted by Wetter Climate. Environ. Sci. Technol. Lett. 2016, 3, 430–435. [Google Scholar] [CrossRef] [Scilit]
  13. Anderson, L.E.; DeMont, I.; Dunnington, D.D.; Bjorndahl, P.; Redden, D.J.; Brophy, M.J.; Gagnon, G.A. A review of long-term change in surface water natural organic matter concentration in the northern hemisphere and the implications for drinking water treatment. Sci. Total. Environ. 2023, 858, 159699. [Google Scholar] [CrossRef] [Scilit]
  14. Xenopoulos, M.A.; Barnes, R.T.; Boodoo, K.S.; Butman, D.; Catalán, N.; D’amario, S.C.; Fasching, C.; Kothawala, D.N.; Pisani, O.; Solomon, C.T.; et al. How humans alter dissolved organic matter composition in freshwater: Relevance for the Earth’s biogeochemistry. Biogeochemistry 2021, 154, 323–348. [Google Scholar] [CrossRef] [Scilit]
  15. Wu, J.; Yao, H.; Yuan, X.; Lin, B. Dissolved organic carbon response to hydrological drought characteristics: Based on long-term measurements of headwater streams. Water Res. 2022, 215, 118252. [Google Scholar] [CrossRef] [Scilit]
  16. Song, K.; Wen, Z.; Xu, Y.; Yang, H.; Lyu, L.; Zhao, Y.; Fang, C.; Shang, Y.; Du, J. Dissolved carbon in a large variety of lakes across five limnetic regions in China. J. Hydrol. 2018, 563, 143–154. [Google Scholar] [CrossRef] [Scilit]
  17. Liu, D.; Shi, K.; Chen, P.; Yan, N.; Ran, L.; Kutser, T.; Tyler, A.N.; Spyrakos, E.; Woolway, R.I.; Zhang, Y.; et al. Substantial increase of organic carbon storage in Chinese lakes. Nat. Commun. 2024, 15, 8049. [Google Scholar] [CrossRef] [Scilit]
  18. An, S.; Álvarez-Salgado, X.A.; Wu, F.; Zhang, S.; He, D.; Chen, H.; Lu, Y.; Du, Y.; Zhang, Y. Climate-driven hydrological and biogeochemical shifts lead to increasing dissolved organic carbon storage in a Tibetan lake of Nam Co. Water Res. 2026, 291, 125239. [Google Scholar] [CrossRef] [Scilit]
  19. Wang, T.; Yang, D.; Yang, Y.; Piao, S.; Li, X.; Cheng, G.; Fu, B. Permafrost thawing puts the frozen carbon at risk over the Tibetan Plateau. Sci. Adv. 2020, 6, eaaz3513. [Google Scholar] [CrossRef] [Scilit]
  20. Luan, S.; Pan, H.; Shen, R.; Xia, X.; Duan, H.; Yuan, W.; Wei, J. High Resolution Water Quality Dataset of Chinese Lakes and Reservoirs from 2000 to 2023. Sci. Data 2025, 12, 572. [Google Scholar] [CrossRef] [Scilit]
  21. Mann, H.B. Nonparametric tests against trend. Econometrica 1945, 13, 245–259. [Google Scholar] [CrossRef] [Scilit]
  22. Helsel, D.R.; Hirsch, R.M.; Ryberg, K.R.; Archfield, S.A.; Gilroy, E.J. Statistical methods in water resources. In Techniques and Methods; US Geological Survey: Reston, VA, USA, 2020; p. 458. [Google Scholar] [CrossRef] [Scilit]
  23. Spencer, R.G.; Guo, W.; Raymond, P.A.; Dittmar, T.; Hood, E.; Fellman, J.; Stubbins, A. Source and biolability of ancient dissolved organic matter in glacier and lake ecosystems on the Tibetan Plateau. Geochim. Cosmochim. Acta 2014, 142, 64–74. [Google Scholar] [CrossRef] [Scilit]
  24. Liu, F.; Kang, L.; Li, Z.; Peñuelas, J.; Abbott, B.W.; Xu, W.; Zhou, W.; Liu, X.; Chen, L.; Qin, S.; et al. Chemoautotrophic carbon fixation in thermokarst lakes on the Tibetan Plateau. Nat. Commun. 2026, 17, 792. [Google Scholar] [CrossRef] [Scilit]
  25. Wu, J.; Yao, H.; Zhou, Y.; Zhou, T.; Zhang, W. Seasonal precipitation-flow-DOC cascade: Long-term monitoring insights. J. Hydrol. 2026, 674, 135534. [Google Scholar] [CrossRef] [Scilit]
  26. Catalán, N.; Pastor, A.; Borrego, C.M.; Casas-Ruiz, J.P.; Hawkes, J.A.; Gutiérrez, C.; von Schiller, D.; Marcé, R. The relevance of environment vs. composition on dissolved organic matter degradation in freshwaters. Limnol. Oceanogr. 2021, 66, 306–320. [Google Scholar] [CrossRef] [Scilit]
  27. Nguyen, H.V.-M.; Shin, J.-K.; Hur, J. Multivariate analysis for spatial distribution of dissolved organic matters in a large river-type dam reservoir. Environ. Monit. Assess. 2011, 183, 425–436. [Google Scholar] [CrossRef] [Scilit]
  28. Brehm, F.D.A.; de Azevedo, J.C.R.; Pereira, J.d.C.; Burrows, H.D. Direct estimation of dissolved organic carbon using synchronous fluorescence and independent component analysis (ICA): Advantages of a multivariate calibration. Environ. Monit. Assess. 2015, 187, 703. [Google Scholar] [CrossRef] [Scilit]
  29. Pedregal-Montes, A.; Mercado-Bettín, D.; Futter, M.; Ledesma, J.L.J.; Farré, M.J.; Marcé, R.; Jennings, E. Seasonal forecasting of dissolved organic carbon in a Mediterranean catchment: Enhancing upstream control of disinfection by-product precursors. Environ. Monit. Assess. 2026, 198, 455. [Google Scholar] [CrossRef] [Scilit]
  30. Clark, J.M.; Chapman, P.J.; Adamson, J.K.; Lane, S.N. Influence of drought-induced acidification on the mobility of dissolved organic carbon in peat soils. Glob. Change Biol. 2005, 11, 791–809. [Google Scholar] [CrossRef] [Scilit]
Figure 1. Geographic distribution of the 60 unique selected lake/reservoir series across the four climate regions of China. Numbers correspond to the source-series entries listed in Table 1.
Water 18 02183 g001
Figure 2. Boxplots of seasonal DOC concentrations for the four climate regions during 2000–2023. Boxes represent the interquartile range, horizontal lines indicate medians, and whiskers extend to 1.5 times the interquartile range. Each seasonal distribution contains 1080 model-derived monthly DOC values.
Water 18 02183 g002
Figure 3. Interannual variation in regional annual mean DOC concentrations across the four climate regions from 2000 to 2023. Each point represents the mean of 15 site-level annual DOC values within the corresponding climate region.
Water 18 02183 g003
Table 1. General information for the 60 unique selected water-body series used in the regional analysis.
No.Source Series IDClimate RegionLatitude (°N)Longitude (°E)
124Subtropical monsoon31.200394120.203463
2139Subtropical monsoon28.824671112.701135
3255Subtropical monsoon25.788701100.195217
4406Subtropical monsoon31.434012120.772579
5410Subtropical monsoon30.029156114.217211
6666Subtropical monsoon29.20726112.510558
71242Subtropical monsoon30.171882113.793519
81280Subtropical monsoon32.595097116.601372
95413Subtropical monsoon29.586411112.465695
106867Subtropical monsoon32.111949121.437004
118359Subtropical monsoon30.037462113.803074
129548Subtropical monsoon30.342373113.873634
1318309Subtropical monsoon30.110357115.379423
1418997Subtropical monsoon32.184379118.556557
1519350Subtropical monsoon30.542082114.223145
16913Temperate monsoon39.543215117.566049
171505Temperate monsoon37.732934119.094179
182245Temperate monsoon39.423375117.2525
192601Temperate monsoon37.015308119.31993
202692Temperate monsoon39.005314117.15374
21134Temperate monsoon46.5805124.046188
22136Temperate monsoon45.282396124.2245
23605Temperate monsoon46.345404125.531437
241583Temperate monsoon44.516625123.555125
251686Temperate monsoon46.304125.047687
261608Temperate monsoon46.502898125.191763
274960Temperate monsoon46.128807133.343972
287183Temperate monsoon35.953622116.358471
298023Temperate monsoon39.31225118.257937
308156Temperate monsoon43.883577123.604298
31169Temperate continental45.480582117.51276
32283Temperate continental43.290601116.634751
331074Temperate continental40.842555113.281521
341499Temperate continental41.46046113.900616
351940Temperate continental45.587871118.15394
3644Temperate continental41.97926887.015078
3760Temperate continental47.25585487.289594
38197Temperate continental45.80236385.941022
39935Temperate continental42.293618101.258944
401565Temperate continental39.52005288.084836
411254Temperate continental48.8133587.054878
421273Temperate continental41.347052114.381381
431845Temperate continental43.39331394.220044
442693Temperate continental39.310819109.267434
457747Temperate continental40.80545980.041533
4625Plateau mountainous31.80078788.992953
4776Plateau mountainous34.7327590.605437
48112Plateau mountainous31.01934387.132121
49146Plateau mountainous34.02006881.612398
50295Plateau mountainous35.2202592.133356
51240Plateau mountainous31.26583790.583231
52316Plateau mountainous31.27772283.447217
53322Plateau mountainous32.44946389.978399
548165Plateau mountainous33.66189590.879338
5514341Plateau mountainous34.46825182.867783
5614600Plateau mountainous31.46601982.983411
5717126Plateau mountainous32.81071884.072513
5818639Plateau mountainous34.81190297.295164
5922062Plateau mountainous35.19988683.031495
6022096Plateau mountainous35.15702385.212631
Table 2. Interannual variability and Mann–Kendall trend results for regional annual mean DOC during 2000–2023.
Climate RegionInterannual CV (%)Mann–Kendall Zp ValueTrend CategoryVariability Level
Subtropical monsoon3.18−0.470.637No significant trendHighest
Temperate continental1.43−2.510.012Significant decreaseModerate
Temperate monsoon1.011.120.264No significant trendLow
Plateau mountainous0.951.310.189No significant trendLowest
Disclaimer/Publisher’s Note: The statements, opinions and data contained in all publications are solely those of the individual author(s) and contributor(s) and not of MDPI and/or the editor(s). MDPI and/or the editor(s) disclaim responsibility for any injury to people or property resulting from any ideas, methods, instructions or products referred to in the content.