Article

Hydrochemical Characteristics and Evolution of Groundwater in Weibei Plain Based on Hydrogeological Zoning (China)


1
School of Environmental Studies, China University of Geosciences, No. 388, Lumo Road, Wuhan 430074, China
2
Tianjin Center, China Geological Survey, No.4 Bahao Road, Tianjin 300170, China
3
North China Center for Geoscience Innovation, No.4 Bahao Road, Tianjin 300170, China
*
Authors to whom correspondence should be addressed.
These authors contributed equally to this work.
Water 2026, 18(17), 2077; https://doi.org/10.3390/w18172077
Submission received: 27 July 2026 / Revised: 19 August 2026 / Accepted: 20 August 2026 / Published: 24 August 2026

Highlights

  • Extreme 11B enrichment links deep brine to evaporated paleo-seawater.
  • Clay aquitards drive membrane ultrafiltration and deep isotopic fractionation.
  • Reverse cation exchange and multi-end-member mixing control coastal salinization.

Abstract

The Weibei Plain, characterized by its complex stratified aquifer system and extensive brine resources, faces severe groundwater salinization. Unraveling the precise evolutionary mechanisms of diverse hydrochemical types across varying depths and geomorphological zones remains a significant challenge. This study synthesizes a multi-batch hydrochemical dataset with multi-isotopic tracers (δ2H, δ18O, δ11B, δ81Br, δ37Cl) to establish a comprehensive groundwater evolutionary model from the piedmont plain to the coastal marine plain. The results indicate distinct hydrochemical zonation governed by geographic geomorphology and historical marine transgressions. Salinization in transitional waters is primarily driven by physical mixing and reverse cation exchange rather than extreme evaporative fractionation. Crucially, isotopic mass balance definitively reveals that deep brine (depth > 60 m) originates not from modern seawater intrusion, but from the extreme surface evaporation of ancient paleo-seawater. This paleo-brine underwent profound isotopic exchange during its gravity-driven downward migration, evidenced by intense clay mineral adsorption (yielding extreme δ11B enrichment up to 64.42‰) and secondary evaporite dissolution. Furthermore, the regional cone of depression formed by intensive brine extraction has profoundly altered deep hydrodynamics, inducing overflow and membrane ultrafiltration across massively thick clay aquitards. This process distinctly drives the isotopic fractionation observed in deep brackish waters. The analysis process in this study combines the isotope method with the regional geomorphological zoning, which can provide a reference for the analysis of groundwater evolution characteristics in other coastal aquifers.

1. Introduction

Groundwater salinization of coastal aquifers is influenced by changes in their equilibrium due to natural seasonal and inter-annual variations, to human activities or even global climatic change [1]. The Weibei Plain, located on the southern coast of Laizhou Bay, Shandong Province, China, is rich in brine resources [2]. Since the 1970s, rapid economic development in this region has driven the overexploitation of fresh groundwater and brine, leading to a continuous expansion of seawater and saline water intrusion [3]. The intrusion into these coastal aquifers may result from simple lateral seawater ingress, or it may involve complex hydrogeochemical processes, such as leakage mixing between aquifers at varying depths and intricate water/rock interactions [4,5]. Furthermore, the frequent occurrence of extreme precipitation events, coupled with the backdrop of global sea-level rise, poses tremendous challenges to the sustainable utilization of coastal aquifers [6,7,8]. Therefore, elucidating the evolutionary processes of groundwater and its diverse hydrochemical types in the Weibei Plain can provide practical cases for the sustainable management of coastal water resources.
Due to variations in geological environments and sedimentary conditions, the groundwater aquifer system in the Weibei Plain exhibits distinct stratified and banded characteristics for fresh groundwater (FW), brine (BRW), and other groundwater bodies, rendering the coastal aquifer a highly complex geological entity [9]. Numerous researchers have investigated the hydrogeochemical characteristics of coastal groundwater [10], evolutionary pathways [11,12,13], and the mechanisms driving seawater/saline water intrusion [2] in this region. These studies have primarily focused on dynamic groundwater changes, the hydrogeochemical signatures of intrusion processes, the genesis of brine via isotopic analysis, and the salinization of shallow groundwater based on hydrochemical characteristics [14]. While these efforts have accumulated a wealth of scientific data and research, most consider the groundwater salinization issue in the Weibei Plain holistically to analyze its formation mechanisms. Considering that the aquifer system in the Weibei Plain has been influenced by multi-phase marine transgressions [4,15], few studies have seamlessly coupled hydrochemical characteristics with multi-isotopic proxies to finely decipher the evolutionary pathways across distinct hydrochemical types.
Moreover, owing to the exceptional complexity of groundwater genesis in the Weibei Plain, previous investigations have frequently been restricted to small-scale, cross-sectional regional studies along the coast. Notably, there remains a critical lack of long-term, large-scale research encompassing the entire continuum of groundwater recharge, runoff, and discharge areas. Within the existing large-scale regional studies, multivariate statistical methods are frequently employed to interpret correlations within hydrochemical datasets [16]. Nevertheless, purely mathematical correlations fall short in explaining the spatial variations of hydrochemical characteristics from a geographic and geomorphological perspective. This is particularly relevant in the Weibei Plain, which encompasses diverse landforms including a piedmont plain, an alluvial plain, and a marine plain [17]. The hydrochemical properties of the marine plain differ significantly from the other two landforms due to the profound impacts of seawater and saline water intrusion [16].
Therefore, the primary objectives of this study include: (1) portraying the hydrochemical characteristics of groundwater in the Weibei Plain—from the piedmont plain to the coastline—by synthesizing a multi-batch hydrochemical dataset, multiple isotopic indicators, and regional geomorphological zoning; (2) comprehensively analyzing the genesis of BRW, brackish water and saline water at various depths based on multi-isotope tracing, thereby improving our understanding of salinity sources, mixing effects, and groundwater evolutionary trajectories; and (3) constructing an evolutionary conceptual model for each of the groundwater bodies in the Weibei Plain.

2. Site Description

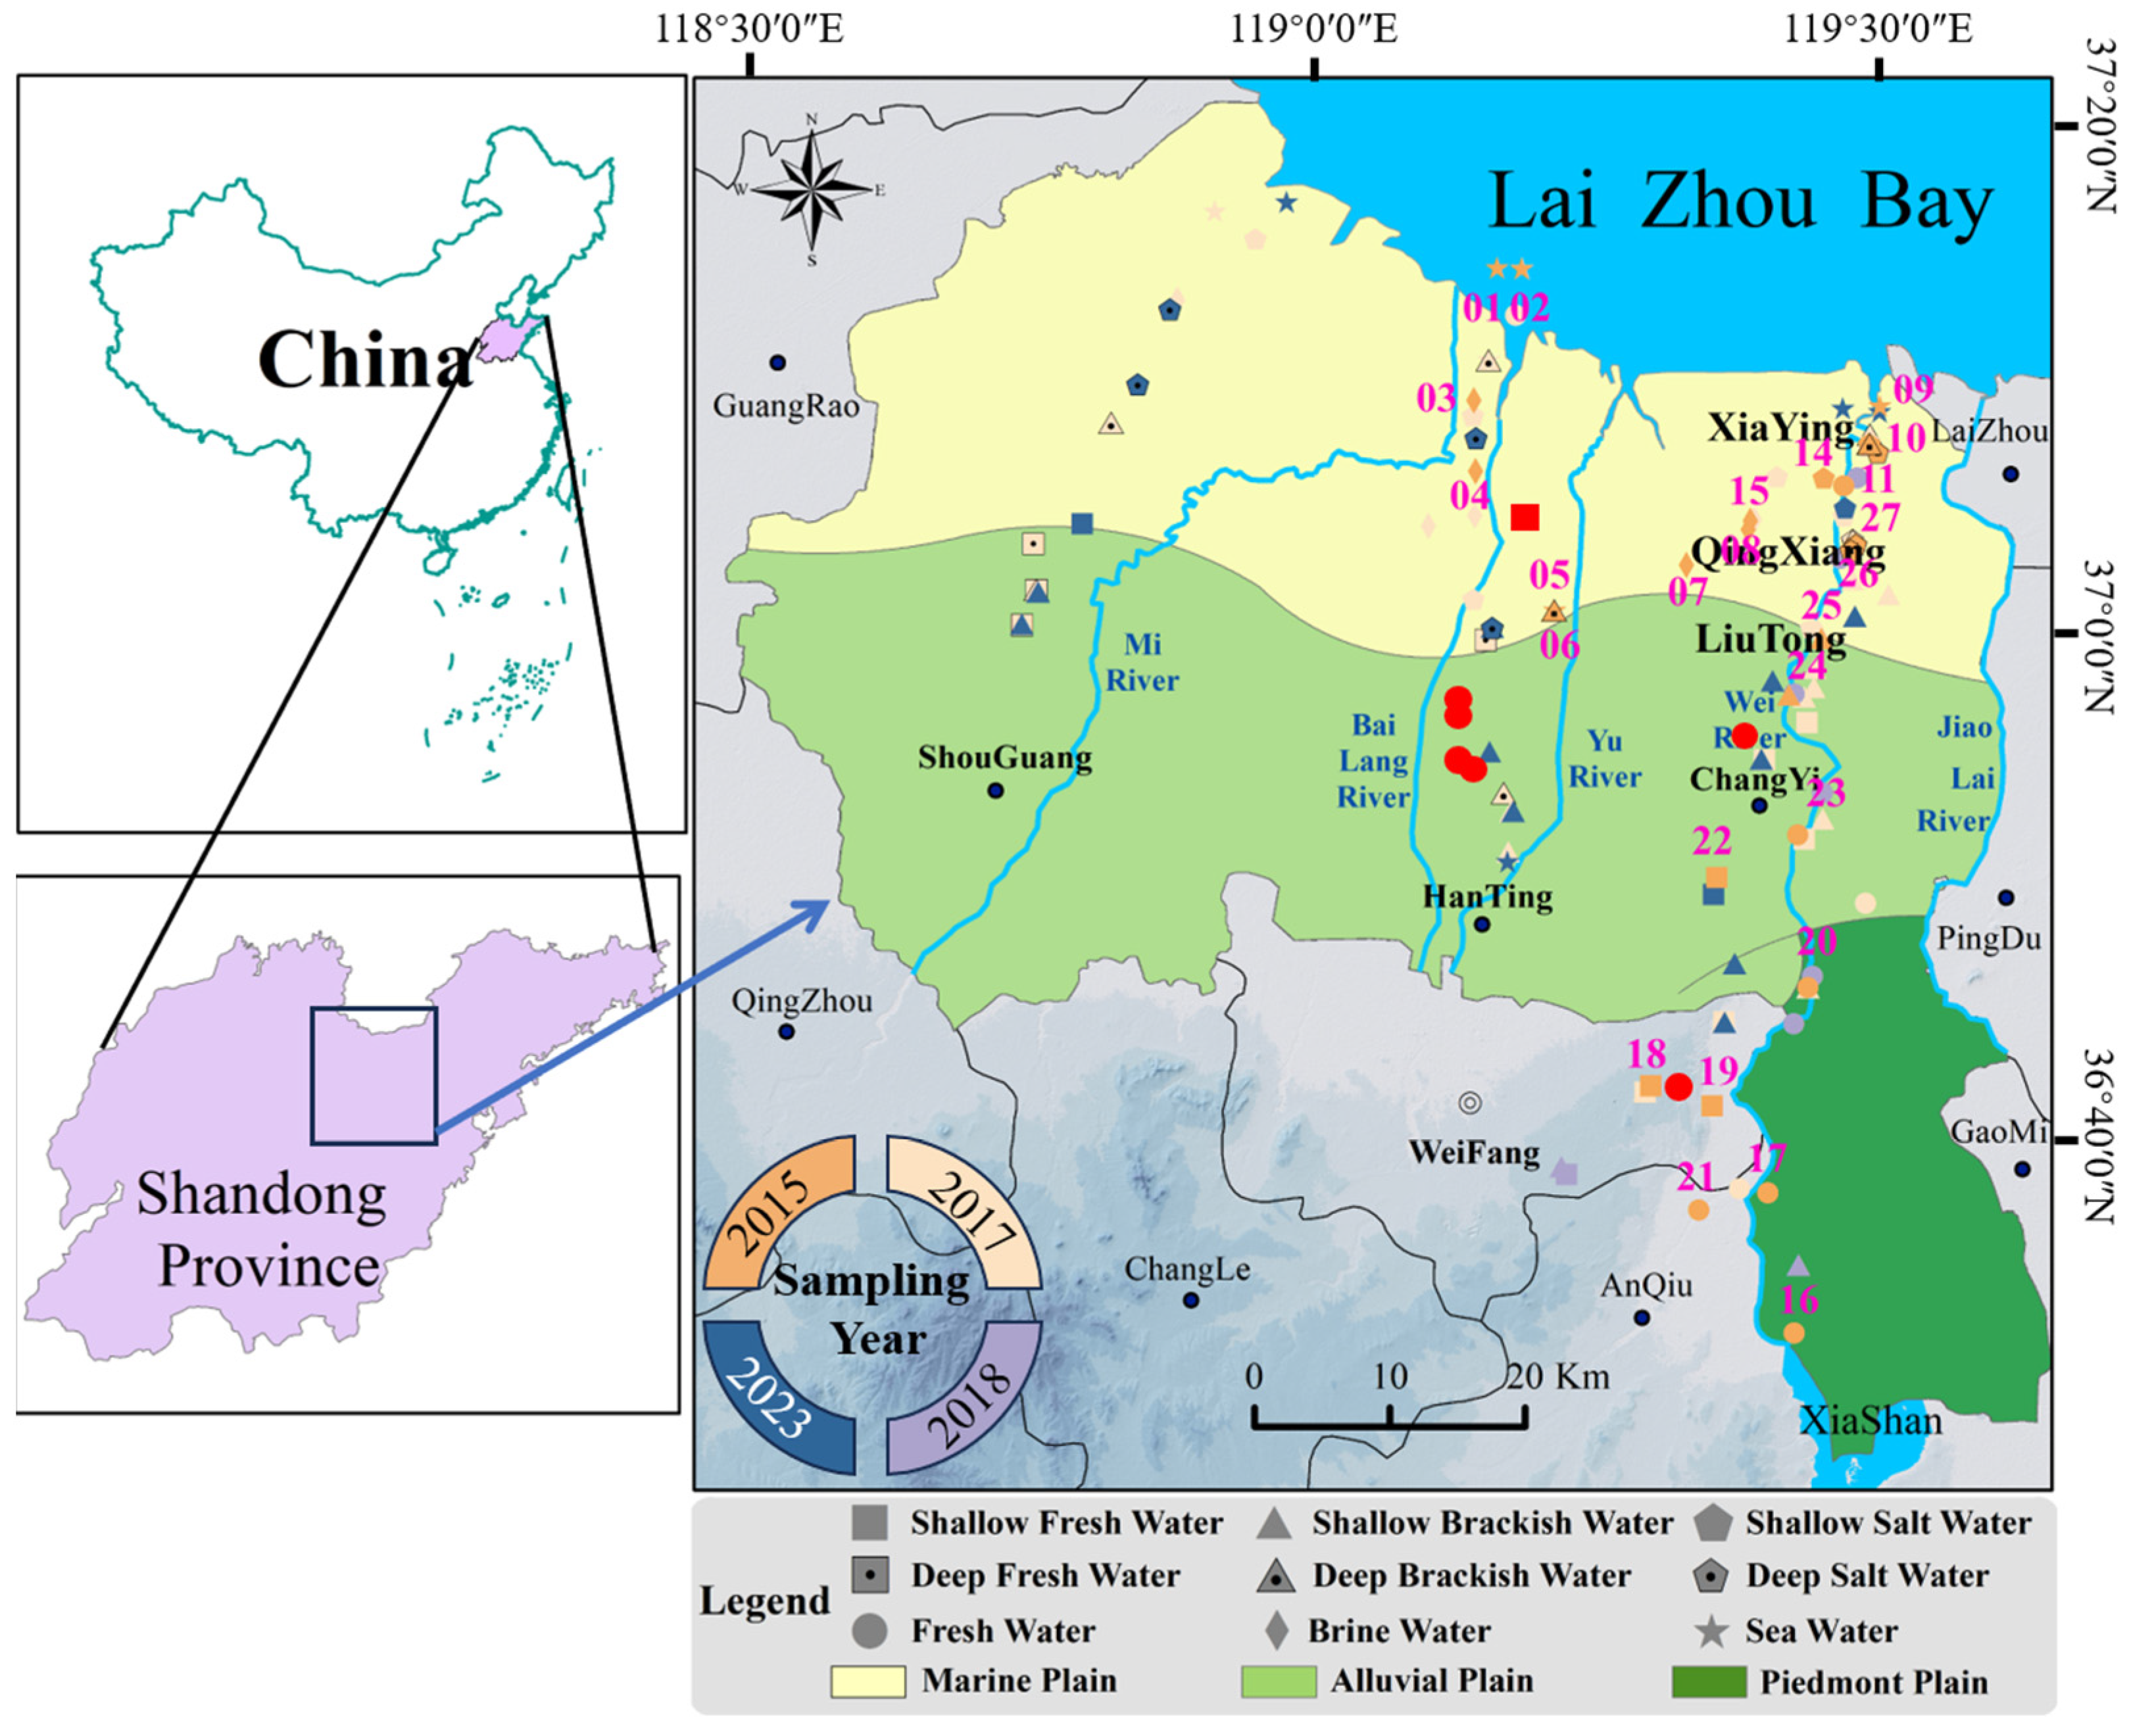
The Weibei Plain is located in the central part of the Shandong Peninsula, between 36°41′ and 37°19′ north latitude, and 118°32′ and 119°10′ east longitude, situated along the southern coast of Laizhou Bay in the southern Bohai Sea, with a total area of 3847.92 km2 (Figure 1); falls within a temperate monsoon climate zone; and the average annual temperature is 12.3 °C. The average annual precipitation is 731 mm, of which approximately 60–65% is concentrated between July and September. Conversely, the annual average evaporation reaches 1468.71 mm, more than double the annual precipitation. From east to west, the study area is traversed by several rivers, including the Mi, Bailang, Wei, Jiaolai, Sha, and Wang rivers, each of which is a rain-fed river in the monsoon region. Topographically, the region transitions from south to north through a piedmont plain, an alluvial plain, and a marine plain, forming a natural banded structure from land to sea, with elevations descending from 40 m down to 1–2 m [18].
The alluvial fan in the study area is predominantly composed of gravel and sandy gravel, which gradually transitions to fine sand, silt, sandy clay, and silty clay toward the coastline. The thickness of the main aquifer is approximately 30–50 m in the south, thickening progressively northward to a maximum of 350 m. Minerals within the shallow aquifer primarily include quartz, albite, plagioclase, pyroxene, biotite, aragonite, dolomite, calcite, kaolinite, gibbsite, and trace amounts of calcium montmorillonite [15]. The clay deposits are mainly composed of illite, kaolinite, and chlorite [11]. Gypsum is prevalent in the coastal saline water areas [19], whereas silicate rocks dominate the freshwater groundwater zone at the apex of the Wei River alluvial fan in the south [20,21].
Existing evidence indicates that the study area has undergone three large-scale marine transgression and regression events, resulting in three distinct, brine-rich marine sedimentary layers in the coastal zone (located at depths of 0–15 m, 33–42 m and 59–74 m) [15]. The extensive cone of depression induced by intensive brine extraction has disrupted the hydrodynamic equilibrium between freshwater and seawater. This disruption has triggered severe seawater intrusion, leading to widespread groundwater salinization within the marine plain in the central and northern coastal sectors. Furthermore, buried paleochannels distributed across the middle and lower reaches of the Mi and Wei river basins serve as preferential conduits for this seawater intrusion [22].

3. Materials and Methods

3.1. Sample Collection and Field Testing

In order to analyze the long-term water chemistry changes in the study area, during four sampling campaigns conducted in 2015, 2017, 2018, and 2023, a total of 115 groundwater and surface water samples were collected. Routine hydrochemical analyses were performed on all samples, which included 46 shallow groundwater samples (depth < 60 m), 40 deep groundwater samples (depth > 60 m), and 7 brine samples. Based on Total Dissolved Solids (TDS), the samples were classified into four categories following the standards of previous research [11,23,24]: shallow and deep freshwater (SFW and DFW, TDS ≤ 1 g/L), shallow and deep brackish water (SBW and DBW, 1 g/L < TDS ≤ 10 g/L), shallow and deep saline water (SSW and DSW, 10 g/L < TDS ≤ 100 g/L), and brine (100 g/L < TDS). Additionally, 27 samples were analyzed for B, Cl, and Br isotopes, and 115 samples were tested for stable hydrogen and oxygen isotopes. During field collection, groundwater was continuously pumped until the temperature, pH, and electrical conductivity stabilized. These parameters, alongside TDS, were measured in situ. Detailed protocols regarding site conditions, sampling methodologies, and hydrochemical analytical procedures are provided in [4].

3.2. Water Chemistry and Isotope Analysis

Major ionic components were determined using an Ion Chromatograph (ICS-1100, Thermofisher, Wilmington, DE, USA) and an Inductively Coupled Plasma Optical Emission Spectrometer (ICP-OES, ICAP-6300, Thermo Fisher, Wilmington, DE, USA) at the Experimental Center of the School of Environmental Studies, China University of Geosciences (CUG). Parallel testing was conducted on a randomly selected 15% subset of samples. A charge balance error (CBE) check was performed for all samples, with errors for the vast majority remaining below 5%. The stable isotopic compositions of hydrogen and oxygen (δ2H and δ18O) were determined using a Thermal Conversion Elemental Analyzer coupled with an Isotope Ratio Mass Spectrometer (TC/EA-IRMS, Finnigan, Germany) at the State Key Laboratory of Biogeology and Environmental Geology, CUG [25]. The results were normalized against the V-SMOW standard, achieving analytical precisions of ±1.0‰ for δ2H and ±0.1‰ for δ18O.
Analyses of Br and Cl isotopes were likewise conducted at the State Key Laboratory of Biogeology and Environmental Geology, CUG. Measurements were performed using an Isotope Ratio Mass Spectrometer (IRMS, Finnigan, Germany) coupled with a GasBench II interface [26], measured via CH3Br and CH3Cl gases. The resulting isotopic ratios are expressed in per mil (‰) relative to Standard Mean Ocean Bromide (SMOB) and Standard Mean Ocean Chloride (SMOC), with precisions of ±0.06‰ and ±0.08‰, respectively. It is worth noting that 5 surface water and 4 deep water samples did not yield detectable bromine isotopic compositions due to low bromide ion concentrations.
Boron isotopic composition was determined via the graphite-loaded Cs4BO3 method utilizing a Triton single-magnetic-sector thermal ionization mass spectrometer(Triton, Thermo Fisher, Wilmington, DE, USA) at the Salt Lake Chemical Analysis and Testing Center, Chinese Academy of Sciences. Data are expressed in per mil (‰) relative to the standard reference material NIST NBS 951a, with an analytical precision of ±0.2‰ [11]. Similarly, 1 surface water and 6 deep water samples failed to yield boron isotope data due to low boron ion concentrations.

3.3. Stable Isotope Composition Calculation Model

To further analyze the formation and evolution of brackish water, the stable isotope composition calculation formula summarized by previous research [27] was employed to analyze the isotopic compositions of B and Br in the saline water. Taking B as an example, the formula is as follows:
δ11B(m) = [F1CB(a)δ11B(a) + F2CB(b) δ11B(b)]/[F1CB(a) + F2CB(b)]
where a and b represent the two end-members of the mixed water body; F1 and F2 represent the volume fractions of a and b in the mixed water; CB(a) and CB(b) represent the B concentrations of a and b; δ11B(m), δ11B(a) and δ11B(b) represent the B isotopic compositions of the mixed water and end-members a and b.
When utilizing B isotopic characteristics for saline water genesis analysis, the mean value of 5 FW samples from the recharge area was used as the freshwater end-member; the mean of 3 samples was used for the seawater end-member; No.15, which had the highest δ11B value, was used as the brine end-member; and No.11 was used as the deep brackish water end-member.
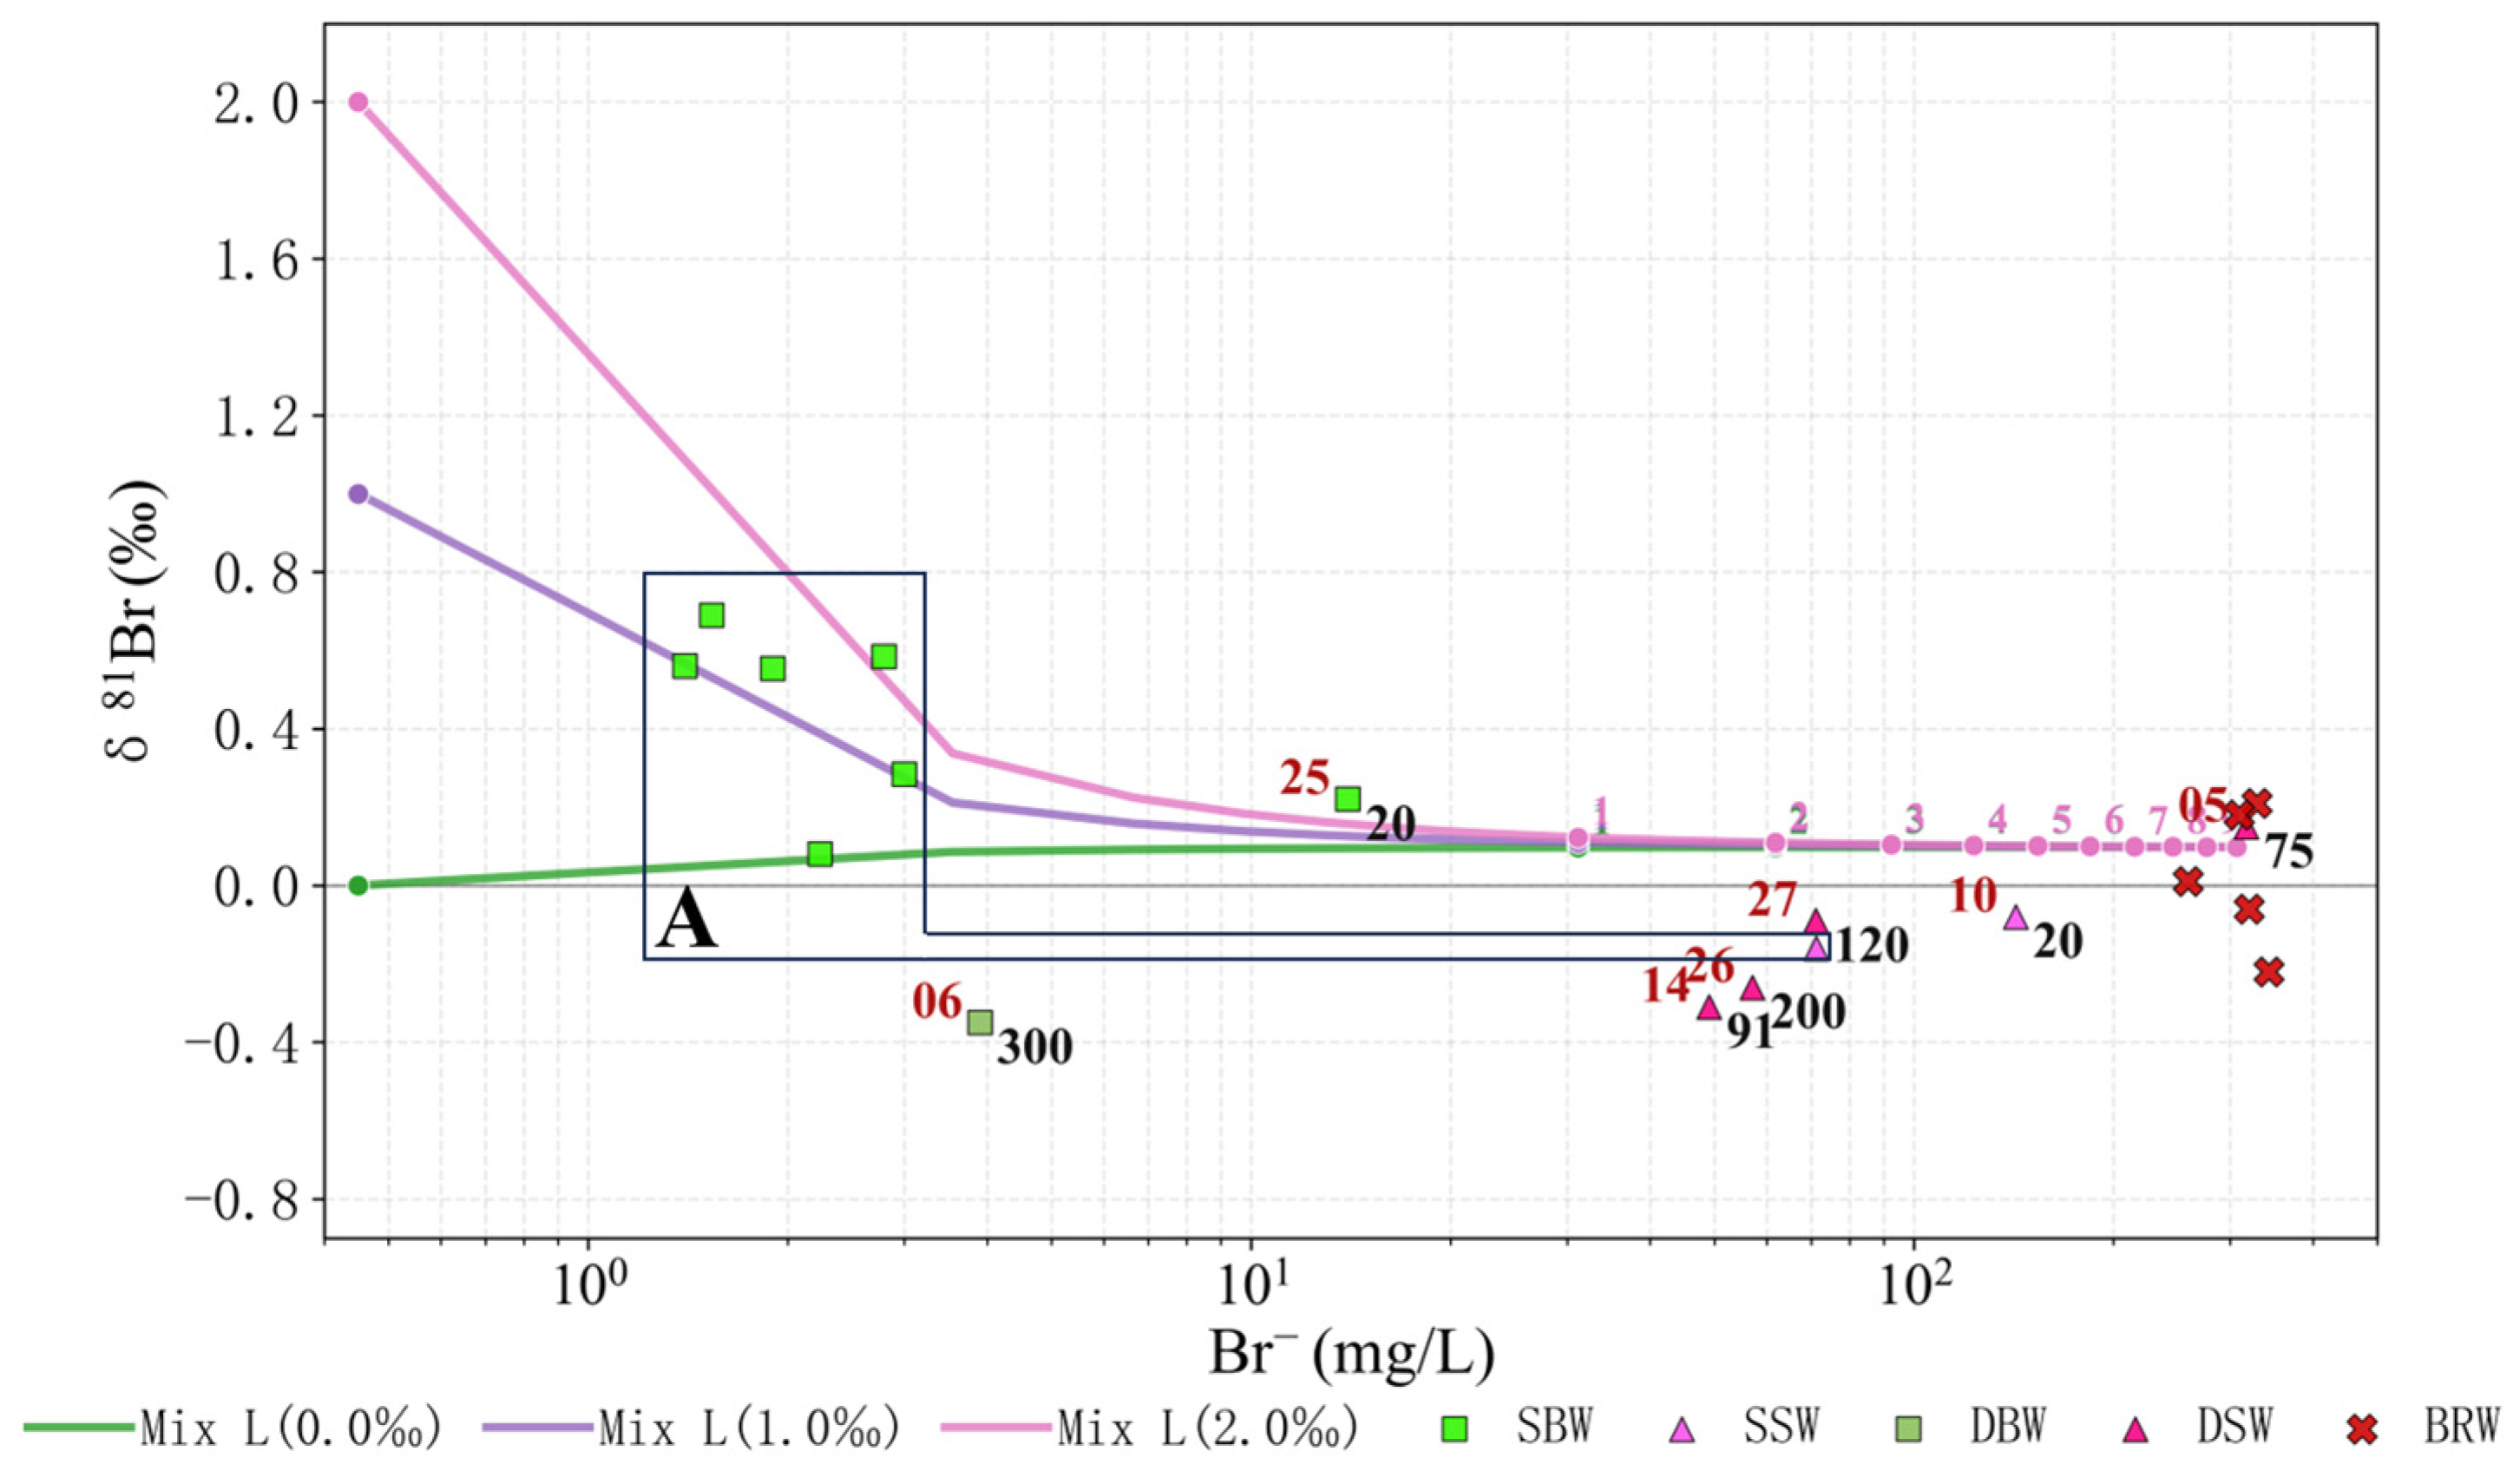
When analyzing saline water using Br isotopic characteristics, surface water samples were used as the freshwater end-member. However, the δ81Br values of the 5 FW samples were not detected. Additionally, the only surface water sample (No.13) with a detected δ81Br value was collected near the pumping sluice gate near the Wei River estuary and cannot serve as the freshwater end-member for the recharge area. Therefore, based on the previous analysis that freshwater of atmospheric origin typically possesses positive δ81Br values relative to SMOB, and referencing the assumptions of previous studies like Du et al., 2015 [12], three specific δ81Br(a) values were assigned for the freshwater end-member: 0.00‰, 1.00‰ and 2.00‰. CBr(a) adopts the mean value of the FW, which is 0.45 mg/L. BRW No.27 and No.26 are both from depths more than 60 m, the mean δ81Br and Br values of 6 shallow brine samples were used as the brine end-member, where CBr(b) = 306.95 mg/L and δ81Br(b) = 0.09‰.

4. Results

4.1. Hydrochemical Types and Spatial Distribution

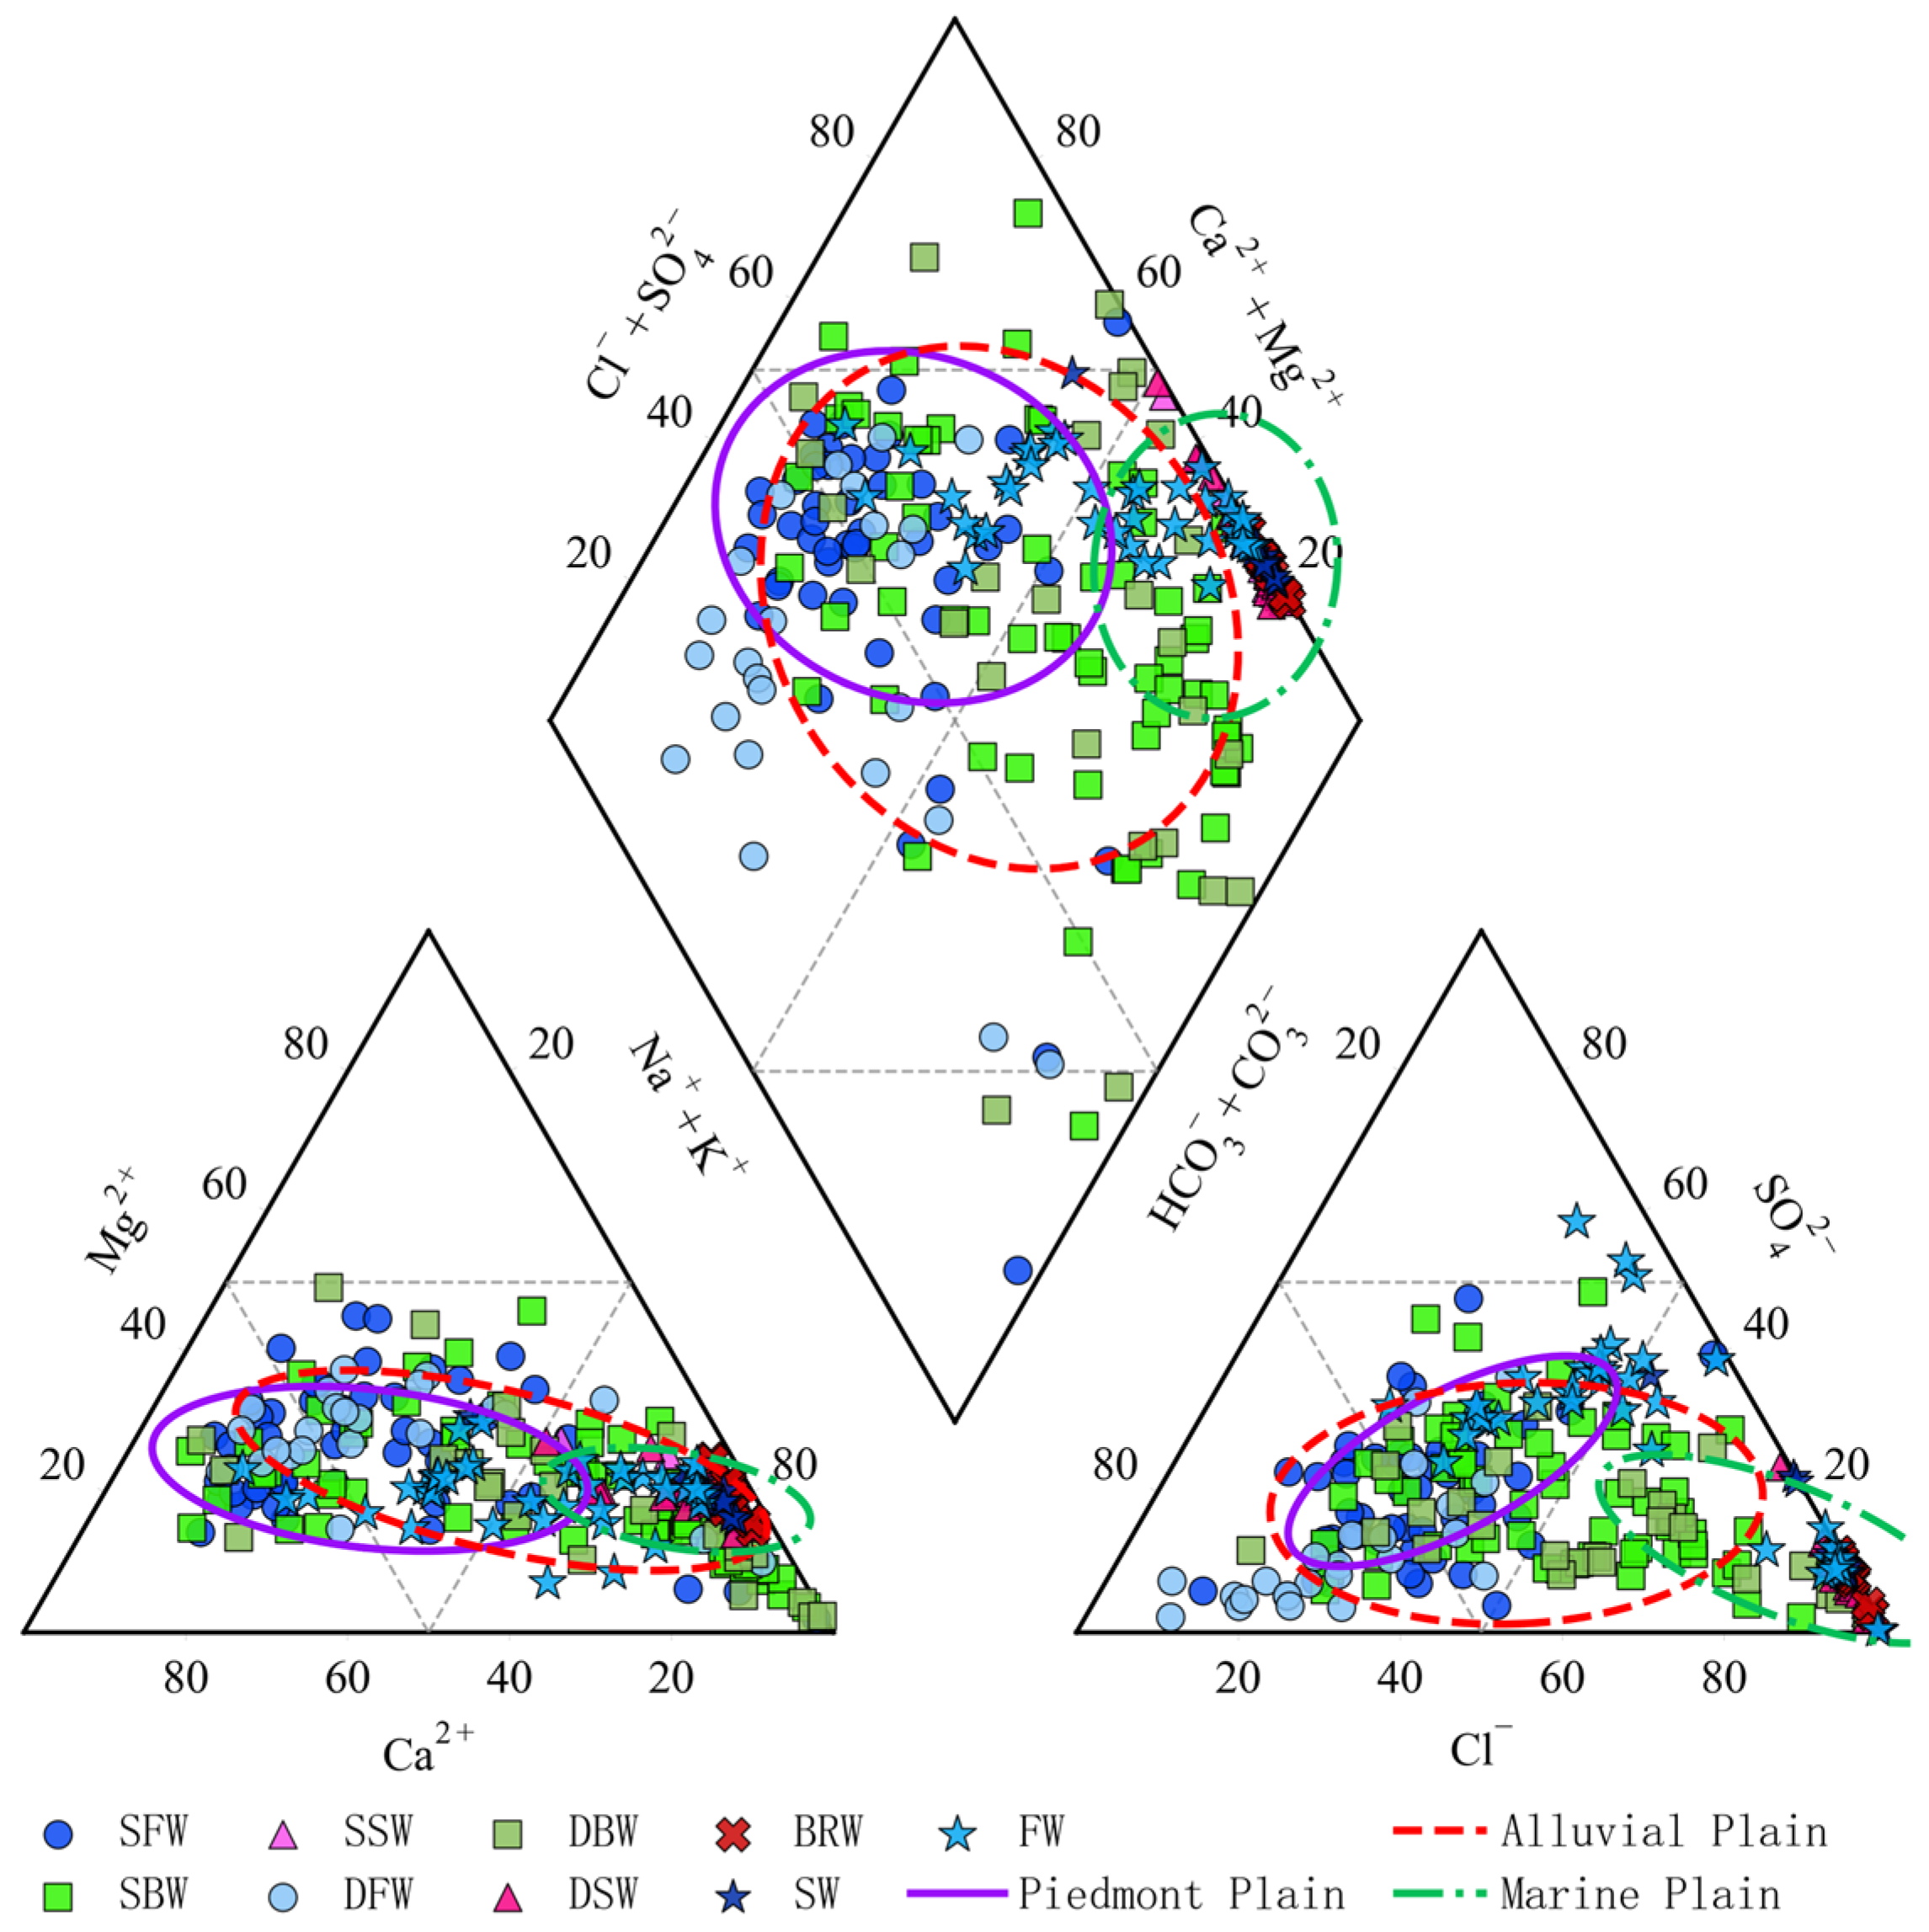
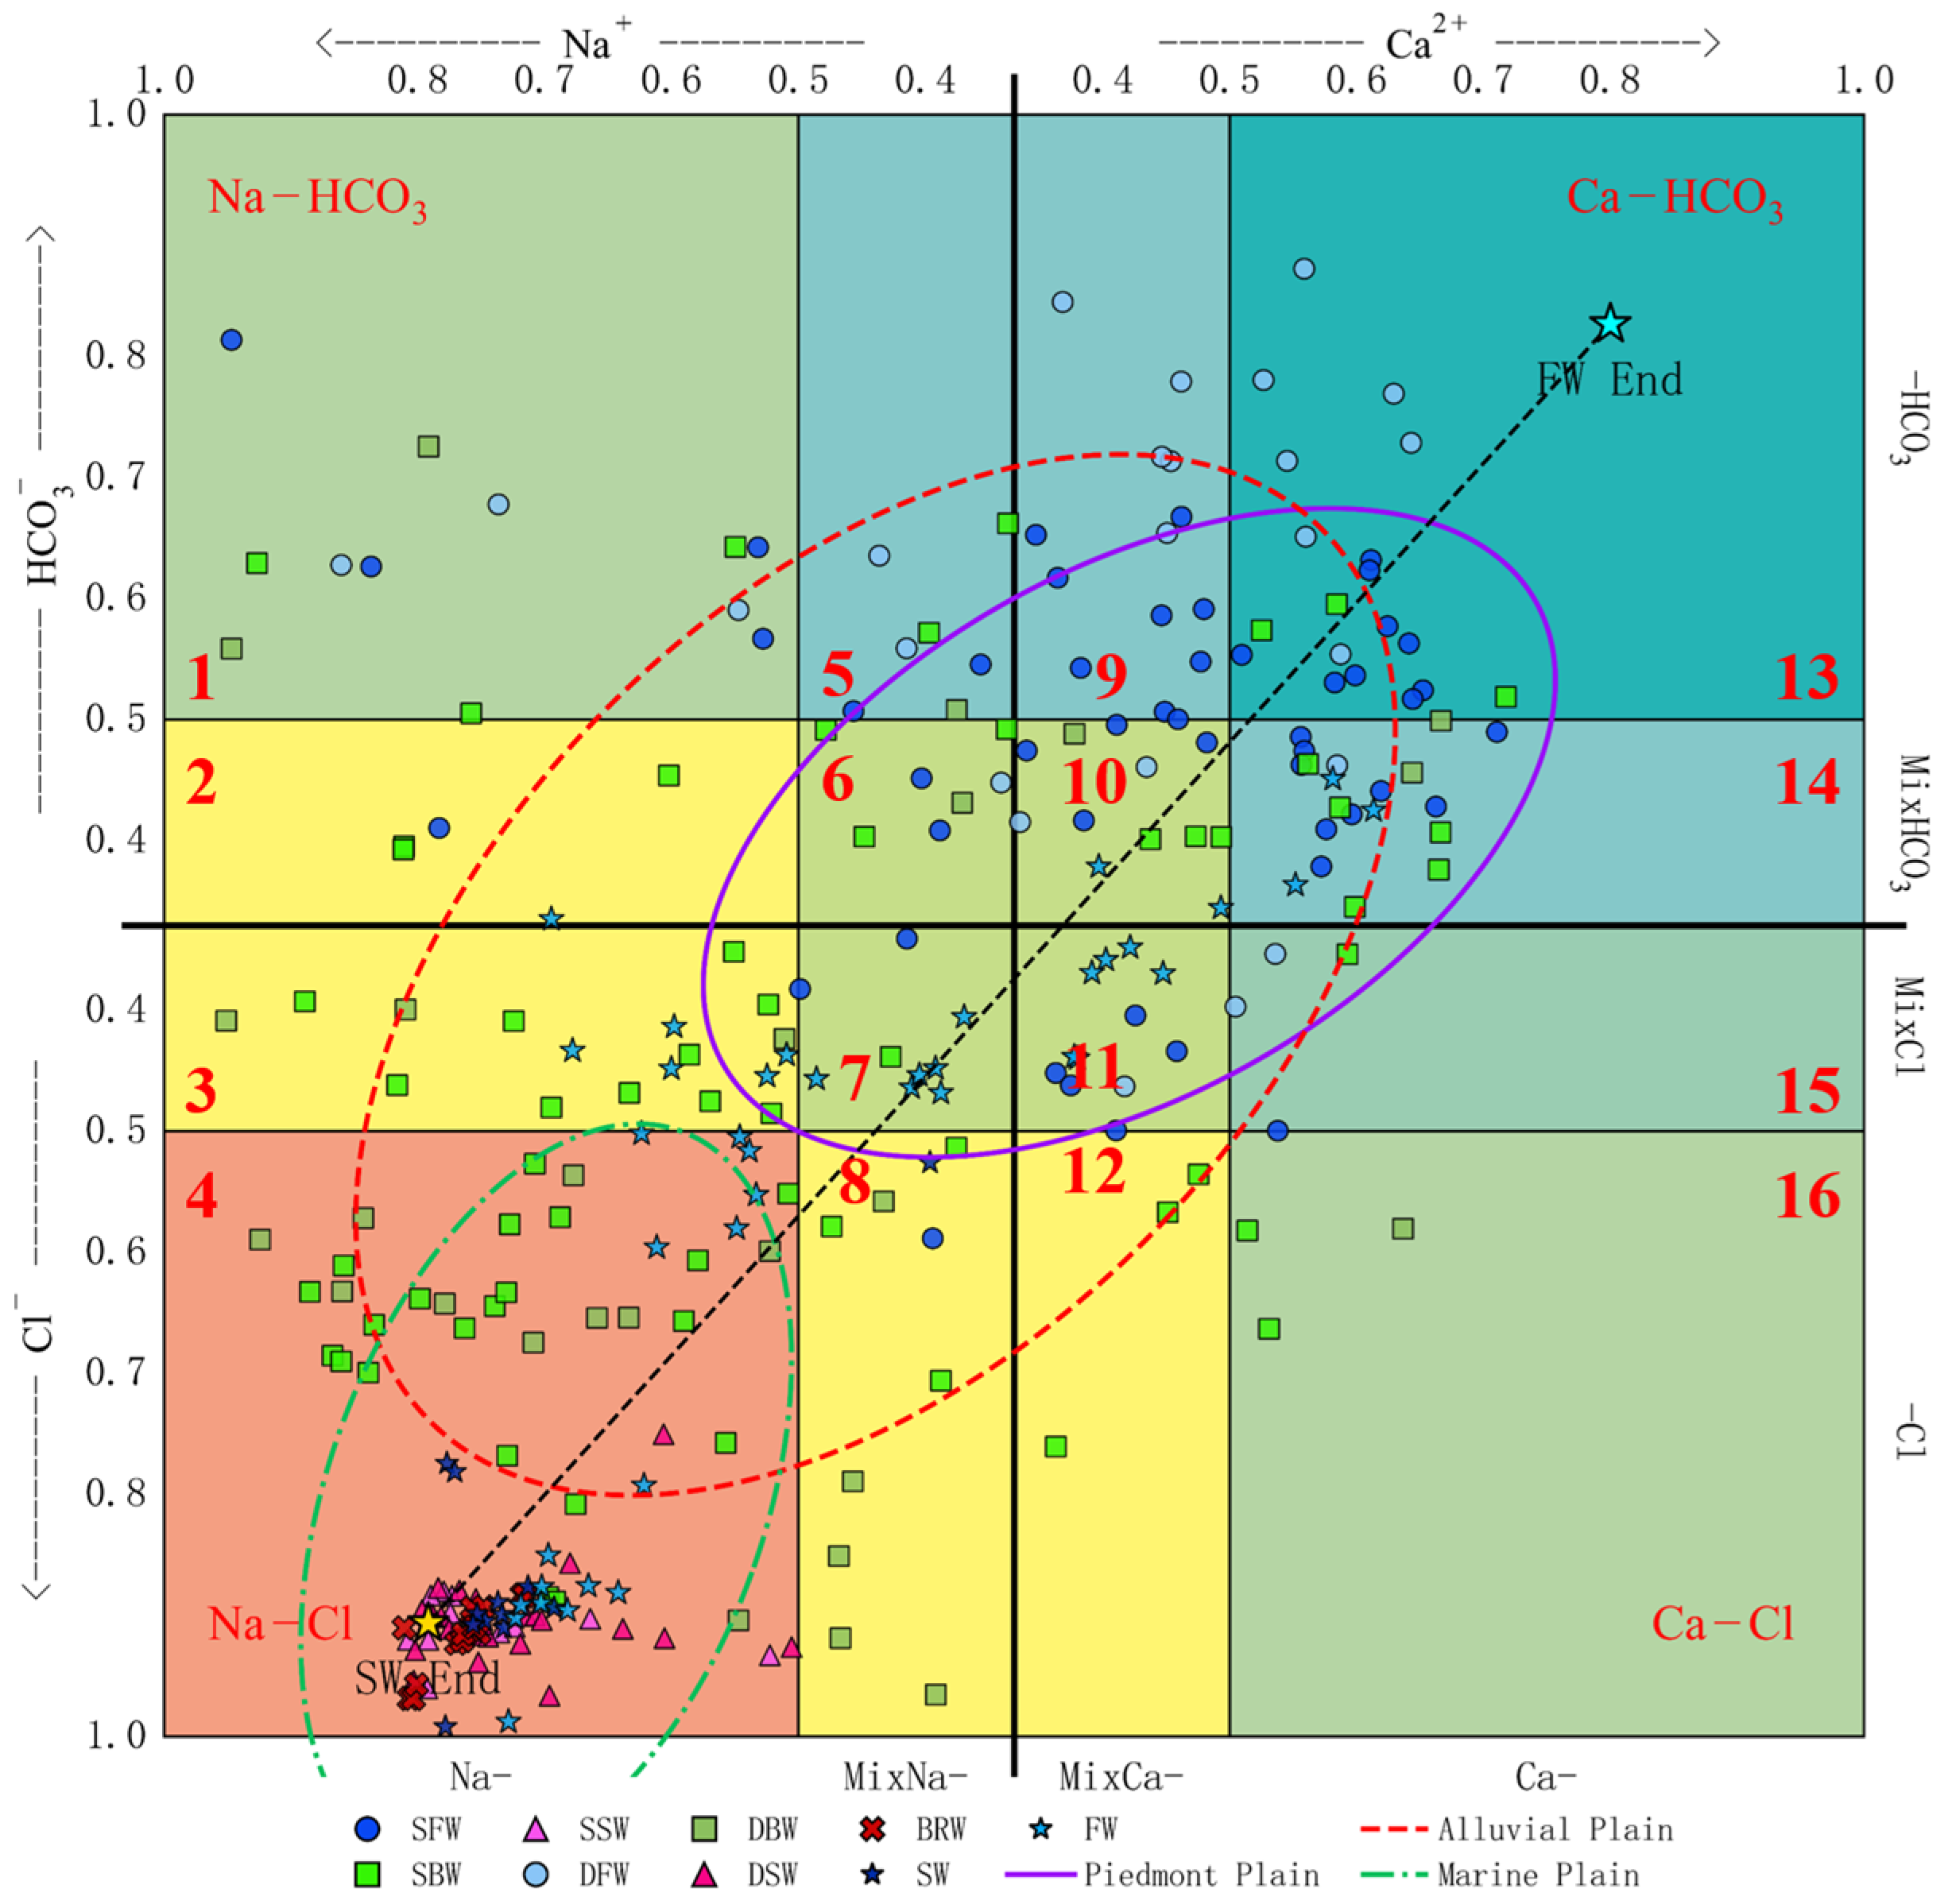
The Piper trilinear diagram [28] (Figure 2) and HFE-Diagram [29] (Figure 3) illustrate the hydrochemical variations across the different hydrogeological zones. In the piedmont plain, SFW and DFW clusters in the upper-left quadrant of the Piper trilinear diagram denote high proportions of Ca2+, Mg2+ and HCO3, with minimal Na+ and K+. In Figure 3, SFW primarily occupies fields 13 and 11, indicating Cl-Na·Mg and MixCa-MixCl types, while DFW clusters in field 13, signifying a predominant Ca- HCO3/SO4 signature.
Within the alluvial plain, fresh groundwater maintains this upper-left distribution, though SFW plots slightly above DFW. This shift reflects higher relative concentrations of Cl and SO42− alongside reduced HCO3 in shallow systems. DFW here is primarily of the HCO3·SO4-Na·Ca type (fields 1, 5, 9, 13), where decreasing TDS triggers the exchange of Na+ and K+ for Ca2+ and Mg2+. SBW and DBW shift toward the center-right of the Piper diamond, dominated by Na+, K+ and Cl. Most brackish samples cluster in fields 3 and 4 of the HFE-Diagram, defining them as freshened Na-Cl types undergoing active cation exchange driven by shifting TDS.
In the marine plain (Figure 2 and Figure 3), high-salinity end-members (SSW, DSW, and BRW) unequivocally display the Cl-Na type (field 4 in the HFE-Diagram). SBW acts as a transitional fluid, clustering in fields 2, 3, and 4 (freshened Na-MiHCO3/MixSO4/MixCl type). DBW is largely Na-Cl dominant, yet specific samples exhibit higher Ca2+ and Mg2+ ratios than SW, pointing to active ion exchange between Na+-rich invading marine fluids and the alkaline earth metals bound within the aquifer matrix. Overall, the hydrochemical zonation is distinctly controlled by proximity to the coastline and burial depth. Coastal and shallow groundwaters are notably enriched in marine indicators (Cl, SO42−), while inland and deep aquifers retain stronger terrigenous signatures (Ca2+, Mg2+) [30,31].

4.2. Major Ionic Correlations and Gibbs Diagram

Spearman’s rank correlation (Figure S1 in the Supplementary Materials) displays a highly significant positive correlation between TDS, Na+, and Cl in SSW, DSW, SBW, and DBW (r > 0.90), with SSW reaching r = 0.99. In SBW and DBW, the correlation between Br and Cl exceeds 0.97. Conversely, the TDS of SFW correlates more strongly with HCO3 (r = 0.76), while DFW correlates strongly with SO42− (r = 0.81). DFW also exhibits robust correlations between NO3 and Br (r = 0.99). According to the Gibbs diagram (Figure S2), groundwater chemistry is distributed between the water/rock interaction dominance (SFW, DFW) and evaporative concentration dominance (SSW, DSW, BRW).

4.3. δ2H and δ18O Results

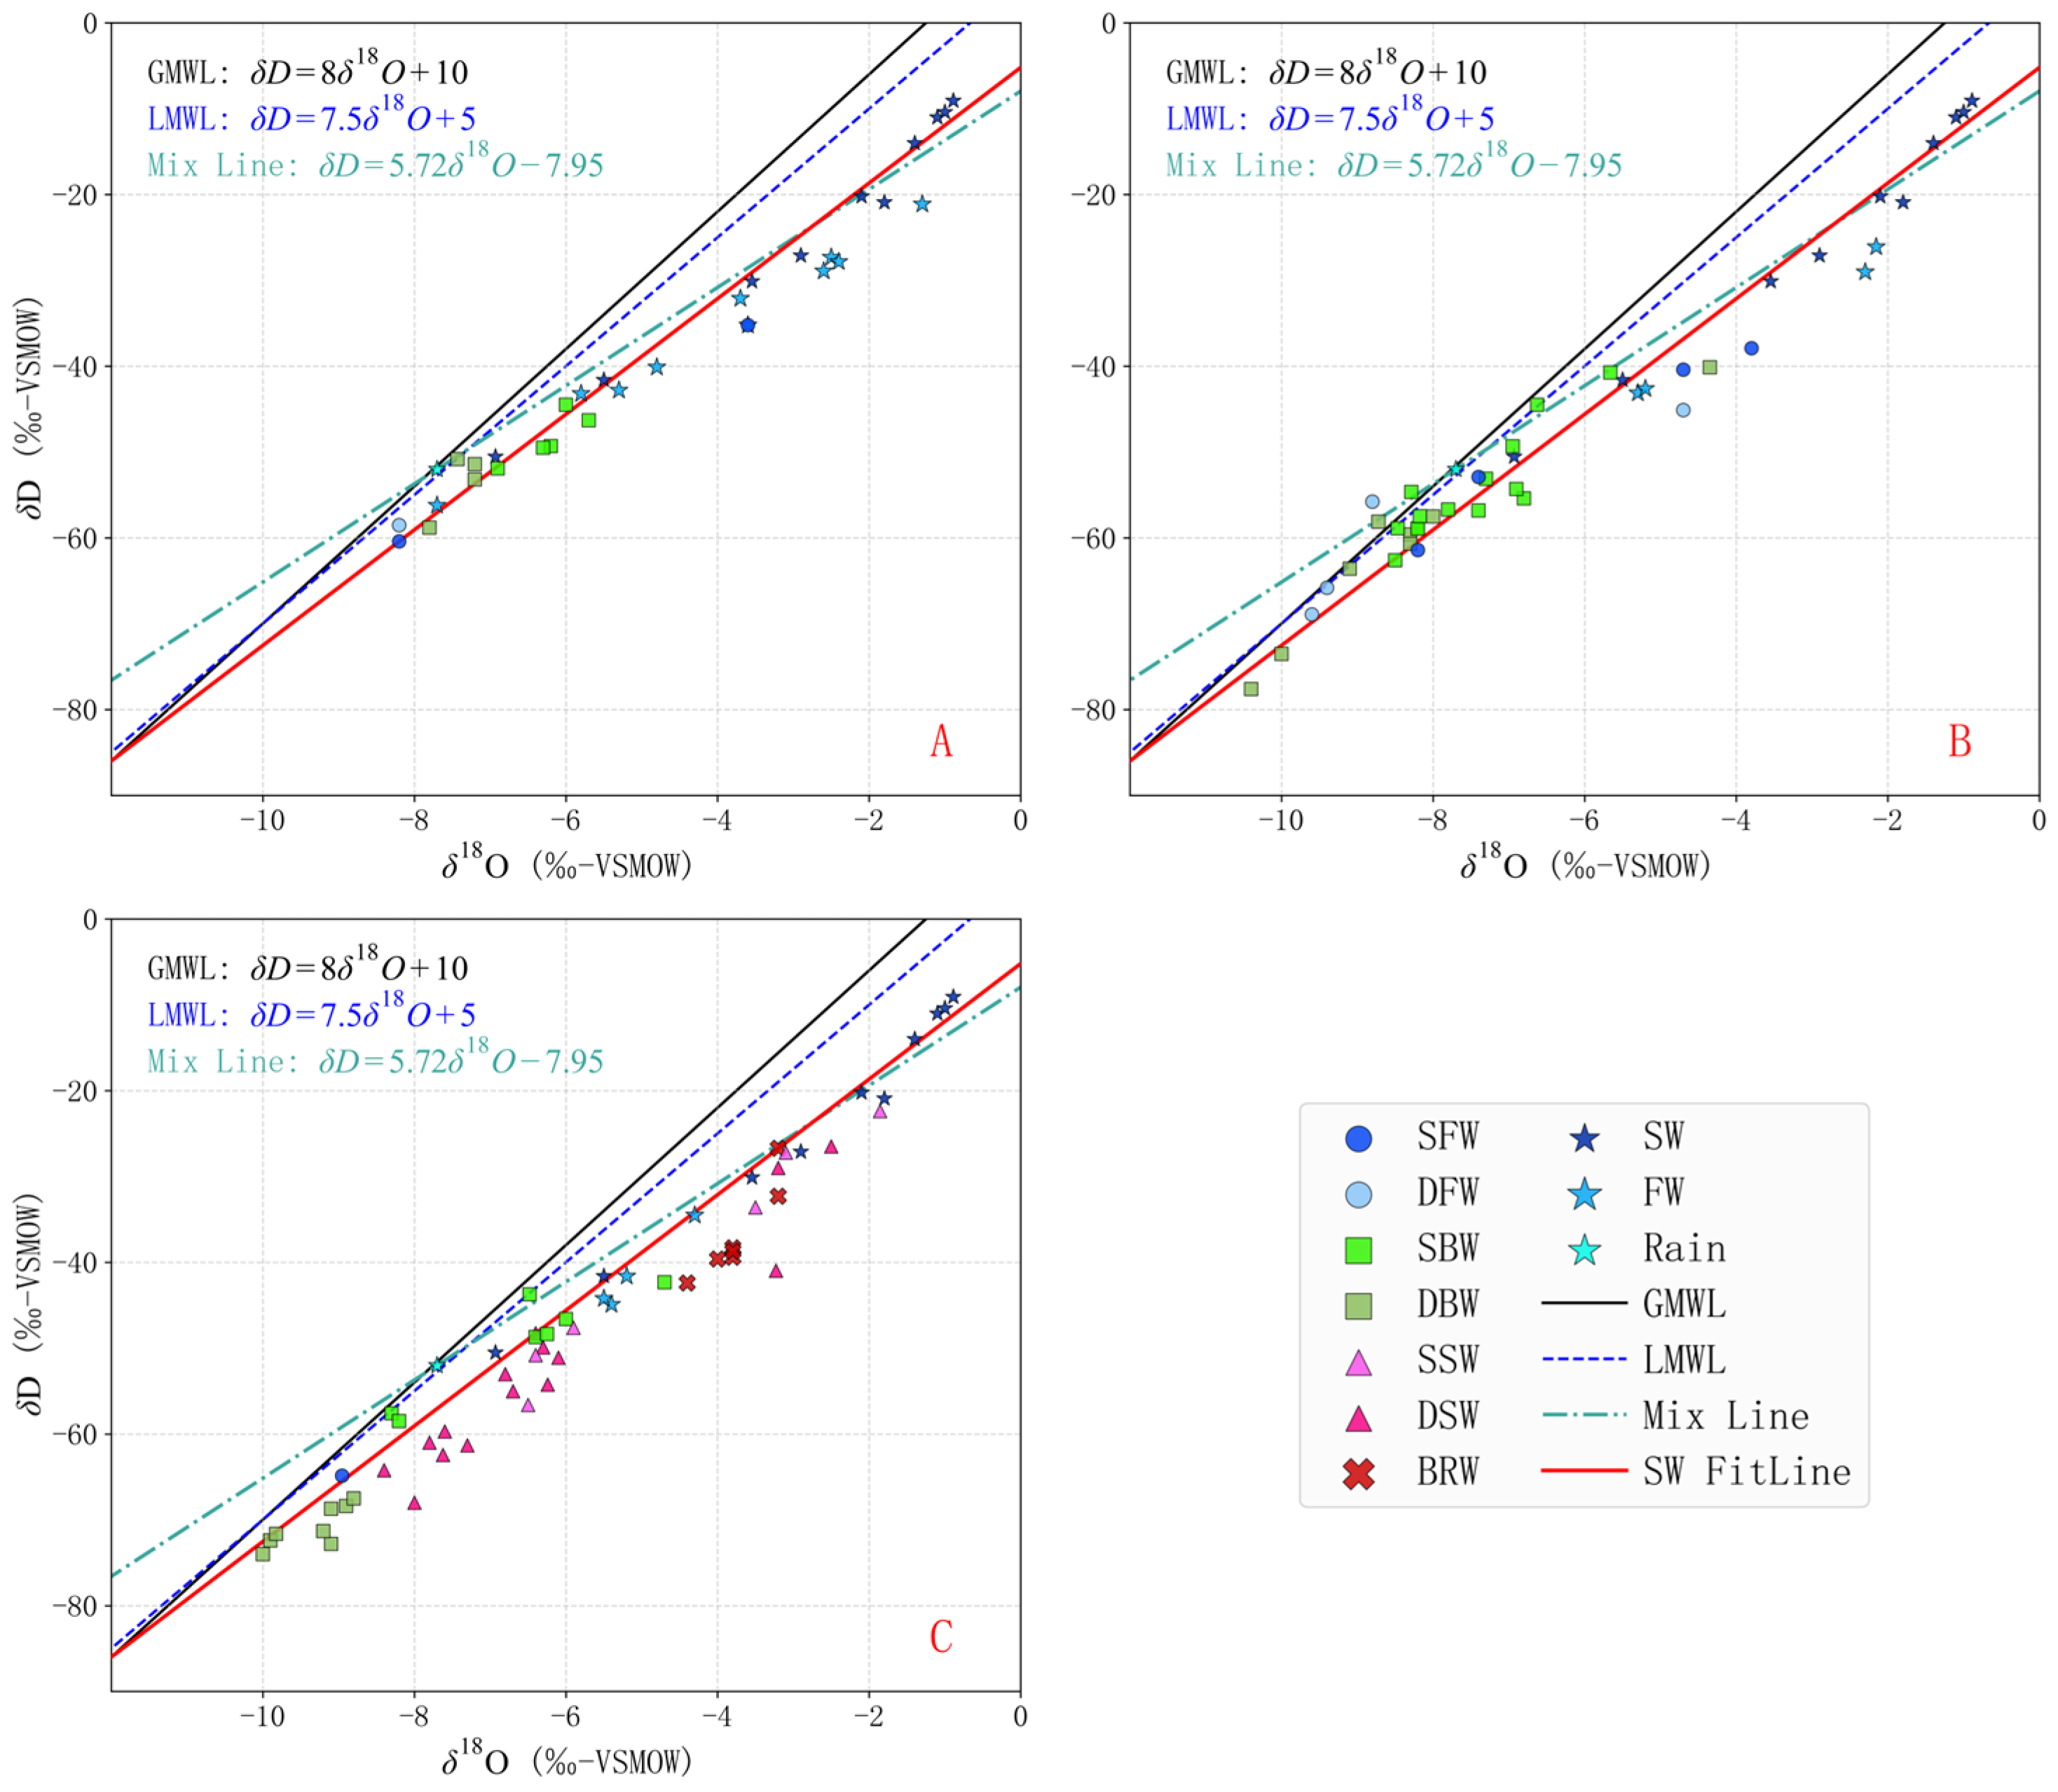
The δ2H and δ18O isotopic compositions predominantly plot below both the Global Meteoric Water Line (GMWL) [32] and the Local Meteoric Water Line (LMWL, slope = 7.5) [4], as well as below the conservative mixing line between local rainwater and seawater (slope = 5.72) (Figure 4). While SBW, DBW, and BRW consistently plot below the LMWL, their spatial distribution reveals diametrically opposed isotopic behaviors. In the shallow system, SBW in both the piedmont and marine plains is relatively enriched. This enrichment stems from two distinct processes: evaporative infiltration through the exceptionally thick vadose zone in the piedmont plain, and direct phreatic evaporation from the extremely shallow water table in the marine plain. Conversely, SBW in the alluvial plain retains a relatively depleted signature due to rapid runoff renewal.
Marine plain DBW exhibits anomalous isotopic depletion compared to DBW further inland in the deep system. This proves that deep groundwater near the coast is not a product of the modern hydrological cycle, but rather paleo-groundwater recharged under colder paleoclimatic conditions (e.g., the Late Pleistocene) [33]. The isotopic profile of BRW further underscores this complexity: despite undergoing extreme evaporative concentration, its isotopic abundance remains below the modern seawater baseline. This suggests a multi-stage evolution where ancient seawater (or residual transgressive fluids) mixed extensively with isotopically depleted ancient continental runoff either prior to or during its evaporative concentration phase. This conceptual model is strongly supported by the widespread occurrence of buried paleochannels in the marine plain [22]. Detailed statistical values for all water types are provided in Table S1 in the Supplementary Materials.

4.4. δ11B, δ81Br and δ37Cl Results

From Table 1, the δ11B values across the dataset are strictly positive, spanning 8.59‰ to 64.42‰, falling within the typical natural range. The average δ11B of modern seawater is +38.73‰. Excluding No.13 (collected near the estuarine pumping station), inland surface waters average 11.11‰. Groundwater exhibits increasing boron isotopic enrichment with rising salinity: brackish water averages 36.08‰, saline water averages 46.60‰, and brine peaks at an average of 54.45‰.
The δ81Br values of all collected samples range from −0.35‰ to +0.22‰, well within the regional baseline previously established by previous research [12]. Brine δ81Br values fluctuate between −0.22‰ and +0.21‰. Notably, brine samples collected from identical depths (e.g., No.07 and No.08) exhibit divergent isotopic signatures (−0.22‰ and +0.21‰, respectively). Brackish and saline water samples display a similarly broad range (−0.35‰ to +0.22‰).
The δ37Cl values of all collected samples range from −0.89‰ to +1.03‰, with a large overall span. Brine δ37Cl values fluctuate between +0.14‰ and +0.21‰, all positive values, indicating that the chlorine isotope composition of this type of water sample is highly consistent. Saline water δ37Cl values fluctuate between −0.28‰ and +1.03‰. This contains the largest value among all water samples (1.03‰, No.27), while the remaining samples fluctuate between −0.28‰ and 0.15‰.

5. Discussion

5.1. Characteristics of Coastal Groundwater Salinization

The distinct hydrochemical zoning observed from the piedmont to the marine plain is not merely a product of simple lateral seawater intrusion, but rather reflects a complex interplay of geographic geomorphology, historical marine transgressions, and intense water/rock interactions. The transition of groundwater types in the HFE-Diagram captures the evolution of hydrochemical phases from piedmont to alluvial plain to marine plain.
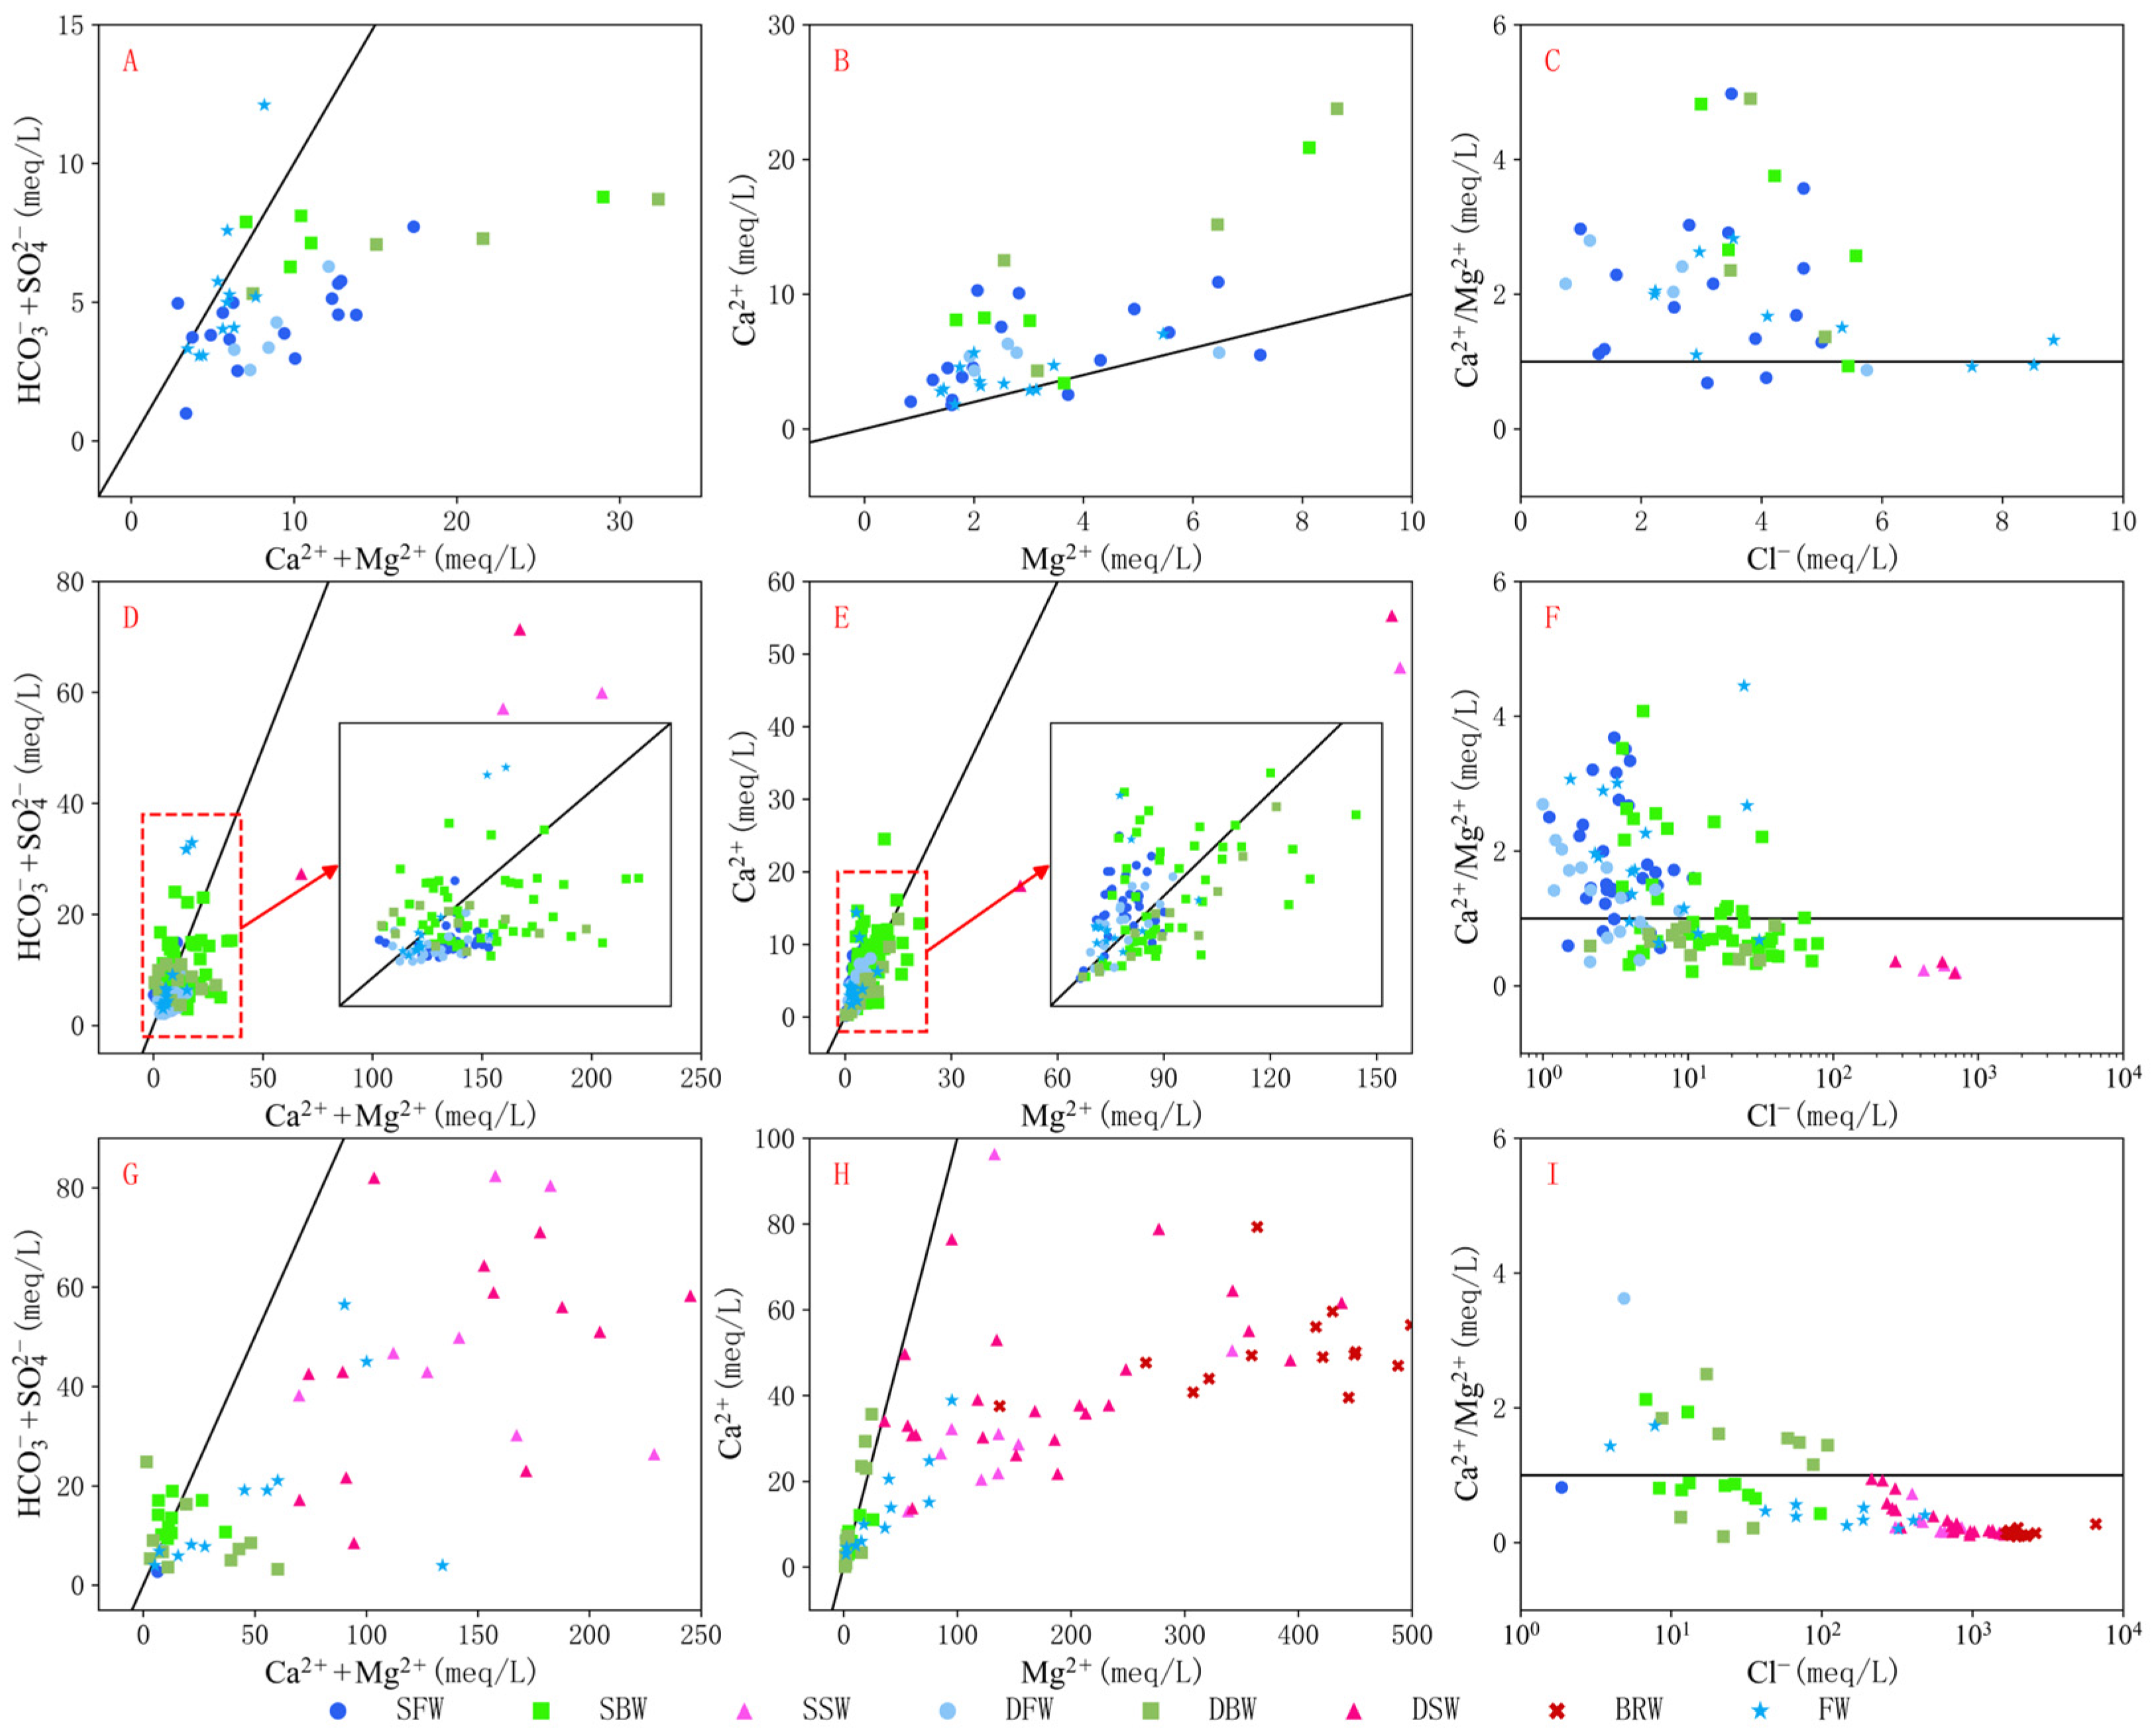
From Figure 5, in the piedmont and alluvial plains, SFW and DFW generally fall within the (HCO3 + SO4)/(Ca + Mg) < 1 and Ca/Mg > 1 domains. Under active runoff recharge, these waters undergo intense calcite weathering, creating a Ca2+-rich baseline further supplemented by reverse cation exchange during fluid migration. Concurrently, reverse cation exchange occurs during fluid migration, providing an additional source of Ca2+ and Mg2+ and thereby further increasing their concentrations [34], and indicating that the freshwater system of the alluvial plain maintains hydraulic contact with the piedmont plain. However, in the alluvial plain, SBW and DBW samples fall on both sides of the (HCO3 + SO4)/(Ca + Mg) = 1 and Ca/Mg = 1 thresholds. This dispersion highlights the alluvial/marine transitional zone as an active front for FW displacement and saline intrusion, shaped by multi-end-member mixing.
In the marine plain (saline water distribution area), groundwater chemical evolution presents a multi-end-member mixing process consistent with the alluvial plain. SBW and DBW are mainly distributed near (HCO3 + SO4)/(Ca + Mg) = 1 and Ca/Mg = 1, indicating alternating influences from terrigenous freshwater and Mg2+-rich, Ca2+-poor marine end-members. As salinization intensifies in the marine plain, SSW and DSW shift decisively toward (HCO3 + SO4)/(Ca + Mg) < 1 and Ca/Mg < 1, reflecting absolute control by the Mg2+-rich, Ca2+-poor marine end-member.
As shown in Figure 5C,F,I, the Cl concentration exhibits an extremely significant negative correlation with the Ca/Mg ratio. The physical intrusion of modern seawater or paleo-brine acts as the core mechanism of salinization, introducing fluids enriched in Cl and Mg2+ but depleted in Ca2+, which induces reverse cation exchange. This analysis results based on hydrochemical mass balance are consistent with the data from hydrogen and oxygen stable isotopes [35].

5.2. Genesis of Brine: Evaporative Concentration and Water/Rock Interaction

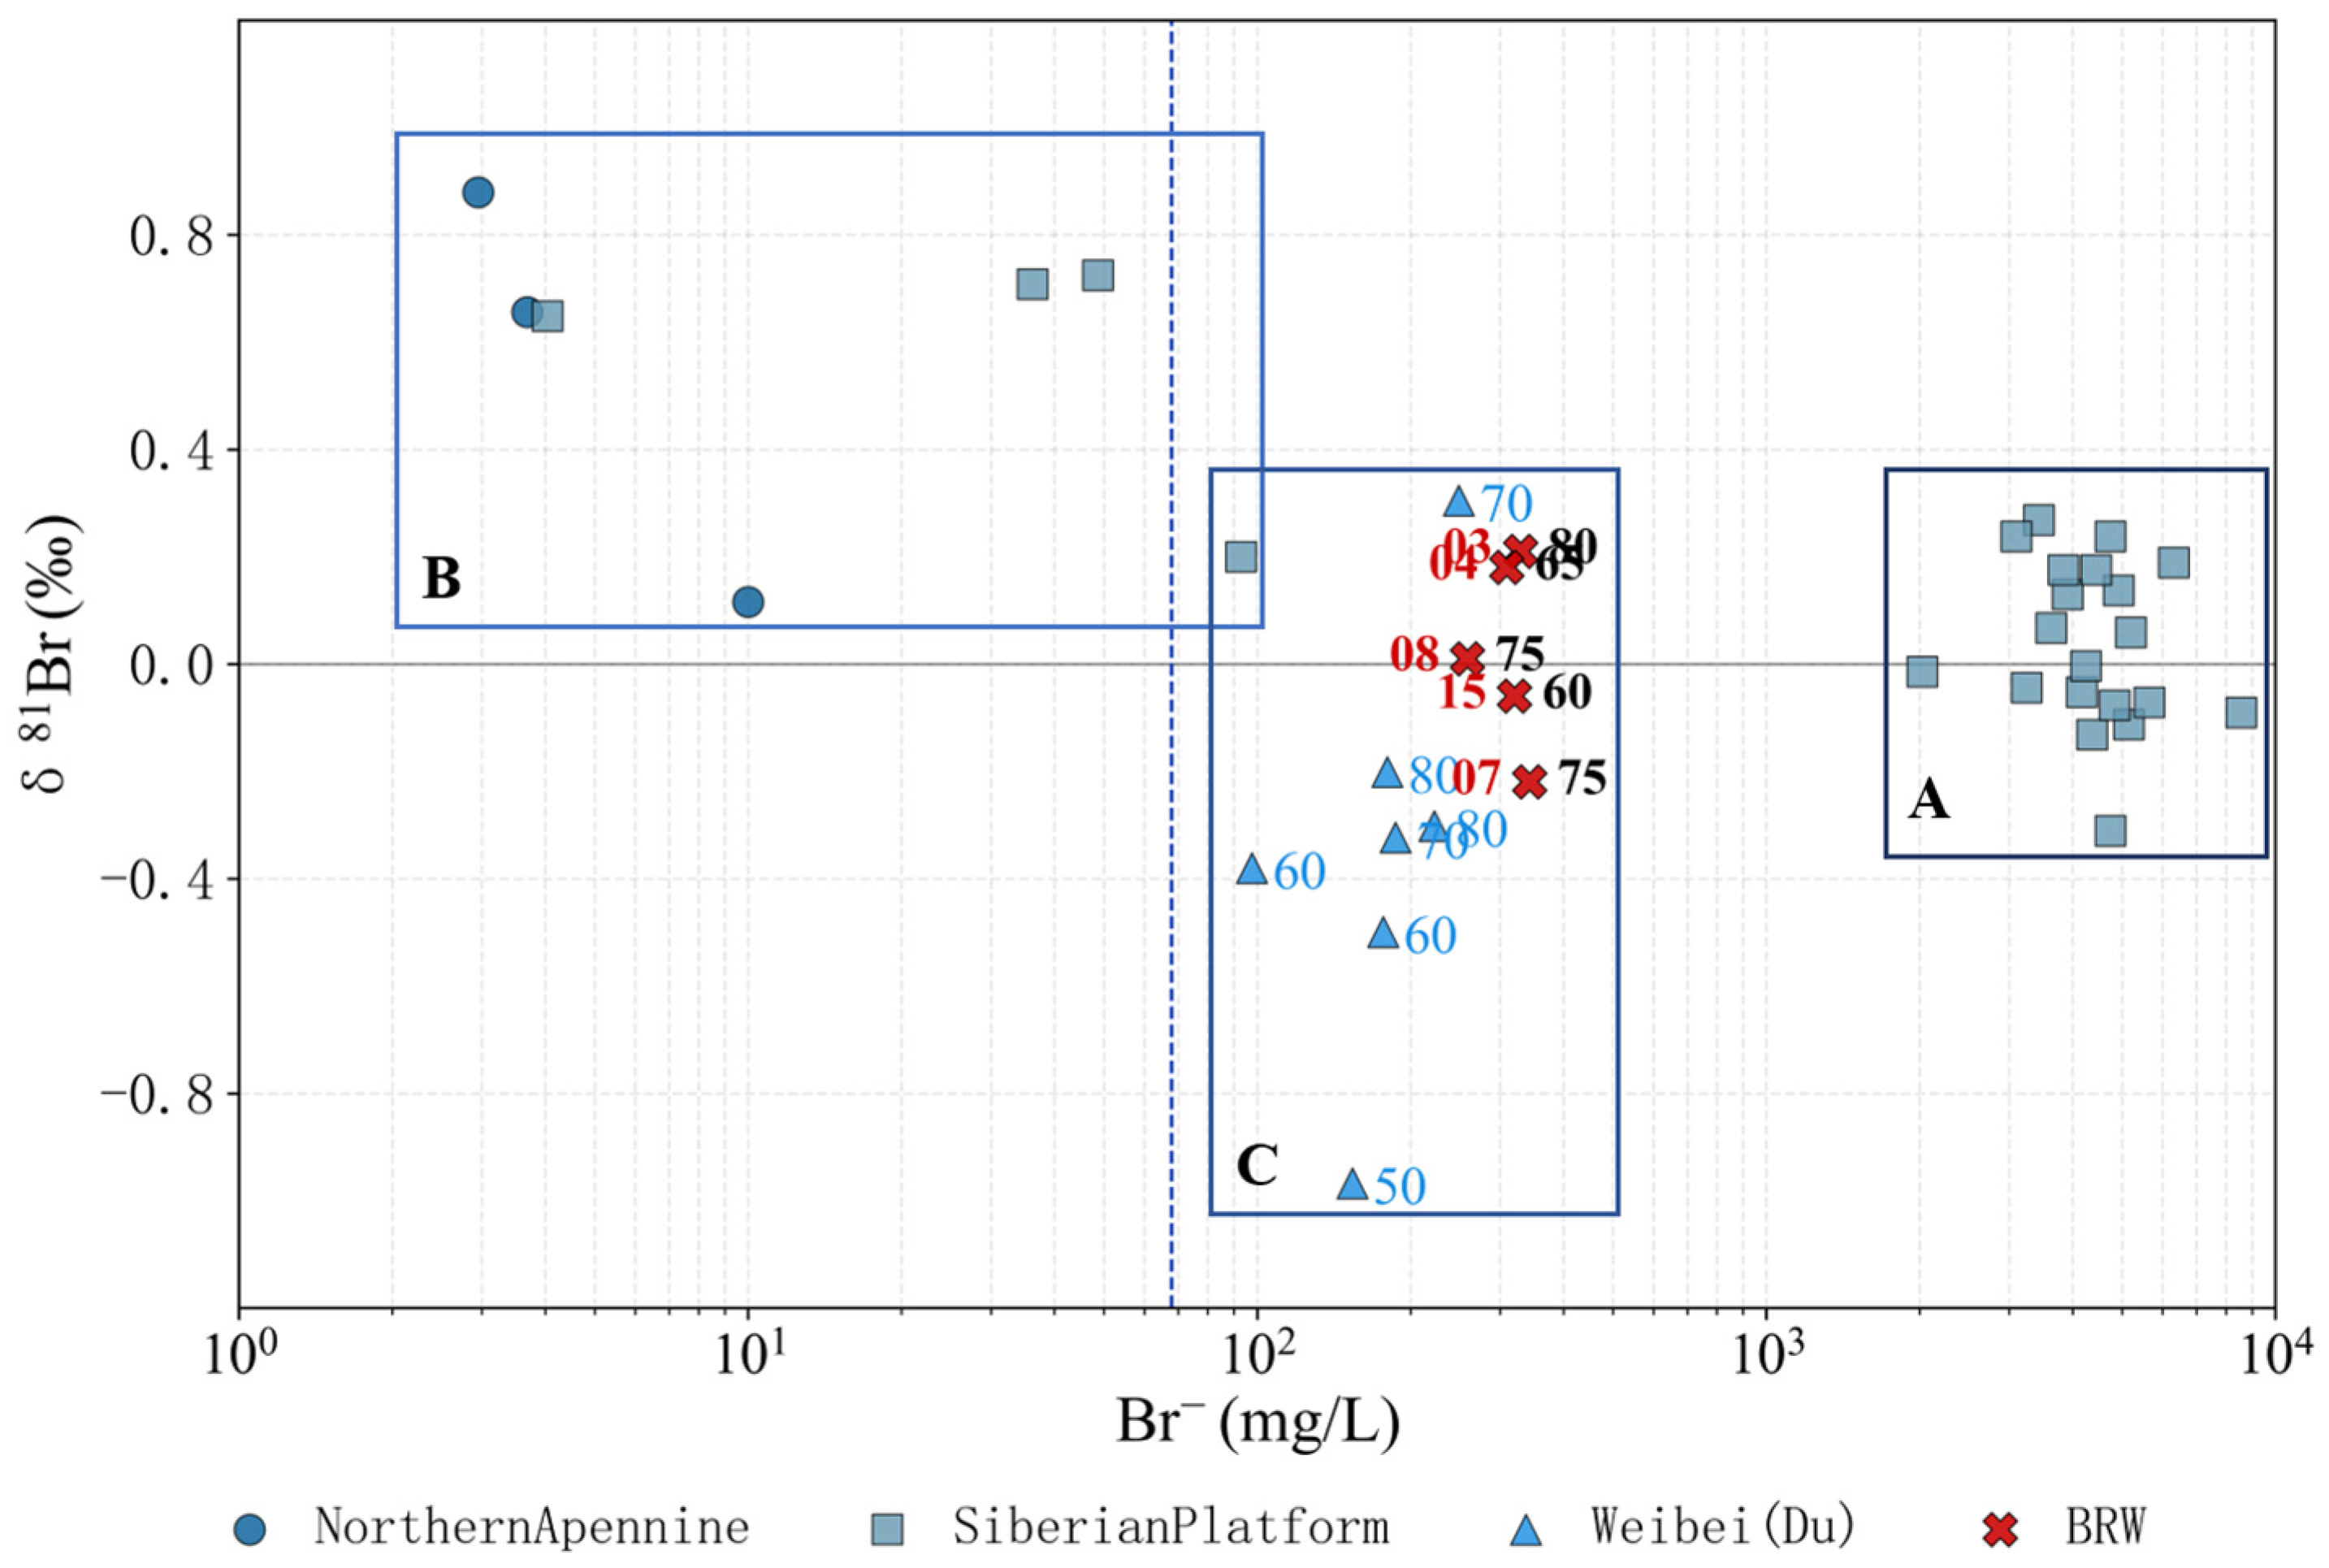
The chloride concentration of BRW at depths of 60–80 m ranges from 62.04 to 93.28 g/L (averaging 3.9 times that of SW), while Br ranges from 259.02 to 342.98 mg/L (3.3 times that of SW). This extreme concentration definitively rules out the lateral intrusion of modern seawater as the primary genetic mechanism [36]. The δ81Br values (−0.26‰ to 0.21‰) firmly align with previous data from evaporated seawater globally, identifying ancient seawater as the sole initial salt source (Figure 6) [37]. Such extraordinary salt accumulation points to paleo-seawater that invaded inland depressions or lagoons during high stands (e.g., Late Pleistocene or Holocene), underwent intense surface evaporation under an arid paleoclimate, and subsequently permeated downward as density-driven gravity flow into underlying porous strata.
In a strictly conservative evaporation model, solute enrichment multiples should remain identical before reaching saturation. Because the ionic radius of Br exceeds that of Cl, Br resists incorporation into the halite crystal lattice, leading to its disproportionate enrichment in the residual liquid [39]. If BRW were simply evaporated SW, its Br enrichment multiple should far exceed that of Cl. However, the data reveal the opposite: Cl is relatively enriched compared to Br. Because none of the samples have reached the gypsum crystallization point (Figure S3), it is evident that BRW dissolved the bromine-poor secondary evaporites (such as disseminated halite) deposited earlier in the aquifer matrix when the ancient salt water penetrated, thereby obtaining supplementary chloride [40].
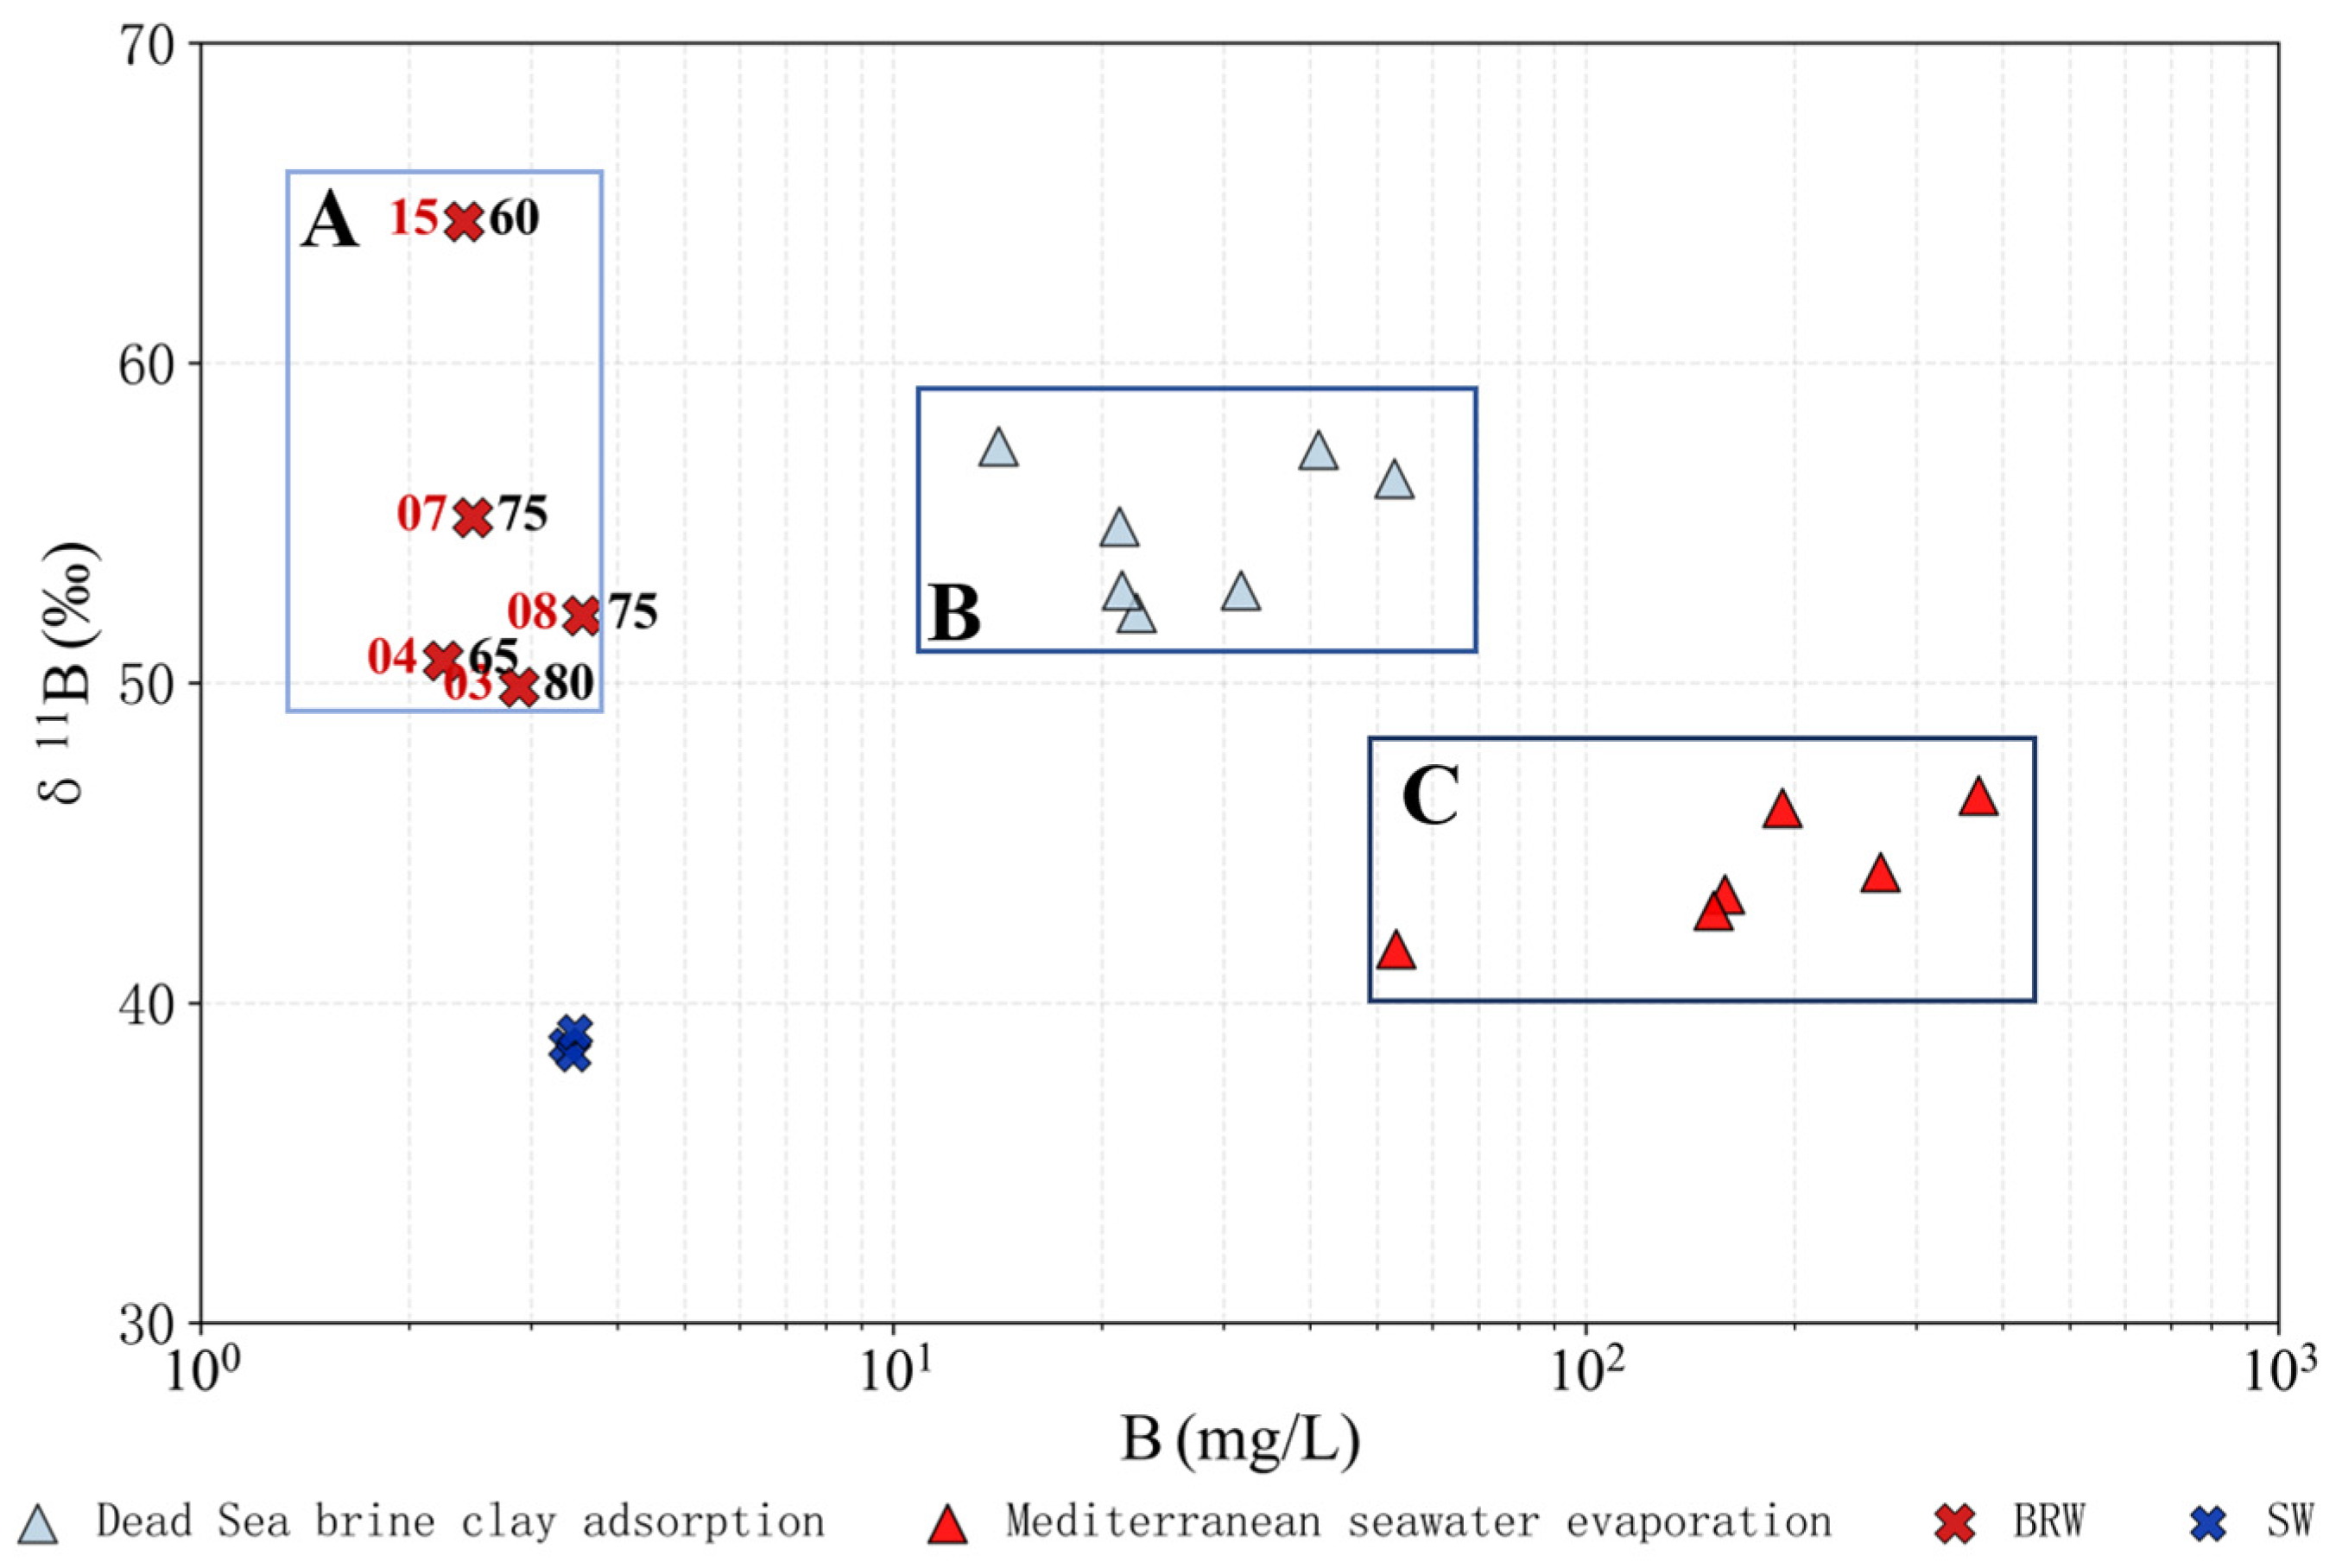
Boron isotopes provide further resolution regarding water/rock interaction [41]. The brine is bounded by clay-rich aquitards. Because clay minerals preferentially adsorb the lighter tetrahedral B(OH)4 (removing 10B), the residual fluid becomes enriched in 11B [27,42]. While extreme evaporation alone could theoretically enrich δ11B to over 50.00‰, this would mandate residual B concentrations (82.8–192.3 mg/L) far exceeding those observed in the Weibei Plain brines [43,44]. Instead, the δ11B values observed here (55.7‰ to 57.4‰) perfectly match empirical data for brine subjected to intense clay adsorption [42,45] (Figure 7). The continuous adsorption of 10B by surrounding clay layers has driven the δ11B up to 64.42‰, far exceeding modern seawater, while maintaining moderate elemental boron concentrations (2–3 mg/L) due to the initial high degree of evaporative concentration.

5.3. Genesis of Brackish Water: Concentration Mechanism and Isotope Fractionation

5.3.1. Genesis of SSW and SBW

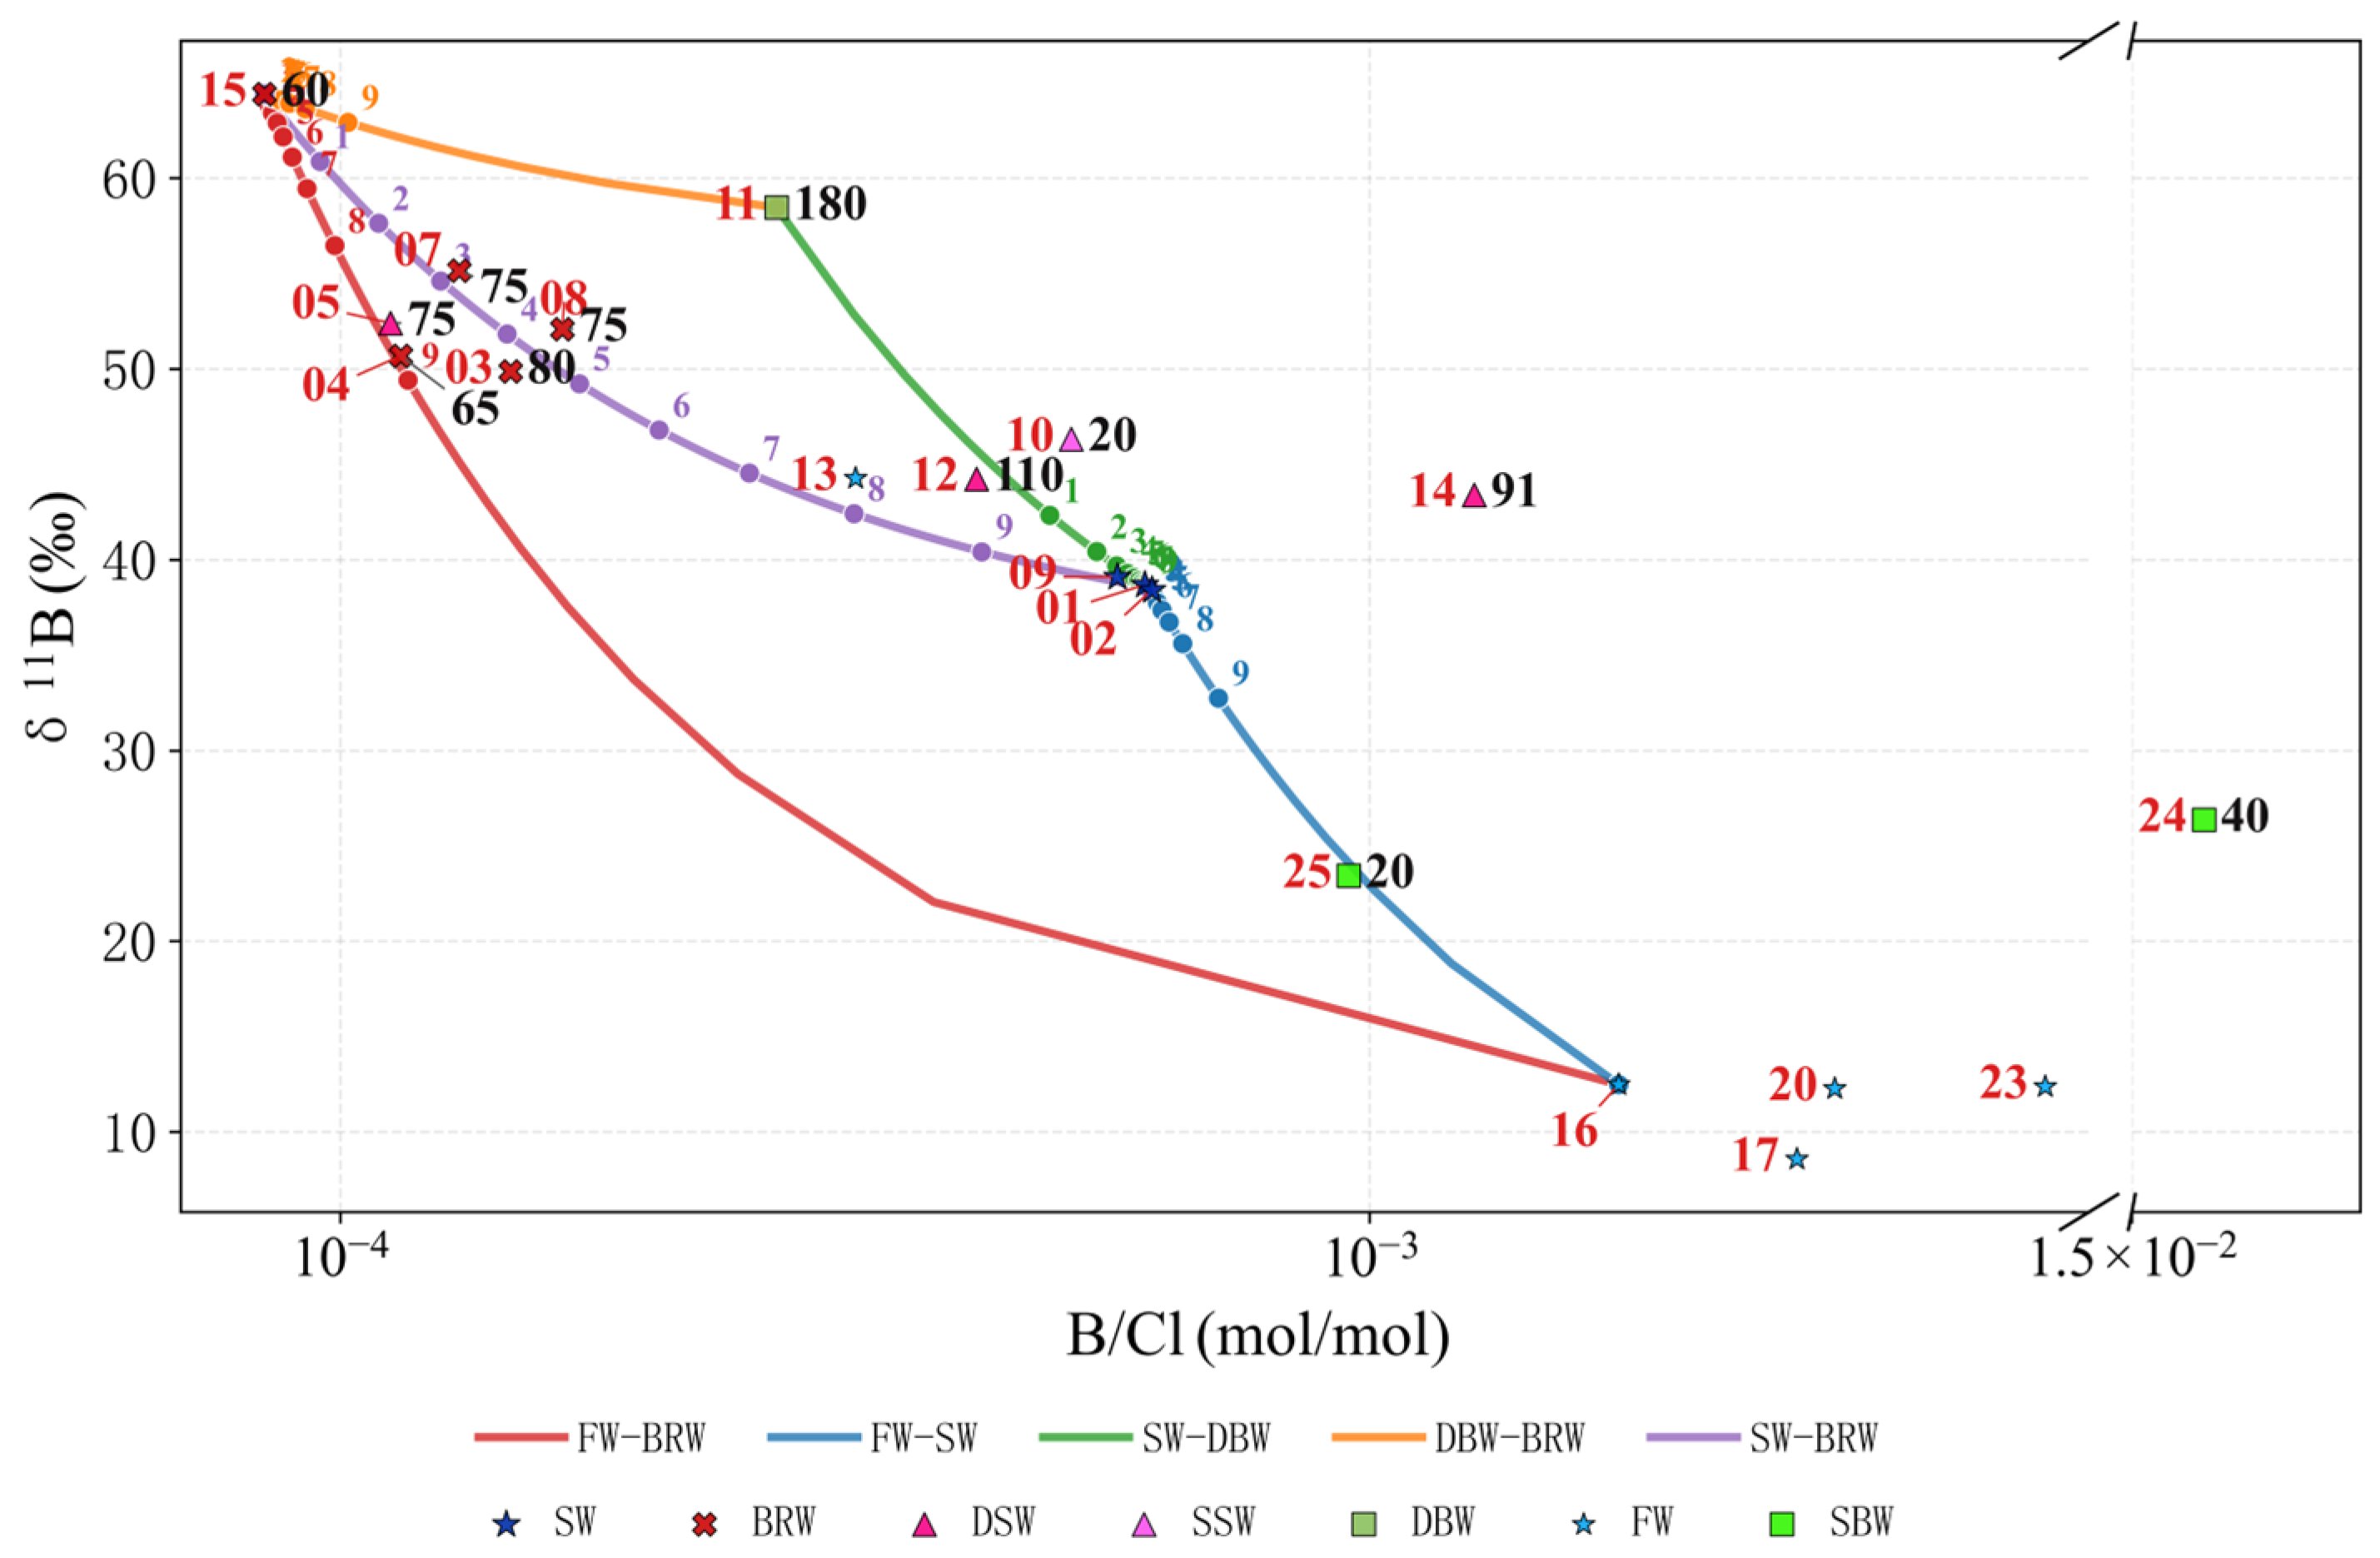
The hydrochemical composition of SSW is affected by both seawater intrusion and upward overflow of BRW. For instance, as seen in Figure 8, No.10 (SSW, depth of 20 m), located closer to the coastline, has a B concentration of 4.71 mg/L and δ11B = 46.32‰, which is higher than SW. Its δ37Cl and δ81Br are −0.04‰ and −0.08‰, respectively, which are consistent with the numerical range of SW. Existing studies indicate that seawater intrusion leads to the desorption of B from sediments, thereby causing the enrichment of 11B in the water body [47,48], demonstrating that SSW is affected by seawater intrusion. However, its Cl concentration far exceeds SW, indicating that its salinity has sources other than recent modern seawater intrusion. Furthermore, combining the shallow burial depth of SSW, it can be inferred that the formation mechanism of the regional SSW involves underlying BRW undergoing overflow via localized leakage channels. When BRW ascends into the Holocene porous aquifer at a depth less than 60 m, it physically mixes with groundwater that has been affected by seawater intrusion, forming SSW which possesses the isotopic enrichment characteristics of BRW and is higher in absolute salinity than SW.
SBW is mainly produced by the mixing of SSW with atmospheric precipitation, surface water, etc., and its spatial evolution indicates the process of freshwater displacing seawater intrusion in the study area. As shown in Figure 9, the δ81Br and Br data for SBW generally fall on or near the mixing line of δ81Br = 1.0‰, with one sample each on the δ81Br = 0.0‰ and δ81Br = 2.0‰ lines. However, all sample points fall to the left of the 10% BRW mixing ratio, indicating that BRW has a minor impact on SBW. Taking No.24 (depth of 40 m) and No.25 (depth of 20 m) as examples, their chloride ion concentrations are 0.31 g/L and 2.77 g/L, respectively, indicating that the regional water body has experienced significant physical dilution by modern atmospheric precipitation or shallow surface runoff. No.25, located 17 km from the coastline, has its δ81Br situated on the standard FW-SW mixing line with a surface water mixing ratio exceeding 95%. This indicates it may be jointly affected by precipitation infiltration, lateral river recharge, and seawater intrusion, and that no significant isotopic fractionation or water/rock interactions occurred during mixing.
Incorporating No.24 and its upstream 15 km FW, No.23, for analysis, calculated via Na+, the theoretical mixing ratios of seawater are 12.5% and 2.5%, respectively, which should correspond to theoretical Ca2+ values of 92.61 mg/L and 40.26 mg/L. However, the actual Ca2+ values for the two samples are 204.2 mg/L and 54.36 mg/L, respectively, exhibiting a typical phenomenon of Ca2+-rich, Na+-poor to FW, which actively displaces SW regions [49]. This implies that freshwater Ca2+ is released from clay exchange sites previously occupied by marine Na+. Concurrently, this displacement desorbs previously bound 11B, driving the δ11B of the water up to 26.35‰, significantly higher than the local surface water baseline but still below modern seawater.

5.3.2. Genesis of DSW and DBW

The evolutionary model of DSW aligns well with binary physical mixing (Figure 8). Taking No.05 as an example, its hydrochemical and isotopic characteristics fall on the geometric connecting line between BRW and FW, and are close to the BRW end-member. This indicates that the immensely thick clay aquitards above and below DSW cause overall stagnant hydrodynamic conditions, making water/rock interactive isotopic desorption relatively weak. The hydrochemical evolution here is governed more by the long-term, slow convective/dispersive physical mixing of ancient BRW at its peripheral boundaries with surrounding deep zones. This also directly proves the continuous, faint lateral water/salt transport and spatial redistribution of the regional underground brine body [50]. Further analysis shows that the Cl and Br contents of DSW No.27 (depth of 120 m) are lower than those of seawater, and the significant enrichment of δ37Cl indicates that it underwent compaction or leakage during burial and sequestration. This is because the dense negative charge networks on the surfaces of clay particles in the aquitards above and below the DSW produce an ion filtration effect similar to a reverse osmosis semi-permeable membrane [40]. Water molecules and the lighter 35Cl ions pass through more easily, while the heavier 37Cl ions are retarded, trapped, and enriched in the residual brine [51,52]. This also proves that the 120 m deep DSW is situated in a more closed, stagnant hydrodynamic environment than the 60–80 m DSW. Concurrently, δ11B data for DSW at 120 m and 200 m depths were not detected, but their B concentrations are far below the seawater average value and Cl is at extremely low levels of 8.97–9.6 g/L. This rules out the possibility that the deep aquifer has been influenced by lateral seawater recharge in recent times.
The evolution of DBW is affected by differences in groundwater drop funnel and depth. Studies have shown that in the Laizhou Bay area, strip-shaped precipitation funnels with a depth of less than 100 m have been formed at 5–10 km along the coast due to brine mining. The No.11 DBW at a depth of 180 m is located between the northern boundary of the landing funnel and the coastline. Its hydrochemical characteristics indicate that the upward hydraulic gradient forces deep paleo-freshwater to leak upward through the marine clay sequence [53]. The clay acts as an ultrafiltration membrane, selectively expelling lighter isotopes and leaving the residual, high-pressure deep water enriched in 37Cl and 11B [54].
The deeper DBW is less affected by the precipitation funnel, which is mainly the result of the vertical diffusion of the upper DSW and the ultrafiltration of the clay layer in the weak permeability layer. Taking the 300 m deep DBW aquifer where No.6 is located as an example for analysis, there is an order of magnitude salinity difference between the water chemical concentration of the DBW aquifer and the 200 m deep DSW aquifer. At the same time, there is a thick layer of clay between 200 m and 300 m. Therefore, it can be seen that the vertical migration of solutes between the upper and lower layers is dominated by molecular diffusion [55,56]. The lighter 35Cl and 79Br isotopes diffuse downward at higher velocities than their heavier counterparts [57], supplying the 300 m aquifer with a trace, but isotopically distinct (highly negative), salt signature.

5.4. Regional Groundwater Evolution Model

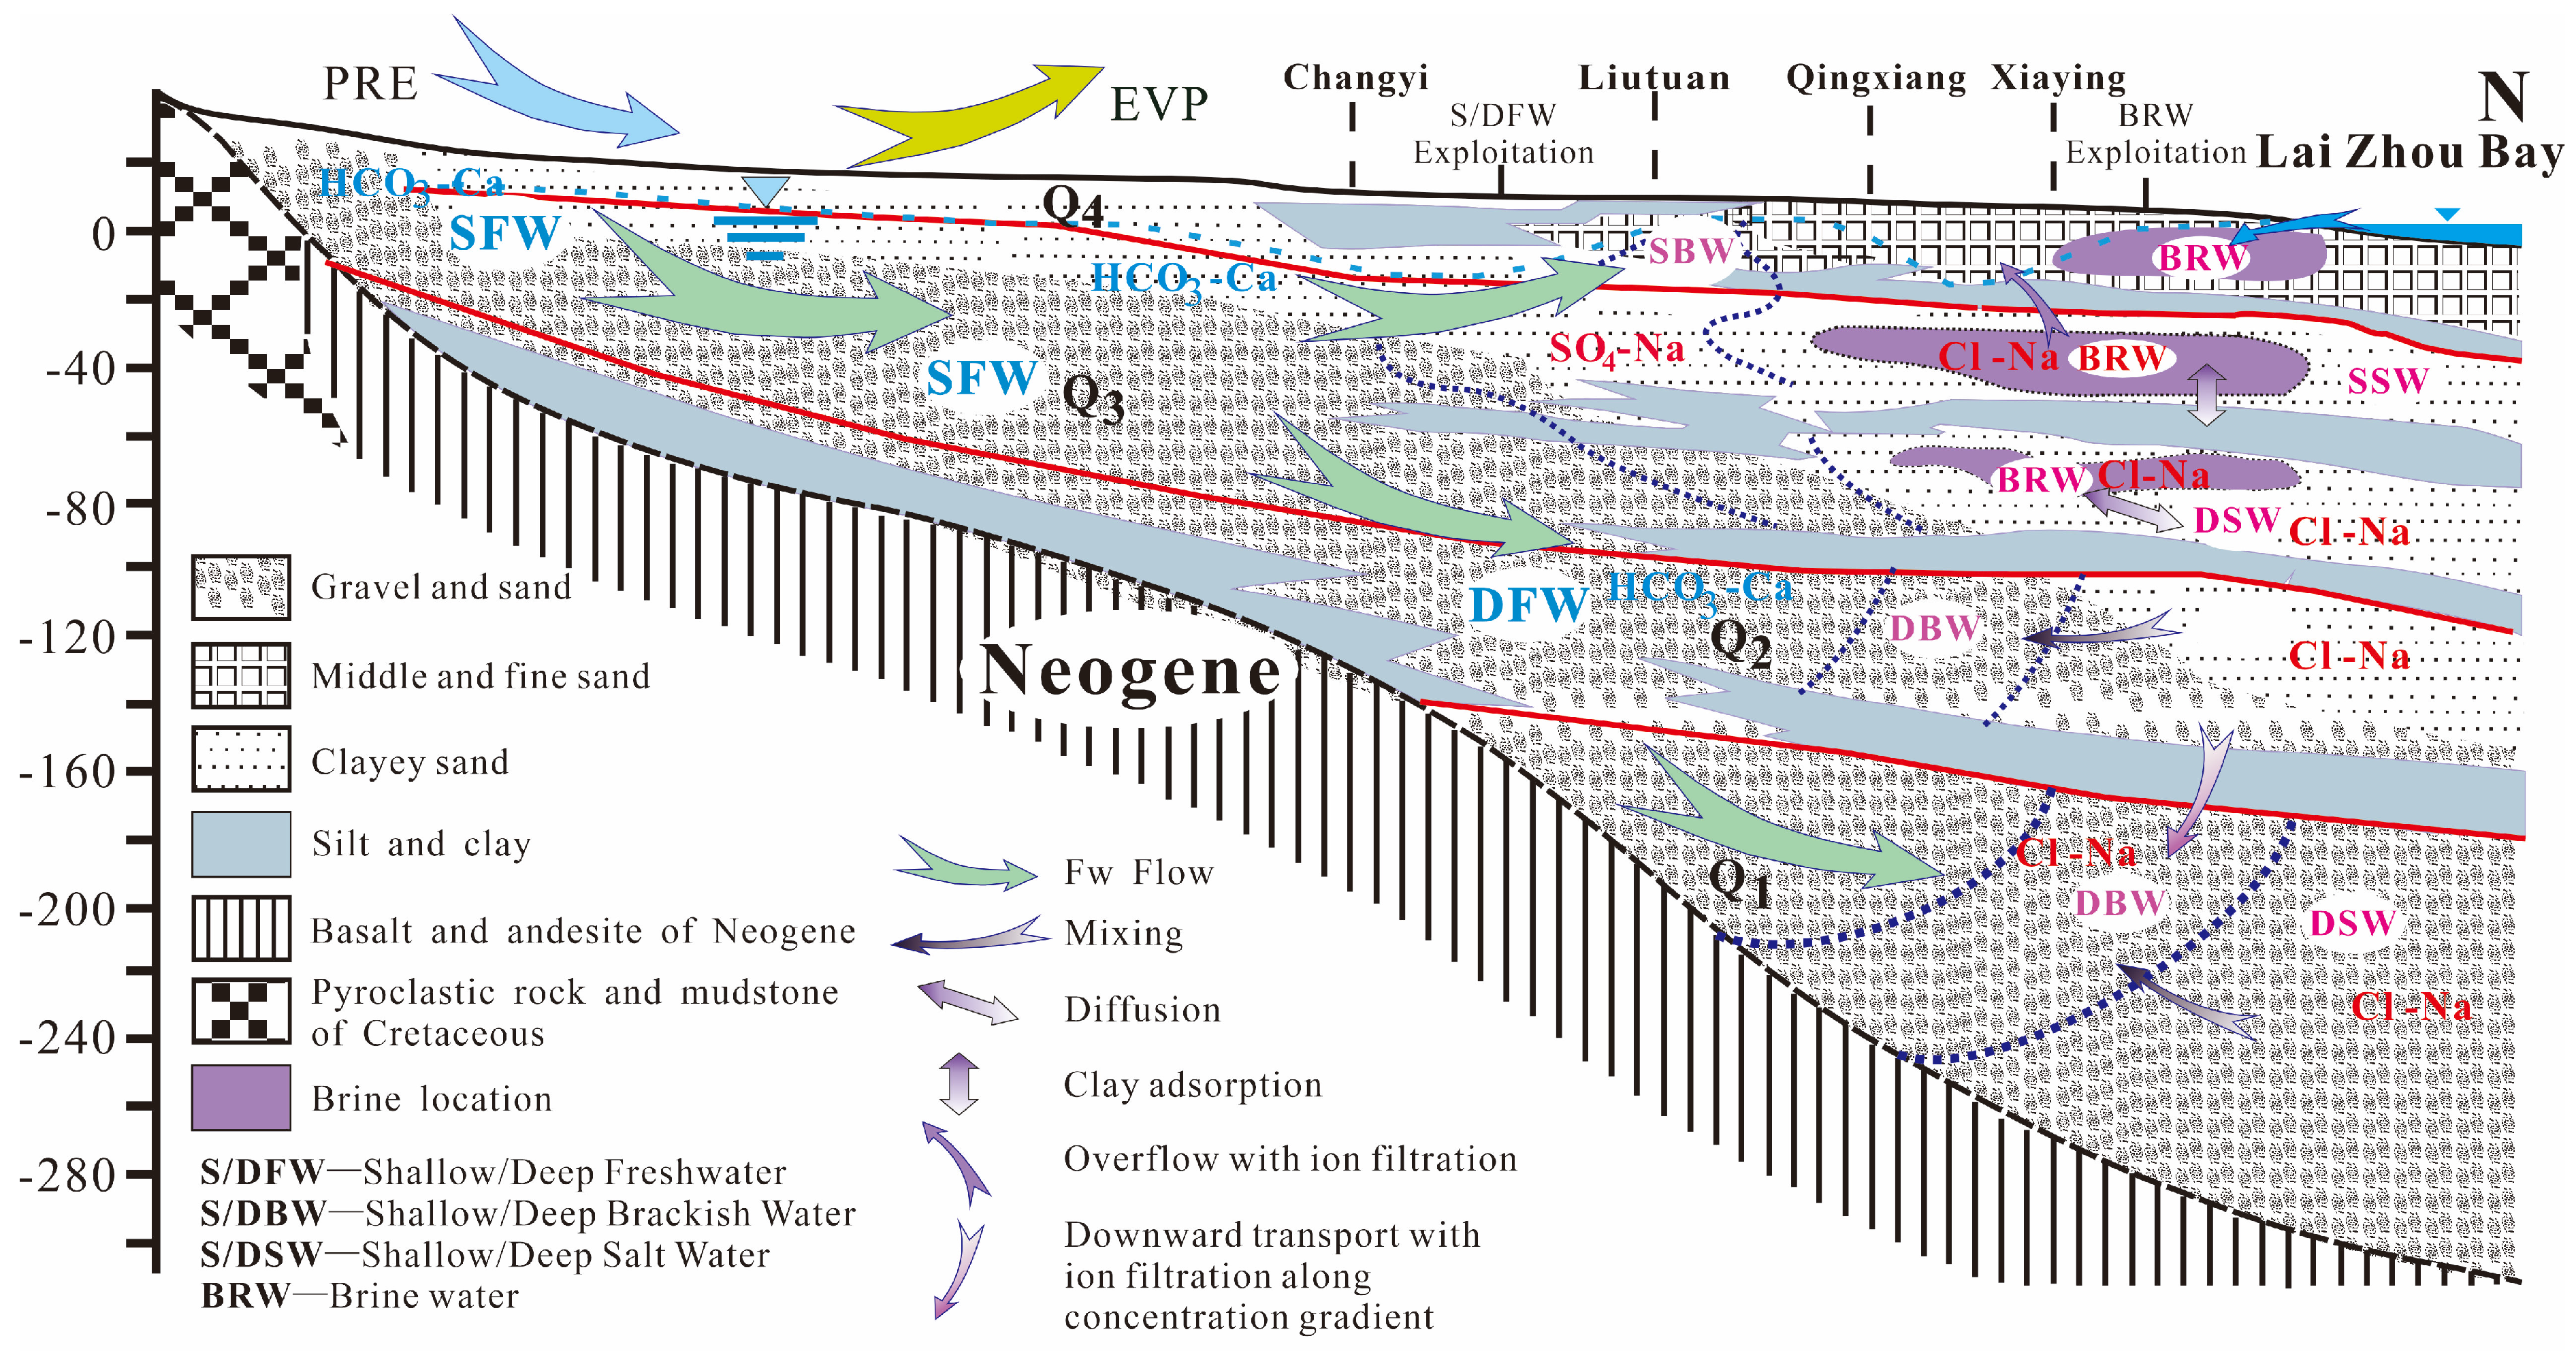
Based on the synthesized hydrochemical and multi-isotopic evidence, we present a unified evolutionary model for the Weibei Plain (Figure 10):
BRW originates from Late Pleistocene/Holocene transgressive paleo-seawater. Following extreme surface evaporation, it infiltrated downward, dissolving secondary evaporites (causing Cl enrichment relative to Br) and undergoing intense clay adsorption (triggering extreme 11B enrichment).
SSW is a hybrid fluid formed by the lateral intrusion of modern seawater mixing with the overflow of underlying BRW, inheriting high absolute salinity and enriched 11B. SBW evolves via the dilution of SSW by meteoric runoff, coupled with ongoing forward cation exchange (releasing Ca2+, adsorbing Na+) and 11B desorption during the active displacement of saline water by freshwater.
DSW is the product of long-term, sluggish convective/dispersive physical mixing between deep BRW and surrounding DFW within highly stagnant hydrodynamic constraints. The evolution of DBW is closely related to depth. The upper part is affected by the regional falling funnel, and the deeper layers are mainly restricted by the ultrafiltration effect of the clay layer. Hydraulic gradients induce overflow and deep membrane ultrafiltration of thick clay aquitards that selectively fractionate chlorine and boron isotopes in depth profiles, resulting in differences in DBW water chemistry characteristics at different depths.

6. Conclusions

Based on the comprehensive analysis of long-term hydrochemical datasets and multi-isotopic tracers (δ2H, δ18O, δ11B, δ37Cl, δ81Br) in the Weibei Plain, the following primary conclusions are drawn:
Distinct Hydrochemical Zonation and Evolution: The groundwater system in the Weibei Plain is highly stratified, reflecting the complex interplay between geographic geomorphology and historic marine transgressions. Brackish and saline waters are primarily formed via the physical mixing of terrigenous freshwater and marine fluids, largely driven by reverse cation exchange and conservative physical mixing rather than extreme isotopic evaporative fractionation. Conversely, both shallow and deep freshwaters exhibit strong isotopic signatures of evaporation during initial meteoric recharge.
Paleo-Genesis of Deep Brine: Isotopic mass balance definitively rules out modern seawater intrusion as the source of deep brine (>60 m). The brine originates from ancient paleo-seawater that underwent extreme surface evaporation during geological highstands. Crucially, the extreme enrichment of δ11B and disproportionate Cl/Br ratios demonstrate that this paleo-brine experienced profound isotopic exchange via long-term clay mineral adsorption and secondary evaporite dissolution during its downward gravitational migration.
Complex Evolutionary Mechanisms of Transitional Waters: The regional cone of depression has drastically altered deep hydrodynamics. DBW evolution is now heavily influenced by membrane ultrafiltration effects across a clay aquitard ranging from 20 to 40 m in thickness and molecular diffusion, which distinctly fractionate lighter isotopes (35Cl, 79Br). Concurrently, SBW serves as an active transition zone characterized by continuous freshwater/seawater displacement, resulting in significant Ca2+ release and localized 11B desorption. These findings provide a critical scientific foundation for the targeted management and sustainable utilization of stratified coastal aquifers worldwide.

Supplementary Materials

The following supporting information can be downloaded at https://www.mdpi.com/article/10.3390/w18172077/s1, Figure S1: Spearman correlation analysis between major ions; Figure S2: Gibbs diagrams of water samples; Figure S3: The relationships of Na+, Mg2+, Ca2+, Sr2+, Li+, Cl, B and SO42− versus Br. SET, SG, G and H represent seawater evaporation trajectory, standard mean ocean water, gypsum precipitation point, halite precipitation point; Table S1: Stable isotope of different water samples; Table S2: Multi-period hydrochemical sample test results.

Author Contributions

Conceptualization, L.G. and Y.Q.; methodology, C.M.; software, L.G.; validation, H.L., C.M. and A.Z.; formal analysis, L.G.; investigation, L.G. and Y.Q.; resources, C.M.; data curation, L.G. and Y.Q.; writing—original draft preparation, L.G.; writing—review and editing, L.G.; supervision, C.M.; project administration, H.L.; funding acquisition, C.M. All authors have read and agreed to the published version of the manuscript.

Funding

This research was funded by Talent Cultivation Fund from North China Center for Geoscience Innovation of China Geological Survey, grant number 2024HBPJ-G10.

Data Availability Statement

The original contributions presented in this study are included in the article/Supplementary Materials. Further inquiries can be directed to the corresponding authors.

Acknowledgments

The authors wish to thank Huihui Qi and Cong Yan for their assistance in field sampling.

Conflicts of Interest

The authors declare no conflicts of interest.

Abbreviations

The following abbreviations are used in this manuscript:
FWSurface Freshwater
SWSeawater
BRWBrain Groundwater
SFWShallow Fresh Groundwater
SBWShallow Brackish Groundwater
SSWShallow Salt Groundwater
DFWDeep Fresh Groundwater
DBWDeep Brackish Groundwater
DSWDeep Salt Groundwater

References

  1. Giménez-Forcada, E. Use of the Hydrochemical Facies Diagram (HFE-D) for the Evaluation of Salinization by Seawater Intrusion in the Coastal Oropesa Plain: Comparative Analysis with the Coastal Vinaroz Plain, Spain. HydroResearch 2019, 2, 76–84. [Google Scholar] [CrossRef] [Scilit]
  2. Liu, S.; Tang, Z.; Gao, M.; Hou, G. Evolutionary Process of Saline-Water Intrusion in Holocene and Late Pleistocene Groundwater in Southern Laizhou Bay. Sci. Total Environ. 2017, 607–608, 586–599. [Google Scholar] [CrossRef] [Scilit] [PubMed]
  3. Chang, Y.; Hu, B.X.; Xu, Z.; Li, X.; Tong, J.; Chen, L.; Zhang, H.; Miao, J.; Liu, H.; Ma, Z. Numerical Simulation of Seawater Intrusion to Coastal Aquifers and Brine Water/Freshwater Interaction in South Coast of Laizhou Bay, China. J. Contam. Hydrol. 2018, 215, 1–10. [Google Scholar] [CrossRef] [Scilit] [PubMed]
  4. Han, D.; Kohfahl, C.; Song, X.; Xiao, G.; Yang, J. Geochemical and Isotopic Evidence for Palaeo-Seawater Intrusion into the South Coast Aquifer of Laizhou Bay, China. Appl. Geochem. 2011, 26, 863–883. [Google Scholar] [CrossRef] [Scilit]
  5. Zhang, X.; Miao, J.; Hu, B.X.; Liu, H.; Zhang, H.; Ma, Z. Hydrogeochemical Characterization and Groundwater Quality Assessment in Intruded Coastal Brine Aquifers (Laizhou Bay, China). Environ. Sci. Pollut. Res. 2017, 24, 21073–21090. [Google Scholar] [CrossRef] [Scilit] [PubMed]
  6. Green, T.R.; Taniguchi, M.; Kooi, H.; Gurdak, J.J.; Allen, D.M.; Hiscock, K.M.; Treidel, H.; Aureli, A. Beneath the Surface of Global Change: Impacts of Climate Change on Groundwater. J. Hydrol. 2011, 405, 532–560. [Google Scholar] [CrossRef] [Scilit]
  7. Werner, A.D.; Bakker, M.; Post, V.E.A.; Vandenbohede, A.; Lu, C.; Ataie-Ashtiani, B.; Simmons, C.T.; Barry, D.A. Seawater Intrusion Processes, Investigation and Management: Recent Advances and Future Challenges. Adv. Water Resour. 2013, 51, 3–26. [Google Scholar] [CrossRef] [Scilit]
  8. Michael, H.A.; Post, V.E.A.; Wilson, A.M.; Werner, A.D. Science, Society, and the Coastal Groundwater Squeeze. Water Resour. Res. 2017, 53, 2610–2617. [Google Scholar] [CrossRef] [Scilit]
  9. He, Z.; Ma, C.; Zhou, A.; Qi, H.; Liu, C.; Cai, H.; Zhu, H. Using Hydrochemical and Stable Isotopic (Δ2H, Δ18O, Δ11B, and Δ37Cl) Data to Understand Groundwater Evolution in an Unconsolidated Aquifer System in the Southern Coastal Area of Laizhou Bay, China. Appl. Geochem. 2018, 90, 129–141. [Google Scholar] [CrossRef] [Scilit]
  10. Han, D.M.; Song, X.F.; Currell, M.J.; Yang, J.L.; Xiao, G.Q. Chemical and Isotopic Constraints on Evolution of Groundwater Salinization in the Coastal Plain Aquifer of Laizhou Bay, China. J. Hydrol. 2014, 508, 12–27. [Google Scholar] [CrossRef] [Scilit]
  11. Qi, H.; Ma, C.; He, Z.; Hu, X.; Gao, L. Lithium and Its Isotopes as Tracers of Groundwater Salinization: A Study in the Southern Coastal Plain of Laizhou Bay, China. Sci. Total Environ. 2019, 650, 878–890. [Google Scholar] [CrossRef] [Scilit] [PubMed]
  12. Du, Y.; Ma, T.; Chen, L.; Shan, H.; Xiao, C.; Lu, Y.; Liu, C.; Cai, H. Genesis of Salinized Groundwater in Quaternary Aquifer System of Coastal Plain, Laizhou Bay, China: Geochemical Evidences, Especially from Bromine Stable Isotope. Appl. Geochem. 2015, 59, 155–165. [Google Scholar] [CrossRef] [Scilit]
  13. Qiu, Y.; Zhou, A.; Gao, L.; Wang, Z.; Hu, X.; Li, Y.; Zhang, F.; Ma, C. Cation Exchange and Leakage as Dominant Processes in Controlling Salinity and Strontium in Sandy and Argillaceous Coastal Aquifer: Insights from Hydrochemistry and Multi-Isotopes. J. Hydrol. 2024, 638, 131529. [Google Scholar] [CrossRef] [Scilit]
  14. Jiao, J.; Post, V. Coastal Hydrogeology; Cambridge University Press: Cambridge, UK, 2019. [Google Scholar]
  15. Xue, Y.; Wu, J.; Ye, S.; Zhang, Y. Hydrogeological and Hydrogeochemical Studies for Salt Water Intrusion on the South Coast of Laizhou Bay, China. Groundwater 2000, 38, 38–45. [Google Scholar] [CrossRef] [Scilit]
  16. Yang, F.; Liu, S.; Jia, C.; Gao, M.; Chang, W.; Wang, Y. Hydrochemical Characteristics and Functions of Groundwater in Southern Laizhou Bay Based on the Multivariate Statistical Analysis Approach. Estuar. Coast. Shelf Sci. 2021, 250, 107153. [Google Scholar] [CrossRef] [Scilit]
  17. Hu, X.; Gao, L.; Ma, C.; Hu, X. Land Use Zoning of Weifang North Plain Based on Ecological Function and Geo-Environmental Suitability. Bull. Eng. Geol. Environ. 2020, 79, 2697–2719. [Google Scholar] [CrossRef] [Scilit]
  18. Lin, G.; Xinjie, H.; Chuanming, M.; Heng, K.; Huihui, Q.; Zekang, H. Geoenvironmental Risk Evaluation of High-Efficiency Eco-Economic Zone in Weifang City, China. Nat. Hazards Rev. 2020, 21, 05020005. [Google Scholar] [CrossRef] [Scilit]
  19. Zhang, Z.; Peng, L. The Groundwater Hydrochemical Characteristics on Seawater Intruded in Eastern and Southern Coasts of Laizhou Bay. China Environ. Sci. 1998, 18, 121–125. (In Chinese) [Google Scholar]
  20. Han, Y.; Meng, G.; Wang, S. Quaternary Underground Brine in the Coastal Areas of the Northern China; Science Press: Beijing, China, 1996. (In Chinese) [Google Scholar]
  21. Zhao, D. Research on Disaster Protection for Seawater Intrusion; Shandong Press of Sciences and Technology: Jinan, China, 1996. (In Chinese) [Google Scholar]
  22. Gao, M.; Guo, F.; Hou, G.; Qiu, J.; Kong, X.; Liu, S.; Huang, X.; Zhuang, H. The Evolution of Sedimentary Environment since Late Pleistocene in Laizhou Bay, Bohai Sea. Geol. China 2018, 45, 59–68. [Google Scholar]
  23. Fetter, C.W. Applied Hydrogeology, 4th ed.; Prentice Hall: Englewood Cliffs, NJ, USA, 2001. [Google Scholar]
  24. Nonner, J.C. Introduction to Hydrogeology; CRC Press: Boca Raton, FL, USA, 2011. [Google Scholar]
  25. Liu, Y.D.; Gan, Y.Q.; Yu, T.T.; Liu, C.F.; Zhou, A.G. Online Simultaneous Determination of δD and δ18O in Micro-liter Water Samples by Thermal Conversion/Elemental Analysis-Isotope Ratio Mass Spectrometry. Rock Miner. Anal. 2010, 29, 643–647. [Google Scholar]
  26. Du, Y.; Ma, T.; Yang, J.; Liu, L.; Shan, H.; Cai, H.; Liu, C.; Chen, L. A Precise Analytical Method for Bromine Stable Isotopes in Natural Waters by GasBench II-IRMS. Int. J. Mass Spectrom. 2013, 338, 50–56. [Google Scholar] [CrossRef] [Scilit]
  27. Xiao, Y.; Yin, D.; Liu, W.; Wang, Q.; Wei, H. Boron Isotope Method for Study of Seawater Intrusion. Sci. China Ser. E Technol. Sci. 2001, 44, 62–71. [Google Scholar] [CrossRef] [Scilit]
  28. Piper, A.M. A Graphic Procedure in the Geochemical Interpretation of Water-Analyses. Eos Trans. Am. Geophys. Union 1944, 25, 914–928. [Google Scholar] [CrossRef] [Scilit]
  29. Giménez-Forcada, E. Dynamic of Sea Water Interface using Hydrochemical Facies Evolution Diagram. Groundwater 2010, 48, 212–216. [Google Scholar] [CrossRef] [Scilit] [PubMed]
  30. Wang, X.; Dai, X.; Wu, G.; Yang, F.; Zhang, Y.; Hu, X.; Yao, Y.; Dong, Y. Hydrochemistry and Evolutionary Processes During Saltwater Intrusion in the Saline–Fresh Groundwater Transition Zone in Southern Laizhou Bay, China. Water 2025, 17, 1081. [Google Scholar] [CrossRef] [Scilit]
  31. Chen, B.; Yu, Y.; Su, Q.; Yang, L.; Fu, T.; Liu, W.; Chen, G.; Lyu, W. The Study on the Genesis of Underground Brine in Laizhou Bay Based on Hydrochemical Data. Water 2023, 15, 3788. [Google Scholar] [CrossRef] [Scilit]
  32. Craig, H. Isotopic Variations in Meteoric Waters. Science 1961, 133, 1702–1703. [Google Scholar] [CrossRef] [Scilit] [PubMed]
  33. Liu, H.; Gao, L.; Ma, C.; Yuan, Y. Analysis of the Seawater Intrusion Process Based on Multiple Monitoring Methods: Study in the Southern Coastal Plain of Laizhou Bay, China. Water 2023, 15, 2013. [Google Scholar] [CrossRef] [Scilit]
  34. Appelo, C.A.J.; Postma, D. Geochemistry, Groundwater and Pollution; Appelo, C.A.J., Postma, D., Eds.; CRC Press: Boca Raton, FL, USA, 2004. [Google Scholar]
  35. Edmunds, W.M.; Guendouz, A.H.; Mamou, A.; Moulla, A.; Shand, P.; Zouari, K. Groundwater Evolution in the Continental Intercalaire Aquifer of Southern Algeria and Tunisia: Trace Element and Isotopic Indicators. Appl. Geochem. 2003, 18, 805–822. [Google Scholar] [CrossRef] [Scilit]
  36. Su, Q.; Yu, Y.; Chen, M.; Fu, T.; Lyu, W.; Liu, W. Exploration of the Formation Mechanism of Underground Brine Based on Hydrodynamic Environment Analysis Using Grain-Size Data of One Drilling Core. J. Mar. Sci. Eng. 2024, 12, 2122. [Google Scholar] [CrossRef] [Scilit]
  37. Ünal Ercan, H.; Çelik Karakaya, M.; Bozdağ, A.; Karakaya, N.; Delikan, A. Origin and Evolution of Halite Based on Stable Isotopes (Δ37Cl, Δ81Br, Δ11B and Δ7Li) and Trace Elements in Tuz Gölü Basin, Turkey. Appl. Geochem. 2019, 105, 17–30. [Google Scholar] [CrossRef] [Scilit]
  38. Shouakar-Stash, O.; Alexeev, S.V.; Frape, S.K.; Alexeeva, L.P.; Drimmie, R.J. Geochemistry and Stable Isotopic Signatures, Including Chlorine and Bromine Isotopes, of the Deep Groundwaters of the Siberian Platform, Russia. Appl. Geochem. 2007, 22, 589–605. [Google Scholar] [CrossRef] [Scilit]
  39. Godon, A.; Jendrzejewski, N.; Rouelle, M.; Dia, A.; Pineau, F.; Boulègue, J.; Javoy, M. Origin and Evolution of Fluids from Mud Volcanoes in the Barbados Accretionary Complex. Geochim. Cosmochim. Acta 2004, 68, 2153–2165. [Google Scholar] [CrossRef] [Scilit]
  40. Liu, M.; Guo, Q.; Shi, H.; Cao, Y.; Shang, J.; Zhang, M. Chlorine Geochemistry of Various Geothermal Waters in China: Implications for Geothermal System Geneses. J. Hydrol. 2022, 616, 128783. [Google Scholar] [CrossRef] [Scilit]
  41. Vengosh, A. Salinization and Isotope Tracing. In Treatise on Geochemistry; Elsevier: Amsterdam, The Netherlands, 2014. [Google Scholar]
  42. Vengosh, A.; Starinsky, A.; Kolodny, Y.; Chivas, A.R. Boron Isotope Geochemistry as a Tracer for the Evolution of Brines and associated hot springs from the Dead Sea, Israel. Geochim. Cosmochim. Acta 1991, 55, 1689–1695. [Google Scholar] [CrossRef] [Scilit]
  43. Vengosh, A.; Spivack, A.J.; Artzi, Y.; Ayalon, A. Geochemical and Boron, Strontium, and Oxygen Isotopic Constraints on the Origin of the Salinity in Groundwater from the Mediterranean Coast of Israel. Water Resour. Res. 1999, 35, 1877–1894. [Google Scholar] [CrossRef] [Scilit]
  44. Cary, L.; Casanova, J.; Gaaloul, N.; Guerrot, C. Combining boron isotopes and carbamazepine to trace sewage in salinized groundwater: A case study in Cap Bon, Tunisia. Appl. Geochem. 2013, 34, 126–139. [Google Scholar] [CrossRef] [Scilit]
  45. Cary, L.; Petelet-Giraud, E.; Bertrand, G.; Kloppmann, W.; Aquilina, L.; Martins, V.; Hirata, R.; Montenegro, S.; Pauwels, H.; Chatton, E.; et al. Origins and Processes of Groundwater Salinization in the Urban Coastal Aquifers of Recife (Pernambuco, Brazil): A Multi-Isotope Approach. Sci. Total Environ. 2015, 530–531, 411–429. [Google Scholar] [CrossRef] [Scilit] [PubMed]
  46. Spivack, A.J.; You, C.F. Boron isotopic geochemistry of carbonates and pore waters, Ocean Drilling Program Site 851. Earth Planet. Sci. Lett. 1997, 152, 113–122. [Google Scholar] [CrossRef] [Scilit]
  47. Pennisi, M.; Bianchini, G.; Muti, A.; Kloppmann, W.; Gonfiantini, R. Behaviour of Boron and Strontium Isotopes in Groundwater–Aquifer Interactions in the Cornia Plain (Tuscany, Italy). Appl. Geochem. 2006, 21, 1169–1183. [Google Scholar] [CrossRef] [Scilit]
  48. Spivack, A.J.; Edmond, J.M. Boron Isotope Exchange between Seawater and the Oceanic Crust. Geochim. Cosmochim. Acta 1987, 51, 1033–1043. [Google Scholar] [CrossRef] [Scilit]
  49. Virkki, V.; Andersen, L.S.; te Wierik, S.; Gerten, D.; Porkka, M. Regionally Divergent Drivers behind Transgressions of the Freshwater Change Planetary Boundary. Nat. Commun. 2026, 17, 5132. [Google Scholar] [CrossRef] [Scilit] [PubMed]
  50. Huang, P.; Ma, C.; Zhou, A. Unraveling the Complexities of Groundwater Salinization in Coastal Environments: Insights from Laizhou Bay’s Eastern Coast, China. Water 2023, 15, 3629. [Google Scholar] [CrossRef] [Scilit]
  51. Jiang, W.; Sheng, Y.; Wang, G.; Shi, Z.; Liu, F.; Zhang, J.; Chen, D. Cl, Br, B, Li, and Noble Gases Isotopes to Study the Origin and Evolution of Deep Groundwater in Sedimentary Basins: A Review. Environ. Chem. Lett. 2022, 20, 1497–1528. [Google Scholar] [CrossRef] [Scilit]
  52. Aschwanden, L.; Looser, N.; Mazurek, M.; Gimmi, T.; Ma, J.; Bernasconi, S.M.; Pérez-Mejías, C.; Schneeberger, R.; Traber, D. Long-Term Transport Processes across an Argillaceous Aquitard Sequence Evidenced by Isotope Geochemistry of Veins. Chem. Geol. 2026, 714, 123430. [Google Scholar] [CrossRef] [Scilit]
  53. Neuzil, C.E. How Permeable Are Clays and Shales? Water Resour. Res. 1994, 30, 140–150. [Google Scholar] [CrossRef] [Scilit]
  54. Fritz, S.J. Ideality of Clay Membranes in Osmotic Processes: A Review. Clays Clay Miner. 1986, 34, 214–223. [Google Scholar] [CrossRef] [Scilit]
  55. Desaulniers, D.E.; Cherry, J.A.; Fritz, P. Origin, Age and Movement of Pore Water in Argillaceous Quaternary Deposits at Four Sites in Southwestern Ontario. J. Hydrol. 1981, 50, 231–257. [Google Scholar] [CrossRef] [Scilit]
  56. Li, X.; Wen, Z.; Zhan, H.; Wu, F.; Zhu, Q. Laboratory Observations for Two-Dimensional Solute Transport in an Aquifer-Aquitard System. Environ. Sci. Pollut. Res. 2021, 28, 38664–38678. [Google Scholar] [CrossRef] [Scilit] [PubMed]
  57. Eggenkamp, H. The Geochemistry of Stable Chlorine and Bromine Isotopes; Advances in Isotope Geochemistry; Springer: Berlin/Heidelberg, Germany, 2014. [Google Scholar]
Figure 1. Location of the study area (red markers denote isotopic data cited from previous studies; numerical labels specifically designate the samples that were subjected to B, Br, and Cl isotopic analyses).
Water 18 02077 g001
Figure 2. Piper diagrams of different hydrogeological divisions.
Water 18 02077 g002
Figure 3. Hydrochemical facies evolution diagram (1. Na-HCO3/SO4; 2. Na-MixHCO3/MixSO4; 3. Na-MixCl; 4. Na-Cl; 5. MixNa-HCO3/SO4; 6. MixNa-MixHCO3/MixSO4; 7. MixNa-MixCl; 8. MixNa-Cl; 9. MixCa-HCO3/SO4; 10. MixCa-MixHCO3/MixSO4; 11. MixCa-MixCl; 12. MixCa-Cl; 13. Ca-HCO3/SO4; 14. Ca-MixHCO3/MixSO4; 15. Ca-MixCl; 16. Ca-Cl.).
Water 18 02077 g003
Figure 4. δ2H and δ18O partitioning characteristics of different hydrogeological divisions. (A) Piedmont plain; (B) alluvial plain; (C) marine plain.
Water 18 02077 g004
Figure 5. Major ion ratio. (AC) Piedmont plain; (DF) alluvial plain; (GI) marine plain.
Water 18 02077 g005
Figure 6. Br isotope characteristics in BRW. Rectangle A: deep formation water (Group C) of Siberian Platform, representing evaporated seawater; rectangle B: deep formation water (Group A) of Siberian Platform (squares) and salt water of the Northern Apennine Foredeep Basin (circles), representing water originating from evaporite dissolution [38]; rectangle C: triangles without sample numbers represent shallow brine in the Weibei Plain [12], and the numbers on the left and right sides of the dark orange graphic are the sample number and depth of the test sample.
Water 18 02077 g006
Figure 7. Diagram of relationships between δ11B values and B in BRW. Rectangle A: brine in the Weibei Plain (the numbers on left and right: sample no. and depth, respectively); rectangle B: Dead Sea salt water, representing seawater adsorbed by clay [46]; rectangle C: Mediterranean seawater, representing evaporated seawater [43].
Water 18 02077 g007
Figure 8. Mixing curves of deep BRW, DBW, FW and SW (The numbers on left and right: sample no. and depth, respectively).
Water 18 02077 g008
Figure 9. The relation diagram of δ81Br versus Br in part of brackish waters (the numbers on left and right: sample no. and depth, respectively). Unlabeled data (Groub A) from DU, studies in the same study area [12].
Water 18 02077 g009
Figure 10. Regional groundwater evolution model.
Water 18 02077 g010
Table 1. Br, Cl and B isotope analysis results.
IDTypeDepthδ11B (‰)δ81Br (‰)δ37Cl (‰)B (mg/L)Br (mg/L)Cl (g/L)B/Cl (molar)10−3
01SW038.68−0.10.033.3788.2318.270.61
02SW038.41-−0.043.4588.5718.410.62
09SW039.1−0.03−0.233.47110.3820.000.60
13FW044.28−0.210.191.6679.417.190.32
16FW012.48-−0.260.11-0.201.75
17FW08.59-0.240.120.720.152.60
20FW012.27-−0.150.160.700.192.83
21FW0--0.470.09-0.410.72
23FW012.38-0.230.250.830.184.54
03BRW8049.880.210.142.88329.164.510.15
04BRW6550.690.180.172.24309.364.140.11
07BRW7555.17−0.220.212.47342.9862.0430.13
08BRW7552.10.010.213.56259.0271.0260.16
15BRW6064.42−0.060.22.4320.3493.280.08
19SFW8--−0.170.060.690.151.41
22SFW50--0.230.030.540.120.95
24SBW4026.35-−0.161.29-0.3113.65
25SBW2023.430.220.050.8114.002.770.96
10SSW2046.32−0.08−0.044.71142.3330.100.51
18DFW70--0.260.03-0.130.78
06DBW300-−0.35−0.89-3.900.610.03
11DBW18058.46-0.40.096.811.100.27
26DSW200-−0.26−0.280.1357.068.970.05
27DSW120-−0.091.030.571.079.600.17
05DSW7552.410.150.151.55316.9745.410.11
12DSW11044.24-0.116.34154.1734.310.61
14DSW9143.41−0.310.114.2349.0410.980.50
Note(s): “-”: The corresponding ion concentration too low; it is not measured.
Disclaimer/Publisher’s Note: The statements, opinions and data contained in all publications are solely those of the individual author(s) and contributor(s) and not of MDPI and/or the editor(s). MDPI and/or the editor(s) disclaim responsibility for any injury to people or property resulting from any ideas, methods, instructions or products referred to in the content.