Article

Evaluation of Multi-Source Precipitation Products in Guangdong Province

Western Guangdong Key Laboratory of Marine Meteorological Disaster Theory and Application, Key Laboratory of Climate, Resources and Environment in Continental Shelf Sea and Deep Ocean, College of Ocean and Meteorology, Guangdong Ocean University, Zhanjiang 524088, China
*
Author to whom correspondence should be addressed.
Water 2026, 18(17), 2066; https://doi.org/10.3390/w18172066
Submission received: 29 June 2026 / Revised: 5 August 2026 / Accepted: 20 August 2026 / Published: 23 August 2026
(This article belongs to the Section Hydrology)

Highlights

What are the main findings?
  • In Guangdong Province, CHM_PRE precipitation shows the closest agreement with NCDC at daily, monthly, and annual scales. The performance of different products is closely related to temporal resolution, and the products are generally consistent at monthly and annual timescales. At the daily scale, rainfall intensity tends to be underestimated, and biases are also evident in light-rain events.
  • Error patterns differ among product types. Satellite-based datasets tend to overes-timate light rain and underestimate heavy rain. ERA5 exhibits biases that are strongly dependent on rainfall intensity. GMCP systematically underestimates precipitation, with low false-alarm rates but high miss rates. Spatially, CN05.1 shows the closest agreement with CHM_PRE. In terms of monthly-scale event de-tection, NOAA CPC performs the best.
What is the implication of the main finding?
  • CHM_PRE is the primary benchmark for daily-scale, extreme-event, and hydro-logical studies in Guangdong. CN05.1 is a reliable spatial alternative, while NO-AA CPC is suitable for monthly-scale event detection.
  • Daily-scale performance degradation and widespread intensity-dependent biases across products highlight the limitations of satellite and reanalysis data in fi-ne-scale and extreme-event studies.

Abstract

Accurate precipitation data are critical for hydrological and climatic studies in Guangdong Province, where complex terrain and frequent extreme rainfall pose substantial challenges. However, the performance of gridded precipitation products is still not well understood. This study evaluates nine products, including gauge-based (CHM_PRE, CN05.1, GMCP, NOAA CPC), satellite-based (IMERG-E, IMERG-F, TMPA RT, TMPA 3B42), and ERA5 reanalysis against NCDC observations from 2001 to 2019 using metrics including trend significance, correlation (R), root mean square error (RMSE), categorical statistics (POD, FAR, ETS), and relative bias across rainfall intensities. The results indicate that, based on validation against NCDC observations, CHM_PRE performs the best across all temporal scales, capturing significant increasing trends (p < 0.05) and achieving the highest consistency with observations at the annual (R = 0.99), monthly (R = 0.99), and daily (R = 0.89) scales. Using CHM_PRE as the reference, CN05.1 shows the highest spatial consistency with it, especially for extreme events. NOAA CPC exhibits the best performance in monthly event detection (ETS = 0.42; BIAS ≈ 1). Satellite products show acceptable performance at the monthly scale but exhibit intensity-dependent biases and high daily variability, with pronounced “light rain overestimation and heavy rain underestimation.” ERA5 shows limitations, particularly in its severe underestimation of extreme precipitation. CHM_PRE is thus identified as the most suitable dataset for Guangdong based on its agreement with NCDC observations. With CHM_PRE as the reference, CN05.1 provides a reliable alternative for spatial analyses; NOAA CPC performs the best in monthly event detection. Satellite products suit monthly use but require daily-scale caution; ERA5 shows a relatively poor performance.

1. Introduction

As an important component of the global hydrological cycle, precipitation serves not only as a key meteorological input for hydrologic modeling but also as a primary driver of hydrological processes [1,2,3]. Moreover, it is essential to the global water system, human survival, agriculture, and ecosystems. However, extreme precipitation events can lead to significant impacts [1], highlighting the critical need for accurate precipitation records.
Despite its importance, the acquisition of accurate, spatially continuous, and temporally consistent precipitation estimates remains a challenge [4]. If the terrain is particularly complex, this problem will be even more apparent. This terrain may block atmospheric circulation and ultimately create significant spatial climate differences. It also gives rise to diverse precipitation mechanisms [5,6,7]. Guangdong Province in southern China is a typical region with these characteristics. Its landscape includes the low-lying Pearl River Delta plains, densely forested hills, and the rugged Nanling Mountains, which serve as the main orographic barriers influencing the regional climate [8]. Climatically, Guangdong is located within the East Asian monsoon region, characterized by a pronounced rainy season (typically in summer) with strong seasonal rainfall [9,10]. During this period, Guangdong is frequently affected by tropical cyclones and intense mesoscale convective systems. These events contribute substantially to its high rainfall variability. The interaction between the complex terrain and strong atmospheric dynamics results in precipitation patterns characterized by exceptional spatial heterogeneity, high intensity, and sharp gradients. These features present substantial challenges for comprehensive monitoring and accurate representation across the province. This is evident from the observed heavy rainfall belt, which is concentrated along the coastline and decreases sharply toward the northwest [10,11].
Scientific communities have given rise to a diverse suite of products such as gauge-based, satellite-related, and reanalysis datasets, with each variant presenting specific strengths and limitations [4]. Among these, ground-based rain gauge networks, such as the NCDC gauge dataset, provide direct and widely used measurements of precipitation. These datasets are widely recognized as “ground truth” for validating satellite-derived precipitation products, as evidenced by their extensive use in comparative studies involving TRMM, GPM, and various reanalysis products [12,13,14]. However, the large spatial and temporal variability in precipitation, combined with the sparse distribution of rain gauges in mountainous and remote coastal regions, leads to significant spatial sampling errors. These errors can cause significant deviations in the estimation of regional average precipitation, and also pose challenges for monitoring local extreme events [15,16]. To address the spatial discontinuities inherent in gauge observations and systematic biases in numerical forecasts, a variety of gridded precipitation datasets and post-processing techniques have been developed, employing advanced spatial interpolation and statistical fusion methods [17,18]. In China, several high-resolution precipitation products aim to provide reliable gridded estimates for different applications, such as CN05.1, which is a 0.25° × 0.25°daily dataset based on dense station observations; gauge-based CHM_PRE, which has demonstrated strong performance across China; and the multi-source merging product GMCP [17,19]. Gridded precipitation products are essential for climatological studies and serve as valuable references. However, their quality is inherently limited by the density of the underlying gauge network and the interpolation methods used [20].
In parallel, atmospheric reanalysis datasets, such as ERA5, use advanced data assimilation techniques to produce comprehensive records of the global atmosphere, land surface, and ocean waves. However, precipitation in reanalysis is a model-derived variable that relies on parameterization schemes, often leading to systematic biases in intensity and location, particularly for extreme rainfall [21,22,23,24,25].
The advent of meteorological satellites since the 1970s has revolutionized global precipitation monitoring. Modern satellite-based precipitation products integrate data from passive microwave and infrared sensors on multiple satellites to generate high-resolution rainfall estimates [26]. Earlier products from the Tropical Rainfall Measuring Mission (TRMM) and the subsequent Global Precipitation Measurement (GPM) mission have provided important multi-satellite precipitation records [27,28,29,30]. Integrated Multi-Satellite Retrievals for GPM (IMERG) offers improved capabilities, with the final run incorporating gauge calibration and the early run providing near-real-time estimates [31,32,33]. These products offer quasi-global coverage, but their performance often degrades over a complex terrain and for extreme events due to sensor limitations and retrieval algorithm uncertainties [4,14,34].
Previous studies have evaluated multi-source precipitation products. Global-scale assessments have consistently shown that gauge-blended precipitation products outperform satellite or reanalysis estimates. These studies also revealed significant regional and seasonal differences in satellite product performance. Satellite estimation generally performs well in summer, but based on the results calculated by the model, it is more accurate in winter [27,35]. Many assessments targeting different river basins and regions have found that precipitation products based on observation stations, such as CN05.1, perform better than other forcing datasets in reproducing the actual observed precipitation climate characteristics and trends due to their dense station layout and terrain deviation calibration [18,36]. Previously, there were assessments specifically targeting parts of southern China, including Guangdong. The results showed that satellite precipitation products such as TMPA and IMERG can capture large-scale precipitation distribution patterns. However, these types of products often fail to account for the heavy rainfall that comes with typhoons, especially in the central area of the storm. ERA5, a type of reanalysis product, is highly likely to experience systematic wet bias overall, and its performance will vary with seasons and regions [21,37].
Although there have been many practical exploration attempts at present, the progress of research in related fields is still limited. For example, there is a lack of comprehensive and systematic inter-comparisons within Guangdong Province. A set of state-of-the-art, high-resolution, gauge-based products (CHM_PRE, GMCP, CN05.1), global reanalysis (ERA5), and satellite products (TMPA 3B42, IMERG-E, IMERG-F), widely used in regional studies, still require further validation. In addition, extreme precipitation is a major concern for flood risk in Guangdong; therefore, assessments across multiple temporal scales, such as annual, monthly, and daily, are still insufficiently detailed.
Despite these advances, several critical gaps remain. First, existing studies in southern China have typically focused on a limited subset of products, often either satellite-only or reanalysis-only comparisons, without simultaneously evaluating the full spectrum of gauge-based, satellite-derived, and reanalysis products within a unified framework. Second, most regional assessments emphasize temporal validation at monthly or annual scales, with insufficient attention being paid to daily scale performance and the systematic biases that emerge across different rainfall intensity categories, particularly for extreme events. Third, while spatial pattern evaluation is essential for hydrological applications, previous studies rarely combine station-based temporal validation with a spatially explicit comparison using a consistent reference field. The present study addresses these limitations by (i) simultaneously evaluating nine products spanning three distinct categories within a single, methodologically consistent framework; (ii) conducting a multi-scale validation from daily to annual timescales with detailed intensity-dependent bias analysis; and (iii) integrating a gauge-based temporal evaluation with a spatial pattern assessment to provide comprehensive guidance for product selection in Guangdong Province.
To address these limitations, this study has three primary objectives. (1) This study aims to use quality-controlled NCDC station observations across Guangdong as the primary reference dataset. This reference will be used to quantitatively evaluate the performance of a suite of multi-source precipitation products (CHM_PRE, GMCP, CN05.1, ERA5, TMPA 3B42, TMPA RT, IMERG-E, IMERG-F) across annual, monthly, and daily timescales, and to identify the product that exhibits the strongest agreement with station observations. (2) Using the best-performing product from stage 1 as a spatially continuous reference, evaluate the remaining products’ ability to reproduce the spatial patterns of daily and extreme precipitation, and assess their mutual consistency and biases. It is acknowledged that this reference field is itself a gridded product and therefore subject to interpolation uncertainties. It is acknowledged that CHM_PRE is itself a gridded product and therefore subject to interpolation uncertainties. (3) This study will provide clear, evidence-based guidance on selecting the most suitable precipitation dataset(s) for key application scenarios in Guangdong. These scenarios include long-term climatological analysis, near-real-time hydrological monitoring, and extreme-event diagnosis. In addition, this study aims to offer a methodological framework that can be adapted for similar regional-scale assessments in other regions.

2. Materials and Methods

2.1. Study Area

Guangdong Province, located in southern China, borders the South China Sea. The region has an average annual precipitation of 1771 mm, with a range of 70–85% falling during the rainy season from April to September, often in the form of typhoons and heavy rainstorms, which frequently cause floods [38]. The complex terrain, including the coastal plains and the Nanling Mountains, contributes to sharp spatial precipitation gradients, making accurate precipitation estimation particularly challenging. It is crucial to clarify the accuracy of multi-source precipitation products in the Guangdong region, which can help improve the management of local water resources and reduce the impact of hydrological and meteorological disasters.

2.2. Data Sources

Table 1 presents the main characteristics of the precipitation products evaluated in this study. The National Climate Data Center, also known as NCDC, provides precipitation datasets built on a dense set of meteorological stations, which can provide long-term and reliable rainfall observation results [39]. These are raw point-scale station measurements, not an interpolated gridded product. The NCDC dataset covers a wide spatial range and has a coherent time series, often used as a reference for evaluating satellite and reanalysis precipitation products [40]. Although subject to instrumental errors and representativeness limitations, these station observations serve as the closest available approximation of ground truth. Its utility in capturing rainfall extremes and statistical variability makes it a suitable benchmark for assessing the applicability of multi-source precipitation datasets.
The CHM_PRE dataset is a gridded daily precipitation product developed from observations at 2839 rain gauges across China. It uses a precipitation ratio analysis method, combined with terrain feature corrections, to generate continuous precipitation fields [41]. GMCP is a merged precipitation dataset that combines satellite, gauge, and reanalysis data [19]. The CN05.1 dataset is a gridded precipitation product constructed from over 2400 observing rain gauges across China using the “anomaly approach” [17].
ERA5 is the fifth generation of the European Centre for Medium-Range Weather Forecasts (ECMWF) reanalysis dataset, providing a globally consistent record of atmospheric variables since 1940 [21]. It integrates observations from various sources through data assimilation techniques.
TMPA-RT is the near-real-time version of the TRMM precipitation product [28]. Unlike the post-processed version, it does not incorporate gauge data, enabling immediate availability for monitoring applications. TMPA 3B42 is a satellite-based precipitation product derived from TRMM. It combines passive microwave and infrared data to provide precipitation estimates at 0.25° spatial and daily temporal resolutions [29]. The product is gauge-adjusted in post-processing. IMERG-E is a near-real-time precipitation product from the GPM mission, providing half-hourly estimates [42]. It combines passive microwave and infrared satellite data. IMERG-F is a post-processed version of the GPM precipitation product, incorporating monthly gauge data and undergoing extensive quality control [43].

2.3. Methods

2.3.1. Neighborhood Averaging for Point-to-Grid Matching

Prior to evaluation, all precipitation products were processed to a common daily temporal scale. For products with a sub-daily temporal resolution, daily precipitation totals were calculated as the sum of all valid sub-daily accumulations within each calendar day. Days with any missing sub-daily records were excluded. Traditional point-to-point verification of high-resolution gridded precipitation products against station observations often suffers from the “double penalty” problem. This occurs when a forecasted precipitation feature is slightly displaced in space. In such cases, the model predicts rain, but not at the exact station location. This results in both a miss (observed rain not forecasted at that point) and a false alarm (forecasted rain not observed at that point). Even though the forecast may have a useful spatial structure, it is penalized twice, leading to overly pessimistic skill scores. To address this issue, neighborhood verification methods have been developed [44]. These methods relax the requirement for exact grid-scale matches and instead evaluate forecasts within a spatial neighborhood around each point, rewarding “close” forecasts [44].
In this study, a 3 × 3 grid-cell neighborhood window was applied around each station location. The gridded precipitation value assigned to the station is the arithmetic mean of all grid points within that window:
P grid ,   station = 1 N i = 1 N P i
where P i is the precipitation value at the i -th grid point within the neighborhood, and N is the total number of grid points in the window (here N = 9 for a 3 × 3 window). After averaging, it can reduce spatial representativeness errors and provide a fairer basis for comparing point observation data with gridded products. Adjusting the neighborhood size can also explore the scales at which the product achieves a useful skill [44]. A comparison of 2 × 2, 3 × 3, and 4 × 4 neighborhood windows showed that the 3 × 3 window yielded the highest overall correlation coefficient and the lowest overall root mean square error at the daily scale, and it was therefore adopted for this study.

2.3.2. Evaluation Metrics

To comprehensively assess the performance of various precipitation products against station observations, a set of statistical indicators was adopted, which included both continuous and categorical measures. For categorical metrics, a precipitation event is defined when the daily precipitation exceeds 0.1 mm. These events are categorized by 24-h accumulated rainfall into six classes, namely light rain, moderate rain, heavy rain, torrential rain, heavy torrential rain, and extreme torrential rain, corresponding to the ranges 0.1–9.9 mm, 10–24.9 mm, 25.0–49.9 mm, 50.0–99.9 mm, 100.0–249.9 mm, and ≥250.0 mm. For the assessment of extreme precipitation, a daily precipitation amount exceeding 50 mm is defined as an extreme event [45]. A contingency table was constructed for each product and threshold, containing the number of hits (H), misses (M), false alarms (F), and correct negatives (F). Consistent with the standard practice for evaluating gridded precipitation products [46,47], the metrics are defined as follows.
  • Relative Bias (RB)
Relative bias normalizes this difference by the mean observed precipitation, facilitating comparisons across different regions or periods.
R B = i 1 N ( F i O i ) i 1 N O i × 100 %
where F i is the gridded value and O i is the observed station value at the i -th sample, N is the total number of station days. Positive (negative) bias indicates overestimation (underestimation).
  • Root Mean Square Error (RMSE)
RMSE quantifies the average magnitude of the error, giving greater weight to large errors.
R M S E = 1 N i = 1 N ( F i O i ) 2
  • Probability of Detection (POD)
POD measures the fraction of observed events that were correctly forecasted by the product [47].
P O D = H H + M
  • False-Alarm Ratio (FAR)
FAR measures the fraction of forecasted events that did not actually occur, ranging from 0 to 1, with 0 being perfect (no false alarms) [47].
F A R = F H + F
  • Equitable Threat Score (ETS)
ETS evaluates the overall skill of the product in forecasting events, accounting for hits that would occur by chance. It is particularly useful for rare events like heavy precipitation [47].
E T S = H H r a n d o m H + M + F H r a n d o m
where H r a n d o m = ( H + M ) ( H + F ) N is the number of hits expected from a random forecast with the same event frequencies, and T = H + M + F + C is the total number of events (hits, misses, false alarms, and correct negatives). ETS ranges from −1/3 to 1, with 0 indicating no skill and 1 a perfect forecast.
  • Bias Score (BIAS)
BIAS measures the ratio of forecasted events to observed events. A perfect score is 1. BIAS < 1 indicates under-forecasting (more misses), while BIAS > 1 indicates over-forecasting (more false alarms) [48].
B I A S = H + F H + M

2.3.3. Interpolation Methods

To ensure comparability among multi-source precipitation datasets in both temporal and spatial dimensions, a unified interpolation procedure was applied in Section 3.2 (Spatial Comparison with CHM_PRE). First, for the CN05.1 and NOAA CPC datasets, missing values near the boundary were filled using spatial linear interpolation separately in the latitudinal and longitudinal directions. Second, the products that were not already at 0.1° resolution were gridded to a common 0.1° × 0.1° grid using bilinear interpolation. This method linearly weights the original grid values of each dataset. To preserve the spatial structure of the original data, it is necessary to ensure consistency between different products. Bilinear interpolation was selected because it is widely used in similar inter-comparison studies and is computationally efficient. However, it should be noted that any resampling operation inherently involves smoothing, which may attenuate localized precipitation extremes, particularly in regions with sharp spatial gradients such as the coastal and mountainous areas of Guangdong. This potential attenuation is acknowledged as a source of uncertainty in the spatial comparison of extreme events.

3. Results

3.1. Comparison with NCDC Station Observations

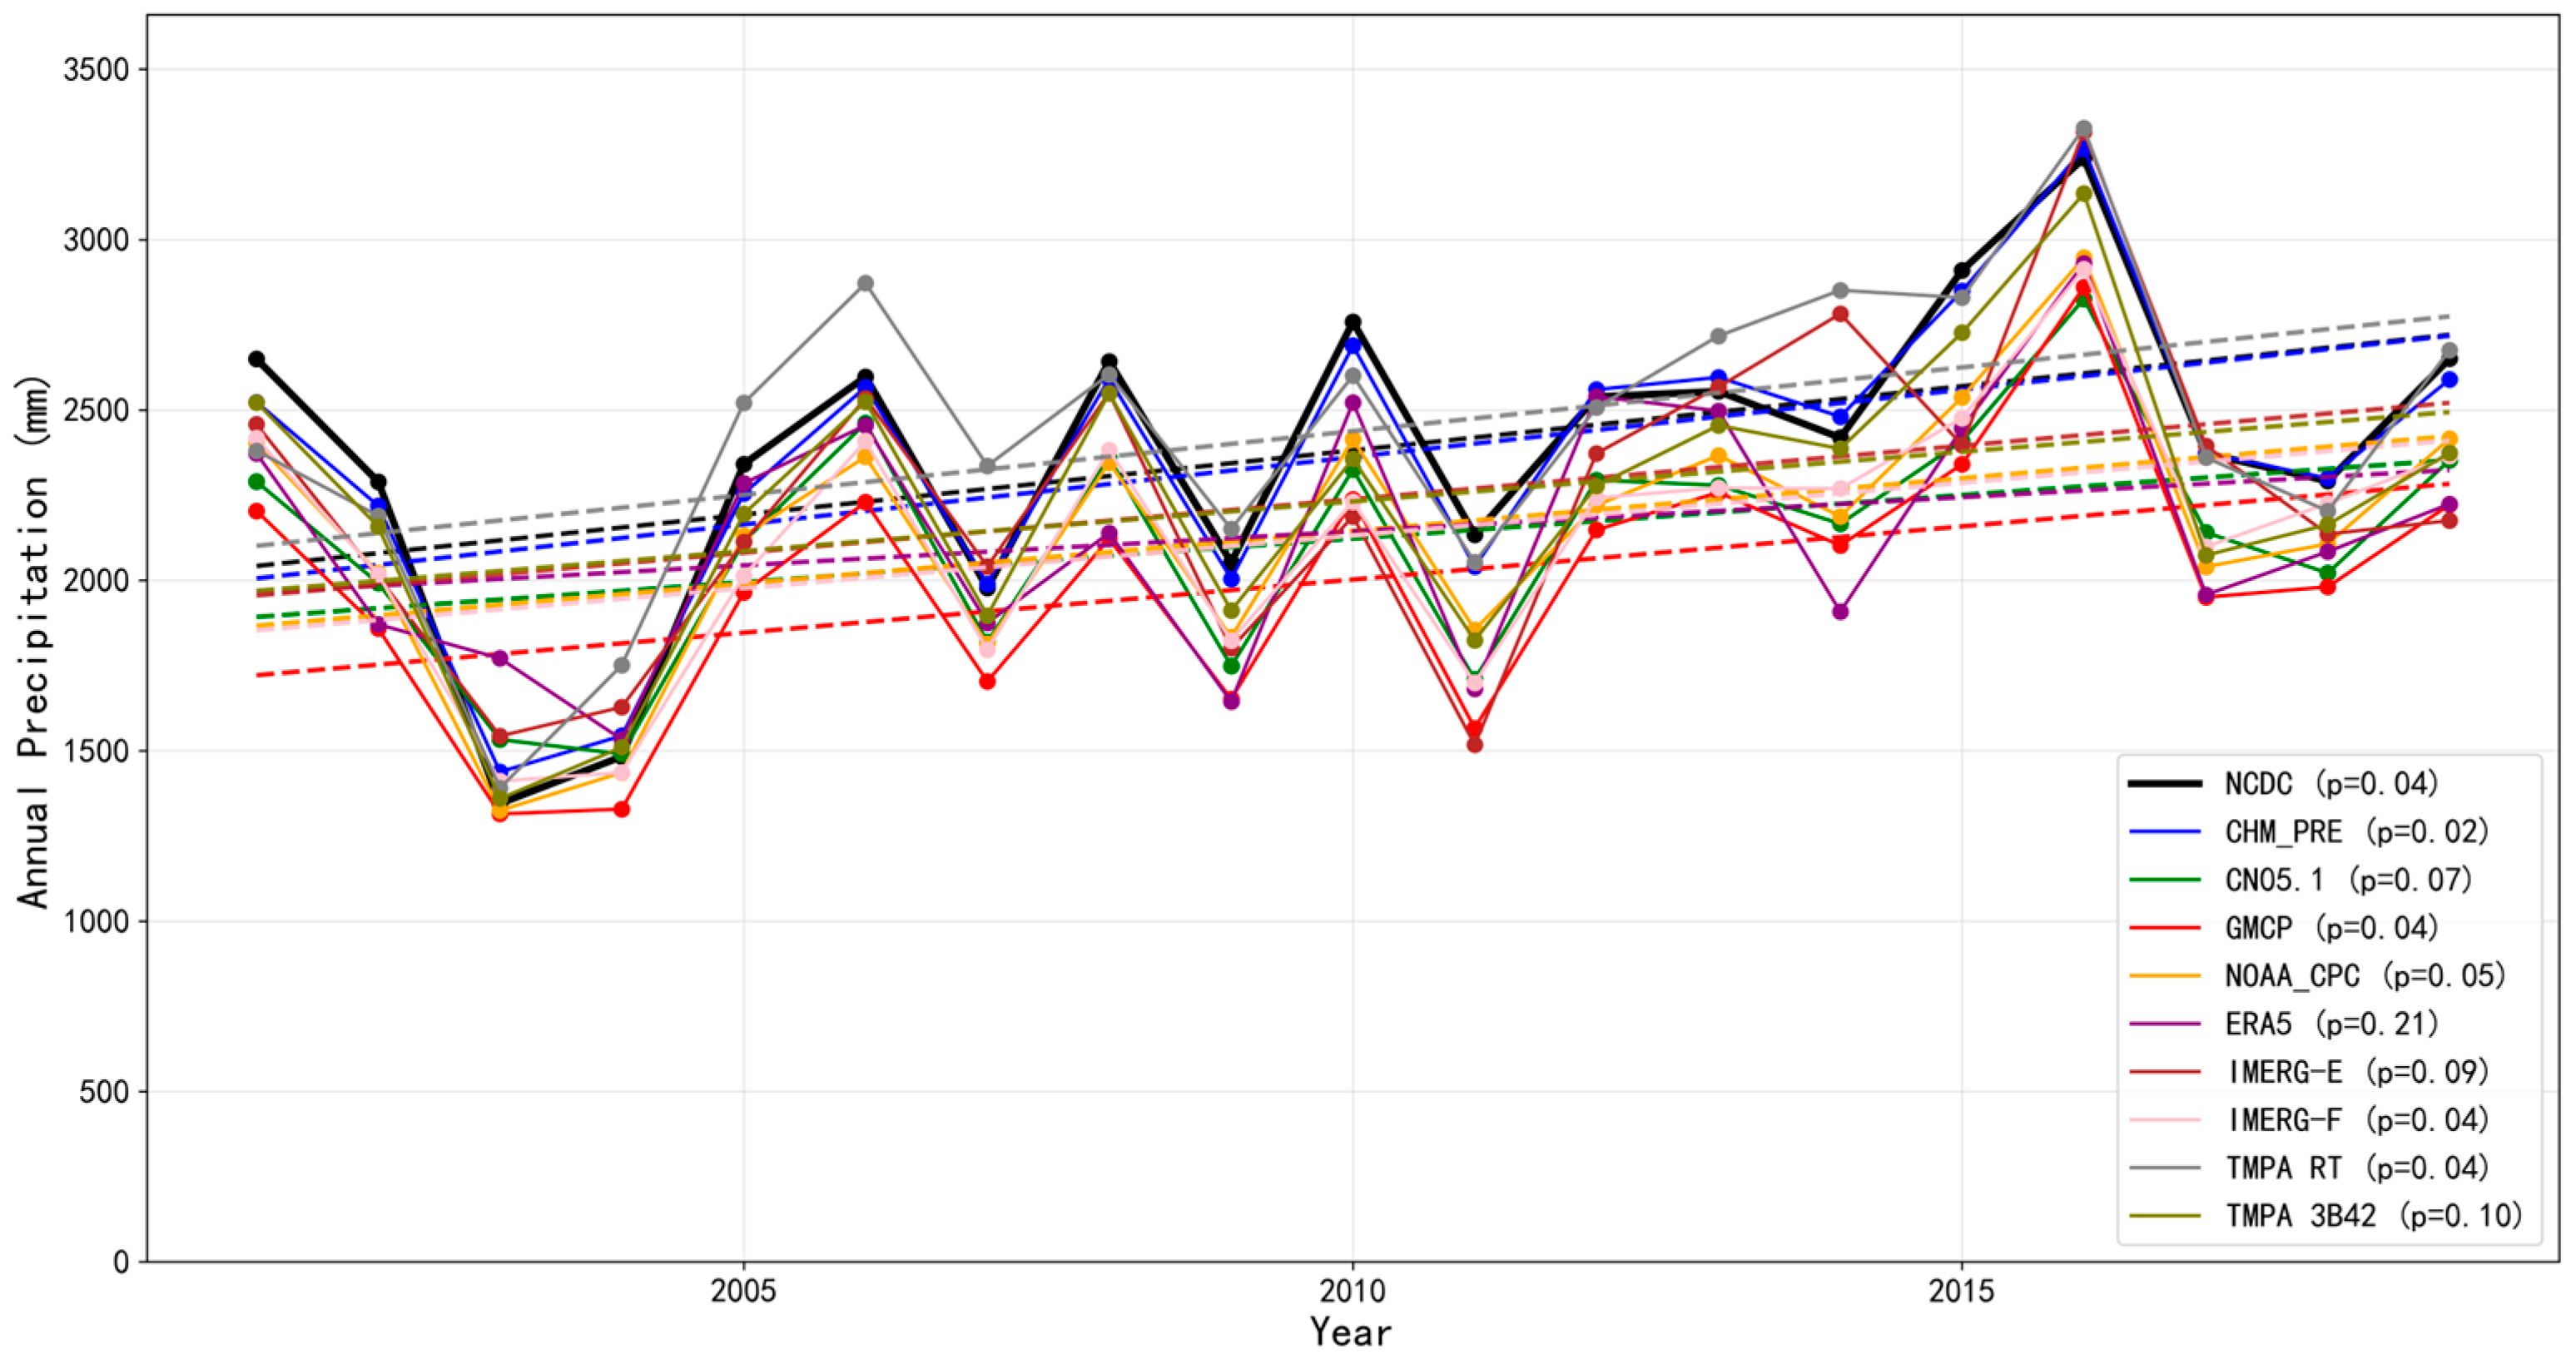
To evaluate the reliability of different precipitation products in Guangdong, it is necessary to assess their ability to accurately capture long-term precipitation trends and estimate the annual total precipitation accurately. Figure 1 shows the temporal variation data of annual precipitation for multiple different precipitation products in Guangdong Province from 2001 to 2019. NCDC station observations showed a statistically significant upward trend (p = 0.04). Among the gridded products, CHM_PRE, GMCP, IMERG-F, and TMPA RT captured significant increasing trends (p < 0.05), while CN05.1, NOAA CPC, IMERG-E, TMPA 3B42, and ERA5 did not. This suggests that these products may reduce the observed long-term trend due to algorithmic smoothing or a lower spatial resolution [18,44].
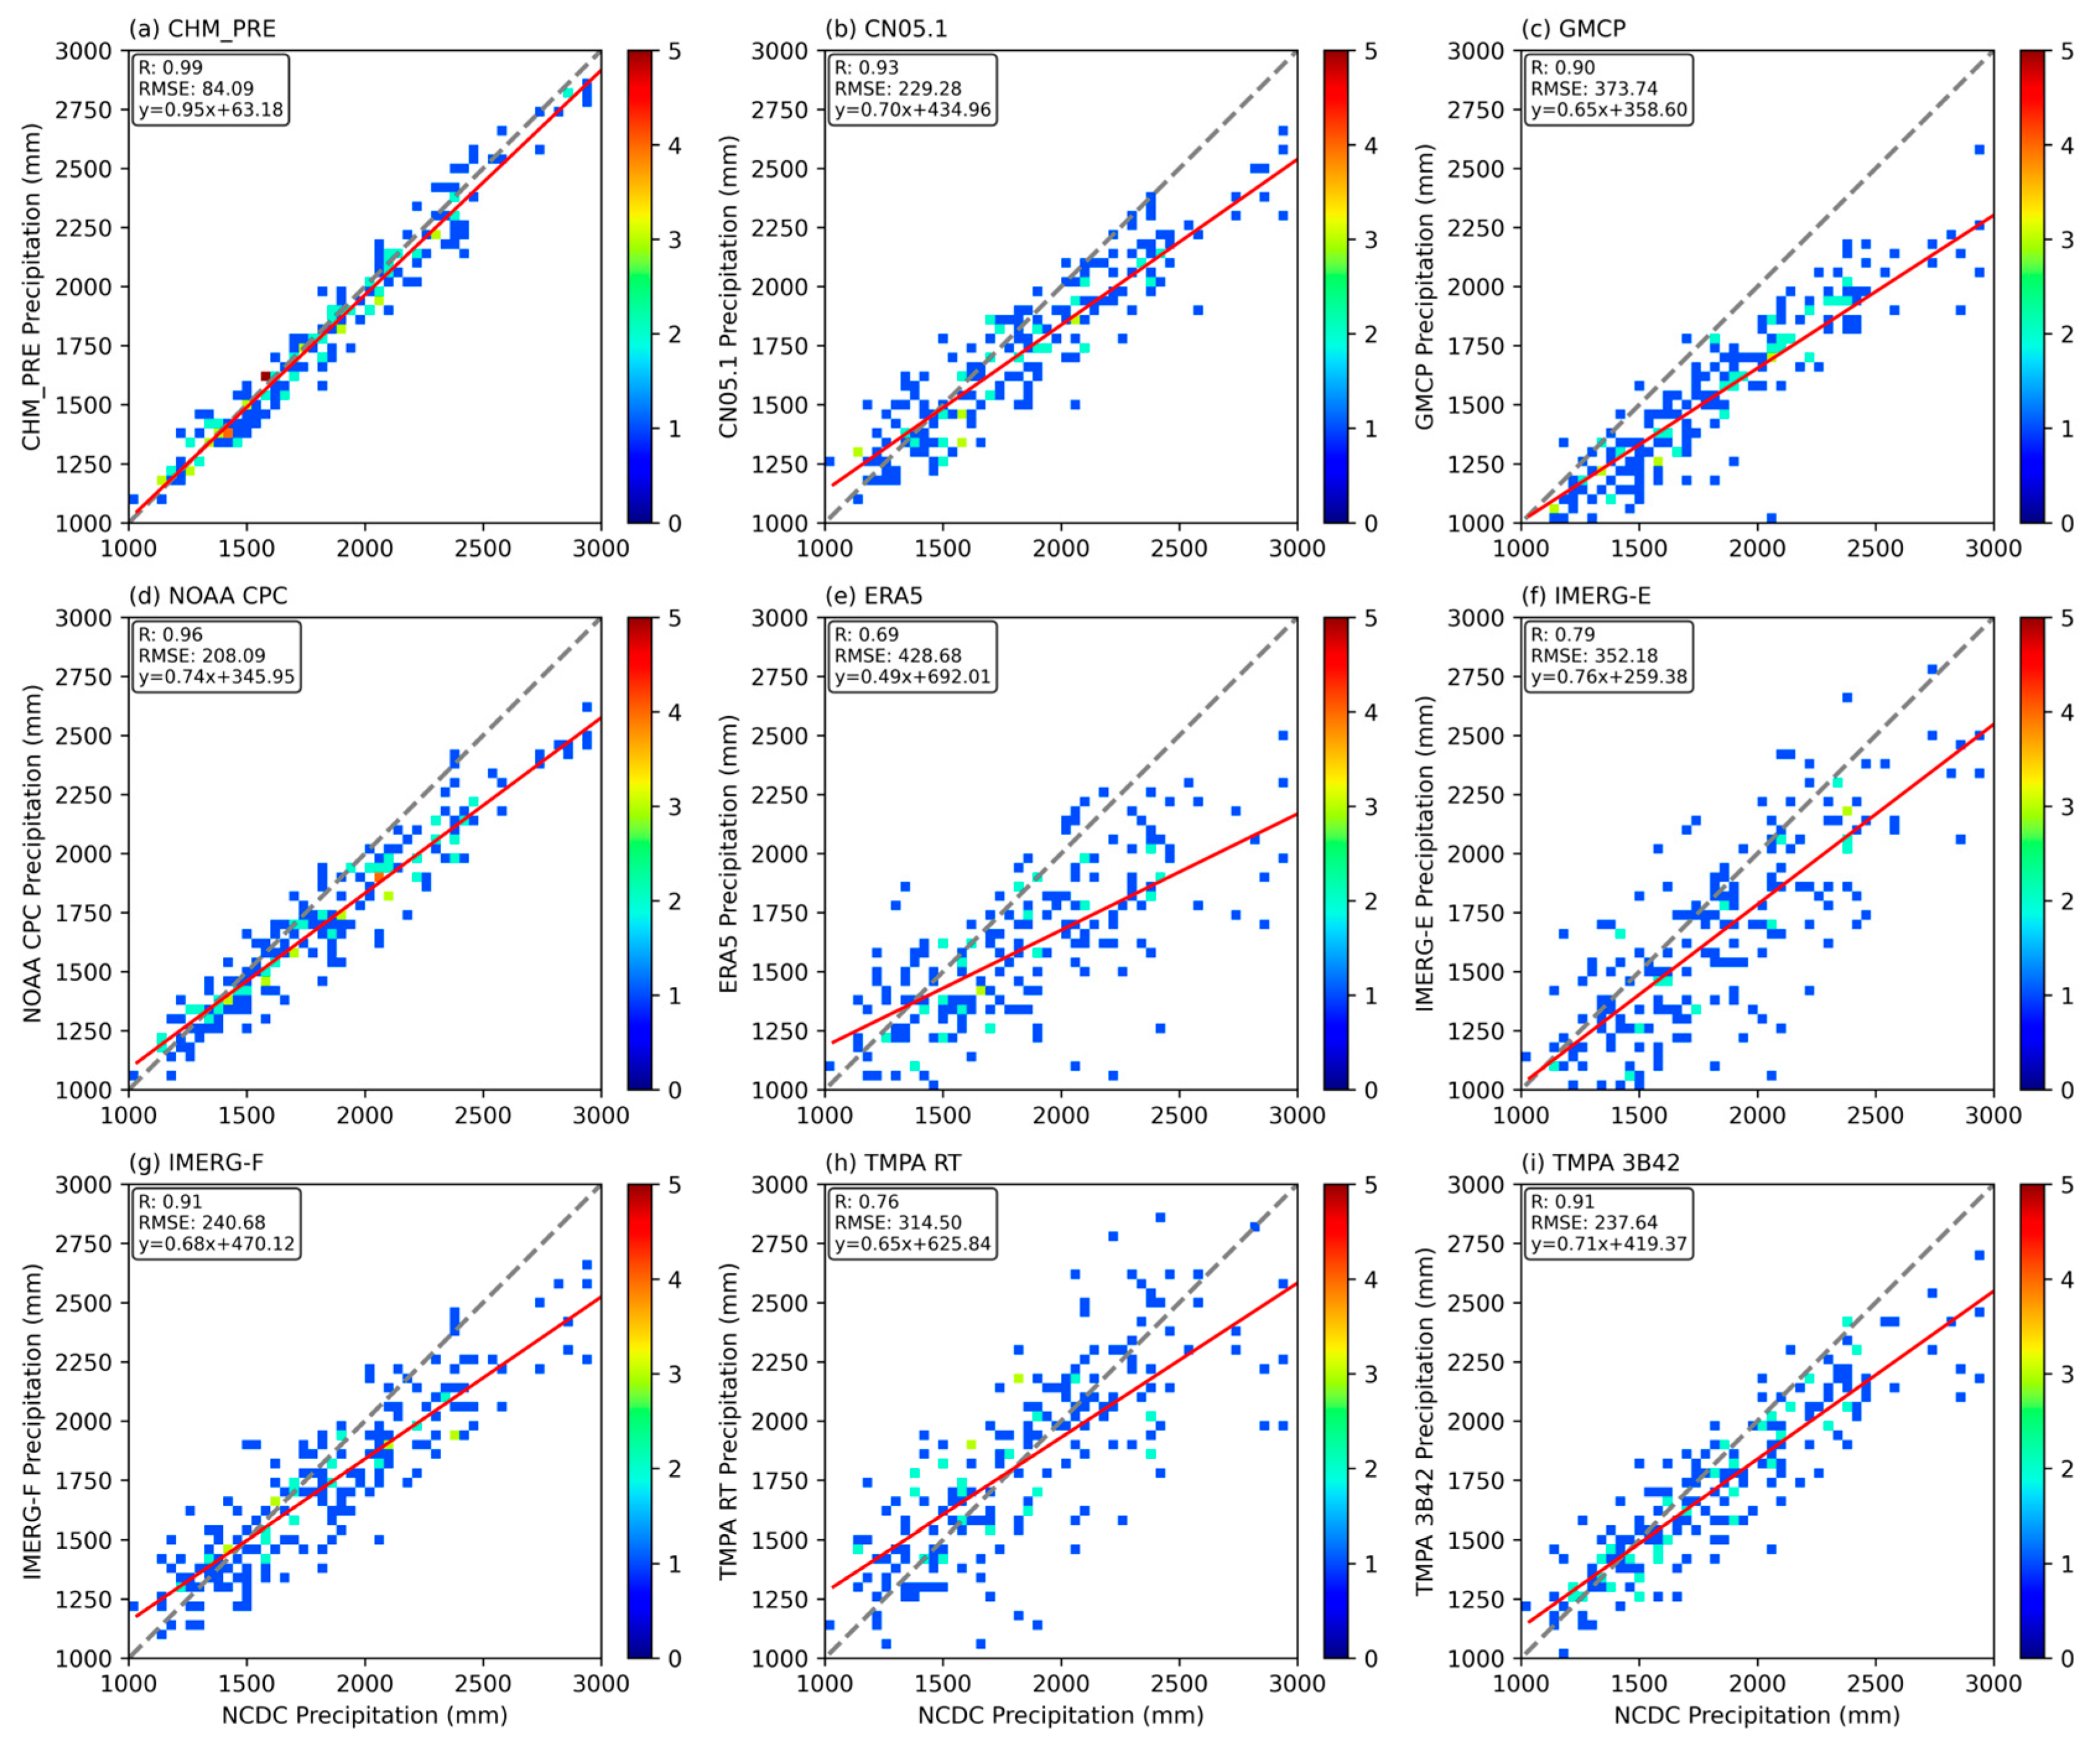
Trend analysis can identify which products can provide a long-term signal performance and can further clarify the overall reliability of these products by verifying their accuracy in simulating annual total precipitation. Figure 2 presents the scatter density distribution between the annual cumulative precipitation of multiple products and NCDC station observations. Among all products, CHM_PRE exhibited the strongest agreement with NCDC observations, with the highest correlation and the lowest RMSE. The remaining gauge-based products (NOAA CPC, CN05.1) also performed well, while GMCP showed a moderate performance. Satellite products displayed variable skills, with IMERG-F and TMPA 3B42 outperforming their near-real-time counterparts. ERA5 showed relatively poor agreement at the annual scale.
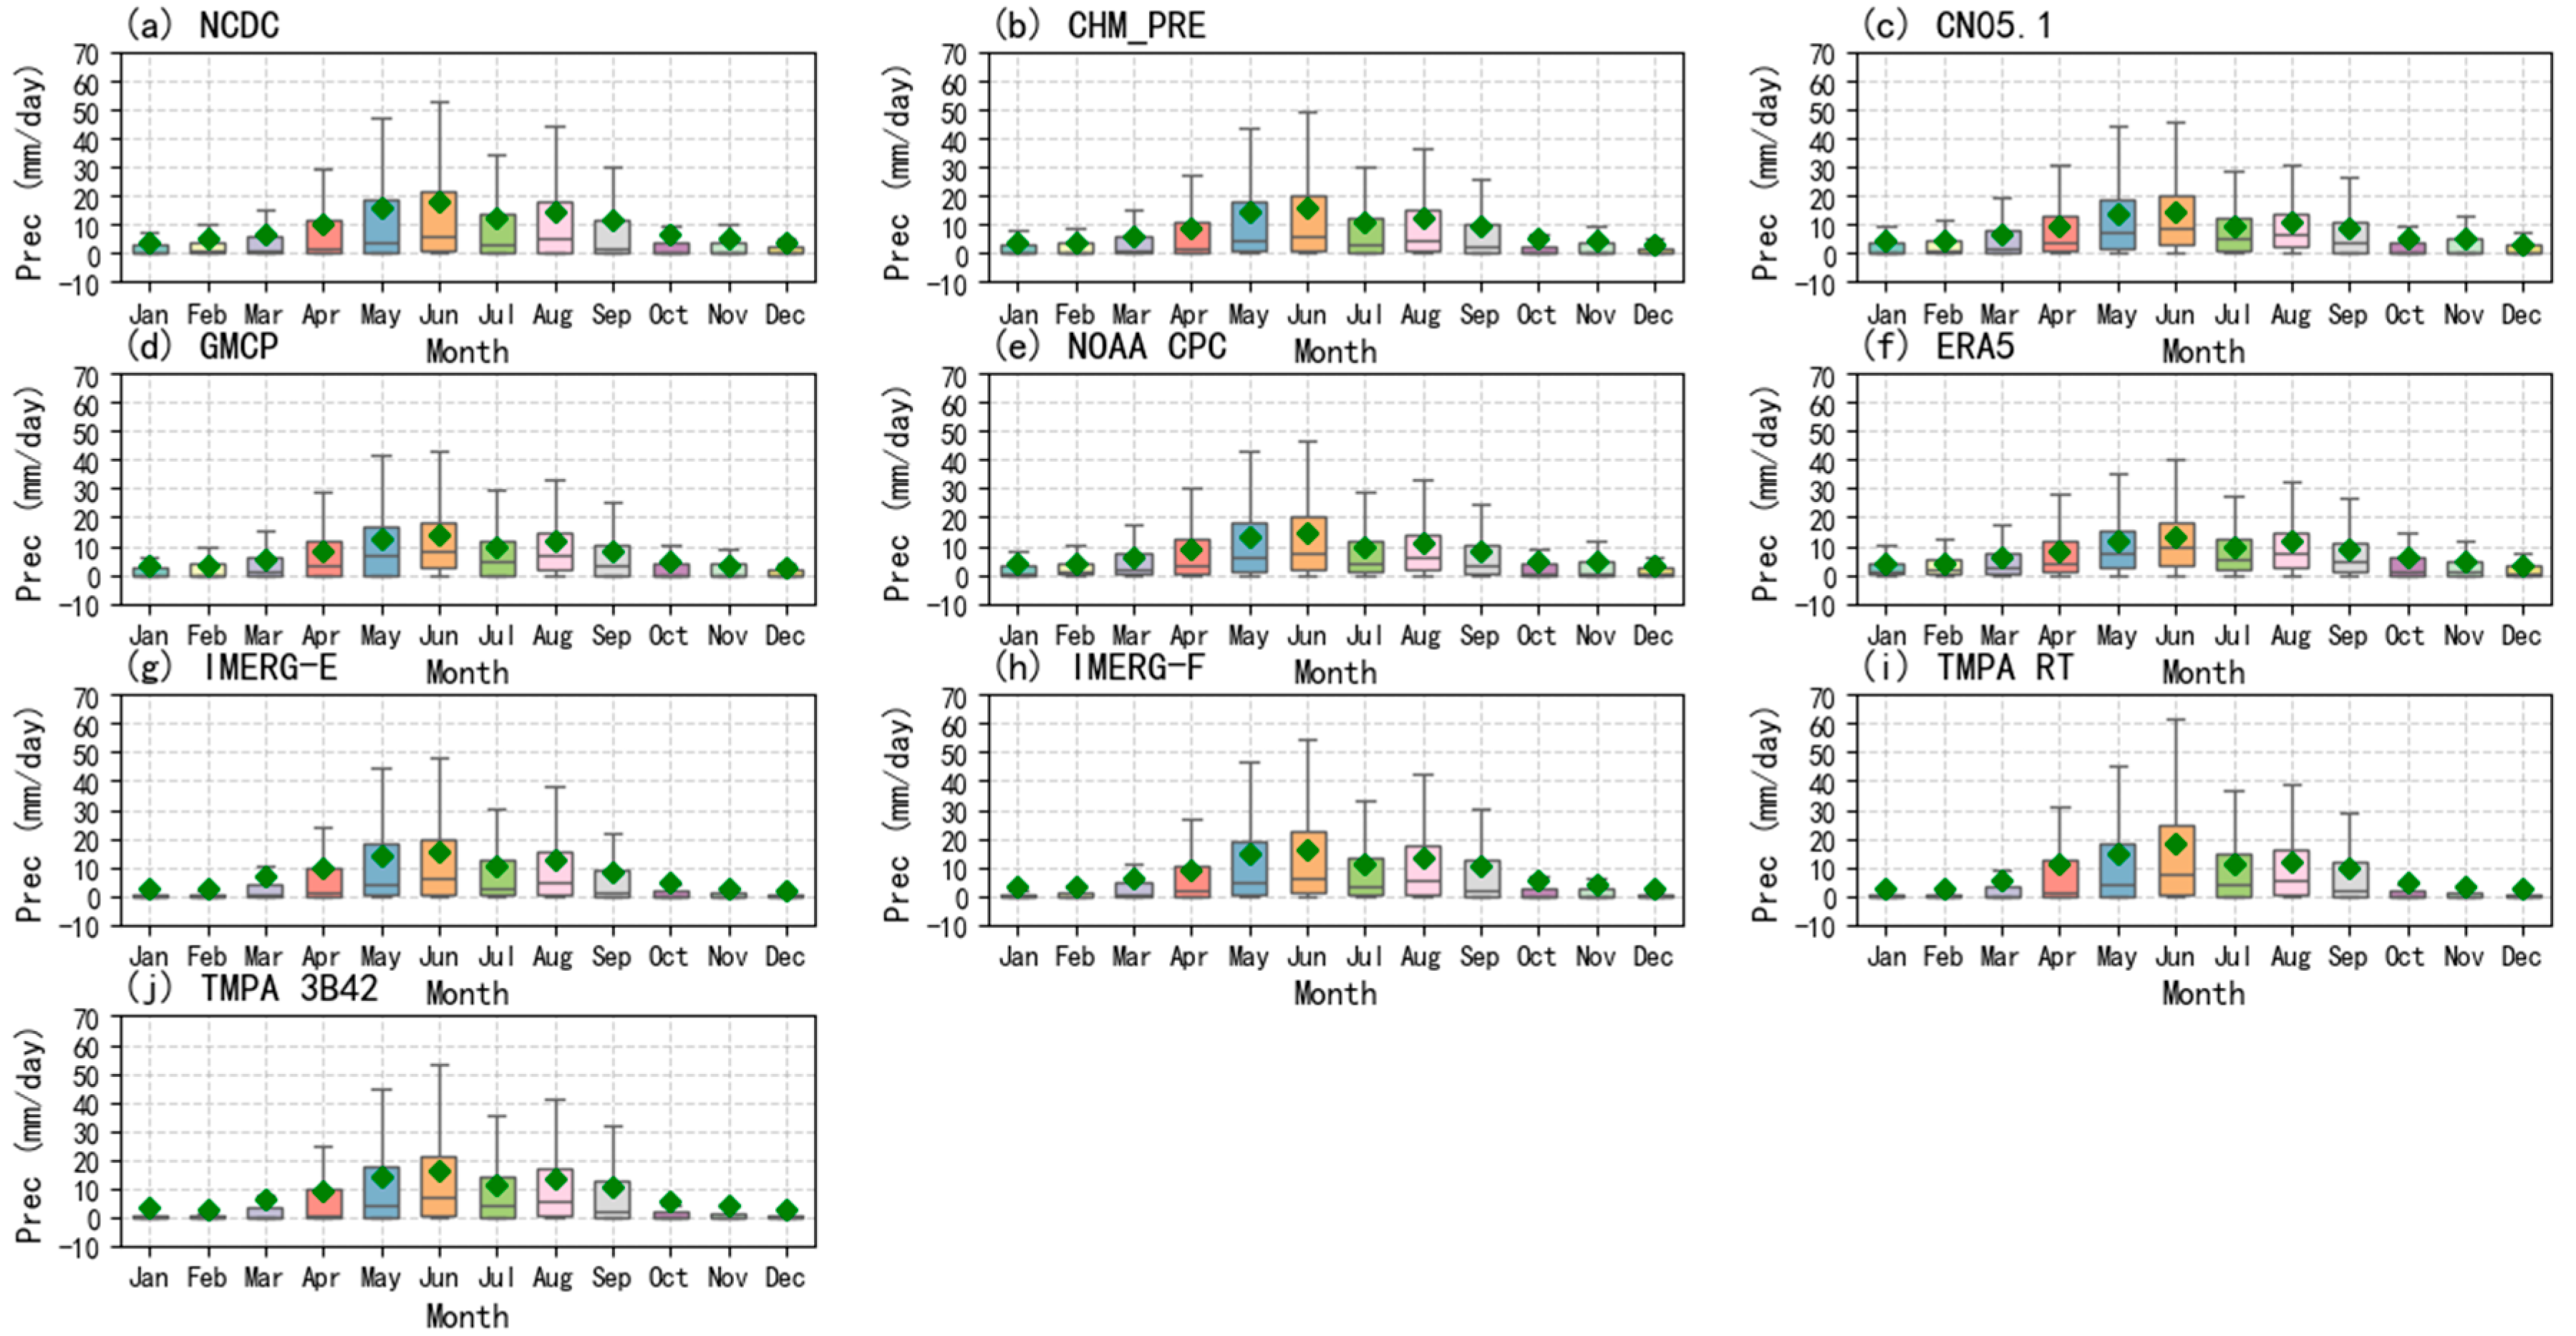
While annual-scale evaluations provide a critical assessment of overall product performance, examining their behavior at finer temporal scales is also important. In particular, assessing the monthly distribution of daily precipitation is essential for understanding a product’s ability to capture seasonal and sub-seasonal variability. Figure 3 presents the monthly distribution of daily precipitation from multiple sources over Guangdong Province in 2001–2019. All datasets capture the distinct wet season (April to September) and dry season (October to March) in Guangdong, as reflected by wider boxes and higher medians/means during summer months. The gauge-based analyses, such as CHM_PRE, CN05.1, GMCP, and NOAA CPC, have medians and means that are closest to those from NCDC station observations across all months, indicating lower bias. In contrast, IMERG-F and IMERG-E exhibit a bias during the wet season, with means (green diamonds) often falling below the NCDC observations. The TMPA products (3B42 and 3B42RT) demonstrate greater variability (wider boxes) and more extreme outliers. ERA5 tends to underestimate daily precipitation intensity, particularly during the peak summer months (June–August), as evidenced by lower means and a compressed interquartile range. During the typhoon season (July–September), satellite products often exhibit long whiskers, suggesting they capture a wider range of extreme precipitation events but with potentially higher uncertainty.
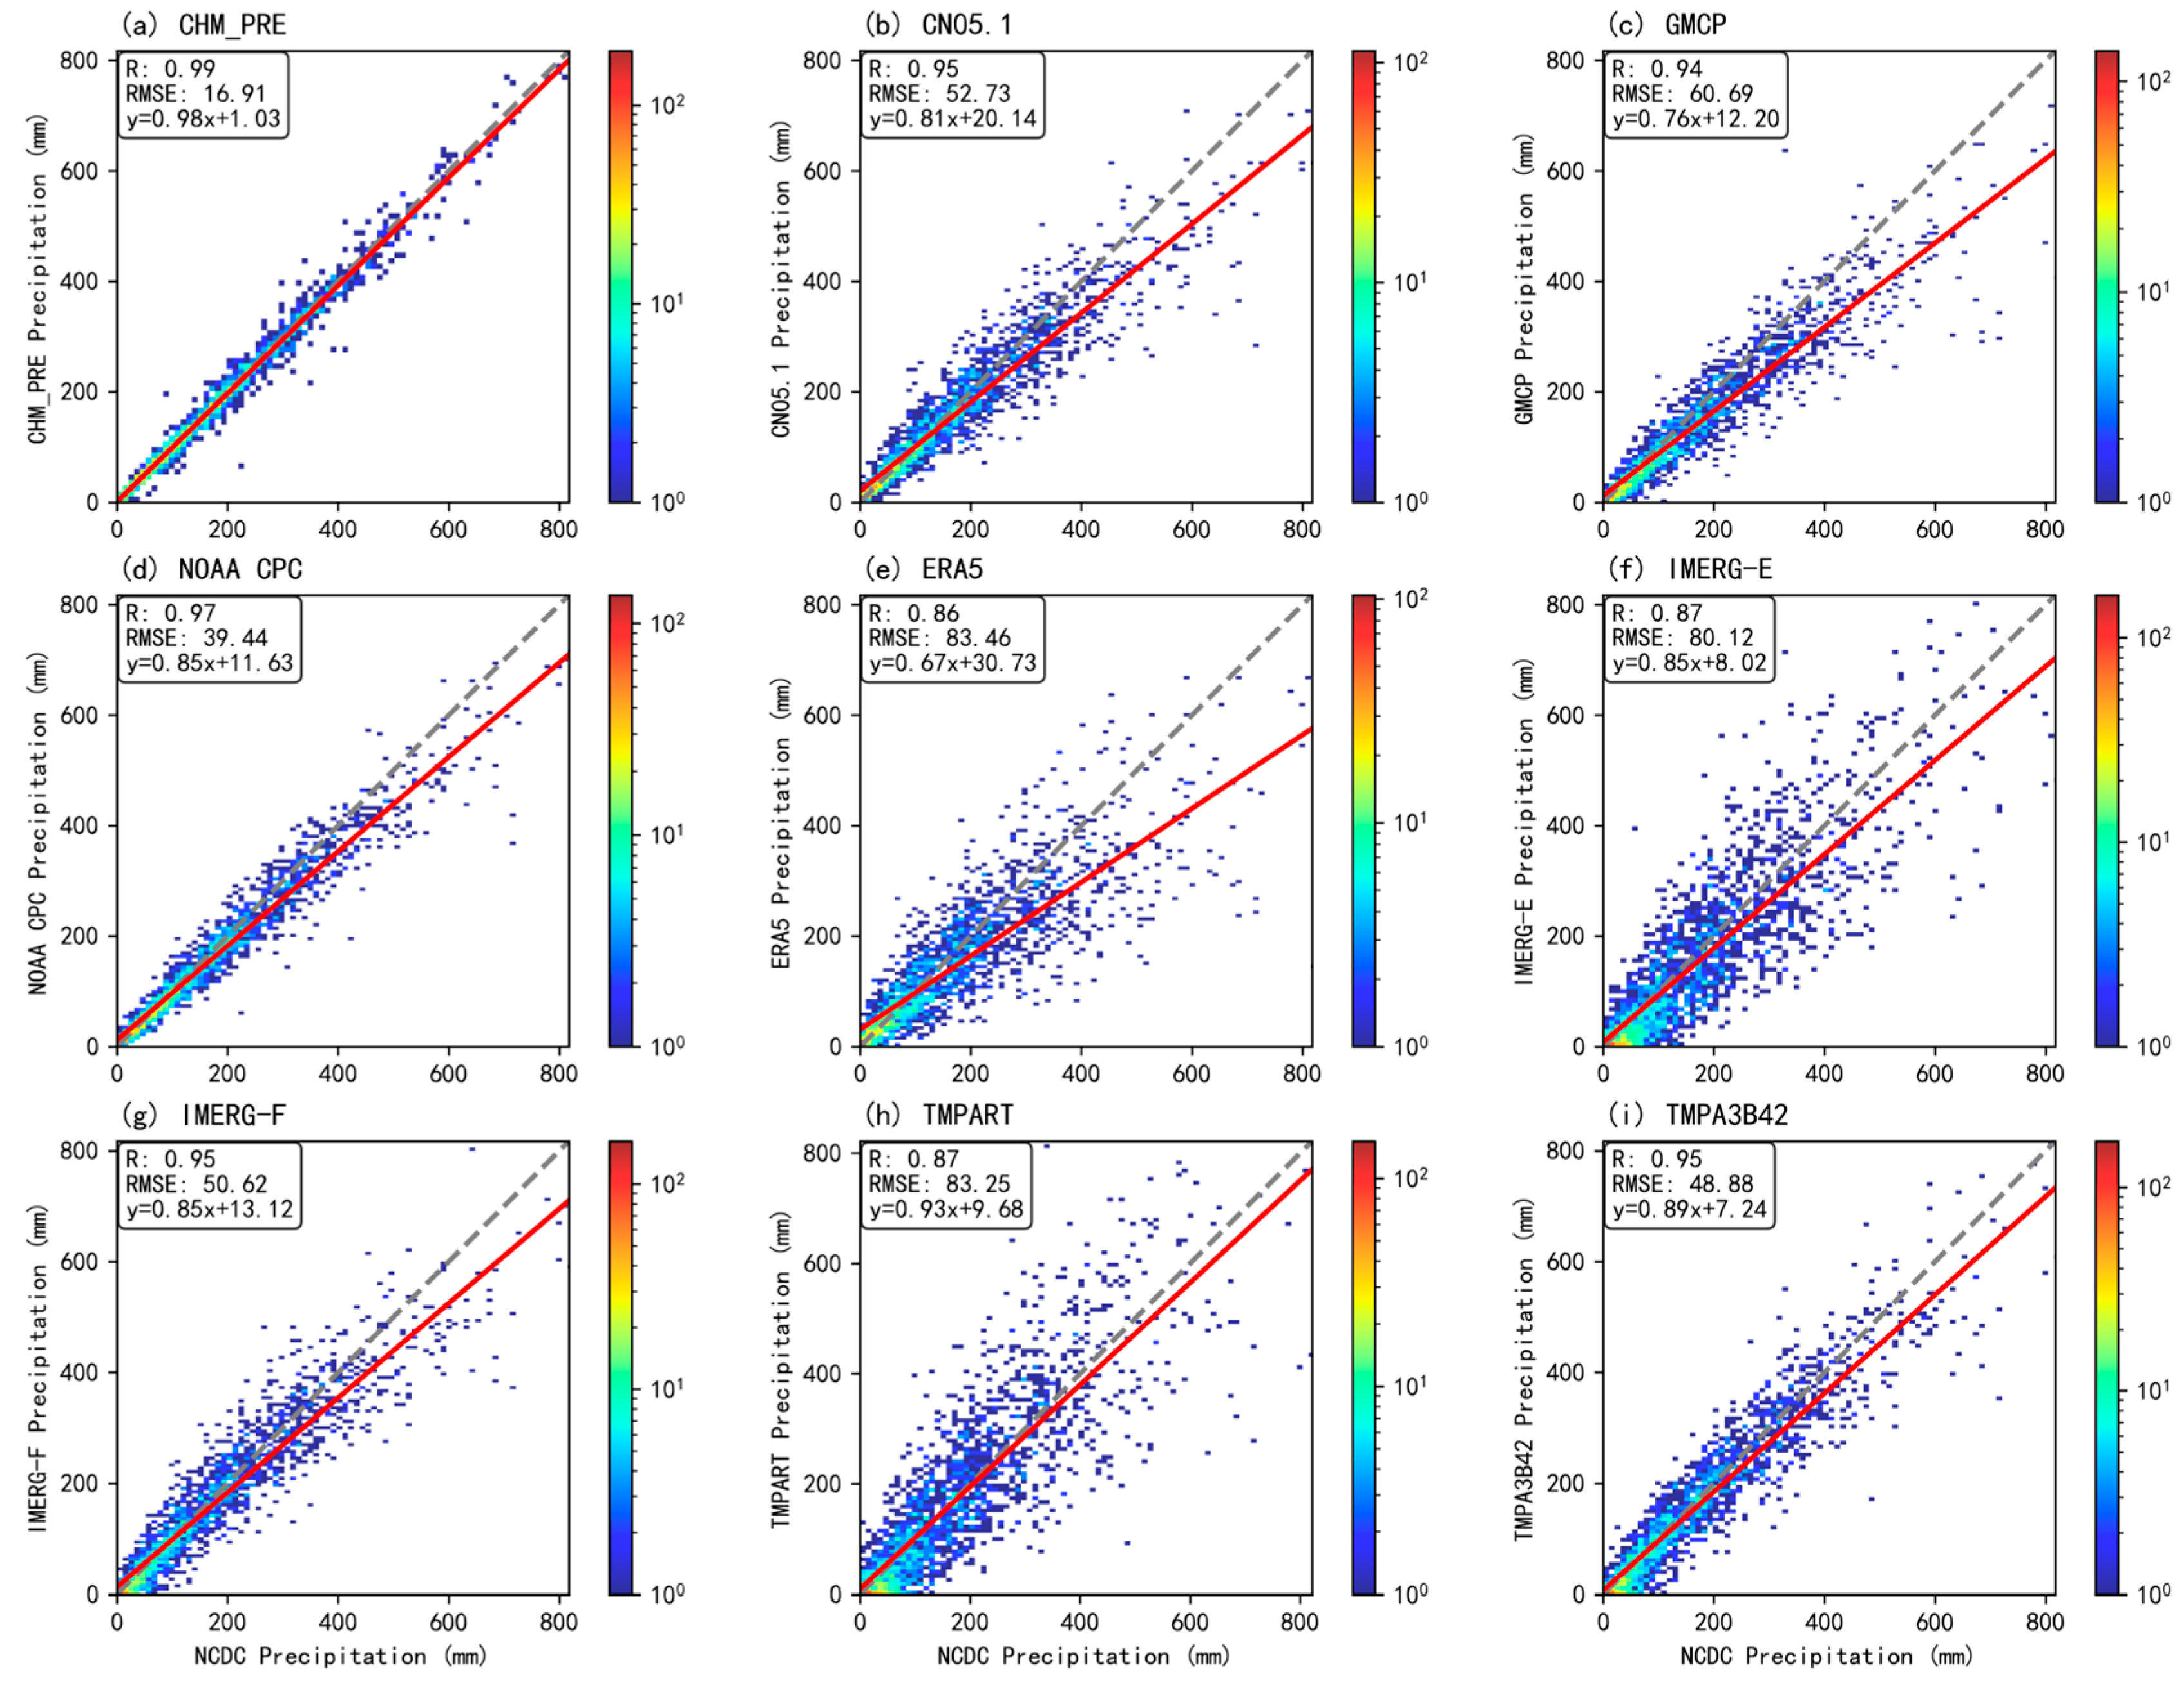
Although the monthly distribution analysis reveals systematic biases in daily precipitation characteristics, quantifying the accuracy of monthly total precipitation provides a complementary assessment of product performance at the monthly cumulative scale. Figure 4 presents scatter plots of monthly total precipitation from multiple products against NCDC over Guangdong Province. All products showed substantially improved consistency at the monthly scale compared to the daily scale. CHM_PRE again performed the best. Among gauge-based products, NOAA CPC and CN05.1 followed in performance, with GMCP appearing slightly lower. Post-processed satellite products (IMERG-F, TMPA 3B42) outperformed their near-real-time counterparts.
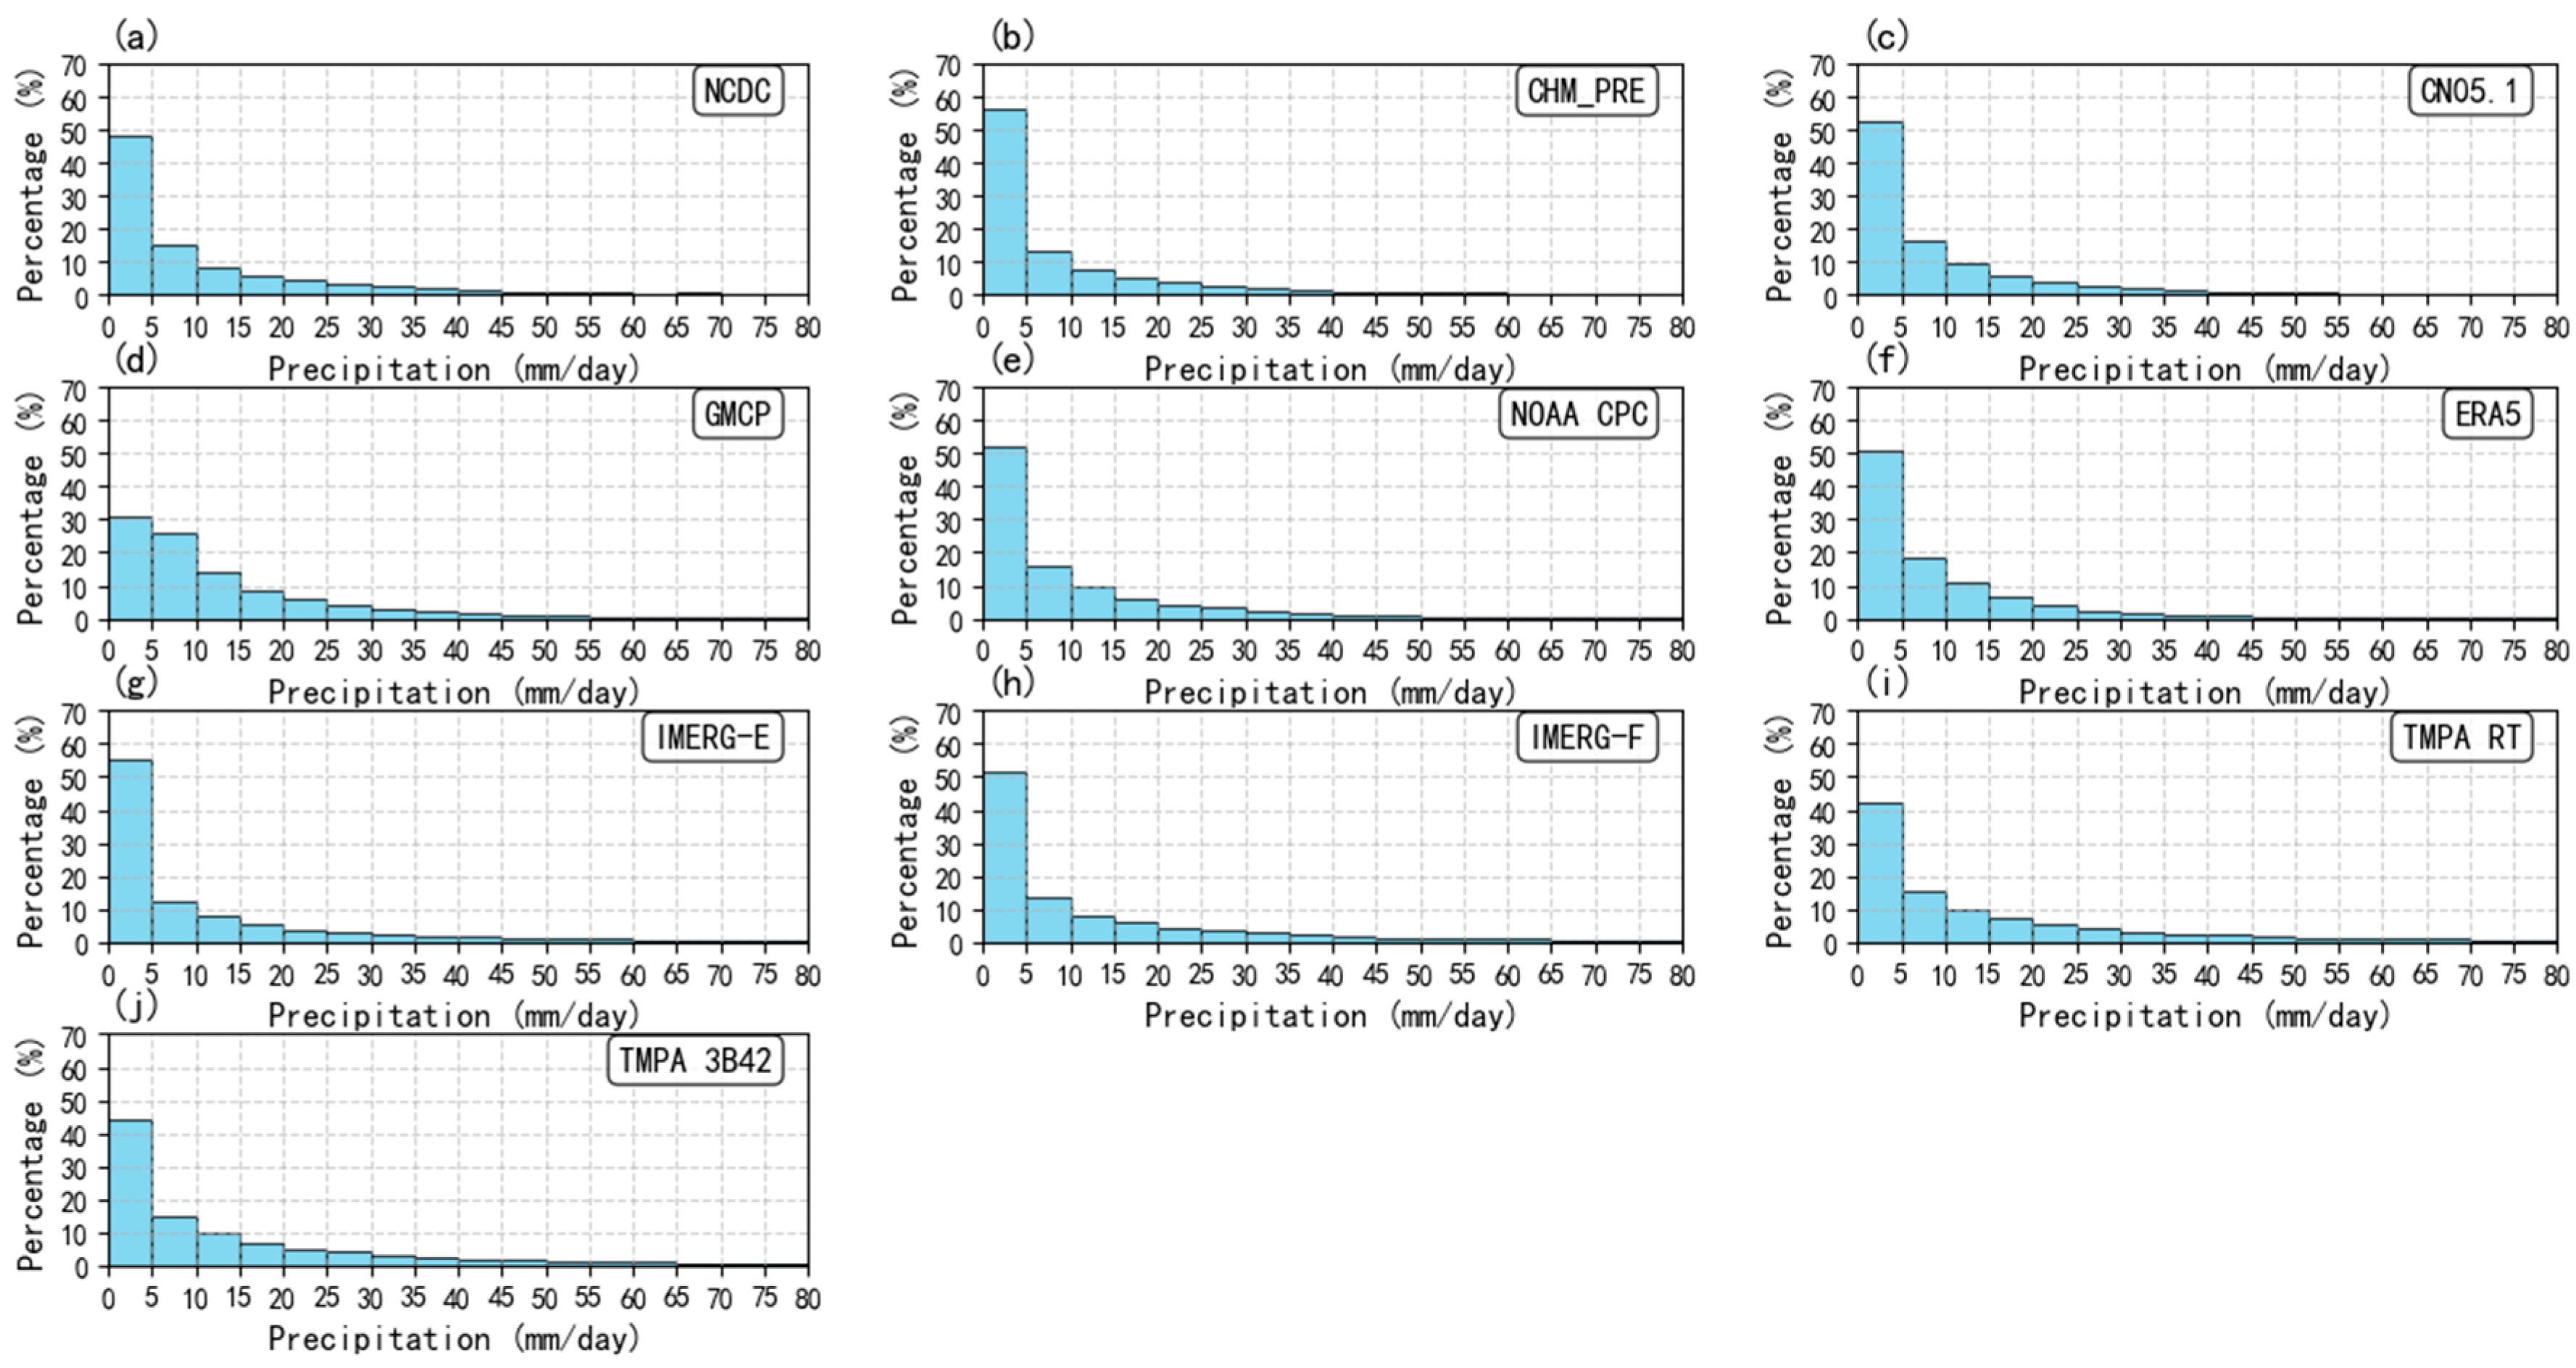
While monthly aggregation substantially improves product consistency, evaluating performance at the daily scale is also important. In particular, examining the frequency distribution of precipitation intensities is critical for applications such as hydrological modeling and extreme-event analysis. Figure 5 presents the frequency distribution of daily precipitation intensities from multiple satellite-based and reanalysis products over Guangdong Province. The histogram represents the percentage of days falling within specific precipitation intensity bins (mm/day). A consistent pattern across all products is the predominance of light precipitation events (≤5 mm/day), with frequencies decreasing rapidly as precipitation intensity increases. However, inter-product discrepancies exist within the ≤5 mm/day interval. Specifically, relative to NCDC, CHM_PRE and IMERG-E exhibit a slight overestimation (positive bias) in this low-intensity range. In contrast, TMPA RT, TMPA 3B42, and GMCP show an underestimation. Furthermore, GMCP exhibits a distinct overestimation at ≥5 mm/day intensity, which is particularly evident in the range of 10–30 mm/day bins, where its frequencies are approximately 1.2 to 1.6 times the NCDC reference. The remaining products display relatively consistent frequency distributions across all intensity intervals.
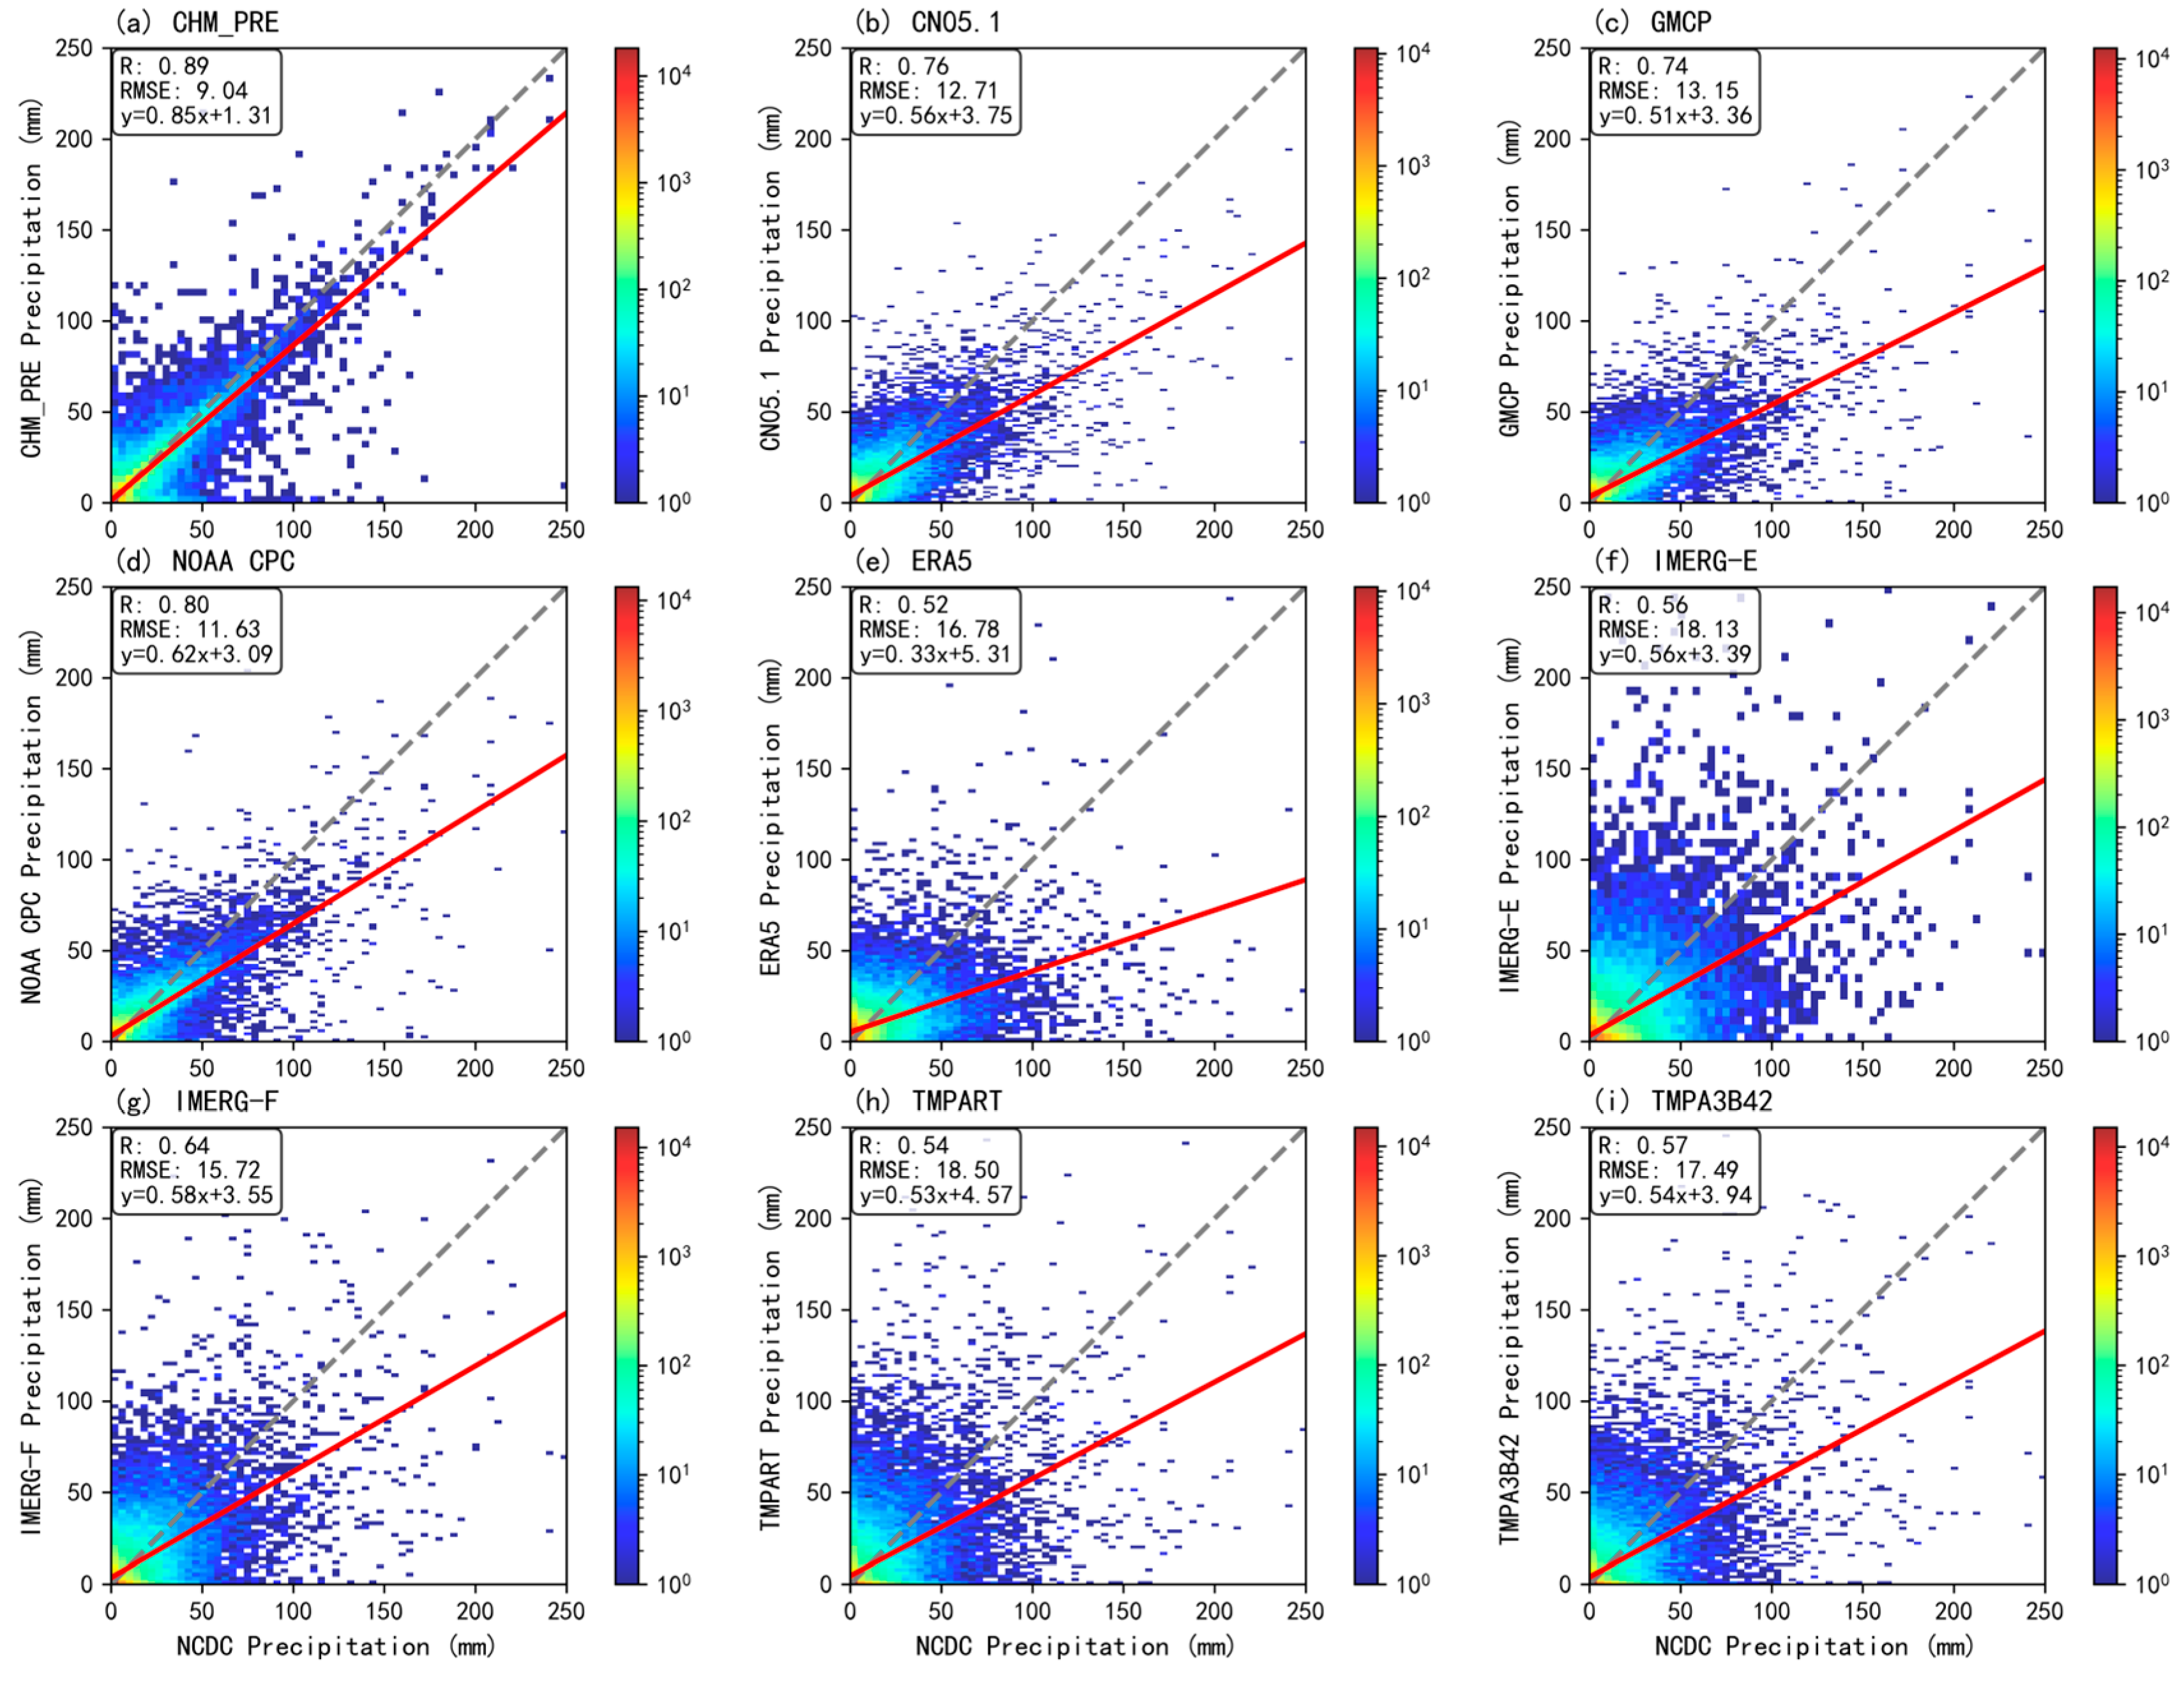
Although frequency distribution analysis can reveal systematic biases between intensity categories, quantifying the accuracy of daily precipitation estimates can provide a more comprehensive evaluation of the performance of this product. It can be used to evaluate whether they can capture the overall magnitude. Figure 6 shows scatter plots that compare the daily precipitation results of multiple precipitation estimation products in the Guangdong region with NCDC. Figure 6 presents scatter plots of daily precipitation from multiple products against NCDC observations. Overall, all products systematically underestimated daily precipitation, with most scatter points falling below the 1:1 line. CHM_PRE performed best, with the highest correlation and the lowest RMSE. NOAA CPC also performed reasonably well but with a more pronounced underestimation. CN05.1 and GMCP showed a moderate performance. Satellite-based products and ERA5 exhibited considerably larger discrepancies and greater dispersion.
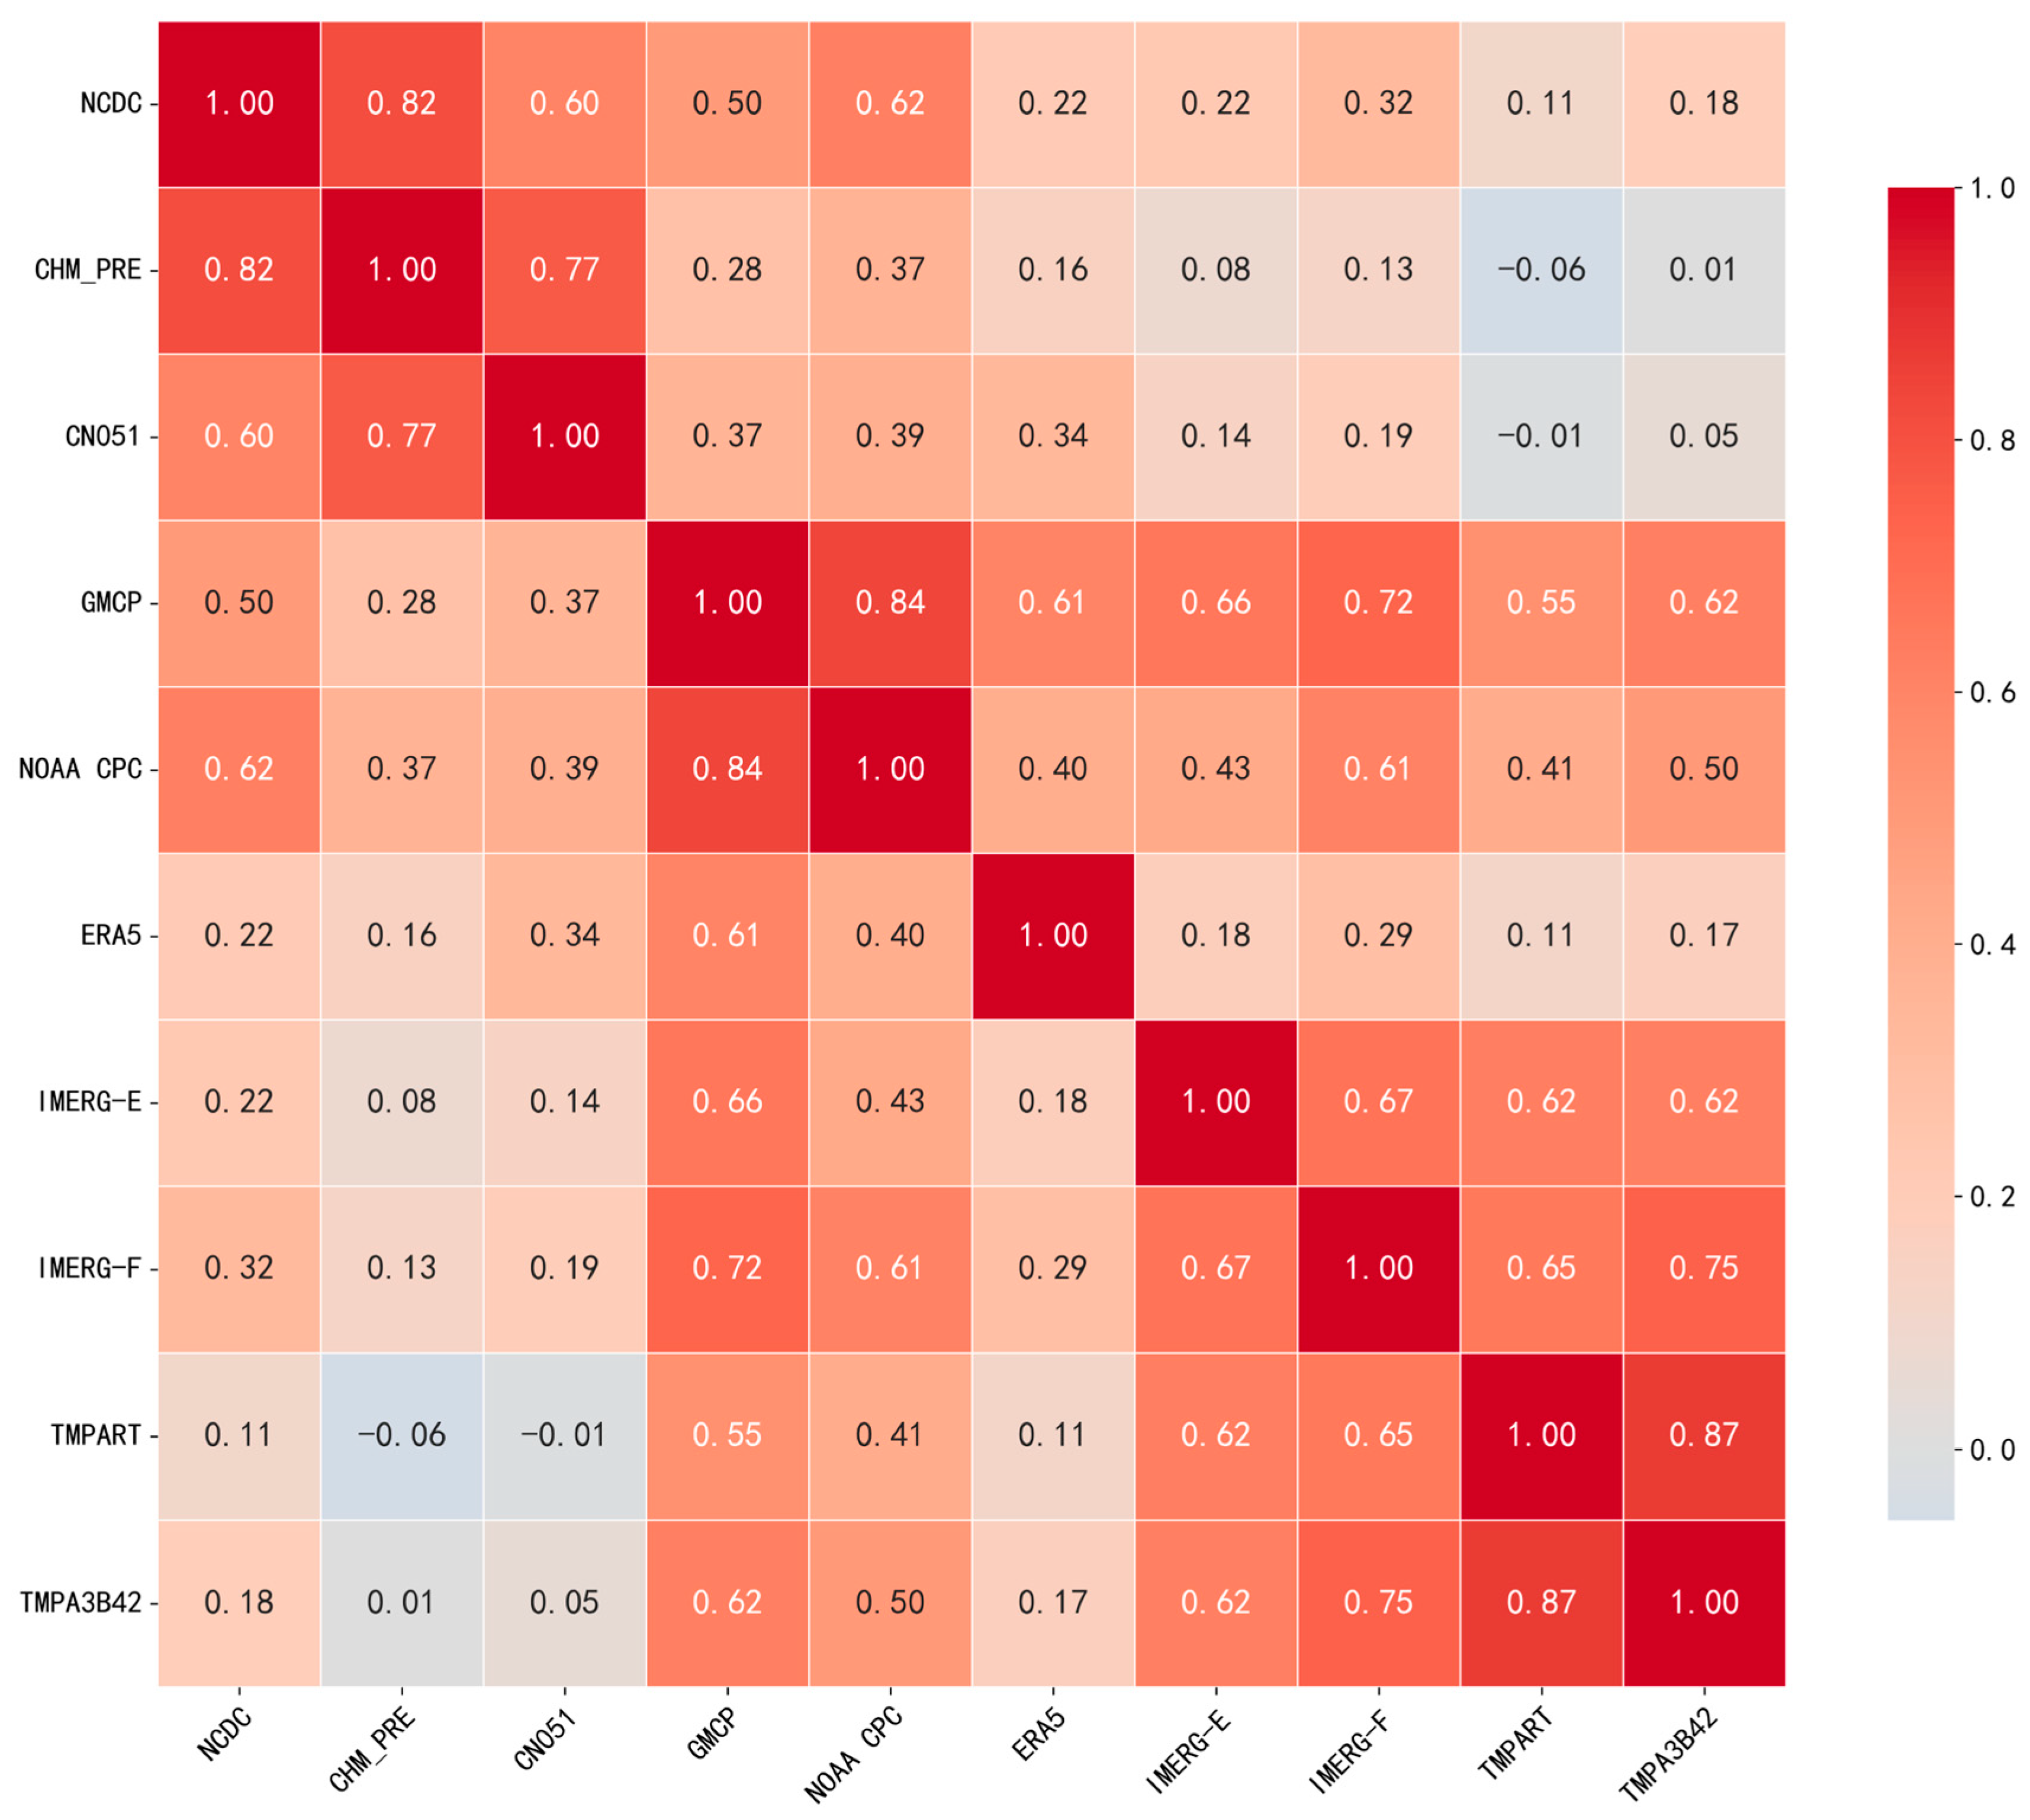
The overall daily precipitation estimation results show a systematic underestimation of various products; it is also necessary to carefully examine whether they can accurately capture extreme precipitation events. It is critical for flood risk assessment and water resource management. Figure 7 presents the correlation heatmap of daily extreme precipitation (≥50 mm) between NCDC gauge observations and other products over Guangdong Province. CHM_PRE showed the highest consistency with NCDC, followed by NOAA CPC, CN05.1, and GMCP. Satellite products and ERA5 showed weak correlations, indicating a limited ability to capture the true intensity of extreme precipitation. Products with similar retrieval algorithms (e.g., TMPA RT and TMPA 3B42) showed high inter-correlations, reflecting consistent biases within algorithm families.
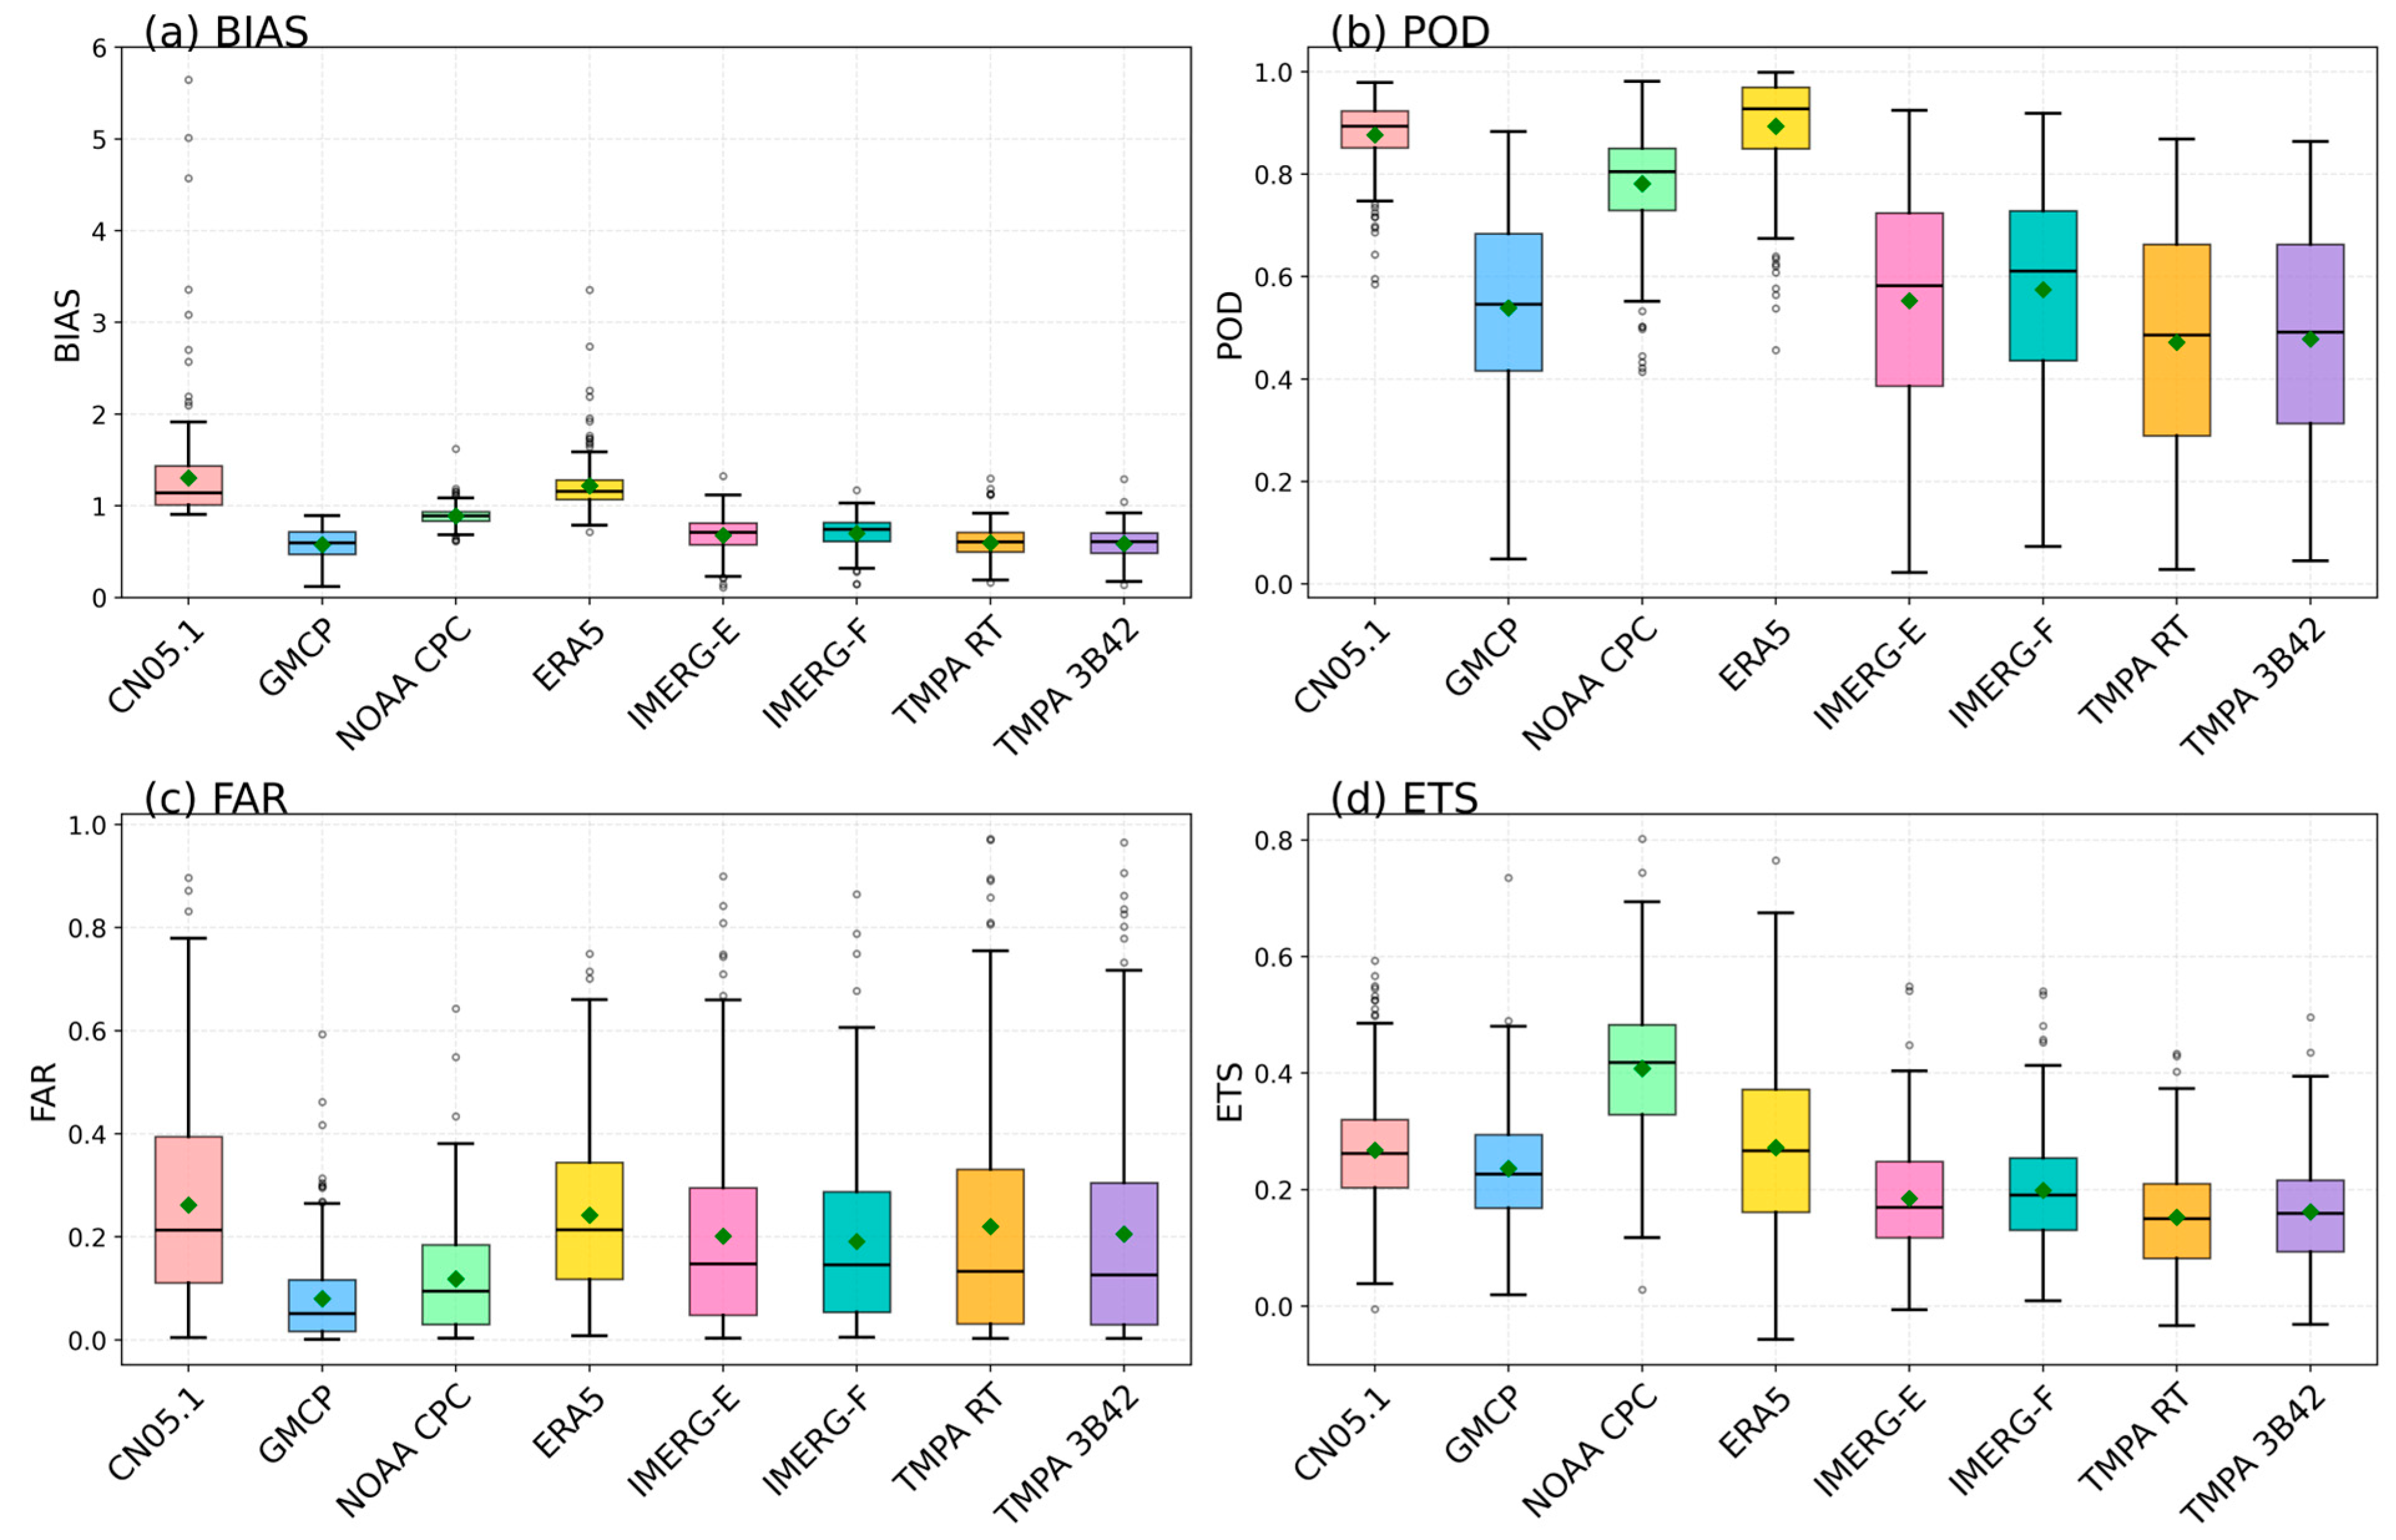
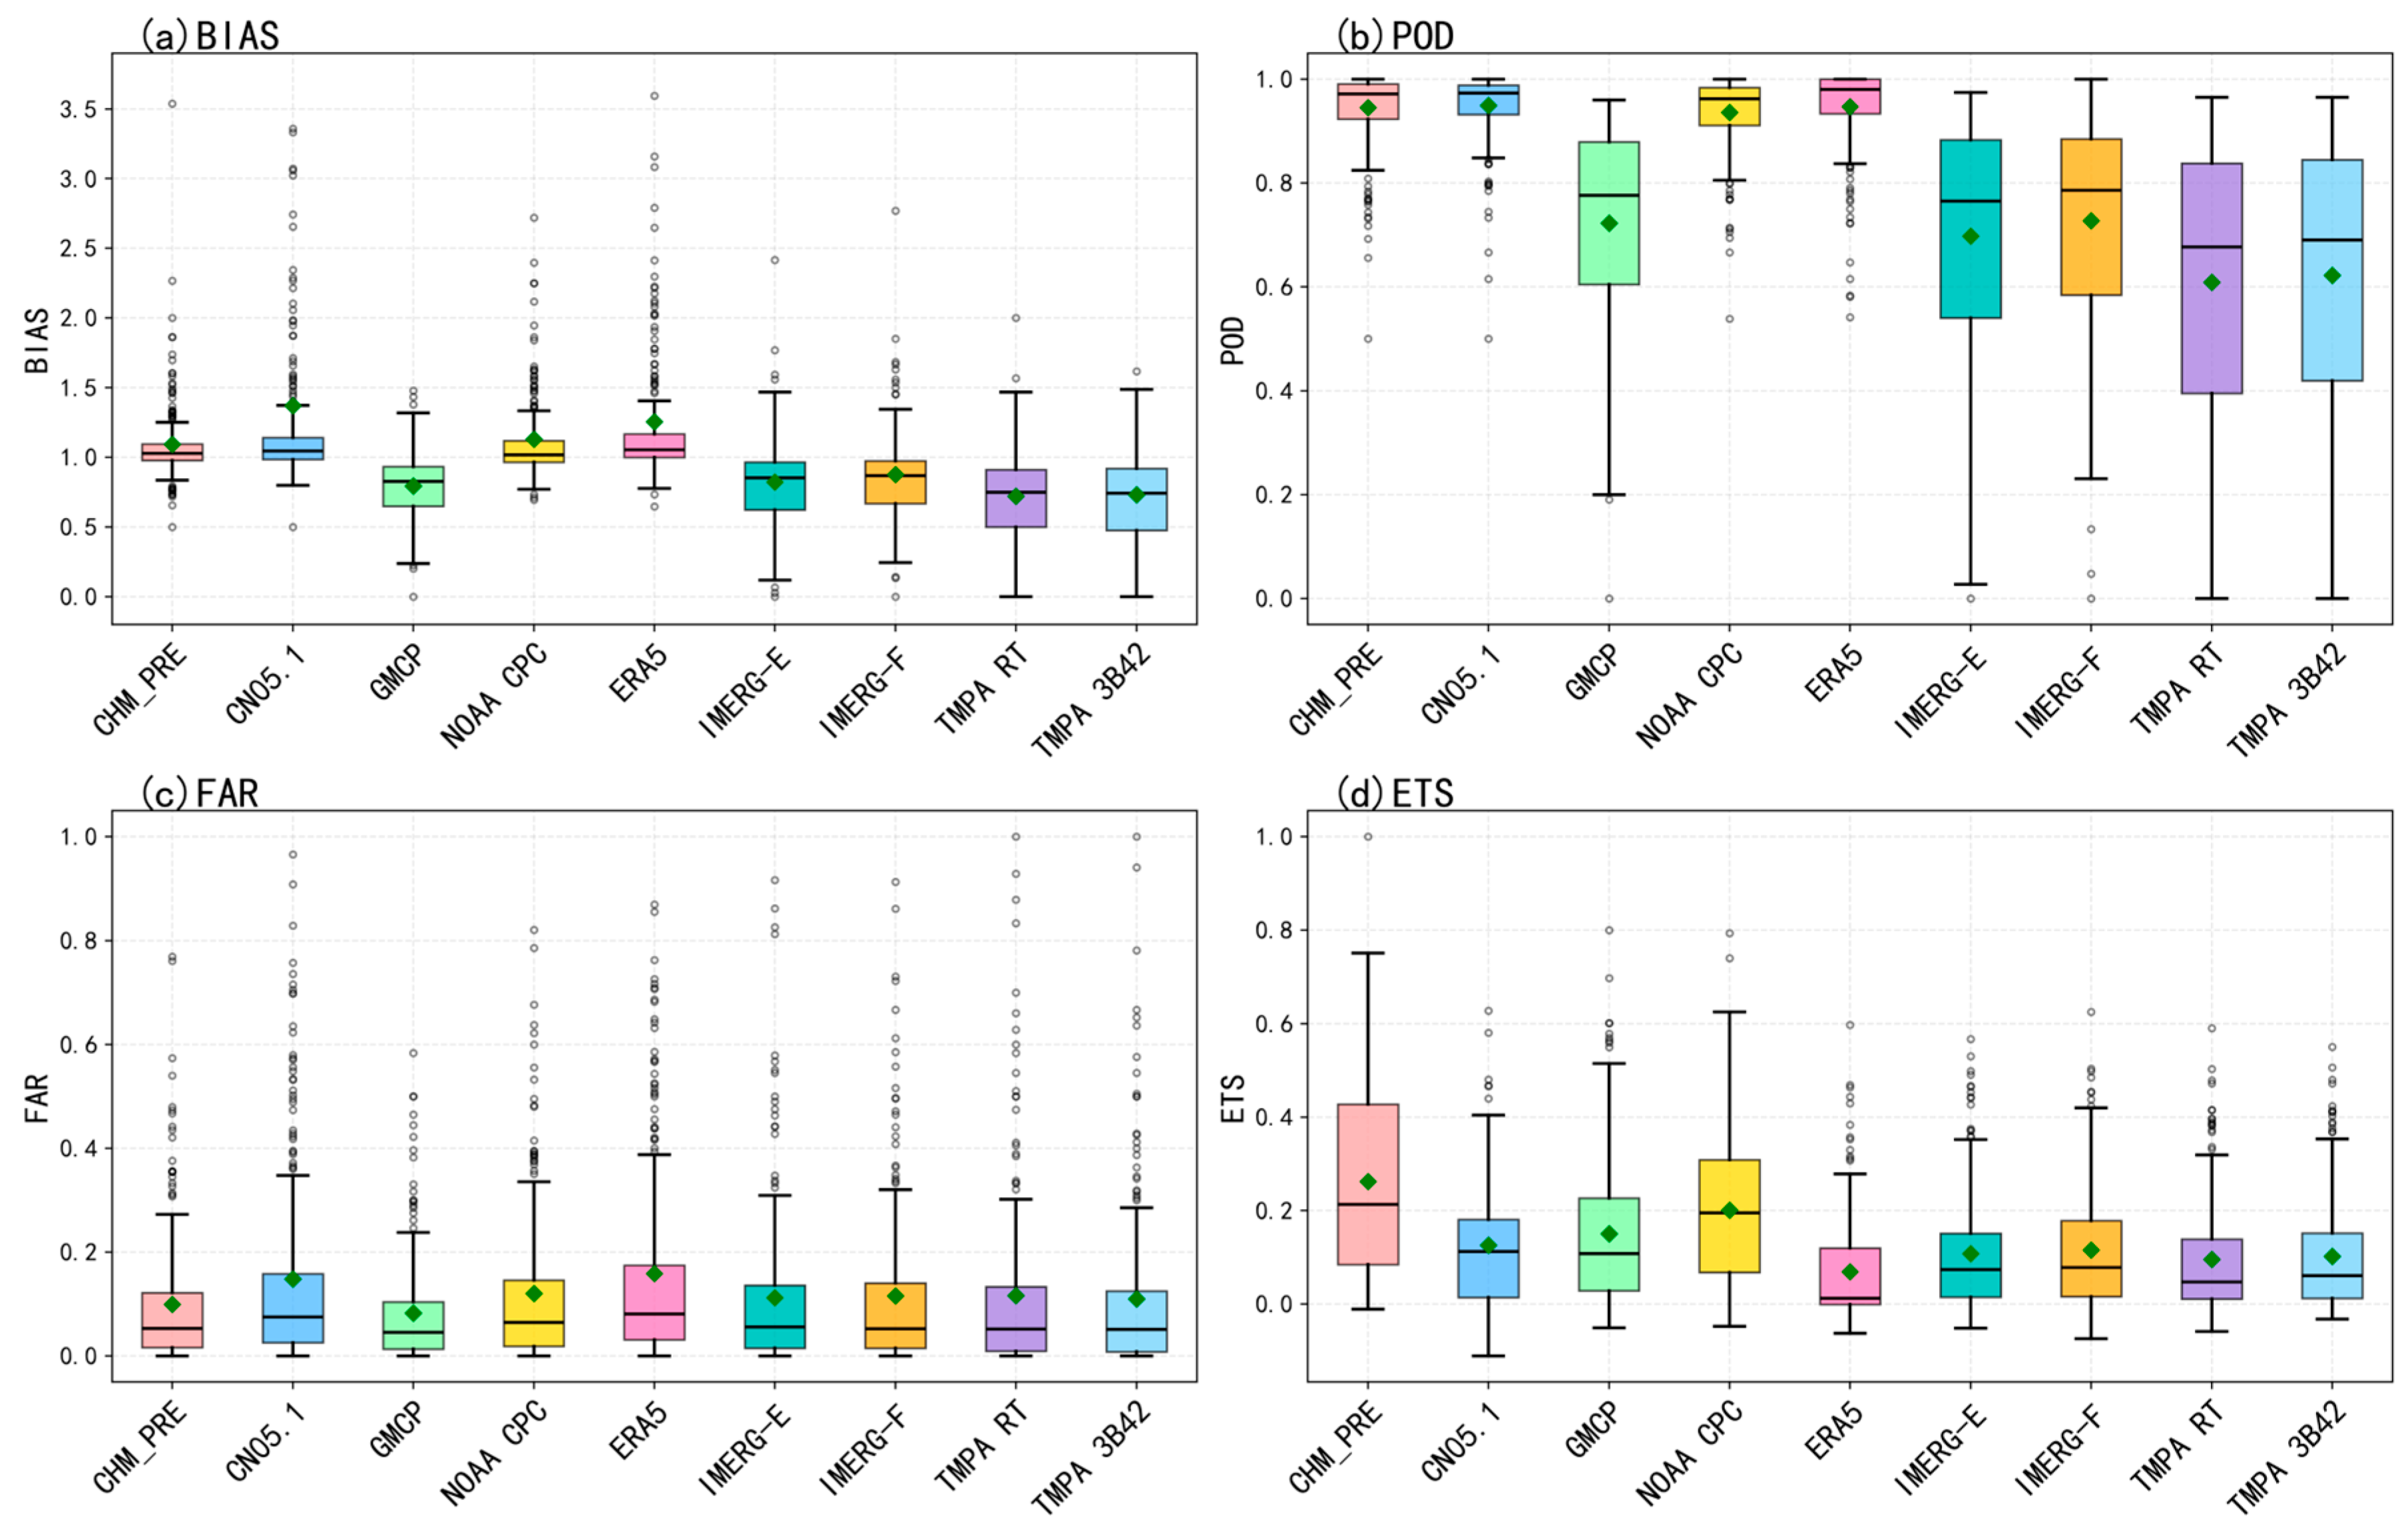
The evaluation of detection capability can provide support for supplementary opinions related to product performance. Indicators such as hit rate and false-alarm rate have been taken into account. Figure 8 presents the categorical statistics (BIAS, POD, FAR, ETS) for daily precipitation events detected by various products against NCDC observations. CHM_PRE demonstrated the most balanced and reliable overall performance, achieving the highest mean ETS (0.26) and a high POD (0.95). NOAA CPC and CN05.1 also performed well in event detection, with mean POD values of 0.94 and 0.95 and mean ETS values of approximately 0.20 and 0.13, respectively. GMCP showed the lowest mean FAR (0.08) among all products, but its detection capability was notably weaker, with a mean POD of only 0.72 and a mean ETS around 0.15, confirming the systematic underestimation of precipitation event frequency. The IMERG products showed a moderate but unstable performance, while the TMPA products displayed the poorest overall performance, with the lowest mean POD (0.61–0.62) and mean ETS (0.10–0.11). ERA5 showed a unique pattern: it achieved a high mean POD (0.95), comparable to the best-performing products, but its mean ETS was only 0.07, the lowest among all products, due to its high false-alarm rate and substantial variability.
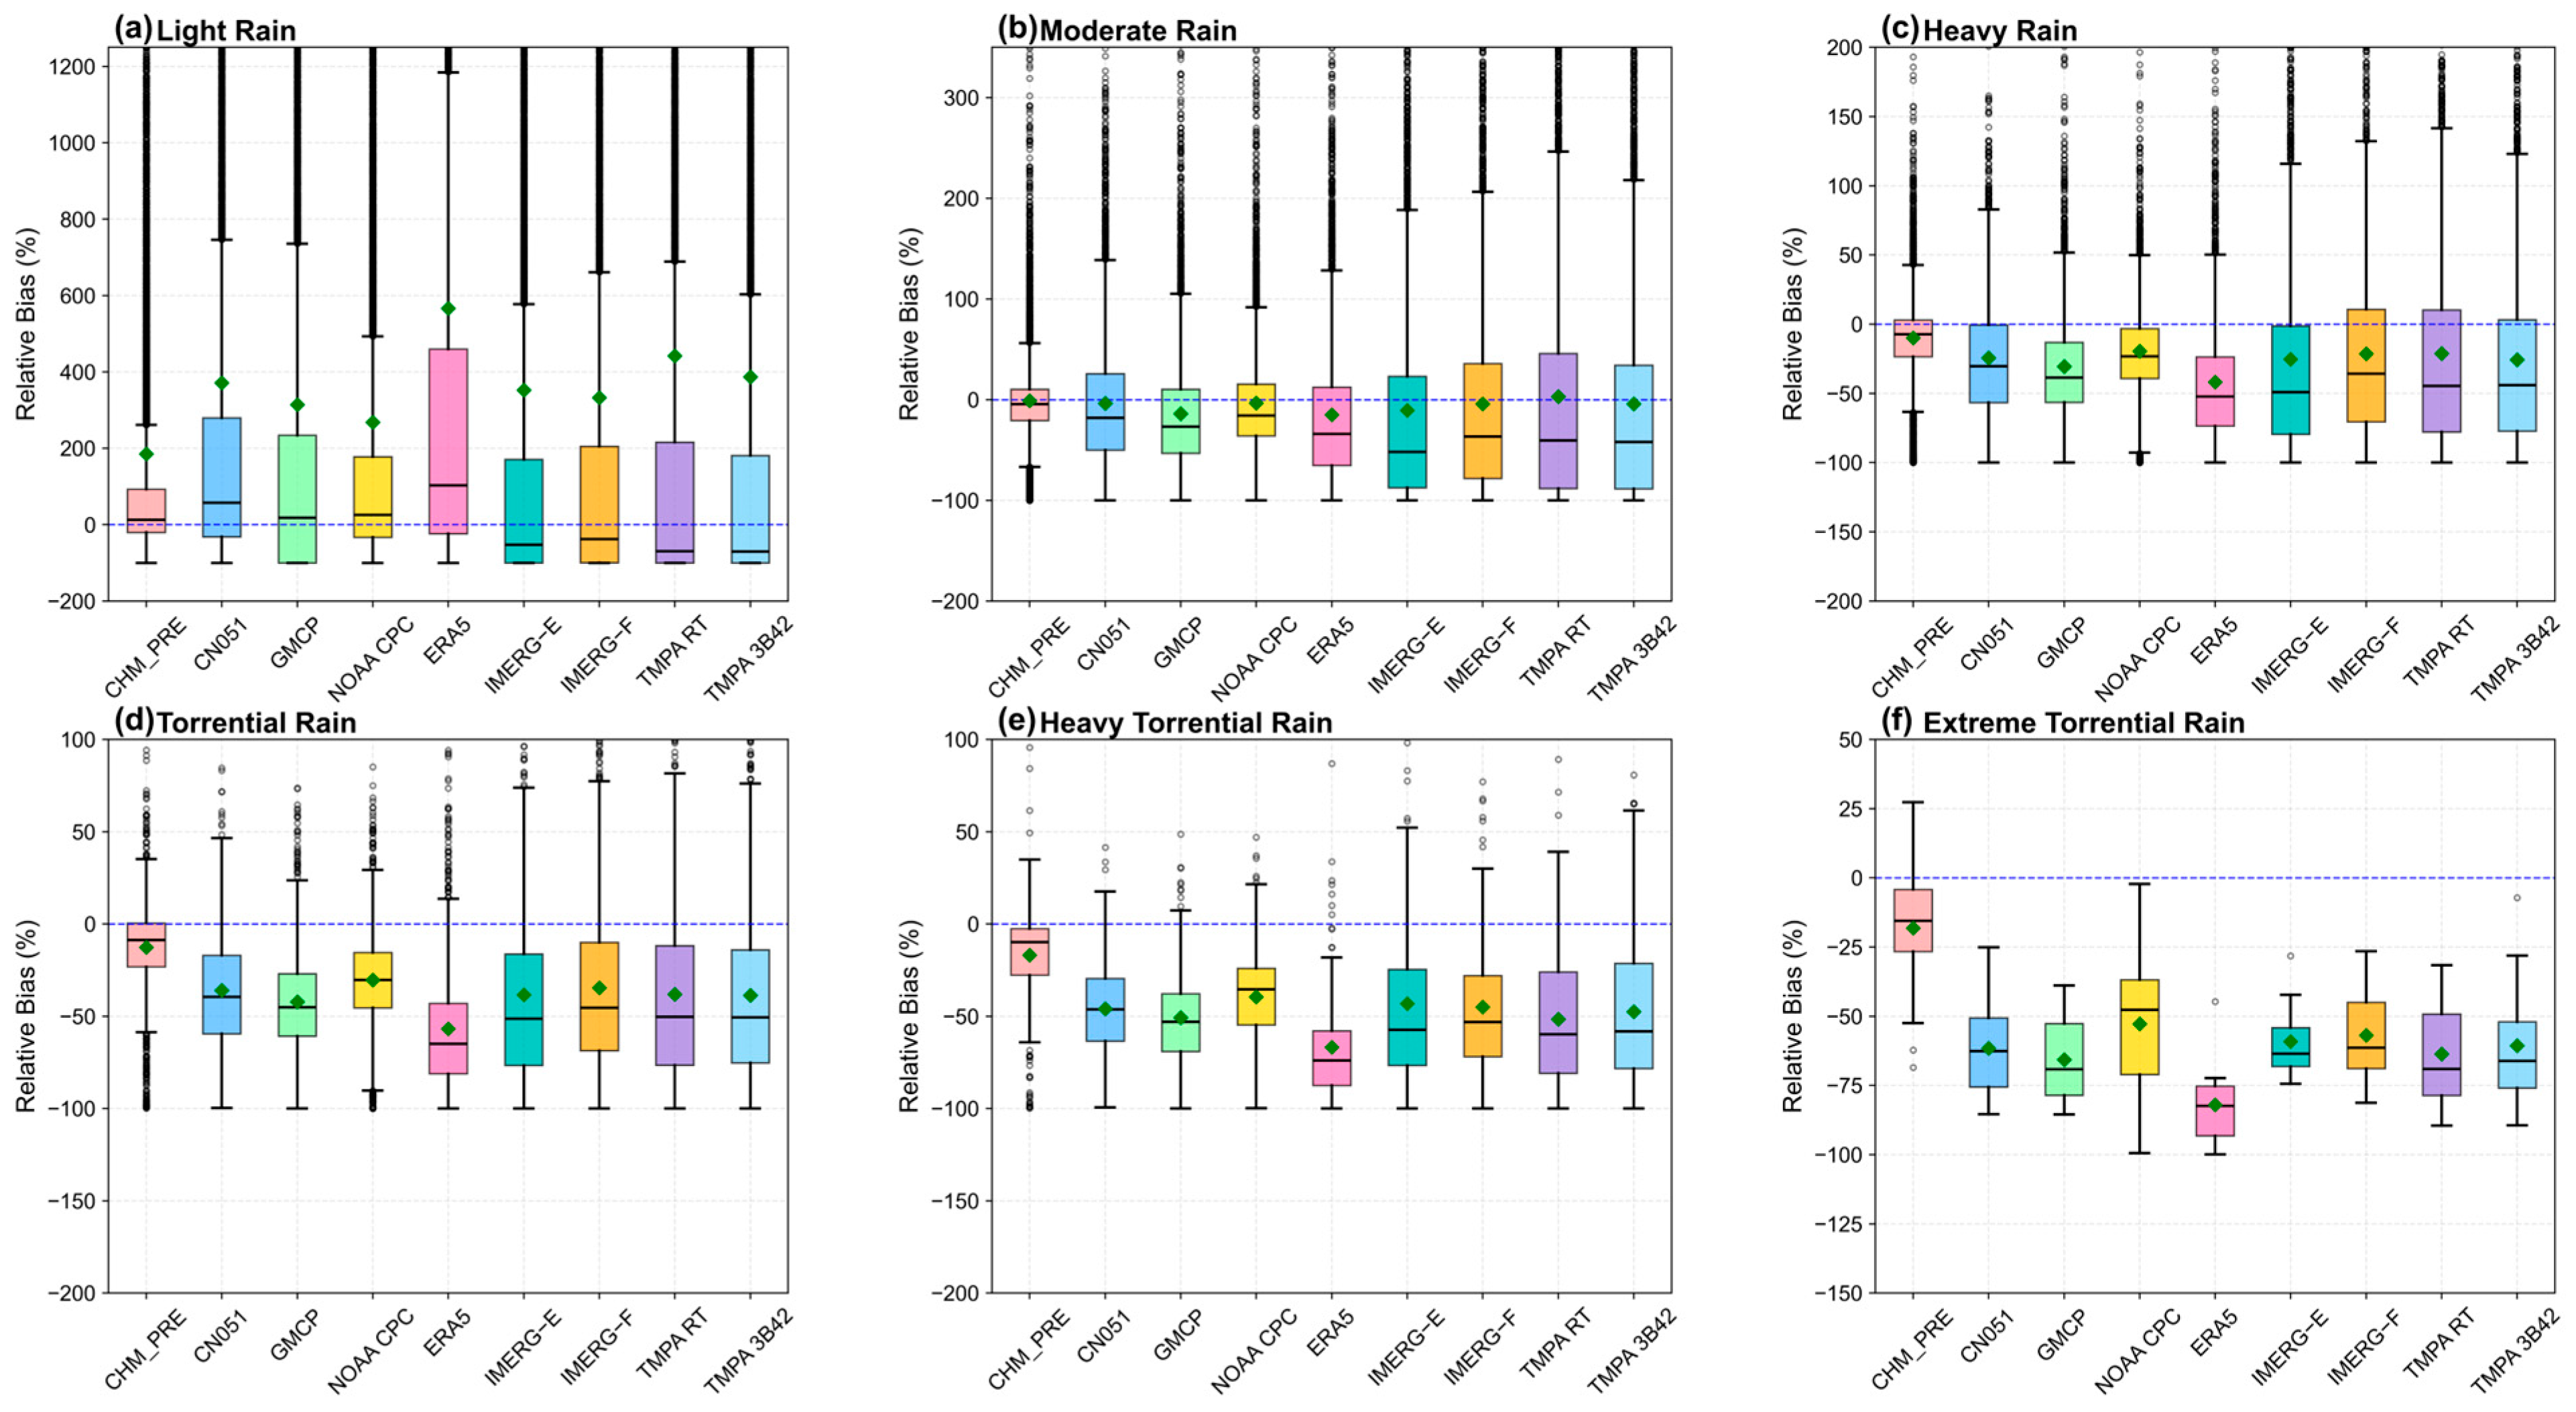
Beyond the ability to detect precipitation events, understanding how products perform across different rainfall intensity categories is essential for identifying systematic biases and their underlying causes. Figure 9 shows the relative bias of different precipitation products across six rain-intensity categories: light, moderate, heavy, torrential, heavy torrential, and extreme torrential rain. This provides insights into their systematic errors under varying rainfall magnitudes. The overall performance of CHM_PRE is considered the most balanced. The relative deviation values at different intensity levels are mostly closest to zero. During light rain, there is a positive deviation in CHM_PRE, with a median value of 12.5%, indicating that it tends to overestimate weak precipitation in typical cases (the mean of 184.9% is inflated by extreme outliers). In the category of moderate to extreme torrential rain, its median relative deviation is between −15.5% and −4.3%, which can be seen as slight to moderate but always underestimated. The performance of NOAA CPC is also good. There is a clear positive deviation in light rain, with a median of 25.6%. When the precipitation level is heavier, the median bias becomes negative, ranging from −15.7% to −35.4% for moderate to heavy torrential rain. However, the deviation turns sharply more negative in extreme rainstorm, with a median of −47.7%. Satellite-related products such as IMERG-E, IMERG-F, TMPA RT, and TMPA 3B42 exhibit significant negative deviations in all strength levels. In the case of light rain, the means are highly positive, indicating an overall overestimation, but the median relative bias values between −70.6% and −37.5%, indicating that at least half of the light-rain events are underestimated or missed entirely (the distributions are strongly right-skewed). For moderate to heavy rain categories, these satellite products continue to show substantial negative biases (median values between −52.0% and −35.8%), with large standard deviations generally exceeding 70% (with IMERG-F at 66.2% for heavy rain), reflecting highly inconsistent performances across events. Among satellite products, IMERG-F generally exhibits the least negative bias, while TMPA RT and TMPA 3B42 show the strongest underestimation. GMCP and CN05.1 demonstrate moderate performances, with systematic negative biases across all intensity categories except light rain. For light rain, GMCP shows a mean relative bias of 314.3% but a median of 17.7%, indicating a strongly right-skewed distribution with occasional extreme overestimates. For moderate to extreme torrential rain categories, both products maintain negative median relative bias values between −69.1% and −18.1%, with relatively low variability (standard deviations typically below 70%), suggesting a consistent but persistent underestimation of moderate to extreme precipitation events. ERA5 exhibits a distinct pattern: it shows the highest positive bias for light rain, with a median of 103.3%. For heavy torrential and extreme torrential rain, it shifts to the most negative bias, with median values ranging from −73.9% to −82.3%. These results indicate a systematic tendency to overestimate weak precipitation while severely underestimating intense events. This intensity-dependent bias pattern is particularly pronounced for ERA5.
The performance of CHM_PRE in capturing long-term trends is superior to all other datasets, and statistical tests show significant differences (p < 0.05). Its correlation with NCDC observation data ranks first on multiple timescales, with an annual correlation coefficient R of 0.99, a monthly correlation coefficient of 0.99, and a daily correlation coefficient of 0.89. And regardless of the time aggregation method, its root mean square error is the lowest. CHM_PRE performs relatively evenly in detecting extreme precipitation events, with a correlation coefficient of 0.82. Its critical success index ETS remains stable at 0.26, and its hit rate POD can also be maintained at around 0.95. In addition, its error in dividing by precipitation type is also the smallest among all schemes. Combined with strong spatial consistency and low systematic bias, it is the most reliable tool for displaying precipitation characteristics in Guangdong. CHM_PRE performs well in both temporal and spatial dimensions in the comprehensive evaluation, making it a reference benchmark for comparing other precipitation products in the Guangdong region.

3.2. Spatial Comparison with CHM_PRE

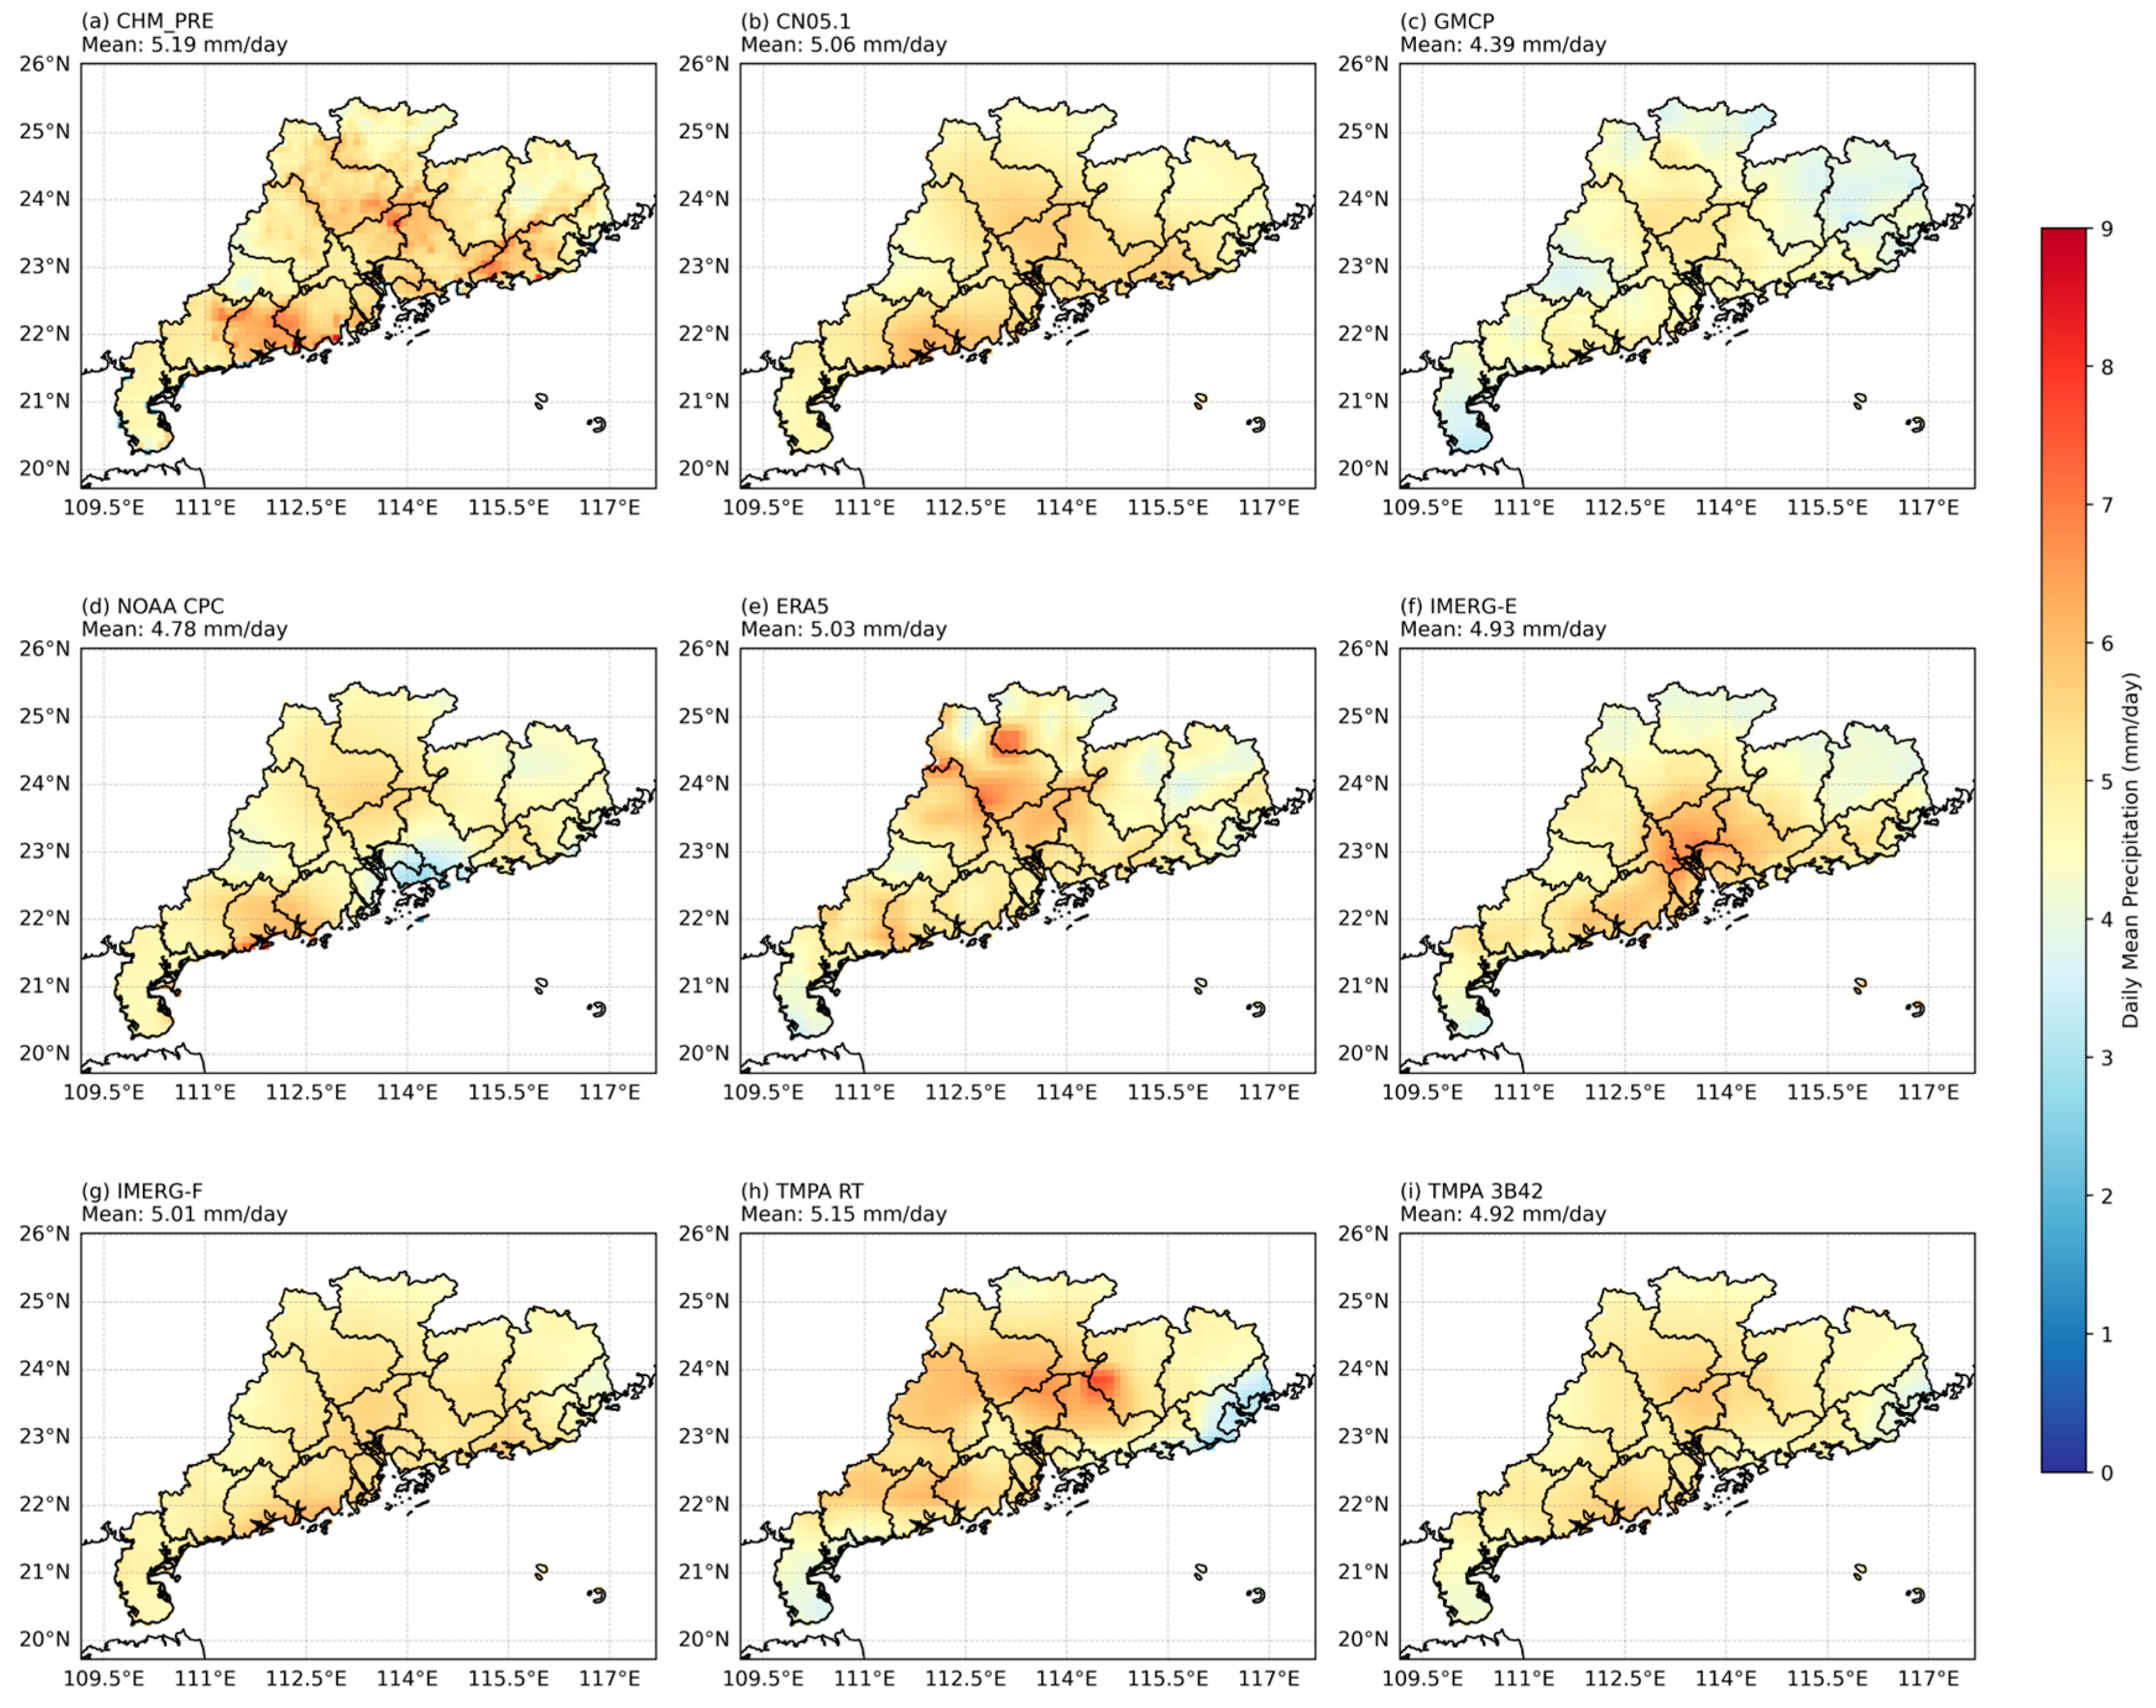
The preceding station-based evaluation (Section 3.1) identified CHM_PRE as the product with the highest temporal agreement with independent NCDC gauge observations. However, station-based validation alone cannot assess spatial pattern fidelity, as gauge networks provide only point-scale information. To evaluate the ability of other products to reproduce the spatial distribution of precipitation, a spatially continuous reference field is required. CHM_PRE was selected for this purpose based on its demonstrated superiority in the station-based evaluation. It is important to acknowledge that CHM_PRE, as an interpolated gridded product, is not a true ground truth and may contain uncertainties inherited from station density, interpolation methods, and topographic complexity. Nevertheless, given its dense underlying station network and demonstrated temporal fidelity, it represents the most reliable spatially continuous precipitation field currently available for Guangdong Province. The following spatial comparisons should therefore be interpreted as assessments of consistency between products, rather than absolute error measurements against an independent truth. In order to understand the spatial performance of different precipitation products in various regions of Guangdong, we compare the spatial distribution of daily average precipitation. In the previous evaluation, CHM_PRE performed well, so it was used as reference data. Figure 10 presents the spatial distribution of daily average precipitation in Guangdong Province, which was calculated through various related products, with CHM_PRE as the reference data. Overall, the daily average precipitation values calculated by most products are roughly consistent with the 5.19 mm/day value of CHM_PRE. However, spatial differences and systematic biases exist among different dataset types. TMPA RT shows the closest mean value to CHM_PRE (5.19 mm/day), followed by IMERG-F (5.01 mm/day) and CN05.1 (5.06 mm/day). These results indicate that this product has a good capture effect on total precipitation at the regional scale. For ERA5, the daily average precipitation can reach 5.03 mm/day. Although some deficiencies in the analysis of extreme events have not been addressed before, it is not a problem to compare the average intensity. The daily average precipitation of GMCP is the lowest, only 4.39 mm/day, which is about 15% less than that of CHM_PRE, indicating a systematic underestimation. The daily average precipitation of NOAA CPC is 4.78 mm/day and TMPA 3B42 is 4.92 mm/day, both of which have significant negative deviations. The daily average precipitation of IMERG-E is 4.93 mm/day, slightly lower than the reference value. From a spatial perspective, the gauge-based and high-quality gridded products (CHM_PRE, CN05.1, and NOAA CPC) display generally similar spatial patterns, with higher precipitation amounts concentrated in northern and southern Guangdong. The satellite-based products (IMERG-E, IMERG-F, TMPA RT, and TMPA 3B42) capture the general spatial gradient but tend to exhibit smoother spatial patterns with reduced local variability compared to the gauge-based products, which is visually evident from the more continuous and less patchy distributions in their maps. ERA5 shows a spatial distribution that generally aligns with the gauge-based products, with persistent underestimation in the northern and southern high-precipitation regions. GMCP captures the overall spatial pattern of precipitation. However, it consistently underestimates precipitation across most of the province. The underestimation is particularly pronounced in the northern parts.
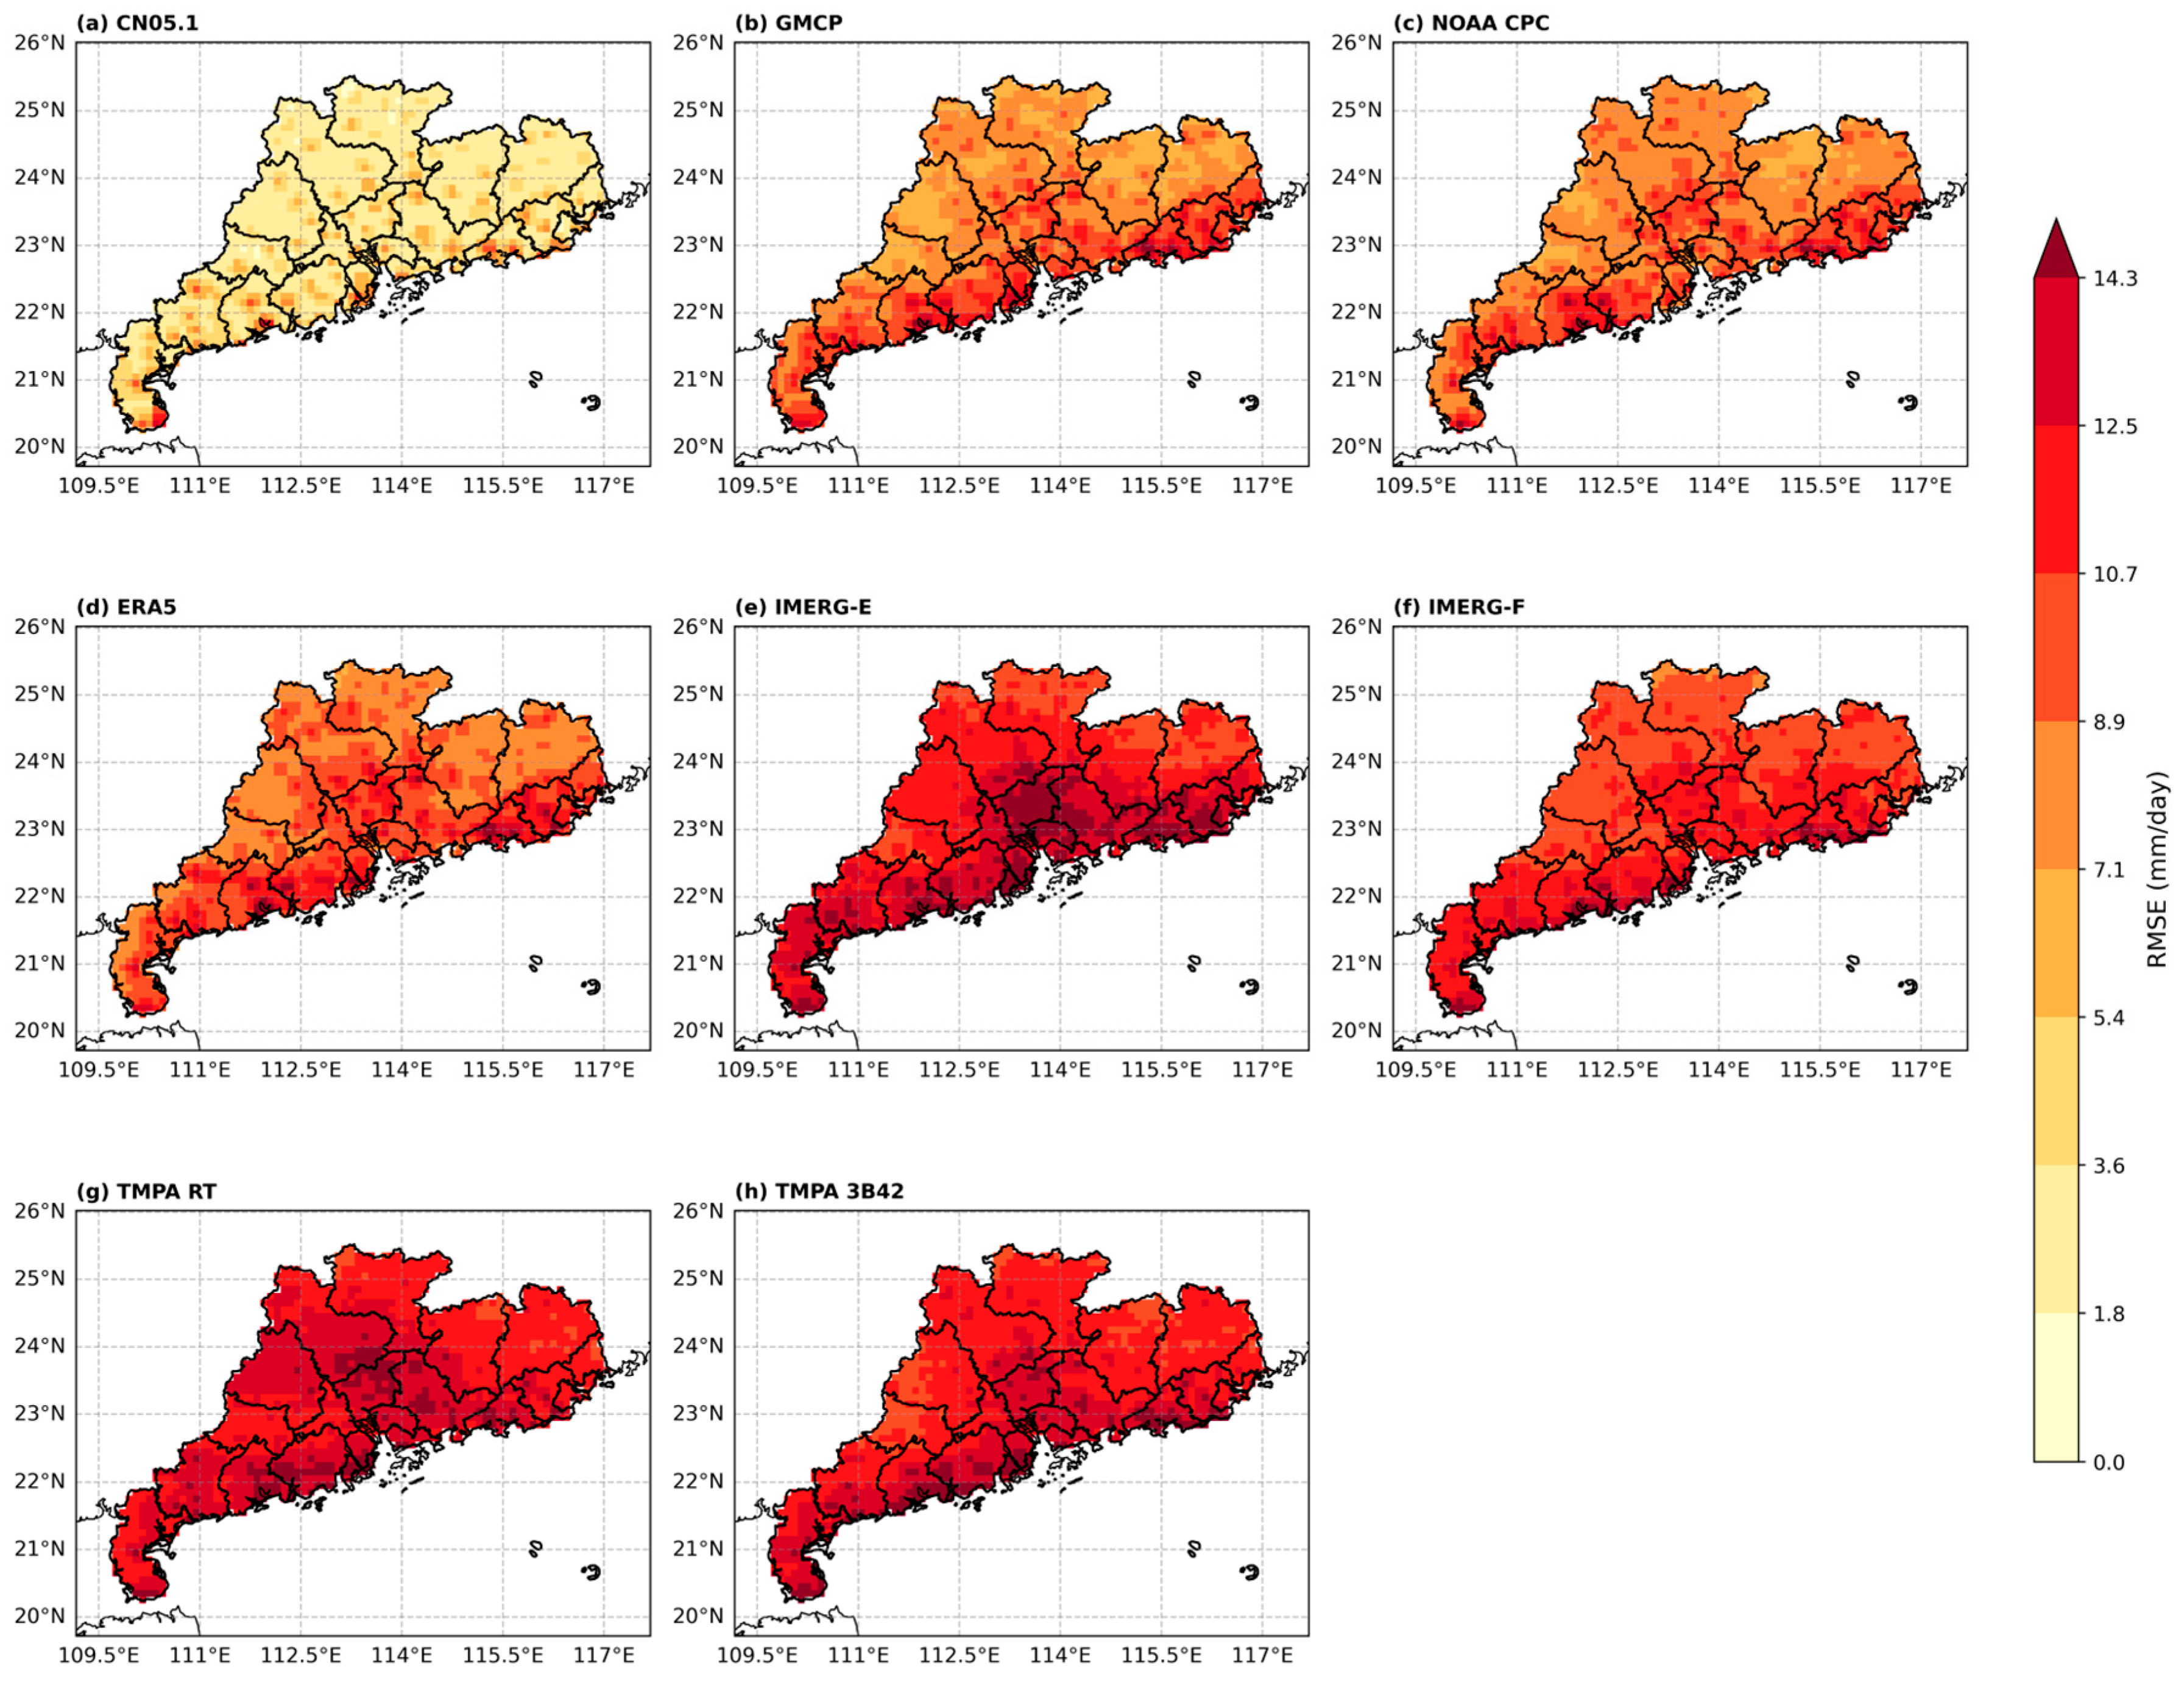
Quantifying the magnitude of local deviations from CHM_PRE is essential for assessing their reliability in capturing spatial details. Figure 11 presents the spatial distribution of the daily root mean square error (RMSE) of various precipitation products relative to CHM_PRE over Guangdong Province. Higher RMSE values indicate greater deviations from the reference dataset. Overall, the RMSE patterns exhibit similar regional characteristics across products, but with significant differences in magnitude, reflecting their varying capabilities in reproducing the spatial details captured by CHM_PRE. With the exception of CN05.1, all products display a pronounced “high in the south, low in the north” spatial pattern. CN05.1 shows the lowest RMSE values across most of the province, ranging from 1.8 to 3.6 mm/day, indicating the highest consistency with CHM_PRE. GMCP exhibits higher RMSE values, ranging from 5.4 to 8.9 mm/day in the northern region and 8.9 to 12.5 mm/day in the southern region. NOAA CPC presents value ranges of 7.1–8.9 mm/day in the north and 8.9–12.5 mm/day in the south. ERA5 shows RMSE value ranges of 7.1–10.7 mm/day in the north and 8.9–12.5 mm/day in the south. IMERG-E has a value range of 10.7–12.5 mm/day in the north, with localized areas exceeding 12.5 mm/day in the south. IMERG-F ranges from 8.9 to 12.5 mm/day in the north and 10.6 to 12.5 mm/day in the south. In addition, TMPA RT shows RMSE values in the range of 10.7–14.3 mm/day in the north, with a localized high-value zone exceeding 14.1 mm/day in the central region, while the south ranges between 12.4 and 14.1 mm/day. TMPA 3B42 exhibits values in the range of 10.7–12.5 mm/day in the north and generally above 12.5 mm/day in the south. These results indicate that CN05.1 demonstrates the highest applicability with CHM_PRE in Guangdong Province, whereas satellite and reanalysis products show significantly larger errors in the complex terrain of the southern region.
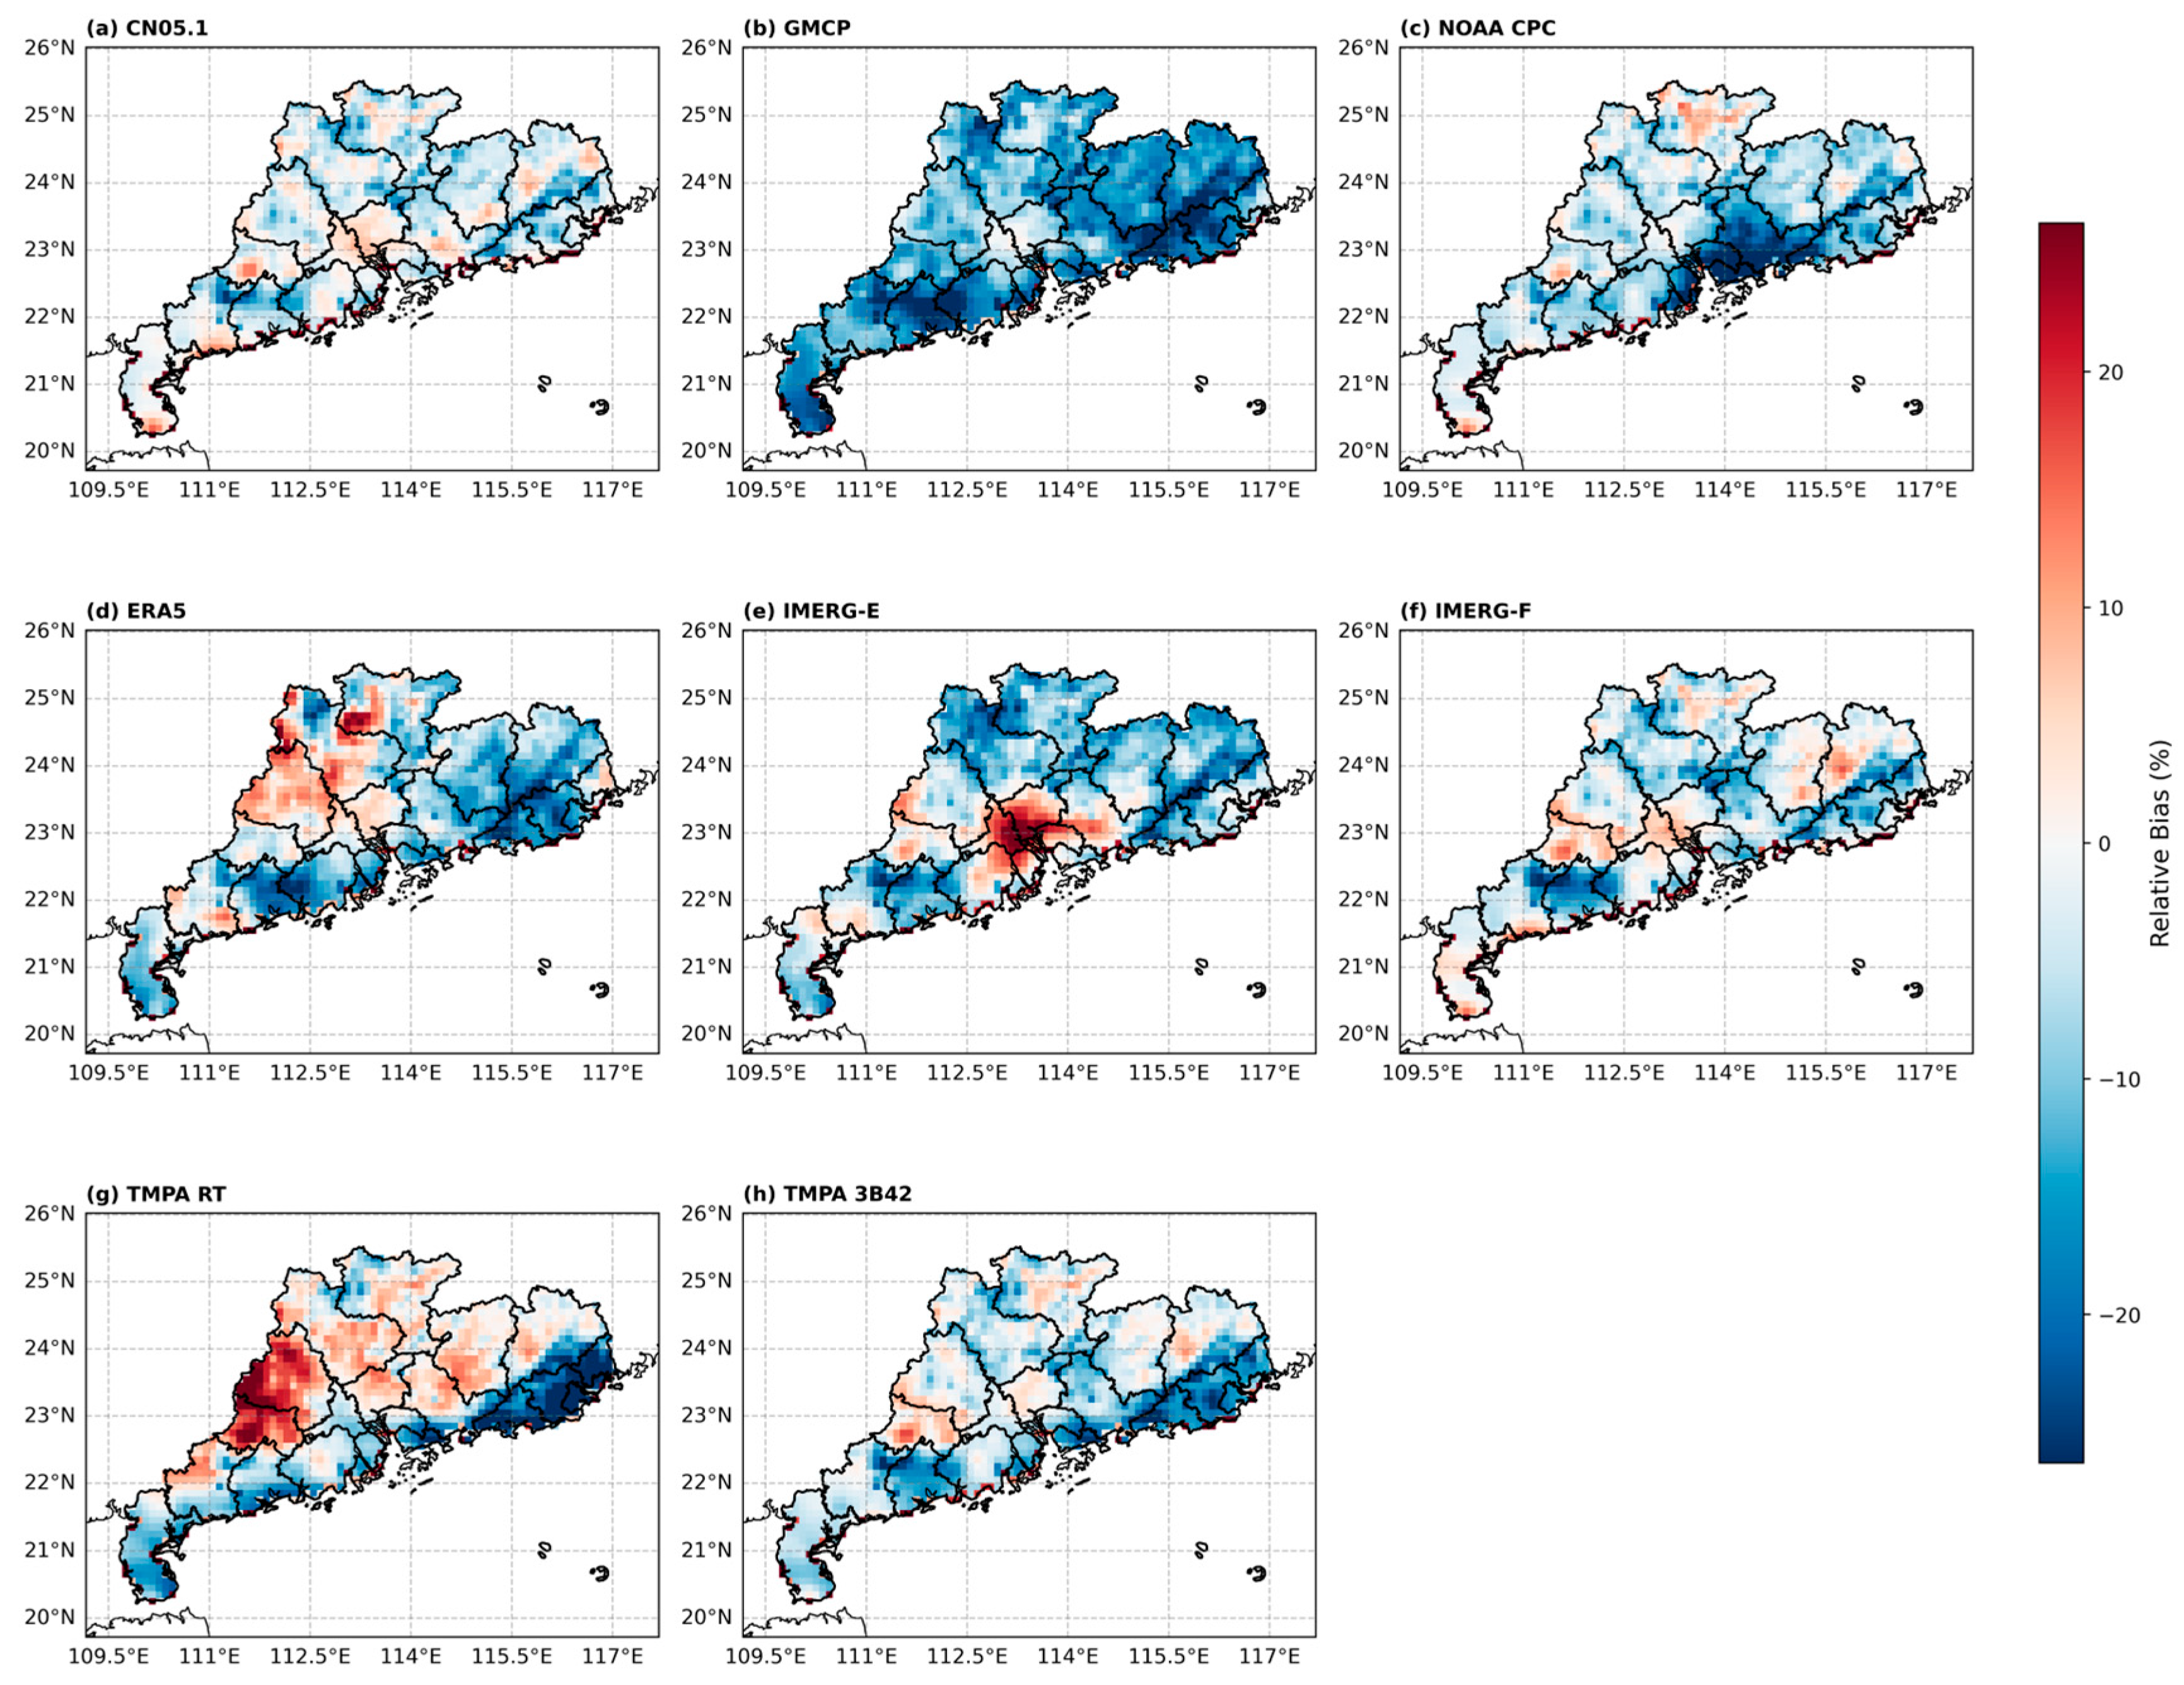
Figure 12 presents the spatial distribution of the daily relative bias of various precipitation products relative to CHM_PRE over Guangdong Province. Positive and negative values indicate overestimation and underestimation, respectively, with larger absolute values reflecting greater systematic deviations. Overall, distinct spatial patterns are observed across products, highlighting their varying biases in capturing the spatial distribution of precipitation. CN05.1 exhibits the smallest relative bias, with values ranging between −10% and 10% across most of the province, demonstrating the highest consistency with CHM_PRE. GMCP is characterized by negative bias values from −20% to −10% over most areas, with bias near zero in some regions and no significant overestimation. NOAA CPC shows a localized extreme negative bias below −20% in the south-central region, with limited overestimation ranging from 0% to 10%. ERA5 displays predominant overestimation (above 10%) in the northwest and underestimation (from −20% to −10%) in the southeast. IMERG-E exhibits bias values from −20% to −10% in the north and localized overestimation exceeding 20% in the south. IMERG-F shows a relatively balanced distribution of bias, with positive bias mainly between 0% and 10% and negative bias mainly between −10% and 0%. TMPA RT is characterized by overestimation in the north, with a high-value zone exceeding 20% in the northwest, and underestimation in the south, with values below −20% in the southeast. TMPA 3B42 exhibits only limited areas of positive bias, with underestimation prevailing in the south, mostly below −10%. Overall, CN05.1 demonstrates the smallest and most stable bias across Guangdong Province, whereas reanalysis and satellite products exhibit pronounced regional systematic biases.
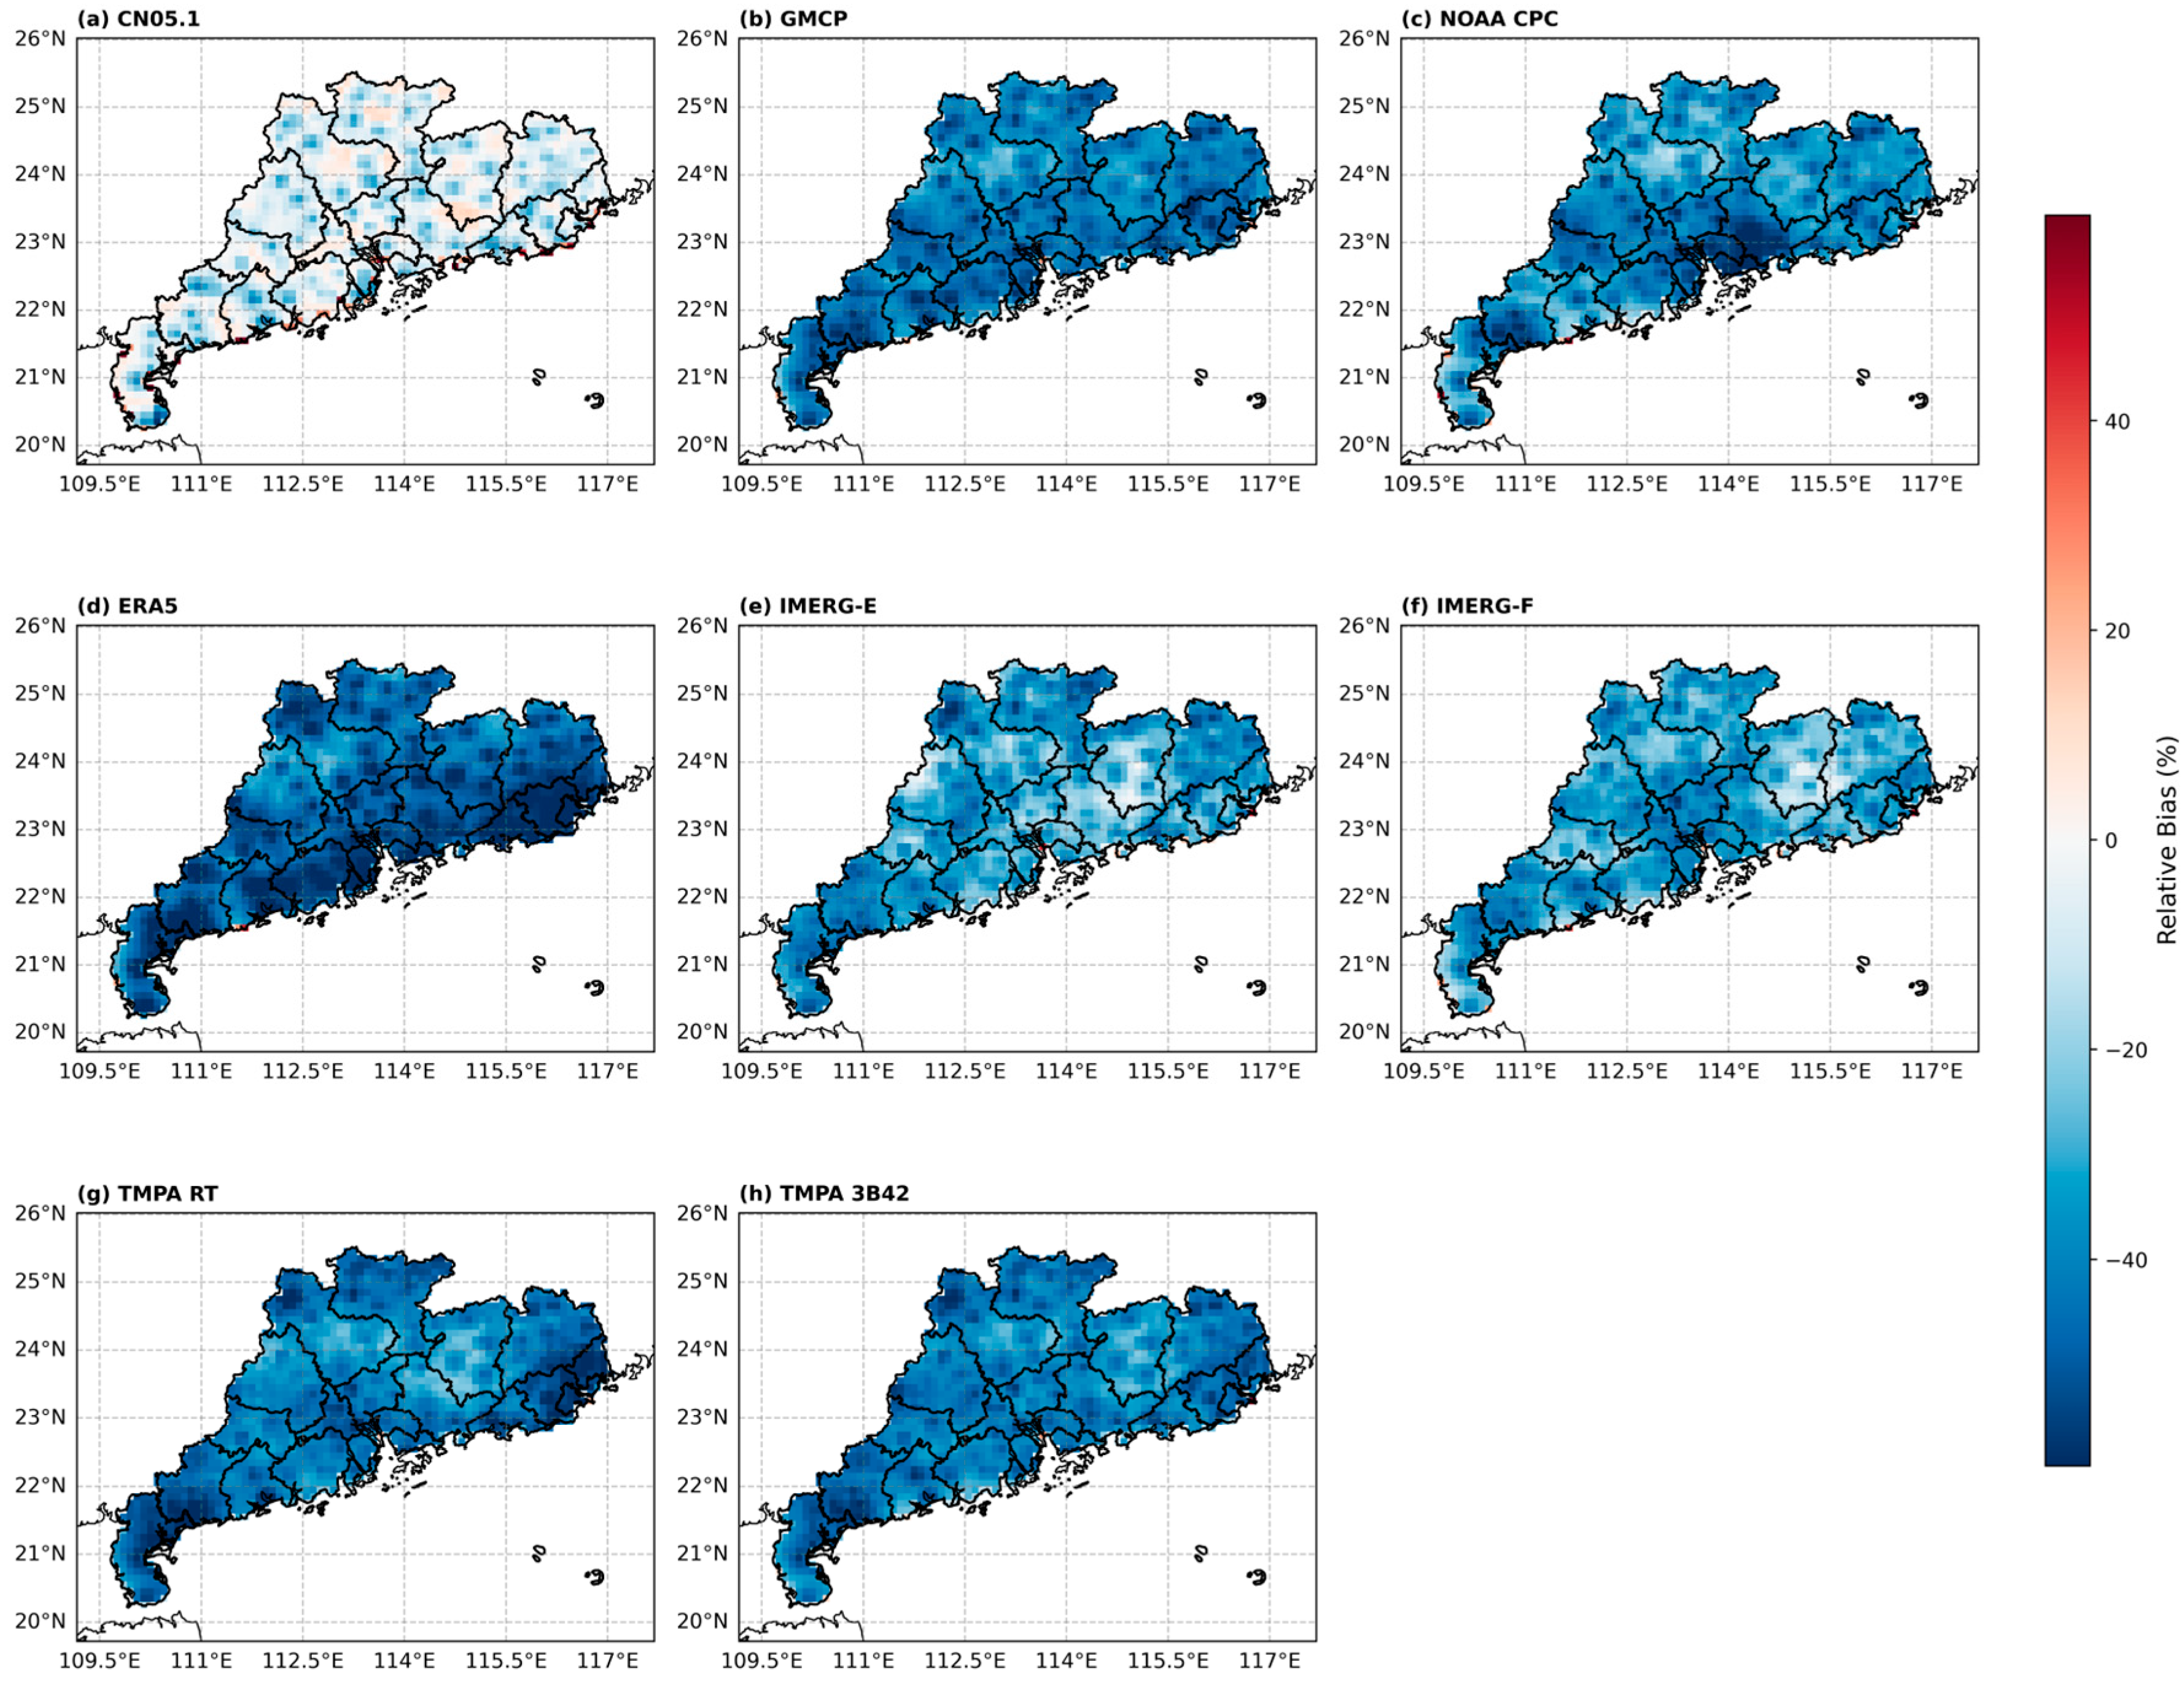
While the spatial bias patterns for total daily precipitation reveal systematic underestimation or overestimation across products and regions, evaluating their performance for extreme precipitation events requires separate consideration. Figure 13 presents the spatial distribution of the daily relative bias for extreme precipitation events (daily precipitation ≥ 50 mm) of various precipitation products relative to CHM_PRE over Guangdong Province. Positive and negative values indicate overestimation and underestimation, respectively, with larger absolute values reflecting greater systematic deviations. Compared with total daily precipitation (Figure 12), the spatial bias patterns for extreme precipitation events are more complex, highlighting significant differences among products in their ability to capture heavy rainfall events. Overall, with the exception of CN05.1, all precipitation products are dominated by negative bias with no significant positive bias. CN05.1 exhibits the smallest relative bias, with values ranging between −10% and 10% across most of the province, demonstrating the highest consistency with CHM_PRE for extreme precipitation events. GMCP shows relative bias below −40% in some irregularly distributed areas. NOAA CPC exhibits bias near 0% in parts of the northern region, with localized areas below −40% in the south-central region. ERA5 shows bias below −40% across most of the region, indicating a severe underestimation of extreme precipitation. IMERG-E and IMERG-F do not exhibit severe underestimations, with relatively uniform bias distribution ranging between −40% and 0% across most areas. TMPA RT shows severe underestimations in the southeastern and western regions, with bias below −40%. TMPA 3B42 exhibits severe underestimation over a relatively smaller area compared to TMPA RT. Overall, CN05.1 maintains the smallest bias and the most stable performance for extreme precipitation events.
The spatial bias analysis reveals a pronounced underestimation of extreme precipitation events across most products, particularly in southern Guangdong. Evaluating their ability to detect precipitation events at the monthly scale provides complementary insights into overall reliability. This evaluation uses categorical metrics such as probability of detection (POD) and false-alarm ratio (FAR). Figure 14 presents the monthly performance metrics (BIAS, POD, FAR, ETS) of multiple precipitation products relative to CHM_PRE in Guangdong in 2001–2019. The green diamonds indicate the mean values, while the boxes represent the interquartile range (IQR) and the whiskers extend to 1.5 times the IQR. Overall, NOAA CPC exhibits the best overall performance, with a median BIAS of 0.89 (close to the ideal value of 1), a high POD of 0.80, a low FAR of 0.09, and the highest ETS of 0.42. CN05.1 and ERA5 achieve the highest POD (0.89 and 0.93, respectively) but tend to overestimate precipitation (BIAS > 1) and have relatively high FAR values (>0.21). GMCP shows the lowest FAR (0.05) and moderate BIAS (0.60), yet its POD is relatively low (0.55). IMERG-E and IMERG-F produce moderate BIAS (0.71 and 0.74), POD (0.58 and 0.61), FAR (0.15 and 0.15), and ETS (0.17 and 0.19), indicating intermediate performances. TMPA RT and TMPA 3B42 yield the lowest ETS values (0.15 and 0.16) and relatively low POD (<0.50), suggesting limited capability for detecting rainfall events in this region. In summary, NOAA CPC demonstrates the highest overall skill in capturing precipitation events, whereas CN05.1 and ERA5 are more prone to overestimation but show high detection rates. The satellite-based products (IMERG-E, IMERG-F, TMPA RT, TMPA 3B42) generally have lower accuracy.
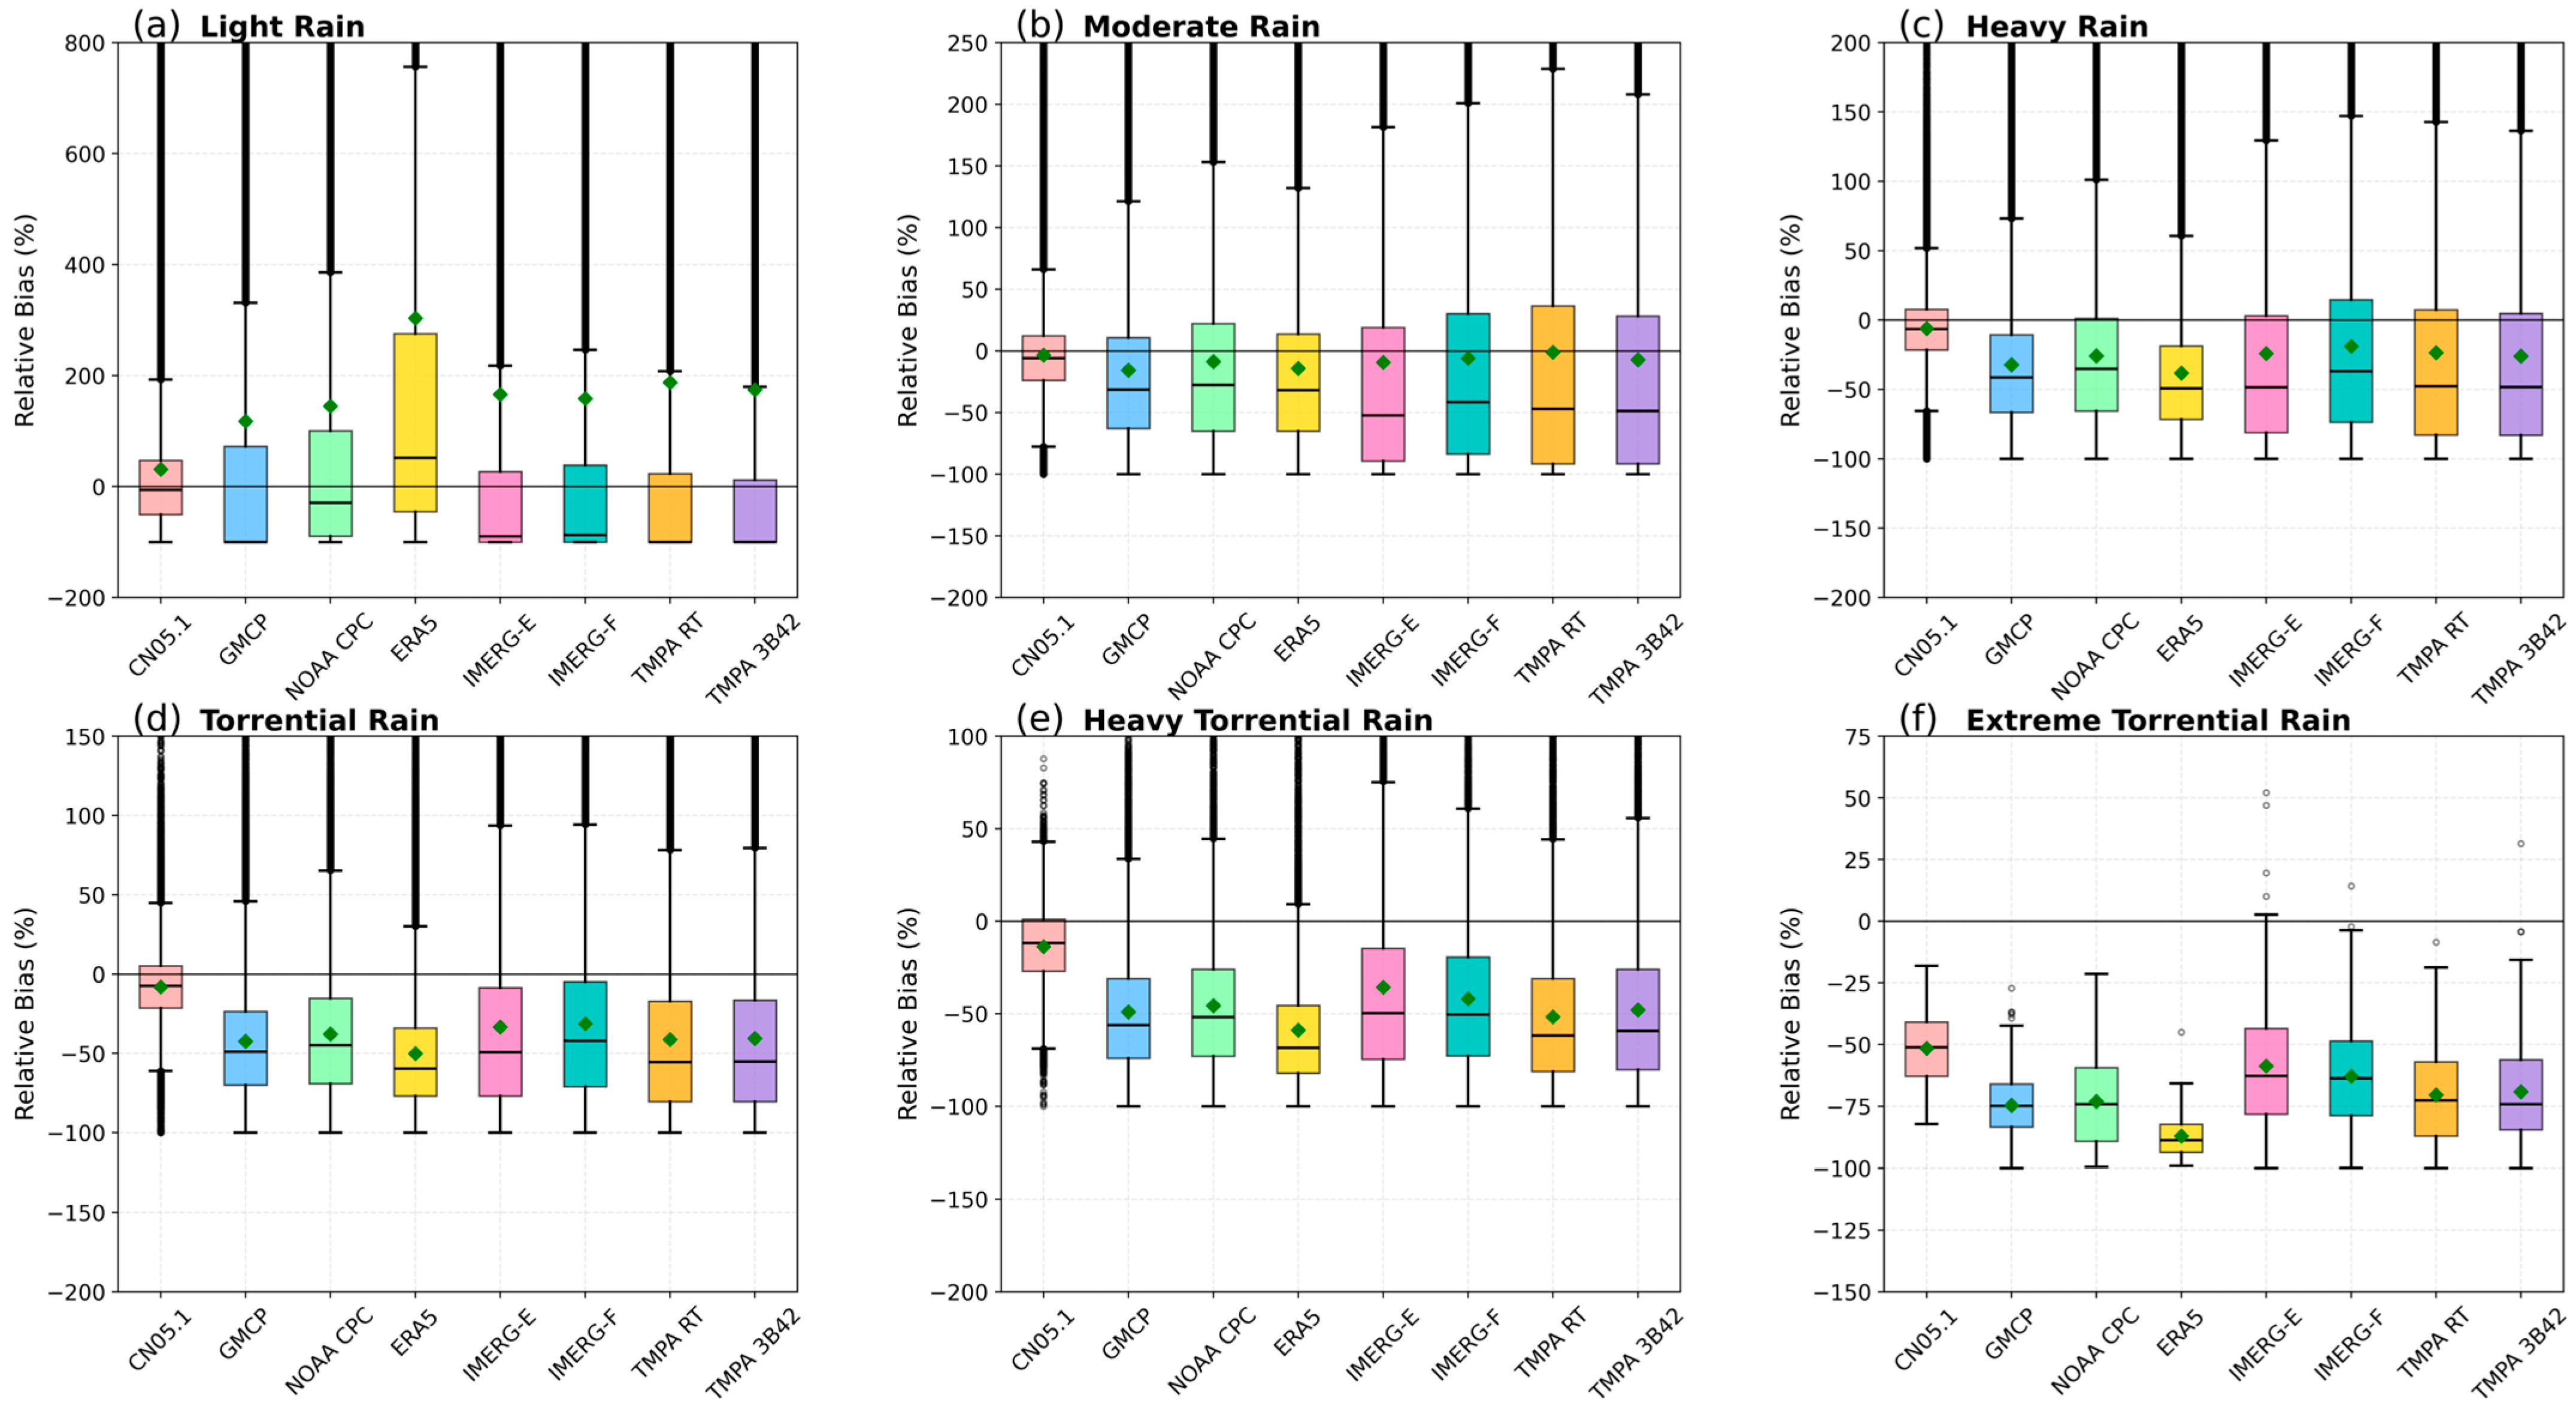
The monthly classification indicators reveal significant differences among the products in detecting precipitation events. It is crucial to clarify the system deviation corresponding to different rainfall intensity levels. This type of analysis not only helps identify potential reasons for performance differences, but also provides guidance on which products are suitable for application scenarios that are sensitive to rainfall. Figure 15 shows the box plots, which correspond to the relative deviation. Each group of box plots corresponds to a precipitation product, covering six rainfall intensity levels, namely, light rain, moderate rain, heavy rain, rainstorm, heavy rainstorm, and extremely heavy rainstorm. CHM_PRE can be used as a reference dataset. The box plot can display the distribution of relative deviations of each product under different rainfall levels, so as to comprehensively evaluate the system deviation and variability at different intensity levels. For rain gauges and high-quality grid products, the deviation patterns of CN05.1 and NOAA CPC are quite different. CN05.1 shows a slight positive mean bias for light rain (mean = 30.96%) but a negative median bias (median = −5.90%), transitioning to a negative bias for moderate to heavy torrential rain (mean ranging from −3.40% to −13.77%), with a pronounced negative bias for extreme torrential rain (mean = −51.50%, median = −51.13%). The variability of CN05.1 is largest for light rain (standard deviation = 173.21%), decreasing substantially for heavier categories. NOAA CPC displays a similar trend but with a stronger positive mean bias for light rain (mean = 144.84%) and a negative median bias (median = −29.39%), and more negative biases for heavier categories (mean =−8.67% to −45.59% for moderate to heavy torrential rain), with extreme torrential rain also showing strong underestimation (mean = −73.07%, median = −74.16%). GMCP demonstrates a markedly different pattern: it exhibits a strong positive bias for light rain (mean = 117.85%, median = −100.00%), indicating that while the mean is inflated by extreme overestimations, the median reveals that most light-rain events are severely underestimated. For moderate to extreme torrential rain, GMCP consistently shows negative biases that become increasingly severe with intensity (mean from −15.59% to −74.67%), with relatively stable variability (standard deviation = 14.11–76.22%). ERA5 shows the most pronounced intensity-dependent bias pattern. It exhibits a strong positive bias for light rain (mean = 303.30%, median = 51.83%), indicating a systematic overestimation of weak precipitation events. For moderate rain, the bias becomes slightly negative (mean = −14.18%, median = −31.87%), and for heavy to extreme torrential rain, the negative bias intensifies substantially (mean from −38.23% to −87.13%, median from −49.25% to −88.79%). This clear transition from an overestimation of light rain to severe underestimation of extreme events is a distinctive feature of ERA5. The satellite-based products (IMERG-E, IMERG-F, TMPA RT, and TMPA 3B42) exhibit broadly similar bias characteristics. All show positive mean bias for light rain (mean = 158.73–187.78%) but a negative median bias (median = −87.50% to −100.00%), with the mean indicating an average overestimation, while the negative median indicates that typical events are underestimated. For moderate to extreme torrential rain, these products consistently display negative biases that intensify with increasing rainfall intensity (mean from −1.02% to −70.40%, median from −41.52% to −74.17%). Notably, these satellite products exhibit the largest variability across all intensity categories, with standard deviations frequently exceeding 100% for light to moderate rain, reflecting highly inconsistent performance across different precipitation events and locations. Among the satellite products, TMPA RT shows the smallest negative bias for moderate rain, while IMERG-F exhibits the smallest negative bias for heavy rain. In contrast, TMPA RT and TMPA 3B42 show the most pronounced underestimation. In summary, all products exhibit a general tendency to overestimate light-rain events while underestimating heavier precipitation, though the magnitude and consistency of these biases vary substantially among product types. Gauge-based products (CN05.1 and NOAA CPC) show a relatively balanced performance with moderate biases. GMCP demonstrates a distinct pattern with severe underestimation of most light-rain events despite inflated means. ERA5 exhibits the most dramatic intensity-dependent bias transition, from a strong overestimation of light rain to severe underestimation of extreme events. Satellite products exhibit the greatest variability and persistent negative biases in moderate to extreme rainfall categories. This suggests reduced reliability in quantitative precipitation estimates across the entire intensity range.
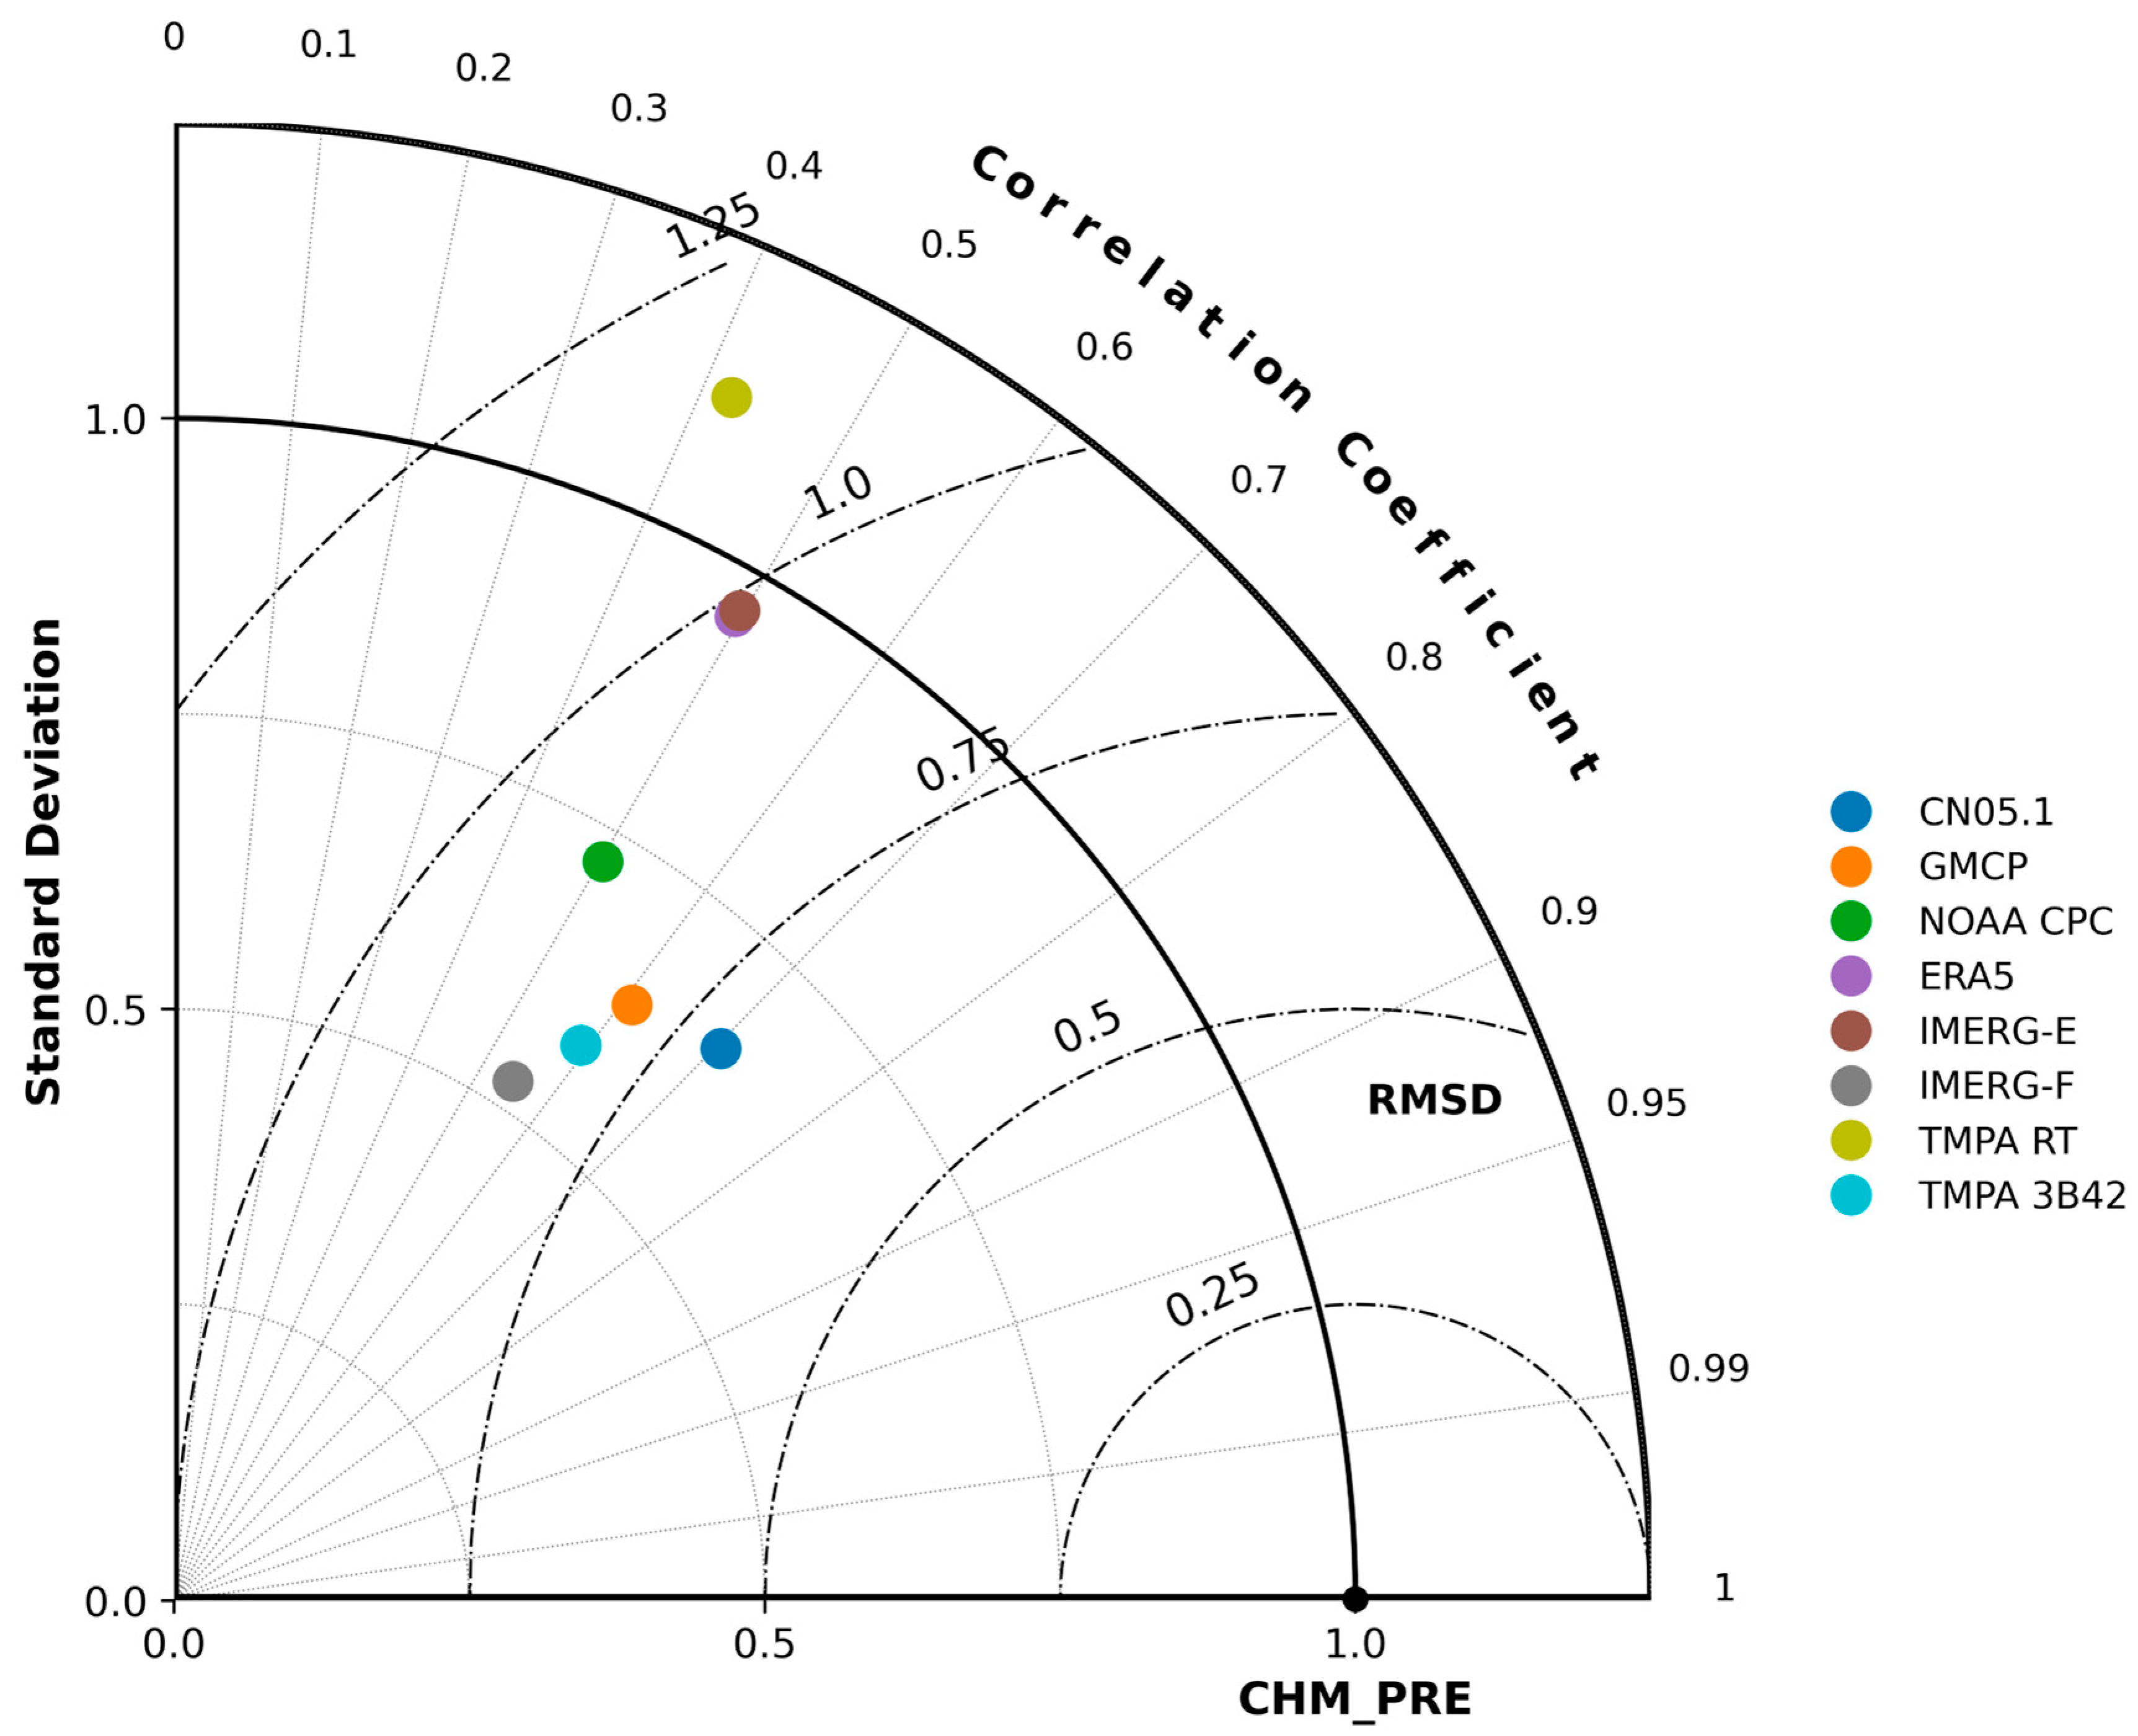
To quantitatively evaluate the spatial pattern similarity, a Taylor diagram summarizing the spatial correlation coefficient, normalized standard deviation, and centered RMSE of each product relative to CHM_PRE is presented in Figure 16. The Taylor diagram confirms that CN05.1 exhibited the highest spatial correlation (0.704) and the best overall agreement with CHM_PRE, while satellite products and ERA5 showed lower spatial correlations and larger dispersions.

4. Discussion

There are nine precipitation-related products that have been systematically evaluated from multiple temporal and spatial scales. The results show that there are significant differences in their actual usability within Guangdong Province. The performance of CHM_PRE is better than other datasets. As mentioned in previous research, high-resolution precipitation products calibrated by stations actually have significant advantages in areas with a complex terrain. The good performance of CHM_PRE is mainly due to its combination of a dense network of ground observation stations and advanced interpolation algorithms. These designs can precisely capture the precipitation intensity and changes under the complex terrain of Guangdong. On a spatial level, the distributions of CN05.1 and CHM_PRE show good agreement, with the lowest root mean square error and minimum relative deviation in most regions, indicating the practical use of station interpolation methods in spatial analysis. The results of this study are consistent with a widely accepted view that gauge-based precipitation products can maintain relatively high spatial accuracy as long as the coverage area of the gauge is sufficient. CN05.1 and NOAA CPC are unable to detect significant long-term trends, as shown in Figure 1. This may be due to limitations in the algorithm itself or the inherent spatial smoothing effect of station-based methods, which has caused many interpolation schemes to smooth out interannual variations. The bias patterns associated with precipitation intensity among different products can help us understand their retrieval principles. Satellite products have always had the problem of overestimation for light rain and underestimation for heavy rain, which is a common limitation of passive microwave and infrared inversion algorithms. Especially for IMERG-E and TMPA RT, this deviation will be more pronounced, likely due to the lack of correlation based on real-time station observations. IMERG-F and later real-time versions of satellite precipitation products such as TMPA 3B42 have shown significant improvements in performance, which also demonstrates the crucial role of ground calibration steps in satellite precipitation-related products. ERA5 has a common bias feature, with light rain significantly overestimated, while heavy and extreme precipitation events are substantially underestimated relative to observations. The bimodal deviation may be related to the convective parameterization scheme within the model. This approach often triggers precipitation too frequently, but the intensity of a single precipitation event is not as strong. This type of systematic error also makes ERA5 less suitable for hydrological applications that require the precise display of extreme events. The correlation heatmap in Figure 7 with daily extreme precipitation, which is a daily precipitation of ≥ 50 mm, shows that the difference between the CHM_PRE product based on rainfall stations, as well as the satellite and ERA5 products, is quite obvious. It is evident that different datasets have fundamental differences in displaying extreme events. Figure 7 shows a heatmap of a set of correlation coefficients. Based on meteorological station observations and high-quality gridded datasets, such as CHM_PRE, CN05.1, GMCP, and NOAA CPC, the correlation coefficients between them are all in the range of 0.60 to 0.87, indicating a moderate to strong correlation level. In contrast, ERA5 and satellite-related products formed a distinct cluster, showing a weak correlation and negligible overlap with the reference data. The correlation between TMPA RT and TMPA 3B42 algorithms is particularly high, with a correlation coefficient of 0.87, which is among the top correlation algorithms in the algorithm family. This also shows that retrieval algorithms can introduce consistency bias, and this bias can spread between different product versions. When applying satellite precipitation products, algorithm transparency should be emphasized, and it is necessary to perform bias correction based on local conditions. The spatial distribution of relative RMSE deviations persists (Figure 11 and Figure 12), with larger errors concentrated in southern Guangdong, a region characterized by coastal terrain and frequent typhoon activity. The spatial differences in product performance highlight the critical need to account for geographical factors when selecting precipitation datasets for regional studies. The systematic pattern of light rain overestimation and heavy rain underestimation observed in satellite products over Guangdong is consistent with evaluations conducted in other complex terrain regions, including mountainous Africa [49] and Central Asia [50]. Similarly, the intensity-dependent bias of ERA5, marked by the overestimation of weak precipitation and severe underestimation of extreme events, has been reported in Iran [51] and other monsoon-dominated areas, suggesting this is a systematic feature of the model’s convective parameterization rather than a regional artifact. In contrast, the gauge-based products evaluated here benefit from Guangdong’s relatively dense station network, resulting in notably smaller errors compared with those reported for sparsely gauged regions [50], reaffirming the critical role of station density in gridded product quality. Subsequent research can explore more deviation correction methods that are suitable for the local climate and terrain characteristics in Guangdong. In addition, fusion technology can be used to integrate data from different sources together, which may further improve the accuracy of precipitation estimation. Despite these contributions, several limitations of this study should be noted. First, although CHM_PRE was selected as the spatial reference based on its superior station-scale performance, it remains an interpolated product, so the spatial error metrics reflect consistency rather than absolute accuracy. Error propagation and circularity risks exist, particularly in areas with sparse gauges. Second, our conclusions are specific to the climatic and topographic conditions of Guangdong and may not be directly transferable to other regions. Third, the choice of bilinear interpolation and the 3 × 3 neighborhood window may influence the results, especially for extreme precipitation; dedicated sensitivity studies are needed to quantify these effects.

5. Conclusions

This comprehensive evaluation of nine precipitation products over Guangdong Province from 2001 to 2019 leads to the following main conclusions:
1. CHM_PRE is the most consistent precipitation dataset compared with NCDC observations in Guangdong Province at daily, monthly, and annual scales. It reliably captures significant long-term trends; shows the highest consistency with observations at annual, monthly, and daily scales; and demonstrates balanced performance in representing extreme events and different rainfall intensity categories. Based on these results, CHM_PRE is recommended as the preferred precipitation dataset for hydrological modeling and extreme-event analysis in Guangdong, although dedicated application-based validation would further confirm its suitability for specific purposes.
2. CN05.1 exhibits the highest spatial consistency with CHM_PRE, particularly for extreme precipitation events, making it a reliable alternative for spatial pattern analysis and applications requiring high spatial fidelity.
3. NOAA CPC performs best in monthly-scale precipitation event detection, achieving the highest ETS and a BIAS closest to unity. It is suitable for studies focusing on precipitation frequency and occurrence. It is recommended for studies focusing on precipitation frequency and occurrence, subject to validation for the specific application.
4. Satellite products (IMERG-F, IMERG-E, TMPA 3B42, TMPA RT) are suitable for monthly-scale applications but show significant limitations at daily scales. They exhibit systematic biases, overestimating light rain and underestimating heavy rain, along with high variability. These characteristics suggest caution when applying them to hydrological modeling or extreme-event analysis, and bias correction is advisable before such applications.
5. ERA5 shows the relatively poor applicability in Guangdong Province, with severe underestimation of extreme precipitation and an extreme intensity-dependent bias pattern.
6. Product performance varies spatially, with all datasets exhibiting larger errors in southern Guangdong. This underscores the importance of considering regional differences when selecting precipitation datasets.
These findings provide critical guidance for selecting appropriate precipitation datasets for hydrological and climatic studies in Guangdong Province. Future work should aim to develop bias-correction techniques tailored to the region’s specific climatic and topographic conditions. In addition, multi-source data fusion should be explored to further improve the accuracy of precipitation estimates.

Author Contributions

B.C. and Y.Y. conceived and designed the experiments; B.C. analyzed the data and wrote the paper; C.X. helped analyze the results; Y.Y., C.L. and L.W. provided funding support. C.L., L.W., CX. and F.Z. helped edit the paper. All authors have read and agreed to the published version of the manuscript.

Funding

This research was funded by the program for scientific research start-up funds of Guangdong Ocean University (060302032306, 060302032301), the National Natural Science Foundation of China (42275017, 42075036, 42405103), Project of Key Laboratory of Guangdong Provincial Department of Education (2025KSYS009), and Guangdong Basic and Applied Basic Research Foundation (2023A1515110527).

Data Availability Statement

Data are contained within the article.

Conflicts of Interest

The authors declare no conflicts of interest.

References

  1. Michaelides, S.; Levizzani, V.; Anagnostou, E.; Bauer, P.; Kasparis, T.; Lane, J. Precipitation: Measurement, remote sensing, climatology and modeling. Atmos. Res. 2009, 94, 512–533. [Google Scholar] [CrossRef] [Scilit]
  2. Beck, H.E.; Vergopolan, N.; Pan, M.; Levizzani, V.; van Dijk, A.I.J.M.; Weedon, G.P.; Brocca, L.; Pappenberger, F.; Huffman, G.J.; Wood, E.F. Global-scale evaluation of 22 precipitation datasets using gauge observations and hydrological modeling. Hydrol. Earth Syst. Sci. 2017, 21, 6201–6217. [Google Scholar] [CrossRef] [Scilit]
  3. Liu, X.; Yang, T.; Hsu, K.; Liu, C.; Sorooshian, S. Evaluating the streamflow simulation capability of PERSIANN-CDR daily rainfall products in two river basins on the Tibetan Plateau. Hydrol. Earth Syst. Sci. 2017, 21, 169–181. [Google Scholar] [CrossRef] [Scilit]
  4. Xiang, Y.; Chen, J.; Li, L.; Peng, T.; Yin, Z. Evaluation of eight global precipitation datasets in hydrological modeling. Remote Sens. 2021, 13, 2831. [Google Scholar] [CrossRef] [Scilit]
  5. Filippi, L. The Fluid Dynamics of Climate: General Circulation Models and Applications to Past, Present and Future Climatic Changes. Ph.D. Thesis, Polytechnic University of Turin, Turin, Italy, 2016. [Google Scholar]
  6. Junquas, C.; Heredia, M.B.; Condom, T.; Ruiz-Hernández, J.C.; Campozano, L.; Dudhia, J.; Espinoza, J.C.; Menegoz, M.; Rabatel, A.; Sicart, J.E. Regional climate modeling of the diurnal cycle of precipitation and associated atmospheric circulation patterns over an Andean glacier region (Antisana, Ecuador). Clim. Dyn. 2022, 58, 3075–3104. [Google Scholar] [CrossRef] [Scilit]
  7. Wang, S.; Liu, J.; Wang, J.; Qiao, X.; Zhang, J. Evaluation of GPM IMERG V05B and TRMM 3B42V7 Precipitation Products over High Mountainous Tributaries in Lhasa with Dense Rain Gauges. Remote Sens. 2019, 11, 2080. [Google Scholar] [CrossRef] [Scilit]
  8. Wang, D.; Yang, H.; Hu, Y.; Zhu, A.-X.; Mao, X. Analyzing Spatio-Temporal Characteristics of Cultivated Land Fragmentation and Their Influencing Factors in a Rapidly Developing Region: A Case Study in Guangdong Province, China. Land 2022, 11, 1750. [Google Scholar] [CrossRef] [Scilit]
  9. Li, C.; Fu, T.; Fu, Y.; Wang, Z.; Li, B.; Qi, C.; Chen, G.; Xu, X.; Yu, H. Origin and Implications of Pollution in Coastal Groundwater of the Guangdong Province. J. Mar. Sci. Eng. 2022, 10, 1394. [Google Scholar] [CrossRef] [Scilit]
  10. Yin, J.; Wang, D.; Zhai, G.; Wang, H.; Xu, H.; Liu, C. A Modified Double-Moment Bulk Microphysics Scheme Geared toward the East Asian Monsoon Region. Adv. Atmos. Sci. 2022, 39, 1451–1471. [Google Scholar] [CrossRef] [Scilit]
  11. Wu, L.; Huang, R.; He, H.; Shao, Y.; Wen, Z. Synoptic characteristics of heavy rainfall events in pre-monsoon season in South China. Adv. Atmos. Sci. 2010, 27, 315–327. [Google Scholar] [CrossRef] [Scilit]
  12. Maussion, F.; Scherer, D.; Mölg, T.; Collier, E.; Curio, J.; Finkelnburg, R. Precipitation Seasonality and Variability over the Tibetan Plateau as Resolved by the High Asia Reanalysis. J. Clim. 2014, 27, 1910–1927. [Google Scholar] [CrossRef] [Scilit]
  13. Sun, X.; Barros, A.P. The Impact of Forcing Datasets on the High-Resolution Simulation of Tropical Storm Ivan (2004) in the Southern Appalachians. Mon. Weather Rev. 2012, 140, 3300–3326. [Google Scholar] [CrossRef] [Scilit]
  14. Hou, A.Y.; Kakar, R.K.; Neeck, S.; Azarbarzin, A.A.; Kummerow, C.D.; Kojima, M.; Oki, R.; Nakamura, K.; Iguchi, T. The Global Precipitation Measurement Mission. Bull. Am. Meteorol. Soc. 2014, 95, 701–722. [Google Scholar] [CrossRef] [Scilit]
  15. Puca, S.; Porcu, F.; Rinollo, A.; Vulpiani, G.; Baguis, P.; Balabanova, S.; Campione, E.; Ertürk, A.; Gabellani, S.; Iwanski, R.; et al. The validation service of the hydrological SAF geostationary and polar satellite precipitation products. Nat. Hazards Earth Syst. Sci. 2014, 14, 871–889. [Google Scholar] [CrossRef] [Scilit]
  16. Huang, A.; Zhao, Y.; Zhou, Y.; Yang, B.; Zhang, L.; Dong, X.; Fang, D.; Wu, Y. Evaluation of multisatellite precipitation products by use of ground-based data over China. J. Geophys. Res. Atmos. 2016, 121, 10,654–10,675. [Google Scholar] [CrossRef] [Scilit]
  17. Wu, J.; Gao, X.J. A gridded daily observation dataset over China region and comparison with the other datasets. Chin. J. Geophys. 2013, 56, 1102–1111. (In Chinese) [Google Scholar] [CrossRef]
  18. Xie, P.; Chen, M.; Yang, S.; Yatagai, A.; Hayasaka, T.; Fukushima, Y.; Liu, C. A Gauge-Based Analysis of Daily Precipitation over East Asia. J. Hydrometeorol. 2007, 8, 607–626. [Google Scholar] [CrossRef] [Scilit]
  19. Ma, Z. GMCP: A Fully Global Multi-Source Merging-and-Calibration Precipitation Dataset (1-Hourly, 0.1°, Global, 2000–Present). National Tibetan Plateau/Third Pole Environment Data Center. 2025. Available online: https://cstr.cn/18406.11.Atmos.tpdc.301878 (accessed on 2 February 2025).
  20. Zhao, C.; Yao, S.; Ding, Y.; Zhao, Q. A Gridded Monthly Precipitation Merged Rain Gauge and Satellite Analysis Dataset for the Tian Shan Range between 1981 and 2019. J. Appl. Meteorol. Climatol. 2023, 62, 691–708. [Google Scholar] [CrossRef] [Scilit]
  21. Copernicus Climate Change Service, Climate Data Store. ERA5 Post-Processed Daily-Statistics on Pressure Levels from 1940 to Present. Copernicus Climate Change Service (C3S) Climate Data Store (CDS), 2024. Available online: https://cds.climate.copernicus.eu/datasets/derived-era5-pressure-levels-daily-statistics?tab=overview (accessed on 2 February 2025).
  22. Caldas-Alvarez, A.; Augenstein, M.; Ayzel, G.; Barfus, K.; Cherian, R.; Dillenardt, L.; Fauer, F.; Feldmann, H.; Heistermann, M.; Karwat, A.; et al. Meteorological, impact and climate perspectives of the 29 June 2017 heavy precipitation event in the Berlin metropolitan area. Nat. Hazards Earth Syst. Sci. 2022, 22, 3701–3724. [Google Scholar] [CrossRef] [Scilit]
  23. Lavers, D.A.; Simmons, A.; Vamborg, F.; Rodwell, M.J. An evaluation of ERA5 precipitation for climate monitoring. Q. J. R. Meteorol. Soc. 2022, 148, 3152–3167. [Google Scholar] [CrossRef] [Scilit]
  24. Kang, H.; Ebtehaj, A. Machine Learning for Explanation of Subgrid Convective Precipitation: A Case Study over CONUS Using a Convection-Allowing Model and SHAP Analysis. Artif. Intell. Earth Syst. 2025, 4, e240062. [Google Scholar] [CrossRef] [Scilit]
  25. Wang, F.; Tian, D.; Carroll, M. Customized deep learning for precipitation bias correction and downscaling. Geosci. Model Dev. 2023, 16, 535–556. [Google Scholar] [CrossRef] [Scilit]
  26. Chua, Z.-W.; Kuleshov, Y.; Watkins, A. Evaluation of Satellite Precipitation Estimates over Australia. Remote Sens. 2020, 12, 678. [Google Scholar] [CrossRef] [Scilit]
  27. Huffman, G.J.; Bolvin, D.T.; Nelkin, E.J.; Wolff, D.B.; Adler, R.F.; Gu, G.; Hong, Y.; Bowman, K.P.; Stocker, E.F. The TRMM Multisatellite Precipitation Analysis (TMPA): Quasi-Global, Multiyear, Combined-Sensor Precipitation Estimates at Fine Scales. J. Hydrometeorol. 2007, 8, 38–55. [Google Scholar] [CrossRef] [Scilit]
  28. Goddard Earth Sciences Data and Information Services Center. TRMM (TMPA-RT) Near Real-Time Precipitation L3 1 Day 0.25 Degree x 0.25 Degree V7, Edited by Andrey Savtchenko, Greenbelt, MD, Goddard Earth Sciences Data and Information Services Center (GES DISC), 2016. Available online: https://disc.gsfc.nasa.gov/datasets/TRMM_3B42RT_Daily_7/summary (accessed on 1 February 2025).
  29. Huffman, G.J.; Bolvin, D.T.; Nelkin, E.J.; Adler, R.F. TRMM (TMPA) Precipitation L3 1 day 0.25 Degree x 0.25 Degree V7, Edited by Andrey Savtchenko, Goddard Earth Sciences Data and Information Services Center (GES DISC), 2016. Available online: https://disc.gsfc.nasa.gov/datasets/TRMM_3B42_Daily_7/summary (accessed on 1 February 2025).
  30. Yu, C.; Zheng, J.; Hu, D.; Di, Y.; Zhang, X.; Liu, M. Evaluation and Correction of IMERG Late Run Precipitation Product in Rainstorm over the Southern Basin of China. Water 2021, 13, 231. [Google Scholar] [CrossRef] [Scilit]
  31. Maggioni, V.; Meyers, P.C.; Robinson, M.D. A Review of Merged High-Resolution Satellite Precipitation Product Accuracy during the Tropical Rainfall Measuring Mission (TRMM) Era. J. Hydrometeorol. 2016, 17, 1101–1117. [Google Scholar] [CrossRef] [Scilit]
  32. Zhou, C.; Gao, W.; Hu, J.; Du, L.; Du, L. Capability of IMERG V6 Early, Late, and Final Precipitation Products for Monitoring Extreme Precipitation Events. Remote Sens. 2021, 13, 689. [Google Scholar] [CrossRef] [Scilit]
  33. Wang, J.; Petersen, W.A.; Wolff, D.B. Validation of Satellite-Based Precipitation Products from TRMM to GPM. Remote Sens. 2021, 13, 1745. [Google Scholar] [CrossRef] [Scilit]
  34. Tian, W.; Cao, X.; Peng, K. Technology for Position Correction of Satellite Precipitation and Contributions to Error Reduction—A Case of the ‘720’ Rainstorm in Henan. China Sens. 2022, 22, 5583. [Google Scholar] [CrossRef] [Scilit] [PubMed]
  35. Ebert, E.E.; Janowiak, J.E.; Kidd, C. Comparison of Near-Real-Time Precipitation Estimates from Satellite Observations and Numerical Models. Bull. Am. Meteorol. Soc. 2007, 88, 47–64. [Google Scholar] [CrossRef] [Scilit]
  36. Li, Q.; Liu, X.; Zhong, Y.; Wang, M.; Shi, M. Precipitation Changes in the Three Gorges Reservoir Area and the Relationship with Water Level Change. Sensors 2021, 21, 6110. [Google Scholar] [CrossRef] [Scilit] [PubMed]
  37. Wang, R.; Chen, J.; Wang, X. Comparison of IMERG Level-3 and TMPA 3B42V7 in Estimating Typhoon-Related Heavy Rain. Water 2017, 9, 276. [Google Scholar] [CrossRef] [Scilit]
  38. Liu, D.; Guo, S.; Chen, X.; Shao, Q. Analysis of trends of annual and seasonal precipitation from 1956 to 2000 in Guangdong Province, China. Hydrol. Sci. J. 2012, 57, 358–369. [Google Scholar] [CrossRef] [Scilit]
  39. Park, Y.S.; Engel, B.A.; Harbor, J. A web-based model to estimate the impact of best management practices. Water 2014, 6, 455–471. [Google Scholar] [CrossRef] [Scilit]
  40. Sun, X.; Barros, A.P. An Evaluation of the Statistics of Rainfall Extremes in Rain Gauge Observations, and Satellite-Based and Reanalysis Products Using Universal Multifractals. J. Hydrometeorol. 2010, 11, 388–404. [Google Scholar] [CrossRef] [Scilit]
  41. Han, J.; Miao, C.; Gou, J.; Zheng, H.; Zhang, Q.; Guo, X. A New Daily Gridded Precipitation Dataset for the Chinese Mainland Based on Gauge Observations. Earth Syst. Sci. Data. 2023, 15, 3147–3161. [Google Scholar] [CrossRef] [Scilit]
  42. Huffman, G.J.; Stocker, E.F.; Bolvin, D.T.; Nelkin, E.J.; Tan, J. GPM IMERG Early Precipitation L3 1 day 0.1 Degree x 0.1 Degree V07, Edited by Andrey Savtchenko, Greenbelt, MD, Goddard Earth Sciences Data and Information Services Center (GES DISC), 2024. Available online: https://disc.gsfc.nasa.gov/datasets/GPM_3IMERGDE_07/summary?keywords=10.5067%2FGPM%2FIMERGDE%2FDAY%2F07 (accessed on 10 March 2025).
  43. Huffman, G.J.; Stocker, E.F.; Bolvin, D.T.; Nelkin, E.J.; Tan, J. GPM IMERG Final Precipitation L3 1 day 0.1 Degree x 0.1 Degree V07, Edited by Andrey Savtchenko, Greenbelt, MD, Goddard Earth Sciences Data and Information Services Center (GES DISC), 2023. Available online: https://disc.gsfc.nasa.gov/datasets/GPM_3IMERGDF_07/summary?keywords=10.5067%2FGPM%2FIMERGDF%2FDAY%2F07 (accessed on 10 March 2025).
  44. Mittermaier, M.; Roberts, N.; Thompson, S.A. A long-term assessment of precipitation forecast skill using the Fractions Skill Score. Met. Apps 2013, 20, 176–186. [Google Scholar] [CrossRef] [Scilit]
  45. Almazroui, M.; Saeed, S. Contribution of extreme daily precipitation to total rainfall over the Arabian Peninsula. Atmos. Res. 2020, 231, 104672. [Google Scholar] [CrossRef] [Scilit]
  46. Tan, M.L.; Duan, Z. Assessment of GPM and TRMM precipitation products over Singapore. Remote Sens. 2017, 9, 720. [Google Scholar] [CrossRef] [Scilit]
  47. Xin, Y.; Yang, Y.; Chen, X.; Yue, X.; Liu, Y.; Yin, C. Evaluation of IMERG and ERA5 precipitation products over the Mongolian Plateau. Sci. Rep. 2022, 12, 21776. [Google Scholar] [CrossRef] [Scilit] [PubMed]
  48. Goswami, T.; Kolusu, S.R.; Chowdhuri, S.; Ganai, M.; Deshpande, M. Comparative Evaluation of Short-Range Extreme Rainfall Forecast by Two High-Resolution Global Models. Atmosphere 2026, 17, 304. [Google Scholar] [CrossRef] [Scilit]
  49. Wang, H.; Yong, B. Quasi-Global evaluation of IMERG and GSMaP precipitation products over land using gauge observations. Water 2020, 12, 243. [Google Scholar] [CrossRef] [Scilit]
  50. Guo, H.; Chen, S.; Bao, A.; Hu, J.; Gebregiorgis, A.S.; Xue, X.; Zhang, X. Inter-Comparison of High-Resolution Satellite Precipitation Products over Central Asia. Remote Sens. 2015, 7, 7181–7211. [Google Scholar] [CrossRef] [Scilit]
  51. Izadi, N.; Karakani, E.G.; Saadatabadi, A.R.; Shamsipour, A.; Fattahi, E.; Habibi, M. Evaluation of ERA5 Precipitation Accuracy Based on Various Time Scales over Iran during 2000–2018. Water 2021, 13, 2538. [Google Scholar] [CrossRef] [Scilit]
Figure 1. Comparison of annual precipitation trends among different products in Guangdong (2001–2019).The dashed lines represent the linear trends for each product.
Water 18 02066 g001
Figure 2. Scatter plots of annual total precipitation from different products against NCDC observations.The red solid line denotes the fitted linear trend; the dashed line denotes the 1:1 line.
Water 18 02066 g002
Figure 3. Monthly distribution of daily precipitation from multiple sources compared with NCDC observations over Guangdong Province. The boxes represent the interquartile range (IQR), the solid black line inside each box indicates the median, and the green diamond indicates the mean. Whiskers extend to 1.5 times the IQR; outliers are omitted.
Water 18 02066 g003
Figure 4. Scatter plots of monthly total precipitation from different products against NCDC observations.The red solid line denotes the fitted linear trend; the dashed line denotes the 1:1 line.
Water 18 02066 g004
Figure 5. Histogram of daily precipitation intensity for (a) NCDC, (b) CHM_PRE, (c) CN05.1, (d) GMCP, (e) NOAA CPC, (f) ERA5, (g) IMERG-E, (h) IMERG-F, (i) TMPA RT, and (j) TMPA 3B42.
Water 18 02066 g005
Figure 6. Scatter plots of daily precipitation from different products against NCDC observations.The red solid line denotes the fitted linear trend; the dashed line denotes the 1:1 line.
Water 18 02066 g006
Figure 7. Correlation heatmap of daily extreme precipitation (≥50 mm) among NCDC and various other products.
Water 18 02066 g007
Figure 8. Categorical statistics (BIAS, POD, FAR, ETS) for daily precipitation events.The boxes represent the interquartile range (IQR), the horizontal lines inside the boxes indicate the median, the green diamonds indicate the mean, and circles outside the whiskers indicate outliers.
Water 18 02066 g008
Figure 9. Relative bias of different rain-intensity categories (light to extreme torrential rain).The boxes represent the interquartile range (IQR), the horizontal lines inside the boxes indicate the median, the green diamonds indicate the mean, and circles outside the whiskers indicate outliers.
Water 18 02066 g009
Figure 10. Spatial distribution of mean daily precipitation from each product compared to CHM_PRE over Guangdong Province.
Water 18 02066 g010
Figure 11. Spatial distribution of root mean square error (RMSE) relative to CHM_PRE.
Water 18 02066 g011
Figure 12. Spatial distribution of relative bias compared to CHM_PRE.
Water 18 02066 g012
Figure 13. Spatial relative bias for extreme precipitation events (≥50 mm) compared to CHM_PRE.
Water 18 02066 g013
Figure 14. Monthly performance metrics (BIAS, POD, FAR, ETS) of multiple precipitation products relative to CHM_PRE in Guangdong.The boxes represent the interquartile range (IQR), the horizontal lines inside the boxes indicate the median, the green diamonds indicate the mean, and circles outside the whiskers indicate outliers.
Water 18 02066 g014
Figure 15. Boxplots of relative bias for different rainfall intensity categories (light rain to extreme torrential rain) across multiple precipitation products, using CHM_PRE as reference.The boxes represent the interquartile range (IQR), the horizontal lines inside the boxes indicate the median, the green diamonds indicate the mean, and circles outside the whiskers indicate outliers.
Water 18 02066 g015
Figure 16. Taylor diagram of spatial pattern similarity between each precipitation product and CHM_PRE over Guangdong Province.
Water 18 02066 g016
Table 1. Main characteristics of the precipitation products evaluated in this study.
ProductTypeSpatial ResolutionTemporal ResolutionCoverage PeriodData Source
NCDCStation observationsPoint3-hourly1942–present NCDC
CHM_PREGauge-based gridded0.1°Daily1961–2022[41]
CN05.1Gauge-based gridded0.25°Daily1961–present[17]
GMCPMulti-source merged0.1°1-hourly2000–2024-09-30[19]
NOAA CPCGauge-based gridded0.5°Daily1979–presentNOAA CPC
ERA5Reanalysis0.25°Daily1940–presentECMWF
IMERG-ESatellite (near-real-time)0.1°Daily1998–present[42]
IMERG-FSatellite (gauge-calibrated)0.1°Daily1998–2025-10-01[43]
TMPA 3B42Satellite (post-processed)0.25°Daily1998–2020-01-01[29]
TMPA_RTSatellite (near-real-time)0.25°Daily2000-03-01–2020-01-02[28]
Note: this study uses data from 2001 to 2019 for all products.
Disclaimer/Publisher’s Note: The statements, opinions and data contained in all publications are solely those of the individual author(s) and contributor(s) and not of MDPI and/or the editor(s). MDPI and/or the editor(s) disclaim responsibility for any injury to people or property resulting from any ideas, methods, instructions or products referred to in the content.