1. Introduction
Rainfall plays a fundamental role in regulating environmental processes and supporting socio-economic activities [
1]. However, climate change is increasingly altering rainfall patterns and intensifying extreme hydroclimatic events, creating significant challenges for ecosystems, agricultural systems, and human livelihoods worldwide [
2]. According to the sixth assessment report of the Intergovernmental Panel on Climate Change (IPCC), the last twenty years constitute the warmest period since the beginning of the 20th century [
3].
The rate of global warming observed since the 1970s is faster than that of any other fifty-year period in the last 2000 years. Alongside more frequent and intense heat waves, extreme rainfall events have become more violent and recurrent, amplifying the risks of flooding, food insecurity, and ecosystem degradation in many temperate and high-latitude regions [
4,
5]. Vegetation–atmosphere–land interactions are a key component of the climate system, where vegetation regulates energy, water, and carbon exchanges, while hydroclimatic conditions influence vegetation growth.
Northeast China, the main grain-producing region, is characterized by diverse vegetation such as boreal forests and grasslands, which are sensitive to variations in rainfall [
6]. Indeed, vegetation is not only a passive indicator but also an active regulator of energy, water, and carbon flows between the Earth and the atmosphere [
7]. In this study, NDVI was selected because it effectively captures vegetation greening trends, climate–vegetation interactions, and ecosystem-specific responses [
8]. NDVI is calculated as the normalized ratio of near-infrared to visible red reflectance [
9], and exhibits a well-established linear relationship with the fraction of absorbed photosynthetically active radiation (FAPAR) and leaf area index (LAI), making it a direct and quantitative indicator of canopy photosynthetic capacity and cumulative biomass accumulation—the primary physiological responses to interannual water availability and atmospheric evaporative demand [
10]. In sum, NDVI is a reliable and essential indicator of vegetation condition in this study.
In our study, the term “atmosphere” refers to a set of variables (maximum and minimum temperatures,
and
, vapor pressure deficit (VPD), relative humidity (RH), and wind speed (WS)). Vapor pressure deficit (VPD), which is the difference between the water vapor pressure at saturation and the actual water vapor pressure at a given temperature, is a key factor in the atmospheric water demand of plants [
11]. Since the 1950s, the average global surface temperature has increased by 0.6 °C, and this warming trend has accelerated in high-latitude regions, such as the Eurasian continent [
12]. Observational and reanalysis data on air temperature, as well as remote sensing data on ground surface temperature, show that the global climate has experienced a warming trend over the past few decades [
13]. Overall, the atmospheric variables considered–maximum and minimum temperature, vapor pressure deficit (VPD), relative humidity (RH), and wind speed (WS)–constitute major climatic factors that influence vegetation growth and dynamics. Soil moisture plays a central role in agricultural sustainability and water resource management in the context of climate change and increasing water scarcity [
14].
Soil moisture plays a crucial role in the interactions between the Earth and the atmosphere, influencing a wide range of atmospheric processes at local and regional scales [
15]. Territory and climate interact in complex ways through changes in forcing factors and multiple biophysical and biogeochemical feedbacks at different spatial and temporal scales [
16]. Atmospheric variables and soil moisture are key factors that influence plant growth, soil–atmosphere interactions, and ecosystem sustainability, particularly in the context of climate change. The Three-North Shelterbelt Program (TNSP) covers more than 40% of China’s land area across the northwest, north, and northeast regions, with about half being arid or sparsely vegetated. Since 1978, China has implemented large-scale reforestation efforts in this region [
17].
Wetlands are ecosystems with unique functions that provide multiple essential ecological services, such as water conservation, climate regulation, water purification, and quality preservation [
18]. Situations in which the response of biodiversity to climate change depending on the presence, type, or rate of land use change, and vice versa, have been observed in a wide range of species and ecosystems [
19]. For instance, a previous study based on the Land Use (LU) dataset reported that the coverage of agricultural land, natural habitats, forests, and overall vegetation in Turkey increased by 18.32% [
20]. Changes in land use and cover (LULCC) have an impact on climate due to their carbon sequestration potential, i.e., their biochemical effects [
21].
Northeast China is one of the country’s major grain-producing regions; its ecosystems span a gradient from humid to semi-arid climate, encompassing forests, cultivated land, grasslands, wetlands, and urban areas [
22]. Previous studies have explored the interaction relationships between precipitation dynamics and vegetation growth across scales, yet significant limitations persist in the scientific literature. Most existing studies focus on monthly or seasonal scales, while annual dynamics remain largely unexplored.
Furthermore, variations in vegetation response according to land cover type are rarely assessed systematically. Finally, the mediating role of soil moisture and vapor pressure deficit (VPD)–a key indicator of atmospheric drought–in the transmission of the effects of extreme precipitation is still poorly characterized. These gaps limit the understanding of local climate–vegetation mechanisms and weaken adaptive management strategies.
In order to fill these gaps, we conducted this study to investigate how precipitation extremes shape annual NDVI dynamics across distinct land cover types, and to disentangle the roles of soil moisture and vapor pressure deficit (VPD), as well as bidirectional interactions between vegetation and atmospheric dryness in Northeast China (NEC). The aim is to provide scientific support for local ecosystem management, agricultural protection, and ecological restoration under ongoing climate change by answering the following three key research questions: (1) How do precipitation extreme events alter annual NDVI dynamics across different land cover types? (2) To what extent do soil moisture and VPD modulate these relationships? (3) Do bidirectional feedback between NDVI and VPD shape overall ecosystem responses?
To address these research questions, this study follows a five-step analytical framework, progressing from climate characterization to ecosystem-specific responses. Objective I identifies the spatiotemporal trends of ten precipitation extreme indices (ETCCDIs) during 2000–2022 using the Mann–Kendall test and Sen’s slope estimator, providing the climatic background of rainfall intensification and drought changes. Objective II examines the relationship between precipitation extremes and annual NDVI dynamics using Pearson and Spearman correlation analyses across different land cover types and the entire study area. Objective III investigates the mechanisms linking precipitation extremes and vegetation responses by quantifying the mediating effects of soil moisture (SM) and vapor pressure deficit (VPD) through structural equation modeling (SEM). Objective IV explores the bidirectional interactions between vegetation and atmospheric dryness by analyzing NDVI–VPD feedback pathways. Objective V evaluates differences in vegetation responses among cropland, forest, grassland, and wetland ecosystems using mixed-effects models to identify ecosystem-specific sensitivities. Together, these objectives provide a comprehensive understanding of how precipitation extremes influence soil–vegetation–atmosphere interactions in Northeast China and support climate adaptation and ecosystem management.
2. Materials and Methods
2.1. Study Area
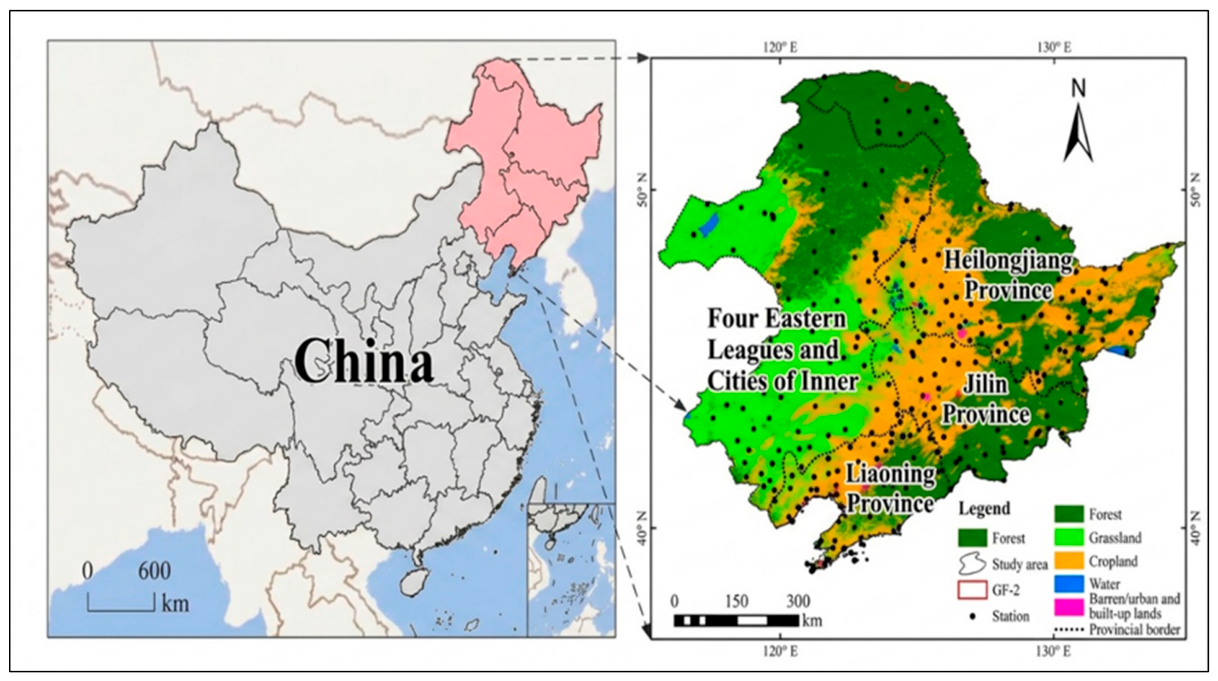
Northeast China is located between 115°32′ E–135°09′ E in longitude and 38°42′ N–53°35′ N in latitude [
23,
24]. As illustrated in
Figure 1, NEC covers a total area of 333,400
and accounts for approximately 13% of China’s total area land [
25]. These territories include Liaoning, Jilin, Heilongjiang, and the eastern part of Inner Mongolia, and exhibit complex and diversified topographic configurations.
Northeast China experiences prolonged and frigid winters, with persistent snow cover occurring from November to mid-March of the year [
26]. This distinct seasonal climatic characteristic substantially regulates local hydroclimatic cycles and seasonal vegetation dynamics. NEC was deliberately selected as the study domain for three key scientific rationales closely aligned with the core research themes of this study. First, the region possesses highly heterogeneous land cover compositions dominated by forest, cropland, and grassland ecosystems, forming a representative gradient of terrestrial environments that enables systematic comparison of vegetation responses to precipitation extremes across different land surface types. Northeast China experiences highly variable hydroclimatic conditions, with frequent precipitation extremes, changing soil moisture, and strong vapor pressure deficit (VPD) fluctuations. Such unique hydroclimatic variability renders this region an optimal site to explore the coupled impacts of precipitation extremes, SM, and VPD on interannual vegetation variations.
Thirdly, Northeast China is a climate-sensitive region experiencing rapid vegetation changes and increasing climate stress, which threaten ecosystem stability, agricultural sustainability, and ecological restoration. Therefore, the region provides an ideal case study to investigate how precipitation extremes and hydroclimatic factors influence annual NDVI dynamics. It also allows assessment of the roles of soil moisture and VPD, as well as vegetation–atmosphere feedback across different ecosystems under climate change.
2.2. Data Sources and Their Description
This study integrates quality-controlled geospatial and hydroclimatic datasets to assess how precipitation extremes affect vegetation–soil–atmosphere interactions in Northeast China during the period 2000 to 2022. The data cover Heilongjiang, Jilin, Liaoning provinces, and eastern Inner Mongolia. Precipitation records were derived from the CHM-PRE gridded gauge-based dataset, interpolated from nationwide in situ meteorological observations. Raw NetCDF daily precipitation records were initially inspected and validated via Panoply 5.7.1 to verify structural integrity, spatial coverage, and temporal continuity.
A Python 3.13 64-bit workflow was used to preprocess data, including study area extraction, temporal alignment, and daily precipitation series generation. The final processed precipitation dataset encompasses 8400 daily observational days across the 23-year study timeframe, providing robust gauge-calibrated records for the calculation of multi-indicator ETCCDI precipitation extreme metrics [
26].
The ETCCDI calculation followed a daily-to-annual processing framework. Specifically, quality-controlled daily precipitation records were first used as input to calculate the ten precipitation extreme indices according to the standard ETCCDI definitions. Only after the daily-based index calculations were completed were the resulting annual index values aggregated for each year (2000–2022). These annual ETCCDIs were then used for subsequent trend analysis, spatial assessment, and correlation analysis with vegetation responses.
For each station, these indices were calculated directly from daily wet-day series (RR ≥ 1.0 mm) following standard ETCCDI definitions, with annual index values subsequently derived and used for the trend and correlation analyses described in
Section 2.4.
Second, NDVI is a remote sensing index widely used to assess vegetation cover and changes, which exhibits a positive correlation [
9,
27]. NDVI is derived from the ratio of red and near-infrared spectral reflectance and is used to quantify green vegetation [
28]. From this, the response characteristics and variations in the NDVI allow for capturing vegetation dynamics and reflect temporal and spatial changes in its growth state. NDVI data were downloaded from the Baidu Cloud platform and were therefore used as an indicator of vegetation greenness in order to analyze vegetation conditions in the study area systematically.
Third, the land cover and land use (LULC) data were obtained from the national land cover product, downloaded from the Baidu Cloud platform. The original dataset initially comprised 25 land cover classification categories, covering various land surface types. To meet the research objectives and ensure a focused analysis of plant ecosystem dynamics, the initial classification system was simplified and reclassified.
In this study, only four dominant land cover types, closely linked to vegetation growth and ecological changes, were retained for further analysis: cropland, forests, grasslands, and wetlands. This targeted reclassification effectively eliminates the interference of non-vegetated areas and allows for a stratified and accurate comparative analysis of the interactions between vegetation, climate, and ecological conditions within the different terrestrial plant ecosystems of the study area.
Fourth, key atmospheric and soil hydrological covariates including soil moisture (SM), vapor pressure deficit (VPD), maximum and minimum temperature (
,
), relative humidity (RH), and wind speed (WS) were extracted exclusively from the TerraClimate dataset, with no precipitation variables sourced from this product. Renowned for high spatiotemporal consistency in terrestrial hydroclimatic simulations, this global land surface dataset provides continuous monthly and daily gridded climatic and hydrological records. All raw temporal series of the above covariates were uniformly aggregated into annual mean values to conform to the study’s interannual analytical framework, supporting subsequent correlation analysis, mediating effect quantification, and bidirectional vegetation–atmosphere feedback modeling. Detailed specifications of all datasets, including variable categories, data origins, and spatial and temporal resolutions (
Table 1).
Spatial harmonization was performed to integrate the multi-source datasets with different spatial resolutions. All datasets were first transformed into the same coordinate reference system and clipped to the Northeast China study domain. Because precipitation extremes were derived from the 0.25° × 0.25° CHM-PRE grid, this grid was selected as the common spatial framework for subsequent analyses. Continuous variables, including NDVI, soil moisture, and VPD, were resampled to the precipitation grid using bilinear interpolation, while categorical land cover classes were harmonized using nearest-neighbor resampling to avoid altering class boundaries. After spatial transformation, pixel-level matching was conducted so that annual precipitation extremes, vegetation conditions, hydroclimatic variables, and land cover categories represented identical spatial units. This procedure ensured spatial consistency among all datasets used in correlation, mixed-effects, and structural equation modeling analyses.
2.3. Research Processing and Structure
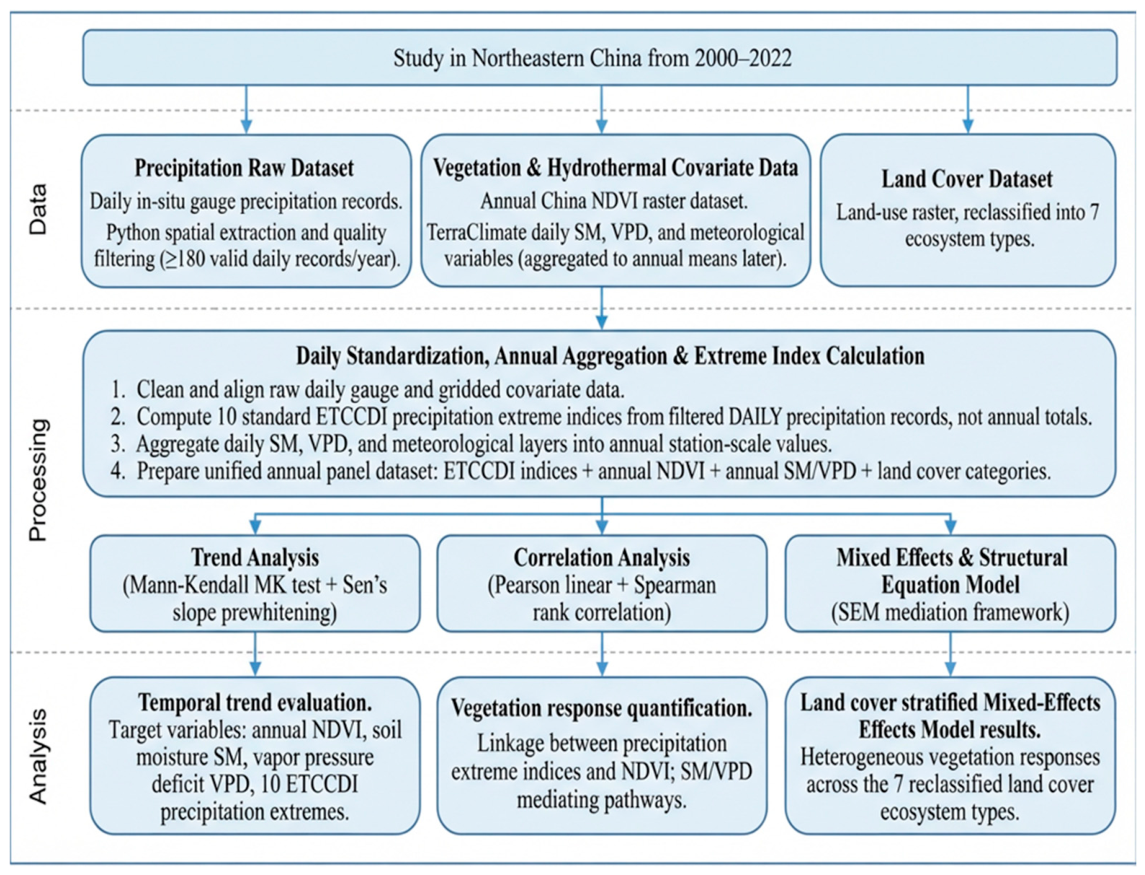
Based on
Figure 2, the study integrates three primary datasets. Precipitation data consist of daily gauge-based records utilized to compute the ten ETCCDIs. The annual China NDVI dataset represents vegetation dynamics. Land cover information is reclassified into seven distinct types. These datasets, along with atmospheric data, were extracted from diverse sources detailed in
Table 1. Following data acquisition and processing, which included temporal trend and correlation analyses, we implemented three complementary statistical methods. First, the Mann–Kendall test was employed to assess temporal trends in the precipitation extreme indices. Second, Pearson and Spearman correlations were used to evaluate the response of vegetation (NDVI) to rainfall, soil moisture (SM), and vapor pressure deficit (VPD). Finally, a mixed-effects model, coupled with structural equation modeling (SEM), was applied to analyze the specific effects of different land cover types, providing a comprehensive framework for understanding the complex interactions driving vegetation dynamics in the region.
2.4. Methods
2.4.1. Theil–Sen Median Trend Analysis and Mann–Kendall Nonparametric Test
The Theil–Sen median analysis, also known as Sen slope estimation, is a nonparametric statistical method. It is rarely affected by outliers and is suitable for analyzing the trend of long-term series data. The calculation formula is:
where
and
refer to the time series data; when
β > 0, the time series shows an upward trend, and when
β < 0, the time series shows a downward trend.
The Mann–Kendall (MK) Mann 1945, Kendall 1948 test evaluates monotonic temporal trends within univariate time series with the null hypothesis () positing independent, identically distributed observations lacking directional trend. Standard MK inference assumes serial independence, an assumption violated by temporal autocorrelation inherent in annual hydroclimatic records, which inflates test statistic magnitude and overestimates statistical significance.
To mitigate serial correlation bias, a pre-whitening procedure was implemented within our custom Python 3.13 64-bit workflow prior to MK testing: lag-1 autocorrelation coefficients were computed for each station’s precipitation extreme index time series, and autoregressive AR (1) signal components were removed from raw time series to eliminate serial dependence. Post-pre-whitening residual series were subjected to standard Mann–Kendall (MK) statistic and Sen’s slope calculation.
The 2000–2022 period was selected to align with high-quality NDVI and land cover data availability, while nonparametric trend methods (Mann–Kendall, Sen’s slope) provide robust detection with
n = 23 observations, and spatial replication across 116 stations (2668 site-year observations) compensates for temporal depth in mixed-effects and SEM analyses. The annual temporal scale was selected to capture interannual climate–vegetation interactions and reduce seasonal variability. Although the study period contains 23 annual observations, the analysis benefits from spatial replication across multiple grid cells. Mixed-effects models were used to account for spatial heterogeneity, and SEM mediation pathways were validated through bootstrap resampling to improve the reliability of the results. This period also captures the recent acceleration of climate change impacts on Northeast China’s precipitation regimes [
29].
For a time series
with length ‘n’, the test statistic S is calculated by:
where the function
is defined as:
When “n” ≥ 8, the distribution of S is approximately normal. If there are no tied data in the time series, the mean and variance of S can be calculated as:
The standardized statistic Z, which is normally distributed with mean (Z) = 0 and var (Z) = 1, can then be calculated as:
The two-sided
p-value is computed by:
where
is the cumulative distribution function of the standard normal distribution. When the
p-value of the MK test is smaller than the selected significance level (α), the null hypothesis is rejected, and the alternative hypothesis is accepted. This approach ensures that the chance of making a type I error (rejecting H0 when a trend does not exist) is limited. The power of the MK test, on the other hand, describes the likelihood of making a type II error (failing to reject H0 when a trend exists) during the hypothesis test.
To reduce the influence of temporal and spatial dependence, annual extreme indices and vegetation variables were used for trend analysis, and all datasets were spatially matched to the same grid framework. In addition, mixed-effects models included spatial units as random effects to account for location-specific variability and repeated observations.
2.4.2. Vegetation and Land Surface Trends (NDVI, Soil Moisture, VPD)
Ordinary least squares (OLS) linear regression is a parametric statistical method used to detect linear temporal trends within continuous time series. This approach enables the estimation of the magnitude and direction of annual variations in environmental variables, independent of minor seasonal fluctuations. In the present study, OLS linear regression was applied to quantify long-term temporal trends in annual NDVI, soil moisture, and VPD, in order to characterize vegetation dynamics as well as surface hydroclimatic variations. The linear trend model is defined as follows:
where Y represents the annual mean of the variable under consideration (NDVI, soil moisture, or VPD),
represents the slope (annual rate of change), and ϵ represents the residual term. Independent trend calculations were performed to facilitate a comparative analysis of the temporal variations in vegetation greenness and its controlling factors.
2.4.3. Spatial Correlation Analysis
Pearson’s correlation coefficient is a standard statistical tool widely used in environmental and ecological scientific research. It quantifies the strength and direction of the linear association between two continuous variables, X and Y. The value of the coefficient ranges strictly from +1 to −1: a value of 1 indicates a perfect positive linear correlation; 0 signals the absence of a linear correlation, and −1 represents a perfect negative linear correlation. Initially conceptualized by Francis Galton in the 1880s, this correlation indicator was refined and formalized by Karl Pearson’s (Equation (8)):
where
denotes the number of paired annual observations with complete datasets,
represents the annual NDVI value for the study area during the
-th year, and
corresponds to the associated value of each precipitation extreme index.
Additionally, Spearman’s rank correlation analysis was employed to assess monotonic relationships between variables; this method offers the advantage of being robust to non-normal data distributions and outlier phenomena frequently encountered in remote sensing and meteorological time series spanning long periods. In the present study, Pearson and Spearman correlation analyses were used in tandem to comprehensively quantify how the five indices capture complementary dimensions of precipitation extremes relevant to vegetation dynamics. PRCPTOT represents total annual water input, providing baseline hydrological context. SDII quantifies average rainfall intensity, distinguishing infiltration-friendly events from runoff-generating events that reduce soil moisture recharge [
30]. R95P captures the contribution of very heavy rainfall to total precipitation, indicating extreme wet events that can cause waterlogging stress or replenish deep soil moisture [
31]. RX5day measures short-duration cumulative rainfall, representing flood risk and excessive saturation particularly relevant to agricultural systems [
32]. CDD complements these wet extremes by quantifying drought duration [
33]. Together, these indices provide a comprehensive characterization—from total volume and intensity to extremes and dry spells–enabling identification of the precipitation dimensions that influence vegetation greenness across ecosystems most strongly.
Spearman’s rank correlation coefficient (ρ) was applied to assess monotonic relationships, as it is robust to non-normality and outliers (Equation (9)):
where
is the difference between the ranks of the paired NDVI and precipitation index values, and
is the number of observations.
Taking land use heterogeneity into account, the relationships between variables in different landscape contexts were compared. All correlation analyses were stratified according to four dominant land use classes: cropland, forests, grasslands, and wetlands. Correlation calculations were also performed for the entire study area to obtain an overall spatial correlation pattern between vegetation cover and extreme rainfall conditions.
2.4.4. Mixed-Effects Model
Restricted maximum likelihood estimation (REML) is a widely accepted and frequently used method for fitting linear mixed models. Its main advantage lies in reducing bias in variance component estimates. In this study, linear mixed models (LMMs) fitted using the REML approach were used to dissociate the independent effects of extreme rainfall on vegetation greening dynamics [
34]. The mean annual normalized difference vegetation index (NDVI) was defined as the dependent variable for all model iterations. The true observational unit in this analysis is each grid cell (pixel) from the 0.25° × 0.25° CHM-PRE precipitation product and the ~5 km NDVI product, with all variables extracted at matching spatial coordinates. A random intercept μ
i was included for each grid cell location to account for repeated annual observations and unmeasured spatial heterogeneity across the 116 effectively independent grid cell locations in Northeast China.
To circumvent multicollinearity across interdependent precipitation extreme metrics, separate univariate LMMs were parameterized for five core ETCCDI precipitation indices: total annual precipitation (PRCPTOT), simple daily precipitation intensity (SDII), extreme heavy precipitation (R95p), maximum 5-day cumulative precipitation (RX5day), and CDD. All models retained a consistent suite of annually aggregated, fixed confounding terms: annual maximum temperature (), full-year mean VPD, annual mean soil moisture, and calendar year (centered relative to the study baseline year 2000 to simplify slope interpretability). The observational unit was defined as the grid–cell–year combination. All datasets, including precipitation extremes, NDVI, soil moisture, VPD, and land cover information, were spatially matched within the same grid cells before analysis. The spatial unit was treated as the random effect in the mixed-effects models to account for location-specific variability and repeated annual observations.
A random spatial-unit intercept was incorporated into the model to account for repeated annual observations and location-specific heterogeneity.
where
is the vegetation greenness at grid cell i in year t;
is the one precipitation index at a time;
:~N (
) is the grid cell-specific random intercept, and
:
is the residual error.
After model calibration, fixed effects coefficients, standard errors, and p-values were extracted to quantify and assess the significance of each extreme precipitation index on the NDVI. The predictive performance and goodness of fit of each independent linear mixed model were evaluated using the Akaike information criteria (AIC) and Bayesian information criteria (BIC).
2.4.5. Pathway/Mediation Analysis and Bidirectional Feedback
Structural equation modeling (SEM) is a robust multivariate statistical technique widely used in ecology and hydrology to disentangle complex causal associations between multiple interacting variables. Unlike classical regression approaches, SEM allows for the simultaneous quantification of direct and indirect causal effects, making it particularly well-suited for exploring mediation pathways and bidirectional interactive relationships within coupled climate–vegetation systems. In this study, a structural equation modeling (SEM) path analysis was implemented to systematically clarify how extreme precipitation indices regulate vegetation greenness (NDVI) through direct causal pathways and indirect mediating effects related to soil moisture and vapor pressure deficit (VPD).
SEM models were further evaluated through multiple fit indicators and re-specified by removing unsupported pathways. Mediation effects were interpreted carefully because values exceeding 100% may result from opposite signs between direct and indirect effects, indicating complex mediation patterns. Therefore, these results represent the relative contribution of indirect pathways rather than simple proportional effects.
All SEM models were rigorously re-specified and diagnostically validated following four protocols to ensure robust causal partitioning and address heterogeneous initial fit. First, multicollinearity was mitigated via VIF thresholding (VIF < 3) with constrained residual covariances for correlated precipitation metrics. Second, ecologically grounded residual covariance relaxation between soil moisture (SM) and vapor pressure deficit (VPD) was introduced to capture land surface evaporative coupling and improve global fit. Third, nested model parsimonization via ΔAIC/ΔCFI-trimming removed non-significant, mechanistically unsupported direct precipitation-NDVI paths. Fourth, 10,000 station-clustered bootstrap resampling was applied to validate persistent statistical significance of all indirect mediation effects and eliminate sampling-driven inflated mediation fractions.
2.4.6. Interaction Analysis
Linear mixed-effects interaction models were used to quantitatively examine the moderating effects of land cover type on the relationships between extreme precipitation indices and vegetation greenness dynamics. This analytical framework allows for the explicit testing of climate–vegetation interaction responses, assessing whether the magnitude and direction of the association between extreme precipitation and the NDVI differ significantly across different ecosystem types. Four dominant land cover classes–crops, forests, grasslands, and wetlands–were included as categorical moderators to capture the heterogeneity of vegetation sensitivity profiles. The general form of the linear mixed-effects model equation is expressed as:
where NDVI represents the normalized difference vegetation index at station i during year t; PE denotes a precipitation extremes index (e.g., R95P, RX5day, or CDD); LC is the categorical land cover type, and X is a vector of covariates including maximum temperature, vapor pressure deficit (VPD), soil moisture, and year (centered on 2000). The term
denotes the interaction effect between the precipitation index and land cover type. A significant β value indicates that the vegetation response to precipitation extremes is modulated by land cover.
3. Results
3.1. Variation in Extreme Precipitation over the Years
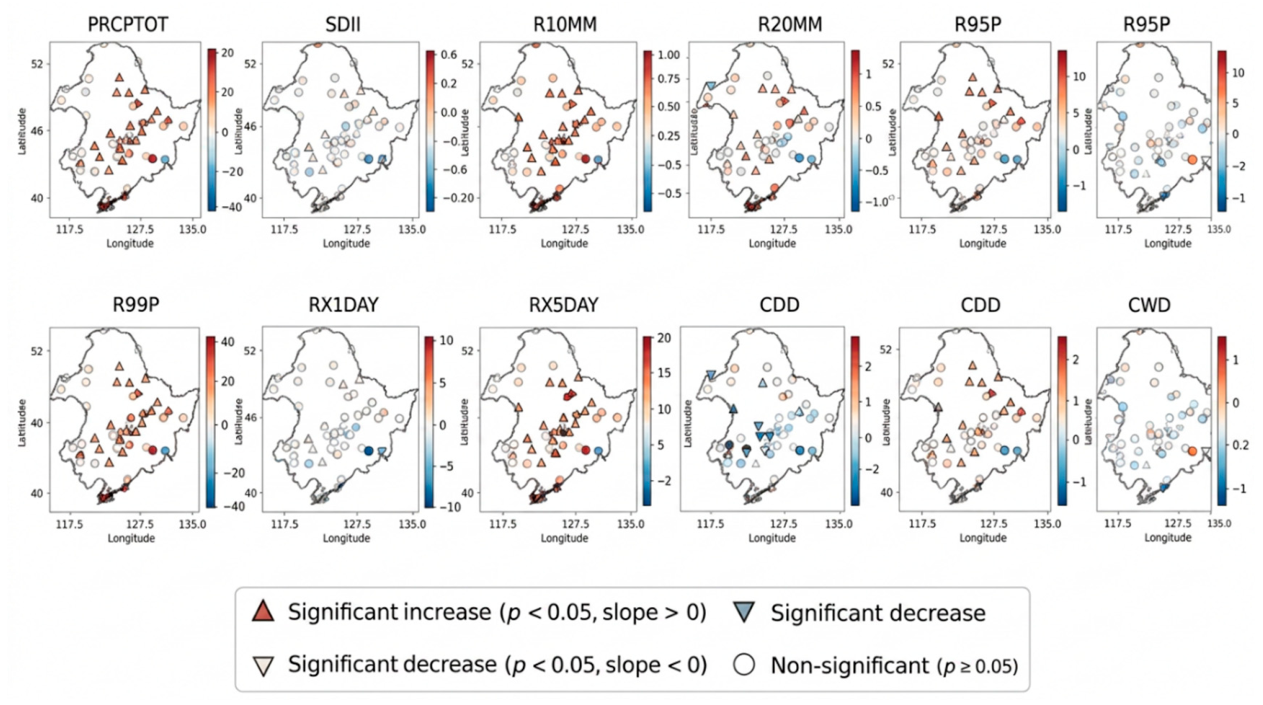
The annual temporal variations in ten precipitation extreme indices (PRCPTOT, SDII, R10 mm, R20 mm, R95P, R99P, RX1day, RX5day, CDD, and CWD) were analyzed in Northeast China for the period 2000–2022 (
Figure 3). The long-term temporal trends of each index were quantified using the nonparametric Mann–Kendall test, while Sen’s slope estimator was applied to calculate the magnitude of the temporal variations at each weather station. The Mann–Kendall test was then used to determine the statistical significance of each trend, classifying the station-level variations as significant upward trends (
p < 0.05), significant downward trends (
p < 0.05), and non-significant trends (
p ≥ 0.05) for the spatial mapping of all precipitation extreme indicators.
Over the 23-year study period, the ten extreme rainfall indices showed distinct temporal trends and strong spatial heterogeneity in Northeast China. Regarding the extreme rainfall indices, R95P and R20 mm exhibited widespread and significant upward trends (p < 0.05) in most southern regions of the study area, indicating an intensification of heavy rainfall events in southern Northeast China.
Conversely, the CDD index showed a significant upward trend (p < 0.05) in northern regions, revealing a clear trend toward prolonged dry conditions in these areas. For the precipitation intensity and total precipitation indicators, SDII and PRCPTOT showed stable temporal variations without a significant trend (p ≥ 0.05) in central Northeast China, reflecting relatively stable overall precipitation conditions in this area.
Collectively, these spatiotemporal patterns highlight a clear regional differentiation in extreme rainfall variations in Northeast China. The southern study area is characterized by an intensification of heavy rainfall events, while the northern region experiences worsening drought, and the central region maintains relatively stable rainfall patterns. This comprehensive assessment effectively identifies the spatially divergent behavior of extreme rainfall, thus providing a systematic overview of the spatiotemporal characteristics of wet and dry climatic extremes in Northeast China over the past two decades.
3.2. Interannual Variation in NDVI, Soil Moisture, VPD, and Temperature
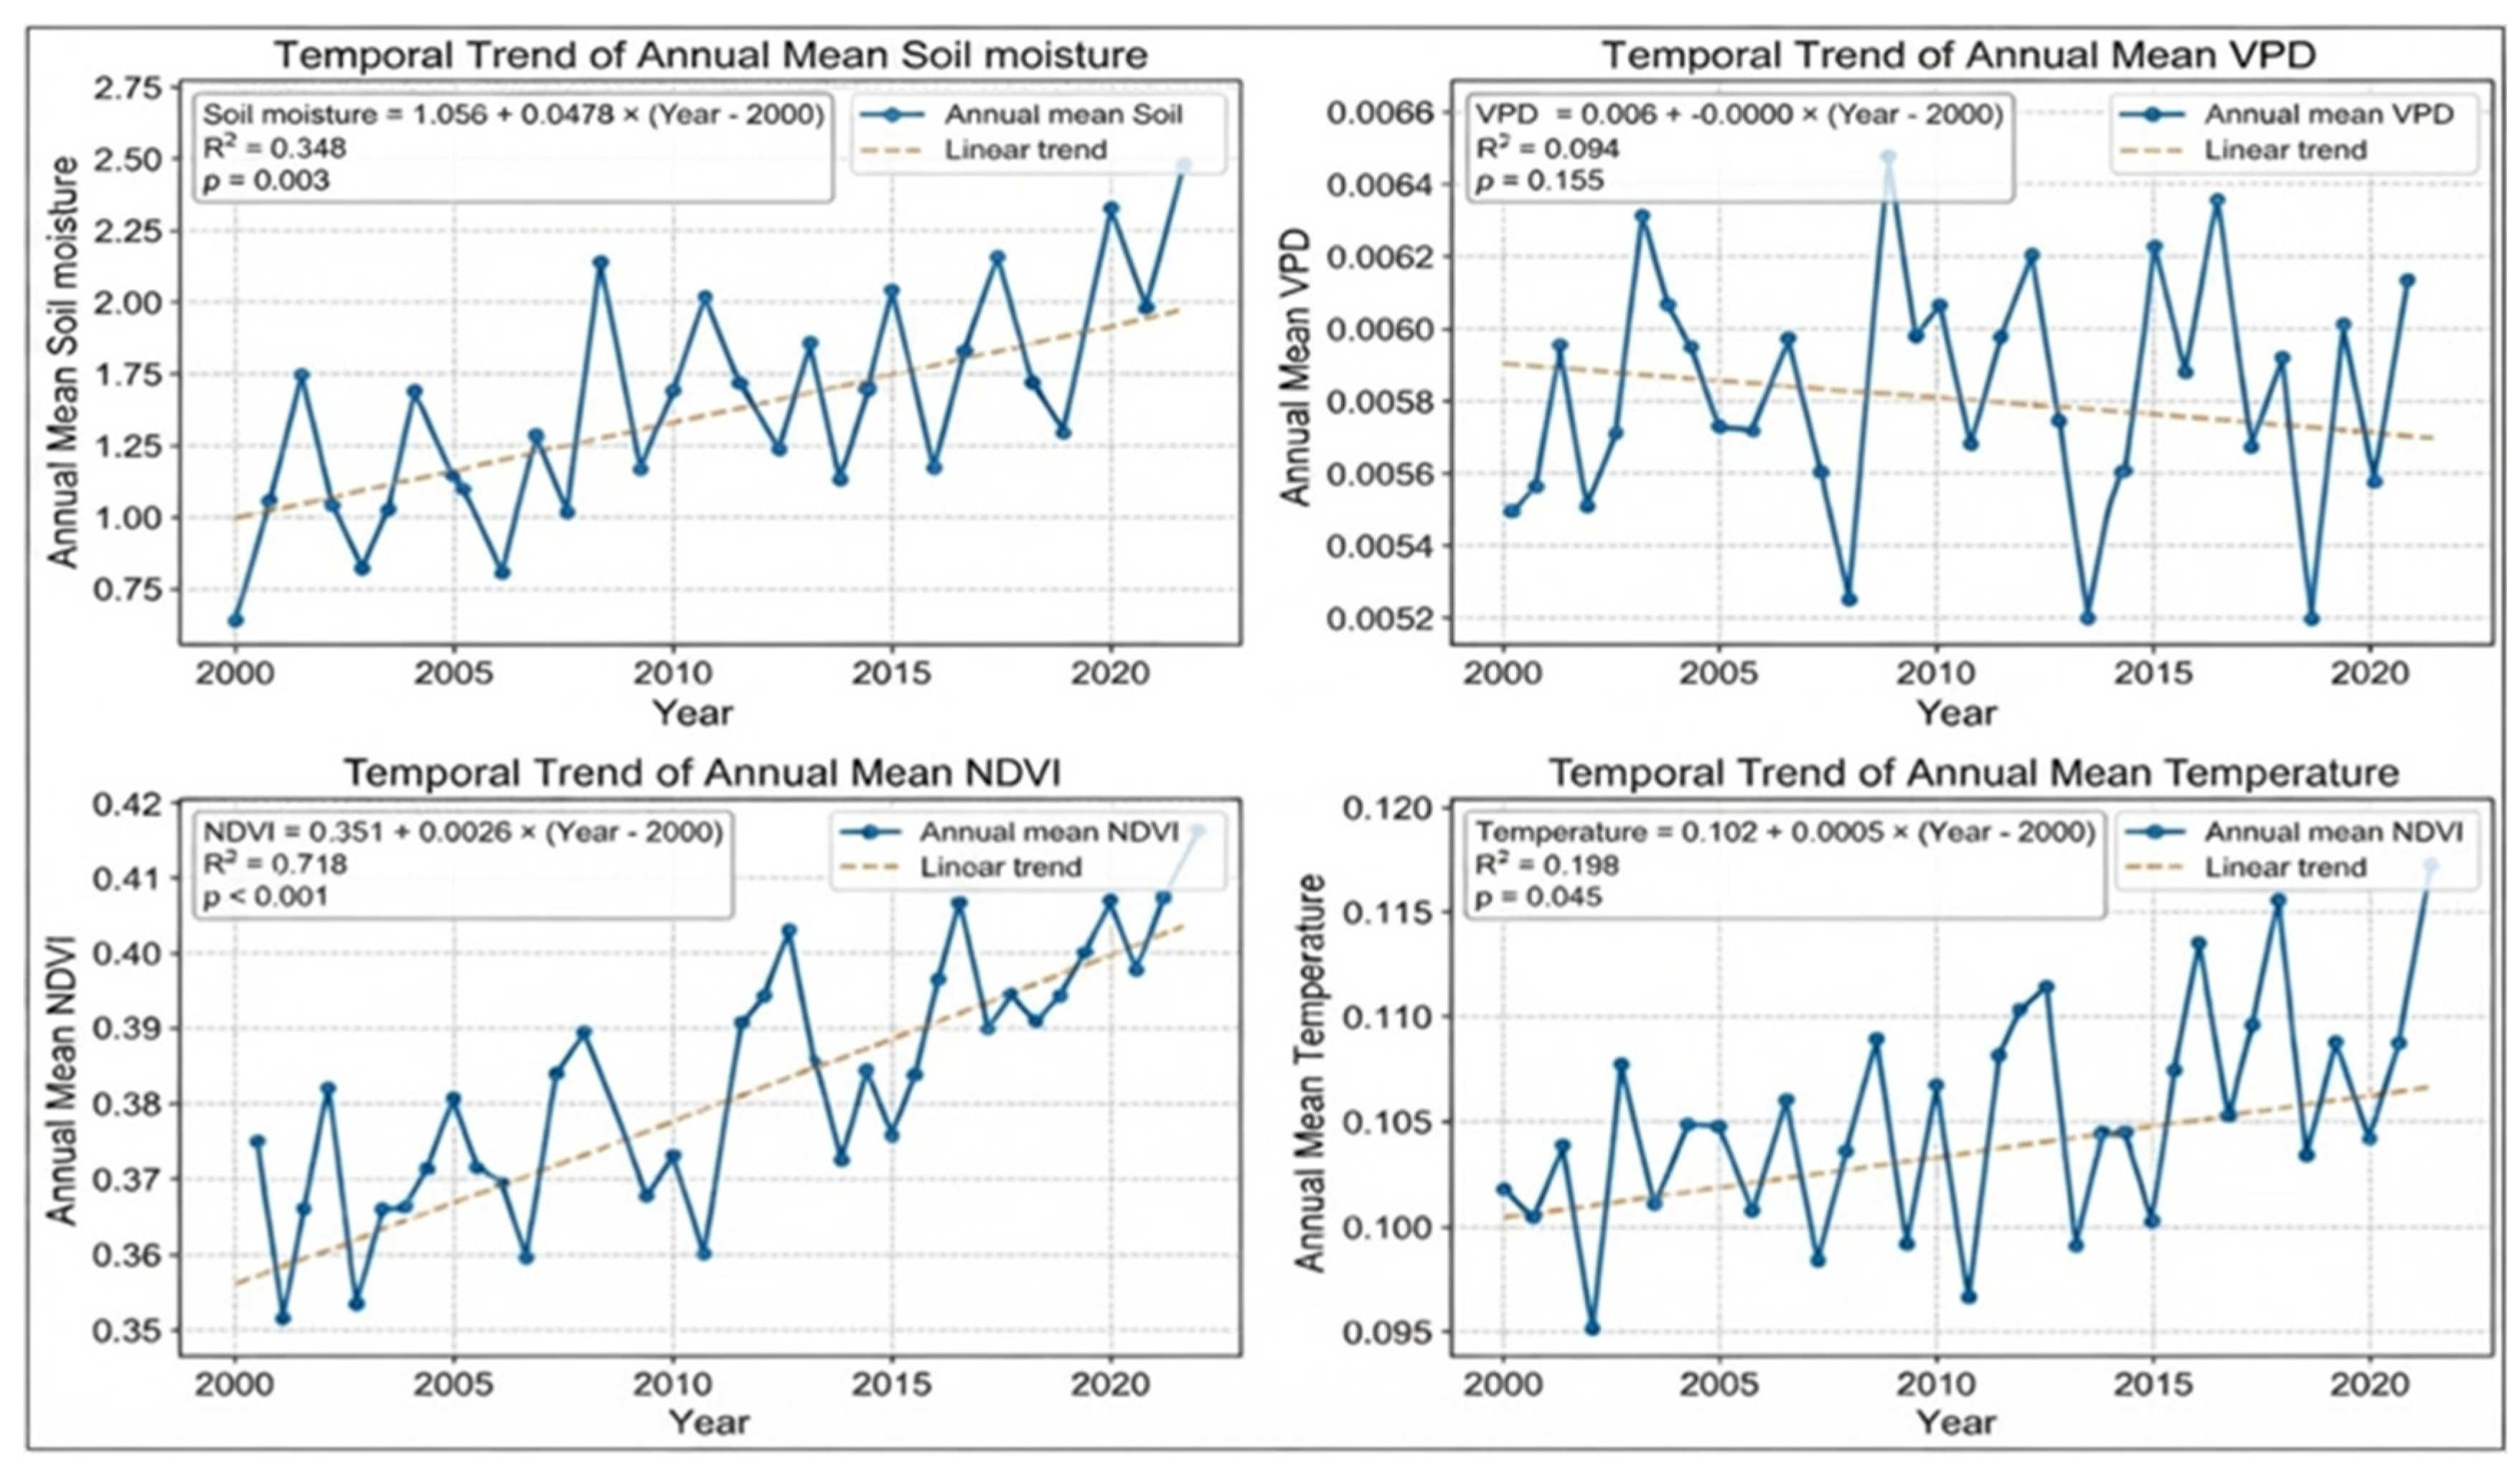
Interannual trends in vegetation greenness (NDVI) and key land and atmospheric surface variables (soil moisture, vapor pressure deficit (VPD), and temperature) were assessed across the Northeast region of China for the period 2000-2022 to characterize their spatiotemporal dynamics. Annual mean values of NDVI, soil moisture, VPD, and temperature were calculated for the entire study area, and linear regression models were fitted for each variable to quantify their temporal trends. To improve the interpretability of the regression slopes (
Figure 4), the “year” variable was centered on the year 2000, allowing for a clear interpretation of the magnitude of the trends. Regarding vegetation greenness (NDVI), the annual average showed a marked and statistically significant upward trend over the 23-year study period (slope = 0.0026 yr
−1, R
2 = 0.718,
p < 0.001). This significant upward trend confirms a clear greening phenomenon across Northeast China, reflecting improved vegetation growth conditions, favored by positive trends in soil moisture and temperature.
For soil moisture, the average annual values showed a statistically significant upward trend (slope = 0.0478 yr−1, R2 = 0.348, p = 0.003). This upward trend indicates an increase in available soil water content in Northeast China between 2000 and 2022, providing optimal water conditions for plant growth and promoting ecosystem stability during the study period. In contrast, the vapor pressure deficit (VPD) showed a slight downward trend (slope = −0.0000 yr−1) during the study period, which was not statistically significant (R2 = 0.094, p = 0.155). This non-significant trend indicates that atmospheric moisture demand (represented by VPD) remained broadly stable in Northeast China between 2000 and 2022, with no significant impact on vegetation water consumption, soil moisture retention, or overall ecosystem dynamics.
Regarding temperature, the annual average showed a slight but statistically significant upward trend (slope = 0.0005 yr−1, R2 = 0.198, p = 0.045). This moderate upward trend in temperature, combined with increased soil moisture, likely had a synergistic effect on plant growth, promoting the observed greening trend and improving the overall health of the vegetation across the study area.
3.3. Correlation Patterns Between NDVI and Climatic and Environmental Variables
Analysis of Pearson and Spearman correlations revealed consistent patterns between NDVI and climatic variables, both at the regional scale and by land cover type. These relationships, robust to both types of analysis, underscore the central role of water availability in vegetation dynamics in Northeast China.
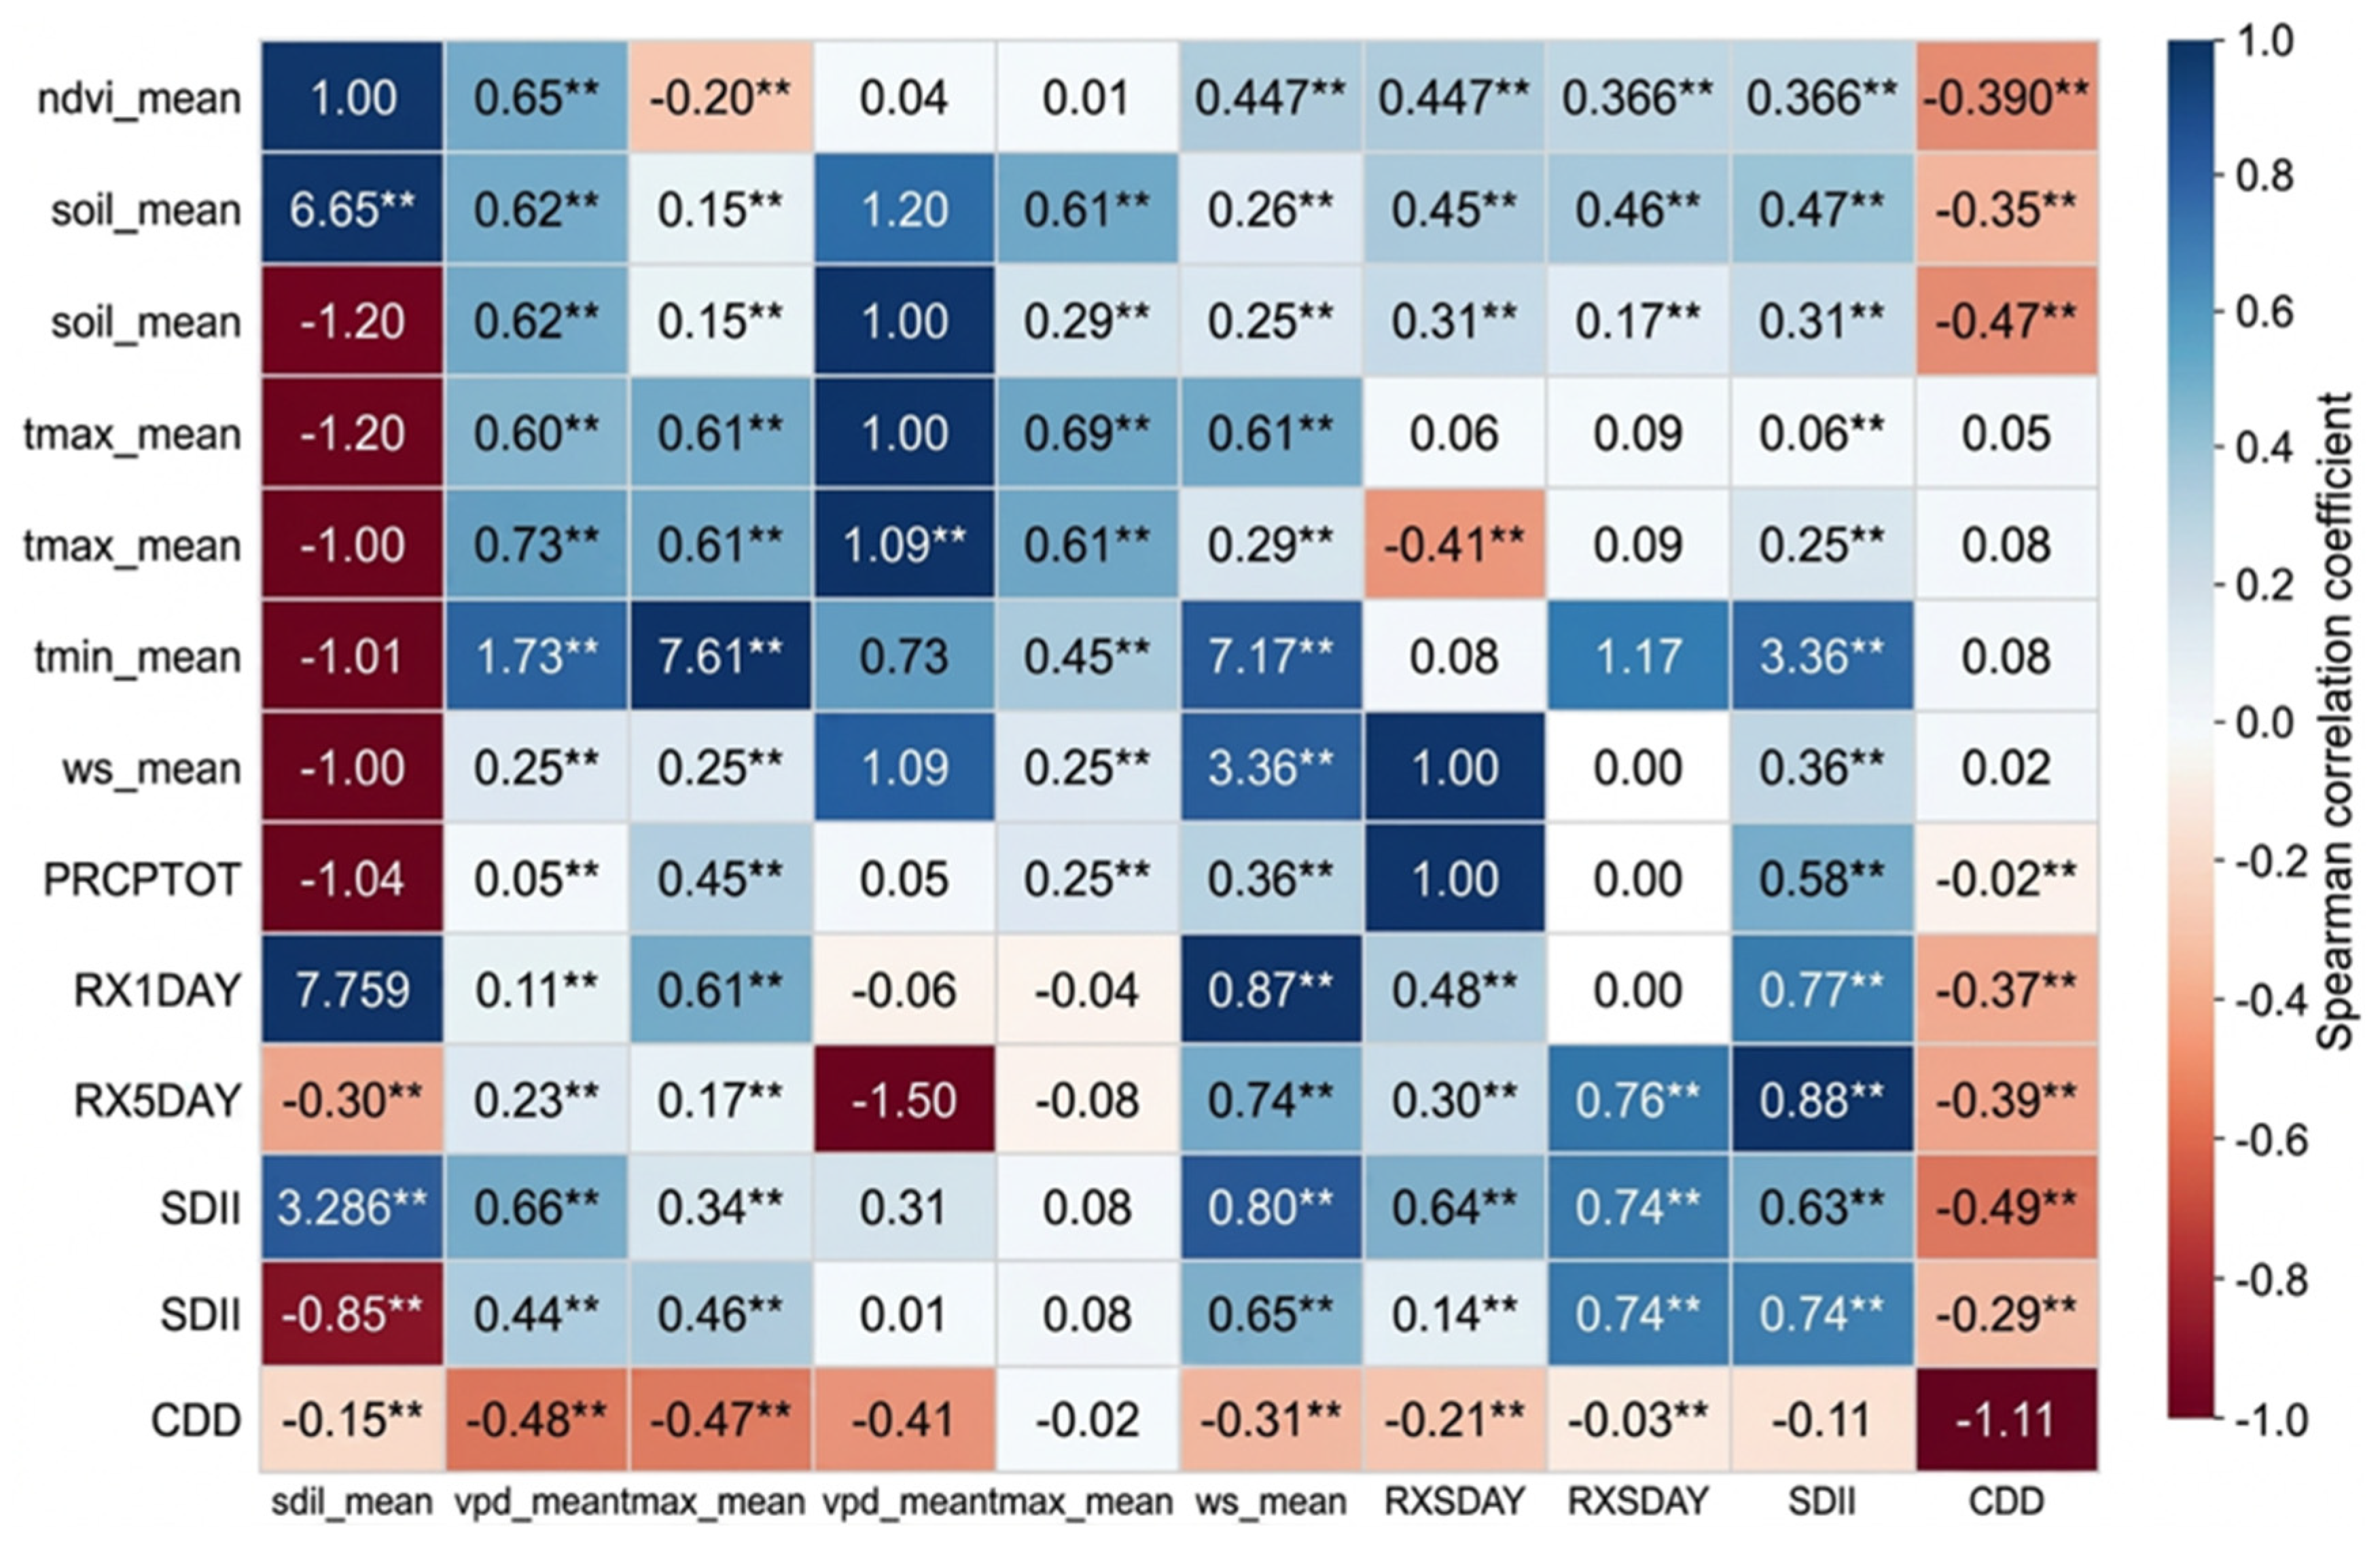
Across the entire study area, the Spearman correlation in
Figure 5 shows that NDVI has a strong and highly significant positive correlation with soil moisture (ρ = 0.65,
p < 0.01), confirming that soil water availability is the primary factor regulating plant growth. Conversely, the vapor pressure deficit (VPD) shows a marked negative correlation with the NDVI (ρ = −0.48,
p < 0.01), indicating that higher atmospheric moisture demand exerts water stress on vegetation. The temperature variables do not show a significant correlation with the NDVI (ρ = 0.04 and 0.01, respectively), suggesting that water-related factors are more dominant than thermal factors in this region.
Among the precipitation indices, PRCPTOT is most strongly correlated with NDVI (ρ = 0.60, p < 0.01), followed by the precipitation extreme indices: R95P (ρ = 0.50, p < 0.01), RX5DAY (ρ = 0.37, p < 0.01), and SDII (ρ = 0.29, p < 0.01). Conversely, CDD is negatively correlated with NDVI (ρ = −0.39, p < 0.01), demonstrating that prolonged drought episodes reduce vegetation greenness. Spearman correlation results show strong intercorrelations between precipitation indices, including PRCPTOT, R95P, RX5DAY, and SDII, indicating that these indicators are interdependent with overall precipitation variation. In contrast, CDD exhibits significant negative correlations with the four aforementioned precipitation indices, thus confirming that CDD acts as an inverse indicator of regional water availability. Conversely, CDD is negatively associated with these same indices, confirming that it is an opposing indicator of water availability.
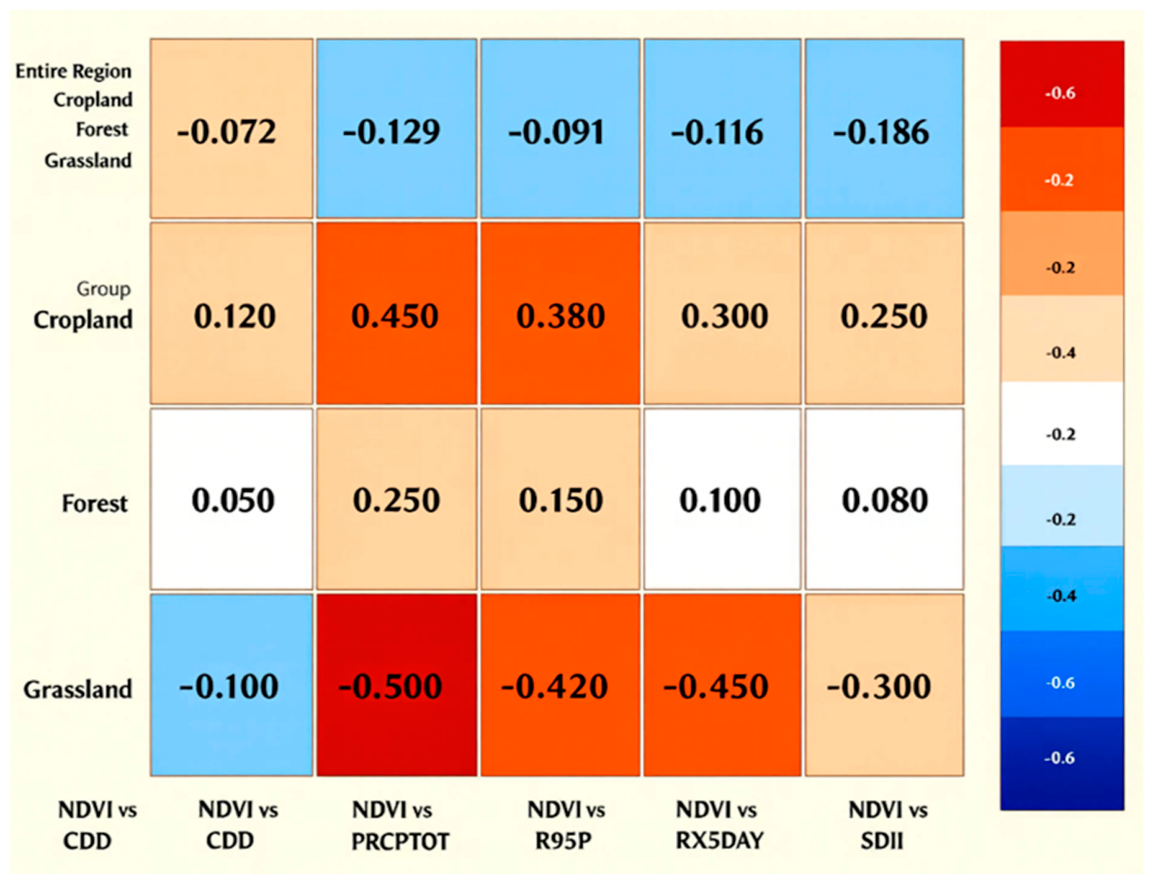
Analysis by land cover group highlights marked differences in the response of NDVI to climatic variables: grasslands show the strongest correlation between the NDVI and cumulative annual rainfall (PRCPTOT, r = 0.50;
Figure 6), as well as with extreme rainfall indicators (R95P (r = 0.42), RX5DAY (r = 0.35), and SDII (r = 0.30)). Given that these ecosystems are largely undisturbed by humans, they are primarily dependent on rainfall and are therefore highly sensitive to water fluctuations.
Furthermore, the negative correlation observed with the CDD index (r = −0.10) confirms their vulnerability to droughts. As for cultivated land, it also shows a strong positive correlation with PRCPTOT (r = 0.45), R95P (r = 0.38), and RX5DAY (r = 0.30). Even though irrigation reduces dependence on rainfall, the results show that annual rainfall and extreme weather events remain major factors in agricultural productivity in the study area. For forests, the correlations between the NDVI and rainfall indicators are weaker (PRCPTOT: r = 0.20; R95P: r = 0.15). Thus, thanks to their deep root systems, these ecosystems are less dependent on annual rainfall and possess greater resilience to water fluctuations. Wetlands show moderate positive correlations with PRCPTOT (r = 0.30), R95P (r = 0.25), and RX5DAY (r = 0.20); however, these values are lower than those of grasslands and croplands. This result is explained by the permanent presence of water in these environments, which reduces their dependence on direct rainfall.
Finally, at the scale of the entire region, the correlations are generally weak, or even negative for some indicators (PRCPTOT: r = −0.13; CDD: r = 0.07). This observation probably results from the averaging of the opposing reactions of the different types of land use, which masks the relationships specific to each ecosystem.
3.4. Mixed Effects Models
Table 2,
Table 3 and
Table 4 summarize model outputs. To get an assessment of the influence of precipitation extremes on vegetation greenness, the linear mixed-effect models (LMMs) with a random intercept for each monitoring station were fitted separately for each precipitation index. The full model specifications, including environmental covariates (maximum temperature, vapor pressure deficit, soil moisture, and year), are detailed in
Section 2.4.4 (Methods). Model fit was evaluated using the Akaike information criterion (AIC) and the Bayesian information criterion (BIC), with these values reported alongside the fixed-effects estimates (
Table 4;
Figure 3).
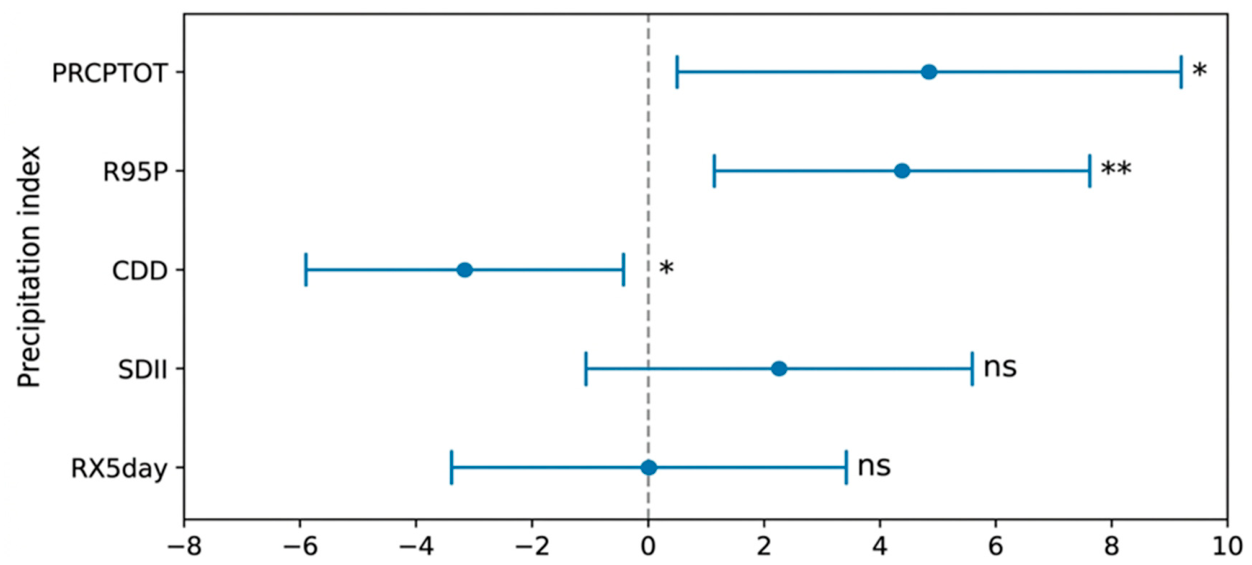
Of the five rainfall indices tested, three showed a statistically significant association with the NDVI (
Table 2,
Figure 2). Total annual rainfall (PRCPTOT) was positively and significantly associated with the NDVI (coefficient = 4.8 × 10
−5% NDVI per standard deviation, standard error = 2.2 × 10
−5,
p = 0.030), indicating that higher annual rainfall promotes greener vegetation. Heavy rainfall events (R95P) also showed a highly significant positive effect (coefficient = 4.4 × 10
−5, standard error = 1.6 × 10
−5,
p = 0.007), corresponding to a greening response following these events. In contrast, CDD had a negative effect on NDVI (coefficient = 3.3 × 10
−5, SE = 1.3 × 10
−5,
p = 0.013), highlighting the negative impact of prolonged periods of drought.
The remaining two precipitation indices exhibited weak, non-significant associations with vegetation greenness. Neither daily precipitation intensity (SDII) (coefficient = 2.2 × 10
−5, standard error = 1.7 × 10
−5,
p = 0.183) nor maximum five-day precipitation (RX5day) (coefficient ≈ 4 × 10
−7, standard error = 1.7 × 10
−5,
p = 0.982) reached the significance level
Table 3. The near-zero coefficient of RX5day implies that short-duration multi-day extreme precipitation events do not significantly shape annual-scale vegetation greenness in Northeast China.
3.5. Mediation Pathways (Structural Equation Modeling, SEM)
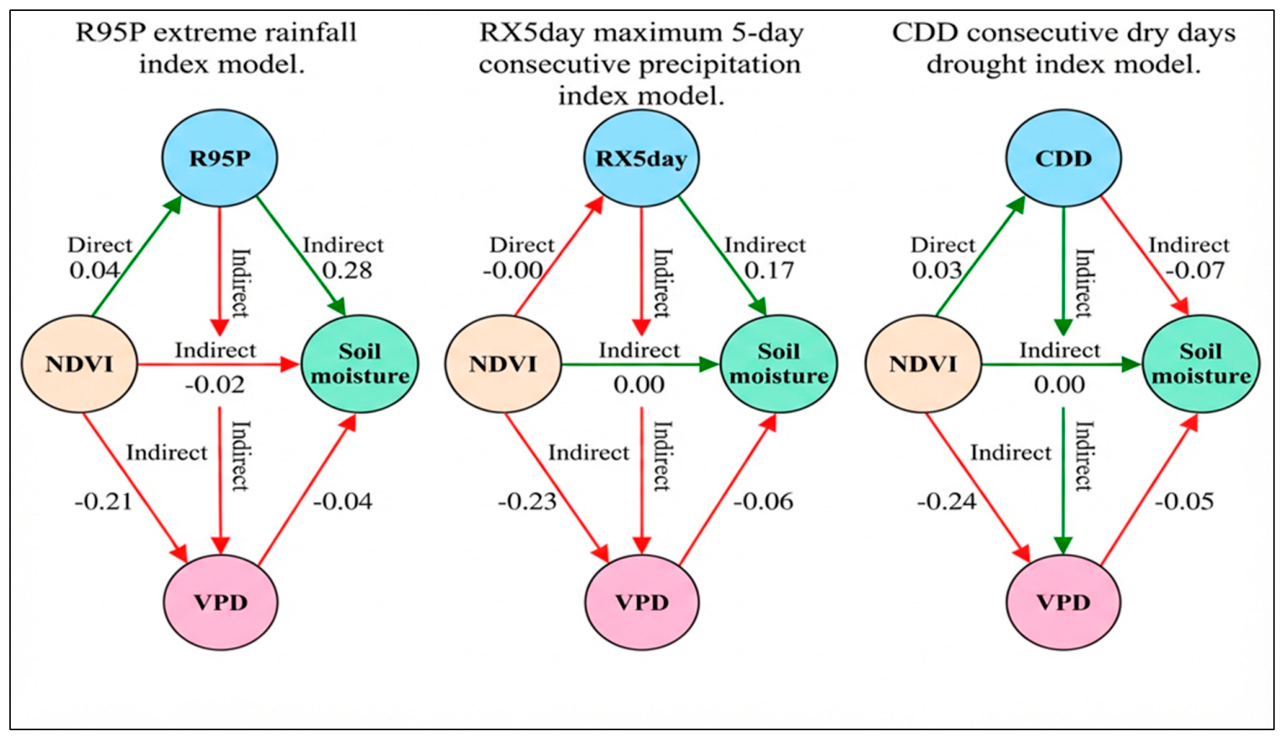
The results of the SEM analysis reveal that extreme rainfall exerts its influence primarily through indirect pathways, with soil moisture and VPD acting as key mediators (
Table 4). For almost all indices in
Figure 6, the direct effects are very small or even negative. In contrast, the overall indirect effects are consistently positive and account for the vast majority of the total effects. This pattern suggests that rainfall promotes vegetation vigor not by directly stimulating growth, but by modulating soil water availability and atmospheric water demand. More specifically, for most indices, the mediation by VPD is more pronounced than that by soil moisture, indicating that reducing atmospheric water stress is a critical pathway linking extreme rainfall to increased plant activity. The fit of the models is acceptable for the majority of indices (CFI between 0.872 and 0.993; RMSEA between 0.051 and 0.181), with the model relating to PRCPTOT showing the best fit (CFI = 0.993, RMSEA = 0.051).
The analysis also highlights significant differences between the precipitation indices. Total annual precipitation (PRCPTOT) and extreme precipitation events (R95P) have direct effects close to zero but marked positive total effects (0.505 and 0.395, respectively), almost entirely mediated by soil moisture and VPD (total indirect effects of 0.501 and 0.397). In contrast, the effect of maximum five-day precipitation (RX5DAY) stands out: it is the only index to show a statistically significant negative direct effect on NDVI (coefficient = −0.030, p < 0.05), while its positive indirect effects (0.265) completely compensate for this inhibition, resulting in a positive total effect (0.235). This result suggests that very intense, short-duration rainfall can cause direct physical damage to vegetation, but that its beneficial hydrological effects outweigh this damage.
Conversely, CDD shows negative total effects (−0.303) resulting from negative indirect effects via soil moisture (−0.117) and VPD (−0.175), confirming that prolonged drought weakens vegetation through multiple and mutually reinforcing pathways. For daily rainfall intensity (SDII) and the number of days of heavy rainfall (R20 mm, R10 mm), the total effects are positive, and their indirect effects are also statistically significant. The percentage of the total effect mediated (Pct-mediated) is generally high, exceeding 97% for all indices and even reaching over 100% in several cases (e.g., SDII, R20 mm, RX5DAY). Mediation percentages exceeding 100% occur when a weakly negative direct effect combines with strongly positive indirect effects, a phenomenon frequently observed in ecological systems.
Following re-specification and validation, fit indices improved considerably across all indices (see
Supplementary Table S1 for pre- and post-revision statistics). PRCPTOT achieved excellent fit (CFI = 0.993, RMSEA = 0.051), while R95P and R10 mm showed good to acceptable fit (CFI = 0.950 and 0.972, respectively). Models for RX5DAY, SDII, and CDD exhibited marginal fit (CFI ≈ 0.91, RMSEA ≈ 0.17), retained due to ecologically meaningful parameter estimates and robust bootstrap validation (90% CI for all indirect effects excludes zero).
The indirect pathways through SM and VPD dominated the total effects, while values exceeding 100% indicate inconsistent mediation caused by opposite direct and indirect effects. This pattern confirms that precipitation extremes’ primary ecological role is hydrological modulation rather than direct physiological stimulation or inhibition.
3.6. Bidirectional Feedback Effects Between Precipitation Extremes and NDVI, Mediated by Soil Moisture and VPD
The bidirectional SEM models in
Table 4, visualized
Figure 7 demonstrate that the links between extreme rainfall and vegetation vitality in Northeast China operate primarily through indirect pathways and feedback loops via soil moisture and VPD. All rainfall indices show weak or negative direct effects on NDVI, in contrast to the clearly dominant indirect effects mediated by SM and VPD, with very high mediation rates ranging from 96.25% for the CDD index to 112.77% for RX5DAY.
These values confirm that extreme rainfall primarily affects vegetation by altering soil water availability and atmospheric water demand, rather than through direct physiological mechanisms. Providing tangible visual evidence for the mediation pathways depicted in
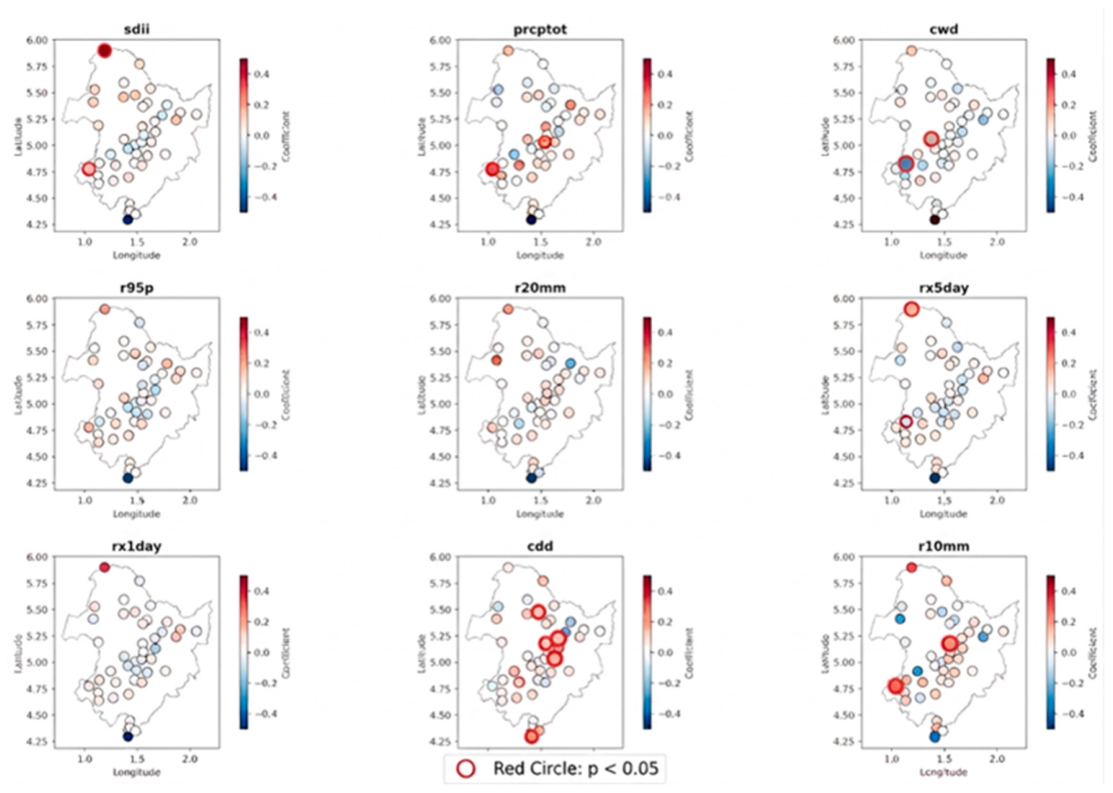
Figure 8 complements these overall results by highlighting a strong spatial heterogeneity of the partial correlations between each rainfall index and the NDVI: significant positive links are concentrated in the central crop and grassland areas. In contrast, negative correlations dominate in the south, demonstrating that the plant response varies strongly according to location and land cover type.
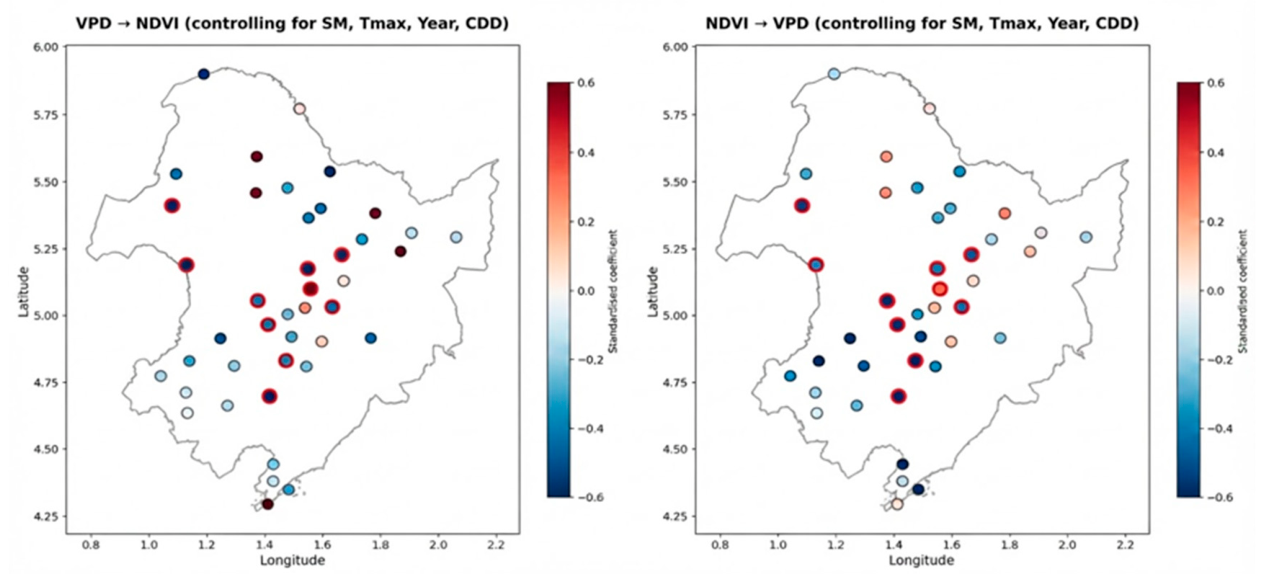
These two maps of spatial variation feedback
Figure 9 and
Figure 10 complement the results of the bidirectional SEM models by highlighting the reciprocal feedback loop between vapor pressure deficit and vegetation vitality at the local scale. The map on the left represents the effect of VPD on NDVI, while the one on the right illustrates the inverse effect of NDVI on VPD. The color key corresponds to standardized coefficients, and red circles indicate significant relationships. On the one hand, VPD generally has a negative impact on NDVI for the majority of the stations, particularly in the central and western parts of the region, where high vapor pressure deficit values induce atmospheric water stress that reduces vegetation greenness. Many sites in agricultural areas show a significant correlation.
On the other hand, the NDVI feedback on VPD shows a predominantly negative relationship in the same areas, as strong vegetation activity generates local cooling and humidification effects that lower the ambient vapor pressure deficit. While some areas in the north and south show weak or even positive effects, the overall effect is also significant. If these are not significant, it is due to local thermal or hydric constraints which attenuate this vegetation–atmosphere interaction; all these observations confirm the bidirectional nature of the links modeled by the SEM and prove that these local feedbacks play a determining role in how ecosystems respond to episodes of extreme precipitation.
Furthermore, bidirectional SEM models highlight a significant feedback loop between NDVI and VPD. Increased plant activity reduces the vapor pressure deficit, corresponding to the cooling and humidification effects induced by vegetation. Conversely, a high VPD, reflecting increased atmospheric water stress, negatively impacts vegetation vigor. This reciprocal relationship confirms the bidirectional nature of the model and underscores the role of vegetation–atmosphere feedback in modulating ecosystem responses to extreme rainfall.
3.7. Land Cover as a Moderator: Interaction Effects with Precipitation Extremes on NDVI
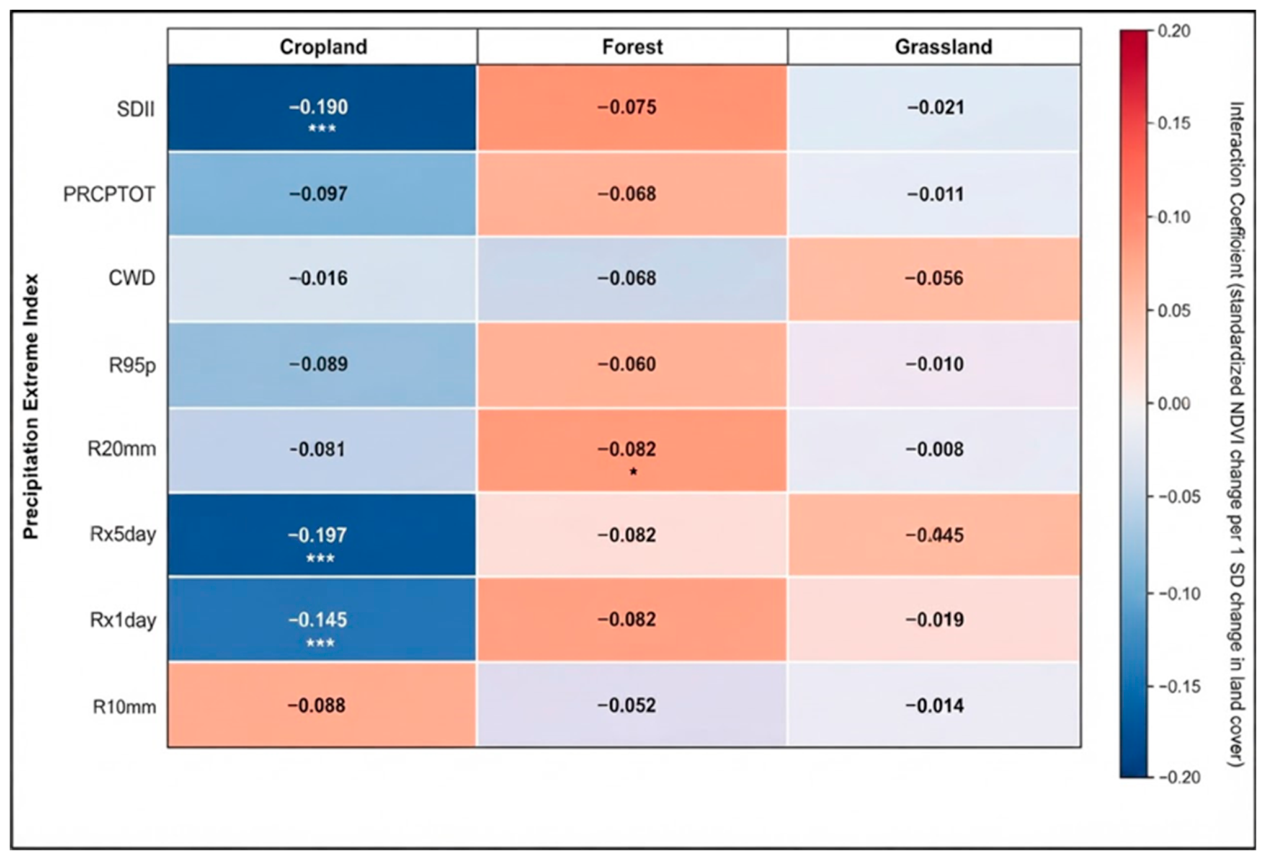
The heatmap (
Figure 11) shows the interaction coefficients from the mixed-effects model associated with the structural equation modeling (SEM), which aims to quantify how each land cover category modulates the impact of extreme rainfall on the NDVI. Wetlands serve as the reference category, while asterisks indicate the threshold for statistical significance: * corresponds to
p < 0.05 and ** to
p < 0.001.
First, cultivated land shows highly significant negative interactions for the SDII (β = −0.190), RX5day (β = −0.197), and RX1day (β = −0.145) indices. This means that an increase in the proportion of agricultural land strongly attenuates the beneficial effect of heavy rainfall on vegetation greenness as measured by the NDVI. Indeed, on the agricultural plains of Northeast China, extreme rainfall events lead to soil waterlogging, generate physiological stress for crops, and can even cause secondary salinization, ultimately degrading plant productivity despite the massive influx of water. In contrast, forests exhibit statistically significant positive interactions for the SDII (β = 0.075) and R20 mm (β = 0.082) indices.
Therefore, unlike cultivated plots, these environments benefit more from intense rainfall or days receiving more than 20 mm of precipitation compared to wetlands. Forest stands often face summer water deficits. Heavy downpours refill deep soil moisture stores, which lets trees sustain growth through subsequent dry spells. For the CDD index, cultivated land shows a significant positive interaction coefficient (β = 0.112, p < 0.05), indicating that agricultural areas experience less severe drought-induced NDVI reductions than wetlands. This counterintuitive finding likely reflects the buffering effect of irrigation infrastructure in cropland systems, which partially decouples agricultural vegetation from atmospheric drought conditions.
In contrast, forests exhibit a significant negative interaction with CDD (β = −0.078, p < 0.05), suggesting that forest ecosystems are more vulnerable to prolonged drought periods than wetlands. This vulnerability arises from the high-water requirements of mature tree stands, particularly during extended dry spells when deep soil moisture reserves become depleted. Finally, no statistically valid interaction was found for grasslands with all extreme precipitation indices, so their response to rainfall fluctuations remains generally homogeneous; this phenomenon is explained both by their small spatial extent within the study area and by their majority location in transition zones where the influence of extreme climatic events is naturally reduced.
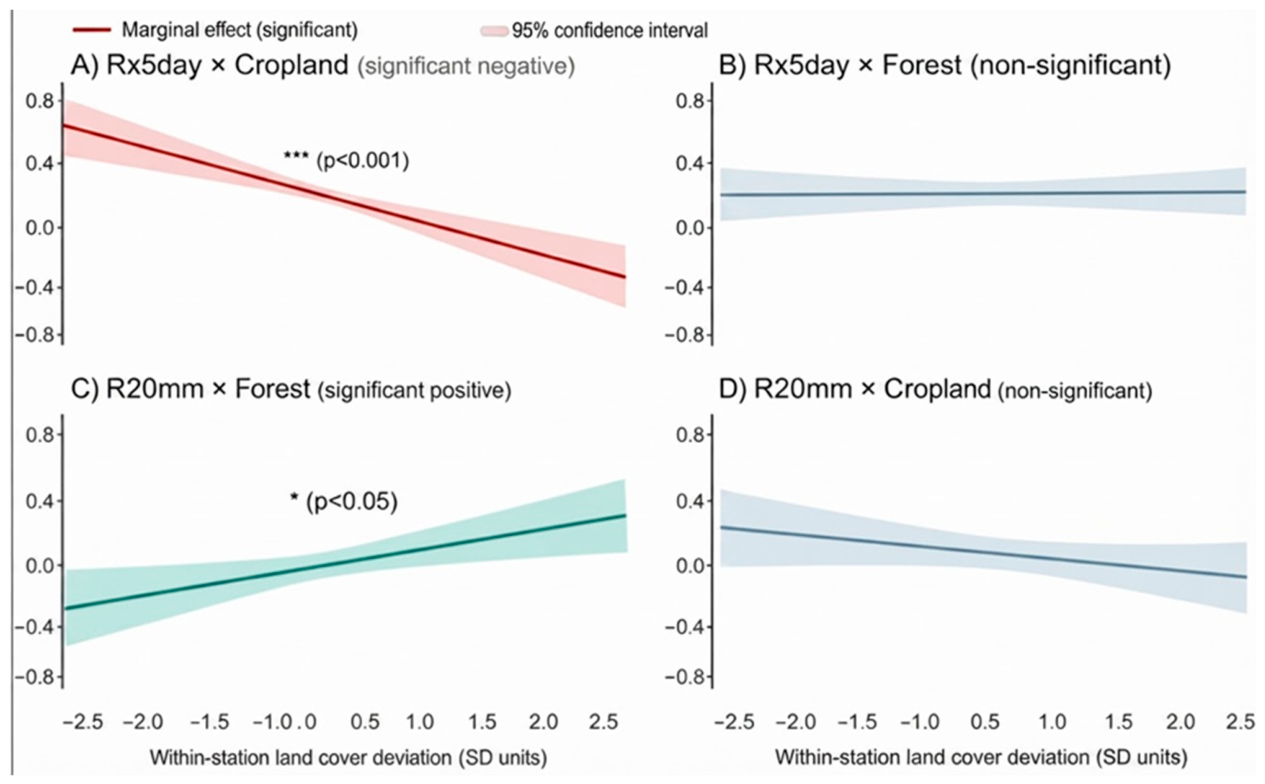
These four graphs (
Figure 12) detail the evolution of the effect of precipitation on the NDVI according to the local proportion of each type of land cover, the horizontal axis corresponding to the deviation from the mean of land cover expressed in standard deviations, the red or green curve representing the marginal effect, and the shaded area representing the 95% confidence interval. On the one hand, Panel A illustrates the RX5day interaction associated with cultivated cropland, with a highly significant negative effect (
p < 0.001), because the more the proportion of agricultural areas increases, the more the positive impact of rainfall totals over five consecutive days on the NDVI diminishes until it becomes negative for high proportions of crops, which confirms the high vulnerability of these plots to excess water generated by extreme rainfall; Panel B examines the interaction between RX5day and forests, a non-significant link since its curve remains stable and its confidence interval consistently includes the value zero, demonstrating that the proportion of forest does not modulate the behavior of the RX5day index.
Panel C, on the other hand, presents the interaction between R20 mm and forests, a statistically valid positive effect (p < 0.05), as increased tree cover progressively reinforces the beneficial influence of days with rainfall exceeding 20 mm on the NDVI, with trees fully utilizing these massive inputs to replenish their underground water reserves. Panel D, however, deals with the interaction between R20 mm and cultivated land without significant results, as no statistically usable trend emerges, meaning that the proportion of crops does not play a modulating role in the impact of daily rainfall exceeding 20 mm. In conclusion regarding both figures, cultivated land is the type of land cover most sensitive to episodes of extreme heavy rainfall, as these events reduce its plant production, unlike forests, which show better resilience and derive a notable benefit from intense rainfall. In contrast, the response of grasslands to rainfall is not at all modulated by their local proportion in the study area.