Article

Recovery of Fluoride as Cryolite from Acidic Semiconductor Waste Liquor: Crystallization Behavior and Continuous-Flow Evaluation


1
School of Resources and Environmental Engineering, Hefei University of Technology, Hefei 230009, China
2
Wancho Environmental-Protection Co., Ltd., Suzhou 234000, China
3
Anhui Xinyu Environmental Protection Technology Co., Ltd., Hefei 230051, China
*
Author to whom correspondence should be addressed.
Water 2026, 18(16), 1960; https://doi.org/10.3390/w18161960
Submission received: 5 July 2026 / Revised: 29 July 2026 / Accepted: 5 August 2026 / Published: 11 August 2026
(This article belongs to the Section Wastewater Treatment and Reuse)

Abstract

Acidic fluoride-rich waste liquor from oxide etching in liquid-crystal display and integrated-circuit manufacturing is commonly treated by calcium precipitation, generating fine, impurity-bearing sludge with limited resource value. This study investigated a thermodynamics-guided route for the recovery of cryolite from acidic semiconductor waste liquor using batch experiments and continuous-flow assessment. Visual MINTEQ was used to screen aqueous speciation and solid saturation, while batch tests examined the Al/F molar ratio, pH, aging time, and temperature. Although cryolite was predicted to be supersaturated over a broad pH range, favorable fluoride removal occurred only within a narrower empirical window. At an Al/F molar ratio of 1.0:6, pH 6.5, an aging time of 2 h, and 20 °C, fluoride removal reached 79.6%. Under recirculating fluidized-bed operation, the principal cryolite phase was retained, and the SEM-derived mean particle size increased from 0.57 ± 0.10 μm in the batch system to 0.82 ± 0.15 μm in the continuous-flow system. These results demonstrate that dissolved fluoride in real acidic oxide-etching waste liquor can be converted into a separable cryolite-enriched solid.

1. Introduction

Driven by demand from artificial intelligence, data centers, electric vehicles, and advanced manufacturing, the global semiconductor industry continues to expand, increasing chemical consumption and placing greater pressure on the management of associated waste streams [1,2,3]. According to estimates from the World Semiconductor Trade Statistics (WSTS), global semiconductor sales were projected to reach USD 701 billion in 2025, representing an increase of 11.2% over 2024 [1]. Fluoride-containing acidic etchants are widely used for oxide removal during liquid-crystal display and integrated-circuit manufacturing, generating strongly acidic waste liquors with high fluoride concentrations and multiple coexisting ions [4,5,6]. In China, such waste liquors are classified as HW34 waste acids under waste code 398-007-34 and exhibit corrosive and toxic hazardous characteristics [7]. Chronic excessive exposure to fluoride may cause dental and skeletal fluorosis; therefore, reducing the dissolved fluoride load in these industrial waste acids is relevant to both environmental health and hazardous waste management [8,9,10].
Conventional treatment of fluoride-containing waste liquor generally relies on calcium-salt precipitation to convert dissolved fluoride into CaF2, followed by coagulation, flocculation, and solid–liquid separation to reduce effluent fluoride concentrations [6,11,12]. Although this approach is operationally simple and can achieve high fluoride removal, the recovered solids are typically fine-grained sludge containing CaF2 and coprecipitated impurities, with potentially high water content, limited settling and dewatering performance, and variable resource quality [11,13,14]. For highly concentrated fluoride waste acids, directing dissolved fluoride into a mineral solid with a more clearly defined crystalline phase and improved separability could simultaneously reduce fluoride loading and enhance the potential for subsequent utilization [15,16,17,18].
Controlled crystallization offers a resource-recovery alternative to conventional sludge-forming precipitation by converting dissolved fluoride into solids whose particle size and crystalline phase can be partially controlled [15,18,19]. Depending on solution composition and added ions, fluoride can crystallize as CaF2, fluorapatite, cryolite, and other fluoride-bearing mineral phases [11,17,20,21,22]. Cryolite is a compositionally defined Na–Al–F crystalline phase and is commonly used as a flux and electrolyte component in aluminum electrolysis. The reuse potential of a recovered cryolite-enriched solid depends on its phase composition, Na/Al/F ratio, impurity and moisture contents, and particle morphology. Under suitable Na/Al/F stoichiometry and solution conditions, dissolved fluoride can be incorporated into a solid that is more amenable to separation and potential reuse [17,18,23,24]. Studies using synthetic solutions, spent etching solutions, aluminum-electrolysis wastewater, and fluorochemical wastewater have shown that pH, Al/F molar ratio, aging time, and temperature affect cryolite nucleation, growth, phase composition, and particle morphology [17,24,25,26,27]. Continuous crystallization and fluidized-bed studies further indicate that coupling reaction, particle growth, and solid–liquid separation can improve crystal retention and solid recovery [18,19,28,29,30]. Despite these advances, evidence remains limited for the direct recovery of cryolite from real, strongly acidic, high-fluoride oxide-etching waste acid with a complex multicomponent ionic matrix [17,18,30]. In particular, the connection among thermodynamic screening, experimentally favorable crystallization conditions, solid-phase characteristics, and continuous-flow transferability has not been sufficiently established [17,18,30].
Thermodynamic supersaturation indicates that solid formation is favorable at equilibrium. However, it does not ensure rapid nucleation, sufficient crystal growth, or effective solid–liquid separation in a real industrial waste acid [19,31,32]. In acidic Na–Al–F systems, HF protonation, aluminum hydrolysis, and Al–F complexation jointly regulate the effective activities of species available for precipitation [25,32,33]. Shifts in the dominant species with pH may therefore produce a thermodynamic supersaturation region that is substantially broader than the practically favorable crystallization range [26,32]. In addition, SO42−, NO3, Cl, and other coexisting constituents can affect fluoride recovery through ion-specific and concentration-dependent pathways, including complexation, competitive precipitation, lattice incorporation, and modification of particle interfacial interactions [33,34,35,36,37,38]. Thermodynamic models are therefore better suited to identifying potential formation regions and screening experimental conditions than to replacing experimental evaluation of nucleation, growth, morphology, and continuous-flow behavior [19,26,31,32].
Given the high fluoride concentration and complex ionic composition of real acidic semiconductor waste liquor, this study investigated a thermodynamics-guided process to recover fluoride as cryolite by supplementing with an aluminum source and adjusting the solution pH. The effects of Al/F molar ratio, pH, aging time, and temperature on fluoride removal and cryolite formation were investigated using aqueous-speciation and saturation calculations. The recovered solids were characterized to determine their phase composition, morphology, elemental distribution, and surface chemical states. The screened conditions were subsequently examined in a recirculating fluidized-bed crystallizer to evaluate continuous-flow fluoride removal and the retention of the principal cryolite phase. Previous studies have demonstrated fluoride recovery through cryolite precipitation; the specific contribution of the present work lies in linking thermodynamic screening, experimentally favorable crystallization conditions, solid characterization, and continuous-flow evaluation for real acidic semiconductor oxide-etching waste liquor.

2. Materials and Methods

2.1. Waste Liquor and Reagents

The real acidic fluoride-containing waste liquor was obtained from a semiconductor manufacturing facility in Hefei, China. Immediately after collection, the samples were sealed in polytetrafluoroethylene (PTFE) containers, stored at 4 °C, and returned to room temperature before use. The total fluoride concentration of the original waste liquor was approximately 2200 mg L−1. The principal physicochemical properties of the original waste liquor are summarized in Table 1. The corresponding analytical methods are provided in Table S1.
Aluminum sulfate octadecahydrate (Al2(SO4)3·18H2O) was used as the supplementary aluminum source. Sodium hydroxide (NaOH) supplied sodium and adjusted pH, whereas sulfuric acid (H2SO4) was used to lower pH without introducing additional Cl or NO3. All reagents were of analytical grade and were purchased from Shanghai Macklin Biochemical Co., Ltd. (Shanghai, China) Ultrapure water with a resistivity of at least 18.25 MΩ·cm was used for washing. All fluoride-containing solutions were stored in PTFE containers, and all reactions were conducted in PTFE vessels to minimize glass corrosion and the associated risk of silicon contamination.

2.2. Thermodynamic Screening

Thermodynamic calculations were performed using Visual MINTEQ 4.0 [39]. The model was based on the measured composition of the real waste liquor. Total F and total Na were set to 0.090 and 0.060 mol L−1, respectively, while total Al was varied from 0.009 to 0.021 mol L−1 to represent Al/F molar ratios of 0.6:6, 0.8:6, 1.0:6, 1.2:6, and 1.4:6. The concentrations of SO42−, NO3, and Cl were set to 0.0163, 0.0230, and 0.00333 mol L−1, respectively. The simulation temperature was 25 °C, and pH was varied from 1.0 to 14.0. Activity coefficients were corrected using the Davies equation, and ionic strength was iteratively calculated by the software from the input composition and equilibrium distribution. The complete model inputs and principal calculation settings are provided in Table S5.
The model included HF(aq), F, aluminum hydrolysis species, and Al–F complexes available in the software database. Simulations were conducted in two steps. First, solid precipitation was disabled to calculate aqueous speciation and the saturation indices of candidate solids. Second, cryolite, Al(OH)3(s), Al2O3(s), and NaF(s) were allowed as candidate solids to estimate equilibrium solid-formation tendencies. The saturation index was calculated using Equation (1):
SI = log10(IAP/Ksp),
where IAP is the ion activity product, and Ksp is the solubility product of the corresponding solid. SI > 0, SI = 0, and SI < 0 indicate supersaturation, equilibrium, and undersaturation, respectively [31,32]. The model was used only to screen the experimental range and interpret overall trends; it did not account for nucleation induction periods, crystal-growth kinetics, mass-transfer resistance, particle collisions, or non-equilibrium solid formation [19,31,32].

2.3. Batch Crystallization Experiments

Batch experiments were conducted in 500 mL PTFE beakers, each containing 300 mL of real waste liquor. The suspensions were stirred at 500 rpm. The tested ranges were selected on the basis of the Visual MINTEQ speciation and saturation results, the stoichiometric Al/F ratio of 1.0:6 for Na3AlF6, and operating ranges reported in previous cryolite-crystallization studies. A sequential single-factor screening design was adopted; the complete experimental design is provided in Table S2.
At the end of each experiment, the suspension was vacuum-filtered using a porcelain Büchner funnel fitted with 90 mm filter paper with a nominal retention size of 6 μm. Vacuum was provided by a water-circulating vacuum pump. The collected solid was washed three times with a total of approximately 100 mL of ultrapure water until the conductivity of the final filtrate approached that of the washing water, and the solid was then dried at 60 °C for 6 h. Three independent runs were performed for each batch condition. The resulting values are presented as the arithmetic mean together with the corresponding standard deviation.
The liquid-phase fluoride removal efficiency was calculated using Equation (2):
FRE = [(C0V0 − CeVe)/(C0V0)] × 100%,
where C0 and Ce are the initial and post-reaction liquid-phase fluoride concentrations, respectively; V0 is the initial waste-liquor volume, and Ve is the nominal liquid volume after reagent addition. Minor changes associated with sampling, evaporation, transfer, and filtration were not independently quantified.

2.4. Fluidized-Bed Crystallizer System

A laboratory-scale recirculating fluidized-bed crystallizer with an effective working volume of 500 mL was used to evaluate the transferability of the batch-screened conditions to continuous operation [18,19,28,30]. The lower reaction zone had an internal diameter of 2 cm and a height of 80 cm; the upper solid–liquid separation zone had an internal diameter of 4 cm and a height of 20 cm. A conical expansion section connected the two zones. Waste liquor and the aluminum-containing reagent entered through separate feed ports, the recirculation line returned liquid from the upper section to the bottom of the reactor, and the effluent outlet was located near the top of the separation zone.
Before operation, the waste-liquor feed pump, reagent feed pump, and recirculation pump were calibrated separately. Influent conditions were set to those identified in the batch experiments, namely an Al/F molar ratio of 1.0:6 and pH 6.5, while the reactor temperature was maintained at 20 ± 2 °C. With other conditions held constant, the effects of hydraulic retention time (HRT; 2–6 h) and circulation ratio (CR; 0.2–1.0) were examined. Total feed flow, HRT, CR, and superficial upflow velocity were calculated using Equations (3)–(6) [19,28,29]:
QT = Qw + Qp,
HRT = VR/QT,
CR = Qr/QT,
us = (QT + Qr)/A,
where Qw and Qp are the waste-liquor and reagent feed flow rates, respectively; Qr is the recirculation flow rate; VR is the effective reactor volume; and A is the cross-sectional area of the lower reaction zone. Here, QT, Qw, Qp, and Qr are expressed in mL h−1; VR is expressed in mL; HRT is expressed in h; CR is dimensionless; A is expressed in cm2; and us is expressed in cm h−1. Reactor dimensions and hydraulic definitions are summarized in Table S3, and a schematic diagram of the system is provided in Figure S11. Solids collected during continuous operation were washed with ultrapure water and dried at 60 °C for 24 h. At least three samples were collected during each designated stable stage to evaluate data variability.

2.5. Analytical Methods

Liquid-phase fluoride was measured using an ion chromatograph (CIC-D100, Qingdao Shenghan Chromatograph Technology Co., Ltd., Qingdao, China), and pH was determined using a calibrated pH meter (PHS-3C, INESA Scientific Instrument Co., Ltd., Shanghai, China) equipped with an E-201-L combination pH electrode (INESA Scientific Instrument Co., Ltd., Shanghai, China). Crystal-phase identification was conducted using a D8 ADVANCE diffractometer (Bruker AXS, Karlsruhe, Germany) equipped with Cu Kα radiation. XRD patterns were collected over a 2θ range of 10–80° at a scanning rate of 10° min−1. Particle morphology and local elemental distribution were observed using field-emission scanning electron microscopy coupled with energy-dispersive spectroscopy (SEM–EDS; Regulus 8230, Hitachi High-Tech Corporation, Tokyo, Japan). FTIR spectra were recorded using a Nicolet 6700 spectrometer (Thermo Fisher Scientific, Madison, WI, USA) with KBr pellets over the range of 4000–400 cm−1 at a resolution of 2 cm−1. Surface elements and chemical states were analyzed by X-ray photoelectron spectroscopy (XPS; K-Alpha, Thermo Fisher Scientific, Waltham, MA, USA), with binding energies calibrated to C 1s = 284.8 eV. Particle-size distributions were obtained from SEM images using Nano Measurer 1.2.

3. Results

3.1. Thermodynamic Screening of Potential Cryolite Formation Conditions

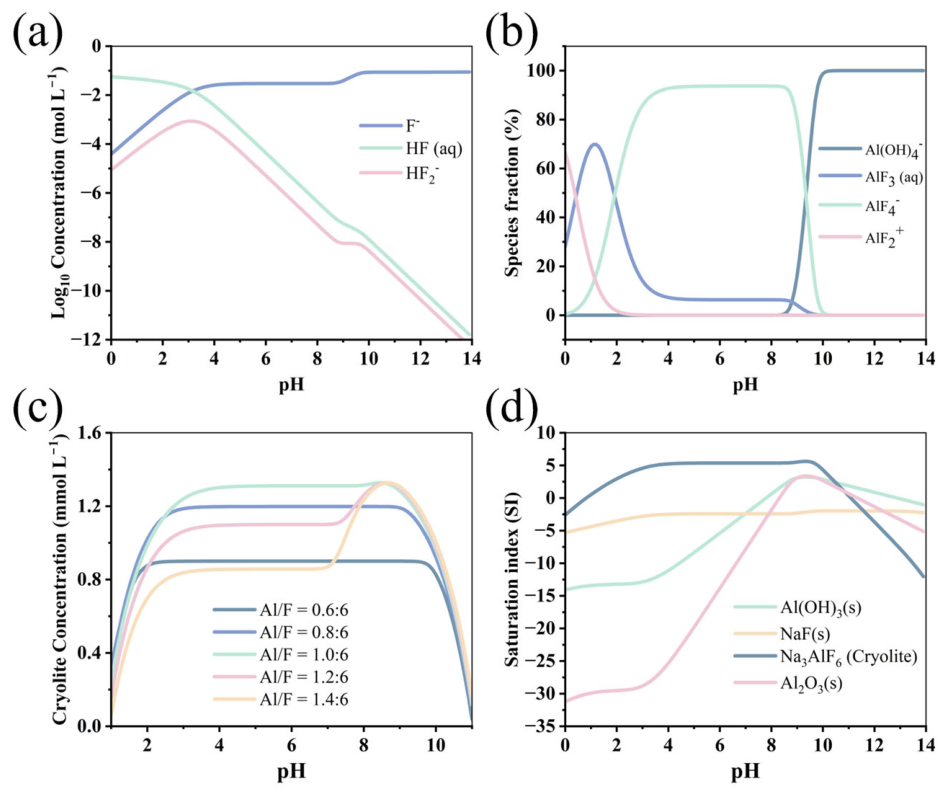
Figure 1a shows the calculated distribution of fluoride species as a function of pH. Under strongly acidic conditions, HF(aq) accounted for the major fraction of dissolved fluoride. As pH increased, the relative fraction of free F gradually rose, theoretically increasing the availability of deprotonated fluoride for complexation and precipitation. The calculated aluminum distribution is shown in Figure 1b. Across a broad intermediate-pH range, dissolved aluminum was dominated by Al–F complexes, with AlF4 being the principal calculated species at approximately pH 4–9. At higher pH, aluminum hydrolysis species, particularly Al(OH)4, increased rapidly.
The equilibrium amount of cryolite was affected by pH and the Al/F molar ratio (Figure 1c). When the Al/F ratio was below 1.0:6, aluminum deficiency relative to the nominal Na3AlF6 stoichiometry limited the theoretical amount of cryolite. When the ratio exceeded 1.0:6, the predicted amount did not increase proportionally with aluminum addition. Saturation-index results (Figure 1d) showed SI > 0 for cryolite over a broad pH range, whereas the saturation tendencies of aluminum hydroxides or oxides increased under alkaline conditions. These calculations indicate a broad potential thermodynamic formation region, but the model alone cannot identify experimentally favorable conditions.

3.2. Effects of Operating Parameters on Liquid-Phase Fluoride Removal

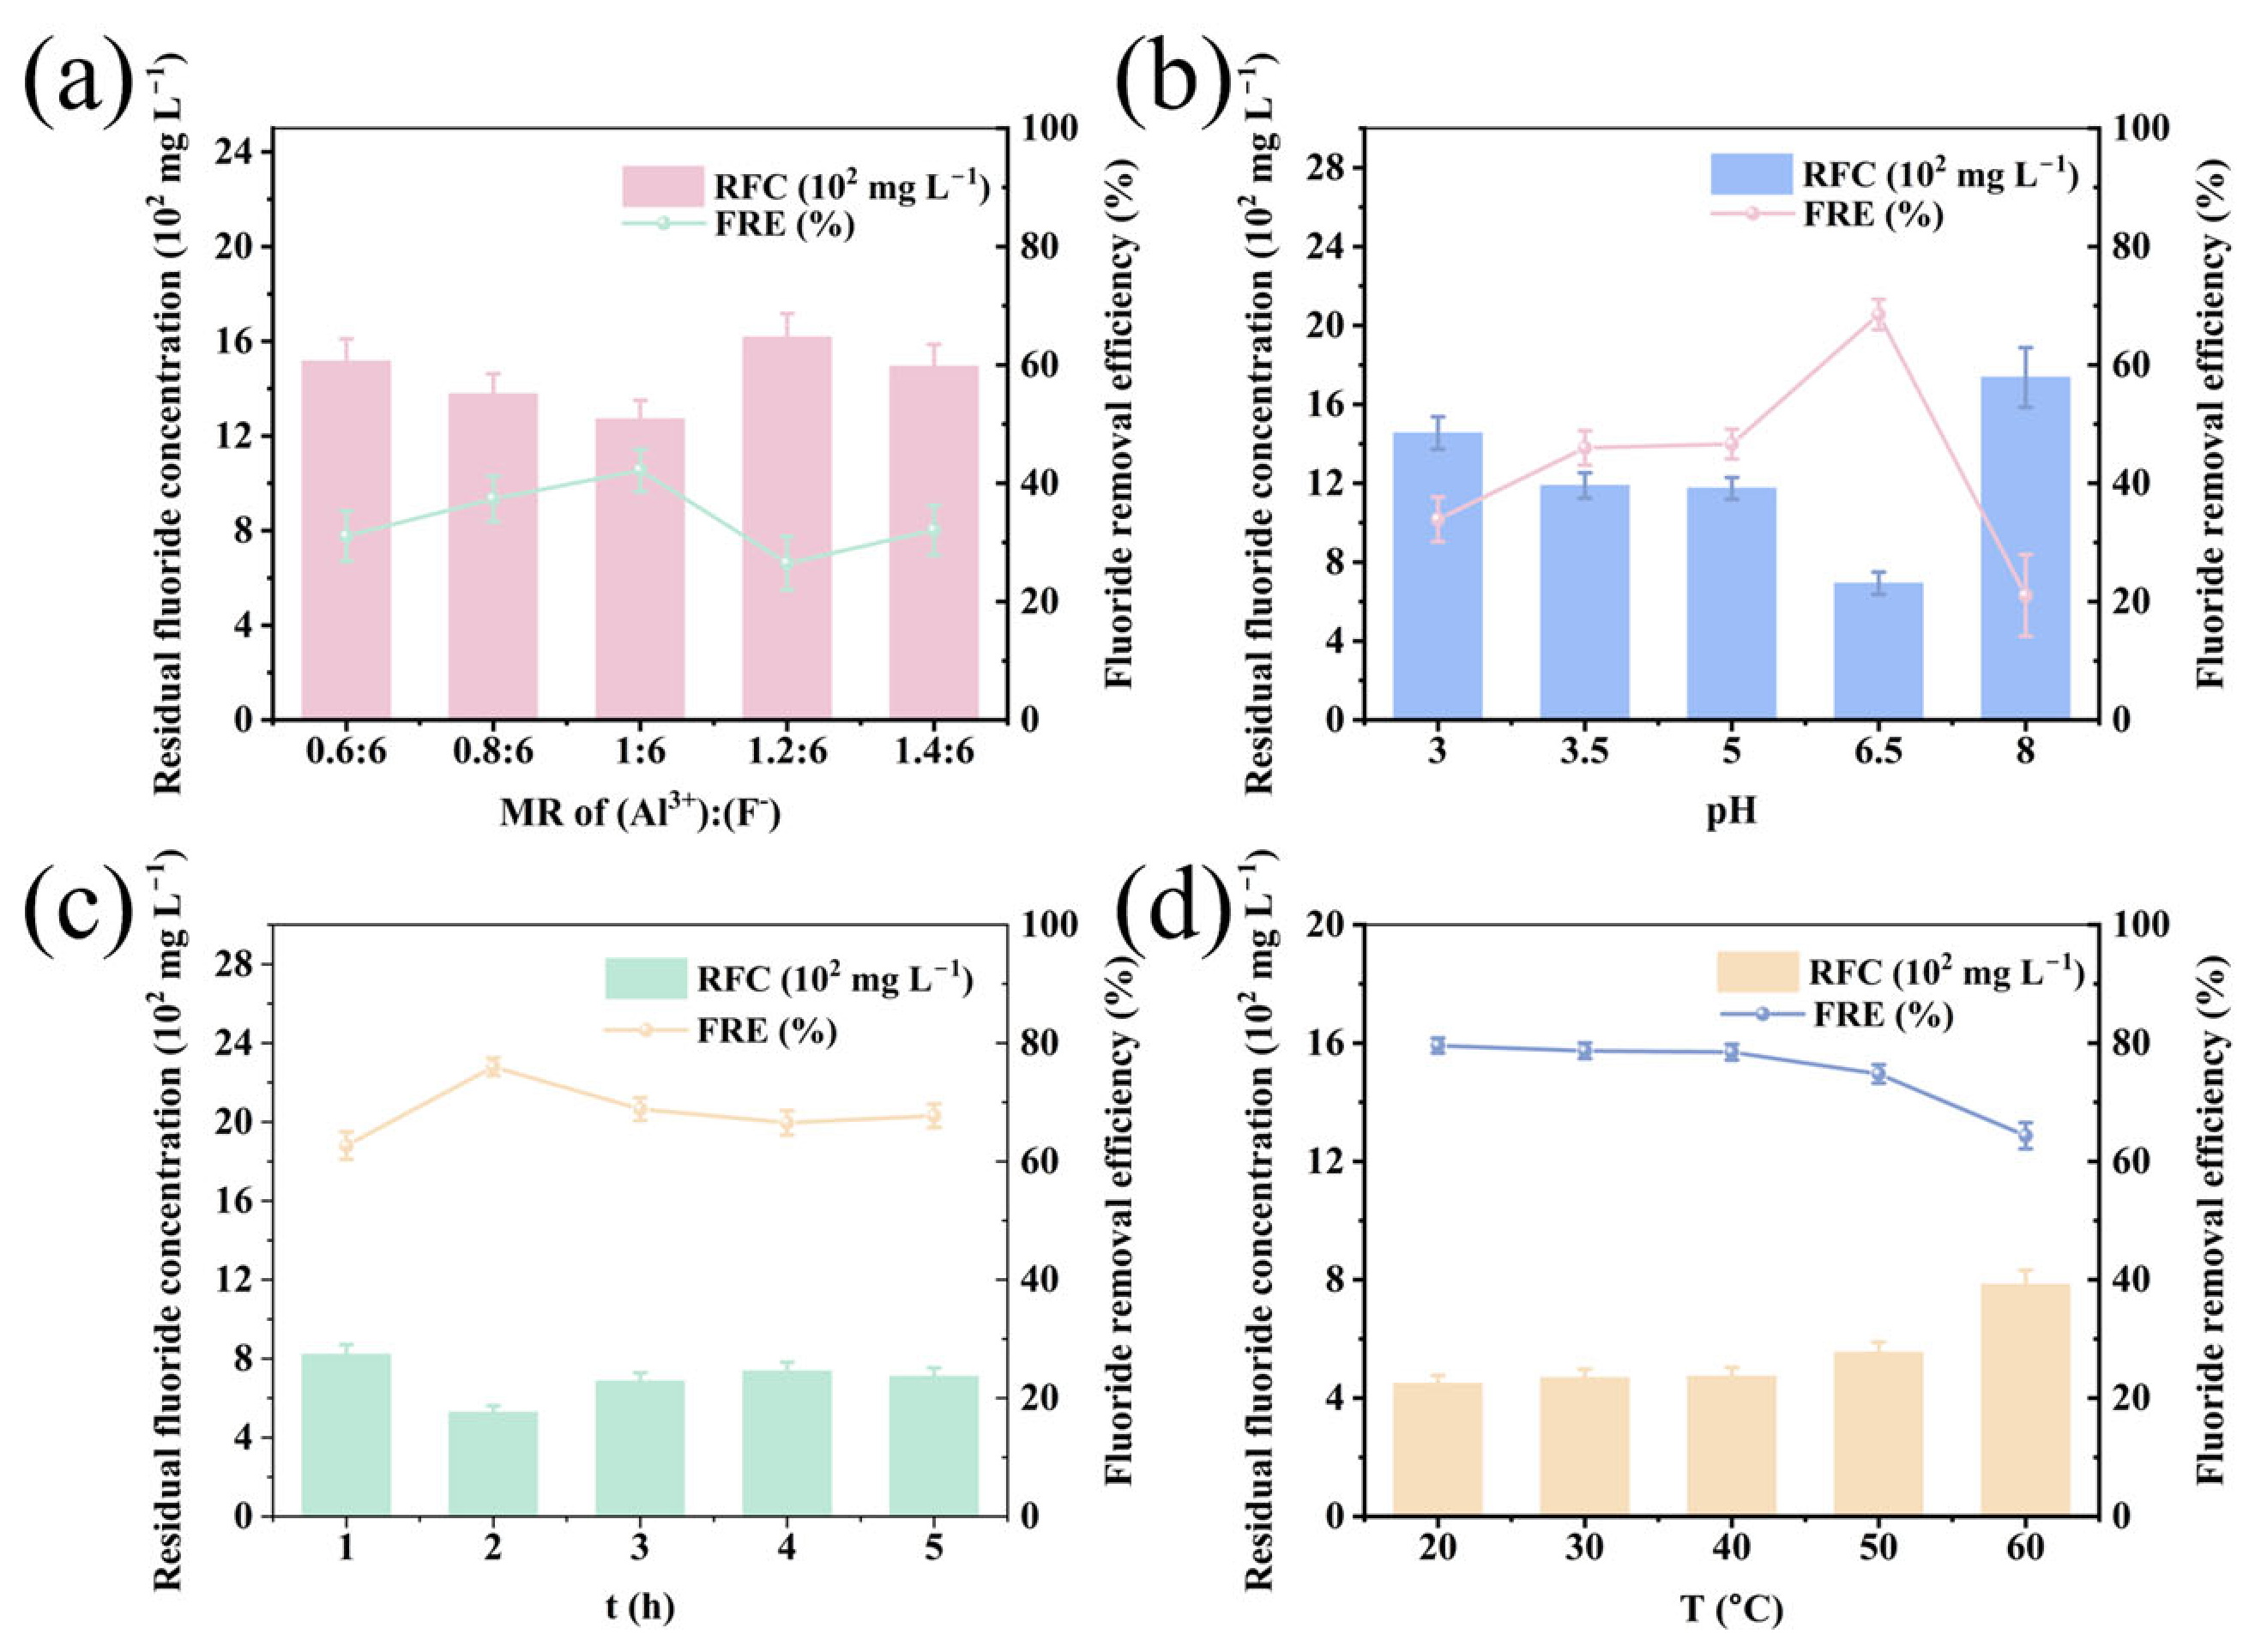
In the initial screening conducted before pH optimization, the Al/F molar ratio affected liquid-phase fluoride removal (Figure 2a). Increasing the Al/F ratio from 0.6:6 to 1.0:6 raised the removal efficiency from 31.1% to 42.2% and lowered residual fluoride from 1516 to 1272 mg L−1. Further increases to 1.2:6 and 1.4:6 reduced the removal efficiency to 26.5% and 32.1%, respectively. Thus, the nominal stoichiometric relationship of cryolite provides a useful starting point for condition screening, but excess aluminum did not improve liquid-phase fluoride removal in this waste-liquor matrix at the initial pH.
At an Al/F molar ratio of 1.0:6, pH had a substantially greater effect on fluoride removal than the Al/F ratio in the initial screening (Figure 2b). Increasing pH from 3.0 to 6.5 raised the fluoride removal efficiency from 33.9% to 68.5% and reduced residual fluoride from 1454 to 693 mg L−1. When pH was further increased to 8.0, removal decreased to 21.1% and residual fluoride increased to 1737 mg L−1. The experimentally favorable response region was therefore considerably narrower than the broad supersaturation region predicted by the equilibrium model.
Aging time also affected fluoride removal and the residual fluoride concentration (Figure 2c). Extending aging from 1 to 2 h increased fluoride removal from 62.7% to 76.0% and reduced residual fluoride from 821 to 528 mg L−1. Further aging to 3–5 h did not yield additional improvement; removal remained within 66.5–68.8%. In the temperature tests, the lowest temperature examined produced the highest liquid-phase fluoride removal (Figure 2d): at 20 °C, removal reached 79.6% and residual fluoride was 449 mg L−1, whereas at 60 °C, removal decreased to 64.4% and residual fluoride rose to 784 mg L−1. Within the tested range and sequential screening design, Al/F = 1.0:6, pH 6.5, 2 h aging, and 20 °C were therefore identified as the most favorable conditions tested.

3.3. Solid-Phase Identification and Morphological Evolution

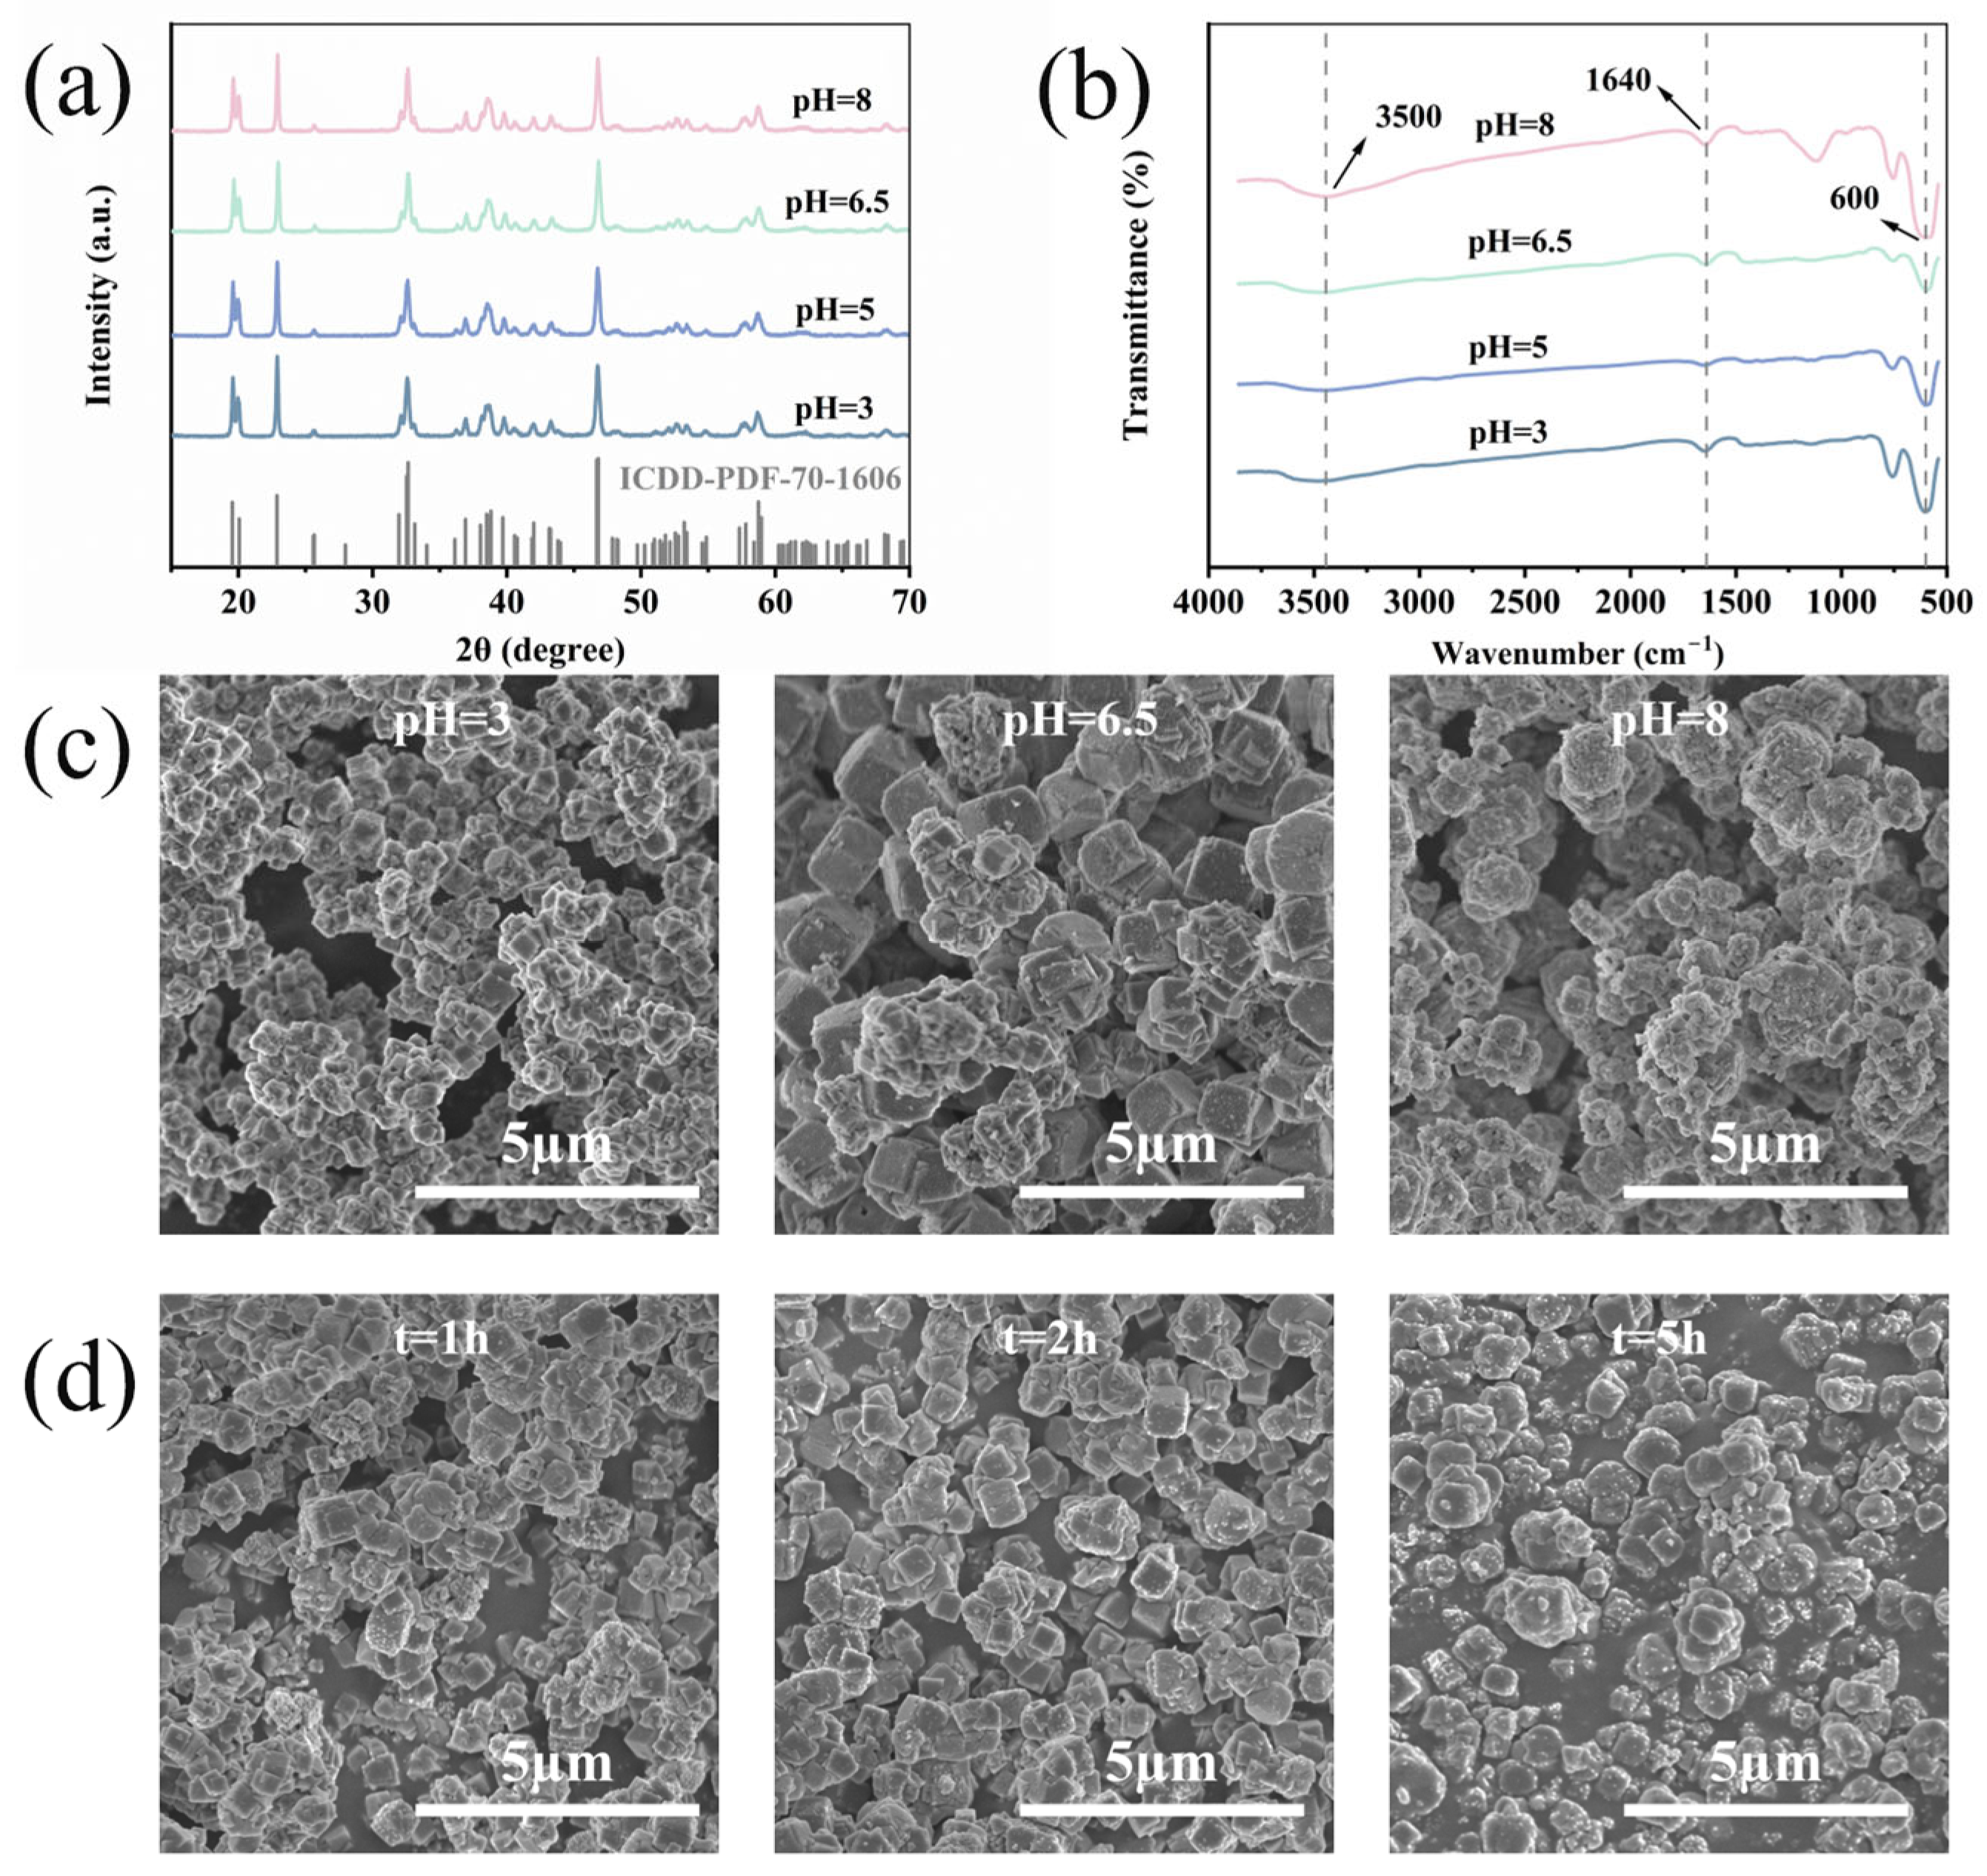
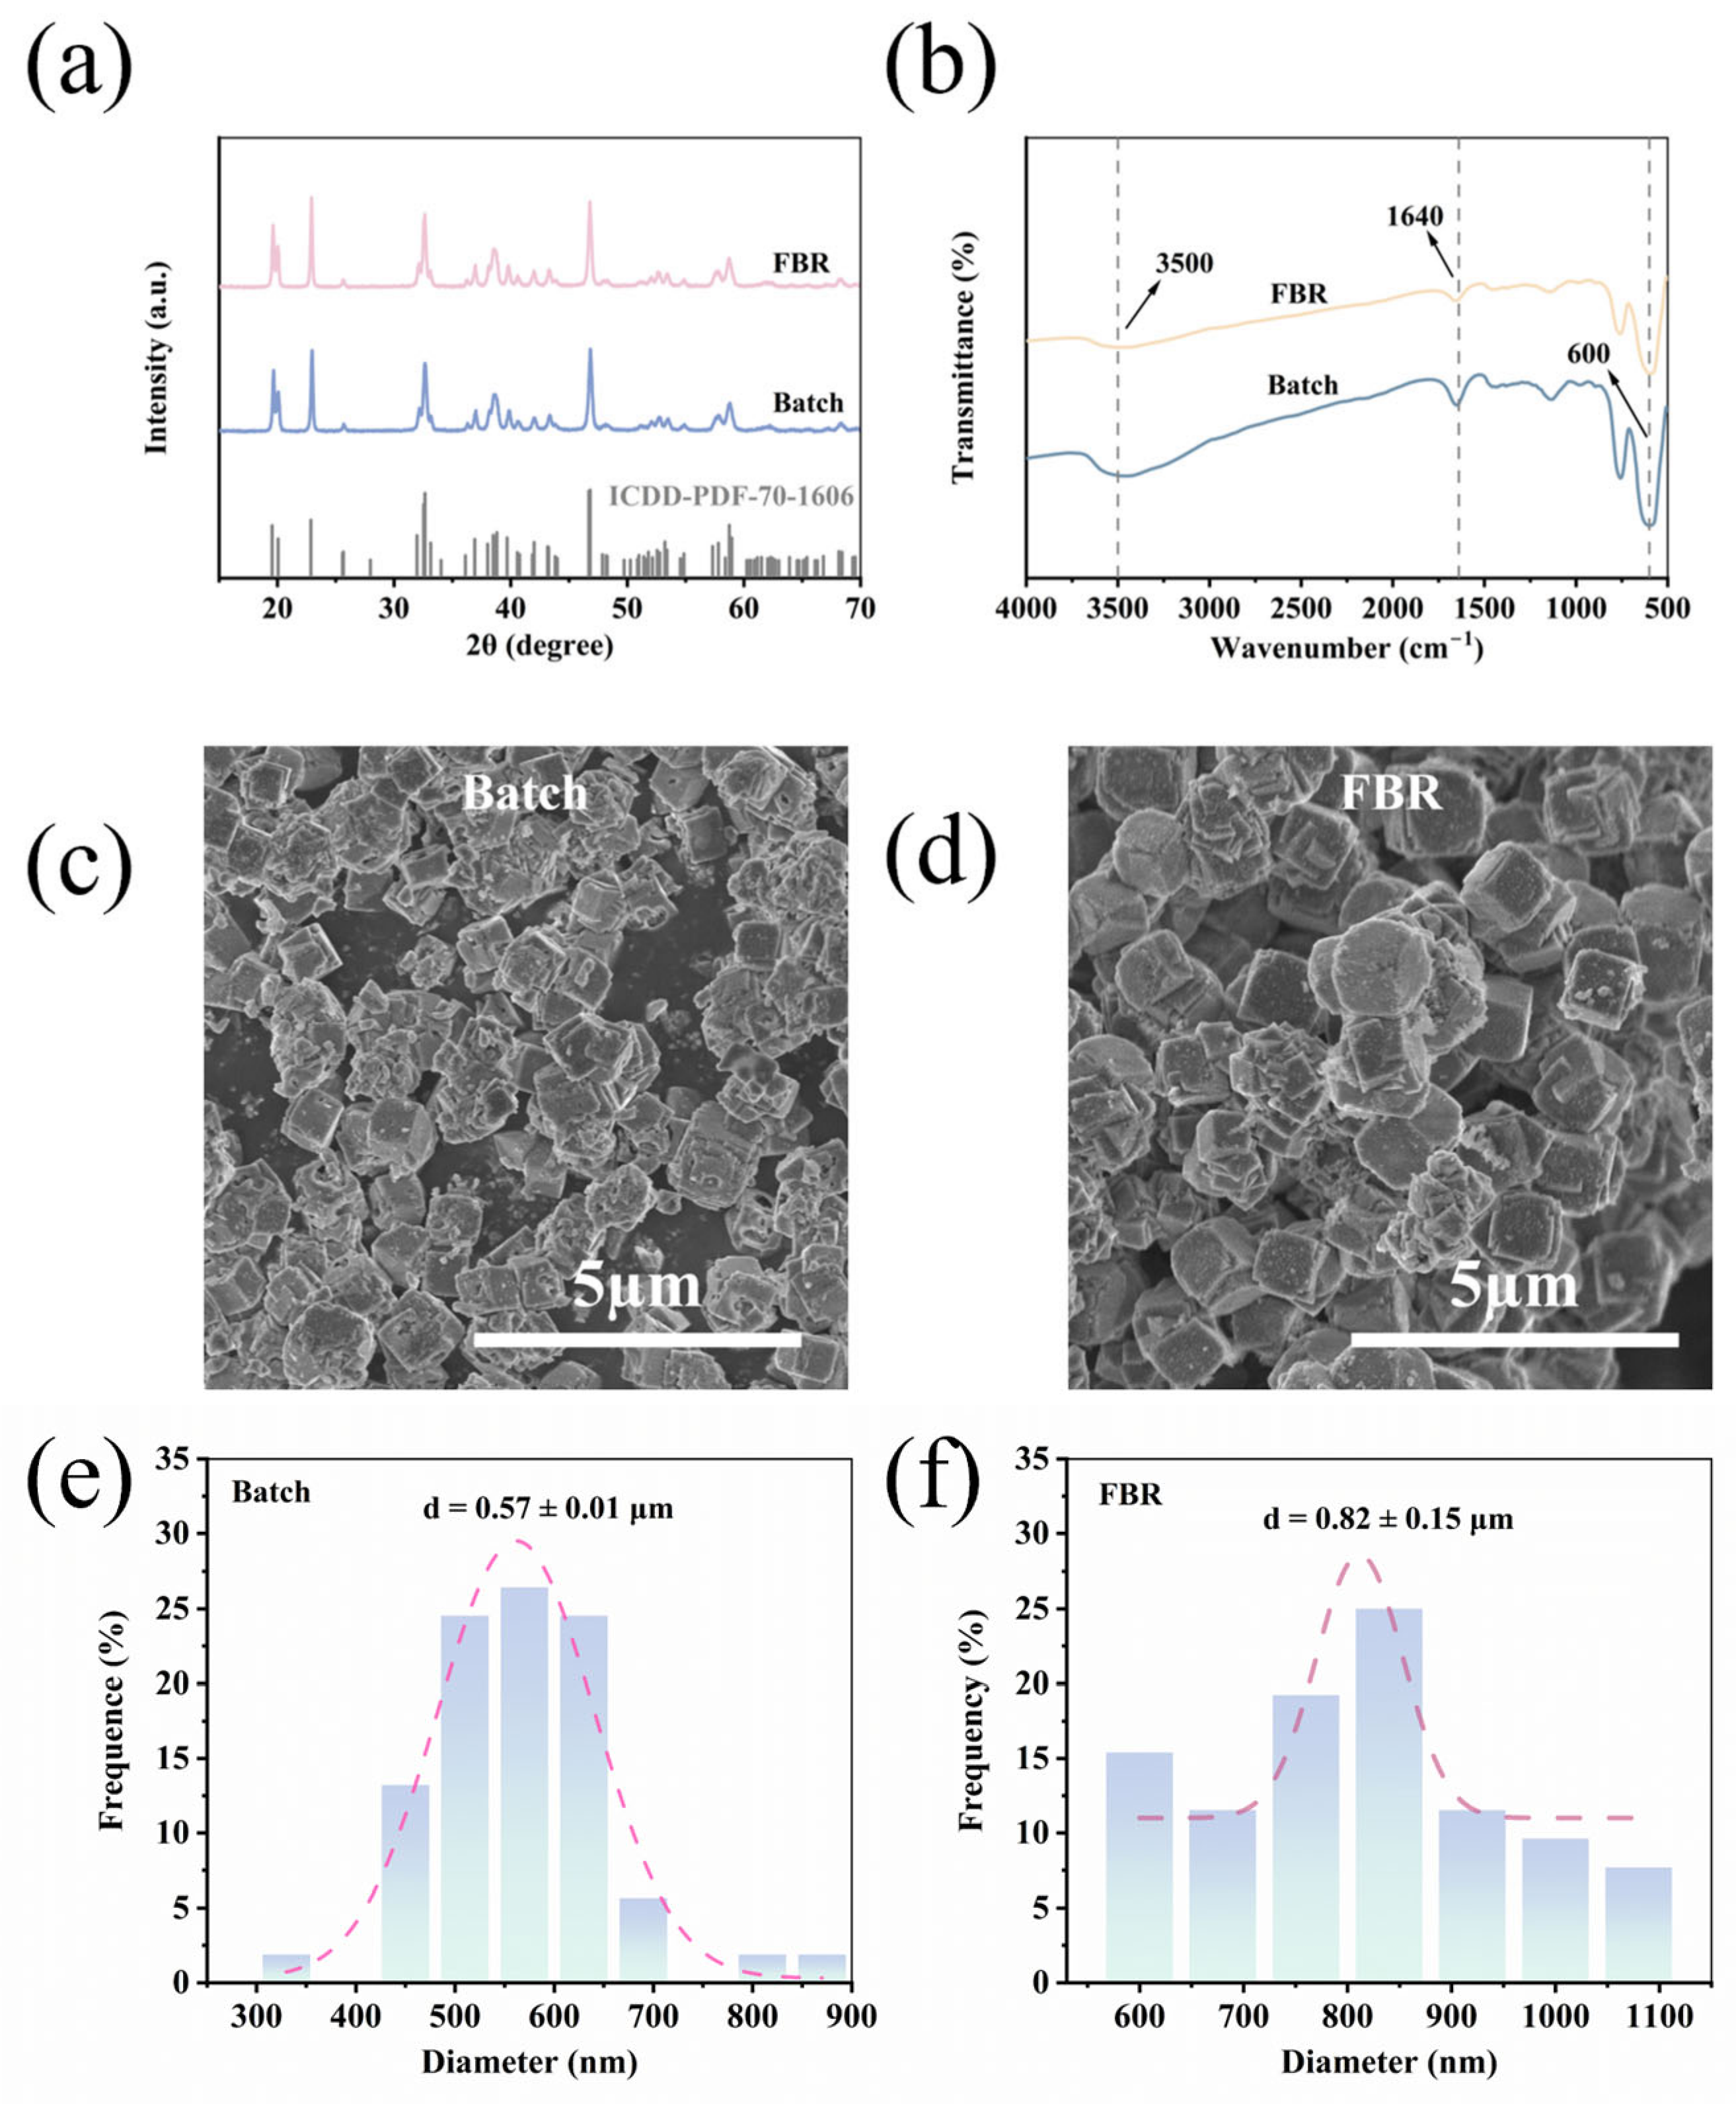
The XRD patterns of solids obtained at different pH values were consistent with the reference pattern of cryolite (Na3AlF6; ICDD PDF No. 70-1606) (Figure 3a) [17,24,30,40], indicating that cryolite was the principal crystalline phase detected. The XRD data were used for qualitative phase identification, and no conclusion regarding crystallite size or relative crystallinity was drawn from visual comparison of the peak widths. Additional XRD patterns for the Al/F ratio, pH, aging time, and temperature series are provided in Figures S1–S4, respectively.
The FTIR spectra showed a prominent Al–F-related absorption near 600 cm−1, supporting the presence of fluoride-coordinated aluminum structures in the recovered solids (Figure 3b) [24,41]. The broad band near 3500 cm−1 and the feature near 1640 cm−1 were attributed to O–H stretching and H–O–H bending vibrations associated with adsorbed water or surface hydroxyl groups [42,43]. The corresponding FTIR spectra for all tested conditions are shown in Figures S5–S8.
SEM images revealed clear changes in particle morphology with operating conditions (Figure 3c,d). At pH 3.0, the solids mainly consisted of fine aggregates with poorly developed crystal faces. At pH 6.5, more regular blocky or near-cubic particles were observed. At pH 8.0, particle uniformity decreased, and the edges became rounded or irregular. After 1 h of aging, particle surfaces remained rough, and crystal faces were incompletely developed; after 2 h, the face outlines became clearer; after 5 h, more pronounced aggregation and edge rounding were again observed. These morphological differences provide qualitative evidence that operating conditions influenced particle morphology and crystal-face development. The complete SEM image series for the pH and aging-time experiments is provided in Figures S9 and S10, respectively.

3.4. Local Elemental Composition and Surface Chemical States

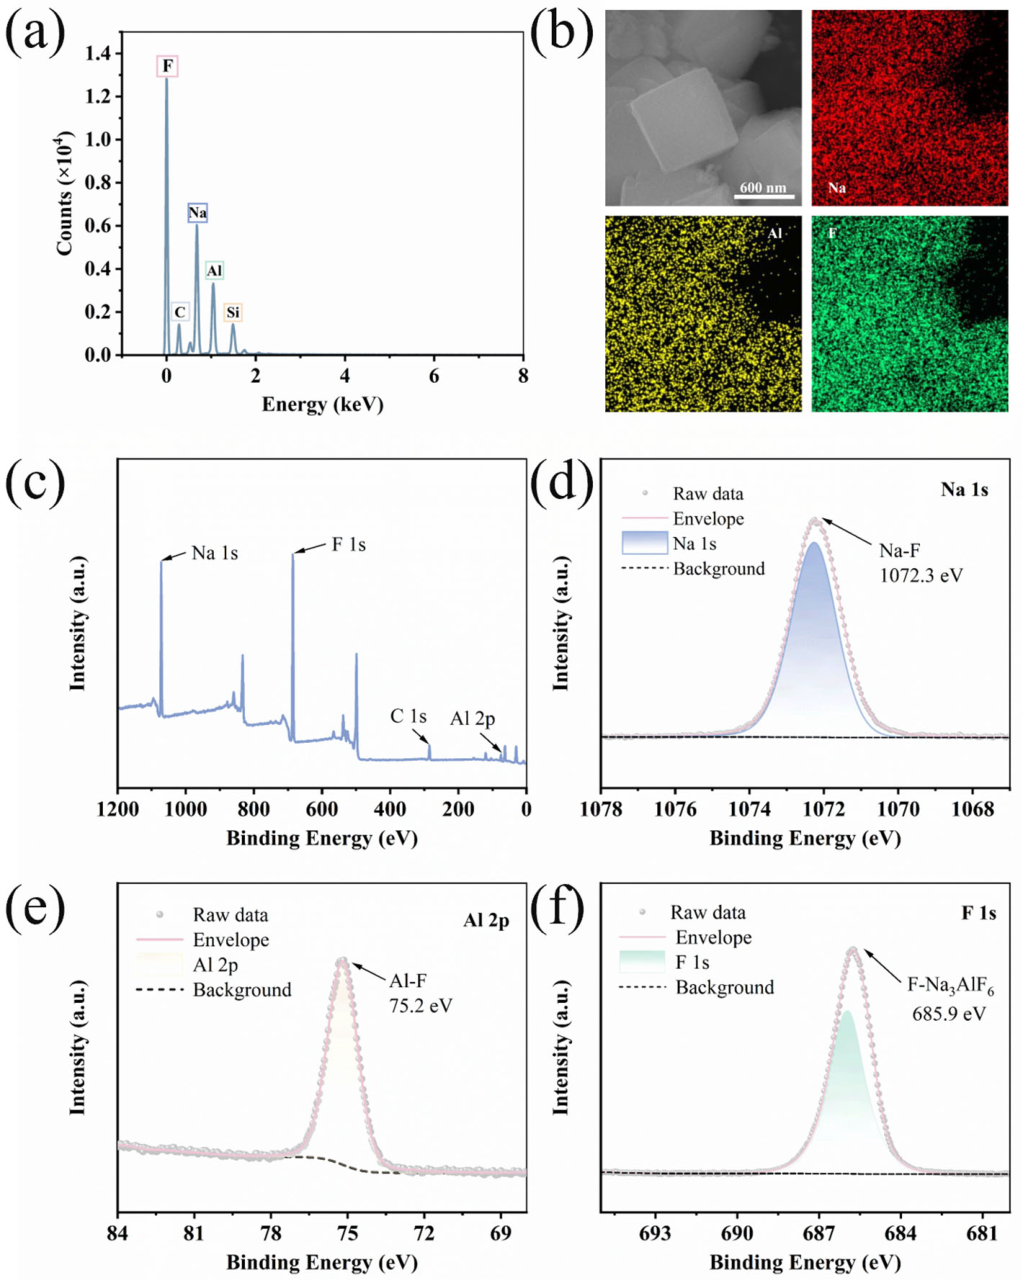
SEM–EDS elemental maps showed that Na, Al, and F were spatially coincident within the observed particle regions, with no evident micrometer-scale elemental segregation (Figure 4a,b). Local EDS analysis yielded atomic percentages of 31.92%, 11.08%, and 56.99% for Na, Al, and F, respectively, corresponding to a local Na/Al atomic ratio of approximately 2.88, close to the nominal value of 3 for Na3AlF6. The minor C and Si signals in the EDS spectrum were attributed mainly to the conductive carbon support and trace matrix- or preparation-derived impurities, respectively.
The XPS survey spectrum was dominated by Na, Al, and F, together with a minor adventitious carbon signal (Figure 4c). The Na 1s, Al 2p, and F 1s spectra were dominated by signals centered at 1072.3, 75.2, and 685.9 eV, respectively, consistent with the principal Na–Al–F surface environment (Figure 4d–f) [24]. Minor unresolved surface contributions cannot be completely excluded. The corresponding EDS and XPS results are summarized in Table S4.

3.5. Continuous-Flow Response and Reproduction of the Principal Crystalline Phase

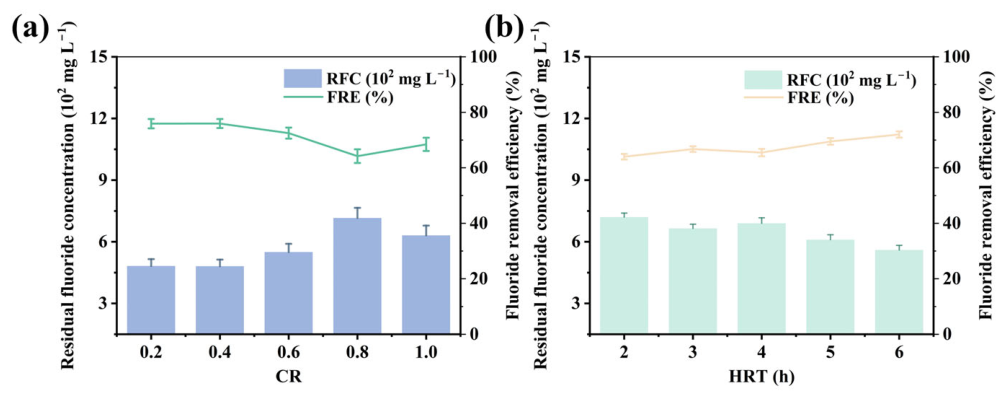
The HRT and circulation-ratio experiments showed that hydrodynamic conditions affected the liquid-phase residual fluoride concentration in the recirculating fluidized bed (Figure 5). As HRT increased from 2 to 6 h, residual fluoride generally decreased, and fluoride removal efficiency generally increased, although neither trend was strictly monotonic. Lower CR values (approximately 0.2–0.4) corresponded to higher removal than the highest CR tested. The fourfold increase in cross-sectional area from the lower reaction zone to the upper separation zone reduced the mean upward liquid velocity and favored the settling of larger particles. Moderate recirculation promoted mixing and particle suspension, whereas excessive recirculation increased hydraulic drag and may have enhanced fine-particle entrainment, partly accounting for the lower fluoride removal at the highest circulation ratio [18,28,29,44].
The principal XRD peak positions of the continuous-flow product were consistent with those of the batch product and the cryolite reference pattern (Figure 6a), while both products exhibited the Al–F-related FTIR absorption near 600 cm−1 (Figure 6b). SEM images showed near-cubic or polyhedral particles in both products (Figure 6c,d). The SEM-derived mean particle sizes were 0.57 ± 0.10 μm for the batch product and 0.82 ± 0.15 μm for the continuous-flow product, and the latter exhibited a broader size distribution (Figure 6e,f). These results indicate that the principal cryolite phase was reproduced under continuous feeding and recirculating hydraulic conditions, accompanied by an increase in mean particle size.

4. Discussion

4.1. Thermodynamic Formation Region Versus Experimentally Favorable Crystallization Window

A key finding of this study is the mismatch between the broad thermodynamic formation region and the much narrower experimentally favorable crystallization window. Visual MINTEQ predicted cryolite supersaturation over a broad pH range, whereas the highest liquid-phase fluoride removal in the batch experiments occurred near pH 6.5. This discrepancy indicates that SI > 0 represents thermodynamic potential but is not, by itself, sufficient to predict a practical crystallization window [19,31,32]. The equilibrium calculation does not determine whether cryolite can nucleate and grow within the available reaction time or whether the resulting particles can be effectively retained during solid–liquid separation [18,19,26,31]. Under strongly acidic conditions, HF protonation and dissolved Al–F complexation may limit the activities of precipitation-available species [25,32,33]. At higher pH, the model predicted increasing aluminum hydrolysis, while the potential formation of competing solids and possible changes in particle-surface interactions may further influence nucleation, growth, aggregation, and particle retention [26,33,35,40,45]. The initial ionic strength estimated from the measured major-ion composition was approximately 0.13 mol L−1. The Davies equation does not explicitly represent ion-specific interactions in the sulfate-rich waste-liquor matrix; accordingly, the calculations were interpreted as qualitative screening of speciation and saturation tendencies rather than quantitative predictions of crystal yield or crystallization kinetics. Coexisting sulfate and the elevated ionic strength may additionally influence aluminum speciation, nucleation, aggregation, and fine-particle retention, contributing to the difference between the calculated supersaturation region and the experimentally favorable crystallization window.
The most favorable liquid-phase response at Al/F = 1.0:6 is consistent with the nominal stoichiometry of Na3AlF6 [17,23,24,32]. Similarly, 2 h aging outperformed 1 h, whereas further extension provided no additional benefit, suggesting a temporal balance among nucleation, crystal growth, and aggregation [26,27,31]. The highest removal at 20 °C further indicates that heating did not improve liquid-phase fluoride removal within the waste-liquor composition and operating range examined [17,26]. Ambient-temperature operation may therefore be feasible without additional heating demand. The sequential single-factor design does not quantify interactions among pH, Al/F ratio, aging time, and temperature; the selected conditions therefore represent an experimentally favorable window rather than a statistically optimized global optimum.

4.2. Evidence Boundaries and Resource-Recovery Significance of the Cryolite-Enriched Solid

Multiple characterization methods consistently support cryolite as the principal crystalline phase in the recovered solid. XRD provides the most direct crystalline-phase evidence, which is corroborated by Al–F-related FTIR vibrations. SEM–EDS shows that Na, Al, and F are broadly co-localized within the observed microregions, whereas XPS supports Na–F- and Al–F-related chemical environments near the sample surface. Although these lines of evidence are mutually consistent, they operate at different spatial scales and do not establish an absolute phase-purity value. The original XRD data were collected for qualitative phase identification without an internal standard or dedicated slow-scan acquisition and were therefore not suitable for reliable quantitative Rietveld analysis. Accordingly, the recovered material is described as cryolite-enriched rather than as phase-pure cryolite.
At pH 6.5 and an aging time of 2 h, the particles changed from fine aggregates to more regular blocky or near-cubic morphologies, suggesting that operating conditions influenced both liquid-phase fluoride removal and crystal development and aggregation. Compared with the mixed fluoride sludge commonly generated by conventional calcium-salt treatment, the formation of a Na–Al–F solid with a more clearly defined principal crystalline phase may provide a more favorable basis for subsequent separation and potential utilization [11,13,14,17,18,30]. Direct reuse of the cryolite-enriched solid would require further verification of phase purity, Na/Al/F composition, moisture content, impurity levels, and particle-size distribution. The residual fluoride concentration remained 449 mg L−1; the process is therefore more appropriately positioned as a resource-recovery pretreatment followed by downstream polishing [5,46,47,48]. A closed solid-phase fluorine mass balance was not established because the dry-solid yield, bulk fluorine content after complete digestion, wash-water fluoride, and fine-particle losses were not quantified within the same experimental runs. A quantitative comparison with representative fluoride-recovery crystallization studies is provided in Table S6.

4.3. Continuous-Flow Transferability and Engineering Implications

Transferring the batch-screened conditions to a recirculating fluidized bed was a preliminary step from static condition evaluation toward continuous-process assessment. The effects of HRT and CR show that contact time, circulation intensity, particle retention, and solid–liquid separation are coupled in the continuous system [18,19,28,29,44]. The fourfold increase in cross-sectional area from the reaction zone to the separation zone reduced the mean upward liquid velocity and favored settling of larger particles. Moderate recirculation may improve mixing and particle suspension, whereas excessive recirculation may increase hydraulic drag and fine-particle entrainment. This hydrodynamic interpretation remains inferential because steady-state crystal yield, bed expansion, suspended solids, and fine-particle washout were not measured directly. The continuous-flow product retained the principal cryolite diffraction peaks and Al–F-related vibrations observed in the batch product, while the mean particle size increased from 0.57 ± 0.10 to 0.82 ± 0.15 μm. The larger mean size is consistent with particle growth, aggregation, or preferential retention of larger particles [18,30].
Under the selected batch conditions, the recorded reagent demands were approximately 5.85 kg m−3 of Al2(SO4)3·18H2O and 16.67 kg m−3 of NaOH on a pure-NaOH basis. For comparison, precipitation of the same removed fluoride mass as CaF2 would theoretically require approximately 3.41 kg m−3 of pure Ca(OH)2. This stoichiometric comparison excludes excess reagent dosage, energy consumption, solid–liquid separation, sludge conditioning, product value, disposal costs, and downstream polishing; no conclusion regarding economic superiority is therefore drawn. Lower-cost or waste-derived aluminum sources should be evaluated in subsequent process studies.
This study is limited by the sequential single-factor design, the use of waste liquor from one industrial source, the short-term continuous-flow evaluation, incomplete solid and liquid mass balances, and the absence of quantitative phase-purity, techno-economic, and life-cycle assessments. Future work should apply multivariate optimization, examine waste liquors from additional sources, quantify bed expansion and fine-particle washout during long-term operation, and complete phase, mass-balance, economic, and environmental evaluations.

5. Conclusions

This study showed that fluoride recovery as cryolite from real acidic semiconductor waste liquor was governed by both thermodynamic supersaturation and a narrower experimentally favorable crystallization window. Among the conditions tested, the highest liquid-phase fluoride removal of 79.6% was obtained at Al/F = 1.0:6, pH 6.5, an aging time of 2 h, and 20 °C. Cryolite was the principal crystalline phase detected, and the continuous-flow product exhibited a larger SEM-derived mean particle size than the batch product (0.82 ± 0.15 versus 0.57 ± 0.10 μm). The residual fluoride concentration remained 449 mg L−1; the process is therefore more appropriately positioned as a resource-recovery pretreatment requiring downstream polishing. Further work should quantify phase purity, solid-phase fluorine recovery, long-term fluidized-bed performance, and process economics.

Supplementary Materials

The following supporting information can be downloaded at: https://www.mdpi.com/article/10.3390/w18161960/s1. The Supplementary Materials include Tables S1–S6 and Figures S1–S11 and cite References [11,18,24,35,49].

Author Contributions

Conceptualization, K.C.; methodology, Y.W.; investigation, Y.W.; formal analysis, Y.W.; data curation, Y.W.; writing—original draft preparation, Y.W.; writing—review and editing, X.X., J.W., Y.Z. and K.C.; supervision, K.C.; funding acquisition, K.C. All authors have read and agreed to the published version of the manuscript.

Funding

This research was funded by the Anhui Province Science and Technology Innovation Tackling Project (No. 202423l10050034).

Data Availability Statement

The original contributions presented in this study are included in the article and Supplementary Materials. Further inquiries can be directed to the corresponding author.

Conflicts of Interest

Authors Xianjin Xie, Jiao Wang and Youde Zhang were employed by Wancho Environmental-Protection Co., Ltd., Suzhou, China and Anhui Xinyu Environmental Protection Technology Co., Ltd., Hefei, China. The remaining authors declare that the research was conducted in the absence of any commercial or financial relationships that could be construed as potential conflicts of interest.

References

  1. Semiconductor Industry Association. 2025 State of the U.S. Semiconductor Industry; Semiconductor Industry Association: Washington, DC, USA, 2025. [Google Scholar]
  2. Sim, J.; Lee, J.; Rho, H.; Park, K.-D.; Choi, Y.; Kim, D.; Kim, H.; Woo, Y.C. A review of semiconductor wastewater treatment processes: Current status, challenges, and future trends. J. Clean. Prod. 2023, 429, 139570. [Google Scholar] [CrossRef]
  3. Noman, E.A.; Ali Al-Gheethi, A.; Al-Sahari, M.; Yashni, G.; Mohamed, R.M.S.R.; Soon, C.F.; Nguyen, H.-H.T.; Vo, D.-V.N. An insight into microelectronics industry wastewater treatment, current challenges, and future perspectives: A critical review. Appl. Water Sci. 2024, 14, 64. [Google Scholar] [CrossRef]
  4. Wang, R.; Zhang, C.; Yu, H.; Sun, W. Research progress on hazardous fluorine-containing wastewater treatment in the integrated circuit industry: A resource recovery perspective. Sep. Purif. Technol. 2025, 365, 132626. [Google Scholar] [CrossRef]
  5. Qiu, Y.; Ren, L.-F.; Xia, L.; Shao, J.; Zhao, Y.; Van der Bruggen, B. Investigation of fluoride and silica removal from semiconductor wastewaters with a clean coagulation-ultrafiltration process. Chem. Eng. J. 2022, 438, 135562. [Google Scholar] [CrossRef]
  6. Zhou, L.; Zhong, Y.; Cao, X.; Zhao, H.; Liu, R. Treatment of highly concentrated fluoride wastewater from the semiconductor industry by CaCl2 based on the adjustment of ζ-potential. ACS EST Water 2023, 3, 4074–4081. [Google Scholar] [CrossRef]
  7. Ministry of Ecology and Environment of the People’s Republic of China; National Development and Reform Commission; Ministry of Public Security. National Catalogue of Hazardous Wastes (2025 Edition). 2024. Available online: https://www.mee.gov.cn/xxgk2018/xxgk/xxgk02/202411/W020241129617875148704.pdf (accessed on 24 June 2026).
  8. Solanki, Y.S.; Agarwal, M.; Gupta, A.B.; Gupta, S.; Shukla, P. Fluoride occurrences, health problems, detection, and remediation methods for drinking water: A comprehensive review. Sci. Total Environ. 2022, 807, 150601. [Google Scholar] [CrossRef] [PubMed]
  9. Johnston, N.R.; Strobel, S.A. Principles of fluoride toxicity and the cellular response: A review. Arch. Toxicol. 2020, 94, 1051–1069. [Google Scholar] [CrossRef] [PubMed]
  10. Veneri, F.; Iamandii, I.; Vinceti, M.; Birnbaum, L.S.; Generali, L.; Consolo, U.; Filippini, T. Fluoride Exposure and Skeletal Fluorosis: A Systematic Review and Dose-Response Meta-Analysis. Curr. Environ. Health Rep. 2023, 10, 417–441. [Google Scholar] [CrossRef] [PubMed]
  11. Lacson, C.F.Z.; Lu, M.-C.; Huang, Y.-H. Chemical precipitation at extreme fluoride concentration and potential recovery of CaF2 particles by fluidized-bed homogeneous crystallization process. Chem. Eng. J. 2021, 415, 128917. [Google Scholar] [CrossRef]
  12. Ho, H.-J.; Takahashi, M.; Iizuka, A. Simultaneous removal of fluoride and phosphate from semiconductor wastewater via chemical precipitation of calcium fluoride and hydroxyapatite using byproduct of recycled aggregate. Chemosphere 2023, 340, 139875. [Google Scholar] [CrossRef] [PubMed]
  13. Aldaco, R.; Garea, A.; Irabien, A. Calcium fluoride recovery from fluoride wastewater in a fluidized bed reactor. Water Res. 2007, 41, 810–818. [Google Scholar] [CrossRef] [PubMed]
  14. Van Den Broeck, K.; Van Hoornick, N.; Van Hoeymissen, J.; De Boer, R.; Giesen, A.; Wilms, D. Sustainable treatment of HF wastewaters from semiconductor industry with a fluidized bed reactor. IEEE Trans. Semicond. Manuf. 2003, 16, 423–428. [Google Scholar] [CrossRef]
  15. Gao, X.; Liu, J.; Gai, N.; Wang, J.; Yuan, Z.; Zhou, B.; Hou, R.; Yuan, R.; Chen, H. Induced crystallization techniques for fluoride removal from wastewater: Current developments and applications. J. Environ. Chem. Eng. 2025, 13, 117653. [Google Scholar] [CrossRef]
  16. Ma, L.; Qiu, Z.; Tang, Y.; Yang, W.; Chen, B.; Jiang, J.; Lin, Y. Chemical leaching–flexible precipitation for sustainable recovery of fluoride from aluminum electrolysis multisource hazardous waste. Chem. Eng. J. 2024, 500, 157138. [Google Scholar] [CrossRef]
  17. Chen, J.-Y.; Lin, C.-W.; Lin, P.-H.; Li, C.-W.; Liang, Y.-M.; Liu, J.-C.; Chen, S.-S. Fluoride recovery from spent fluoride etching solution through crystallization of Na3AlF6 (synthetic cryolite). Sep. Purif. Technol. 2014, 137, 53–58. [Google Scholar] [CrossRef]
  18. Quedi, B.B.B.; Ballesteros, F.C.; Vilando, A.C.; Lu, M.-C. Recovery of fluoride from wastewater in the form of cryolite granules by fluidized-bed homogeneous crystallization process. J. Water Process. Eng. 2024, 66, 106063. [Google Scholar] [CrossRef]
  19. Valderama, V.E.; Ballesteros, F.C.; García-Segura, S.; Lu, M.-C. Transforming wastewater into resources: A review of fluidized-bed homogeneous crystallization for sustainable treatment and recovery. J. Environ. Chem. Eng. 2025, 13, 118702. [Google Scholar] [CrossRef]
  20. Deng, L.; Wang, Y.; Zhang, X.; Zhou, J.; Huang, T. Defluoridation by fluorapatite crystallization in a fluidized bed reactor under alkaline groundwater conditions. J. Clean. Prod. 2020, 272, 122805. [Google Scholar] [CrossRef]
  21. Lee, M.-T.; Li, C.-W.; Liu, J.-C. Recovery of fluoride as perovskite-like minerals from industrial wastewater. Sep. Purif. Technol. 2015, 156, 1057–1063. [Google Scholar] [CrossRef]
  22. Kumar, M.; Babu, M.N.; Mankhand, T.R.; Pandey, B.D. Precipitation of sodium silicofluoride (Na2SiF6) and cryolite (Na3AlF6) from HF/HCl leach liquors of alumino-silicates. Hydrometallurgy 2010, 104, 304–307. [Google Scholar] [CrossRef]
  23. Ya, V.; Chen, Y.-C.; Chou, Y.-H.; Choo, K.-H.; Liu, J.-C.; Mameda, N.; Li, C.-W. Cryolite (Na3AlF6) crystallization for fluoride recovery using an electrolytic process equipped with a sacrificial aluminum anode. J. Hazard. Mater. 2019, 368, 90–96. [Google Scholar] [CrossRef] [PubMed]
  24. Wang, G.; Yang, Z.; Liu, J.; Xing, D.; Li, J. Study on preparation of cryolite by chemical precipitation of fluorine from aluminum electrolytic industrial wastewater. J. Environ. Manag. 2024, 371, 123036. [Google Scholar] [CrossRef] [PubMed]
  25. Ouedraogo, S.J.; Vinh, Y.; Noophan, P.; Naddeo, V.; Li, C.-W. Dissolution of aluminum hydroxide to provide Al and to neutralize acidity for the removal and recovery of fluoride through cryolite crystallization. J. Clean. Prod. 2023, 404, 136987. [Google Scholar] [CrossRef]
  26. Cao, X.; Peng, J.; Dong, W.; Wang, Y.; Di, Y. Theoretical study on the utilization of fluorine-containing wastewater in the aluminum industry: Crystallization characteristics and particle size control of cryolite prepared by carbonization. J. Environ. Chem. Eng. 2024, 12, 113572. [Google Scholar] [CrossRef]
  27. Wang, C.; Mao, S. Study on the effect of an ultrasound-assisted reaction on the crystallization properties of recovered cryolite. RSC Adv. 2023, 13, 35359–35368. [Google Scholar] [CrossRef] [PubMed]
  28. Aldaco, R.; Garea, A.; Irabien, A. Fluoride recovery in a fluidized bed: Crystallization of calcium fluoride on silica sand. Ind. Eng. Chem. Res. 2006, 45, 796–802. [Google Scholar] [CrossRef]
  29. Aldaco, R.; Garea, A.; Irabien, A. Modeling of particle growth: Application to water treatment in a fluidized bed reactor. Chem. Eng. J. 2007, 134, 66–71. [Google Scholar] [CrossRef]
  30. Jiang, K.; Zhou, K.; Yang, Y.; Du, H. A pilot-scale study of cryolite precipitation from high fluoride-containing wastewater in a reaction-separation integrated reactor. J. Environ. Sci. 2013, 25, 1331–1337. [Google Scholar] [CrossRef] [PubMed]
  31. Myerson, A.S.; Ginde, R. Crystals, Crystal Growth, and Nucleation. In Handbook of Industrial Crystallization, 2nd ed.; Myerson, A.S., Ed.; Butterworth-Heinemann: Woburn, MA, USA, 2002; pp. 33–65. [Google Scholar] [CrossRef]
  32. Ford, M.A.; Cunliff, J.D.B. An equilibrium model for the precipitation of synthetic cryolite. Hydrometallurgy 1986, 16, 283–299. [Google Scholar] [CrossRef]
  33. Deng, Z.; Xu, A.; Wei, X.; Zhang, X.; Pan, B. Formation of aluminum–fluoride complexes compromises defluoridation efficiency of aluminum-based coagulation. Environ. Sci. Technol. 2024, 58, 14918–14928. [Google Scholar] [CrossRef] [PubMed]
  34. Yuan, L.; Liu, T.; Sun, S.; Zhang, Y.; Li, C.-X.; Cui, K. Enhanced CaF2 crystal agglomeration induced by charge screened through sulfate doping. J. Water Process Eng. 2026, 88, 110146. [Google Scholar] [CrossRef]
  35. Wang, B.; Huo, L.; Wang, D. Defluorination behaviors using different types of aluminum salts: The effect of SO42−. Colloids Surf. A Physicochem. Eng. Asp. 2021, 624, 126768. [Google Scholar] [CrossRef]
  36. Zhang, J.; Brutus, T.E.; Cheng, J.; Meng, X. Fluoride removal by Al, Ti, and Fe hydroxides and coexisting ion effect. J. Environ. Sci. 2017, 57, 190–195. [Google Scholar] [CrossRef] [PubMed]
  37. Deng, L.; Wang, Y.; Yang, H.; Zhang, R.; Huang, T. New insights into defluoridation via induced crystallization: Implications of phosphate species regulation for process efficiency and economics. Sep. Purif. Technol. 2024, 348, 127706. [Google Scholar] [CrossRef]
  38. Tounsi, H.; Chaabane, T.; Omine, K.; Sivasankar, V.; Sano, H.; Hecini, M.; Darchen, A. Simultaneous removal of fluoride and nitrate from an aqueous mixture and semiconductor wastewater by sodium chloride-mediated electro-generated aluminas (EGAs): Conversion of recovered fluoride into fluorapatite using plasterboard waste. J. Clean. Prod. 2024, 463, 142730. [Google Scholar] [CrossRef]
  39. Gustafsson, J.P. Visual MINTEQ, Version 4.0: A Free Equilibrium Speciation Model; KTH Royal Institute of Technology: Stockholm, Sweden, 2026. [Google Scholar]
  40. Nguyen, K.A.; Shin, Y.-U.; Nguyen, D.A.; Jang, A. A robust approach for sustainable removal and recovery of fluoride via cryolite crystallization in an enhanced electrocoagulation process. J. Water Process. Eng. 2025, 76, 108256. [Google Scholar] [CrossRef]
  41. Parker, S.F.; Ramírez-Cuesta, A.J.; Daemen, L.L. The structure and vibrational spectroscopy of cryolite, Na3AlF6. RSC Adv. 2020, 10, 25856–25863. [Google Scholar] [CrossRef] [PubMed]
  42. Gomes, J.A.G.; Daida, P.; Kesmez, M.; Weir, M.; Moreno, H.; Parga, J.R.; Irwin, G.; McWhinney, H.; Grady, T.; Peterson, E.; et al. Arsenic removal by electrocoagulation using combined Al–Fe electrode system and characterization of products. J. Hazard. Mater. 2007, 139, 220–231. [Google Scholar] [CrossRef] [PubMed]
  43. Kloprogge, J.T.; Ruan, H.D.; Frost, R.L. Thermal decomposition of bauxite minerals: Infrared emission spectroscopy of gibbsite, boehmite and diaspore. J. Mater. Sci. 2002, 37, 1121–1129. [Google Scholar] [CrossRef]
  44. Aldaco, R.; Garea, A.; Irabien, A. Particle growth kinetics of calcium fluoride in a fluidized bed reactor. Chem. Eng. Sci. 2007, 62, 2958–2966. [Google Scholar] [CrossRef]
  45. Yu, Y.; Zhang, M.; Lu, H.; Huang, F.; Zhang, Z.; Qiu, W.; Hu, B.; Zheng, P.; Wang, D. Insights into the crucial role of pH to achieve the dual goals of efficient fluoride removal and resource recovery from the photovoltaic manufacturing wastewater. Chem. Eng. J. 2024, 498, 155391. [Google Scholar] [CrossRef]
  46. Qiu, Y.; Ren, L.-F.; Shao, J.; Xia, L.; Zhao, Y. An integrated separation technology for high fluoride-containing wastewater treatment: Fluoride removal, membrane fouling behavior and control. J. Clean. Prod. 2022, 349, 131225. [Google Scholar] [CrossRef]
  47. Damtie, M.M.; Woo, Y.C.; Kim, B.; Hailemariam, R.H.; Park, K.-D.; Shon, H.K.; Park, C.; Choi, J.-S. Removal of fluoride in membrane-based water and wastewater treatment technologies: Performance review. J. Environ. Manag. 2019, 251, 109524. [Google Scholar] [CrossRef] [PubMed]
  48. Wan, K.; Huang, L.; Yan, J.; Ma, B.; Huang, X.; Luo, Z.; Zhang, H.; Xiao, T. Removal of fluoride from industrial wastewater by using different adsorbents: A review. Sci. Total Environ. 2021, 773, 145535. [Google Scholar] [CrossRef] [PubMed]
  49. Hu, R.; Tian, Z.; Fan, Z.; Huang, T.; Wen, G. Pilot test on acidic fluoride-containing wastewater treatment in the photovoltaic industry through induced crystallization with a focus on calcium fluoride recovery. Sep. Purif. Technol. 2024, 341, 126879. [Google Scholar] [CrossRef]
Figure 1. Visual MINTEQ thermodynamic screening results for the semiconductor waste liquor: (a) calculated fluoride-species distribution; (b) calculated aluminum-species distribution; (c) effects of pH and Al/F molar ratio on the equilibrium amount of cryolite; and (d) saturation indices of cryolite and selected competing solids.
Water 18 01960 g001
Figure 2. Effects of operating parameters on residual liquid-phase fluoride concentration (bars) and liquid-phase fluoride removal efficiency (lines): (a) Al/F molar ratio; (b) pH; (c) aging time; and (d) temperature. FRE denotes liquid-phase fluoride removal efficiency, and RFC denotes residual fluoride concentration. Data are presented as the mean ± standard deviation (n = 3).
Water 18 01960 g002
Figure 3. Solid-phase identification and morphology under different batch conditions: (a) XRD patterns at different pH values; (b) FTIR spectra at different pH values; (c) SEM images at pH 3.0, 6.5, and 8.0; and (d) SEM images after aging for 1, 2, and 5 h at pH 6.5.
Water 18 01960 g003
Figure 4. Elemental and surface characterization of the solid obtained under the screened batch conditions: (a) EDS spectrum; (b) SEM image and elemental maps of Na, Al, and F; (c) XPS survey spectrum; and high-resolution spectra of (d) Na 1s, (e) Al 2p, and (f) F 1s.
Water 18 01960 g004
Figure 5. Effects of fluidized-bed operating parameters on residual fluoride concentration and liquid-phase fluoride removal efficiency: (a) circulation ratio (CR); and (b) hydraulic retention time (HRT). FRE denotes liquid-phase fluoride removal efficiency, and RFC denotes residual fluoride concentration. Data are presented as the mean ± standard deviation for samples collected during the designated stable stages.
Water 18 01960 g005
Figure 6. Comparison of solids obtained from the screened batch experiment and the recirculating fluidized-bed crystallizer: (a) XRD patterns; (b) FTIR spectra; (c) SEM image of the batch product; (d) SEM image of the continuous-flow product; (e) particle-size distribution of the batch product; and (f) particle-size distribution of the continuous-flow product.
Water 18 01960 g006
Table 1. Principal physicochemical properties of the original waste liquor.
ParameterpHF (mg L−1)Na (mg L−1)Al (mg L−1)SO42− (mg L−1)Cl (mg L−1)NO3 (mg L−1)
Content2.5220010664815691181424
Disclaimer/Publisher’s Note: The statements, opinions and data contained in all publications are solely those of the individual author(s) and contributor(s) and not of MDPI and/or the editor(s). MDPI and/or the editor(s) disclaim responsibility for any injury to people or property resulting from any ideas, methods, instructions or products referred to in the content.