Article

The Impact of the Variation in Land Use and Land Cover on the Lake Water Quality in Arid Areas—A Case Study of the Hetao Irrigation District Basin, Northwest China


1
Inner Mongolia Ecological Environment Big Data Co., Ltd., Hohhot 010010, China
2
National Joint Research Center for Ecological Conservation and High Quality Development of the Yellow River Basin, Beijing 100012, China
3
School of Electric Power Engineering, Kunming University of Science and Technology, Kunming 650500, China
*
Author to whom correspondence should be addressed.
Water 2026, 18(15), 1907; https://doi.org/10.3390/w18151907
Submission received: 20 April 2026 / Revised: 24 July 2026 / Accepted: 27 July 2026 / Published: 4 August 2026

Abstract

The Hetao Irrigation District in arid northwestern China presents a significant challenge in balancing agricultural intensification and water conservation, particularly in its terminal lake, Wuliangsu Lake. This study examined how changes in Land Use/Land Cover (LULC) and cropping structures influenced the lake’s water quality. By using remote sensing data for LULC classification and agricultural statistics for crop composition, we analyzed the spatio-temporal variation in LULC and cropping structure in the irrigation district and quantified the associated agricultural non-point source pollution loads (total nitrogen, total phosphorus, and chemical oxygen demand) entering the lake. A calibrated Environmental Fluid Dynamics Code model was applied to evaluate water quality responses to cropping structure optimization. Our findings revealed significant shifts in LULC and cropping structure during the study period, driven by agricultural intensification, ecological restoration policies, urbanization, market forces, and national food security strategies. Concurrently, agricultural non-point source pollution loads into the lake showed a steady declining trend from 2018 to 2023, with total nitrogen (TN) decreasing by 15%, total phosphorus (TP) by 16.9%, and chemical oxygen demand (COD) by 19.4%. Model simulations demonstrated that optimizing the cropping structure, specifically by reducing the area of high-fertilizer crops (sunflower) and expanding low-fertilizer crops (spring wheat) and forage crops for ecological purposes, could further improve lake water quality. Under the intensive adjustment scenario, the inflow loads of TN, TP, and COD decreased by 10%, 11.7%, and 10.9%, respectively, while the corresponding in-lake concentrations decreased by 22.1%, 19.8%, and 18.7%, respectively. TP exhibited the highest sensitivity to such adjustments. By linking cropping structure adjustments with hydrodynamic-water quality modeling, this study provides a quantitative framework for assessing water quality responses in arid irrigated systems, offering a scientific basis for balancing agricultural production and water ecosystem protection in the Hetao district and similar regions.

1. Introduction

Arid and semi-arid regions account for over 40% of the global land area, with agricultural irrigation being the primary consumer of water resources in these areas [1]. Many studies have extensively documented that water scarcity and irrational agricultural activities in these arid and semi-arid regions are key drivers of ecological degradation and agricultural non-point source pollution globally [2,3]. According to the Food and Agriculture Organization (FAO), irrigation is essential to compensate for the evapotranspiration deficit caused by insufficient precipitation in arid climates, making irrigation water management a core issue for sustainable agricultural development in such regions [4,5]. Meanwhile, relevant reviews have pointed out that nitrate leaching, as the main form of nitrogen loss in arid farmland, is closely related to irrigation and fertilization practices, further exacerbating non-point source pollution risks in arid agricultural areas [6,7]. Arid and semi-arid regions in northwestern China have attracted widespread academic attention due to their fragile ecological environment and critical role in agricultural production, with numerous studies focusing on the balance between agricultural development and water-ecological security in typical irrigation districts [8,9,10].
The Hetao Irrigation District (HID), located in the arid northwest of China (40°19′ N–41°18′ N, 106°20′ E–109°19′ E), is the largest gravity-fed irrigation district in China, relying solely on the Yellow River for its irrigation supply. It stretches approximately 250 km east-west and 50 km north-south, covering a total area of 11,195.4 km2, of which over 6670 km2 (approximately 60%) is irrigated. As a vital base for grain and cash crop production in China [11], HID faces growing environmental challenges. Over the past few decades, water scarcity and suboptimal cropping structure adjustments have contributed to the worsening of agricultural non-point source pollution across the district [12,13]. Large quantities of nitrogen and phosphorus nutrients from agricultural activities are transported via irrigation return flow into the downstream Wuliangsu Lake, causing water quality deterioration and significant eutrophication, which poses a threat to the ecological security of the Yellow River Basin [14]. As the sole drainage and flood detention basin of HID, Wuliangsu Lake is the largest freshwater lake in the Yellow River Basin, and its water quality is inextricably linked to the cropping structure of the upstream irrigation district [15]. Long-term monitoring data from the Bayannur Ecology and Environment Bureau (2011–2023) indicates that Wuliangsu Lake has been moderately to severely eutrophic since at least 2011, with concentrations of total nitrogen (TN) and total phosphorus (TP) consistently surpassing the standard limits. The eutrophication levels exhibit notable spatial variability, being most severe in the inflow area, followed by the central and outflow areas [16].
Variations in LULC and cropping structure are key factors influencing agricultural non-point source pollution [17]. Different crop types exhibit significant differences in fertilizer application rates, irrigation demands, and pollutant export coefficients, which directly determine the non-point source pollution load entering the lake [18,19,20]. The main crops cultivated in HID include spring wheat, maize, sugar beet, and sunflower. Among these, sunflower and sugar beet are typical high-fertilizer-consumption crops. In recent years, alongside the adjustments to the agricultural industrial structure in HID, the cultivation area of high-economic-value, high-fertilizer crops has increased, while the area devoted to traditional grain crops (e.g., spring wheat and maize) has decreased. This shift has further increased the pollution load in the irrigation return flow [21]. This trend aligns with the long-term trajectory of non-point source pollution in HID, where the reduction observed over the past decade is primarily attributed to adjustments in cropping structure and the control of industrial pollution. Therefore, investigating how cropping structure changes affect lake water quality in HID is of considerable practical significance for controlling rural non-point source pollution and protecting the subaquatic ecological environment in arid regions.
Building on this research context, total nitrogen (TN), total phosphorus (TP), and chemical oxygen demand (COD) were selected as the core water quality indicators in this study, grounded in three interrelated considerations. TN and TP are the principal nutrients driving eutrophication in Wuliangsu Lake, with agricultural fertilizer application in HID serving as their dominant source. Reducing the input of these nutrients through cropping structure adjustment is therefore the central intervention evaluated in this study. Meanwhile, COD captures the organic pollution load originating from crop residues, livestock manure, and irrigation return flows, which together constitute a major component of the agricultural non-point source pollution entering the lake. Importantly, all three parameters have been consistently monitored at six stations in Wuliangsu Lake from 2018 to 2023 under the national surface water quality monitoring program (GB 3838-2002 [22]), providing a robust and homogeneous dataset for model calibration and validation. Other water quality parameters (e.g., heavy metals, pesticides, microbial indicators) were excluded from this analysis because they are not directly influenced by cropping structure changes and would require separate sampling campaigns and modeling approaches beyond the scope of this study.
Water quality models are powerful tools for simulating the migration and transformation of pollutants in subaquatic systems and predicting water quality changes [23,24]. Among these models, the Environmental Fluid Dynamics Code (EFDC) model is a comprehensive three-dimensional hydrodynamic-water quality model. Originally developed by John Hamrick and colleagues at the Virginia Institute of Marine Science (VIMS) with funding from the U.S. Environmental Protection Agency (USEPA) and presently maintained by Tetra Tech, Inc., the EFDC model enables accurate simulation of hydrodynamic processes and the transport and transformation of nutrients such as nitrogen and phosphorus. It has been successfully applied to water quality simulations in lakes, reservoirs, and irrigation districts within arid and semi-arid regions [25,26]. For instance, United States Department of Agriculture-Agricultural Research Service (USDA-ARS) researchers utilized the EFDC model to simulate dynamic changes in microbial water quality in irrigation ponds, clarifying the impact of pollutant spatial distribution on irrigation water quality [27]. Lai et al. employed the EFDC model to predict the hydrological impacts of the Poyang Lake Project and analyzed the relationship between water level fluctuations and water quality deterioration [28]. However, few studies have integrated the EFDC model with variations in cropping structure to investigate the impact of agricultural non-point source pollution on lake water quality in arid irrigation districts, particularly within HID. Existing research on Wuliangsu Lake has primarily focused on the spatial differences in water quality and eutrophication characteristics across different monitoring zones/locations (i.e., spatial variation) and their changes over time (i.e., temporal variation) [29], or on assessing ecological environment quality using the Remote Sensing Ecological Index (RSEI) [30], lacking quantitative simulations of how adjustments in upstream cropping structure affect lake water quality.
In this study, LULC change refers to transitions among broad land cover categories (cultivated land, water bodies, impervious surfaces, wasteland, and natural vegetation) as mapped by remote sensing, while cropping structure change refers to shifts in the proportional area of individual crop types (sunflower, maize, spring wheat, and forage) within the cultivated land, as determined from agricultural statistics.
To address these research gaps, this study aimed to achieve the following five objectives:
(1)
Characterize the spatio-temporal evolution of Land Use/Land Cover (LULC) and cropping structure in the Hetao Irrigation District (HID) during 2018–2023, using MODIS remote sensing imagery and agricultural statistical data.
(2)
Quantify the annual agricultural non-point source pollution loads (TN, TP, and COD) entering Wuliangsu Lake from different cropping structures, employing the export coefficient method with locally calibrated coefficients.
(3)
Develop, calibrate, and validate a three-dimensional EFDC hydrodynamic-water quality model for Wuliangsu Lake, enabling reliable simulation of pollutant transport, transformation, and spatial distribution.
(4)
Simulate and evaluate the water quality response of the lake under two designed cropping structure optimization scenarios, thereby providing a quantitative scientific basis for balancing agricultural production and aquatic ecosystem protection in arid irrigation regions.
(5)
Investigate the spatio-temporal response structures of lake water quality to cropping structure adjustments, quantifying the differential reduction efficiencies between high-load inlet zones and low-load outlet zones across the growing season.

2. Study Area and Data

2.1. Study Area

The Hetao Irrigation District (HID), situated in northwestern China, is the largest gravity-fed irrigation district relying on the Yellow River, covering approximately 11,195 km2 (Figure 1). A 220 km main drainage ditch collects irrigation return flows and discharges them into Wuliangsu Lake, a critical terminal basin characterized by ecological fragility in the Yellow River basin.
HID serves as a major grain and cash crop production base in an arid climate, with a mean annual precipitation of 153 mm and evaporation of 650 mm, where agricultural activities dominate the regional land use. The regional groundwater table is shallow (1–3 m), and the flat topography (slope 1/5000–1/8000) limits natural drainage, making the area prone to salinization and pollutant accumulation. Notably, the main crops in HID include spring wheat, maize, sunflowers, sugar beets and forage, among which sunflowers and sugar beets are high-fertilizer crops while spring wheat and forage are low-fertilizer crops [31,32]. Thus, adjustments in the cropping structure of HID directly impact the water quality of downstream Wuliangsu Lake and are a critical factor for the ecological health of the entire basin [33].
The Wuliangsu Lake (40°36′–41°03′ N, 108°43′–108°57′ E) lies in the western HID and receives its irrigation drainage. Acting as both the largest freshwater lake in the Yellow River basin and HID’s only discharge zone, Wuliangsu Lake has an elongated morphology (35–40 km long, 5–10 km wide) and a 126.7 km shoreline. Its water storage varies from 320 to 400 million m3, with surface elevations between 1018.5 and 1019.2 m. The lake is predominantly shallow (0.8–1 m over 80% of its area), with a maximum depth around 4 m. Its water comes mainly from HID irrigation return flows. Moderate to severe eutrophication, driven by persistent nitrogen and phosphorus inputs from its dominant water source (HID irrigation return flow, carrying agricultural nutrients), has impaired the lake’s ecological functions. A clear water quality gradient is evident from the inlet to the outlet. The inlet area, which receives concentrated drainage and sewage input, exhibits the poorest water quality, accompanied by persistent algal turbidity. Conditions improve in the central and outlet areas, which maintain a macrophyte–algae coexistence state.

2.2. Data Source and Processing

2.2.1. Remote Sensing Data

In this study, MODIS (Moderate Resolution Imaging Spectroradiometer) images served as the primary remote sensing data source, including three specific products: MOD13A1, MOD11A2, and MOD09A1. The primary utility of the MODIS datasets lies in their ability to provide large-scale spatial coverage alongside consistent long-term observational records. To guarantee the accuracy of ecological indicator extraction during subsequent analyses, we carefully selected MODIS images of the study area acquired between July and August, with cloud cover limited to less than 5%; these images were then used to identify and classify different LULC types.
Although the moderate spatial resolution of MODIS (250–500 m) limits the ability to discern fine-scale landscape heterogeneity, which potentially leads to mixed pixel effects where a single pixel encompasses both land and water, it provides significant advantages for large-scale ecological monitoring. The high temporal resolution of MODIS (daily acquisitions from Terra and Aqua) enables the construction of continuous, cloud-filtered time series of NDVI/EVI profiles that capture phenological differences among broad land cover classes, which is crucial for robust trend analysis. In contrast, higher-resolution sensors such as Sentinel-2 (10–20 m, 5-day revisit) and Landsat (30 m, 16-day revisit) are more prone to cloud-gap interruptions during the growing season, reducing the continuity of phenological profiles. Given the study’s focus on inter-annual trends at the basin scale rather than field-level crop mapping, the MODIS-based approach provides an appropriate balance between temporal resolution and spatial coverage, despite its coarser spatial resolution.

2.2.2. Hydrological and Water Quality Data

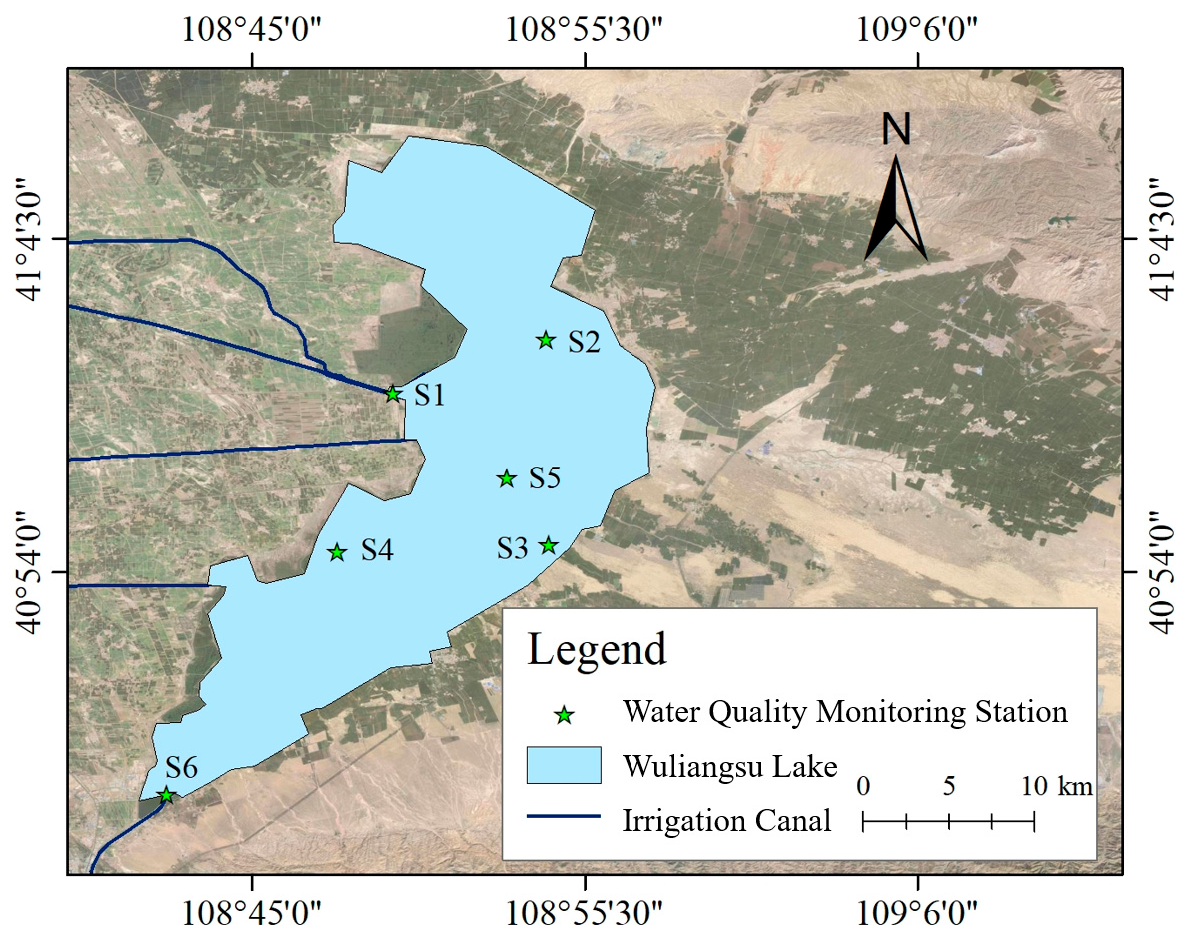
Hydrological data (encompassing Wuliangsu Lake’s inflow volumes, precipitation, and evaporation) used in this study were sourced from the Bayannur Water Conservancy Bureau and the China Meteorological Data Network. Daily water quality data (TN, TP, and COD) observed from 2018 to 2023 were collected at six designated monitoring points across the lake (Figure 2). Water quality monitoring station S1 is positioned at the estuary of the primary drainage canal on the western shore of the lake region, S2 is situated in the eastern part of the lake region where reeds grow densely, S3 and S4 are respectively located on the eastern and western shores of the lake, S5 is located at the center of the lake, and S6 is located at the only outlet of Wuliangsu Lake. The parameters monitored were analyzed in accordance with the analytical protocols outlined in the Environmental Quality Standards for Surface Water (GB 3838-2002). Prior to use, abnormal values within the monitoring dataset were removed using the 3σ principle, and mean values were computed to facilitate model verification.
The most recent complete water quality monitoring data available at the time of this study covered the period 2018–2023. Data for subsequent years (2024 onward) had not yet been officially released by the Bayannur Ecology and Environment Bureau at the time of analysis, thus precluding their inclusion in the current investigation. Extending the monitoring period to include 2024–2025 observations would further validate the trends identified here and is recommended for future studies.

2.2.3. Agricultural Statistical Data

For the purpose of this study, agricultural statistical data regarding the HID during the period from 2018 to 2023 (specifically including crop-specific cultivated areas, fertilizer application rates, and irrigation quotas) were systematically collected from two authoritative regional data sources, namely the Inner Mongolia Statistical Yearbook and the Bayannur Agricultural Statistical Report. Notably, the cropping system in HID has undergone considerable change in recent years, marked by a substantial expansion in the cultivated area of high-fertilizer-demand crops such as sunflower and sugar beet. This shift in cropping structure has led to a significant rise in nitrogen and phosphorus inputs, further elevating the load of non-point source pollutants entering the nearby lake system.

2.2.4. Topographic Data

The topography of HID was derived from a 30 m resolution Digital Elevation Model (DEM) obtained from the Shuttle Radar Topography Mission (SRTM) via USGS EarthExplorer. Available online: https://earthexplorer.usgs.gov/ (accessed on 15 June 2024). By using the EFDC modeling framework, a 50 m resolution grid was generated for the spatial discretization of Wuliangsu Lake. The lake’s topographic features directly influence its hydrodynamic processes, which in turn drive the migration and transformation of pollutants. Therefore, an accurate representation of topography is critical for constructing the EFDC model.

3. Methodology

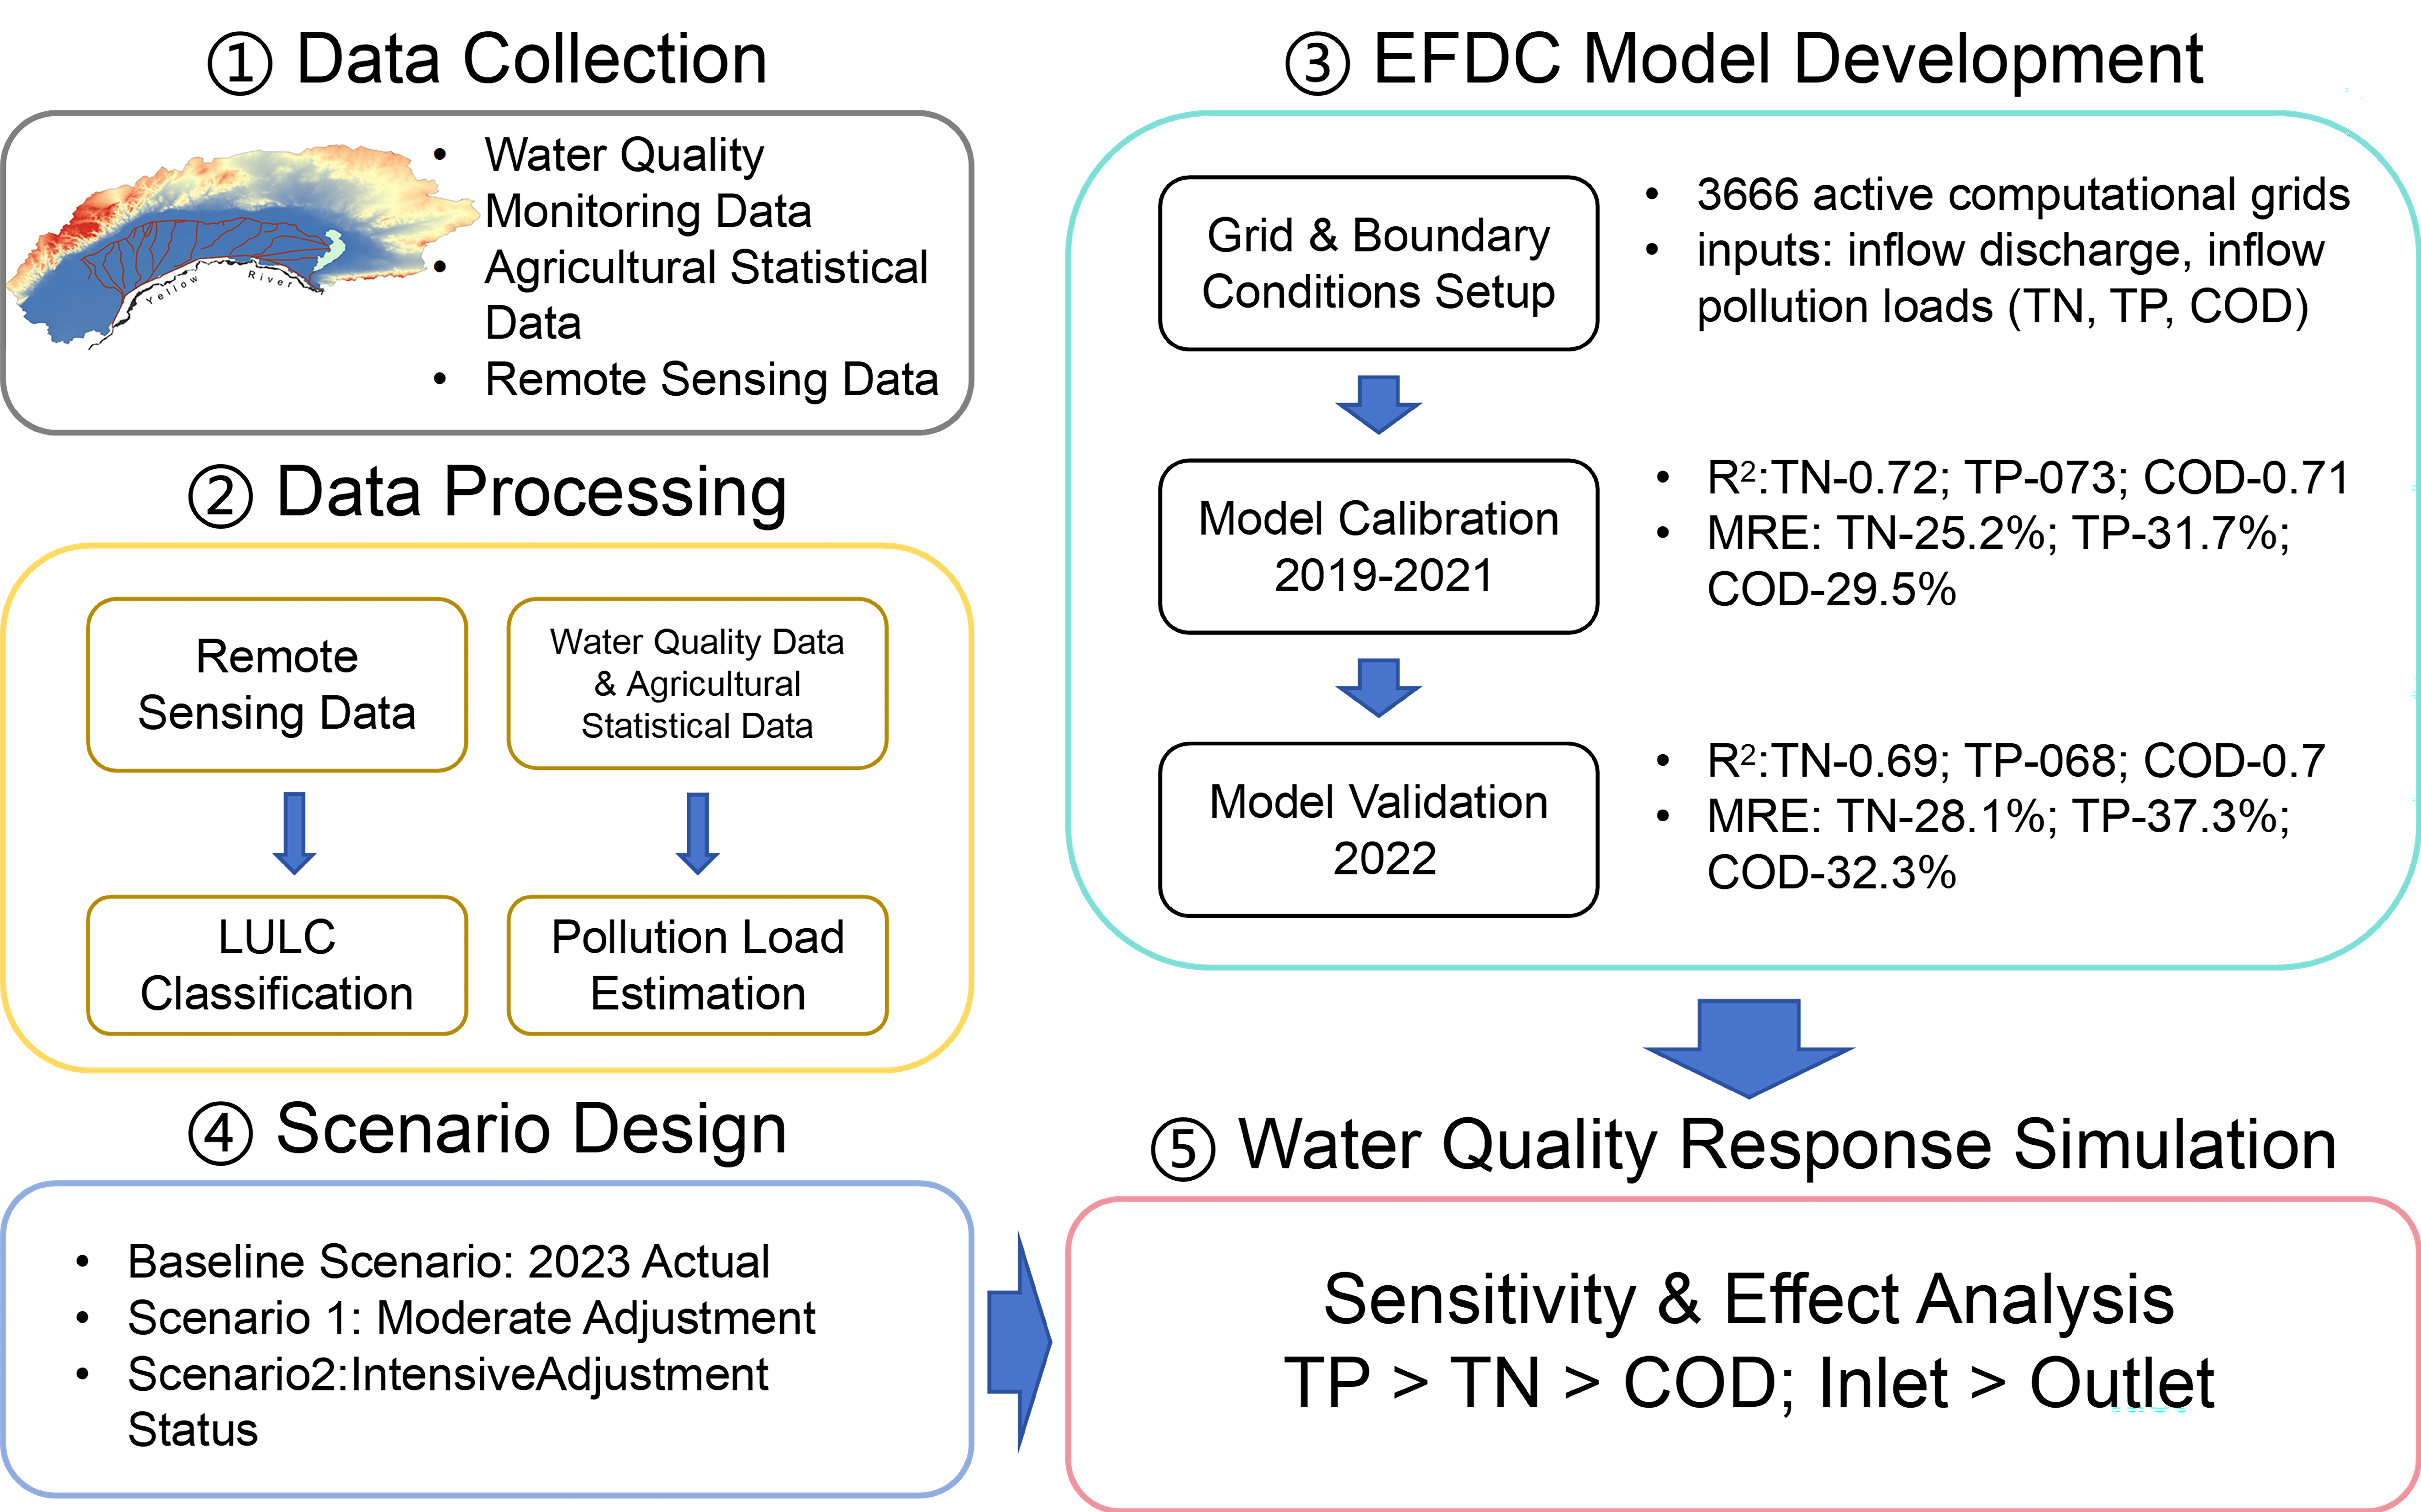
This study adopted a comprehensive framework combining remote sensing analysis, non-point source pollution quantification, and hydrodynamic-water quality modeling (Figure 3). This integrated framework ensures a systematic and quantitative assessment of how land use and cropping structure adjustments affect the water quality of Wuliangsu Lake.

3.1. LULC Classification in HID

We performed LULC classification for HID using time-series MODIS data from 2018 to 2023. To distinguish different land cover types, we derived multi-temporal surface reflectance and vegetation indices including NDVI and EVI. Preprocessing steps included cloud masking, atmospheric correction, and temporal smoothing to minimize noise interference. We then applied a supervised Random Forest classifier trained on samples collected from high-resolution remote sensing imagery to generate annual land cover maps. The study area was classified into five categories: cultivated land, water bodies, impervious surfaces, wasteland, and natural vegetation. The high temporal frequency of MODIS data was essential for discriminating land cover classes with similar phenological characteristics.
This study adopted a hybrid approach for crop mapping. The MODIS-based classification was used only to delineate the total cultivated land area. The specific composition of crops (sunflower, maize, spring wheat, and forage) within this area was determined using agricultural statistics from the Bayannur Bureau of Statistics. These statistical proportions were then allocated to the cultivated land pixels derived from MODIS, proportionally distributed according to their administrative units (township/county). This two-step approach avoids the need for fine-resolution crop-type mapping and leverages the strengths of each data source. MODIS provides spatially explicit cultivated land boundaries at the basin scale, while statistical data provide accurate crop composition information at the district level.
Accuracy assessment was performed for the 2018 and 2023 LULC classifications. For each year, 100 stratified random validation points (20 per class) were generated and independently assigned to land cover types by visual interpretation of Google Earth high-resolution historical imagery at sub-meter to ~1 m ground sampling distance, following predefined interpretation criteria including tone, texture, shape, context, and surrounding land use. Table 1 showed the confusion matrix constructed for 2023, and the overall accuracy, producer’s accuracy (PA), user’s accuracy (UA), and Kappa coefficient were calculated. The overall accuracy reached 81%, with a Kappa coefficient of 0.76. PA ranged from 70% (natural vegetation) to 90% (cropland), while UA ranged from 73.7% (natural vegetation) to 89.5% (water bodies). The 2018 classification yielded similar results, with an overall accuracy of 82% and a Kappa of 0.775 (Table 2). The lower accuracy for natural vegetation is attributable to spectral similarity among grassland, sparse shrub, and fallow cropland, which is a known challenge in the arid region classifications. Overall, the accuracy metrics confirm that the LULC classification is sufficiently reliable for subsequent analyses. The lower PA for natural vegetation (70%) is attributed to spectral similarity among grassland, sparse shrub, and fallow cropland, which is a known challenge in arid-region classifications. In contrast, cropland achieved the highest PA (90%), although its slightly lower UA (85.7%) suggests minor commission errors from fallow or saline–alkali patches adjacent to active fields.
Furthermore, the accuracy assessment of our LULC classification demonstrates that the classification results are reliable for basin-scale analysis, despite the moderate spatial resolution of MODIS images. The mixed pixel effect is mitigated by the fact that our study focuses on broad land cover categories (e.g., cultivated land, water bodies) rather than fine-scale features, and the temporal smoothing of MODIS time-series further reduces noise.

3.2. Estimation of Pollution Load Entering the Lake

3.2.1. Calculation Procedure and Coefficient Selection

The agricultural non-point source pollution load entering Wuliangsu Lake from HID was quantified using the export coefficient method [34,35,36], which is widely applied for estimating pollutant loads from agricultural land in arid irrigation districts [37]. This method links crop-specific pollutant export coefficients with cultivated area, fertilizer application rate, and irrigation return flow characteristics to calculate TN, TP and COD loads delivered to the lake.
The total pollution load L (t/a) of a single pollutant (TN, TP and COD, respectively) entering the lake was computed as:
L = i = 1 n ( A i × E i × η i ) × γ
where i is crop type; Ai is cultivated area of crop i (km2), derived from agricultural statistical data and remote sensing interpretation; Ei is pollutant export coefficient of crop i (t·km−2·a−1); η i is fertilizer application correction coefficient of crop i, reflecting the impact of actual fertilization level on pollutant loss; and γ is irrigation return flow pollutant delivery coefficient, representing the ratio of pollutants entering the lake via drainage ditches to total farmland pollutant generation.
To improve the accuracy of the estimation of pollution load, annual precipitation correction was introduced to adjust inter-annual variation in pollution load Lcorrected (t/a):
L corrected = L × ɑ
ɑ = P / P avg
where ɑ is precipitation correction coefficient; P is annual precipitation of the study year (mm); and Pavg is multi-year average precipitation (153.1 mm).
Crop-specific pollutant generation coefficients for TN, TP, and COD were adopted to reflect the distinct fertilizer demand and nutrient loss characteristics of the main crop types in HID. The coefficients for maize and spring wheat were obtained directly from the First National Pollution Source Census [38], with values of (14.5, 0.95, 45) and (11.5, 0.75, 38) kg·ha−1·yr−1 for TN, TP, and COD, respectively. For sunflower, which is not listed in the national census, the coefficients were derived by scaling the maize coefficients according to the local sunflower-to-maize fertilizer application ratio (approximately 1.28× for nitrogen and 1.74× for phosphorus, based on the Bayannur Agricultural Statistical Report), yielding (18.5, 1.65, 55) kg·ha−1·yr−1. For other crops, which in the HID context mainly comprise vegetables and conventionally managed forage, the coefficients were assigned as (13, 0.85, 42) kg·ha−1·yr−1, representing the weighted average of the maize and wheat coefficients according to their respective planting proportions. For ecological forage (e.g., alfalfa) planted on reclaimed saline–alkali wasteland, which is managed with conservative fertilization due to salt stress, the coefficients were assigned the same values as for spring wheat (11.5, 0.75, 38 kg·ha−1·yr−1). If more detailed field trial data become available, these coefficients should be refined accordingly.
These coefficients, though adopted from national census and the published literature without independent field calibration in HID, are supported by compelling considerations. Notably, the census coefficients themselves were derived from extensive monitoring campaigns across multiple arid and semi-arid irrigation districts in northern China, where similar climate, soil, and cropping systems prevail. Furthermore, the fertilizer correction coefficient η i was tailored to each crop using local application records (Bayannur Agricultural Statistical Report), accounting for regional fertilization intensity: η = 1.15 for sunflower (receiving 15% more N than the national average), 1.00 for maize, and 0.92 for spring wheat. Additionally, the delivery coefficient γ was empirically refined using measured pollutant fluxes at the Wuliangsu Lake inlet (station S1, 2018–2019), resulting in γ = 0.35 for TN and 0.30 for TP and COD. These γ values align with reported ranges for arid irrigation districts featuring lined drainage canals (0.25–0.45). Importantly, this calibration process implicitly accounts for potential upstream export coefficient biases, as the EFDC model’s boundary conditions are anchored by monitored inlet loads.

3.2.2. Sensitivity Analysis of Pollution Load Estimation

To quantify the uncertainty of key parameters in the export coefficient method, a one-at-a-time sensitivity analysis was conducted. Three parameters were selected as the most influential: the TN export coefficient of sunflower (ETN,sunflower), the fertilizer correction coefficient of sunflower ( η sunflower ), and the delivery coefficient γ. Each parameter was varied by ±20% from its baseline value, and the resulting change in the total TN load entering Wuliangsu Lake in 2023 (baseline: 1581 t/yr) was calculated. The sensitivity index (SI) was defined as the percentage change in total load divided by the percentage change in the parameter.
The results (Table 3) show that γ exhibited the highest sensitivity (SI = 0.66), meaning a 20% change in γ leads to a 13.2% change in the total TN load, underscoring the importance of calibrating γ against local monitoring data. The sunflower export coefficient showed moderate sensitivity (S = 0.185), while the fertilizer correction coefficient showed relatively low sensitivity (SI = 0.105). These results indicate that the deterministic load estimates are robust within approximately ±4% for crop-specific parameters and ±13% for γ. The same sensitivity ranking (γ > export coefficient > fertilizer correction coefficient) was also observed for TP and COD loads, as the delivery coefficient is shared across all three pollutants. This analysis strengthens the credibility of the pollution load estimates used as input to the EFDC model, despite the reliance on the literature-based export coefficients.

3.3. EFDC-Based Lake Water Quality Modeling

The Environmental Fluid Dynamics Code (EFDC) is a widely used three-dimensional model for simulating hydrodynamic processes and water quality in surface waters [39]. It has been applied to over 100 water bodies throughout the United States and Europe [40]. It is a widely used tool for environmental assessments and policy development [41]. The model is capable of one-, two- and-three-dimensional simulations of diverse aquatic environments, such as rivers, lakes, reservoirs, wetlands, estuaries, and coastal regions. Its integrated framework incorporates hydrodynamics (including water quantity exchanges such as inflow, outflow, and evaporation), water quality, sediment transport, hazardous contaminant fate, wind wave effects, and sediment diagenesis. To represent complex geometries, EFDC uses boundary-fitted curvilinear coordinates horizontally and a sigma-coordinate transformation vertically. Turbulence closure is achieved through the Mellor-Yamada 2.5-order scheme, allowing the model to adapt effectively to irregular bathymetry and shorelines [42].

3.3.1. Model Setup and Boundary Conditions

Wuliangsu Lake was designated as the computational domain. Based on remote sensing images from June 2018, the domain was discretized into a 500 m × 500 m grid using Cartesian coordinates to accommodate the lake’s irregular boundaries. The grid system consisted of 47 × 78 cells, with 3666 active computational grids. Key model inputs included inflow discharge (primarily from the main drainage channel), inflow pollution loads (e.g., TN, TP and COD), meteorological data (atmospheric pressure, temperature, relative humidity, precipitation, evaporation, solar radiation, wind speed, wind direction), initial water temperature, and initial concentrations of water quality state variables.

3.3.2. Sensitivity Analysis and Model Calibration and Validation

A standardized, stepwise approach guided the selection of EFDC parameters [43]. Initial feasible ranges for each parameter were established by integrating three authoritative sources: the official EFDC technical manual, peer-reviewed studies on shallow arid irrigation lakes ecologically similar to Wuliangsu Lake, and long-term in situ monitoring data specific to the study site. Subsequent sensitivity analysis stratified parameters into three tiers based on their influence on model outputs: high-sensitivity parameters (e.g., algae growth rate, algae settling rate, light intensity, COD degradation rate, and reaeration coefficient) were prioritized for calibration using observational data; medium-sensitivity parameters were refined to balance accuracy and computational efficiency; and low-sensitivity parameters were held constant at the literature-derived baseline values to mitigate overfitting risks. All final calibrated values fell within biophysically reasonable reference intervals validated through domain knowledge. A comprehensive compilation of these values (initial ranges, calibrated estimates, and site-specific contextualization) is provided in Supplementary Table S1.
Model calibration was performed using observed data from May to October 2019–2021, including inflow discharge, meteorological forcing (wind speed, temperature, evaporation), and TN/TP/COD concentrations at six monitoring stations. The calibration followed a sequential order: hydrodynamic parameters (bottom roughness, eddy viscosity) were first adjusted to produce realistic flow structures consistent with the lake’s hydraulic characteristics, after which water quality parameters (e.g., phytoplankton settling rate, COD decay rate) were calibrated for COD, TN, and TP while accounting for interdependent biogeochemical cycles.
Parameter adjustments were guided by the sensitivity analysis results, with highly sensitive parameters tuned within the literature-reported ranges and less sensitive parameters kept at default values. The calibration target was a coefficient of determination R2 > 0.7 and a mean relative error MRE < 40% for all three indicators at all monitoring stations. Model validation was carried out using independent data from June to October 2022, assessing temporal and spatial variations in TN, TP, and COD. The calibration and validation results confirmed the robustness of the EFDC model, supporting its application in subsequent scenario simulations and water quality assessments for Wuliangsu Lake.

3.3.3. Scenario Design and Simulation

Two land use optimization scenarios were designed to evaluate the impact of land reclamation and cropping structure adjustment on lake water quality. The 2023 baseline scenario represents the current land use and planting configuration of HID.
Baseline Scenario: The genuine cropping structure of HID in 2023 (no adjustment of crop cultivated area). Sunflower (high-fertilizer crop) and maize dominate the cultivated land, while the cultivated areas of low-fertilizer crops (spring wheat) and ecological forage remain at the current level.
Scenario 1 (Moderate Adjustment): In total, 25% of the active sunflower cultivated area (the independent high-fertilizer crop in HID) is converted to low-fertilizer spring wheat, and 15% of saline–alkali wasteland is reclaimed to plant ecological forage (such as alfalfa). The cultivated area of maize and different food crops remains unchanged to ensure territorial food security.
Scenario 2 (Intensive Adjustment): On the basis of the baseline scenario, a substantial range of cropping structure optimization and ecologic land adjustment is implemented. A total of 35% of the active sunflower area is converted to spring wheat, and 25% of saline–alkali wasteland is reclaimed for ecologic forage planting. The maize area remains unchanged to balance food security and ecologic protection. The scenario design follows the territorial rural and environmental management objectives, and controls the reclamation ratio of wasteland (mainly gently salinized or abandoned farmland with low ecologic value) within 25–35% to avoid encroaching on sensitive ecosystems. It represents a realistic and policy-feasible way to improve land use efficiency without damaging the overall ecological stability.
Spring wheat is selected for converted areas because of its low fertilizer demand and high nutrient utilization efficiency, which can minimize the incremental load of TN, TP and COD, and directly reduce the input of non-point source pollution to the lake. This scheme not only helps to improve water quality, but also expands agricultural output. In addition, the design conforms to the regional policy orientation of water-saving agriculture and cropping structure adjustment. Spring wheat has strong drought resistance, which can reduce irrigation water demand compared with dominant crops such as sunflower, relieve water resource pressure and reduce agricultural drainage.
The newly increased cultivated area from wasteland reclamation was spatially allocated using ArcGIS (Version 10.6), based on the distribution of existing saline–alkali wasteland and the distance from irrigation canals. The corresponding incremental pollution load from spring wheat planting was calculated using crop-specific load coefficient (derived from 2023 baseline data), and input into the EFDC model as time-series boundary conditions in the WQPSL.INP file. All other model parameters (hydrodynamics, sediment release, calibrated water quality coefficient) remain unchanged to isolate the impact of land use change on lake water quality dynamics.
The changes in TN, TP and COD concentrations were compared and analyzed to evaluate the effect of cropping structure optimization on water quality improvement. In the simulation process, the impact of ecological water replenishment on lake water quality was also considered to make the simulation results more consistent with the actual situation.

4. Results and Discussion

4.1. Analysis of the Variation in LULC in HID

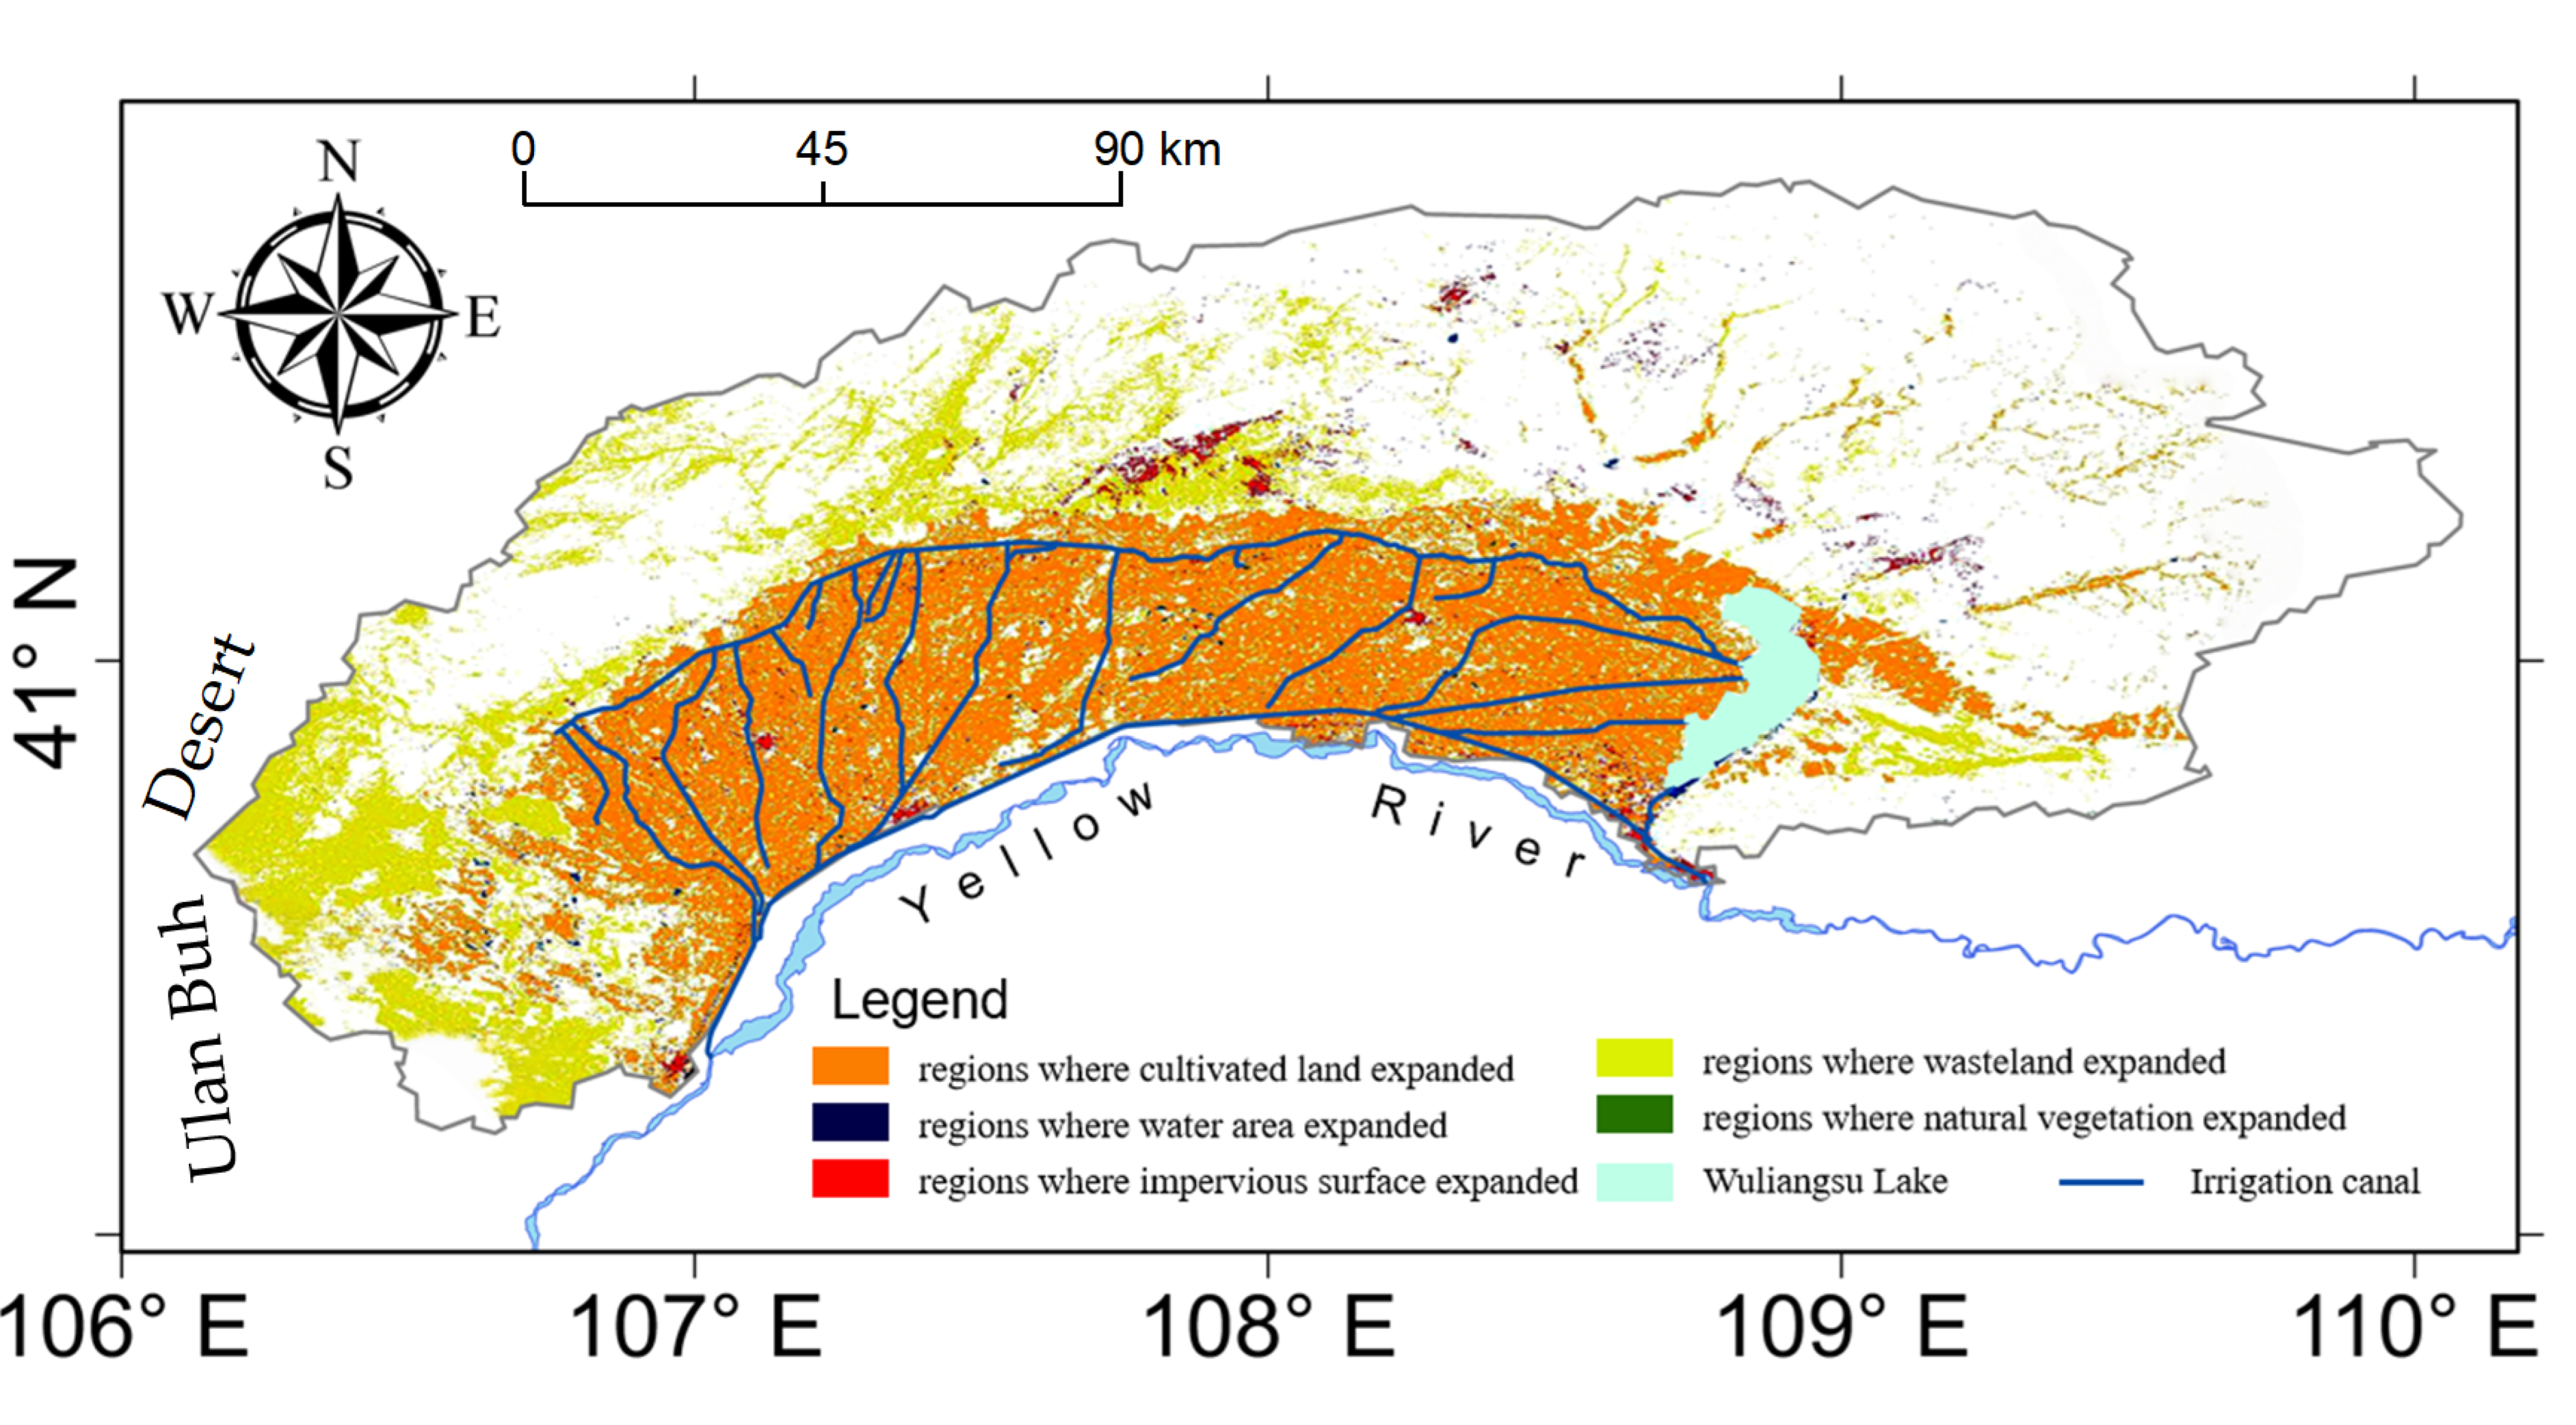
From 2018 to 2023, the LULC of HID underwent notable transformations, driven by the interplay of agricultural intensification, ecological governance, and urbanization (Table 4 and Figure 4). Cultivated land expanded, wasteland decreased, and forestland increased, while grassland showed a declining trend, collectively reflecting the region’s efforts to balance food security, ecological restoration, and economic development under the overarching constraint of water resource availability.

4.1.1. Agricultural Intensification and Cultivated Land Expansion

Agricultural intensification, driven by national and regional food security strategies and high-standard farmland projects, was the dominant force reshaping the landscape of HID from 2018 to 2023. Cultivated land expanded by 2.6%, concentrated along the Yellow River and irrigation canals, primarily converting saline–alkali wasteland and low-yield fields. Accordingly, wasteland decreased by 23.8%, with conversion to cropland outpacing new wasteland formation from salinization or desertification. This net reduction was facilitated by improved irrigation and drainage systems and mature reclamation technologies. The spatial structure of cropland growth was governed by water access, with infrastructure constraints preventing inland spread, underscoring the overriding role of water resource availability in shaping land use trajectories in this arid region.

4.1.2. Ecological Governance and Vegetation Restoration

Ecological governance measures, including afforestation, wetland conservation, and ecological water replenishment, reshaped regional ecosystems. Forestland expanded by 13.5% through windbreak and sand-fixation programs. Water area around Wuliangsu Lake also increased by 5.1%. However, these ecological gains coincided with a 5.2% decline in native grasslands. Conservation efforts only partially mitigated this loss. This contrast highlights a critical balance in arid environments: while large-scale afforestation effectively stabilizes sand, it can exacerbate competition for limited water resources with natural grasslands. Under persistent water scarcity and human disturbances, grassland degradation risks accelerating. Therefore, future ecological restoration should prioritize water availability over widespread afforestation. Interventions must align with local hydrological constraints to safeguard grassland resilience.

4.1.3. Urbanization Pressure and Impervious Surface Growth

Though limited in absolute extent, urbanization gradually but continuously encroached on agricultural and ecological land. Impervious surface area grew by 25.3%, yet remained less than 0.1% of the total HID area. This expansion was largely confined to urban cores (e.g., Bayannur’s Linhe District), major transportation corridors, and clustered ancillary facilities at canal headworks. The trend signals emerging urbanization pressure that, if unchecked, may increasingly compete with agricultural and ecological land uses, posing a challenge to balancing economic growth with food and ecological security.
In summary, the LULC changes in HID from 2018 to 2023 reflect the interplay of agricultural intensification, ecological governance, and urbanization, all operating under the overarching constraint of water resource availability. These findings imply that future land use trajectories in such arid irrigation districts will be critically determined by the implementation and effectiveness of water resource management policies.

4.2. Variation in Cropping Structure from 2018 to 2023

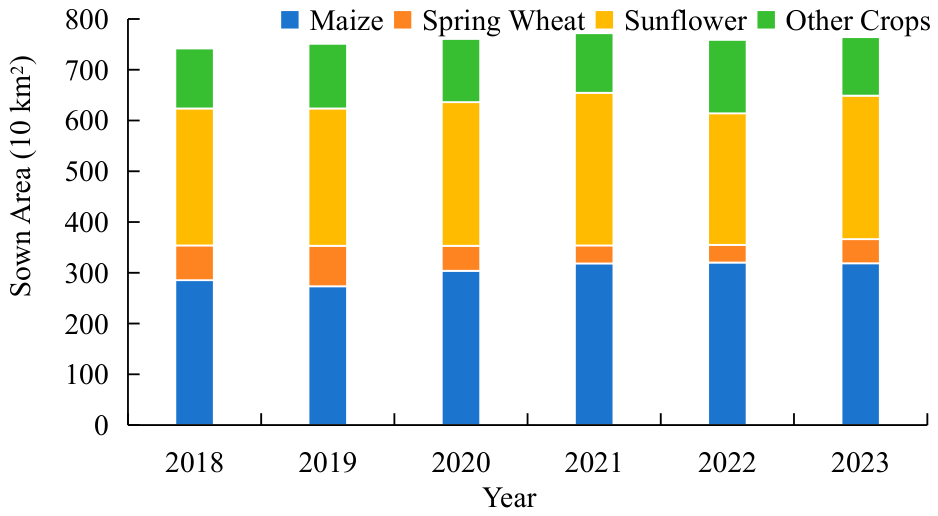
The cropping structure of HID underwent notable adjustments between 2018 and 2023 (Figure 5). The total sown area remained relatively stable, with a modest overall increase of approximately 4.1% over the six-year period. Among individual crops, maize maintained its dominant position and showed a consistent upward trend. Sunflower, the second-largest crop, experienced mild fluctuations but exhibited a slight net increase. In contrast, wheat underwent a pronounced decline followed by a partial recovery in 2023, reflecting high sensitivity to economic returns and policy adjustments. Other crops, dominated by forage, remained relatively stable with a minor decrease. In aggregate, these shifts were driven by market demand, national food security policies, regional agricultural planning, and relative planting profitability, resulting in a gradually optimizing yet stable cropping structure.

4.3. Estimation of Non-Point Source Pollution Load Entering Wuliangsu Lake

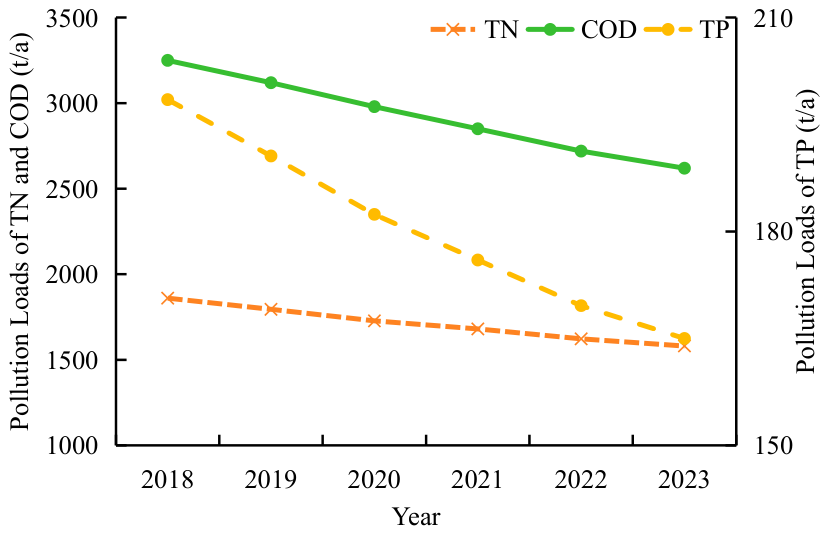
To quantitatively characterize the temporal dynamics of non-point source pollution inputs into Wuliangsu Lake and their response to human management interventions, the inter-annual variations in key pollutant loads (TN, TP, COD) from 2018 to 2023 are presented in Figure 6. Non-point source pollution loads consist of agricultural-sourced (including cropping and animal husbandry) and industrial-sourced components, among which agricultural-sourced pollution accounts for the majority proportion [44,45].
Intensive livestock breeding, distinguished by centralized production modes, acts as the principal contributor to nutrient transport fluxes across the system among all agricultural pollution sources. Animal husbandry in this region is predominantly characterized by intensive, large-scale operations. According to the Bayannur Statistical Yearbook of 2023, the year-end livestock inventory reached approximately 7.88 million heads, with sheep (7.20 million) and cattle (0.35 million) accounting for over 90% of the total. However, the majority of these animals are raised in concentrated animal feeding operations equipped with manure collection, solid–liquid separation, and biogas treatment facilities. Treated effluent is reused for irrigation or discharged under regulated standards, significantly reducing the direct release of untreated manure into surface water bodies. Nevertheless, residual nutrient losses may still occur through leakage, incomplete treatment, and runoff from land application of treated effluent. As a result, although the per-head nutrient discharge from livestock is expected to be lower than that from cropland fertilizer application under current practices, a site-specific quantification of livestock-derived loading is lacking in this study, and this component warrants future investigation to avoid underestimating the combined agricultural source.

4.3.1. Temporal Variation Characteristics of Pollutant Loads

Figure 6 shows a steady downward trend for all three pollutants from 2018 to 2023. The TN load entering the lake decreased smoothly from 1860 t/a in 2018 to 1581 t/a in 2023, representing a cumulative reduction of 279 t and an average annual reduction rate of approximately 3.2%. The TP load exhibited a slightly steeper decline compared with TN and COD, with a cumulative reduction of 33.5 t and an average annual reduction rate of 3.6%. The COD load decreased from 3250 t/a in 2018 to 2620 t/a in 2023, yielding a cumulative reduction of 630 t and an average annual reduction rate of 4.2%.
Notably, the COD load decreased more significantly during 2021–2022, which corresponds to the strict control of irrigation return water discharge in this period. In addition, the reduction rates of TP and COD were slightly higher than that of TN. This phenomenon can be attributed to the stronger retention and degradation capacity of phosphorus and organic matter in irrigation return water and riparian zones, coupled with targeted control measures for high-phosphorus and high-organic-matter agricultural activities in HID.

4.3.2. Key Driving Factors of the Pollution Load Variations

The consistent downward trend of TN, TP, and COD from 2018 to 2023 reflects the positive effects of continuous optimization of agricultural management and ecological governance in HID. This decline can be attributed to a combination of source reduction, process interception, and water-saving measures implemented over the past seven years.
At the source level, HID implemented a sustained fertilizer reduction strategy since 2017. The total pure application of chemical fertilizers decreased continuously from 27.91 × 10⁴ tons in 2017 to 23.91 × 10⁴ tons in 2023, a cumulative reduction of 14.3% (Table S2 in Supplementary Materials). This decline was driven by specific agronomic measures, including the progressive replacement of conventional broadcast fertilization with soil testing and formulated fertilization (2018–2019), large-scale adoption of water-fertilizer integration technology combining drip irrigation with fertigation, and the promotion of mechanical side-deep fertilization and organic fertilizer substitution. Since phosphate fertilizers are a major component of the total applied nutrients, the consistent reduction in fertilizer input directly reduced the amount of phosphorus available for runoff and drainage loss.
In terms of process interception, HID deployed multiple measures to further cut nutrient loads entering Wuliangsu Lake. Constructed wetlands and ecological ditches have been established along major drainage canals, where solar-powered aeration and emergent macrophytes intercept and assimilate nutrients before drainage water reaches the lake. Riparian vegetation buffer zones have been created along key waterways, where Phragmites australis, Suaeda glauca, and tamarix buffers have been shown to remove a substantial portion of TP from runoff and seepage water.
On the water-saving front, irrigation-side practices (including the coordinated autumn irrigation and spring replenishment scheme, widespread adoption of water-fertilizer integration, and strict volumetric quota management) indirectly reduced drainage-borne loads by decreasing the total volume of farmland drainage generated.
These combined measures synergistically contributed to the decline in nutrient loads, demonstrating the effectiveness of a comprehensive set of agricultural and environmental management interventions implemented across HID.

4.3.3. Ecological and Management Implications

The consistent decline in TN, TP, and COD loads from 2018 to 2023 demonstrates that the pollution control measures implemented in HID have been effective. Over the six-year period, TN, TP, and COD loads decreased by 15%, 16.9%, and 19.4%, respectively, alleviating eutrophication pressure on Wuliangsu Lake. The differential reduction rates suggest that future efforts should prioritize TN reduction through more precise fertilization management and crop rotation optimization, while maintaining existing control measures for TP and COD.

4.4. Water Quality Response Under Different LULC and Cropping Structure Scenarios

4.4.1. EFDC Model Performance Evaluation

The calibration and verification results of the EFDC model show that the model corresponds well to the measured data (Table 5). During the calibration period (2019–2021), the R2 of TN, TP and COD were 0.72, 0.73 and 0.71, respectively, and the MRE were 25.2%, 31.7% and 29.5%, respectively. In the validation period (2022), the R2 of TN, TP and COD were 0.69, 0.68 and 0.70, respectively, and the MRE were 28.1%, 37.3% and 32.3%, respectively.
All the evaluation indicators meet the model applicability requirements, indicating that the constructed EFDC model can accurately simulate the water quality changes in Wuliangsu Lake, and can be used for water quality simulation under different cropping structure scenarios. The model simulation results are consistent with the long-term variation trend of Wuliangsu Lake water quality, showing that the model can effectively reflect the impact of cropping structure changes on lake water quality.
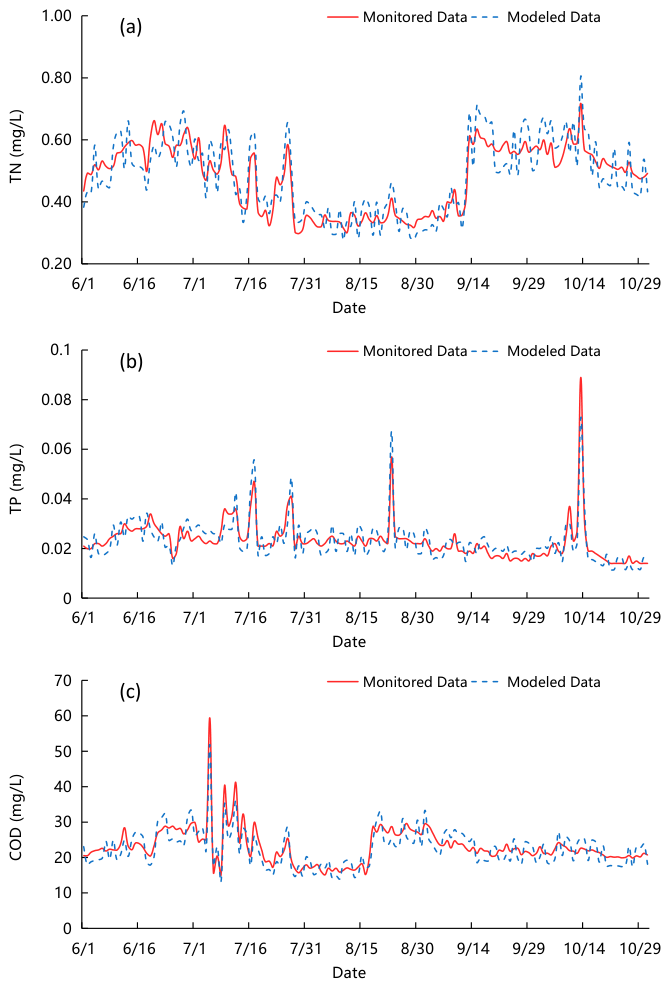
To further illustrate the model’s capability in capturing seasonal variations and short-term fluctuations, the central lake station (S5) was selected as a representative site. Figure 7 shows the comparison between daily monitored and simulated concentrations during the validation period (June–October 2022).
As shown in Figure 7, the simulated values generally capture the temporal trends of the monitored data. For TN, the model reproduces well the seasonal pattern of relatively high concentrations in early summer and autumn and low concentrations in mid-summer, and effectively captures the concentration fluctuations driven by intermittent irrigation return flow inputs. For TP, the simulation reflects the characteristics of low baseline concentration accompanied by short-term pulse peaks, with peak occurrence times highly consistent with monitored records. For COD, the model replicates the prominent summer concentration peak induced by algal growth and organic matter decomposition, as well as the gradual stabilization trend in autumn. Individual extreme monitored values (e.g., the abrupt COD peak in early July) are slightly smoothed in the simulation, which is mainly attributed to the model’s averaging effect on short-term random disturbances such as wind-driven sudden sediment resuspension.
Overall, the combination of quantitative statistical metrics and graphical time-series comparison confirms that the EFDC model is robust and suitable for subsequent scenario simulations of cropping structure adjustment.

4.4.2. Analysis of Inflow Pollution Loads Under Different Scenarios

Table 6 presents the estimated inflow loads of TN, TP, and COD under the baseline and two optimized cropping structure scenarios. Compared with the baseline, Scenario 1 (25% of sunflower area converted to spring wheat, 15% of wasteland reclaimed for ecological forage) reduced TN, TP, and COD loads by 6.8%, 8%, and 7.4%, respectively. Scenario 2 (35% of sunflower area converted, 25% of wasteland reclaimed) achieved greater reductions of 10%, 11.7%, and 10.9%, respectively. Across both scenarios, TP exhibited the highest reduction rate, followed by COD and TN, indicating that phosphorus load is more sensitive to the conversion of high-fertilizer crops and the nutrient uptake capacity of ecological forage. The progressive increase in reduction rates from Scenario 1 to Scenario 2 confirms that a larger scope of cropping structure adjustment yields a more pronounced mitigation effect on non-point source pollution.

4.4.3. Water Quality Response Under Different Cropping Structure Scenarios

(1)
Spatial Heterogeneity of Baseline Water Quality
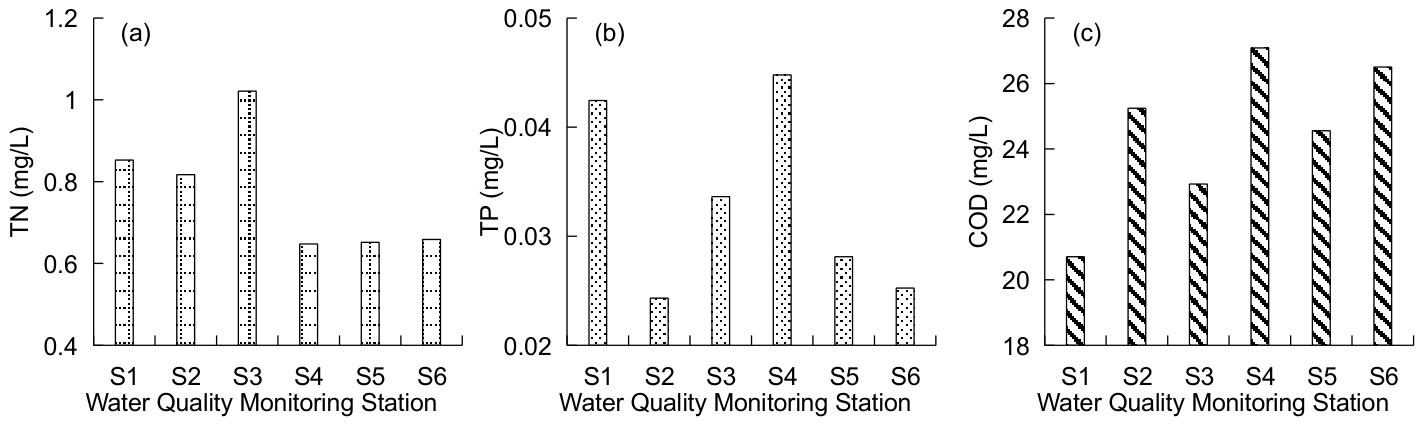
To establish the spatial baseline for evaluating the effects of cropping structure optimization, the mean concentrations of TN, TP, and COD at each monitoring station (S1–S6) from April to October under the baseline scenario were analyzed (Figure 8). The results reveal complex spatial patterns that reflect the interplay of external loading, phytoremediation, and internal nutrient cycling.
Spatially, both TN and TP exhibit a general decreasing gradient from the lake inlet to the outlet under baseline conditions, but with notable deviations at intermediate stations. As shown in the April–October average concentrations (Figure 8), the inlet station S1 receiving concentrated agricultural drainage, records the highest baseline TN concentration (peak 1.13 mg/L in October) and a TP peak of 0.05 mg/L in July. At S2, located within a dense reed belt, TP drops sharply to 0.024 mg/L (a 42.8% reduction), demonstrating efficient particulate phosphorus retention. However, this apparent purification comes at the cost of elevated organic loading, with COD surging from 20.7 mg/L at S1 to 25.2 mg/L at S2.
In S3 on the eastern shore, a pronounced rebound occurs. TN rises to 1.02 mg/L and TP to 0.03 mg/L, values that in the case of TP exceed even the inlet concentration. This rebound is likely attributed to wind-induced resuspension of nutrient-rich sediments at this unsheltered, unvegetated site, combined with the absence of direct macrophyte filtration. An anomalous TN spike of 1.74 mg/L was recorded at S3 in April, attributed to an episodic external input event; excluding this outlier, the baseline TN at S3 remains comparable to that at S2. Consistent with the resuspension-driven internal loop, S3 also records the highest baseline TP among all stations (0.06 mg/L in September), again exceeding S1 (0.05 mg/L in July). This confirms that the eastern shore acts as a hotspot of internal phosphorus recycling.
From S4 to S6, TN and TP resume their declining trend toward the outlet, while COD remains elevated (>25 mg/L) due to active decomposition of senescent algae and macrophytes in the low-flow outlet zone. S6 exhibits the lowest baseline TN (0.46–0.83 mg/L) and TP (below 0.025 mg/L) concentrations.
These fluctuating patterns carry important management implications. The reed belt at S2 effectively retains particulate phosphorus (42.8% reduction) but simultaneously increases organic matter loading, highlighting a trade-off that must be considered in wetland management. Meanwhile, the S3 rebound reveals the existence of internal nutrient loops driven by sediment resuspension. Effective restoration of Wuliangsu Lake therefore requires a dual strategy of reducing external nutrient inputs through cropping structure optimization while also addressing internal loading through measures such as artificial aeration, macrophyte harvesting, and sediment remediation, rather than relying solely on source control.
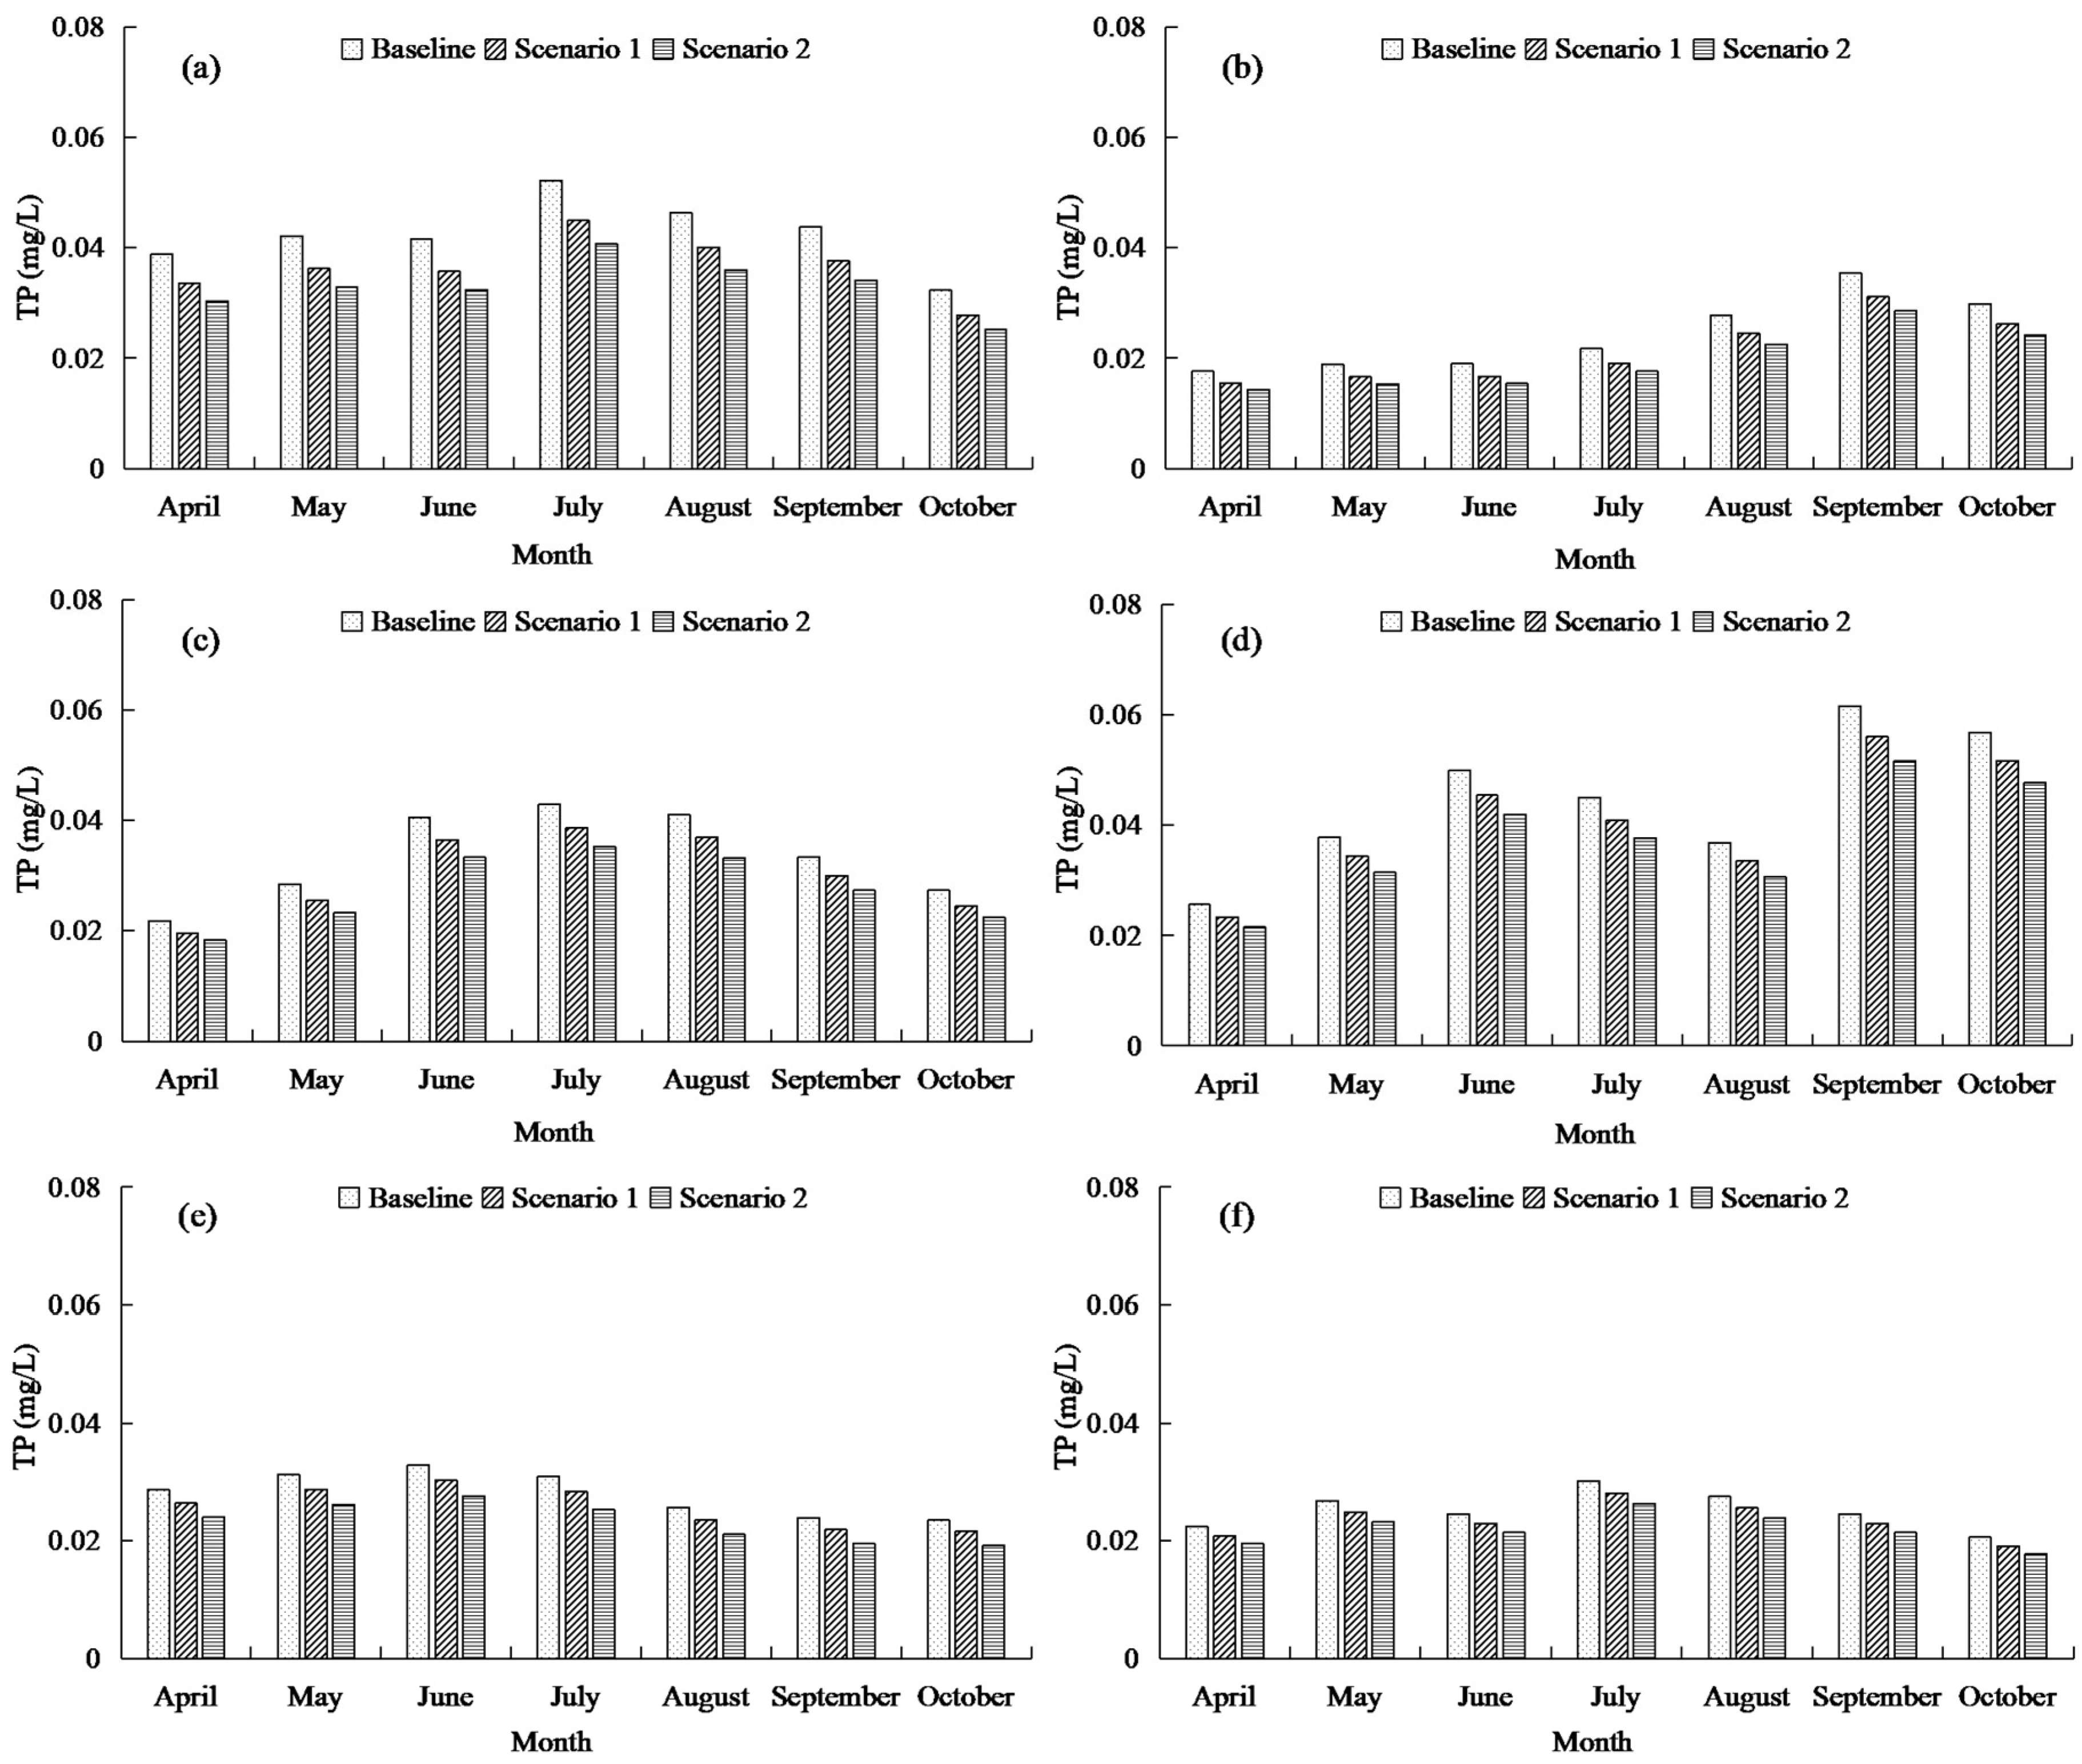
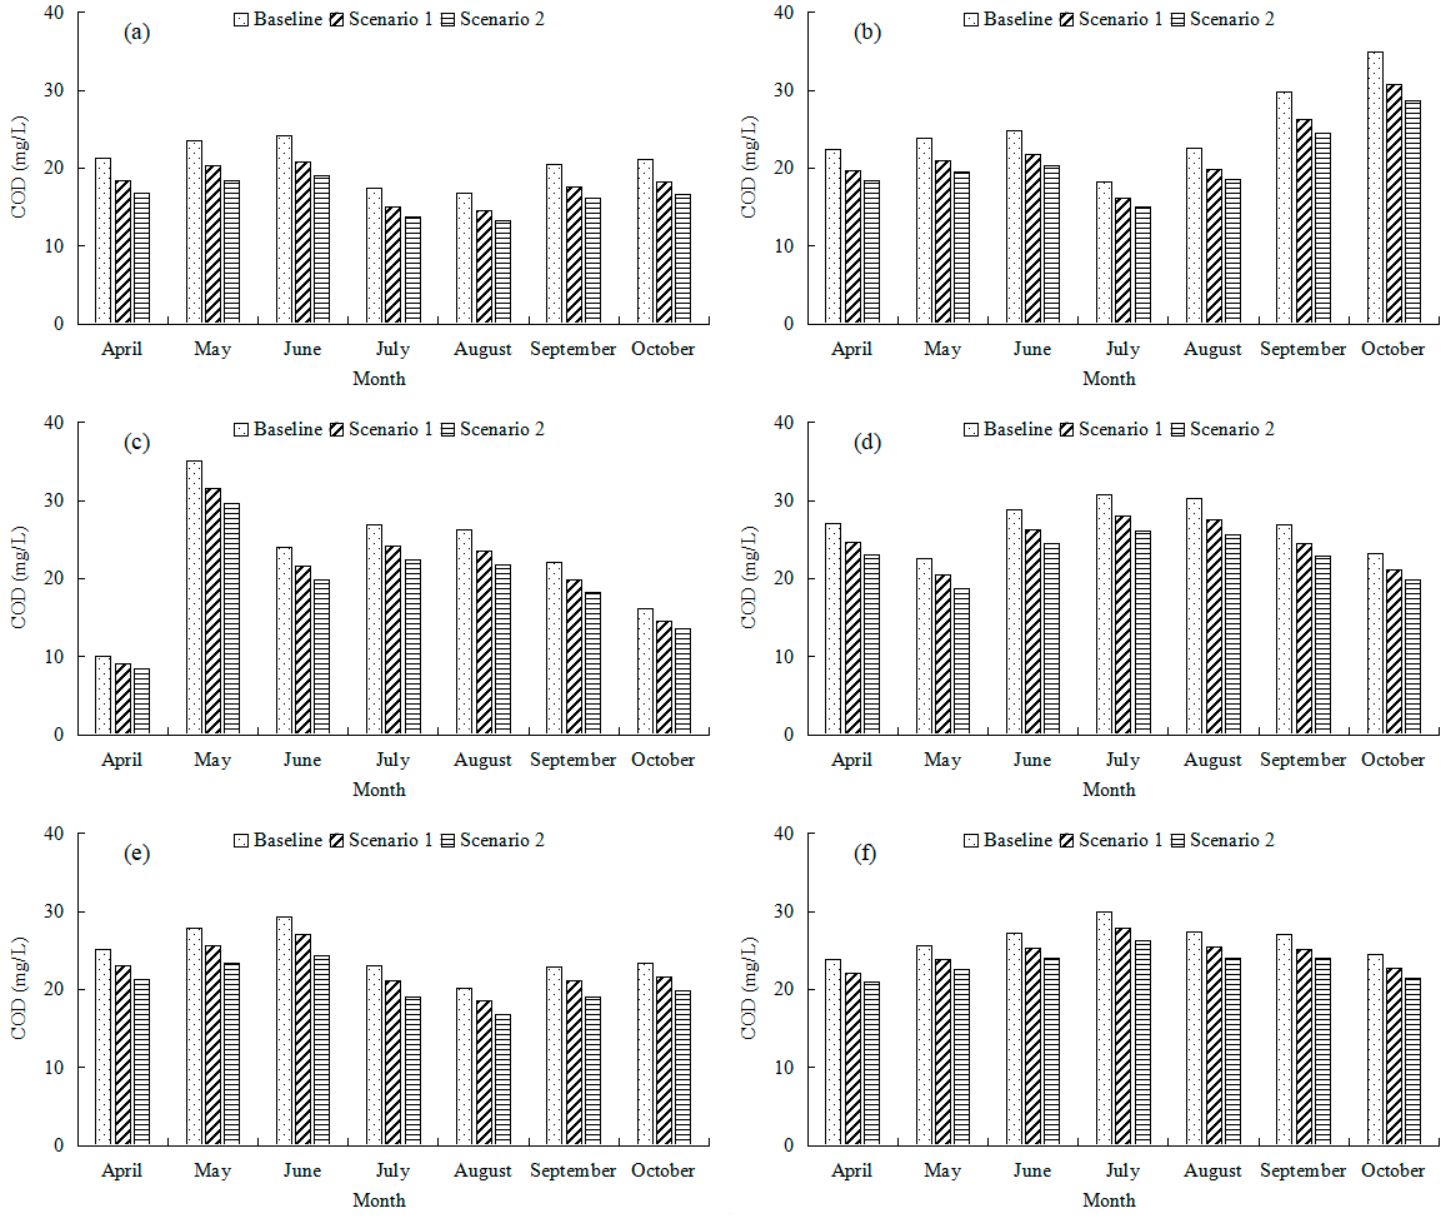
Based on this baseline understanding, the simulation results of the EFDC model under different cropping structure scenarios showed significant water quality improvements (Figure 8, Figure 9 and Figure 10). The following sections detail the temporal and spatial responses of TN, TP, and COD concentrations.
(2)
Temporal and Spatial Variation in TN Concentration
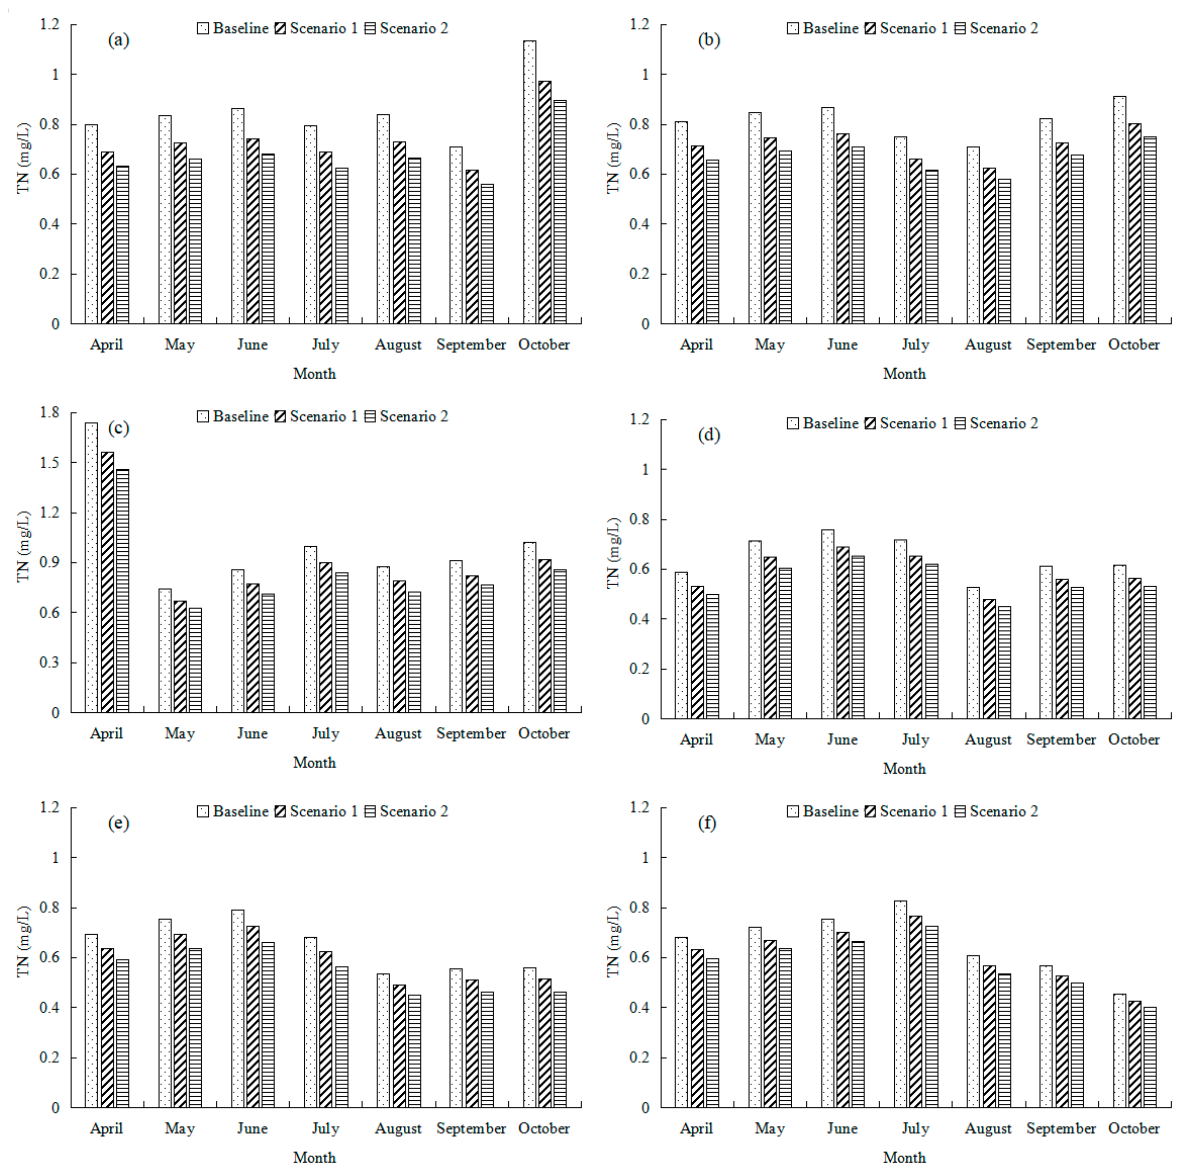
The spatio-temporal dynamics of TN concentrations at six monitoring stations (S1–S6) from April to October under the baseline, Scenario 1 (moderate adjustment), and Scenario 2 (intensive adjustment) are shown in Figure 9.
Temporally, TN concentration at most stations fluctuates moderately during the monitoring period. S1 shows an obvious increase in TN concentration in October (1.13 mg/L) compared with September (0.71 mg/L), which may be related to seasonal rural non-point source pollution input.
Compared with the baseline, both Scenario 1 and Scenario 2 consistently reduce TN concentration at all stations and months, with Scenario 2 achieving a more significant reduction. The TN concentration reduction rate at S1 ranges from 12.8% to 14.2% under Scenario 1 and from 20.6% to 21.1% under Scenario 2, while the reduction rate at S6 is relatively lower (6.8–7.4% for Scenario 1 and 11.8–12% for Scenario 2). This indicates that the effect of cropping structure optimization on TN reduction is more pronounced in areas with high pollutant input load, and the adjustment intensity is positively correlated with the reduction effect.
(3)
Temporal and Spatial Variation in TP Concentration
Compared with TN, TP concentration is more sensitive to cropping structure adjustment scenarios, with distinct spatial and temporal characteristics (Figure 10).
Temporally, TP concentration at S1 peaks in July (0.05 mg/L), which is related to the combined effect of summer rainfall runoff and sediment endogenous release. Both adjustment scenarios achieve substantial TP reduction: Scenario 1 reduces TP concentration by 8% to 14% across all stations and months, while Scenario 2 achieves a reduction rate of 16% to 22.2%.
Specifically, S1 has the highest TP reduction rate (22.2% in August under Scenario 2), and S5 also shows a significant TP reduction (18.1% in July under Scenario 2). This demonstrates that phosphorus is the most sensitive indicator to cropping structure optimization, because the reduction in agricultural phosphorus loss directly decreases TP concentration in the lake system. In addition, the monthly fluctuation of TP reduction rate is the smallest (≤1% variation at most stations), indicating that cropping structure adjustment has a stable effect on phosphorus control.
(4)
Temporal and Spatial Variation in COD Concentration
As an organic pollution indicator, COD concentration shows a relatively stable temporal and spatial variation pattern and moderate sensitivity to adjustment scenarios (Figure 11).
Spatially, the baseline COD concentration is highest at S2 (34.96 mg/L in October) and lowest at S3 (10.13 mg/L in April). Unlike TN and TP, COD does not show a strict inlet-to-outlet decreasing gradient, which is attributed to the complex sources of organic matter, including endogenous release from algae, decomposition of aquatic plants, and external inputs.
Temporally, COD concentration at most stations is higher from May to July (e.g., 35.11 mg/L at S3 in May) and relatively lower from August to October, consistent with the seasonal variation in algal biomass and organic matter input.
Scenario 1 reduces COD concentration by 7% to 14%, and Scenario 2 achieves a reduction rate of 11.2% to 21.8%. S1 has the highest COD reduction rate (21.8% in May under Scenario 2), while S6 has the lowest (11.2% in September under Scenario 2). The monthly variation in COD reduction rate is the smallest among the three indicators (fluctuating within ±1%), indicating that cropping structure optimization has a stable but relatively moderate effect on organic matter reduction. This is because COD is affected by multiple factors such as endogenous organic matter release and microbial decomposition, and external agricultural input accounts for only part of the total organic load.
(5)
Summary of Scenario Simulation Results
In summary, the simulation results of TN, TP, and COD concentrations at six monitoring stations of Wuliangsu Lake from April to October show that, compared with the baseline scenario, cropping structure adjustment (Scenario 1: moderate; Scenario 2: intensive) can effectively reduce water pollutant concentrations, with different indicators and spatial-temporal gradients exhibiting distinct response characteristics.
TP is the most sensitive to adjustment scenarios, with a maximum reduction rate of 22.2% under Scenario 2, followed by TN (maximum reduction of 21.1%), while COD shows a stable but moderate reduction effect (maximum reduction of 21.8%). Spatially, the pollution reduction effect of cropping structure optimization is more significant in high-load areas such as the lake inlet (represented by S1), while the lake outlet (represented by S6) has a relatively lower reduction rate due to the low baseline pollutant concentration and cumulative attenuation of pollutants along the flow path. Temporally, the reduction effect is stable across months, with slight fluctuations related to seasonal external pollution input (e.g., the increase in TN at S1 in October) and endogenous processes (e.g., the peak of TP at S1 in July).
These findings emphasize that targeted intensive cropping structure optimization should prioritize phosphorus control, especially in pollution source input areas such as the lake inlet, to maximize the water quality improvement effect. In addition, a comprehensive management strategy combining cropping structure adjustment and endogenous pollution control (e.g., reducing sediment phosphorus release) is recommended to address the multi-factor-driven variation in COD and further enhance the overall water quality improvement.
This conclusion not only quantifies the effect of cropping structure optimization on key water quality indicators, but also provides a technological basis for formulating differentiated and targeted pollution control measures for lake systems. It has reference significance for the sustainable management of lake aquatic ecosystems affected by rural non-point source pollution.
It is worth noting that the reduction in external nutrient loads will likely alter the source–sink role of the lake sediment over the long term. While our model used a calibrated constant sediment flux, a sustained decrease in external loading is expected to reduce the net release of phosphorus from sediments, creating a positive feedback loop for water quality improvement. Future studies with a fully coupled sediment diagenesis model could quantify this dynamic response.

4.4.4. Agronomic, Economic and Ecological Trade-Offs of Scenario Design

While the simulation results demonstrate that cropping structure optimization can effectively reduce pollutant concentrations in Wuliangsu Lake, it is important to recognize that the practical implementation of such adjustments involves substantial agronomic, economic, and ecological trade-offs that are not captured by the water quality model alone.
From an economic perspective, sunflower is a high-value cash crop in HID, generating net incomes approximately 1.5–2 times higher per hectare than spring wheat. However, the proposed “wheat expansion” does not imply a simple crop swap. In HID, spring wheat is typically harvested in mid-July, leaving an 80–100 day fallow window before frost, which is routinely exploited via post-wheat relay cropping, where farmers successively plant oat grass, sweet waxy corn, cabbage, broccoli, kale, or even transplanted sunflower on the same field, realizing a “two-harvest-per-year” system. Local data show that oat grass alone yields ~7500 kg dry matter per hectare (gross ~15,000 CNY/ha, net >9000 CNY/ha), and contracted sales to dairy farms and vegetable markets are common. Crucially, the Bayannur municipal government provides direct wheat planting subsidies (2250–8250 CNY/ha, scaled by contiguous area) plus post-wheat relay cropping subsidies (1050–6000 CNY/ha). Pilot villages report that wheat, followed by post-wheat oat grass and supplemented by subsidies, yields more than twice the net income of wheat-only farming, thereby offsetting the sunflower-to-wheat unit-value gap. The expansion of ecological forage further integrates with livestock production. Therefore, the Scenario 1–2 adjustments are not purely “from high-value to low-value” swaps, but structured rotations backed by subsidies and market contracts, making them socially implementable despite the nominal crop-value difference.
From an agronomic standpoint, spring wheat has a shorter growing season and lower irrigation water demand than sunflower, which is favorable for water conservation in this arid region. However, transitioning away from sunflower may disrupt established crop rotations, alter labor allocation patterns, and potentially increase pest and disease pressure if spring wheat is grown continuously without rotation. The assumption that maize area remains unchanged to ensure food security also simplifies the complexity of real-world decision-making, where crop prices, market demand, and government policies interact dynamically.
The reclamation of saline–alkali wasteland for forage production presents a more complex set of ecological trade-offs than initially apparent. On one hand, converting unproductive saline land to planted forage (e.g., alfalfa) can reduce the transport of wind-blown dust and surface runoff of salts and nutrients into drainage channels, thereby contributing to the reduction in non-point source pollution loads entering Wuliangsu Lake—a benefit that is captured by our scenario simulations. On the other hand, several ecological risks merit careful consideration.
Even “gentle saline–alkali or abandoned farmland with low ecological value” (as defined in Section 3.3.3) may harbor specialized halophytic plant communities (e.g., Suaeda glauca, Salicornia europaea, Leymus chinensis) that provide unique habitat for desert-adapted bird species, insects, and soil microbiota. Field studies in HID have shown that drip-irrigation-based reclamation of heavy saline–alkali soil leads to a rapid shift in understory vegetation from the halophytic annual herb S. glaucato to the perennial grass L. chinensis, with attendant changes in plant diversity and soil seed bank dynamics [46,47]. Conversion to a monoculture forage crop would eliminate these habitats and reduce local biodiversity, potentially disrupting ecological networks that have adapted to saline conditions over extended timescales.
A further complication arises from the hydrological alterations induced by irrigation on reclaimed saline soils. Increased infiltration raises the shallow groundwater table, which can mobilize salts stored in the deeper soil profile upward through capillary rise, leading to secondary salinization if drainage infrastructure is inadequate or poorly maintained [48]. This risk is particularly acute in HID, where the regional groundwater table is already shallow (1–3 m) and natural drainage is limited by flat topography (slope 1/5000–1/8000).
Compounding these ecological concerns, the additional irrigation demand for forage production on reclaimed land (estimated at ~300 mm per year for alfalfa establishment) competes with existing agricultural and ecological water uses in this water-scarce region. Although spring wheat conversion saves water (as discussed above), the net effect on regional water resources depends on the balance between these two opposing changes.
A more sustainable alternative may be to retain selected saline wetlands as ecological buffers while focusing cropping structure adjustment on existing cultivated land, thereby avoiding the ecological risks of land conversion altogether.
In sum, while the water quality benefits of cropping structure optimization are clearly supported by our modeling results, a balanced assessment requires that these benefits be weighed against potential adverse effects on farmer livelihoods, agricultural sustainability, and ecosystem integrity. Future research should integrate economic cost–benefit analysis, stakeholder preference surveys, and ecological risk assessments to identify socially acceptable and environmentally effective pathways for sustainable land management in the Hetao Irrigation District.

4.5. The Role of Sediment-Bound Pollution from Soil Erosion

It should be noted that this study focused exclusively on dissolved nutrient loads from agricultural non-point source pollution, without addressing the contribution of sediment-bound pollutants transported via soil erosion. In arid irrigation districts such as HID, wind and water erosion can mobilize substantial amounts of particulate matter from cultivated land, wasteland, and exposed surfaces into drainage channels and ultimately into Wuliangsu Lake. This eroded material serves as a significant carrier of adsorbed nutrients (particularly phosphorus) as well as organic matter and heavy metals [49]. Previous studies in the Hetao region have reported that sediment-associated phosphorus can account for a considerable proportion of the total phosphorus load entering downstream water bodies [50]. Therefore, the actual pollution load entering Wuliangsu Lake may be underestimated in our current analysis, and the effectiveness of cropping structure optimization alone in mitigating total pollutant loading may be overstated if sediment-bound transport is not concurrently addressed. Future studies should integrate soil erosion modeling (e.g., RUSLE) with water quality modeling to provide a more comprehensive assessment of pollution sources and transport pathways. Additionally, erosion control measures such as conservation tillage, contour farming, and riparian buffer strips should be considered as complementary strategies to cropping structure adjustment for holistic water quality management in HID.

4.6. Mechanistic Insights and Global Context

4.6.1. Nutrient Transport Pathways in Arid Irrigation Systems

The pollutant loads entering Wuliangsu Lake originate primarily from agricultural return flows, but the transport pathways differ markedly among TN, TP, and COD. Nitrate (the dominant form of TN in HID drainage water) is highly mobile in soil solution and is transported predominantly via subsurface drainage and groundwater seepage [51]. This pathway explains why TN reduction from cropping adjustment is relatively modest (10% under Scenario 2), even when fertilizer application is reduced, because legacy nitrogen stored in the vadose zone continues to leach for multiple seasons [52]. In contrast, TP is primarily transported in particulate form attached to eroded soil particles [53]. Because particulate P transport is directly linked to surface runoff and irrigation-induced erosion, reducing high-fertilizer crops such as sunflower immediately decreases the P source available for erosion, leading to the higher TP reduction rates observed (11.7% under Scenario 2) [54]. COD occupies an intermediate position, as it includes both soluble organic compounds from fertilizer and manure and particulate organic carbon from crop residues and soil organic matter.

4.6.2. Phosphorus Retention and Internal Loading in Shallow Lakes

The greater sensitivity of TP to cropping adjustments also reflects the unique phosphorus dynamics of shallow polymictic lakes like Wuliangsu Lake. In such systems, phosphorus retention is controlled by a dynamic equilibrium between sedimentation and sediment release [55]. The lake’s shallow depth (mean 0.8–1 m) and frequent wind-induced resuspension (mean wind speed 3 m/s) promote continuous recycling of sediment-bound P back into the water column [56]. The TP peak in July at S1 is primarily driven by increased external loading from summer irrigation return flows and rainfall runoff, which transport phosphorus from fertilized croplands. Internal sediment resuspension may contribute to a lesser extent in this high-flow inlet zone. When external P inputs are reduced through cropping adjustment, the internal P pool acts as a buffer, delaying water quality improvement [57]. Nevertheless, our scenario results show that even moderate external load reduction (8–11.7%) produces measurable TP declines, suggesting that the lake is not yet saturated with P and that external load reduction remains an effective strategy. This contrasts with hyper-eutrophic shallow lakes such as Lake Taihu (China) and Lake Okeechobee (USA), where decades of accumulated sediment P render external load reduction ineffective without concurrent internal P management [58,59]. The difference likely arises because Wuliangsu Lake receives regular ecological water diversions from the Yellow River, which dilutes internal P concentrations and removes a portion of the sediment P pool through outflow.

4.6.3. Hydrodynamic Controls on Water Quality Gradients

The pronounced spatial gradient in water quality—with highest pollutant concentrations at the inlet (S1) and lowest at the outlet (S6)—is governed by the lake’s hydrodynamics. Wuliangsu Lake has an elongated morphology (35–40 km long, 5–10 km wide) with a single main inlet and outlet, creating a plug-flow-like transport regime. The theoretical residence time is approximately 60–90 days during the irrigation season (May–September), sufficient for significant in-lake processing of nutrients [60]. However, the lake’s shallowness promotes vertical mixing and prevents thermal stratification, maintaining oxic conditions at the sediment–water interface except in localized reed-bed areas (S3). This oxygenation suppresses anaerobic P release but enhances nitrification, converting ammonium to nitrate and sustaining elevated TN concentrations along the flow path. Similar hydrodynamic controls have been documented in other arid-zone terminal lakes, such as Pyramid Lake (Nevada, USA) and Lake Eyre (Australia), where salinity and nutrient gradients are strongly modulated by inflow geometry and evaporative concentration [61,62]. In HID context, the fact that water quality improvement under cropping scenarios is most pronounced at the inlet (S1) and diminishes toward the outlet (S6) reflects the dilution and processing capacity of the lake itself: external load reduction has the greatest impact where the signal-to-noise ratio is highest.

4.6.4. Comparisons with Irrigated Basins in Other Arid and Semi-Arid Regions

The challenges faced by HID and Wuliangsu Lake are emblematic of a global syndrome affecting irrigated agriculture in water-scarce regions. In California’s Central Valley, irrigated agriculture generates non-point source pollution that has degraded downstream water bodies such as the Sacramento–San Joaquin Delta, prompting regulatory programs that combine fertilizer management, cover cropping, and constructed wetlands [63]. Similar to our findings, TP has proven more amenable to source control than TN in the Central Valley, due to the dominance of particulate P transport. In the Indus Basin of Pakistan, intensive irrigation and fertilizer use have led to widespread salinization and nutrient enrichment in terminal lakes such as Manchhar Lake, where cropping structure optimization has been proposed but implementation lags due to socioeconomic constraints [64]. In the Murray–Darling Basin of Australia, irrigation return flows carry high nutrient loads into shallow lakes and wetlands, and management strategies have evolved from purely structural measures (e.g., drainage interception) to integrated approaches combining land-use change, environmental flows, and market-based instruments [65]. The Australian experience highlights the importance of economic incentives—such as water trading and nutrient offset schemes—for achieving the kind of cropping transitions modeled in our scenarios. In Central Asia, the desiccation of the Aral Sea represents the most extreme consequence of irrigation mismanagement, where unsustainable cotton monoculture led to complete ecosystem collapse [66]. Despite facing serious water quality challenges, HID has avoided this fate, owing to the dilution capacity of the Yellow River and sustained ecological restoration investments. Collectively, these international cases reinforce our conclusion that cropping structure optimization is a necessary but not sufficient measure for lake water quality recovery; it must be embedded within a broader portfolio of interventions, including controlled drainage, sediment management, and institutional reforms.

4.7. Study Limitations

Despite the encouraging performance of the EFDC model and the demonstrable water quality improvements projected under the two optimization scenarios, a number of constraints qualify the interpretation of our findings and should be borne in mind when drawing broader conclusions.
One primary source of uncertainty stems from the approach used to estimate agricultural non-point source pollution loads. Calculations were based on the export coefficient method, with generalized parameters drawn from the First National Pollution Source Census and the published literature. While this framework is standard practice in data-scarce regions, it inevitably masks local spatial heterogeneities in soil properties, hydrological connectivity, and field management practices across the extensive Hetao Irrigation District. Most notably, crop-specific export coefficients were not independently calibrated through in situ plot trials within the study area. Although sensitivity analysis and the calibration of delivery coefficients against monitored inlet loads partially mitigate this uncertainty, future research should prioritize field-scale experiments (particularly for high-fertilizer crops such as sunflower) to derive truly site-specific parameters. An additional source of uncertainty is that official agricultural statistics only report synthetic fertilizer application rates, with no disaggregation of organic manure inputs by crop type. Given that organic fertilizers are applied sparingly to major field crops in HID, their omission is expected to introduce a slight underestimation of total nutrient loads, particularly those associated with livestock manure returned to croplands.
Beyond uncertainties in input data, the EFDC model itself incorporates inherent structural simplifications that shape simulation outcomes. Despite rigorous calibration and validation, the 500 m × 500 m grid resolution may be too coarse to resolve fine-scale water quality gradients in littoral zones and near inflow outlets. More fundamentally, the representation of phosphorus biogeochemistry is substantially simplified. TP is treated entirely as a dissolved constituent, ignoring the particulate fraction that dominates agricultural runoff in this region. This simplification is likely to underpredict rapid phosphorus settling near inlets and overpredict its downstream transport toward the lake outlet. In addition, sediment phosphorus flux is prescribed as a constant value, whereas field observations in Wuliangsu Lake document pronounced seasonal, redox-driven variations. For COD, the model lumps all organic matter into a single pool with a uniform decay rate, failing to distinguish between easily degradable autochthonous material (e.g., algal biomass) and recalcitrant allochthonous inputs (e.g., humic acids from irrigation return flow). Additionally, macrophyte decomposition, which is an important COD source in reed-dominated zones such as station S3, is not explicitly represented in the model. This lumping likely accounts for the higher mean relative error of COD (32.3%) relative to TN (28.1%) during the validation period. Improved representation of internal nutrient cycling in future work will require a multi-component organic matter scheme coupled with a sediment diagenesis sub-model.
Additional constraints relate to the design and scope of the scenario analysis. Only two intensities of cropping structure adjustment (moderate and intensive) were evaluated, leaving the full continuum of potential optimization pathways unexplored. More critically, the analysis does not account for synergistic or antagonistic interactions between cropping regime shifts and other driving forces, including soil erosion, climate variability, industrial discharges, and livestock waste. The 6-year study window (2018–2023) is also relatively short to capture long-term regime shifts in lake water quality; extended monitoring and multi-year simulations under changing climatic and management conditions are needed to confirm the robustness of the observed structures.
A further caveat relates to the focused scope of the water quality assessment. We intentionally restricted our analysis to TN, TP, and COD as core indicators of agricultural non-point source pollution and eutrophication dynamics. For organic pollution quantification, COD was selected in preference to BOD. BOD was not included in our 2018–2023 routine monitoring program, so no continuous long-term time series was available to support model calibration and trend analysis. Beyond data availability, BOD only captures readily biodegradable organic matter, which would underestimate the total organic load from agricultural sources, as irrigation return flow carries abundant refractory components from crop residues, soil humus, and livestock manure. This indicator choice is also consistent with the single-pool organic matter parameterization of the EFDC model described above, where total COD serves as the primary state variable for organic pollution simulation.
Beyond organic pollution indicators, this targeted scope aligns with our core objective of quantifying how cropping structure adjustments alter lake trophic status, but it does not address the lake’s suitability for other beneficial uses, including domestic water supply, industrial consumption, and recreation. A more holistic evaluation framework incorporating pH, dissolved oxygen, electrical conductivity, heavy metals, and microbial indicators, as established in comparable multi-parameter surface water studies [67], is a clear and high-priority direction for follow-up work.
These limitations notwithstanding, the core finding that cropping structure optimization delivers meaningful improvements to water quality in Wuliangsu Lake remains robust. Rather than undermining the value of the present work, these constraints identify actionable avenues for refinement and extension in subsequent studies.

5. Conclusions

This study presents a comprehensive assessment of the hydro-ecological responses to agricultural intensification in the Hetao Irrigation District (HID), offering a quantitative framework for reconciling the conflict between grain production and aquatic ecosystem preservation in arid endorheic basins. By integrating multi-source remote sensing, statistical data, and the EFDC hydrodynamic-water quality model, we elucidated the transmission mechanisms of non-point source pollution (NPS) from field to lake and evaluated the efficacy of cropping structure optimization. The principal conclusions are drawn as follows:
(1)
Spatio-temporal evolution driven by anthropogenic–water interactions
From 2018 to 2023, the LULC dynamics in HID were characterized by a complex interplay between agricultural expansion and ecological restoration. While cultivated land expanded by 2.6% driven by food security demands, concurrent ecological governance led to a 13.5% increase in forestland and a 23.8% reduction in wasteland. However, the degradation of native grasslands (−5.2%) signals a persistent vulnerability in the regional ecological baseline, highlighting that water resource availability remains the ultimate constraint on land use sustainability in this arid region.
(2)
Decoupling agricultural output from pollution loads
Despite the expansion of high-fertilizer crops like sunflowers, the total agricultural NPS pollution loads entering Wuliangsu Lake exhibited a consistent downward trend (TN: −15%; TP: −16.9%; COD: −19.4%) during the study period. This “decoupling” effect is primarily attributed to the synergistic implementation of water-saving irrigation and precision fertilization management. This finding challenges the conventional view that agricultural intensification inevitably leads to proportional environmental degradation, demonstrating that improved management practices can mitigate pollution risks even under intensified production.
(3)
Differential sensitivity and spatial heterogeneity in water quality response
Model simulations revealed that water quality responses to cropping structure adjustments are non-linear and spatially heterogeneous. Total phosphorus (TP) proved to be the most sensitive indicator to land use changes, followed by TN and COD. Under the intensive adjustment scenario (Scenario 2), converting high-fertilizer crops to spring wheat and reclaiming wasteland for ecological forage reduced inflow loads by approximately 10–12% and in-lake concentrations by nearly 20%. Notably, the “source control” effect was most pronounced in the inlet zones, whereas the central and outlet areas were more influenced by internal hydrodynamic processes and sediment release, suggesting that future management must adopt a “source-pathway-sink” holistic approach.
(4)
Strategic implications for sustainable basin management
This study confirms that optimizing cropping structures is a viable and effective strategy for alleviating eutrophication in terminal lakes without compromising regional food security. The proposed “wheat-forage” substitution strategy not only reduces nutrient leaching but also aligns with regional policies on saline–alkali land amelioration. It provides a practical pathway for balancing the roles of the region as a “grain basket” and a guardian of the “water tower.”
While this study provides a robust framework, future research should incorporate additional factors such as climate change, industrial pollution, and livestock farming to further improve simulation accuracy. A more comprehensive model that integrates these dynamic drivers will be essential for developing holistic management strategies, ensuring the long-term balance between agricultural production and aquatic ecosystem protection in arid and semi-arid regions globally.

Supplementary Materials

The following supporting information can be downloaded at https://www.mdpi.com/article/10.3390/w18151907/s1. Table S1. Key calibrated parameters of the EFDC water quality module; Table S2. Trends in chemical fertilizer application and management interventions in HID, 2017–2023.

Author Contributions

Conceptualization: W.Z. and H.X. (Hongliang Xu); Methodology: H.X. (Hekun Xie); Software, Y.H.; Validation: Z.L.; Formal analysis: W.Z. and H.X. (Hekun Xie); Investigation: Y.H.; Resources: Z.L.; Data curation: W.Z.; Writing—original draft: W.Z.; Writing—review and editing: H.X. (Hongliang Xu); Visualization: H.X. (Hekun Xie); Supervision: H.X. (Hongliang Xu); Project administration: H.X. (Hongliang Xu). All authors have read and agreed to the published version of the manuscript.

Funding

This research was funded by Joint Research Program for Ecological Conservation and High Quality Development of the Yellow River Basin (2022-YRUC-01-0601).

Data Availability Statement

The remote sensing data used in this study are openly available from the National Cryosphere Desert Data Center and the MODIS Land Data Distributed Active Archive Center at https://modis.gsfc.nasa.gov/. Water quality monitoring data were obtained from the Bayannur Ecology and Environment Bureau. Crop planting structure data were provided by the Bureau of Statistics of Bayannur City. All data supporting the findings of this study are available from the corresponding author upon reasonable request. Cultivated land areas are cross-validated against the Bayannur Statistical Yearbook (2018, 2023). Areas for other land-use types (forestland, grassland, water bodies, wasteland, impervious surface) are derived from the authors’ MODIS-based LULC classification, with trends further corroborated by internal reports from local government agencies (Bayannur Bureau of Natural Resources, Bureau of Agriculture, Forestry and Grassland Bureau). The observed trends are consistent with regional policy implementations: cultivated land expansion and wasteland reduction align with high-standard farmland construction and saline–alkali land amelioration initiatives; forestland increase corresponds to the “Three-North” Shelterbelt Program and sand-fixation projects; grassland decline reflects persistent water deficit under high evaporative demand and anthropogenic disturbances, consistent with reported grassland degradation in arid northern China; water area growth is supported by ecological water replenishment to Wuliangsu Lake; impervious surface expansion is driven by urban built-up growth and transportation infrastructure upgrades, consistent with urbanization data in the Bayannur Statistical Yearbook. Additional supporting documents, including Chinese government news releases on the above policies, are available from the corresponding author upon reasonable request.

Acknowledgments

The authors wish to thank the National Cryosphere Desert Data Center and NASA for providing remote sensing data. We are also grateful to the Bayannur Ecology and Environment Bureau and the Bayannur Bureau of Statistics for providing water quality monitoring data and planting structure data, respectively.

Conflicts of Interest

Author Wei Zhang and Author Zhuying Li were employed by Inner Mongolia Ecological Environment Big Data Co., Ltd. The remaining authors declare that the research was conducted in the absence of any commercial or financial relationships that could be construed as a potential conflict of interest.

Abbreviations

The following abbreviations are used in this manuscript:
HIDHetao Irrigation District
LULCLand Use/Land Cover
MODISModerate Resolution Imaging Spectroradiometer
EFDCThe Environmental Fluid Dynamics Code
TNTotal Nitrogen
TPTotal Phosphorus
CODChemical Oxygen Demand

References

  1. Chen, Y. (Ed.) Water Resources Research in Northwest China; Springer: Dordrecht, The Netherlands, 2014; ISBN 978-94-017-8016-2. [Google Scholar]
  2. USDA Agricultural Research Service. Nitrate Leaching in Irrigated Corn and Soybean in a Semi-Arid Climate; USDA ARS: Washington, DC, USA, 1998. [CrossRef]
  3. Lu, Z.; Wu, D.X.; Meng, S.S.; Kou, X.K.; Jiao, L.P. Exploration of Spatiotemporal Covariation in Vegetation–Groundwater Relationships: A Case Study in an Endorheic Inland River Basin. Land 2025, 14, 715. [Google Scholar] [CrossRef]
  4. Allen, R.G.; Pereira, L.S.; Raes, D.; Smith, M. Crop Evapotranspiration—Guidelines for Computing Crop Water Requirements; FAO Irrigation and Drainage Paper No. 56; Food and Agriculture Organization of the United Nations: Rome, Italy, 1998. [Google Scholar] [CrossRef]
  5. FAO. Coping with Water Scarcity: The Role of Agriculture—An Action Framework for Agriculture and Food Security; Food and Agriculture Organization of the United Nations: Rome, Italy, 2012. [Google Scholar]
  6. Wang, D.P.; Zheng, L.; Wu, X.P.; Luo, X.H.; Wang, W.B.; Zhang, Y.F.; Xue, X.X. Review of Soil Nitrate Formation, Leaching Transport, and Control Measures in Upland Farming Systems. Chin. J. Eco-Agric. 2017, 25, 1731–1741. [Google Scholar] [CrossRef]
  7. Zhang, S.; Li, F.; Wang, X. Effects of Irrigation and Fertilization on Grain Yield, Water and Nitrogen Dynamics and Their Use Efficiency of Spring Wheat Farmland in an Arid Agricultural Watershed of Northwest China. Agric. Water Manag. 2023, 280, 108234. [Google Scholar] [CrossRef]
  8. Chen, Y.N.; Yang, Q.; Luo, Y.; Shen, Y.; Pan, X.; Li, L.; Li, Z. Ponder on the Issue of Water Resources in the Arid Region of Northwest China. Arid. Land Geogr. 2012, 35, 1–9. [Google Scholar]
  9. Chen, Y.N.; Li, Z.; Fan, Y.T.; Wang, H.J.; Fang, G.H. Research Progress on the Impact of Climate Change on Water Resources in the Arid Region of Northwest China. Acta Geogr. Sin. 2014, 69, 1295–1304. [Google Scholar] [CrossRef]
  10. Scanlon, B.R.; Reedy, R.C.; Faunt, C.C. Global impacts of groundwater use for irrigation on water storage and reliability. Nat. Rev. Earth Environ. 2021, 2, 789–803. [Google Scholar]
  11. Guo, P.; Zhao, M.; Zhang, Y. Optimization and Evaluation of Multi-objective Planting Structure in Hetao Irrigation District Based on Water Footprint. Trans. Chin. Soc. Agric. Mach. 2021, 52, 346–357. [Google Scholar] [CrossRef]
  12. Yin, J.; Li, X.; Engel, B.A.; Ding, J.; Xing, X.; Sun, S.; Wang, Y. Inter-Regional Food-Water-Income Synergy Through Bi-Level Crop Redistribution Model Coupled with Virtual Water: A Case Study of China’s Hetao Irrigation District. Water Resour. Res. 2024, 60, e2023WR036572. [Google Scholar] [CrossRef]
  13. Zhao, C.; Ye, M.; Li, N.; Huang, X.; Wang, J. Can Reduced Nitrogen Application of Slow/Controlled-Release Urea Enhance Maize Yield Stability and Mitigate Nitrate/Ammonium Nitrogen Leaching in Soil in North China? Agriculture 2025, 15, 2045. [Google Scholar] [CrossRef]
  14. Li, J.; Zhang, H.; Wang, P. Simulation of Water Quality in Arid Area Lakes Based on EFDC Model—A Case Study of Wuliangsu Lake. Environ. Model. Softw. 2024, 172, 105892. [Google Scholar]
  15. Liu, X.H.; Liu, H.M.; Wang, L.X.; Cao, X.A. Simulation of Non-Point Source Pollution Load in Ulansuhai Watershed by SWAT Model Based on Improved Planting Structure. Chin. J. Environ. Eng. 2023, 17, 2505–2514. [Google Scholar] [CrossRef]
  16. Zhu, P.H.; Yu, R.H.; Ge, Z.; Sun, H.Y. Long-term Temporal Variation of Water Quality and Its Driving Factors in Wuliangsu Lake, Northern China. J. Environ. Sci. 2023, 126, 394–405. [Google Scholar] [CrossRef]
  17. Lu, Z.; Shen, C.Y.; Zhan, C.; Tang, H.L.; Luo, C.H.; Meng, S.S.; An, Y.K.; Wang, H.; Kou, X.K. Quantifying Multifactorial Drivers of Groundwater–Climate Interactions in an Arid Basin Based on Remote Sensing Data. Remote Sens. 2025, 17, 2472. [Google Scholar] [CrossRef]
  18. Li, W.; Guo, S.; Liu, H.; Zhai, L.; Wang, H.; Lei, Q. Comprehensive Environmental Impacts of Fertilizer Application Vary Among Different Crops: Implications for the Adjustment of Agricultural Structure Aimed to Reduce Fertilizer Use. Agric. Water Manag. 2018, 210, 196–203. [Google Scholar] [CrossRef]
  19. Peng, J.; Jin, C.; Wu, Y.; Hou, Z.; Gao, S.; Chu, Z.; Zheng, B. Modeling Non-Point Source Nutrient Loads with Different Cropping Systems in an Agricultural Lake Watershed in Southwestern China: From Field to Watershed Scale. Mathematics 2022, 10, 4047. [Google Scholar] [CrossRef]
  20. Zhang, T.; Yang, S.; Liu, Y.; Wang, J. Phenology–Gross Primary Productivity (GPP) Method for Crop Information Extraction in Areas Sensitive to Non-Point Source Pollution and Its Influence on Pollution Intensity. Remote Sens. 2022, 14, 742. [Google Scholar] [CrossRef]
  21. Liu, X.; Wei, Y.; Zhao, J.; Song, Y.; Hou, C.; Wu, Q. Evaluation of the Reduction Efficiency of Best Management Practices for Non-point Source Pollution in Hetao Irrigation District Under Climate Change. J. Environ. Eng. Technol. 2025, 15, 1634–1645. [Google Scholar] [CrossRef]
  22. GB 3838-2002; Environmental Quality Standards for Surface Water. State Environmental Protection Administration of China: Beijing, China, 2002.
  23. Kularathna, M.; Somlyody, L. River Basin Water Quality Management Models: A State-of-the-Art Review; IIASA Working Paper WP-94-003; International Institute for Applied Systems Analysis: Laxenburg, Austria, 1994. [Google Scholar]
  24. Lu, Z.; Ning, D.H.; Shen, C.Y.; Bai, J.; Zhang, Y.H.; Kou, X.K.; Meng, S.S. Diagnosing the Causal Relationships between Groundwater Resource Characteristics and Socio-economic Factors in the Heihe River Basin, China. Water Cycle 2026, 7, 422–437. [Google Scholar] [CrossRef]
  25. Wang, Q.; Li, S.; Jia, P.; Qi, C.; Ding, F. A Review of Surface Water Quality Models. Sci. World J. 2013, 2013, 231768. [Google Scholar] [CrossRef] [PubMed]
  26. Bai, J.; Zhao, J.; Zhang, Z.; Tian, Z. Assessment and a Review of Research on Surface Water Quality Modeling. Ecol. Model. 2022, 466, 109888. [Google Scholar] [CrossRef]
  27. Pachepsky, Y.; Stocker, M.; Kim, M.S. Accounting for the Three-Dimensional Distribution of Escherichia coli Concentrations in Pond Water in Simulations of the Microbial Quality of Water Withdrawn for Irrigation. Water Res. 2020, 168, 115184. [Google Scholar] [CrossRef]
  28. Lai, G.; Wang, P.; Lin, H. Predicting the Hydrological Impacts of the Poyang Lake Project Using an EFDC Model. J. Hydrol. Eng. 2015, 20, 05015009. [Google Scholar] [CrossRef]
  29. Zhu, P.; Yu, R.; Ge, Z.; Sun, H.; Cao, Z. Long-term Changes of Water Quality and the Driving Factors of Wuliangsuhai Lake. Chin. J. Ecol. 2022, 41, 546. [Google Scholar]
  30. Li, C.; Chai, G.; Li, Z. Spatial−Temporal Variation of Ecological Environment Quality and Driving Factors from 2000 to 2020 in Wuliangsu Lake Basin, Northern China. Front. Ecol. Evol. 2023, 11, 1240514. [Google Scholar] [CrossRef]
  31. Liu, Y.; Zeng, W.; Ao, C.; Liu, Z.; Hu, X. Optimizing Irrigation and Planting Strategies to Prevent Non-point Source Pollution in the Hetao Irrigation District Using SWAT-MODFLOW-RT3D Model. Agric. Water Manag. 2024, 295, 108765. [Google Scholar] [CrossRef] [PubMed]
  32. Zhao, N.; Ma, J.; Wu, L.; Li, X.; Xu, H.; Zhang, J.; Wang, X.; Wang, Y.; Bai, L.; Wang, Z. Effect of Organic Manure on Crop Yield, Soil Properties, and Economic Benefit in Wheat-Maize-Sunflower Rotation System, Hetao Irrigation District. Plants 2024, 13, 2250. [Google Scholar] [CrossRef] [PubMed]
  33. Liu, Y.; Lu, J.; Zhao, S.; Shi, X.; Sun, B.; Zhang, X.; Shi, Z.; Mi, J. Water Environment Change Trend and Ecological Water Replenishment of Lake Wuliangsuhai and Other Key Driving Factors Analysis Based on Long Time Series (2011–2020). J. Lake Sci. 2023, 35, 1939–1948. [Google Scholar] [CrossRef]
  34. Li, H.L.; Zhang, S.H.; Yu, P.D.; Song, Z.Y.; Xie, C.X.; Zhang, J.J. Estimation and Critical Source Area Identification of Non-point Source Pollution Based on Improved Export Coefficient Models: A Case Study of the Upper Beiyun River Basin. Environ. Sci. 2023, 44, 6194–6204. [Google Scholar] [CrossRef] [PubMed]
  35. Johnes, P.J. Evaluation and Management of the Impact of Land Use Change on the Nitrogen and Phosphorus Load Delivered to Surface Waters: The Export Coefficient Modelling Approach. J. Hydrol. 1996, 183, 323–349. [Google Scholar] [CrossRef]
  36. Ding, J.; Li, W.; Zhang, L. Quantitative Assessment of Agricultural Non-point Source Pollution in Irrigation Districts Based on Export Coefficient Method. J. Irrig. Drain. Eng. 2020, 39, 625–632. [Google Scholar]
  37. Liu, C.; Wang, J.; Li, X. Application of Export Coefficient Method in Estimating Agricultural Non-point Source Pollution Load in Arid Irrigation Districts. Arid. Zone Res. 2018, 35, 921–928. [Google Scholar]
  38. Office of the Leading Group for the First National Pollution Source Census of the People’s Republic of China. First National Pollution Source Census Communique: Analysis Report on Planting Industry Pollution Sources; China Environmental Science Press: Beijing, China, 2009. [Google Scholar]
  39. Hamrick, J.M. The Environmental Fluid Dynamics Code (EFDC) Theory and Computation Volume 1: Hydrodynamics and Transport; Tetra Tech, Inc. for U.S. Environmental Protection Agency: Washington, DC, USA, 2007. [Google Scholar]
  40. Wu, G.Z.; Xu, Z.X. Prediction of Algal Blooming Using EFDC Model: Case Study in the Daoxiang Lake. Ecol. Model. 2011, 222, 1245–1252. [Google Scholar] [CrossRef]
  41. Ji, Z.G. Hydrodynamics and Water Quality: Modeling Rivers, Lakes, and Estuaries; John Wiley & Sons: Hoboken, NJ, USA, 2008. [Google Scholar] [CrossRef]
  42. EPA. EFDC Modeling System: User’s Guide and Supplemental Documentation; U.S. Environmental Protection Agency, Office of Research and Development: Washington, DC, USA, 2010.
  43. van Griensven, A.V.; Meixner, T.; Grunwald, S.; Bishop, T.; Diluzio, M.; Srinivasan, R. A Global Sensitivity Analysis Tool for Environmental Parameters. Environ. Model. Softw. 2006, 21, 1346–1354. [Google Scholar] [CrossRef]
  44. Yi, S.R.; Feng, X.J.; Wang, Z.W.; Xiong, J.F.; Lin, C.; Xia, Y.; Wu, H.Y. Spatial-temporal Changes of Nitrogen and Phosphorus Non-point Source Pollution in Hetao Irrigation District Based on SWAT. J. Agro-Environ. Sci. 2023, 42, 2550–2559. [Google Scholar]
  45. Chinese Academy for Environmental Planning, Ministry of Environmental Protection. The Situation of Agricultural Non-point Source Pollution and the Policy Orientation of the 14th Five-Year Plan; Chinese Academy for Environmental Planning: Beijing, China, 2021. [Google Scholar]
  46. Zhao, S.; Shi, X.; Li, C.; Zhang, S.; Sun, B.; Wu, Y.; Zhao, S. Diffusion Flux of Phosphorus Nutrients at the Sediment–Water Interface of the Ulansuhai Lake in Northern China. Water Sci. Technol. 2017, 75, 1455–1465. [Google Scholar] [CrossRef] [PubMed]
  47. Zhu, W.; Kang, Y.; Li, X.; Wan, S.; Dong, S. Changes in Understory Vegetation During the Reclamation of Saline-Alkali Soil by Drip Irrigation for Shelterbelt Establishment in the Hetao Irrigation Area of China. Ecol. Eng. 2022, 180, 106639. [Google Scholar] [CrossRef]
  48. Qadir, M.; Ghafoor, A.; Murtaza, G. Amelioration Strategies for Saline Soils: A Review. Land Degrad. Dev. 2000, 11, 501–521. [Google Scholar] [CrossRef]
  49. Wu, Y.; Shi, X.; Li, C.; Zhao, S.; Pen, F.; Green, T.R. Simulation of Hydrology and Nutrient Transport in the Hetao Irrigation District, Inner Mongolia, China. Water 2017, 9, 169. [Google Scholar] [CrossRef]
  50. Yu, S.; Du, X.; Lei, Q.; Wang, X.; Wu, S.; Liu, H. Long-term Variations of Water Quality and Nutrient Load Inputs in a Large Shallow Lake of Yellow River Basin: Implications for Lake Water Quality Improvements. Sci. Total Environ. 2024, 900, 165776. [Google Scholar] [CrossRef] [PubMed]
  51. Wang, W.; Shi, H.; Li, X.; Sun, Y.; Zhang, W.; Zhou, H. Effects of Irrigation–Fertilization–Tillage on Nutrient Loading and Crop Yield in Ulansuhai Watershed Based on Improved SWAT Model. J. Lake Sci. 2022, 34, 1505–1523. [Google Scholar] [CrossRef]
  52. Van Meter, K.J.; Basu, N.B.; Van Cappellen, P. The Nitrogen Legacy: Emerging Evidence of Nitrogen Accumulation in Anthropogenic Landscapes. Environ. Res. Lett. 2017, 12, 095008. [Google Scholar] [CrossRef]
  53. Sharpley, A.; Jarvie, H.P.; Buda, A.; May, L.; Spears, B.; Kleinman, P. Phosphorus Legacy: Overcoming the Effects of Past Management Practices to Mitigate Future Water Quality Impairment. J. Environ. Qual. 2013, 42, 1308–1326. [Google Scholar] [CrossRef] [PubMed]
  54. Kratzer, C.R.; Brown, L.R.; Dubrovsky, N.M. Trends in Nutrient Concentrations in the San Joaquin River, California, 1991–2018. J. Am. Water Resour. Assoc. 2020, 56, 1040–1058. [Google Scholar]
  55. Søndergaard, M.; Jensen, J.P.; Jeppesen, E. Role of Sediment and Internal Loading of Phosphorus in Shallow Lakes. Hydrobiologia 2003, 506, 143–152. [Google Scholar] [CrossRef]
  56. Hamilton, D.P.; Mitchell, S.F. An Empirical Model for Sediment Resuspension in Shallow Lakes. Hydrobiologia 1996, 317, 209–220. [Google Scholar] [CrossRef]
  57. Jeppesen, E.; Søndergaard, M.; Jensen, J.P.; Havens, K.E.; Anneville, O.; Carvalho, L.; Coveney, M.F.; Deneke, R.; Dokulil, M.T.; Foy, B.; et al. Lake Responses to Reduced Nutrient Loading: An Analysis of Contemporary Long-term Data from 35 Case Studies. Freshw. Biol. 2005, 50, 1747–1771. [Google Scholar] [CrossRef]
  58. Paerl, H.W.; Xu, H.; McCarthy, M.J.; Zhu, G.; Qin, B.; Li, Y.; Gardner, W.S. Controlling Harmful Cyanobacterial Blooms in a Hyper-Eutrophic Lake (Lake Taihu, China). Water Res. 2011, 45, 1973–1983. [Google Scholar] [CrossRef] [PubMed]
  59. LaBounty, J.F. Secchi transparency of Boulder Basin, Lake Mead, Arizona-Nevada: 1990–2007. Lake Reserv. Manag. 2008, 24, 207–218. [Google Scholar] [CrossRef]
  60. Chapra, S.C. Surface Water-Quality Modeling; McGraw-Hill: New York, NY, USA, 1997; Available online: https://www.researchgate.net/profile/Steven-Chapra/publication/48447645_Surface_Water-Quality_Modeling/links/0fcfd510a6a96a337b000000/Surface-Water-Quality-Modeling.pdf (accessed on 26 July 2026).
  61. Galat, D.L.; Lider, E.L.; Vigg, S.; Robertson, S.R. 22. Limnology of a Large, Deep, North American Terminal Lake: Pyramid Lake, Nevada, U.S.A. Hydrobiologia 1981, 81, 281–317. [Google Scholar] [CrossRef]
  62. Williams, W.D. Environmental Threats to Salt Lakes and the Likely Status of Inland Saline Ecosystems in 2025. Environ. Conserv. 2002, 29, 154–167. [Google Scholar] [CrossRef]
  63. Delta Independent Science Board. Water Quality Science in the Sacramento-San Joaquin Delta: Chemical Contaminants and Nutrients; Delta Independent Science Board: Sacramento, CA, USA, 2018. [Google Scholar]
  64. Rehman Qaisar, F.U.; Zhang, F.; Pant, R.R.; Wang, G.; Khan, S.; Zeng, C. Spatial variation, source identification, and quality assessment of surface water geochemical composition in the Indus River Basin, Pakistan. Environ. Sci. Pollut. Res. Int. 2018, 25, 12749–12763. [Google Scholar] [CrossRef] [PubMed]
  65. Walker, G.; Prosser, I.P. Water Quality: Land Use Impacts on Salinity, Sediments, and Nutrients. In Ecohydrology from Catchment to Coast; Hart, B.T., Bond, N.R., Byron, N., Pollino, C.A., Stewardson, M.J., Eds.; Elsevier: Cambridge, MA, USA, 2021; Volume 1, pp. 109–135. ISBN 9780128181522. [Google Scholar] [CrossRef]
  66. Micklin, P.P. The Aral Sea Disaster. Annu. Rev. Earth Planet. Sci. 2007, 35, 47–72. [Google Scholar] [CrossRef]
  67. Khan, I.; Zakwan, M.; Pulikkal, A.K.; Lalthazula, R.; Siddiqui, S.A.; Nazeer, S. Impact of Unplanned Urbanization on Surface Water Quality of the Twin Cities of Telangana State, India. Mar. Pollut. Bull. 2022, 185, 114324. [Google Scholar] [CrossRef]
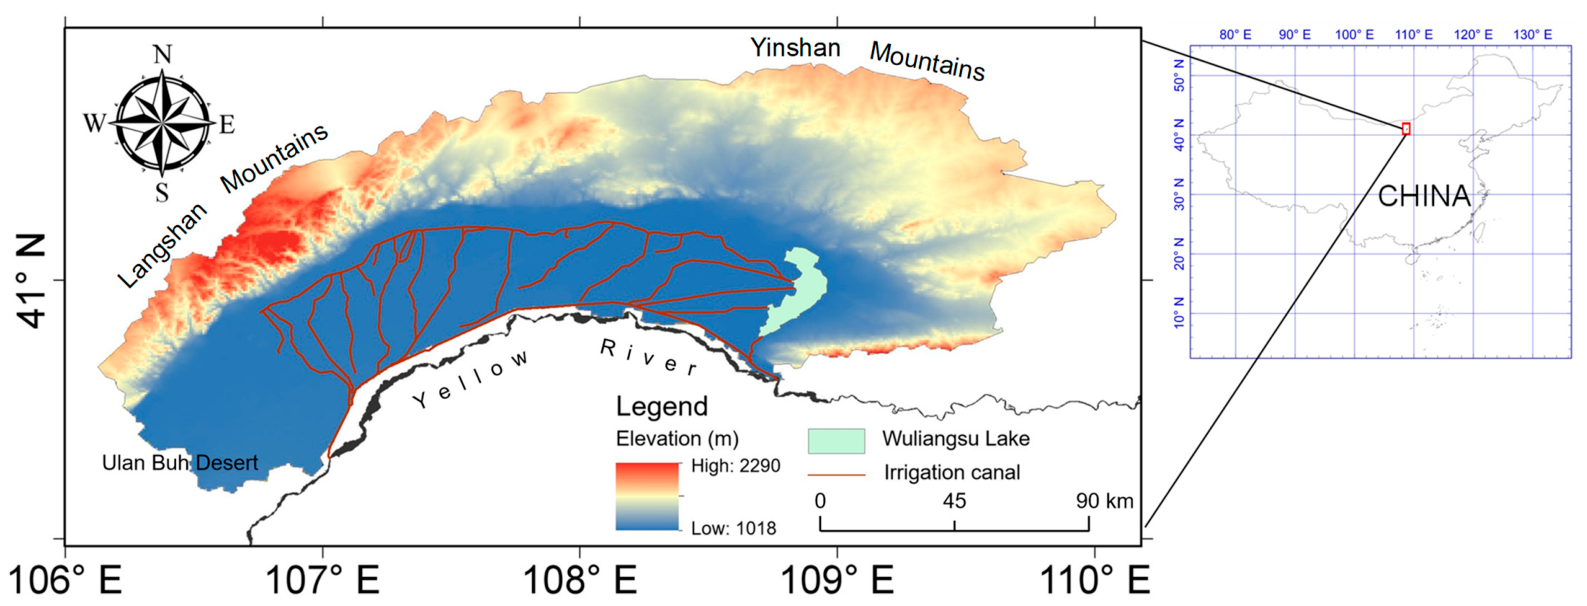
Figure 1. Study area.
Water 18 01907 g001
Figure 2. Locations of the water quality monitor stations.
Water 18 01907 g002
Figure 3. Technical flowchart of the research framework.
Water 18 01907 g003
Figure 4. The spatial distribution of LULC changes during the period 2018–2023.
Water 18 01907 g004
Figure 5. Variation in sown areas of maize, wheat, sunflower, and other crops in HID (2018–2023).
Water 18 01907 g005
Figure 6. Annual agricultural non-point source pollution loads (tons per year) entering Wuliangsu Lake (2018–2023).
Water 18 01907 g006
Figure 7. Comparison of daily monitored and simulated water quality concentrations at the central lake station (S5) during the validation period in June–October, 2022. (a) TN; (b) TP; (c) COD.
Water 18 01907 g007
Figure 8. Distribution of TN, TP and COD concentrations at six monitoring stations (S1–S6) under the baseline scenario (April–October average). (a) TN; (b) TP; (c) COD.
Water 18 01907 g008
Figure 9. Variation in TN concentrations across six monitoring stations under the baseline, Scenario 1 and Scenario 2: (a) Station S1; (b) Station S2; (c) Station S3; (d) Station S4; (e) Station S5; (f) Station S6.
Water 18 01907 g009
Figure 10. Variation in TP concentrations across six monitoring stations under the baseline, Scenario 1 and Scenario 2: (a) Station S1; (b) Station S2; (c) Station S3; (d) Station S4; (e) Station S5; (f) Station S6.
Water 18 01907 g010
Figure 11. Variation in COD concentrations across six monitoring stations under the baseline, Scenario 1 and Scenario 2: (a) Station S1; (b) Station S2; (c) Station S3; (d) Station S4; (e) Station S5; (f) Station S6.
Water 18 01907 g011
Table 1. Confusion matrix for the 2023 LULC classification (100 validation points, 20 per class).
Classified\ReferenceCroplandWaterImpervious LandWaste LandNatural
Vegetation
Row
Total
UA
Cropland1811102185.7%
Water0170021989.5%
Impervious Land1016122080%
Waste Land1021622176.2%
Natural Vegetation0212141973.7%
Column Total2020202020100
PA90%85%80%80%70%
Table 2. Summary of accuracy metrics for 2018 and 2023 LULC classifications.
Metric20182023
Overall accuracy82%81%
Kappa coefficient0.7750.763
Cropland-PA/UA90/85.790/84.6
Water-PA/UA86/9085/89.5
Impervious Land-PA/UA80/7980/80
Waste Land-PA/UA82/7780/76.2
Natural Vegetation-PA/UA72/7570/73.7
Table 3. Sensitivity of total TN load to ±20% variation in key parameters.
Parameter VariedValue at −20%TN Load at −20% (t/yr)Change (%)Value at +20%TN Load at +20% (t/yr)Change (%)SI
ETN,sunflower (18.5 → 14.8 or 22.2 kg·ha−1·yr−1)14.81523−3.722.216393.70.185
ηsunflower (1.15 → 0.92 or 1.38)0.921548−2.11.3816142.10.105
γ (0.35 → 0.28 or 0.42)0.281372−13.20.42179013.20.66
Table 4. Temporal changes in land use types in Hetao Irrigation District (HID) from 2018 to 2023.
Land Use TypeArea (km2)Change Rate (%)
20182023
Cultivated Land890913.32.6
Wasteland140106.7−23.8
Forestland51675864.613.5
Grassland38,98337,004.3−5.2
Water Area2933085.1
Impervious Surface8.81125.3
Table 5. Calibration and verification results of the EFDC model.
Water Quality IndicatorCalibration PeriodValidation Period
R2MRE (%)R2MRE (%)
TN0.7225.20.6928.1
TP0.7331.70.6837.3
COD0.7129.50.732.3
Table 6. Inflow pollution loads and reduction rate under two designed optimal scenarios.
ScenarioInflow Load (Tons Per Year)Reduction Rate (%)
TNTPCODTNTPCOD
Baseline15811652620---
Scenario 11472.6151.82426.3−6.8−8−7.4
Scenario 21421.1145.72334.8−10−11.7−10.9
Disclaimer/Publisher’s Note: The statements, opinions and data contained in all publications are solely those of the individual author(s) and contributor(s) and not of MDPI and/or the editor(s). MDPI and/or the editor(s) disclaim responsibility for any injury to people or property resulting from any ideas, methods, instructions or products referred to in the content.