Article

Multi-Media Distribution and Sources of Dissolved Organic Matter in Subtropical Watershed: Insights into Impact of Sediment Grain Size

1
Institute of Water Sciences, Zhejiang University of Water Resources and Electric Power, Hangzhou 310018, China
2
School of Environmental Science and Engineering, Shanghai Jiao Tong University, 800 Dongchuan Road, Shanghai 200240, China
*
Author to whom correspondence should be addressed.
Water 2026, 18(15), 1851; https://doi.org/10.3390/w18151851
Submission received: 19 June 2026 / Revised: 22 July 2026 / Accepted: 24 July 2026 / Published: 30 July 2026
(This article belongs to the Section Water Quality and Contamination)

Highlights

What are the main findings?
  • The similarity of DOM between sediments and aquaculture was negatively related to coarse silt.
  • Negative and positive FQs concentrated on amino acid- and humic/fulvic-like regions, respectively.
What are the implications of the main findings?
  • The contributions of anthropogenic sources to sediment DOM were related to sediment grain.
  • Sediment grain size exerts different effects on the multi-media distribution of different DOMs.

Abstract

The multi-media environmental behavior of dissolved organic matter (DOM) is closely related to biogeochemistry and water quality. In this study, we characterized the multi-media distribution patterns and sources of DOM in a human-intensive watershed based on fluorescence measurements and fluorescence quotient (FQ) methods. Clay showed higher proportions in urban areas compared with rural areas. The biological index decreased with the increased similarity of DOM between sediment and a wastewater treatment plant (WWTP)/domestic sewage. The similarity of DOM between sediment and aquaculture was negatively related to coarse silt (Pearson, p < 0.05). In the water, C2 was more abundant in urban areas than in rural areas; among all sources, the WWTP exhibited the highest similarity (98.04%) of DOM with water, which was higher than that between sediment and the WWTP. The fluorescence index decreased with the increased similarity of DOM between waters and the WWTP/domestic sewage. The FQs for some amino acid-like materials and microbial byproducts between sediment and water were negative, while those for humic-like and fulvic-like materials between sediment and water were positive. Structure equation model (SEM) results showed that sediment grain size exerted positive effects on the distribution of C1 between sediment and water and negative effects on the distribution of C3 between sediment and water. The results demonstrated that the distribution of DOM between sediment and water, as well as the source contribution to DOM in sediment, was related to the sediment grain size, revealing the impact of sediment on the multi-media environmental behavior of DOM.

1. Introduction

Dissolved organic matter (DOM) comprises organic mixtures originating from both natural and anthropogenic sources. Natural organic matter mainly consists of amino acids, proteins, and humic substances, and terrestrial inputs of soil particles and plant remains can contribute to the occurrence of DOM in surface waters [1]. DOM could be related to spatial–temporal variations in Chl-a concentrations [2]. Additionally, some pollutants (e.g., tetracycline) from human sources could be linked to fluorescent DOM by emitting fluorescence or enhancing fluorescence [3,4], while DOM could serve as the precursor of contaminants, such as disinfection by-products [5]. Therefore, the fate and migration of DOM in the aquatic environment could be related to the environmental risk of pollutants. Considering that DOM ubiquitously occurs in multiple environmental media, deciphering the distribution and sources of DOM is beneficial not only for monitoring water quality but also for illustrating anthropogenic impacts on the water environment.
Similar to the DOM in water, sediment DOM could also have biological origins and anthropogenic signatures [6,7,8]. However, sediment DOM has a different composition from the DOM in overlying surface water, with more abundant nitrogen- and sulfur-containing compounds [9]. The distribution of variable DOM components between water and sediment can exhibit different patterns. Sediment DOM can be related to multiple environmental factors [10]. What is more, sediment particles can adsorb DOM, and sediment resuspension can release organic matter into surface waters [11]. This would influence the environmental behavior of DOM between sediment and water [11]. Meanwhile, sediments contain sand, clay, silt, and other materials that deposit in the aquatic environment. Dynamic changes in the multi-media distribution of DOM can be influenced by environmental factors [12]. Deciphering the relationship of sediment grain size with the distribution of DOM between water and sediment is key to revealing the environmental behavior of DOM in the aquatic environment.
Mineralogical compositions could influence the geochemical compositions of sediment, and many studies have demonstrated that the abundance of sediment DOM is often related to the sediment grain size distribution. The increasing surface area and available complexing sites in the sediment can be related to a high content of organic matter [13]. Organic matter can be stored in silt and clay particles [14], and total organic carbon contents are associated with the grain size fraction < 8 μm [13]. Large grain size fractions can provide attachment points for bacteria [15], which might influence the biological production of DOM. Resuspension will reduce the amount of organic carbon adsorbed on fine-grained sediment [11,13]. Environmental factors can influence the similarity of DOM and particulate organic matter [12]. However, limited information has been documented regarding the impact of sediment grain size on the distribution of DOM between water and sediment. Fluorescence spectroscopy could serve as a useful tool to detect the distribution of DOM, and fluorescence spectroscopy coupled with parallel factor analysis (PARAFAC) can be employed to track the anthropogenic signature between water and sediment [8,16]. Fluorescence measurement and PARAFAC techniques will be useful for deciphering the multi-media distribution and sources of DOM in the aquatic environment.
In this study, the East Taihu Lake Basin, which is in the densely populated Yangtze River Delta, was selected as the research area. Three-dimensional fluorescence spectroscopy coupled with PARAFAC techniques was employed to (1) characterize the spatial–temporal distribution and external sources of DOM between sediment and water in a human-intensive watershed; (2) characterize the distribution patterns of DOM between sediment and water; and (3) evaluate the impact of sediment grain size on the multi-media distribution of DOM.

2. Materials and Methods

2.1. Sample Collection

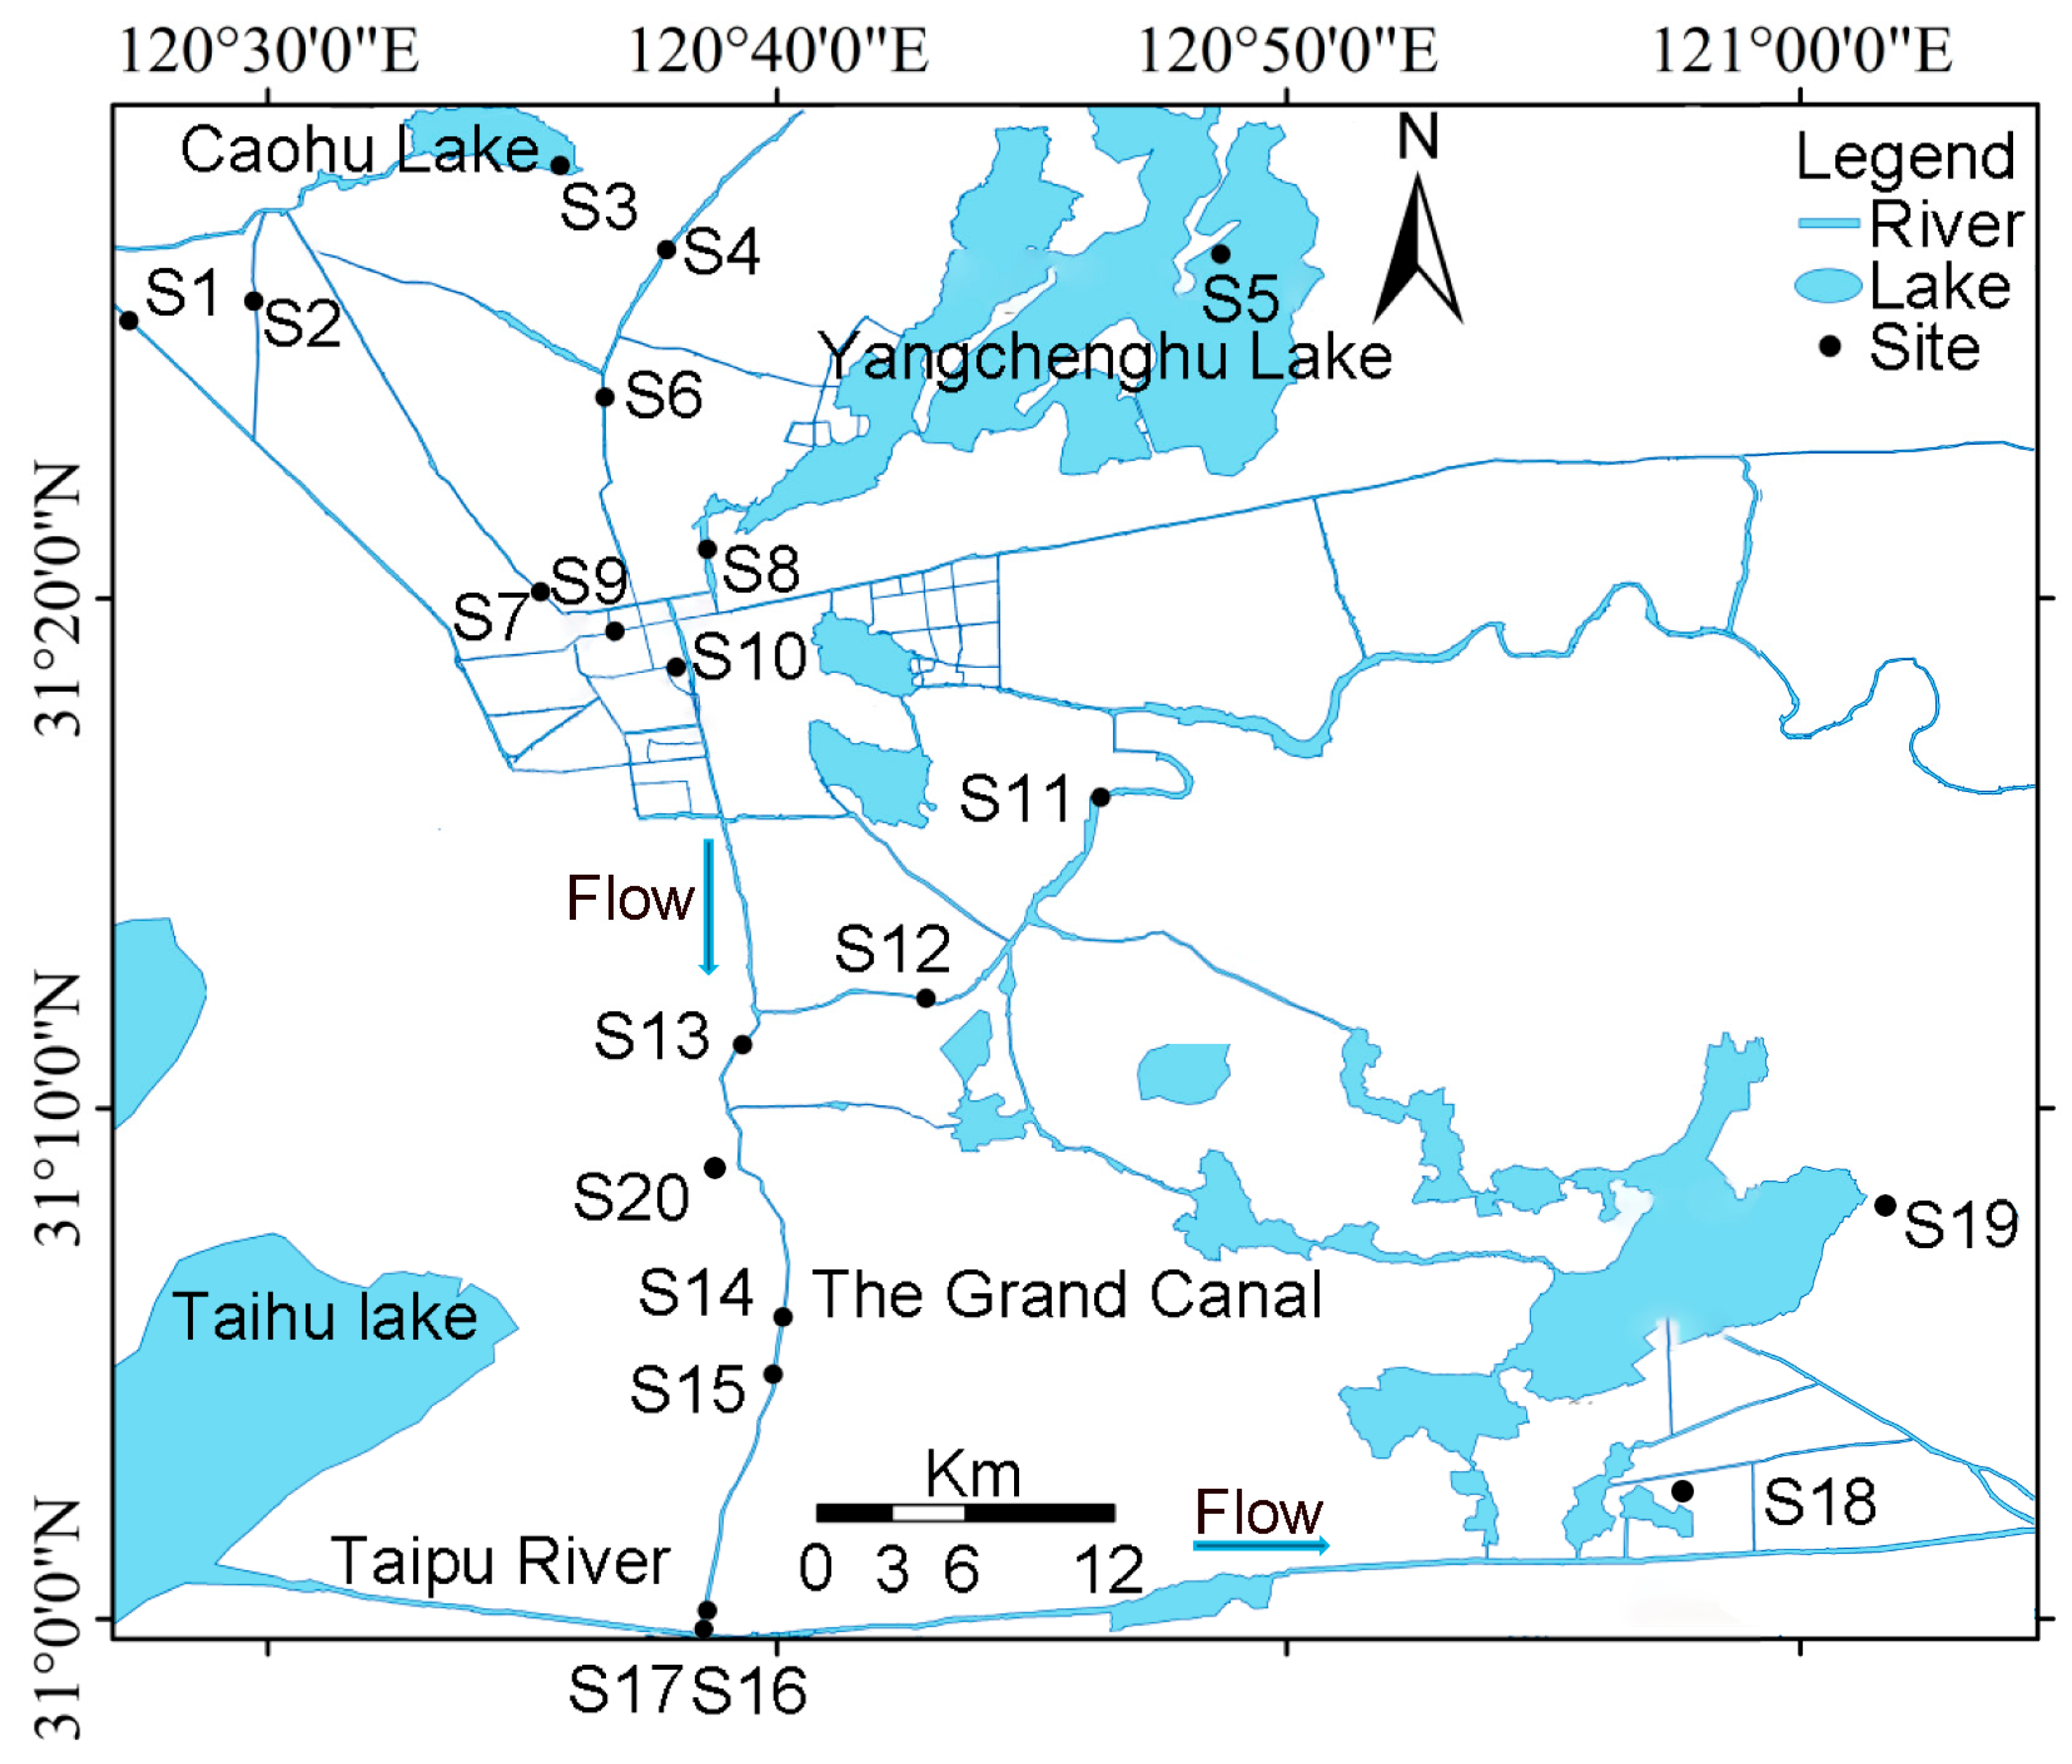
The research area (31°31′30″ N, 120°27′40″ E) is mainly located in Suzhou City (130.48 million people in 2025), China. This area belongs to plain tidal river networks. The water bodies studied included rivers and lakes (Figure 1). The main river (e.g., the Grand Canal) exhibits water depth ranging from 3 to 5 m. The water depth of Caohu Lake ranges from 1.5 to 2 m, while Yangchenghu Lake has an average depth of about 1.8 m. The climate is subtropical monsoon. The annual temperature is approximately 17.9 °C, and the annual precipitation is about 1086.3 mm, with the highest rainfall in summer (wet season), followed by spring (flat season) and winter (dry season). Paired sediment and water samples (S1–S17) and water samples (S18–S20) representative of the anthropogenic sources (i.e., aquaculture, wastewater treatment plants (WWTPs), and domestic sewage) were collected during winter, spring, and summer in 2018 and winter in 2021. Water and sediment samples were collected using a water tank and grab dredger, respectively. All samples were transported to the laboratory within 12 h. Water and sediment samples were preserved at 4 °C and −20 °C, respectively. Relevant information about the sampling sites is provided in Table S1.

2.2. Characterization of Sediment Grain Size Distribution

An S3500 laser particle size analyzer (Microtrac, Largo, FL, USA) was used to measure the sediment grain size distribution following the general guideline [17]. Pretreatment followed a previous study [18]. Briefly, sediment samples were first sieved through a 10-mesh sieve. Calgon (5% solution of sodium hexametaphosphate) was added to the samples. All measurements were performed in triplicate, and the value (D50) that was bigger than a half volume of the total particles was used as the representative sediment grain size. Sediment was classified into clay (<3.9 μm), fine silt (3.9–15.6 μm), coarse silt (15.6–63 μm), and sand (63–2000 μm) [19].

2.3. Characterization of DOM

Sediment samples were freeze-dried and passed through a 100-mesh sieve. Samples were shaken in Milli-Q water (1:10) for 24 h, and supernatants were filtered through a 0.45 μm polyvinylidene fluoride filter. Water samples were filtered through a 0.45 µm membrane. Absorbance spectra (200–800 nm) were obtained with a Cary 60 UV–Vis spectrophotometer (Agilent Technologies, Santa Clara, CA, USA). Fluorescence measurements were performed on an F-7000 fluorescence spectrometer (Hitachi, Tokyo, Japan) with a 150 W xenon arc lamp at 20 °C. Both excitation and emission scanning wavelengths ranged from 200 to 550 nm (5 nm intervals) with a scanning speed of 2400 nm/min. Milli-Q water served as a blank control. The inner-filter effect, disturbing effects of the 1st- and 2nd-order Raman scattering, and Rayleigh scattering were corrected [5,20]. All fluorescence measurements were normalized to Raman Units [21]. PARAFAC was conducted using the DOMFluor toolbox according to previous methods [22,23]. The optimal model was determined via residual analysis, and the model was validated through half splitting analysis and stochastic analyses. A (350) (m−1) was used to indicate the DOM quantity, defined as the absorbance equal to 2.303/r (r is the cuvette length (m)) [24]. The biological index (BIX) is the ratio of fluorescence intensity at Excitation/Emission = 310/380 nm to that at Excitation/Emission = 310/430 nm [25]. The fluorescence index (FI) is the ratio of fluorescence intensity at Excitation/Emission = 370/450 nm to that at Excitation/Emission = 370/500 nm [26]. The humification index (HIX) is the ratio of the integrated fluorescence intensities from 435 to 480 nm to the sum of the integrated fluorescence intensities over 300–345 nm and 435–480 nm at an excitation wavelength of 254 nm [27]. The fluorescence excitation–emission matrix (EEM) was divided into five regions named I to V [28].

2.4. Calculation of the Fluorescence Quotient (FQ)

The fluorescence quotient (FQ) was calculated to represent the fluorescence distribution between the sediment and water [29]. Briefly, the fluorescence intensity was normalized using Equation (1):
F = 0.01 + 0.99 × ( F F m i n ) F m a x F m i n
where F and F′ refer to the original and normalized fluorescence intensities, respectively. Fmax and Fmin represent the maximum and minimum value of the fluorescence EEM. The quotient (FQsediment:water) of the EEM between the sediment and water was calculated using Equation (2):
F Q s e d i m e n t : w a t e r = l o g 10 ( F s e d i m e n t F w a t e r )
The distribution of FQsediment:water in the fluorescence EEM indicates the distribution pattern of DOM between the sediment and water.

2.5. Measurement of Similarities of DOM (SD)

The similarity of DOM between water/sediment samples and potential sources was calculated using Equation (3):
S D = 1 s A s A m a x s E s E m a x N × 100 %
where sA denotes the fluorescence spectra in sediment or water samples; sA(max) denotes the maximum of the fluorescence intensity in the sediment or water samples; sE denotes the fluorescence spectra in the external sources; sE(max) denotes the maximum of the fluorescence intensity in the external sources; and N denotes the number of wavelength pairs in the fluorescence EEM.

2.6. Statistical Analyses

Statistical analyses were conducted using R version 3.6.0. The effects of sediment grain size on the distribution of DOM between the sediment and water were evaluated based on structural equation model (SEM) analysis with AMOS 26.0 software (SPSS, Chicago, IL, USA). SEMs were selected based on a non-significant chi-square test (p > 0.05), high goodness-of-fit index (GFI > 0.90), and comparative fit index (CFI > 0.90).

3. Results and Discussions

3.1. Characterization of Sediment Grain Size and PARAFAC Components

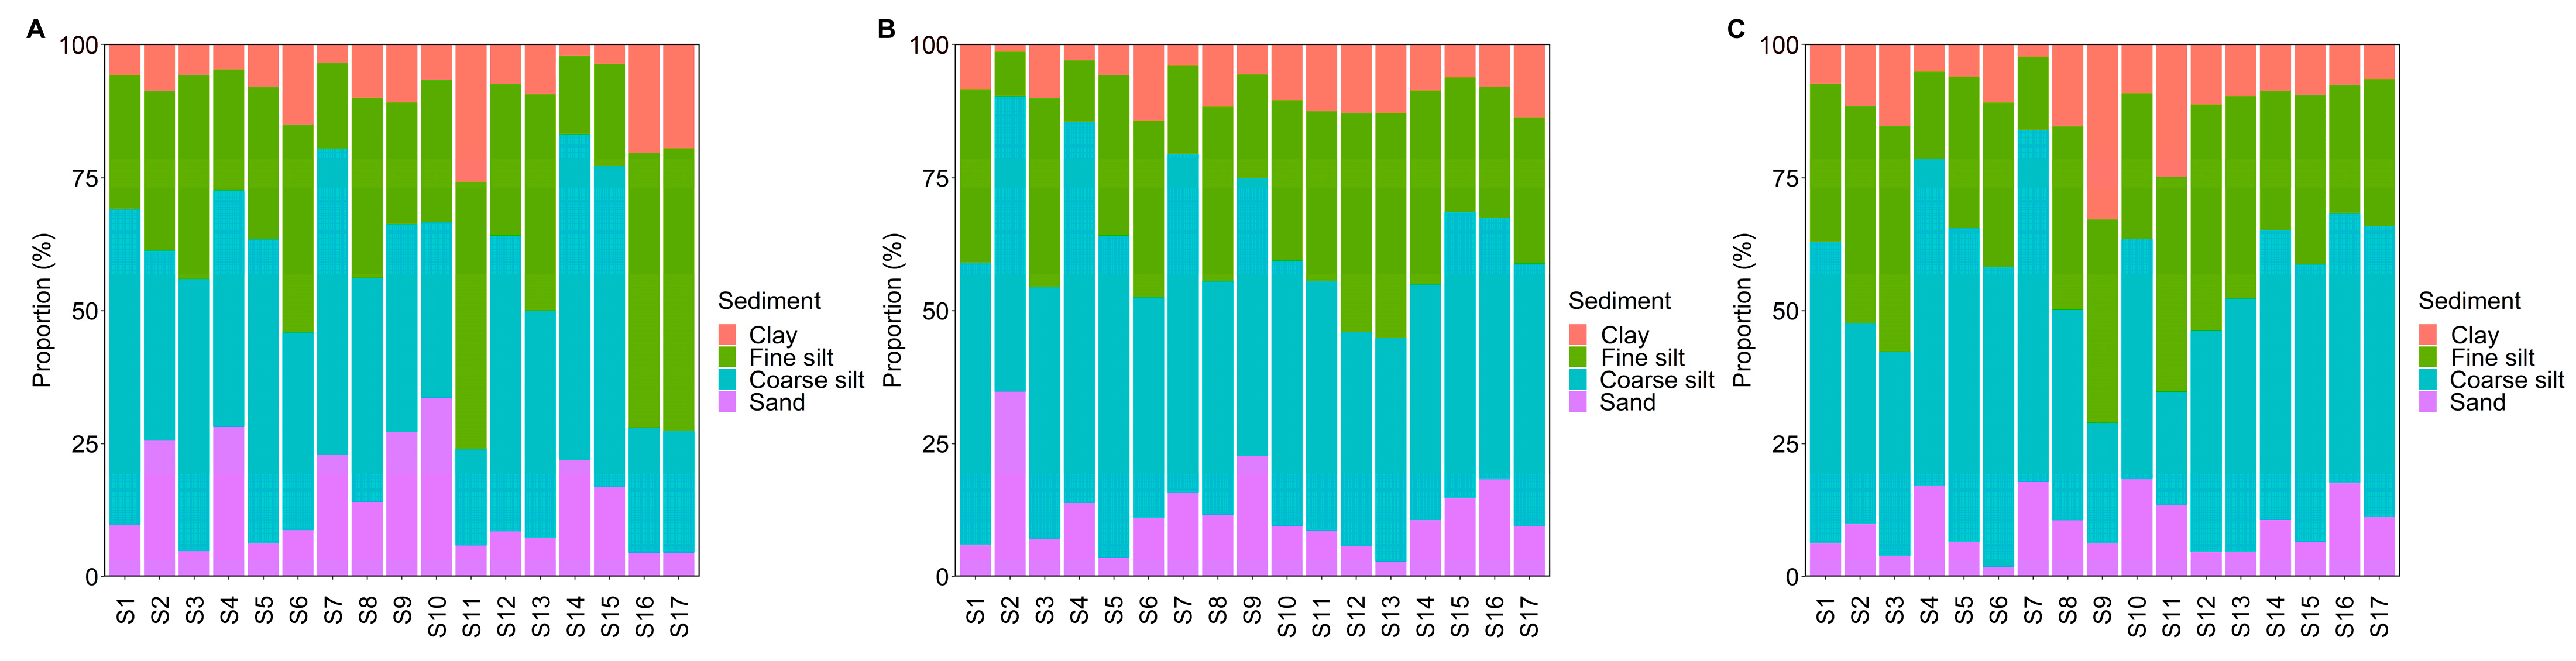
The most abundant sediment fractions were coarse silt (47.31% on average) and fine silt (30.55% on average), followed by sand (12.23% on average) and clay (9.91% on average) (Figure 2). The proportion of clay was significantly higher in the urban area than in the rural area (paired t-test, p < 0.05), which might be attributed to pollution sources in the urban area, such as WWTPs. The proportion of sand was significantly higher in summer than in winter (paired t-test, p < 0.05).
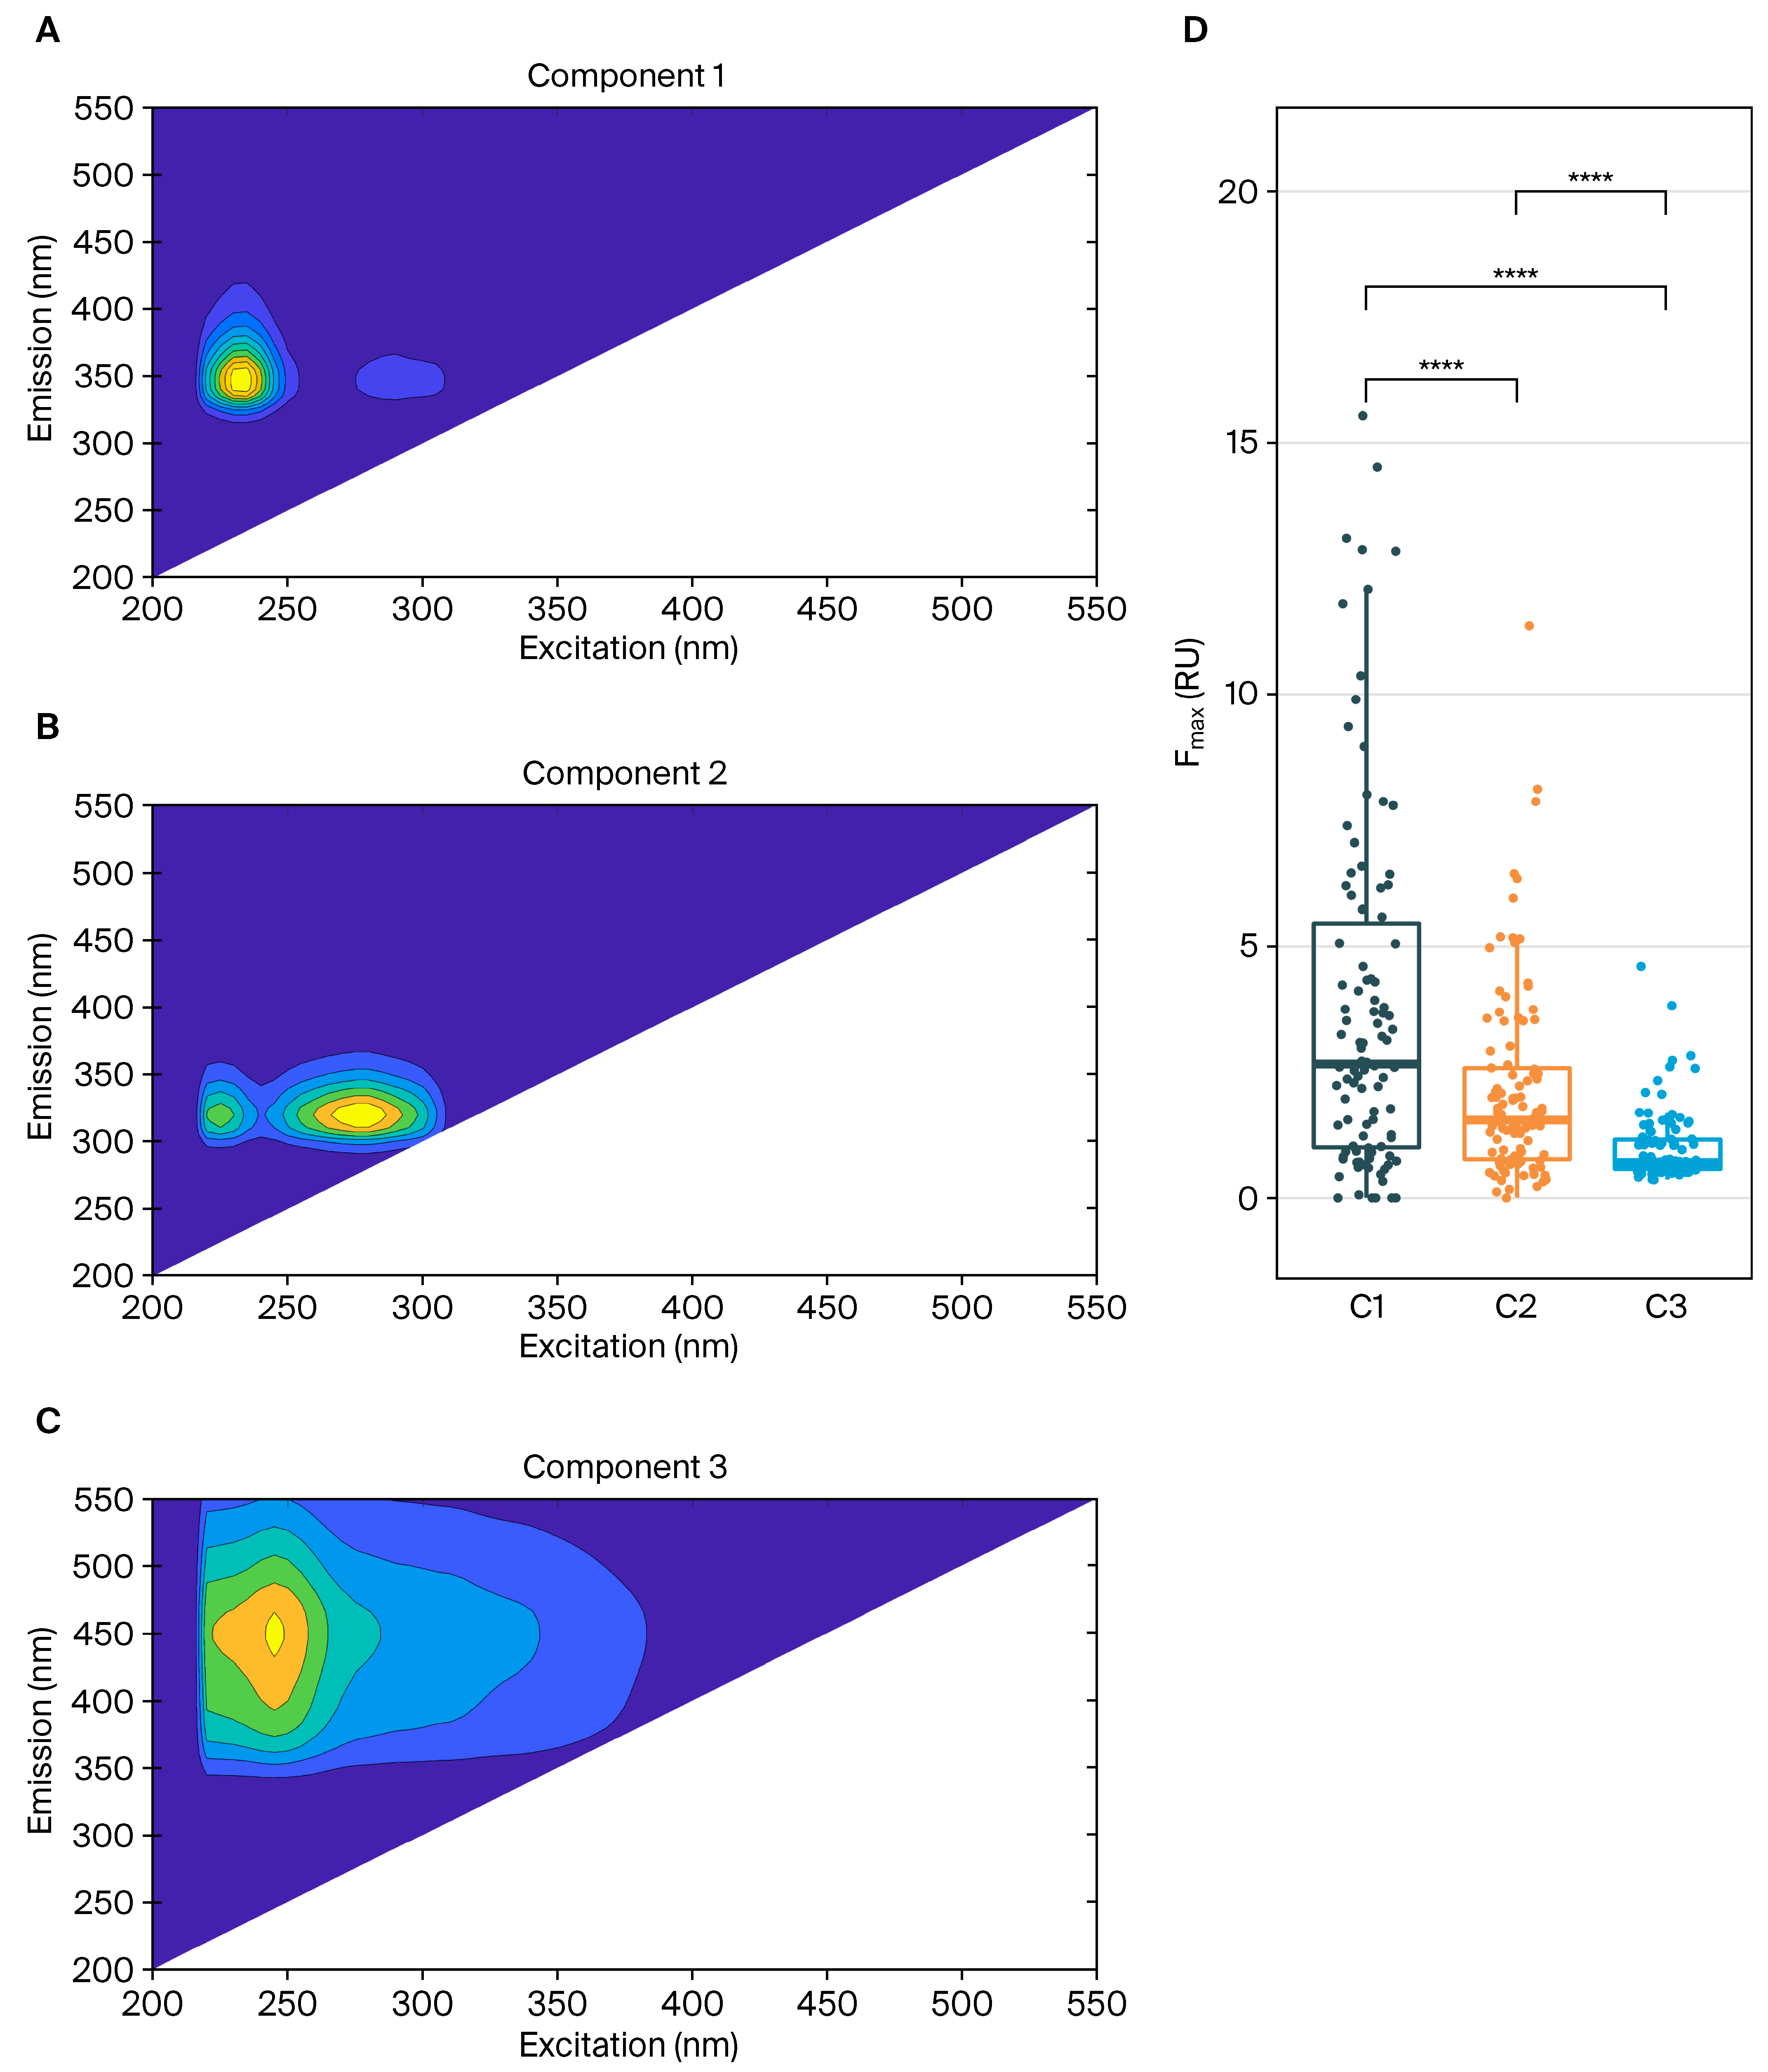
A three-component PARAFAC model was obtained (Figure 3A–C). Component 1 (C1) showed two peaks at Excitation/Emission of 230 (290)/350 nm and was assigned to the tryptophan-like component [30,31]. Component 2 (C2), with Excitation/Emission peaks at 275 (225)/320 nm, was characterized as the tyrosine-like component [31,32]. Component 3 (C3) with Excitation/Emission of 245/450 nm was characterized as the terrestrial humic-like component [33,34]. C1 was the most abundant PARAFAC component, followed by C2 and C3 (paired t-test, p < 0.05) (Figure 3D). The results indicated that DOM was mainly composed of tryptophan-like and tyrosine-like materials in the water environment.

3.2. Spatial–Temporal Distribution and Source of DOM in the Sediment

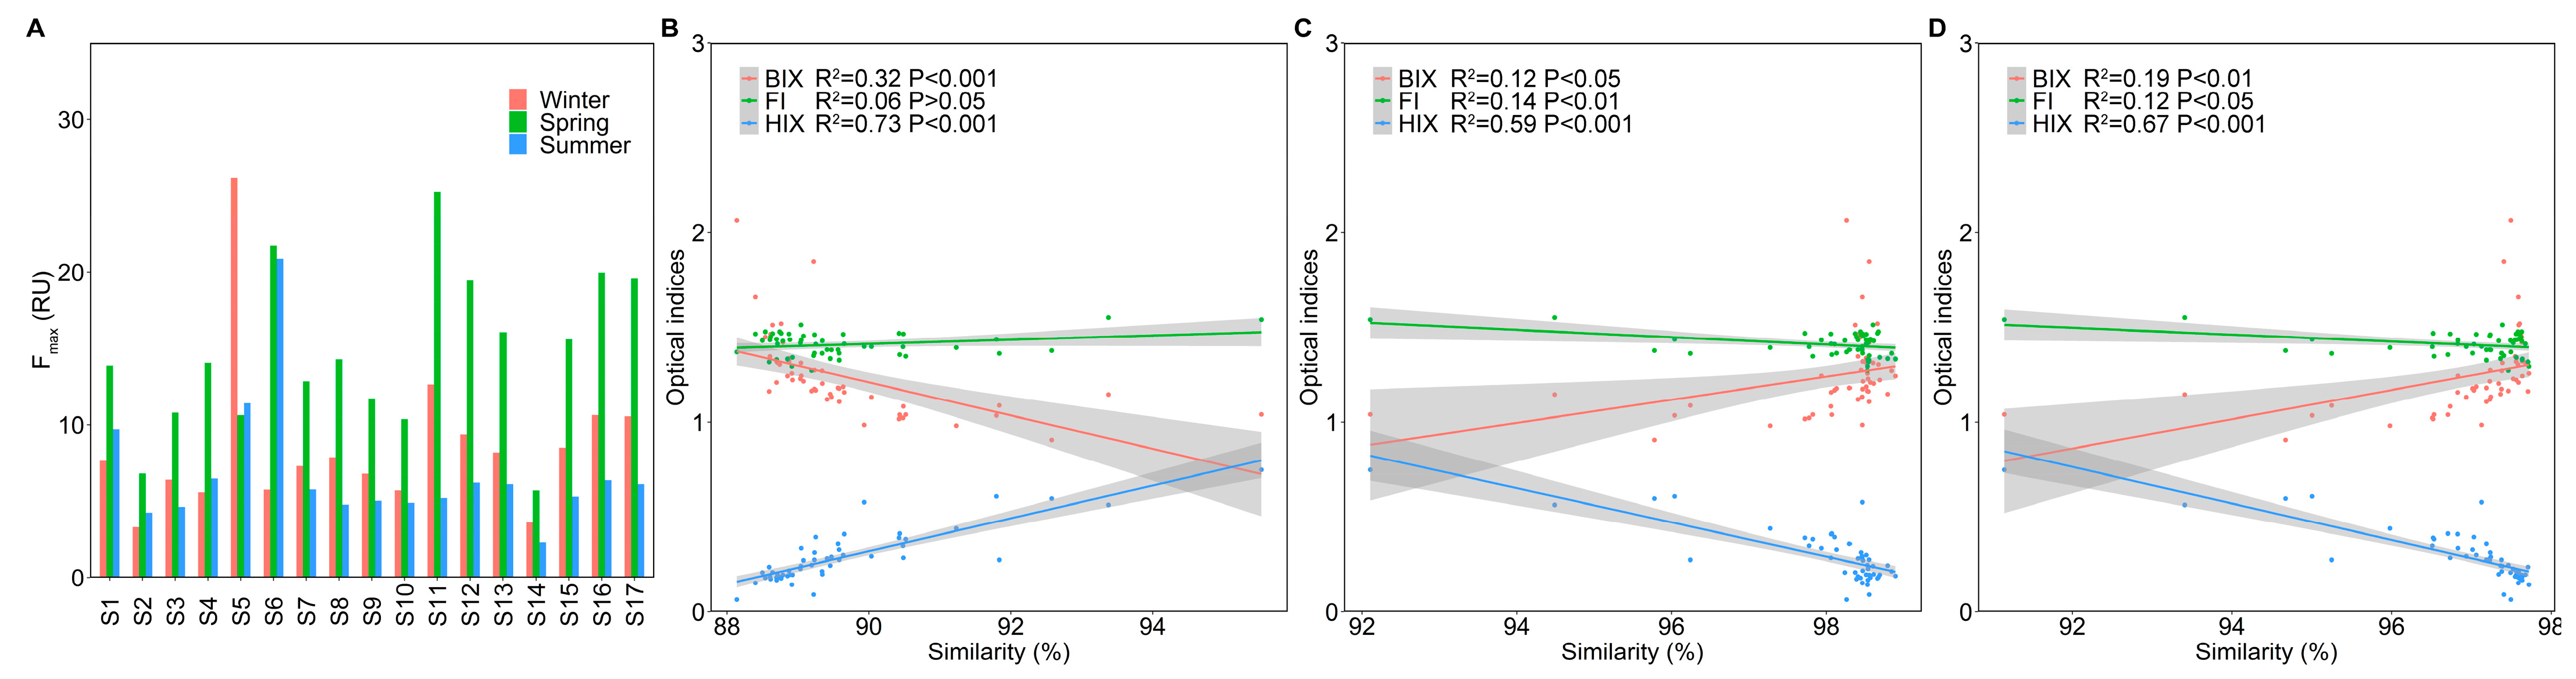
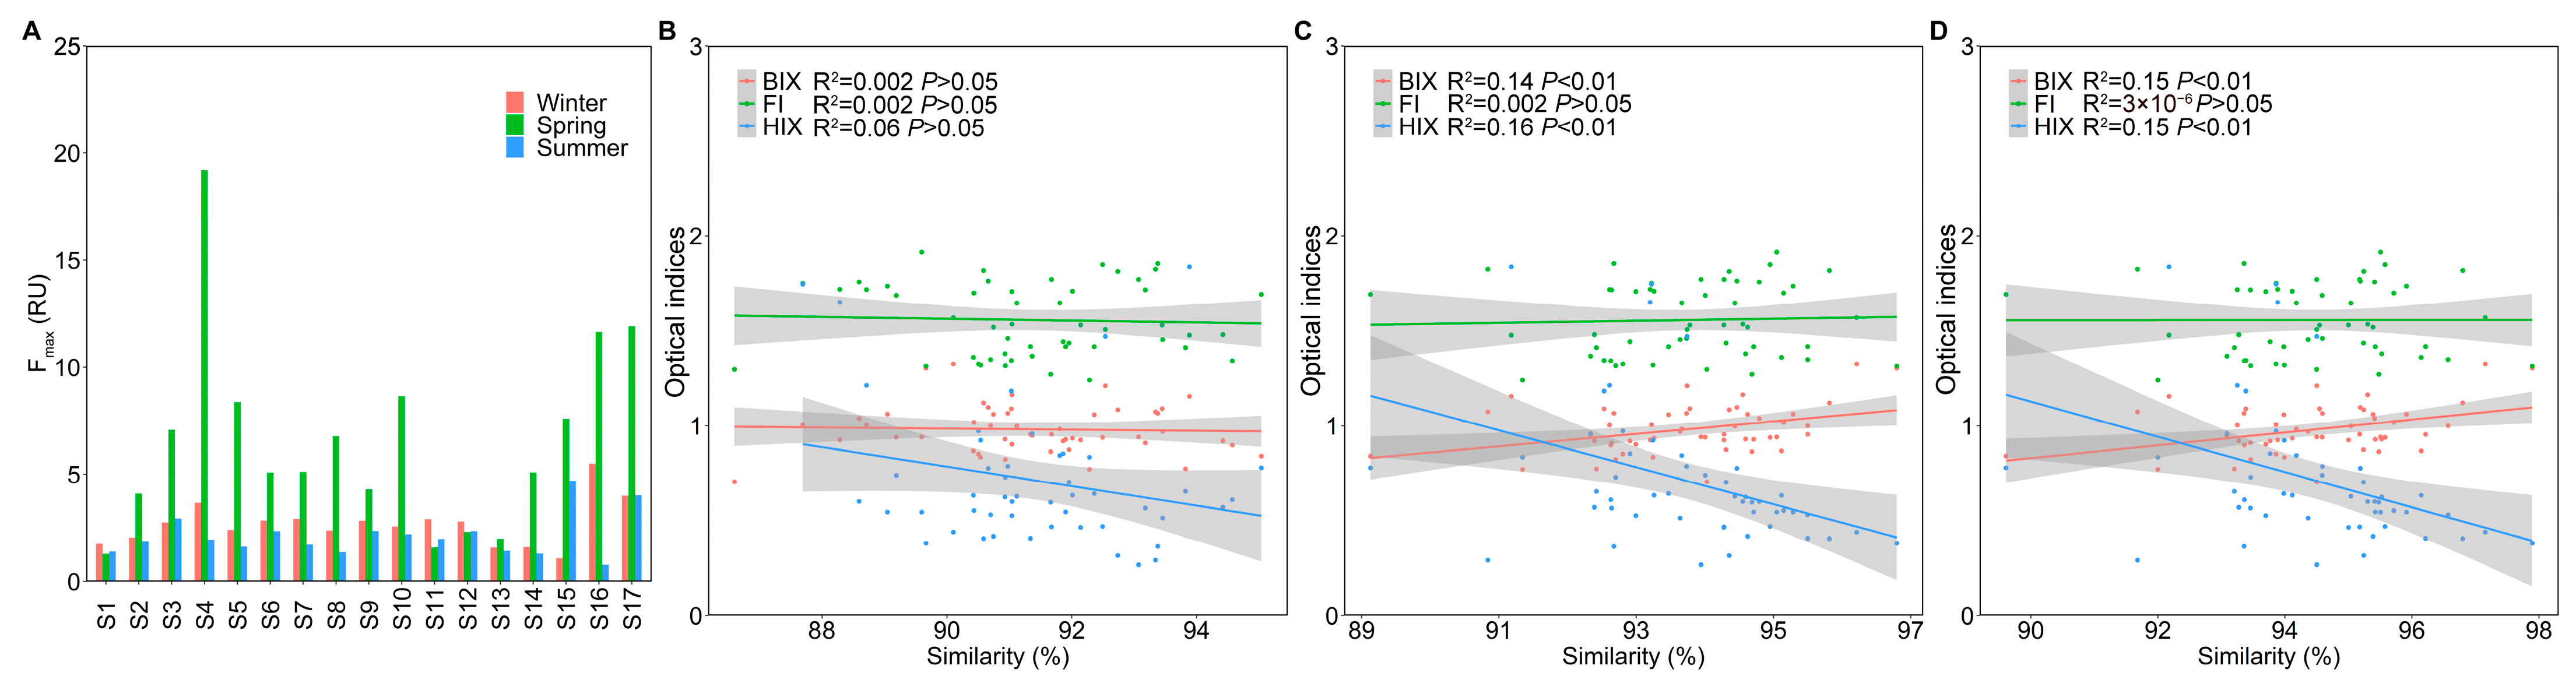
No significant differences in the sum of Fmax between rural and urban areas were observed (Wilcoxon rank sum test, p > 0.05) (Figure 4A). A (350) ranged from 6.78 to 596.12 and did not significantly differ between rural and urban areas (Wilcoxon rank sum test, p > 0.05). C1 and C3 were positively correlated with clay in winter (Pearson, p < 0.05) (Table S2). C1 was positively correlated with coarse silt in spring (Pearson, p < 0.01) (Table S2), suggesting that a higher Fmax value in spring could be related to the higher proportion of coarse silt. BIX ranged from 0.71 to 1.33, with a mean value of 0.98, indicating that DOM originated from multiple sources. FI ranged from 1.24 to 1.91, indicating that DOM was derived from both terrestrial and microbial sources. BIX and FI were significantly lower in spring than in summer and winter (paired t-test, p < 0.05). HIX ranged from 0.29 to 8.65 and did not show significant seasonal differences (Wilcoxon rank sum test, p > 0.05).
The fluorescence spectra of aquaculture, WWTPs, and domestic sewage are shown in Figure S1. The average similarity of DOM between sediments and WWTPs was 94.49% (highest), followed by 93.74% between sediments and domestic sewage and 91.39% between sediments and aquaculture. The highest similarity of DOM between sediments and aquaculture occurred at S2 in summer (Figure 4B), while the highest similarity of DOM between sediments and aquaculture/domestic sewage occurred at S4 in summer (Figure 4C,D). Linear regression results indicated that aquaculture had little effect on the optical indices. BIX decreased with an increasing similarity of DOM between the sediment and WWTPs or domestic sewage, indicating that sediment could shield DOM from anthropogenic sources. Consistent with the water, HIX was linearly correlated with the similarity of DOM between sediments and WWTPs or domestic sewage. The results indicated that human activities largely influenced the humification degree of DOM in the aquatic environment. Additionally, the similarity of DOM between sediments and aquaculture was negatively correlated with coarse silt (Pearson, p < 0.05). The coarse sediment grain with a large specific surface area provides fewer adsorption sites for organic matter, therefore affecting the storage of organic matter from external sources in the sediment.

3.3. Spatial–Temporal Distribution and Source of DOM in the Water

The sum of Fmax did not show significant differences between rural and urban areas (Figure 5A). A (350) ranged from 2.17 to 125.19. Consistent with the sediment, A (350) in the water did not significantly differ between rural and urban areas (Wilcoxon rank sum test, p > 0.05). In spring, C2 was significantly higher in urban areas than in rural areas (Wilcoxon rank sum test, p < 0.05), indicating that human activities promoted the occurrence of the tyrosine-like component. However, no significant seasonal variation in DOM was observed in rural areas (paired t-test, p > 0.05). BIX ranged from 0.91 to 2.06, indicating that the majority of DOM originated from autochthonous sources. BIX was significantly lower in summer than in spring and winter (paired t-test, p < 0.05). The possible reason for this could be that the wet season promoted terrestrial input and inhibited the autochthonous origin. FI ranged from 1.30 to 1.54, suggesting that DOM exhibited a terrestrial signature. FI was significantly higher in winter than in spring and summer (paired t-test, p < 0.05), suggesting that the wet season promoted terrestrial input of organic matter. HIX ranged from 0.06 to 0.75 and was highest in summer, followed by spring and winter (paired t-test, p < 0.05), indicating that terrestrial input increased the humification degree of DOM. The spatial variations in BIX, FI, and HIX were not significant (Wilcoxon rank sum test, p > 0.05).
The average similarity of DOM was highest between water and WWTPs (98.04%), followed by between water and sewage wastewater (96.95%) and between water and aquaculture (89.63%). The results indicated that WWTPs and domestic sewage could be important sources of DOM in surface water. The highest similarity of DOM between water and WWTPs was present in urban areas, while the highest similarity of DOM between water and domestic sewage occurred in rural areas. The results demonstrated that WWTPs and domestic sewage largely influenced the occurrence of DOM between urban and rural areas, respectively. The similarity of DOM was significantly lower between water and aquaculture than that between sediment and aquaculture (paired t-test, p < 0.01). Nevertheless, the highest similarity of DOM between water and aquaculture occurred in rural areas, suggesting that aquaculture might exert noticeable impacts on DOM in rural areas. Linear regression results indicated a strong relationship between optical indices and similarity. BIX decreased with the increasing similarity of DOM between water and aquaculture (Figure 5B), reflecting that aquaculture enhanced allochthonous origins of DOM in the water. Conversely, BIX increased with the increasing similarity of DOM between water and WWTPs or domestic sewage (Figure 5C,D), indicating that WWTPs and domestic sewage promoted the recent autochthonous production of DOM in the waters. FI decreased with the increasing similarity of DOM between water and WWTPs or domestic sewage, indicating that WWTPs and domestic sewage promoted terrestrial origins of DOM in the water. Additionally, HIX was linearly correlated with the similarity of DOM between water and aquaculture/WWTPs/domestic sewage.

3.4. The Multi-Media Distribution Patterns of DOM in the Water Environment

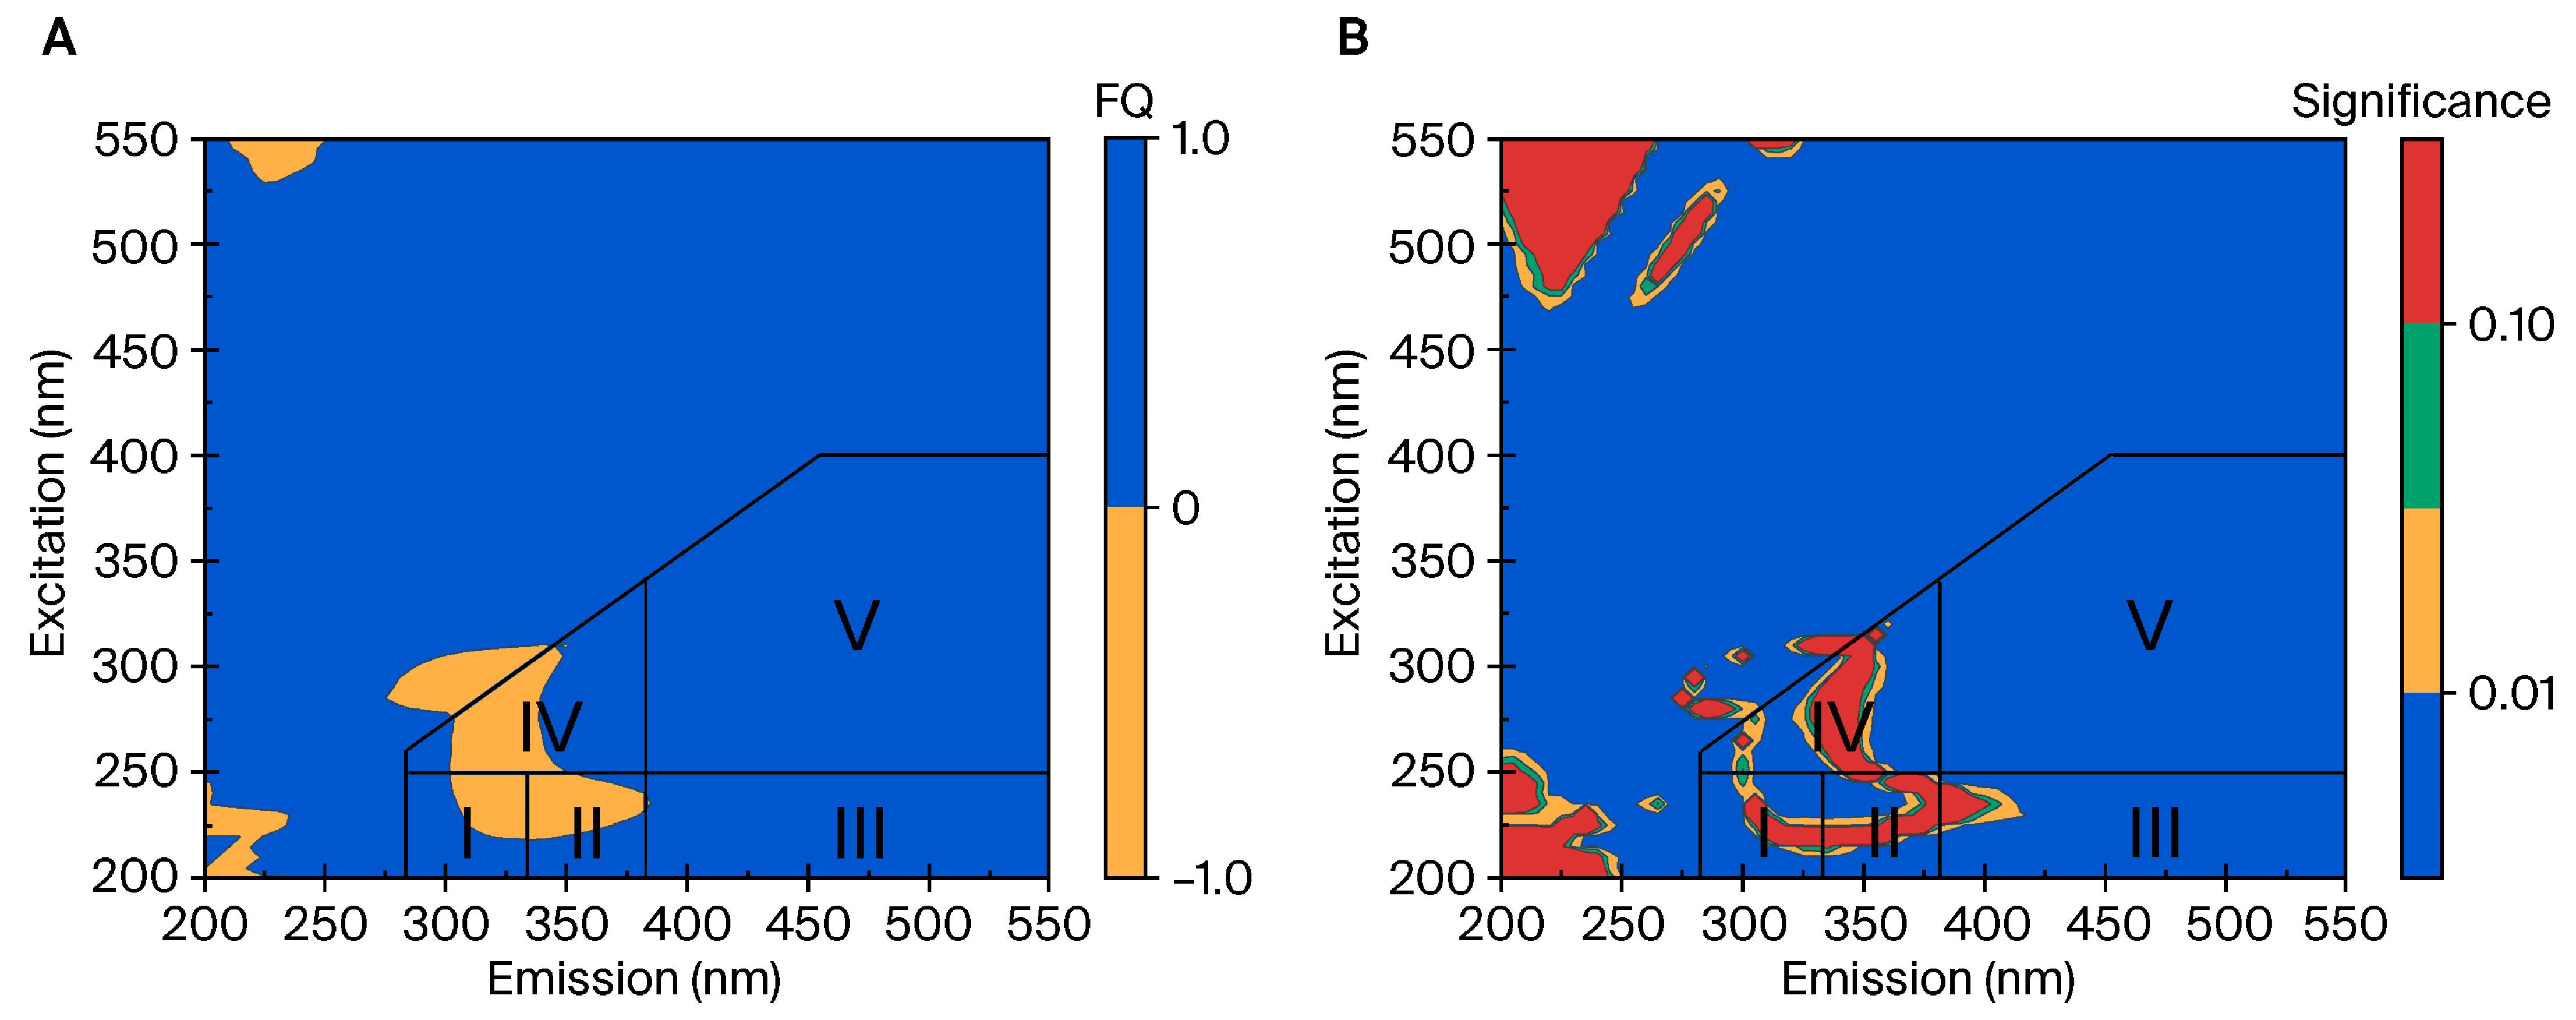
The results of the pairwise FQs between sediment and water are shown in Figure 6A. The regions comprised positive and negative FQs, indicating that the distribution of DOM between sediment and water had a corresponding fingerprint aligned with fluorescence regions. The figure was mainly composed of positive FQ values, reflecting a tendency for in situ enrichment in the sediment or migration behavior. This is consistent with the higher abundance of DOM in the sediment than in the water (Figure S2). A negative sediment:water value indicated a lower relative content of organic matter in the sediment compared with the water. Negative sediment:water points concentrated in fluorescence regions I, II, and IV, which were representative of amino-acid-like materials and microbial byproducts [28]. Positive sediment:water FQ points concentrated in fluorescence regions III and V, representing humic-like and fulvic-like materials [28].
Paired t-test was employed to determine whether the FQ values were statistically significant. The regions identified as significant (in yellow and blue) in Figure 6B generally align with the positive and negative FQ regions in Figure 6A. Negative regions in Figure 6A suggest that amino-acid-like materials and microbial byproducts could be reduced in the sediment or enriched in the water. The in situ production of amino-acid-like materials was supported by the relatively higher autochthonous DOM production in the water than in the sediment (Figure S3A). In contrast, humic substances are more biologically recalcitrant compared with protein-like materials, so the positive regions in Figure 6A could reflect the deposition of humic-like and fulvic-like materials in the sediment. This is supported by the higher humification degree of DOM in the sediment compared with the water (Figure S3B).

3.5. Impact of Sediment Grain Size on the Multi-Media Distribution of DOM

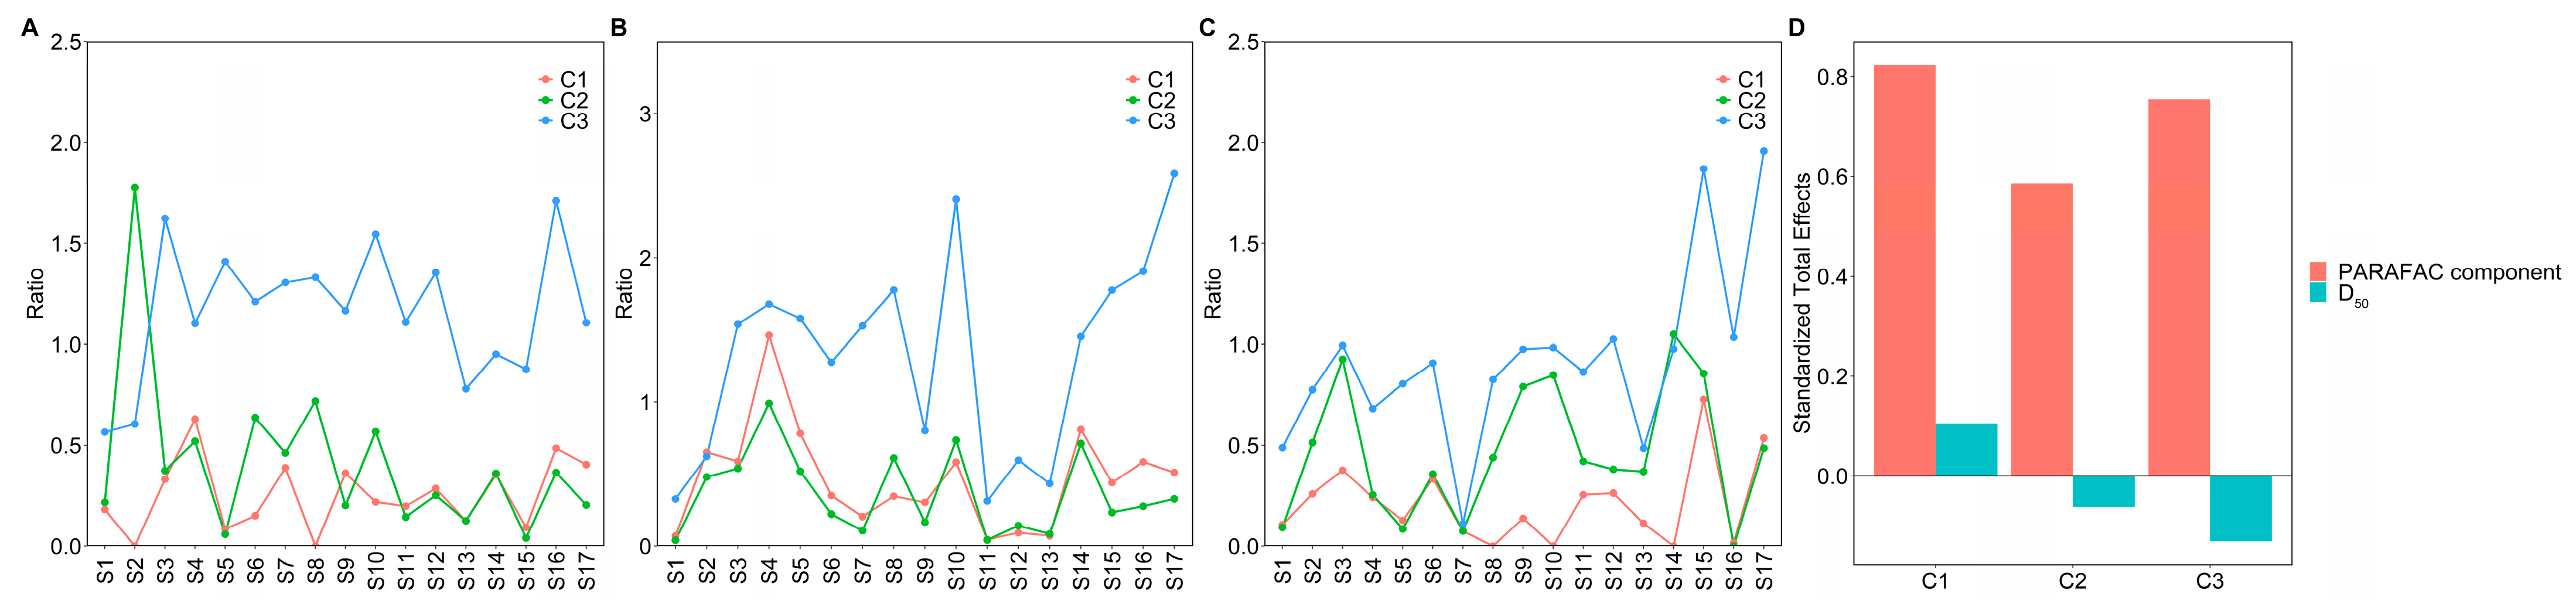
The ratios of DOM in the sediment to those in the water are shown in Figure 7A–C. Consistent with the FQs, most ratios for C1 and C2 were below 1.0, while many ratios for C3 exceeded 1.0. In spring, the ratios of C1 were negatively related to clay (Pearson, p < 0.05) and positively correlated with coarse silt (Pearson, p < 0.05). SEM analysis was performed to assess the impact of the sediment grain size on the multi-media distribution patterns of DOM (Figure S4A–C). The SEM assumptions posited that sediment grains and DOM could exert potential effects on the multi-media distribution of DOM. The results showed that DOM in the sediment was the major driver of the distribution of DOM between sediment and water (Figure 7D). D50 exerted positive effects on the distribution of C1 between the sediment and water (Figure 7D). This was consistent with the negative relationships between clay and the sediment-to-water ratios of C1 and the positive relationships between coarse silt and these ratios in spring. Considering the positive correlations of clay with C1 in the sediment in winter, clay could be related to the enrichment of C1 in the water. This is supported by the more pronounced microbial signature of DOM in the sediment relative to the water (Figure S3C). The abundant coarse silt might influence the distribution of C1 between sediment and water by affecting the production of tryptophan-like materials in the sediment. Meanwhile, D50 exerted negative effects on the distribution of C3 between sediment and water (Figure 7D). Fine sediment grain could influence the distribution of C3 between sediment and water by affecting the multi-media environmental behavior of humic-like and fulvic-like materials.

4. Discussion

The sediment composition in the East Taihu Lake Basin resembles that in the Tully River and Yellowknife area lakes of other continents, in which sediment is dominated by silt-sized grains [18,35]. Sediment grain showed clear spatial–temporal patterns. The spatial variation in clay aligns with a previous study showing an increased clay fraction in sediment under human disturbance [36]. The temporal variation in sand might reflect hydraulic erosion during the wet season; clay and silt are easily transported, while sand tends to deposit [37].
Sediment can promote the occurrence of DOM by providing adsorption points or by enhancing biological sources, while external sources can directly input DOM into the water. The DOM composition in the water environment is consistent with that in the Taihu Lake [31], but different from that in the Altamaha River watershed [38]. In sediment, the sum of Fmax was significantly higher in spring than in winter and summer (paired t-test, p < 0.05), and the seasonal variation in DOM aligns with observation in Jinze water sources [4]. Clay can adsorb organic matter, and organic carbon is preferentially associated with fine-grained sediment [39]. Optical indices (i.e., HIX) of DOM are consistent with those reported for inland sediment [9]. The occurrence of DOM in sediment can be influenced by terrestrial organic matter [40]. In summer (i.e., wet season), the terrestrial inputs from runoff can contribute to the spatial variations in the similarity of DOM between sediment and human sources. Additionally, the abundance of DOM in the water is comparable to that in the Taihu Lake [31]. The sum of Fmax in the urban area was significantly higher in spring and winter than in summer (paired t-test, p < 0.05), and seasonal variation in DOM may be attributed to short water residence time during the wet season [41]. The optical index (i.e., HIX) is lower than that reported for the Yichang River watershed and cold-temperate forest ecosystems [42,43]. Moreover, water and WWTPs/domestic sewage exhibited a high similarity of fluorescence spectra [44], which was even higher than that between sediment and WWTPs/domestic sewage (paired t-test, p < 0.01). External sources directly influence the occurrence of DOM in the water rather than in the sediment. Additionally, nutrient input may promote the growth of aquatic organisms (e.g., phytoplankton), leading to in situ production of DOM [45].
The occurrence and multi-media environmental behavior of DOM could be related to the sediment grain size in the water environment. Coarse silt was the dominant sediment fraction, while clay was the minority. Coarse silt could provide microorganisms with attachment sites [15], supporting microbial origins of organic matter and positive correlations of coarse silt with C1 in the sediment in winter and spring. Fine-grained sediment (e.g., clay) could adsorb humic substances [46], which is consistent with the significant correlations of clay with C3 in the sediment in winter. Moreover, the sediment-to-water ratios of C1 were generally lower than those of C3, and D50 exerted differential effects on the multi-media distribution of C1 and C3. Therefore, the distribution patterns of DOM between sediment and water are related to the sediment grain size. In addition to in situ changes in DOM in sediment, the migration of DOM between sediment and overlying water can alter the multi-media distribution patterns of DOM. Sediment resuspension can be driven by hydrodynamic changes caused by wind-wave disturbance in shallow rivers and lakes, while hydrodynamic variability across hydrological periods can enhance the migration of DOM between sediment and water. The release of amino-acid-like materials from coarse sediments may contribute to DOM in water, while adsorption of humic substances on clay can facilitate the accumulation of DOM in sediment.

5. Conclusions

In this study, we evaluated the multi-media distribution patterns and sources of DOM in a human-intensive watershed. Coarse silt was the main sediment grain in the rivers and lakes. The tryptophan-like component could show significant correlations with clay and coarse silt in the sediment. WWTP and domestic sewage enhance allochthonous origins of sediment DOM. The negative correlation between the similarity of DOM between sediments and aquaculture with coarse silt indicates that sediment grain could influence the source contribution of sediment DOM. A significant difference in the tyrosine-like component between rural and urban areas was observed in the water in spring, and WWTPs and domestic sewage promoted terrestrial sources of DOM in the water. FQ patterns for amino-acid-like and protein-like materials differed from those of humic-like and fulvic-like materials, suggesting that humic-like and fulvic-like materials are more prone to enrichment in sediment compared with amino-acid-like and protein-like materials. The ratios of the tryptophan-like component in sediment relative to water were correlated with clay and coarse silt. Sediment grain size exerted contrary effects on the multi-media distribution of the tryptophan-like component and humic-like component. Hence, the distribution of DOM between sediment and water could be influenced not only by DOM in the sediment but also by sediment grain size, highlighting the impact of sediment grain size on the migration behavior of DOM in the aquatic environment.

Supplementary Materials

The following supporting information can be downloaded at: https://www.mdpi.com/article/10.3390/w18151851/s1, Figure S1: Fluorescence spectra of typical pollution sources (A: aquaculture; B: WWTP; C: domestic sewage) in the East Taihu Lake Basin; Figure S2: A (350) in the East Taihu Lake Basin; Figure S3: Optical indices including (A) BIX, (B) HIX, and (C) FI between the water and sediment in the East Taihu Lake Basin; Figure S4: Structural equation model (SEM) analyses showing the effects of sediment grain size on the multi-media distribution of (A) C1, (B) C2, and (C) C3. Size refers to D50; C1, C2, and C3 refer to component 1, component 2, and component 3, respectively. Ratio refers to the ratios of PARAFAC components in the sediment to the water. (*: p < 0.05, **: p < 0.01, ***: p < 0.001); Table S1: Information about the sampling sites; Table S2: Pearson correlations of sediment particles with PARAFAC components.

Author Contributions

Conceptualization, methodology, software, investigation, writing—original draft preparation, funding acquisition, Y.Z.; methodology, investigation, funding acquisition, project administration, writing—review and editing, B.Z. All authors have read and agreed to the published version of the manuscript.

Funding

This research was supported by Zhejiang Provincial Natural Science Foundation of China under Grant No. LQN26D030004 and Ningxia Key Research and Development Program (2025BEG02019).

Data Availability Statement

The data are not publicly available due to privacy or ethical restrictions.

Acknowledgments

Hanxin Wang was acknowledged for the support in sampling.

Conflicts of Interest

The authors declare no conflicts of interest.

Abbreviations

The following abbreviations are used in this manuscript:
DOMDissolved organic matter
PARAFACParallel factor analysis
WWTPWastewater treatment plant
D50Sediment grain size that is bigger than a half volume of the total particles
C1Component 1
C2Component 2
C3Component 3
BIXBiological index
FIFluorescence index
HIXHumification index
EEMExcitation–emission matrix
FQFluorescence quotient
SDSimilarity of DOM
SEMStructural equation model
GFIHigh goodness-of-fit index
CFIComparative fit index

References

  1. Kim, M.S.; Lim, B.R.; Jeon, P.; Hong, S.; Jeon, D.; Park, S.Y.; Hong, S.; Yoo, E.J.; Kim, H.S.; Shin, S.; et al. Innovative approach to reveal source contribution of dissolved organic matter in a complex river watershed using end-member mixing analysis based on spectroscopic proxies and multi-isotopes. Water Res. 2023, 230, 119470. [Google Scholar] [CrossRef] [PubMed]
  2. Huang, Z.; Liao, H.; Ji, M.; Luo, Y.; Yang, F.; Liu, D.; Zhong, Y.; Feng, D.; Jiang, W.; Shi, Y.; et al. Spatiotemporal Distribution of Chlorophyll-a and Dissolved Organic Matter in Ganjiang River Estuary of Lake Poyang. Water 2026, 18, 1160. [Google Scholar] [CrossRef]
  3. Horvath, J.J.; Glazier, S.A. Fluorescence Measurement of Tetracycline in Model Fermentation Media Samples Containing Streptomyces aureofaciens Cell Mass. Appl. Spectrosc. 1996, 50, 327–333. [Google Scholar] [CrossRef]
  4. Zhang, Y.; Zhang, B.; He, Y.; Lev, O.; Yu, G.; Shen, G.; Hu, S. DOM as an indicator of occurrence and risks of antibiotics in a city-river-reservoir system with multiple pollution sources. Sci. Total Environ. 2019, 686, 276–289. [Google Scholar] [CrossRef] [PubMed]
  5. Lee, M.H.; Ok, Y.S.; Hur, J. Dynamic variations in dissolved organic matter and the precursors of disinfection by-products leached from biochars: Leaching experiments simulating intermittent rain events. Environ. Pollut. 2018, 242, 1912–1920. [Google Scholar] [CrossRef] [PubMed]
  6. Zhang, F.R.; Han, W.X.; Sun, X.; Wang, Z.D.; Zhang, L.; Shen, Q.S.; Lan, H.J.; Chen, B.F.; Yin, H.B.; Liu, C. Organic matter cycling reveals escalating algal blooms and accelerated mineralization in a macrophyte-dominated cold-arid eutrophic lake. Water Res. 2026, 290, 125128. [Google Scholar] [CrossRef] [PubMed]
  7. Li, Y.; Wang, S.; Zhang, L.; Zhao, H.; Jiao, L.; Zhao, Y.; He, X. Composition and spectroscopic characteristics of dissolved organic matter extracted from the sediment of Erhai Lake in China. J. Soils Sediments 2014, 14, 1599–1611. [Google Scholar] [CrossRef]
  8. He, W.; Lee, J.-H.; Hur, J. Anthropogenic signature of sediment organic matter probed by UV-Visible and fluorescence spectroscopy and the association with heavy metal enrichment. Chemosphere 2016, 150, 184–193. [Google Scholar] [CrossRef] [PubMed]
  9. Chen, M.; Hur, J. Pre-treatments, characteristics, and biogeochemical dynamics of dissolved organic matter in sediments: A review. Water Res. 2015, 79, 10–25. [Google Scholar] [CrossRef] [PubMed]
  10. Wu, Y.; Li, Y.; Lv, J.; Xi, B.; Zhang, L.; Yang, T.; Li, G.; Li, C.; Liu, H. Influence of sediment DOM on environmental factors in shallow eutrophic lakes in the middle reaches of the Yangtze River in China. Environ. Earth Sci. 2017, 76, 142. [Google Scholar] [CrossRef]
  11. Hou, C.Y.; Yi, Y.J.; Song, J.; Zhou, Y. Effect of water-sediment regulation operation on sediment grain size and nutrient content in the lower Yellow River. J. Clean. Prod. 2021, 279, 123533. [Google Scholar] [CrossRef]
  12. Duan, Z.P.; Tan, X.; Ali, I.; Wu, X.G.; Cao, J.; Xu, Y.X.; Shi, L.; Gao, W.P.; Ruan, Y.L.; Chen, C. Comparison of organic matter (OM) pools in water, suspended particulate matter, and sediments in eutrophic Lake Taihu, China: Implication for dissolved OM tracking, assessment, and management. Sci. Total Environ. 2022, 845, 157257. [Google Scholar] [CrossRef] [PubMed]
  13. De Falco, G.; Magni, P.; Teräsvuori, L.M.H.; Matteucci, G. Sediment grain size and organic carbon distribution in the Cabras lagoon (Sardinia, Western Mediterranean). Chem. Ecol. 2004, 20, S367–S377. [Google Scholar] [CrossRef]
  14. Veerasingam, S.; Venkatachalapathy, R.; Ramkumar, T. Distribution of clay minerals in marine sediments off Chennai, Bay of Bengal, India: Indicators of sediment sources and transport processes. Int. J. Sediment Res. 2014, 29, 11–23. [Google Scholar] [CrossRef]
  15. Feng, Y.; Zhao, Y.; Wu, X.; Pan, J.; Zhu, G.; Liu, S. Adjustable microbial cross-feedings adapt to landforms in the Yangtze River. Water Ecol. 2025, 1, 100004. [Google Scholar] [CrossRef]
  16. Tang, J.; Wang, W.; Yang, L.; Qiu, Q.; Lin, M.; Cao, C.; Li, X. Seasonal variation and ecological risk assessment of dissolved organic matter in a peri-urban critical zone observatory watershed. Sci. Total Environ. 2020, 707, 136093. [Google Scholar] [CrossRef] [PubMed]
  17. ISO 13320:2020; Particle Size Analysis—Laser Diffraction Methods. ISO: Geneva, Switzerland, 2020.
  18. Bainbridge, Z.; Lewis, S.; Stevens, T.; Petus, C.; Lazarus, E.; Gorman, J.; Smithers, S. Measuring sediment grain size across the catchment to reef continuum: Improved methods and environmental insights. Mar. Pollut. Bull. 2021, 168, 112339. [Google Scholar] [CrossRef] [PubMed]
  19. Leeder, M.R. Sedimentology: Process and Product; Chapman and Hall: London, UK, 1982. [Google Scholar]
  20. Bahram, M.; Bro, R.; Stedmon, C.; Afkhami, A. Handling of Rayleigh and Raman scatter for PARAFAC modeling of fluorescence data using interpolation. J. Chemom. 2006, 20, 99–105. [Google Scholar] [CrossRef]
  21. Murphy, K.R.; Butler, K.D.; Spencer, R.G.M.; Stedmon, C.A.; Boehme, J.R.; Aiken, G.R. Measurement of Dissolved Organic Matter Fluorescence in Aquatic Environments: An Interlaboratory Comparison. Environ. Sci. Technol. 2010, 44, 9405–9412. [Google Scholar] [CrossRef] [PubMed]
  22. Stedmon, C.A.; Bro, R. Characterizing dissolved organic matter fluorescence with parallel factor analysis: A tutorial. Limnol. Oceanogr. Methods 2008, 6, 572–579. [Google Scholar] [CrossRef]
  23. Zhang, Y.P.; Shen, G.X.; Hu, S.Q.; He, Y.L.; Li, P.; Zhang, B. Deciphering of antibiotic resistance genes (ARGs) and potential abiotic indicators for the emergence of ARGs in an interconnected lake-river-reservoir system. J. Hazard. Mater. 2021, 410, 124532. [Google Scholar] [CrossRef]
  24. Yamashita, Y.; Scinto, L.J.; Maie, N.; Jaffe, R. Dissolved organic matter characteristics across a subtropical wetland’s landscape: Application of optical properties in the assessment of environmental dynamics. Ecosystems 2010, 13, 1006–1019. [Google Scholar] [CrossRef]
  25. Huguet, A.; Vacher, L.; Relexans, S.; Saubusse, S.; Froidefond, J.M.; Parlanti, E. Properties of fluorescent dissolved organic matter in the Gironde Estuary. Org. Geochem. 2009, 40, 706–719. [Google Scholar] [CrossRef]
  26. McKnight, D.M.; Boyer, E.W.; Westerhoff, P.K.; Doran, P.T.; Kulbe, T.; Andersen, D.T. Spectrofluorometric characterization of dissolved organic matter for indication of precursor organic material and aromaticity. Limnol. Oceanogr. 2001, 46, 38–48. [Google Scholar] [CrossRef]
  27. Ohno, T. Fluorescence inner-filtering correction for determining the humification index of dissolved organic matter. Environ. Sci. Technol. 2002, 36, 742–746. [Google Scholar] [CrossRef] [PubMed]
  28. Chen, W.; Westerhoff, P.; Leenheer, J.A.; Booksh, K. Fluorescence excitation—Emission matrix regional integration to quantify spectra for dissolved organic matter. Environ. Sci. Technol. 2003, 37, 5701–5710. [Google Scholar] [CrossRef] [PubMed]
  29. Xiao, K.; Liang, S.; Xiao, A.; Lei, T.; Tan, J.; Wang, X.; Huang, X. Fluorescence quotient of excitation–emission matrices as a potential indicator of organic matter behavior in membrane bioreactors. Environ. Sci. Water Res. Technol. 2018, 4, 281–290. [Google Scholar] [CrossRef]
  30. Zhou, Y.Q.; Yao, X.L.; Zhang, Y.L.; Zhang, Y.B.; Shi, K.; Tang, X.M.; Qin, B.Q.; Podgorski, D.C.; Brookes, J.D.; Jeppesen, E. Response of dissolved organic matter optical properties to net inflow runoff in a large fluvial plain lake and the connecting channels. Sci. Total Environ. 2018, 639, 876–887. [Google Scholar] [CrossRef] [PubMed]
  31. Zhou, Y.Q.; Xiao, Q.T.; Yao, X.L.; Zhang, Y.L.; Zhang, M.; Shi, K.; Lee, X.H.; Podgorski, D.C.; Qin, B.Q.; Spencer, R.G.M.; et al. Accumulation of Terrestrial Dissolved Organic Matter Potentially Enhances Dissolved Methane Levels in Eutrophic Lake Taihu, China. Environ. Sci. Technol. 2018, 52, 10297–10306. [Google Scholar] [CrossRef] [PubMed]
  32. Zhang, Y.; Zhang, E.; Yin, Y.; van Dijk, M.A.; Feng, L.; Shi, Z.; Liu, M.; Qin, B. Characteristics and sources of chromophoric dissolved organic matter in lakes of the Yungui Plateau, China, differing in trophic state and altitude. Limnol. Oceanogr. 2010, 55, 2645–2659. [Google Scholar] [CrossRef]
  33. Sgroi, M.; Roccaro, P.; Korshin, G.V.; Greco, V.; Sciuto, S.; Anumol, T.; Snyder, S.A.; Vagliasindi, F.G.A. Use of fluorescence EEM to monitor the removal of emerging contaminants in full scale wastewater treatment plants. J. Hazard. Mater. 2017, 323, 367–376. [Google Scholar] [CrossRef] [PubMed]
  34. Ziegelgruber, K.L.; Zeng, T.; Arnold, W.A.; Chin, Y.-P. Sources and composition of sediment pore-water dissolved organic matter in prairie pothole lakes. Limnol. Oceanogr. 2013, 58, 1136–1146. [Google Scholar] [CrossRef]
  35. Galloway, J.M.; Swindles, G.T.; Jamieson, H.E.; Palmer, M.; Parsons, M.B.; Sanei, H.; Macumber, A.L.; Patterson, R.T.; Falck, H. Organic matter control on the distribution of arsenic in lake sediments impacted by ~65years of gold ore processing in subarctic Canada. Sci. Total Environ. 2018, 622–623, 1668–1679. [Google Scholar] [CrossRef] [PubMed]
  36. Borges, H.V.; Nittrouer, C.A. Sediment accumulation in Sepetiba Bay (Brazil) during the holocene: A reflex of the human influence. J. Sediment. Environ. 2016, 1, 90–106. [Google Scholar] [CrossRef]
  37. Wang, T.; Li, P.; Hou, J.M.; Tong, Y.; Li, J.; Wang, F.; Li, Z.N. Transport mechanism of eroded sediment particles under freeze-thaw and runoff conditions. J. Arid Land 2022, 14, 490–501. [Google Scholar] [CrossRef]
  38. Roebuck, J.A., Jr.; Seidel, M.; Dittmar, T.; Jaffe, R. Controls of Land Use and the River Continuum Concept on Dissolved Organic Matter Composition in an Anthropogenically Disturbed Subtropical Watershed. Environ. Sci. Technol. 2020, 54, 195–206. [Google Scholar] [PubMed]
  39. Wang, S.; Ran, F.; Li, Z.; Yang, C.; Xiao, T.; Liu, Y.; Nie, X. Coupled effects of human activities and river–Lake interactions evolution alter sources and fate of sedimentary organic carbon in a typical river–Lake system. Water Res. J. Int. Water Assoc. 2024, 255, 121509. [Google Scholar] [CrossRef]
  40. Goni, M.A.; Teixeira, M.J.; Perkey, D.W. Sources and distribution of organic matter in a river-dominated estuary (Winyah Bay, SC, USA). Estuar. Coast. Shelf Sci. 2003, 57, 1023–1048. [Google Scholar] [CrossRef]
  41. Jiang, T.; Wang, D.; Wei, S.; Yan, J.; Liang, J.; Chen, X.; Liu, J.; Wang, Q.; Lu, S.; Gao, J.; et al. Influences of the alternation of wet-dry periods on the variability of chromophoric dissolved organic matter in the water level fluctuation zone of the Three Gorges Reservoir area, China. Sci. Total Environ. 2018, 636, 249–259. [Google Scholar] [CrossRef] [PubMed]
  42. Liu, C.; Li, R.J.; Zhang, Y.H.; Zhang, L.J.; Liu, Z.L.; Li, P.; Fan, G.H.; Zhu, Y.J.; Zuo, Y.; Liu, X.L.; et al. Spatiotemporal changes in dissolved organic matter chemodiversity and its interaction with microbial composition in heavy-metal polluted river. Water Res. 2026, 288, 124738. [Google Scholar] [CrossRef] [PubMed]
  43. Liu, F.; Zhao, Q.L.; Ding, J.; Li, L.L.; Wang, K.; Zhou, H.M.; Jiang, M.; Wei, J. Sources, characteristics, and in situ degradation of dissolved organic matters: A case study of a drinking water reservoir located in a cold-temperate forest. Environ. Res. 2023, 217, 114857. [Google Scholar] [CrossRef] [PubMed]
  44. Liu, B.; Wu, J.; Cheng, C.; Tang, J.K.; Khan, M.F.S.; Shen, J. Identification of textile wastewater in water bodies by fluorescence excitation emission matrix-parallel factor analysis and high-performance size exclusion chromatography. Chemosphere 2019, 216, 617–623. [Google Scholar] [CrossRef] [PubMed]
  45. Sadchikov, A.P.; Ostroumov, S.A. Interactions in the Detritus-Dissolved Organic Matter-Bacteria-Algae System in Freshwater Ecosystems of Different Trophic Levels: Water Quality Formation. Russ. J. Gen. Chem. 2020, 90, 2708–2716. [Google Scholar] [CrossRef]
  46. Bilanovic, D.D.; Kroeger, T.J.; Spigarelli, S.A. Behaviour of humic-bentonite aggregates in diluted suspensions. Water SA 2009, 33, 111–116. [Google Scholar] [CrossRef][Green Version]
Figure 1. Sampling sites in the East Taihu Lake Basin.
Water 18 01851 g001
Figure 2. Sediment grain compositions in (A) winter, (B) spring, and (C) summer.
Water 18 01851 g002
Figure 3. PARAFAC components including (A) C1, (B) C2, and (C) C3 in the water environment. (D) Comparison of PARAFAC components in the watershed. **** Wilcoxon rank sum test, p < 0.0001.
Water 18 01851 g003
Figure 4. Profiles of DOM in the sediment. (A) Spatial–temporal distribution of DOM. Correlations of optical indices with the similarity of DOM between the sediment and (B) aquaculture/(C) WWTP/(D) domestic sewage.
Water 18 01851 g004
Figure 5. Profiles of DOM in the water. (A) Spatial–temporal distribution of DOM. Correlations of optical indices with the similarity of DOM between the water and (B) aquaculture/(C) WWTPs/(D) domestic sewage.
Water 18 01851 g005
Figure 6. Multi-media distribution patterns of DOM in the water environment. (A) Spectra of the FQ for DOM between the sediment and water. (B) Statistically significant regions for the FQs for DOM between the sediment and water according to the paired t-test.
Water 18 01851 g006
Figure 7. Influence of sediment grain size on the multi-media distribution patterns of DOM in the water environment. (A) Ratios of PARAFAC components in the sediment to the water in winter. (B) Ratios of PARAFAC components in the sediment to the water in spring. (C) Ratios of PARAFAC components in the sediment to the water in summer. (D) SEM showing the effects of sediment grain size on the distribution of DOM between the sediment and water.
Water 18 01851 g007
Disclaimer/Publisher’s Note: The statements, opinions and data contained in all publications are solely those of the individual author(s) and contributor(s) and not of MDPI and/or the editor(s). MDPI and/or the editor(s) disclaim responsibility for any injury to people or property resulting from any ideas, methods, instructions or products referred to in the content.