Article

Changes in the Frequency of High- and Low-Flow Years in the Permafrost-Dominated Lena River Basin During Long-Lasting Phases of Contrasting Water Flow

by
Alexander G. Georgiadi
1,
Irina P. Milyukova
1,
Oleg O. Borodin
1,
Elena A. Barabanova
1,
Pavel Y. Groisman
2,3,* and
Yuriy Y. Alent’ev
1
1
Institute of Geography, Russian Academy of Sciences, 119017 Moscow, Russia
2
Cooperative Institute for Satellite Earth System Studies, North Carolina State University, Asheville, NC 28801, USA
3
Hydrology Science and Services Corporation, Asheville, NC 28804, USA
*
Author to whom correspondence should be addressed.
Water 2026, 18(15), 1791; https://doi.org/10.3390/w18151791
Submission received: 15 April 2026 / Revised: 26 June 2026 / Accepted: 17 July 2026 / Published: 24 July 2026

Abstract

Long-term phases (lasting 10–15 years or more) of decreased and increased annual and seasonal runoff and related differences in the frequencies of low-water and high-water river flow years were identified for the Lena across Kyusyur and Tabaga and its tributary, the Aldan in Verkhoyanski Perevoz, for observation periods beginning in the 1930–1940s. Phase boundaries were identified by cumulative deviation curves and the statistical homogeneity of runoff time series. The frequencies of abnormal years were estimated based on the empirical exceedance probability curves, derived from multi-year time series of annual and seasonal flows. Two main long-lasting, quasi-synchronous contrasting phases were revealed on each of the rivers under consideration during an 80-year series of observations for both annual and seasonal runoff. At first, there was a phase of decreased runoff, which was followed by a phase of increased runoff during the period of modern global warming. These contrasting phases exhibit quasi-synchronicity not only within the same river but also across different rivers. However, the duration and magnitude of the flow difference between phases vary both on each river and between them. The phases of increased runoff are characterized by a noticeably higher frequency of high-water years (when runoff is at least 25% of the exceedance probability) and a lower frequency of low-water years (when runoff is at least 75% of the exceedance probability). This inverse relationship has been revealed for the phases of decreased runoff.

1. Introduction

Contemporary global warming has brought about clear changes in various components of the natural environment, including river runoff [1,2]. Many publications are devoted to the study of long-lasting contrasting periods regarding multi-year variations in runoff in different regions of the world [3,4,5,6,7,8,9,10,11,12]. These contrasting periods (termed “phases” in the USSR and Russia [13]) are characterized by specific, relatively steady river water regimes [6]. They constitute a significant part of the overall long-term variability of river runoff caused by climate change. In most cases, the differences in the average runoff of such phases are statistically significant [8]. There is experience in using parametric and nonparametric criteria to assess the statistical uniformity of the runoff time series based on its average values [14,15,16,17]. The phases commonly last 10–15 years or more, even extending over several decades. It has been established that the long-term dynamics of contrasting phases in relation to the world’s largest rivers are asynchronous [12]. In the territory of Russia, where the water regime is dominated by snowmelt flood flow, the years of the annual runoff contrasting phase transition, associated with the onset of modern global warming, change in the meridional types of circulation [18]. The main characteristics (phase duration, runoff differences between them) have been assessed for the rivers of Northern Eurasia [5,6,7,8,9,10,11], Europe [4], Asia [10,11] and Africa [3]. For the East European Plain and Siberia, several characteristic types of long-term dynamics of seasonal-scale contrasting phases of annual runoff and runoff have been identified [5,6,7].
In the East European Plain, against the background of long phases of decreased/increased flow, years are identified in which extremely low flow is observed, caused by the most severe droughts affecting large river basins. These occur not only in the summer–autumn period, but also in other seasons and over the year as a whole. Abnormally low and high runoff between seasons and annual runoff are fairly typical for this region. Their frequency during long phases of contrasting annual and seasonal runoff differs significantly. This issue has been studied to a much lesser extent in relation to river flow between hydrological seasons [6]. Also, the question of how the frequency of low- and high-water years is related to long phases of increased/decreased annual and seasonal runoff remains understudied.
The primary objectives of our study were (1) to identify the boundaries of long-term phases of increased/decreased annual and seasonal runoff and to assess their characteristics (boundaries, duration, and average runoff) and (2) to estimate the number of years with low and high runoff for the major rivers of the Lena River Basin—one of the largest river basins in the world. This Basin is almost entirely covered by permafrost. The main study areas included the entire Lena River Basin up to the Kyusyur gage station; the basin of the Lena River’s largest right-bank tributary, the Aldan River; and the Lena River Basin up to the confluence of the Aldan River. The working hypotheses are that in the phases of increased runoff, the frequency of high-water years notably increases, while the frequency of low-water years decreases, and vice versa. Furthermore, the difference in the frequency of such years depends on the hydrological season of the year.

2. Materials

2.1. Study Area

The Lena River catchment in the village of Kyusyur is one of the largest in Russia (Figure 1) and is over 90% permafrost (Table 1). Most of the territory is occupied by taiga forests and tundra. This vast region is characterized by a sharply continental climate.
Runoff during the spring–summer flood period accounts for approximately 60% of the annual flow in the lower Lena near Kyusyur (where the flood lasts longer than in the upper and middle parts of the Basin) and over 40% in the Lena near Tabaga and Aldan (Table 2). During the decline of the snowmelt flood, rain floods make a certain contribution to its volume. Between 30 and 50% of the annual flow occurs during the summer–autumn period, and during this period, it is formed by rainfall and groundwater recharge. Winter runoff (from November to April), when the river is covered with ice, accounts for less than 10% of the annual flow.
The average long-term volume of water flow for the entire observation period reaches 542 km3 in the Lena across Kyusyur, 230 km3 in the Lena across Tabaga, and 172 km3 in the Aldan.
The main anthropogenic influences on the Lena flow, especially in winter, are due to the long-term regulation reservoir on the left tributary, the Vilui, which flows into the Lena downstream of Yakutsk city. The total volume of the reservoir, which was filled in 1966, is 44.4 km3, and its active storage capacity is 22.4 km3. Other types of anthropogenic impact have an insignificant effect on the river flow and water regime of the Lena and Aldan.

2.2. Data

The study was based on long-term hydrometric observations conducted at the network of Roshydromet stations. The Lena River’s flow records across Kyusyur, for the period following the start of filling the Vilyui Reservoir, were naturalized by transforming the annual hydrograph of daily water discharges [8] via a linear model describing the relationship between water discharges at the inlet and outlet of the river reach under consideration, using Kalinin–Milyukov influence functions [23].
The boundaries of hydrological seasons, which were assumed to be constant for the entire observation period, were determined by analyzing long-term records of monthly water discharges, as well as of river freezing and ice cover destruction [6].

3. Methods

3.1. Detection of Transition Years for Phases of Contrast Annual and Seasonal Water Flow

The transition years between long phases of contrasting annual and seasonal water flow were identified using cumulative deviation curves (based on their maximum and minimum coordinate values) in combination with an assessment of the statistical homogeneity in the runoff time series between adjacent phases using their mean values. The nonparametric homogeneity test was applied for this purpose [5,6,7].

3.1.1. Cumulative Deviation Curves

Cumulative deviation curves (CDCs) represent the cumulative sum of deviations of a given characteristic from its mean value, calculated over the entire observation period [7,24]. The values of normalized cumulative deviation curves are calculated as follows:
C D C τ = 1 C v i = 1 τ K i 1
K i = E i / E m
C v = σ E m
σ = 1 n 1 i = 1 n E i E m 2
where CDCτ is the value of the cumulative deviation curve for year τ; Ei is the value of the ith member of the time series (i = 1, … n); n is the number of members in the time series; Em is the average long-term value; Ki is the modular coefficient of the ith member of the time series; Cv is the coefficient of variation of the time series; and σ is the standard deviation.

3.1.2. Criteria for Statistical Homogeneity of Long-Term Time Series of River Water Flow Based on Their Mean Values

The Mann–Whitney–Pettitt (MWP) test [25] from the AnClim 5.025 package [26] was used to assess the statistical significance of deviations in the mean values of series of long-term contrast phases of hydrological characteristics, the boundaries of which were determined using the cumulative deviation curve.

3.2. Estimation of the Exceedance Probability of River Low-Flow and High-Flow Years

Low-flow years were defined as those in which the average seasonal (summer–autumn, winter low-water, and snowmelt flood) and annual runoff were equal to or lower than the runoff corresponding to 75% exceedance probability. Conversely, high-water years were defined as those with flows equal to or greater than the values corresponding to 25% exceedance probability [27]. Years between these two brackets were deemed medium-flow years [6].
The exceedance probability of the runoff of the rivers under consideration was calculated using empirical exceedance probability curves constructed from long-term time series of the rivers’ average seasonal (snowmelt flood, summer–autumn, winter) and average annual water discharge values.
Empirical values of the exceedance probability were calculated using the following formula [15]:
P Q i = m i n + 1 100 % ,
where mi is the rank position of the year in the time series of water discharge values in descending order, and n is the total number of water discharge values in the time series.

4. Results

4.1. Long Phases of Seasonal and Annual Water Flow

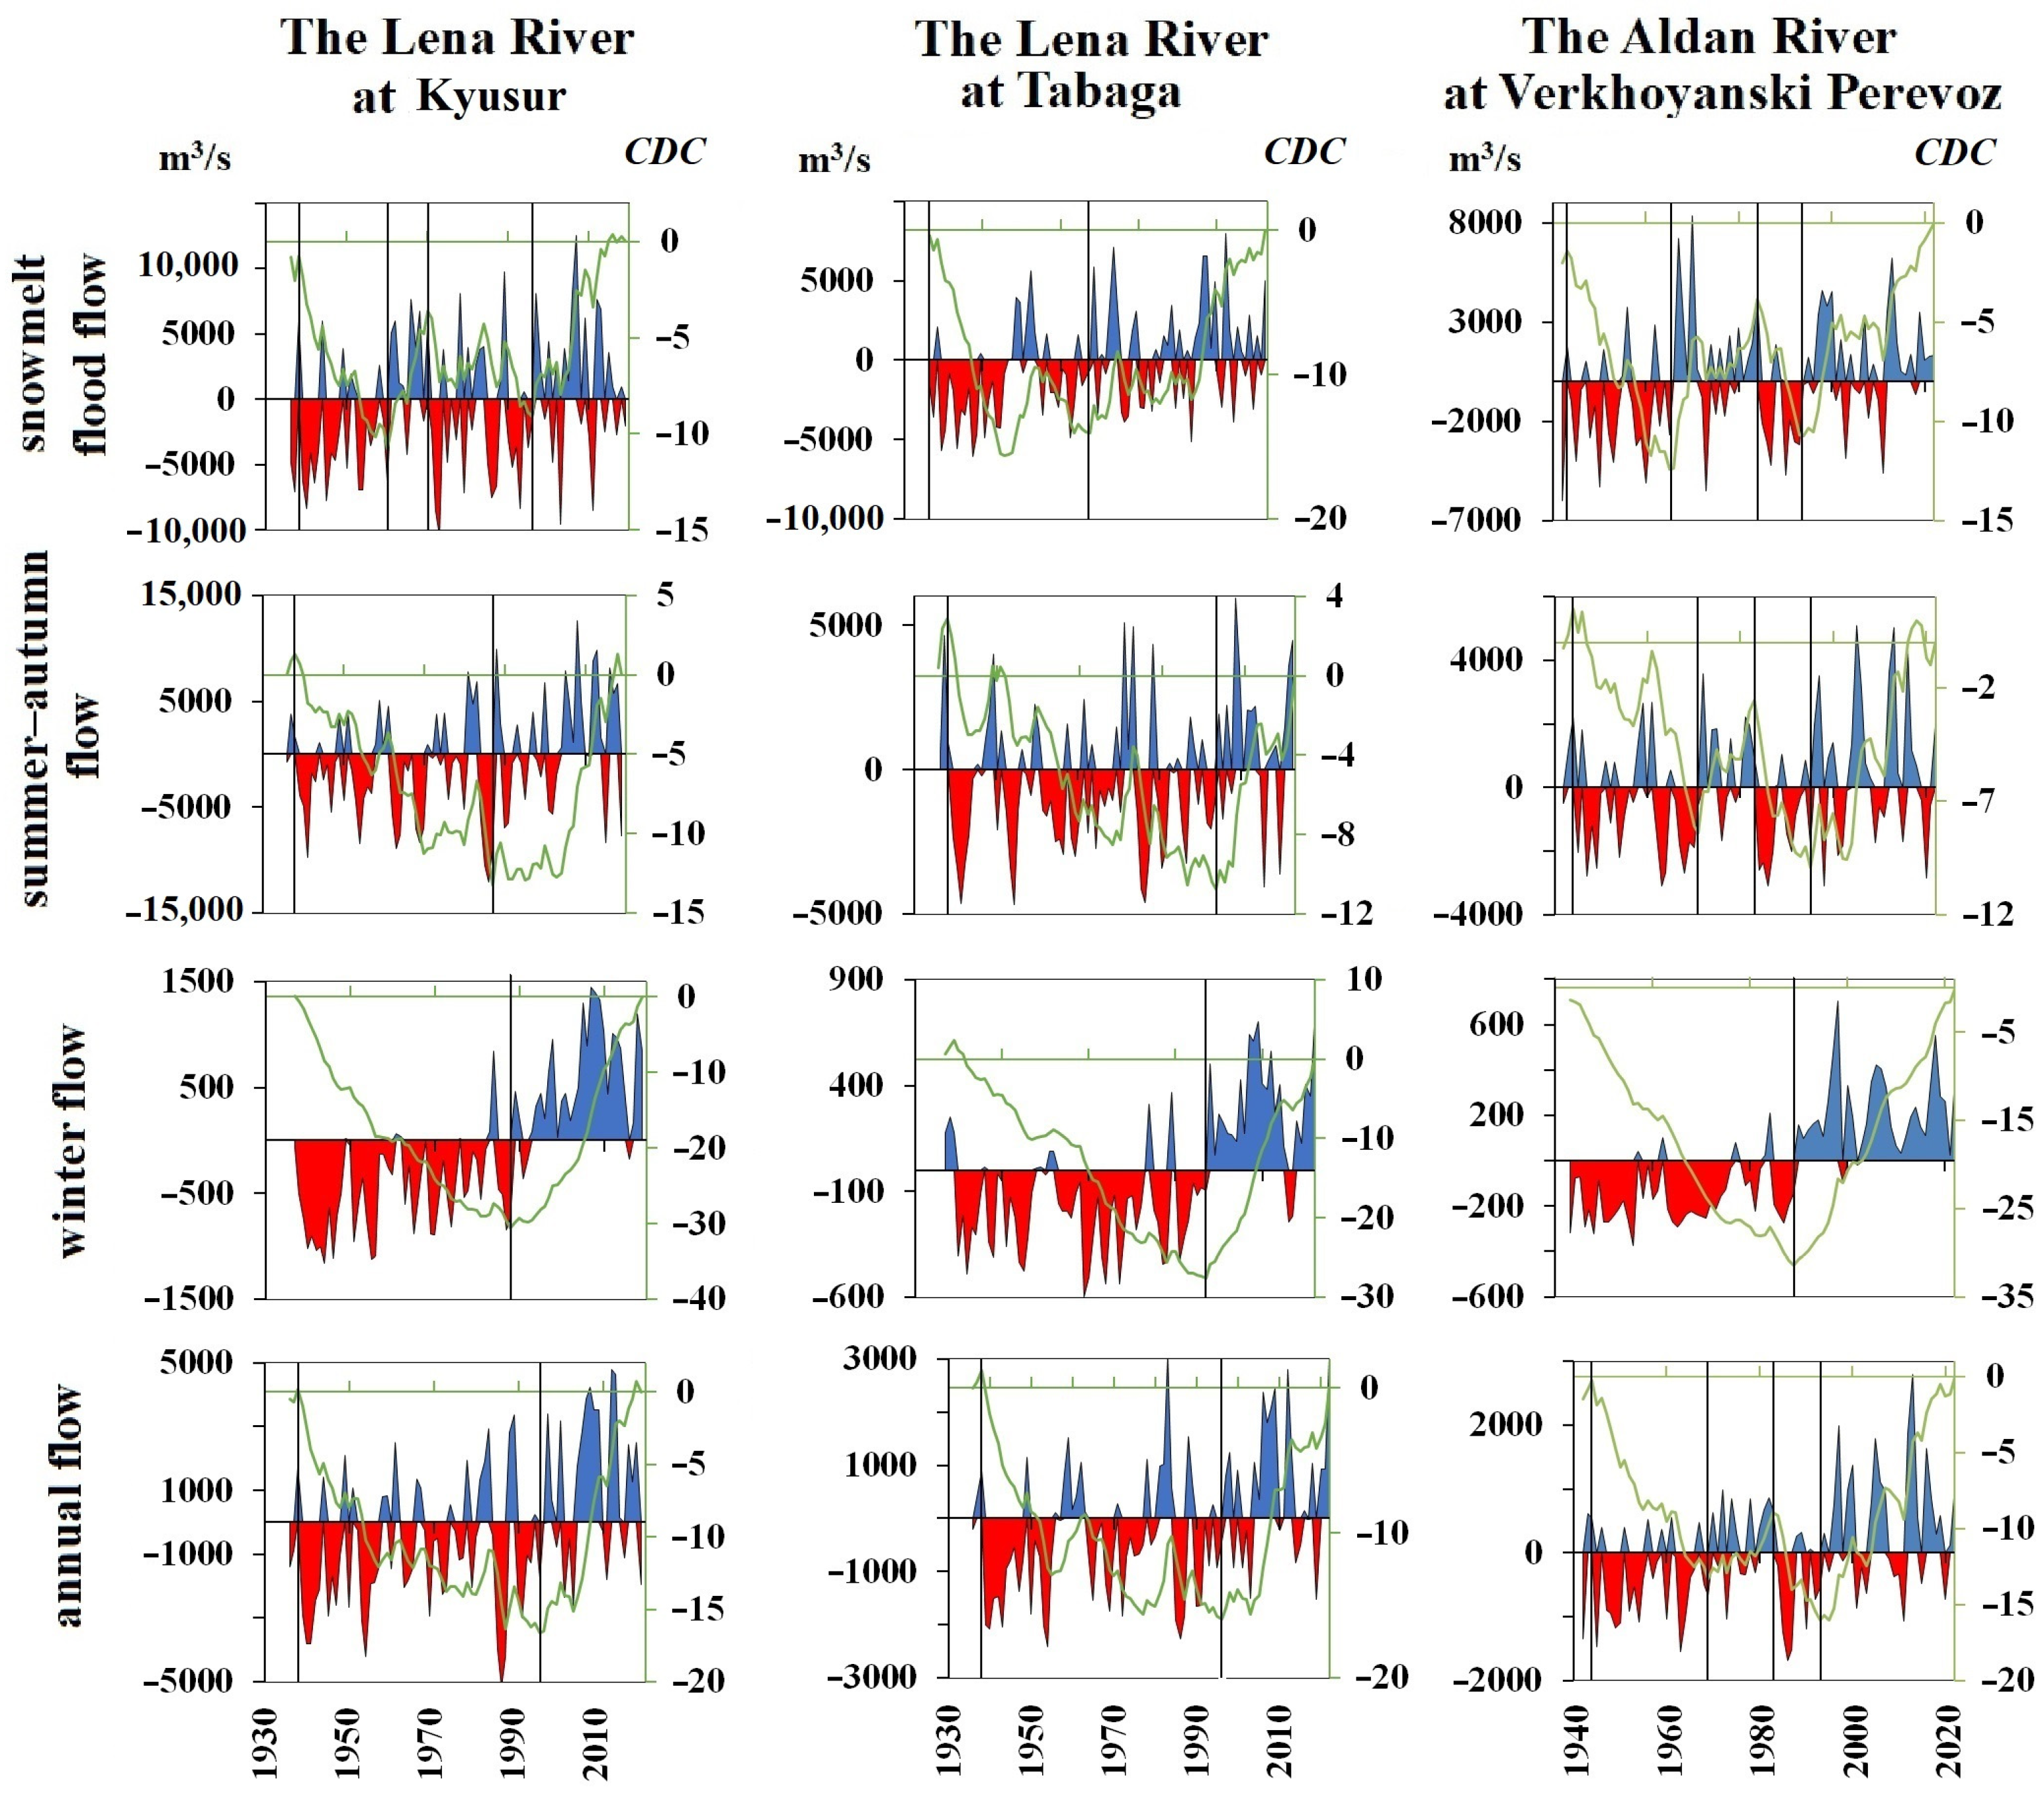
Two main long-term (lasting several decades) quasi-synchronous phases were revealed during the 80-year series for both the annual runoff and the runoff of each hydrological season. First, a phase of decreased runoff was observed, which was replaced by a phase of increased runoff under modern global warming (Figure 2). The years of transition to the phase of increased runoff associated with global warming for the annual and seasonal runoff were different for the rivers. The change in contrasting runoff phases on each of the rivers occurred, as a rule, in the 1980s and 1990s. The earliest and latest changes in contrasting phases were identified at the Lena–Tabaga gauge. For snowmelt flood runoff, the transition occurred in 1977/1978, and for summer–autumn runoff, it occurred in 2003/2004. Two contrasting phases (one of decreased runoff; another of increased runoff) on each of the rivers are most clearly distinguished for winter runoff. For the Lena River across Kyusyur and the Aldan, a change in contrasting winter runoff phases occurred in the 1980s–1990s, and, for the Lena across Tabaga, it occurred in the late 1990s. It should be noted that two long-term contrasting phases (one of decreased and another one of increased runoff) were also identified for snowmelt flood runoff, summer–autumn runoff, and annual runoff for the Lena across Tabaga, as well as for summer–autumn and annual runoff for the Lena across Kyusyur. Two phases of increased runoff and two phases of decreased runoff were identified for snowmelt flood runoff in the Lena across Kyusyur, and for the snowmelt flood, summer–autumn, and annual runoff in the Aldan. In some cases, relatively short phases (a little less than 10 years) of contrasting runoff were observed against the background of long phases of decreased/increased runoff, which were included in the longer phases.

4.1.1. Transition Years of Long Phases of Contrasting Annual and Seasonal River Water Flow

The years of phase change of contrasting annual and seasonal runoff identified using cumulative deviation curves are confirmed by estimates of the statistical significance of the differences in their mean values, determined using nonparametric criteria (Table 3). Only in a few cases were differences noticeable, particularly for the Lena snowmelt flood runoff across Tabaga.

4.1.2. Characteristics of Contrasting Phases of Water Flow

The total duration of the decreased annual and seasonal runoff phases in the Lena across Kyusyur and Tabaga appreciably exceeds the increased runoff phase duration (except for the snowmelt flood runoff across Tabaga, for which it is virtually identical) (Table 4). The maximum duration of the decreased runoff phase is 58 years (for Lena–Tabaga, for annual runoff), and the minimum is 24 years (for Lena–Kyusyur, also for annual runoff). In the Aldan River, on the other hand, the increased runoff phase is longer than the decreased runoff phase (for the snowmelt flood runoff and annual runoff). For summer–autumn runoff, it did not differ, and only for winter runoff did the decreased runoff phase last longer than the increased runoff phase.
The most significant flow difference (as a percentage of the phase of decreased flow) for contrasting phases was revealed for winter flow. It ranges from 40% (Lena–Tabaga) to more than 76% (Aldan). For summer–autumn runoff, it varies within 18–24%, while for snowmelt flood runoff, the range is within 11–22%, and for annual runoff, the range is within 14–19%.
For the Lena near Kyusyur, Lena near Tabaga, and Aldan near Verkhoyansk Perevoz, changes in the standard error of mean runoff for the contrasting phases were within single-digit percentages. For snowmelt flood runoff, the values were 2.2–2.7 (2.3–3.1), 2.7–2.8 (3.0–3.8), and 2.9–5.1 (3.1–5.8), respectively. For summer-autumn runoff, they were 3.2–4.0 (4.8), 4.2–7.5 (5.1–7.7), and 4.4–5.9 (4.9–8.9). For winter runoff, they were 1.5–2.9 (2.3–5.5), 2.2–2.8 (2.9–4.7), and 3.6–6.9 (5.0–7.9). For annual runoff, they were 1.6–2.6 (3.0–3.4), 2.2–3.1 (3.3–3.6), and 2.6–4.9 (2.9–6.6). Values in parentheses account for autocorrelation. The standard errors of the mean runoff estimates for the increased and decreased runoff phases were several times smaller than the differences between the phase means, especially for winter runoff. Accounting for autocorrelation [15] produced only a moderate increase in standard errors.
When more than one increased or decreased runoff phase was detected during the observation period (Table 4), the differences among their mean values were much smaller than—or, for short phases, comparable to—the standard error. In these cases, mean runoff was calculated for the full period that included the corresponding increased or decreased phases.

4.2. The Difference in the Frequency of Extreme Runoff Years in the Long Phases of Contrasting Water Flow

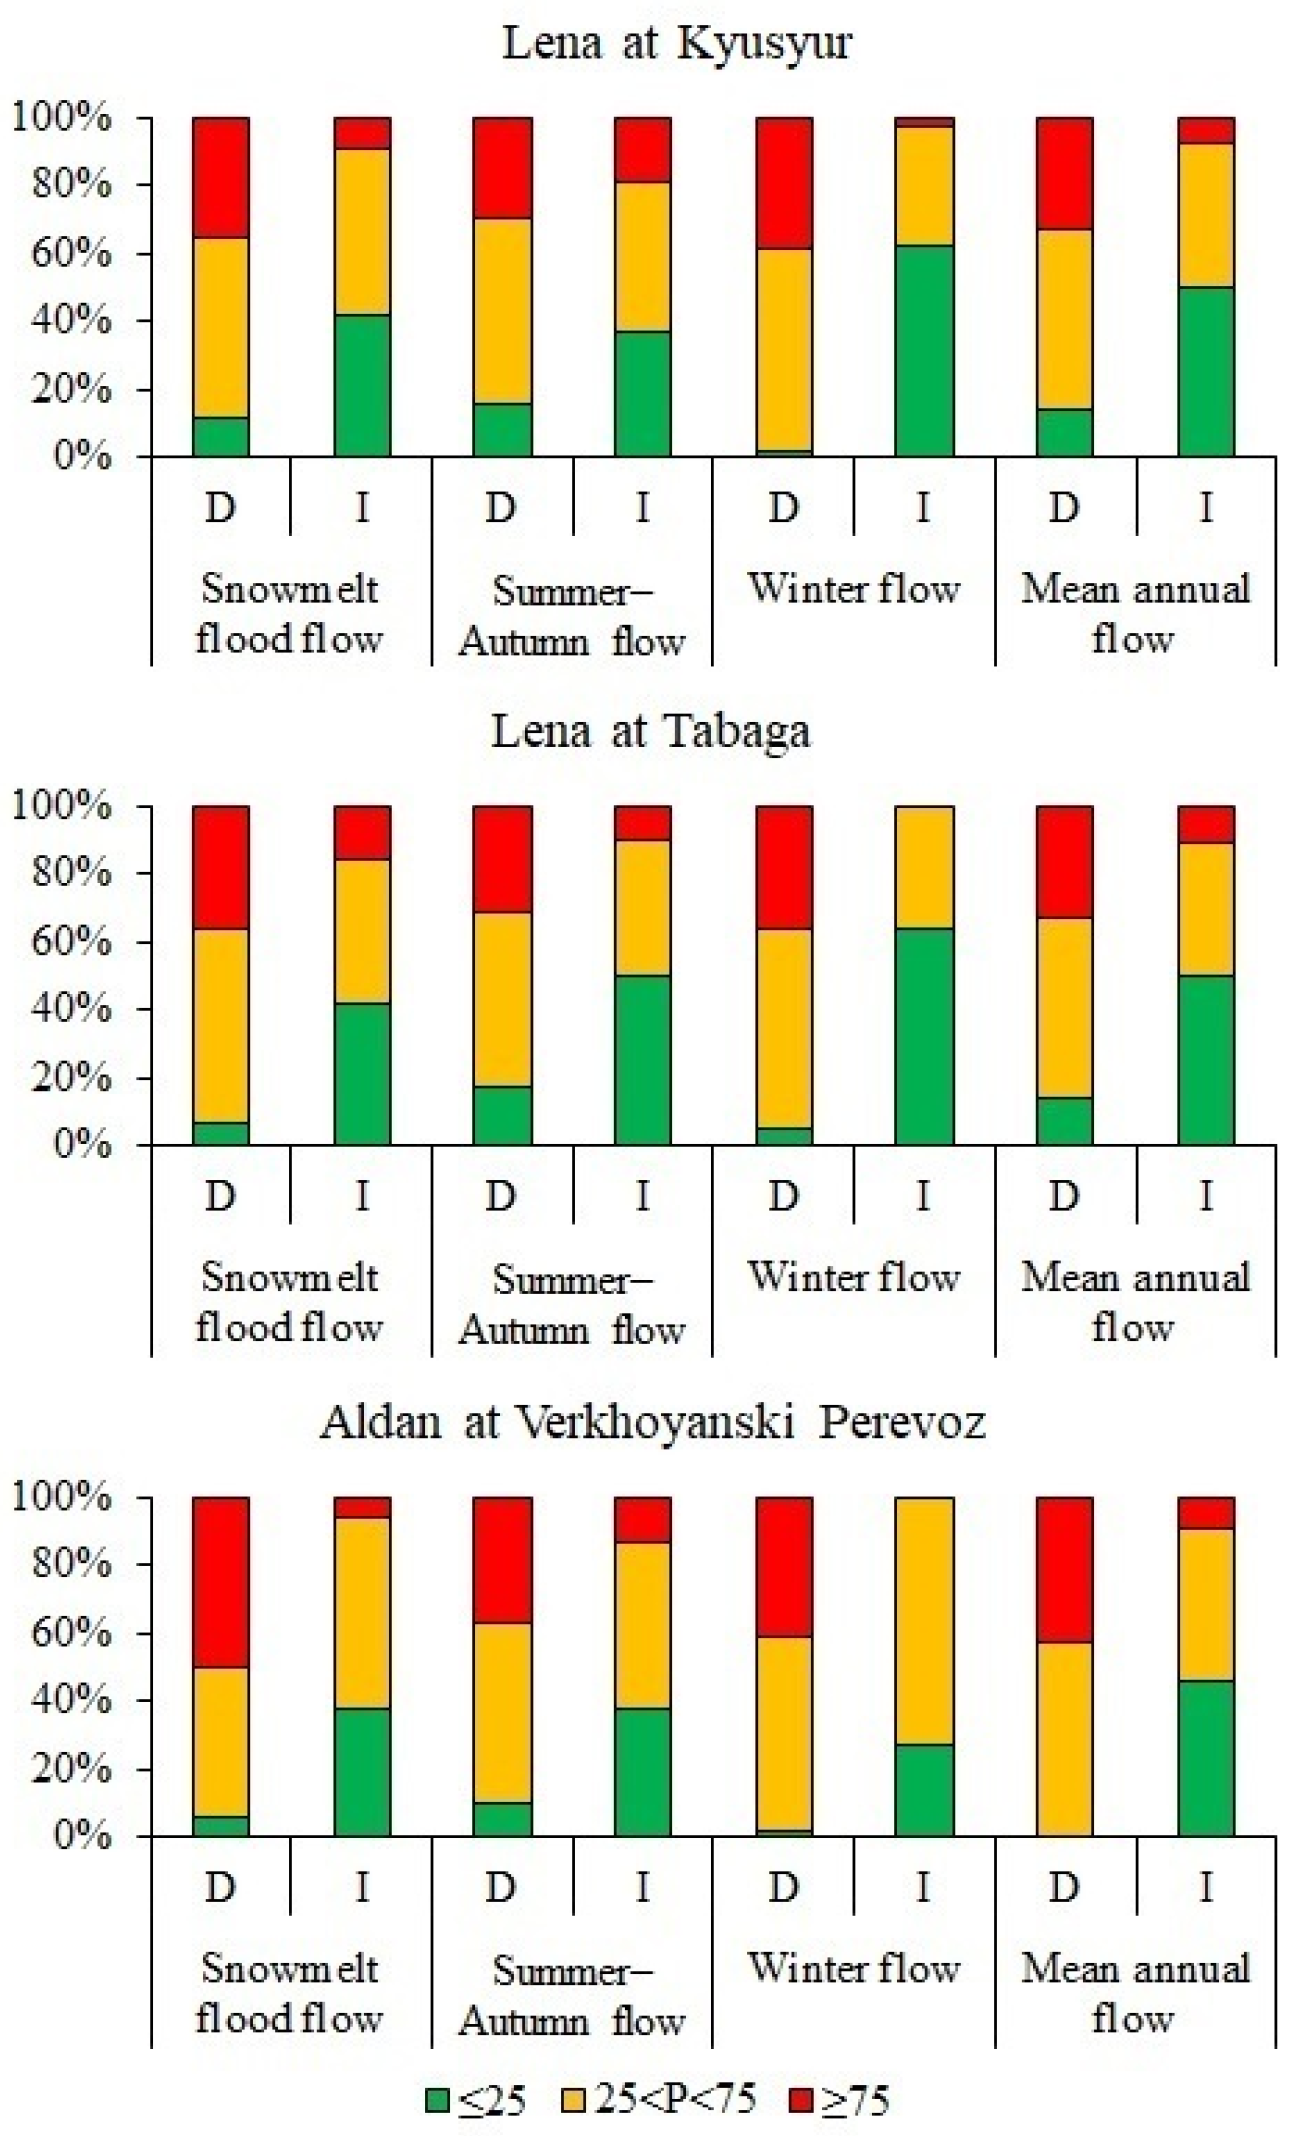
During the longest phases of increased flow (caused by modern global warming) compared to the decreased flow phases in each of the rivers, both for the annual flow and for the flow of the main hydrological seasons, there is a significant increase in the proportion of high-water years (Figure 3, Table A1). The most noticeable increase in the proportion of high-flow years was found for winter runoff, increasing from 2–5% to 27–64%, while, on the contrary, for low-flow years, it decreases from 36–41% to 0–3%. The proportion of high-flow and low-flow years changed in similar proportions during contrasting phases in the three considered rivers for snowmelt flood, the summer–autumn period, and annual runoff. Moreover, the proportion of years with runoff in the range corresponding to 25–75% exceedance probability remained relatively constant, with the exceptions of the winter runoff of the three rivers and the annual runoff of the Aldan.

5. Discussion

Studies show that modern global warming is causing differently directed changes in both annual and seasonal runoff over the world [3,5,6,7,12]. Russia and southern Africa have been studied in the most detail in this regard, and noteworthy results have also been obtained for other regions [3,4,10,11].
Although a number of results have already been obtained regarding the typification of long-term dynamics of long phases of contrasting runoff for some regions [6], as well as at the global level [27], there is an obvious need for further study in this direction, covering a diversity of territories both at the level of large regions of the world and at the global level, taking into account the accumulated long-term data and available methodological experience.
Our experience [7] shows that, as a rule, water flow characteristics exhibit statistically significant linear increase (or decrease) trends, as determined by the Mann–Kendall and Spearman tests, and linear regression. A statistically significant linear trend during the entire observation period under review is usually detected in the presence of at least two long-term contrasting phases [28,29]. At the same time, often there is no noticeable increasing (or decreasing) trend during the phase of decreased or increased runoff. Thus, taking phases into account when calculating the characteristics of river flow and other hydrological components allows us to obtain additional information about the nature of their long-term changes. Therefore, in recent years, when analyzing multi-year variability, both linear trends and long-lasting phases have been considered [28,29].
The climatic conditions of long-term phases of decreased/increased runoff have been insufficiently studied. Some features of these conditions (air temperature, precipitation, macroscale atmospheric circulation, permafrost thawing) have been identified for a number of Arctic rivers: Northern Dvina, Pechora, Ob, Yenisei, Lena, etc. [6,30,31].
However, research on determining the initial boundary of the period of modern global warming in different regions and the degree of its conjugation with the boundaries of the change in long-lasting phases of contrasting runoff during this period remains insufficient.
Methods for detecting abrupt changes (shift points) in the mean, variance, and frequency structure have been developed and are widely used [16,32]. Various statistical packages include such tests [26]. New methods are also being developed, such as the robust regime-shift detection algorithm for water-flow dynamics [33]. Although brief summaries of these methods are available, the authors are not aware of any detailed comparison of their application to long-term flow changes in rivers with different water regimes.
The relationship between the frequency of low- and high-water flow years and the nature of prolonged water flow phases also remains poorly understood. The results obtained show that alternating prolonged periods of increased/decreased flow are closely linked to significant changes in the frequency of low- and high-flow years. This can bring about significant, including negative, impacts on both ecosystems and human activities, which have adapted to these conditions over a long period of time.

6. Conclusions

We revealed how long phases of decreased/increased flow are related to the frequency of years with abnormally low water (when the water flow was less or equal to 75% exceedance probability levels) and high-water years (when the water flow was higher or equal to 25% exceedance probability levels) on the Lena River across Kyusyur and Tabaga, as well the Aldan River in Verkhoyanski Perevoz (the Lena’s right tributary), for periods starting from the 1930s and 1940s.
Two main quasi-synchronous phases were revealed over the 80-year observation time series for both annual flow and the flow of each hydrological season (with phases lasting several decades). Initially, this was a phase of decreased flow, which was replaced by a phase of increased flow during the current period of global warming.
The phase-transition years corresponding to increased runoff associated with global warming for annual runoff and the runoff of the main hydrological seasons of the year varied among the gauge stations, but typically, these years occurred in the 1980s and 1990s. The earliest and latest changes in contrasting phases in the Lena–Tabaga were identified for snowmelt flood runoff (1977/1978) and summer–autumn runoff (2003/2004). Two contrasting phases are most clearly distinguished for winter runoff for each of the rivers. For the Lena across Kyusyur and for the Aldan, the change in contrasting phases of winter runoff occurred in the 1980s–1990s, while for the Lena across Tabaga, they occurred in the late 1990s.
The years of long phase change regarding contrasting annual and seasonal runoff identified using cumulative deviation curves are, in most cases, confirmed by estimates of the statistical significance of the differences in their mean values, determined using the Student and Mann–Whitney–Pettit tests. Only in a few cases were differences in the results noticeable, particularly for the Lena snowmelt flood runoff across Tabaga.
The total duration of the low-flow phases of annual and seasonal flow in the Lena River across Kyusyur and Tabaga appreciably exceeds the duration of the snowmelt flow phases (except for the snowmelt flood flow across Tabaga, where it is virtually identical). The maximum duration of the low-flow phase is 58 years (for the Lena–Tabaga (annual flow)), and the minimum is 24 years (for the Lena–Kyusyur (annual flow)). On the other hand, for the Aldan, the duration of the increased flow phase exceeds the duration of the decreased flow phase (for snowmelt flood and annual runoff). For summer–autumn runoff, it is the same, and only for winter runoff is the decreased flow phase longer than the increased flow phase.
The most significant flow differences (as a percentage of the phase of decreased flow) for contrasting phases were revealed for winter flow. It ranges from 40% (Lena–Tabaga) to more than 76% (Aldan). For summer–autumn runoff, it ranges within 18–24%, while for snowmelt flood runoff, the range is 11–22%, and for annual runoff, the range is 14–19%.
The standard error of the mean runoff estimates for the compared increased and decreased runoff phases were several times smaller than the differences between the phase means, especially for winter runoff. Accounting for autocorrelation substantially increased the standard error in some cases. The largest relative differences in the frequency of abnormal years between contrasting runoff phases occurred in winter. In other seasons and for the year as a whole, except for the Aldan River, these differences were less pronounced.
In the Lena near Kyusyur, the proportion of high-water years varied from 37% (summer–autumn runoff) to 62% (winter runoff) in the phase of increased runoff and from 2% (winter runoff) to 16% (summer–autumn runoff) in the phase of decreased runoff.
In the Lena across Tabaga, it varied from 42% (snowmelt flood runoff) to 64% (winter runoff) in the increased flow phase and from 5% (winter runoff) to 14% (annual runoff) in the decreased runoff phase.
In the Aldan in Verkhoyansky Perevoz, it varied from 27% (winter runoff) to 46% (annual runoff) in the phase of increased flow and from 0% (annual runoff) to 10% (summer–autumn runoff) in the phase of decreased flow.

Author Contributions

A.G.G. developed the research concept and methodology and analyzed the results of the calculations; A.G.G. and E.A.B. made the main contributions to the preparation of this manuscript; I.P.M., E.A.B., O.O.B. and Y.Y.A. contributed to the calculation; P.Y.G. reviewed and edited the English version of this manuscript. All authors have read and agreed to the published version of the manuscript.

Funding

The article is based on the results of studies that were carried out under the Governmental Order of the Institute of Geography, Russian Academy of Sciences, state assignment FMWS-2026-0003, (1025030300154-4). The work of Pavel Groisman is partially supported by the U.S. NSF Grants # 2020404 ‘Belmont Forum Collaborative Research: Coastal OceAn SusTainability in Changing Climate’ and # 2127343 ‘NNA Collaborative Research: Frozen Commons: Change, Resilience and Sustainability in the Arctic’ and by NOAA through the Cooperative Institute for Satellite Earth System Studies under Cooperative Agreement NA19NES4320002.

Data Availability Statement

The data generated and analyzed during the current study are available from the corresponding author upon reasonable request.

Conflicts of Interest

Pavel Y. Groisman was employed by the Hydrology Science and Services Corporation. The remaining authors declare that the research was conducted in the absence of any commercial or financial relationships that could be construed as a potential conflict of interest.

Abbreviations

The following abbreviations are used in this manuscript:
USSRUnion of Soviet Socialist Republics
CDCCumulative deviation curve
MWPMann–Whitney–Pettitt test

Appendix A

Table A1. The proportion of low-water and high-water years (with exceedance probability ≥75 and ≤25% of probability of exceedance) in long-lasting phases of increased and decreased annual and seasonal water flow in the Lena River across Kyusyur and Tabaga, as well as the Aldan River in Verkhoyanski Perevoz.
PhaseLena Across KyusyurLena Across TabagaAldan in Verkhoyanski Perevoz
≥75%≤25%≥75%≤25%≥75%≤25%
Snowmelt flood flow
D1939–19601936–19771944–1965
1971–19961985–1994
3512367506
I1961–19701978–20221966–1984
1997–20191995–2022
9421642638
Summer–Autumn flow
D1939–19871939–20021945–1971
1984–1995
301631173710
I1988–20192003–20221972–1983
1996–2022
193710501338
Winter flow
D1937–19871939–19971944–1989
392365412
I1988–20191998–20221990–2022
362064027
Annual flow
D1939–19951939–19961945–1969
1984–1993
33143314430
I1996–20191997–20221970–1983
1994–2022
8501150946

References

  1. Intergovernmental Panel on Climate Change (IPCC). Climate Change 2022—Impacts, Adaptation and Vulnerability: Working Group II Contribution to the Sixth Assessment Report of the Intergovernmental Panel on Climate Change; Cambridge University Press: Cambridge, UK, 2023; p. 3056. [Google Scholar] [CrossRef] [Scilit]
  2. Reid, P.C.; Hari, R.E.; Beaugrand, G.; Livingstone, D.M.; Marty, C.; Straile, D.; Barichivich, J.; Goberville, E.; Adrian, R.; Aono, Y.; et al. Global impacts of the 1980s regime shift. Glob. Change Biol. 2016, 22, 682–703. [Google Scholar] [CrossRef] [Scilit] [PubMed]
  3. Alemaw, B.; Chaoka, T. Trends in the flow regime of the southern African rivers as visualized from rescaled adjusted partial sums (RAPS). Afr. J. Sci. Technol. 2002, 3, 70–79. [Google Scholar] [CrossRef] [Scilit]
  4. Đurin, B.; Raič, M.; Sušilović, P. Analysis of homogeneity and isotropy of the flow in the watercourses by applying the RAPS and IPTA methods. Adv. Civ. Archit. Eng. 2024, 15, 67–83. [Google Scholar] [CrossRef] [Scilit]
  5. Georgiadi, A.G.; Groisman, P.Y. Long-term changes of water flow, water temperature and heat flux of two largest arctic rivers of European Russia, Northern Dvina and Pechora. In Environmental Research Letters; IOP Publishing: Bristol, UK, 2022; Volume 17, pp. 1–14. [Google Scholar]
  6. Georgiadi, A.G.; Groisman, P.Y. Extreme low flow during long-lasting phases of river runoff in the central part of the East European Plain. Water 2023, 15, 2146. [Google Scholar] [CrossRef] [Scilit]
  7. Georgiadi, A.G.; Kashutina, E.A.; Milyukova, I.P. Long-term changes of water flow, water temperature and heat flux of the largest Siberian rivers. Polarforschung 2018, 87, 167–176. [Google Scholar] [CrossRef] [Scilit]
  8. Georgiadi, A.G.; Milyukova, I.P. Peculiarities of long-term phases of the increased and decreased Don and Lena runoff in the 19th–21st centuries. Russ. Meteorol. Hydrol. 2023, 48, 1066–1075. [Google Scholar] [CrossRef] [Scilit]
  9. Georgievsky, V.Y. Scientific and Applied Reference Book: Long-Term Characteristics of Water Inflow into the Largest Reservoirs of the Russian Federation; Georgievsky, V.Y., Ed.; OOO APC Ofort: Moscow, Russia, 2017; p. 132. ISBN 978-5-9907194-5-3. (In Russian) [Google Scholar]
  10. Sharma, S.; Singh, P.K. Long term spatiotemporal variability in rainfall trends over the state of Jharkhand, India. Climate 2017, 5, 18. [Google Scholar] [CrossRef] [Scilit]
  11. Yeh, C.-F.; Wang, J.; Yeh, H.-F.; Lee, C.-H. Spatial and temporal streamflow trends in Northern Taiwan. Water 2015, 7, 634–651. [Google Scholar] [CrossRef] [Scilit]
  12. Shi, X.; Qin, T.; Nie, H.; Weng, B.; He, S. Changes in major global river discharges directed into the ocean. Int. J. Environ. Res. Public Health 2019, 16, 1469. [Google Scholar] [CrossRef] [Scilit] [PubMed]
  13. Muraveisky, S.D. Rivers and Lakes, Hydrobiology, Runoff; Geografgiz: Moscow, Russia, 1960; p. 387. (In Russian) [Google Scholar]
  14. Cramer, H. Mathematical Methods of Statistics; Princeton University Press: Princeton, NJ, USA, 1946; p. 575. [Google Scholar]
  15. Georgievsky, V.Y. Determination of the Main Design Hydrological Characteristics; Rules Summary: Moscow, Russia, 2023; p. 103. (In Russian) [Google Scholar]
  16. Kundzewicz, Z.W.; Robson, A.J. Change detection in hydrological records—A review of the methodology. Hydrol. Sci. J. 2004, 49, 7–19. [Google Scholar] [CrossRef] [Scilit]
  17. Rodionov, S.N. A sequential algorithm for testing climate regime shifts. Geophys. Res. Lett. 2004, 31, L09204. [Google Scholar] [CrossRef] [Scilit]
  18. Frolova, N.L.; Magritskii, D.V.; Kireeva, M.B.; Grigor’ev, V.Y.; Gelfan, A.N.; Sazonov, A.A.; Shevchenko, A.I. Streamflow of the Russian rivers under current and forecasted climate changes. A review of publications. 1. Assessment of changes in the water regime of Russian rivers by observation data. Water Resour. 2022, 49, 333–350. [Google Scholar] [CrossRef] [Scilit]
  19. Shuttle Radar Topography Mission. Available online: https://www.earthdata.nasa.gov/data/instruments/srtm (accessed on 12 January 2026).
  20. ArcAtlas: Our Earth. Environmental Systems Research Institute (1996). Inc. and DATA+ All Rights Reserved. Available online: https://geo2.scholarsportal.info/#r/details/_uri@=1952603239 (accessed on 12 January 2026).
  21. Circum-Arctic Map of Permafrost and Ground-Ice Conditions. (GGD318, Version 2). Available online: https://nsidc.org/data/ggd318/versions/2 (accessed on 12 January 2026).
  22. Barabanova, E.A. Comparison of reservoirs by the complex of their positive and negative impacts on the environment and economy. Izv. Akad. Nauk. Ser. Geogr. 2004, 2, 72–82. (In Russian) [Google Scholar]
  23. Kalinin, G.P.; Milyukov, P.I. Approximate Calculation of Unsteady Motion of Water Masses. Proc. Cent. Inst. Forecast. 1958, 66, 72. (In Russian) [Google Scholar]
  24. Andreyanov, V.G. Cyclical fluctuations of annual runoff and their accounting in hydrological calculations problems of runoff calculations. Proc. State Hydrol. Inst. 1959, 68, 3–50. (In Russian) [Google Scholar]
  25. Pettitt, A.N. A non-parametric approach to the change-point problem. J. R. Stat. Soc. 1979, 28, 126–135. [Google Scholar] [CrossRef] [Scilit]
  26. Štěpánek, P. AnClim and ProClimDB Software for Data Quality Control and Homogenization of Time Series. Geophysical Research Abstracts Vol. 17, EGU2015-15570, 2015 EGU General Assembly 2015. Available online: https://meetingorganizer.copernicus.org/EGU2015/EGU2015-15570.pdf (accessed on 10 December 2025).
  27. Kuzin, P.S.; Babkin, V.I. Geographical Patterns of the Hydrological Regime of Rivers; Gidrometeoizdat: Leningrad, Russia, 1979; p. 200. (In Russian) [Google Scholar]
  28. Magritsky, D.V.; Frolova, N.L.; Vasilenko, A.N. The Inflow of River Water into Russian Arctic Seas: Its Amount, Long-term and Intraannual Changes. Russ. Meteorol. Hydrol. 2025, 50, 369–381. [Google Scholar] [CrossRef] [Scilit]
  29. Xi, Y.; Su, Y.; Yang, H.; Luo, Z.; Pan, G.; Xu, L.; Li, Z. Significant Increases in Extreme Heat and Precipitation over the Past 62 Years in the Tarim River Basin and Their Large-Scale Climatic Drivers. Sustainability 2026, 18, 2787. [Google Scholar] [CrossRef] [Scilit]
  30. Georgiadi, A.G.; Kashutina, E.A. The Features of Long-Term Annual and Seasonal Runoff Changes for Lena Basin Rivers. Izv. Akad. Nauk. Ser. Geogr. 2014, 2, 71–83. (In Russian) [Google Scholar]
  31. Georgiadi, A.G.; Kashutina, E.A. Long-Term Runoff Changes of the Largest Siberian Rivers. Izv. Akad. Nauk. Ser. Geogr. 2016, 5, 70–81. (In Russian) [Google Scholar] [CrossRef] [Scilit]
  32. Rodionov, S.N. A brief overview of the regime shift detection methods. Methods for detecting regime shifts in large marine ecosystems: A review with approaches applied to North Pacific data. Progr. Oceanog. 2005, 60, 165–182. [Google Scholar]
  33. Dastour, H.; Gupta, A.; Achari, G.; Hassan, Q.K. A Robust Regime Shift Change Detection Algorithm for Water-Flow Dynamics. Water 2023, 15, 1571. [Google Scholar] [CrossRef] [Scilit]
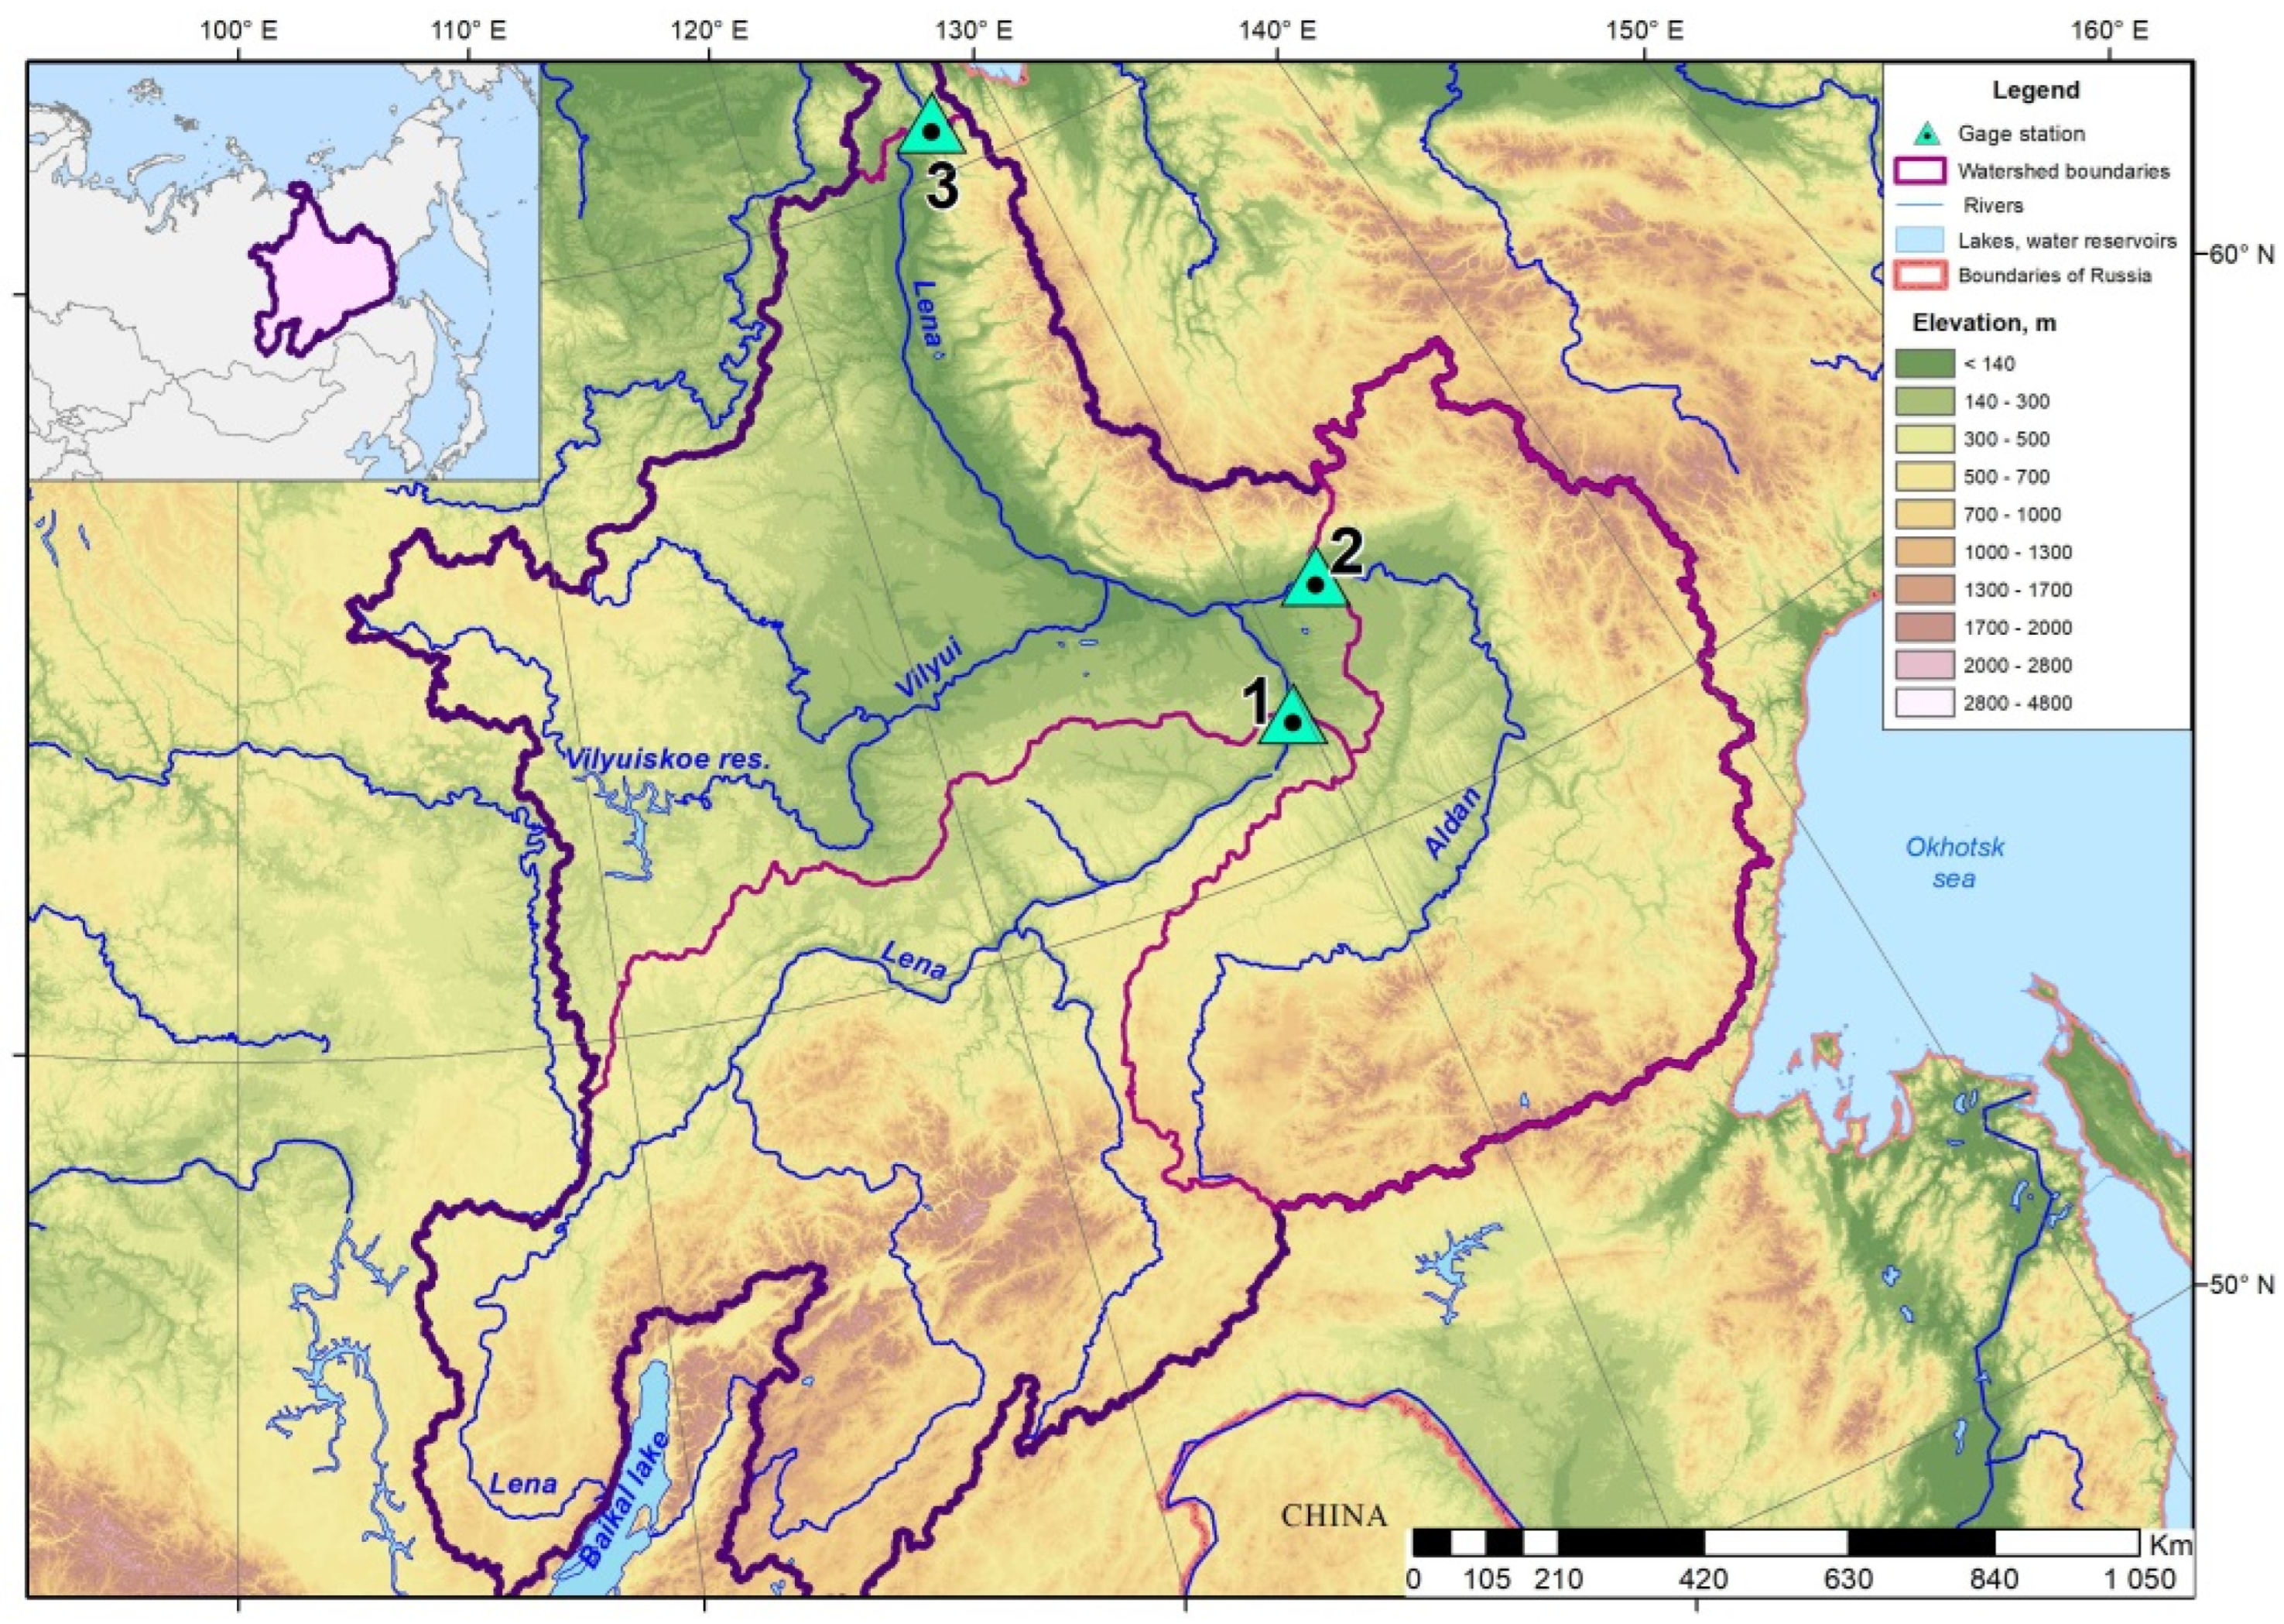
Figure 1. The Lena catchment. The flows studied here are measured at gauges on (1) the Lena River across Tabaga, (2) the Aldan River in Verkhoyanski Perevoz, and (3) the Lena River across Kyusyur. Map projection: Lambert Azimuthal Equal Area (central meridian 20° E, latitude of origin 45° N).
Water 18 01791 g001
Figure 2. Long-term changes in snowmelt flood flow, summer–autumn water flow, winter water flow, and annual water flow in the Lena River across Kyusyur, the Lena River across Tabaga and the Aldan River in Verkhoyanski Perevoz. Blue and red fields indicate positive and negative deviations relative to long-term averages, respectively; the green line is the normalized cumulative deviation curve (CDC). The vertical black lines show phase boundaries (shift points) between increased or decreased values of the water flow [6].
Water 18 01791 g002
Figure 3. The proportion of low-water and high-water years (with exceedance probability ≥75 and ≤25%, respectively) in long-lasting phases of increased (I) and decreased (D) annual water flow.
Water 18 01791 g003
Table 1. Main characteristics of the river basins studied.
River GaugeBasin Area,
103 km2
Proportion of the Basin with Elevation
≥1000 m, % [19]
Share of Main Natural Zones *, % of the Basin Area [20]Permafrost Share (All Types), % of the Entire Basin Area [21]Main Reservoirs’ Total Capacity, km3 [22]
Lena–Kyusyur243017Tu: 22
T: 71
I: 7
9435.9
Lena–Tabaga89725T: 93
I: 7
990
Aldan–Verkhoyanski Perevoz69622Tu: 18
T: 78
I: 4
930
Note(s): * TU—tundra, T—taiga, and I—Intrazonal (swamps and others).
Table 2. Characteristics of the flow of the studied rivers, averaged for the entire observation period.
River–GaugePeriod of ObservationMean Annual River Runoff, m3/sMean Daily Water Discharge, m3/s
Spring–Summer Snowmelt RunoffSummer–Autumn RunoffWinter Runoff
Lena–Kyusyur *1936–201917,17640,48922,9612621
Lena–Tabaga1936–2022730018,07710,7431406
Aldan–Verkhoyanski Perevoz1942–2022545314,9217882677
Note(s): * naturalized water discharges (for the restoration method see Section 2.2).
Table 3. Shift points for contrasting phases of annual and seasonal river water flow in the Lena River across Kyusyur, the Lena River across Tabaga and the Aldan River in Verkhoyanski Perevoz.
MethodRiver Gauge Station
Lena Across KyusyurLena Across TabagaAldan in Verkhoyanski Perevoz
Shift Pointp ValueShift Pointp ValueShift Pointp Value
Snowmelt flood flow
CDCD→I 1960/1961-D→I 1977/1978-D→I 1965/1966-
I→D 1970/1971I→D 1984/1985
D→I 1996/1997D→I 1994/1995
MWP test19610.0119940.0119660.01
1971~0.0519850.05
1997~0.119970.05
Summer–Autumn flow
CDCD→I 1987/1988-D→I 2002/2003-D→I 1971/1972-
I→D 1983/1984
D→I 1995/1996
MWP test19880.0519970.05 (0.031)19720.05
19840.05
19960.1
Winter water flow
CDCD→I 1987/1988-D→I 1997/1998-D→I 1989/1990-
MWP test19890.0119940.0119900.01
Annual water flow
CDCD→I 1996/1997-D→I 1996/1997-D→I 1969/1970-
I→D 1983/1984
D→I 1993/1994
MWP test19960.0119970.0119700.01
19840.05
19960.05
Note(s): I—increased river runoff and D—decreased river runoff, with the arrows showing the direction of runoff shift.
Table 4. Characteristics of contrasting phases of water flow of the Lena River across Kyusyur, the Lena River across Tabaga and the Aldan River in Verkhoyanski Perevoz.
River GaugeLena Across KyusyurLena Across TabagaAldan in Verkhoyanski Perevoz
Long PhaseMean Water Discharge, m3/sLength of Phase/YearsMean Water Discharge, m3/sLength of Phase/YearsMean Water Discharge, m3/sLength of Phase/Years
Snowmelt flood flow
D38,0811939–1960/2216,0041936–1977/4213,4521944–1965/22
D39,3721971–1996/26 12,8821985–1994/10
Daverage38,780 13,274
I44,2751961–1970/1018,1061978–2022/4516,2491966–1984/19
I42,5781997–2019/23 16,0521995–2022/28
Iaverage43,092 16,132
Iaverage − Daverage, m3/s4312 2102 2858
Iaverage − Daverage relative to Daverage11.1% 13.1% 21.5%
Summer–Autumn flow
D21,3791939–1987/4987741939–2003/6571611945–1971/27
D 66711984–1995/12
Daverage 7010
I25,1691988–2019/3210,5592004–2022/1988441972–1983/12
I 86071996–2022/27
Iaverage 8680
Iaverage − Daverage, m3/s3790 1784 1670
Iaverage − Daverage relative to Daverage17.7% 20.3% 23.8%
Winter flow
D22281937–1987/5112511939–1997/594971944–1989/46
I32461988–2019/3217501998–2022/258781990–2022/33
Iaverage − Daverage, m3/s1017 499 382
Iaverage − Daverage relative to Daverage45.6% 39.9% 76.8%
Annual flow
D16,4931939–1995/5769241939–1996/5849771945–1969/25
D - 48051984–1993/10
Daverage- - 4928
I18,7851996–2019/2480831997–2022/2657351970–1983/14
I - 59571994–2022/29
Iaverage 5885
Iaverage − Daverage, m3/s2293 1159 957
Iaverage − Daverage relative to Daverage13.9% 16.7% 19.4%
Note(s): Abbreviations for I and D are the same as in Table 3. In the table, the symbol ‘-’ means that phases have not been revealed.
Disclaimer/Publisher’s Note: The statements, opinions and data contained in all publications are solely those of the individual author(s) and contributor(s) and not of MDPI and/or the editor(s). MDPI and/or the editor(s) disclaim responsibility for any injury to people or property resulting from any ideas, methods, instructions or products referred to in the content.