Article

Long-Term Coal Mining-Driven Groundwater Flow Field Alteration and Its Impact on Pollutant Migration

1
Xi’an Center of China Geological Survey, Xi’an 710119, China
2
Key Laboratory of Groundwater Resources and Environment, Ministry of Education, Jilin University, Changchun 130021, China
*
Author to whom correspondence should be addressed.
Water 2026, 18(14), 1752; https://doi.org/10.3390/w18141752
Submission received: 17 June 2026 / Revised: 16 July 2026 / Accepted: 16 July 2026 / Published: 20 July 2026

Abstract

To reveal the impacts of long-term coal mining on groundwater flow fields and the environment, the Jinjitan Coal Mine in Shaanxi Province, China, was selected as the study area. A systematic investigation on the evolution of flow fields and migration of pollutants under long-term coal mining impact was conducted using methods including Self-Organizing Map (SOM) clustering analysis, water isotope analysis, and numerical simulation. The results show that groundwater in the study area is mainly derived from atmospheric precipitation, and the mine water is a mixture of 55% coal seam water and 45% Quaternary groundwater; long-term coal mining has led to two types of Quaternary groundwater level changes (stable and continuously declining); The groundwater level of the Jurassic aquifer shows an overall decline. However, where the aquifer is locally recharged by the Quaternary groundwater, the groundwater level shows a decline-then-rise variation. The overall groundwater flow field maintains the pattern of runoff from northeast to southwest and discharge into the Yuxi River, with no local or regional groundwater depression cones observed; numerical simulation results indicate an average groundwater level drop of 1.36 m over an 10-year period, with a maximum decrease of 4.89 m; the migration scope of oxygen demand and petroleum pollutants caused by domestic sewage pond leakage is limited, their maximum long-term (3650 d) migration distances are 253.47 m and 254.27 m, respectively, and their concentrations are far below the limit of the Class III groundwater quality standard. The research findings provide a scientific basis for the environmental protection, rational development, and utilization of groundwater in the Jinjitan Coal Mine area.

1. Introduction

Coal serves as the strategic cornerstone of China’s energy security and occupies an irreplaceable core position in national economic development. With abundant coal reserves, the arid and semi-arid mining areas in western China have become a key region for ensuring national energy supply [1,2]. Coal and water resources in China exhibit a distinct reverse distribution characteristic, i.e., the coal-rich northern regions are simultaneously confronted with the dual challenges of ecological fragility and water scarcity. Groundwater is not only the key water source for regional industrial and agricultural production but also a critical support for sustaining vegetation growth, soil moisture, and ecological balance. Its environmental stability directly determines the sustainable development potential of mining areas [3]. However, long-term coal mining may disrupt the in-situ rock stress balance of the stratum, triggering the development of water-conducting fracture zones and damage to aquifer structure. This further alters the recharge–runoff–discharge conditions of groundwater, leading to a series of ecological and environmental problems such as disturbance of groundwater flow field, water level decline, and water pollution, which have become the key problems restricting green coal development [4,5,6,7].
In the Jurassic coalfields of northern China, water-conducting fracture zones induced by shallow coal seam mining often directly connect with unconsolidated aquifers. This shifts the groundwater flow field from horizontal runoff to vertical migration, resulting in a significant negative groundwater balance deficit and markedly exacerbating regional water scarcity [8]. Meanwhile, ground fissures generated by coal mining subsidence can accelerate precipitation infiltration and evaporation processes, forming a “funnel zone” in soil moisture content near the fissures. In key ecological zones where the groundwater table depth is less than 5 m, the ecological water consumption of vegetation decreases sharply, and the stability of the ecosystem is severely damaged [9,10,11,12]. Additionally, acid mine water, high-salinity mine water produced during mining operations, and oxygen demand and petroleum pollutants from domestic sewage leakage further threaten groundwater quality safety [13,14,15]. Currently, Class III and IV groundwater quality accounts for a relatively high proportion in key coal development areas of the Yellow River Basin, making the “coal–water–ecology” conflict increasingly acute.
Problems such as the development of water-conducting fracture zones, changes in hydraulic connections between aquifers, and pollutant leakage caused by long-term coal mining exhibit complex spatiotemporal evolution characteristics [16,17,18,19]. Han et al. investigated the evolution of groundwater flow fields under coal mining activities and found that a dynamic circulation pattern of groundwater developed in the mining area. Based on theoretical analysis and field investigations [20]. Li et al. revealed that coal mining activities altered groundwater flow fields and damaged aquifer structures [21]. Xu et al. found that the height of the water-conducting fractured zone is a critical factor determining the impact of coal mining on aquifers [22]. As a core method for quantitative analysis of the evolution of groundwater flow fields and migration of pollutants, numerical simulation can effectively integrate hydrogeological parameters and mining conditions to achieve dynamic characterization of complex groundwater systems [23,24,25,26,27,28]. Based on models such as MODFLOW and MT3DMS, researchers can simulate groundwater level variations, hydraulic connections among aquifers, and contaminant transport processes under different mining conditions [29]. Existing studies have mainly focused on individual aspects, such as analyzing groundwater level decline caused by coal mining or evaluating the characteristics of contaminant plume expansion after pollution sources are generated [30,31]. However, comprehensive investigations into the entire process of “aquifer structural changes–groundwater flow field evolution–contaminant migration responses” under long-term mining conditions remain insufficient. This limitation is particularly evident in ecologically fragile arid and semi-arid mining regions of Northwest China, where integrated studies combining long-term monitoring data, multi-source hydrochemical tracing, and groundwater flow modeling are still limited.
Based on this, this study takes the Jinjitan Coal Mine as a typical case and combines SOM hydrochemical clustering and hydrogen and oxygen isotopes to identify groundwater sources and analyze hydraulic mixing patterns among aquifers, providing hydrochemical evidence for subsequent analysis of groundwater flow field evolution. Then, a groundwater numerical model is constructed based on groundwater source information and measured hydrogeological data to quantify groundwater level evolution and contaminant migration patterns under mining disturbances, systematically revealing the impact mechanisms of long-term coal mining on groundwater systems. The research findings aim to provide a scientific basis for the optimization of dynamic groundwater monitoring schemes, adjustment of mining processes, and pollution prevention and control in the Jinjitan Coal Mine area, while also offering theoretical support for water resource protection and ecological restoration in ecologically fragile mining areas.

2. Study Area

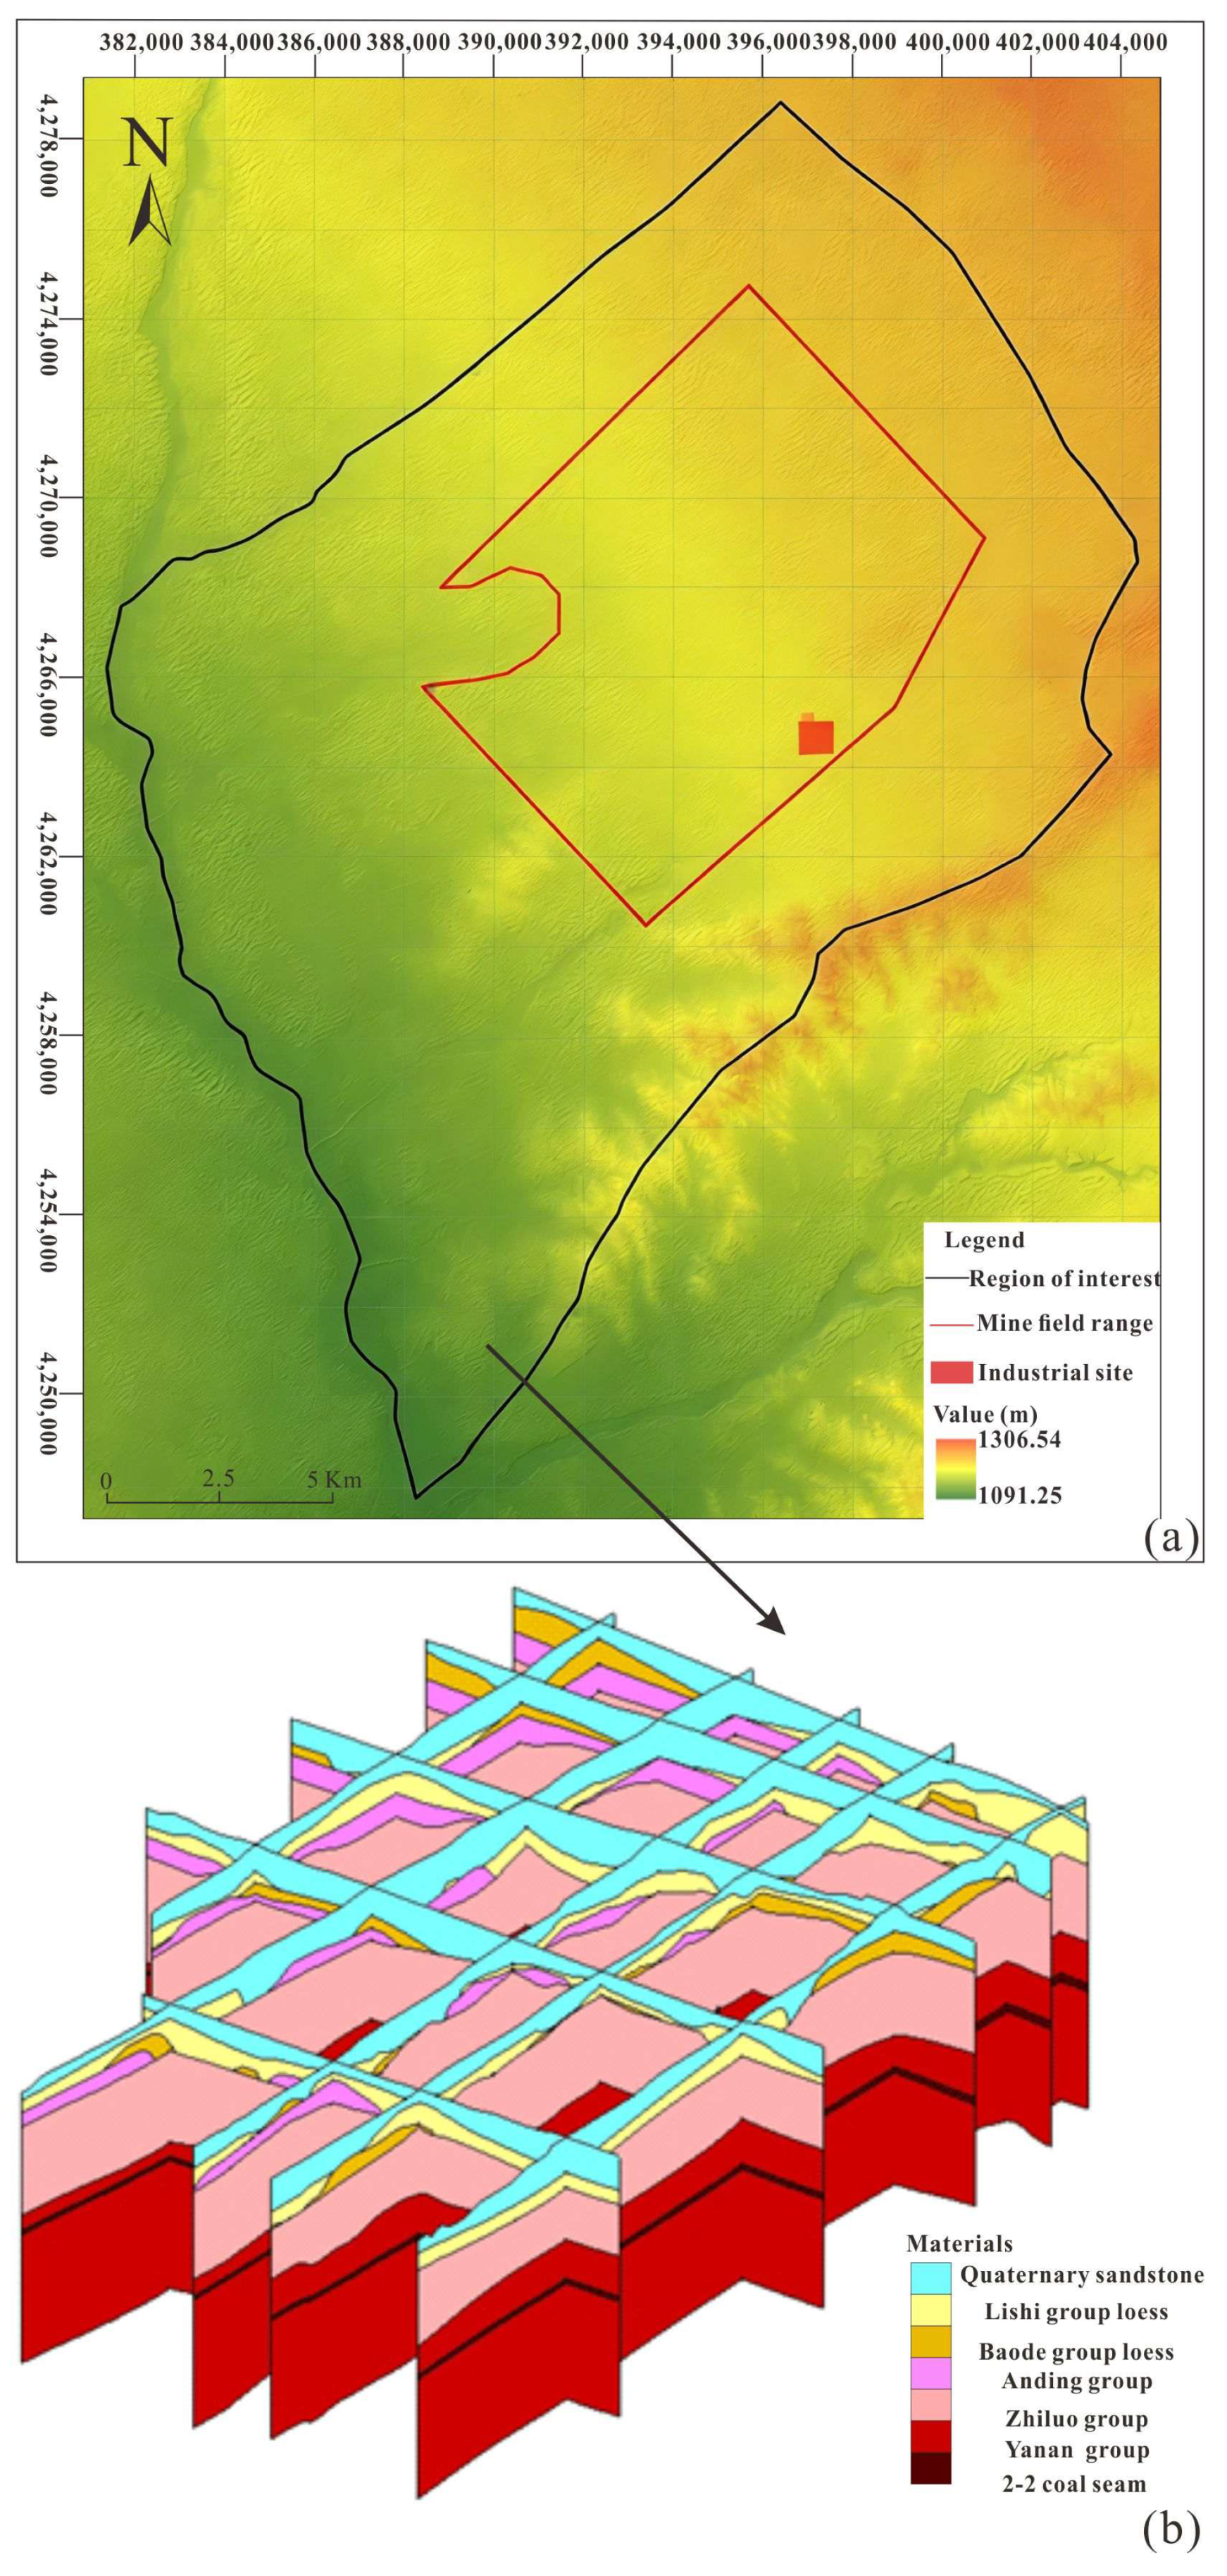
Jinjitan Coal Mine is situated in Jinjitan Town, Yuyang District, Yulin City, Shaanxi Province. The overall terrain slopes from northeast to southwest, characterized by higher elevations in the northeast and lower in the southwest.
The study area has a simple geological structure, presenting an overall monoclinal structure that gently dips northwestward with an average dip angle of less than 1°. There are no folds or magmatic activities, only small-scale gentle undulations and one high-angle normal fault (F1) developed. Climatically, the area falls under a temperate continental monsoon semi-arid grassland climate, with precipitation concentrated in autumn. The multi-year average annual precipitation is 429.8 mm. Hydrologically, the study area belongs to the Yuxi River Basin, a secondary tributary of the Yellow River. The main surface water systems include the Yuxi River and its tributaries. The Jinjitan groundwater flow subsystem is a relatively independent groundwater flow subsystem within the northern groundwater flow system of the Ordos Basin. Its scope is basically consistent with that of the surface water basin. The aquifer system is mainly composed of the Quaternary Salawusu Formation, under which the Jurassic System consists of coal-bearing strata with extremely weak water-bearing capacity, basically not of water supply value. This flow system is mainly recharged by precipitation infiltration, with evaporation, overflow to rivers, and mining as the main discharge methods. Groundwater generally flows from northeast to southwest, exhibiting the runoff characteristic of converging and discharging into the Yuxi River.
The spatial structural characteristics of the Quaternary, Neogene, and each formation of the Jurassic in the Jinjitan Coal Mine are shown in Figure 1. The formation interfaces generally gently dip northwestward. The coal-bearing strata in the coalfield is the Yan’an Formation, and the current main minable coal seam is the 2-2 coal seam of the Jurassic Yan’an Formation. The Quaternary Salawusu Formation phreatic aquifer is widely distributed in the area and serves as the main water-filling source of the mine.

3. Materials and Methods

3.1. Sample Collection and Analysis

To investigate the impact of coal mining on the groundwater environment, water samples were collected from the upstream, downstream, left, and right sides of potential pollution sources (mainly industrial sites). Additionally, to fully understand the current status of groundwater quality in the study area, sampling and testing were also conducted in the periphery of the mining area. Before sampling, the sampling bottles were cleaned 3–4 times with distilled water. Water samples were filled into the bottles, sealed, and transported back to the laboratory. Portable instruments were used to determine pH and TDS. Water samples were filtered through a 0.45 μm filter membrane. Conventional hydrochemical ions (Na+, K+, Ca2+, Mg2+, SO42−, Cl, NO3) in the water samples were detected using an ion chromatograph (SCS-1100 (Thermoelectric Corporation of America)). HCO3 ions in the water samples were measured by acid–base titration with phenolphthalein and methyl orange as indicators [32]. Oxygen demand was determined via acidic potassium permanganate titration, and petroleum substances were analyzed using ultraviolet spectrophotometry. The δD and δ18O values in water were measured with a Thermo stable isotope ratio mass spectrometer (MAT253 (Thermo Fisher Scientific)). The laboratory measurement error for δD is ±0.5‰, and for δ18O it is ±0.2‰. The test results are presented in Table S1.

3.2. Self-Organizing Map (SOM) Clustering Analysis

The Self-Organizing Map (SOM) is an artificial neural network model designed with two primary objectives: (1) nonlinear dimensionality reduction, and (2) unsupervised classification. SOM can map high-dimensional data to a low-dimensional space while preserving its topological structure, and it possesses adaptive and nonlinear characteristics. In this study, Na+, K+, Ca2+, Mg2+, Cl, SO42−, HCO3, pH, and TDS were used as indicators for data normalization. The normalization was performed using the normalize function in MATLAB (2019b). For a random variable x with mean μ and standard deviation σ, the normalization function is expressed as: x′ = ( x     μ ) / . Subsequent to normalization, SOM was employed to perform clustering analysis on 26 water sample datasets. The map size was determined using a heuristic rule, i.e., 5 M where M denotes the sample size [33,34,35]. Since SOM clustering analysis does not automatically determine the optimal number of clusters, the K-means algorithm was applied to its results. In practice, a relatively smaller Davies–Bouldin index indicates an appropriate number of clusters [36].

3.3. Numerical Model

The study involves Quaternary and multiple Jurassic multi-layer aquifers. Coal mining disturbances induce vertical leakage and vertical recharge–discharge through water-conducting fractures, resulting in significant vertical stratification differences in groundwater levels. A three-dimensional model can accurately characterize hydraulic exchanges among multi-layer aquifers and vertical seepage processes, matching the actual characteristics of the multi-layer hydrogeological structure. Therefore, based on the generalization of the lithological characteristics of aquifers and aquitards according to the hydrogeological conditions of the simulated area, the groundwater flow in the simulated area is defined as a heterogeneous, isotropic, three-dimensional spatial structure with unsteady seepage. Its mathematical model is expressed as follows:
{ S s H t = x ( K x H x ) + y ( K y H y ) + z ( K z H z )     ( x , y , z ) Ω ,   t > 0 { μ H t H = Z = ( K + W ) H z + W       ( x , y , z ) Γ 0 ,   t > 0 H ( x , y , z , t ) | t = 0 = H 0 ( x , y , z )         ( x , y , z ) Ω ,   t = 0     K n H n | Γ 1 = q ( x , y , z , t )                 ( x , y , z ) Γ 1 ,   t > 0 K n H n | Γ 2 = 0                                             ( x , y , z ) Γ 2 , t > 0
where: Ω—seepage region; H—aquifer water level elevation (m); Z—phreatic aquifer base elevation (m); Γ 1 —flow boundary of the seepage region (Type II boundary); q—unit width seepage discharge on the flow boundary (m2/d), and q(x,y,z,t) represents the spatially and temporally varying normal specific flux per unit width on the second-type boundary, which characterizes the intensity of water exchange between the model domain and external aquifers. The value is jointly determined by four components: (1) the natural lateral flow and river exchange base flux calculated from hydrogeological conditions; (2) the dynamic drainage discharge induced by mine dewatering; (3) the spatially differentiated allocation among three-dimensional layers; and (4) model identification and calibration based on measured groundwater level data, resulting in a spatiotemporally distributed flux function; H0(x,y,z)—initial water level of the aquifer (m); n—outward normal direction of the boundary; K—aquifer hydraulic conductivity (m/d); W—vertical recharge or discharge intensity on the phreatic surface; μ—specific yield of the phreatic aquifer (dimensionless); Ss—pecific storage of the confined aquifer (1/m).
The study found that after petroleum hydrocarbons entered the vadose zone, they mainly underwent lateral diffusion, and the contaminant concentration at the center did not exceed 1 mol/m3 within one year of migration [37]. The maximum simulation period in this study is 10 years; therefore, for this groundwater pollution simulation, only the advection and dispersion of pollutants with groundwater are considered. Environmental attenuation factors that may exist, such as chemical reactions (e.g., acid–base reactions, redox reactions, adsorption, exchange, volatilization, and biochemical reactions) between pollutants and liquid media (groundwater) or solid media (vadose zone media and groundwater aquifer media), are considered conservatively.
When contaminated infiltrating water recharges groundwater, petroleum pollutants in groundwater will mainly migrate along the groundwater flow direction, expanding the pollution range [38]. Accordingly, the migration of petroleum pollutants in the aquifer is simplified as a mathematical model based on the two-dimensional hydrodynamic dispersion equation:
{ ( θ C ) t = x ( θ D x ( C ) x ) + y ( θ D y ( C ) y ) x ( θ v x C ) y ( θ v y C ) + q s C s c ( x , y , 0 ) = c 0 ( x , y , 0 ) ( c v D g r a d c ) . n | Γ = Ψ ( x , y , z )
where: C—pollutant concentration (kg/m3); Dx, Dy—dispersion coefficients in the x and y main directions (m2/d); vx, vy—actual seepage velocities in the x and y main directions (m/d); c0—initial concentration of the pollutant (kg/m3); Γ—Type II boundary; Ψ—boundary solute flux; gradc—concentration gradient; qs—sewage infiltration rate; Cs—pollutant concentration in sewage.
Ψ = θ ( C v D · C ) · n
θ represents the aquifer porosity; C represents the contaminant concentration; v is the seepage velocity vector; D is the hydrodynamic dispersion coefficient tensor; ∇C is the concentration gradient; and n is the outward normal unit vector of the boundary. There are no dynamic external pollution sources at the regional boundaries, the natural groundwater background concentration is stable, temporal fluctuations of the flow field are weak, and boundary fluxes are much smaller than the internal contaminant source strength. This simplification reduces numerical complexity and does not affect the core prediction results.
The two-dimensional solute transport model ignores the weak vertical dispersion of contaminants and cannot characterize the minor vertical exchange of pollutants between upper and lower layers. If localized damaged pathways exist within aquitards, the model may slightly underestimate vertical contaminant diffusion. This deviation has a negligible impact on the maximum horizontal migration distance and the central contaminant concentration. The overall prediction results are conservative and meet the requirements of groundwater environmental risk assessment.

4. Analysis of Groundwater Sources

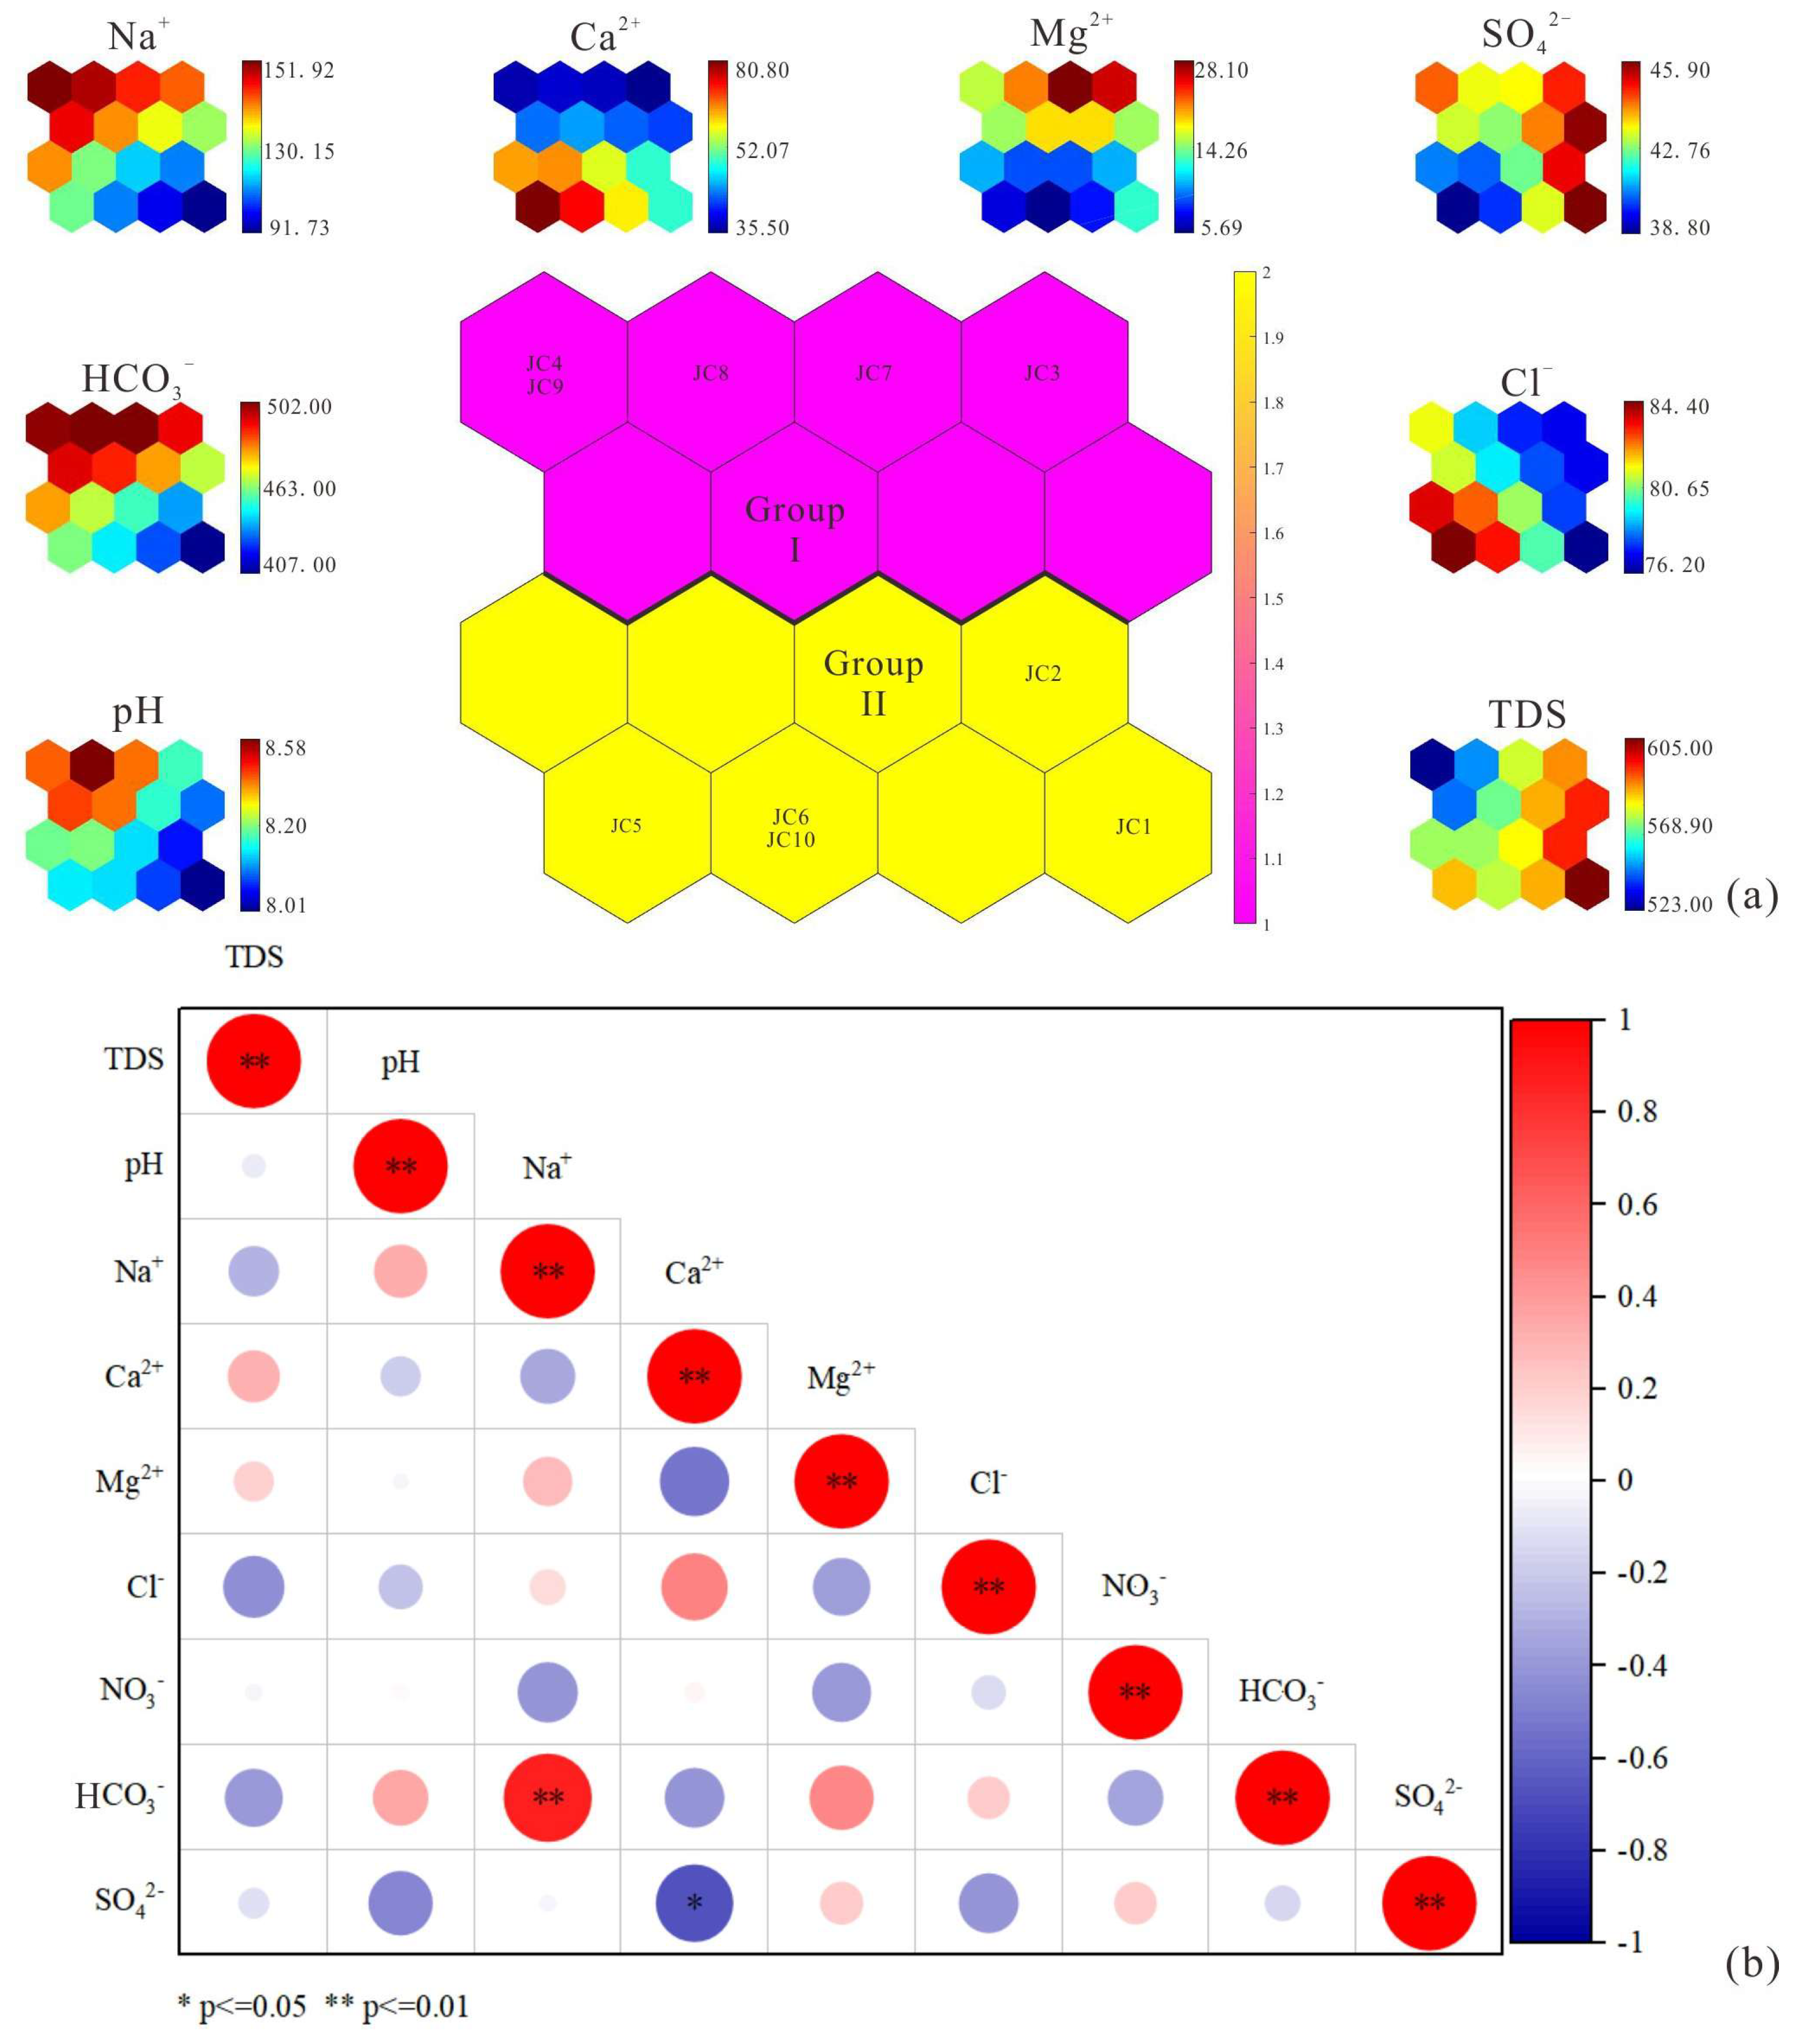
The color gradient between subgraphs in the SOM matrix can reveal the relationships among variables (Figure 2a). To further confirm the quantitative relationships between the eight ionic components, a correlation coefficient diagram of the eight hydrochemical parameters was plotted (Figure 2b). The concentrations of Na+ and HCO3 gradually increase from the bottom left to the top right, showing similar variation trends, and these two parameters are significantly positively correlated (p < 0.01), indicating potential influence from silicate (albite) dissolution. Generally, Ca2+ and SO42− exhibit similar color gradient changes, suggesting possible gypsum dissolution/precipitation. However, in Figure 2a, the color change trends of Ca2+ and SO42− are opposite, and Na+ is significantly negatively correlated with SO42− (p < 0.05), indicating potential influence from cation exchange reactions.
The distance between topological structures in the clustering matrix can reflect the similarity between neurons; the closer the distance between neurons, the higher the similarity. The clustering results are shown in Figure 2a. Cluster I is located in the upper part of the matrix, with characteristic indicators including pH, HCO3, Na+, and Mg2+, and consists of Jurassic groundwater in the mining area (JC3), Jurassic groundwater outside the mining area (JC4), and surface water (JC7, JC8, JC9); Cluster II is located in the lower part, with characteristic indicators including Cl, TDS, SO42−, and Ca2+, and also comprises groundwater in the mining area, Jurassic groundwater outside the mining area, and surface water samples. This indicates that mixing has occurred among the three, leading to similar hydrochemical characteristics across different aquifers and regions.
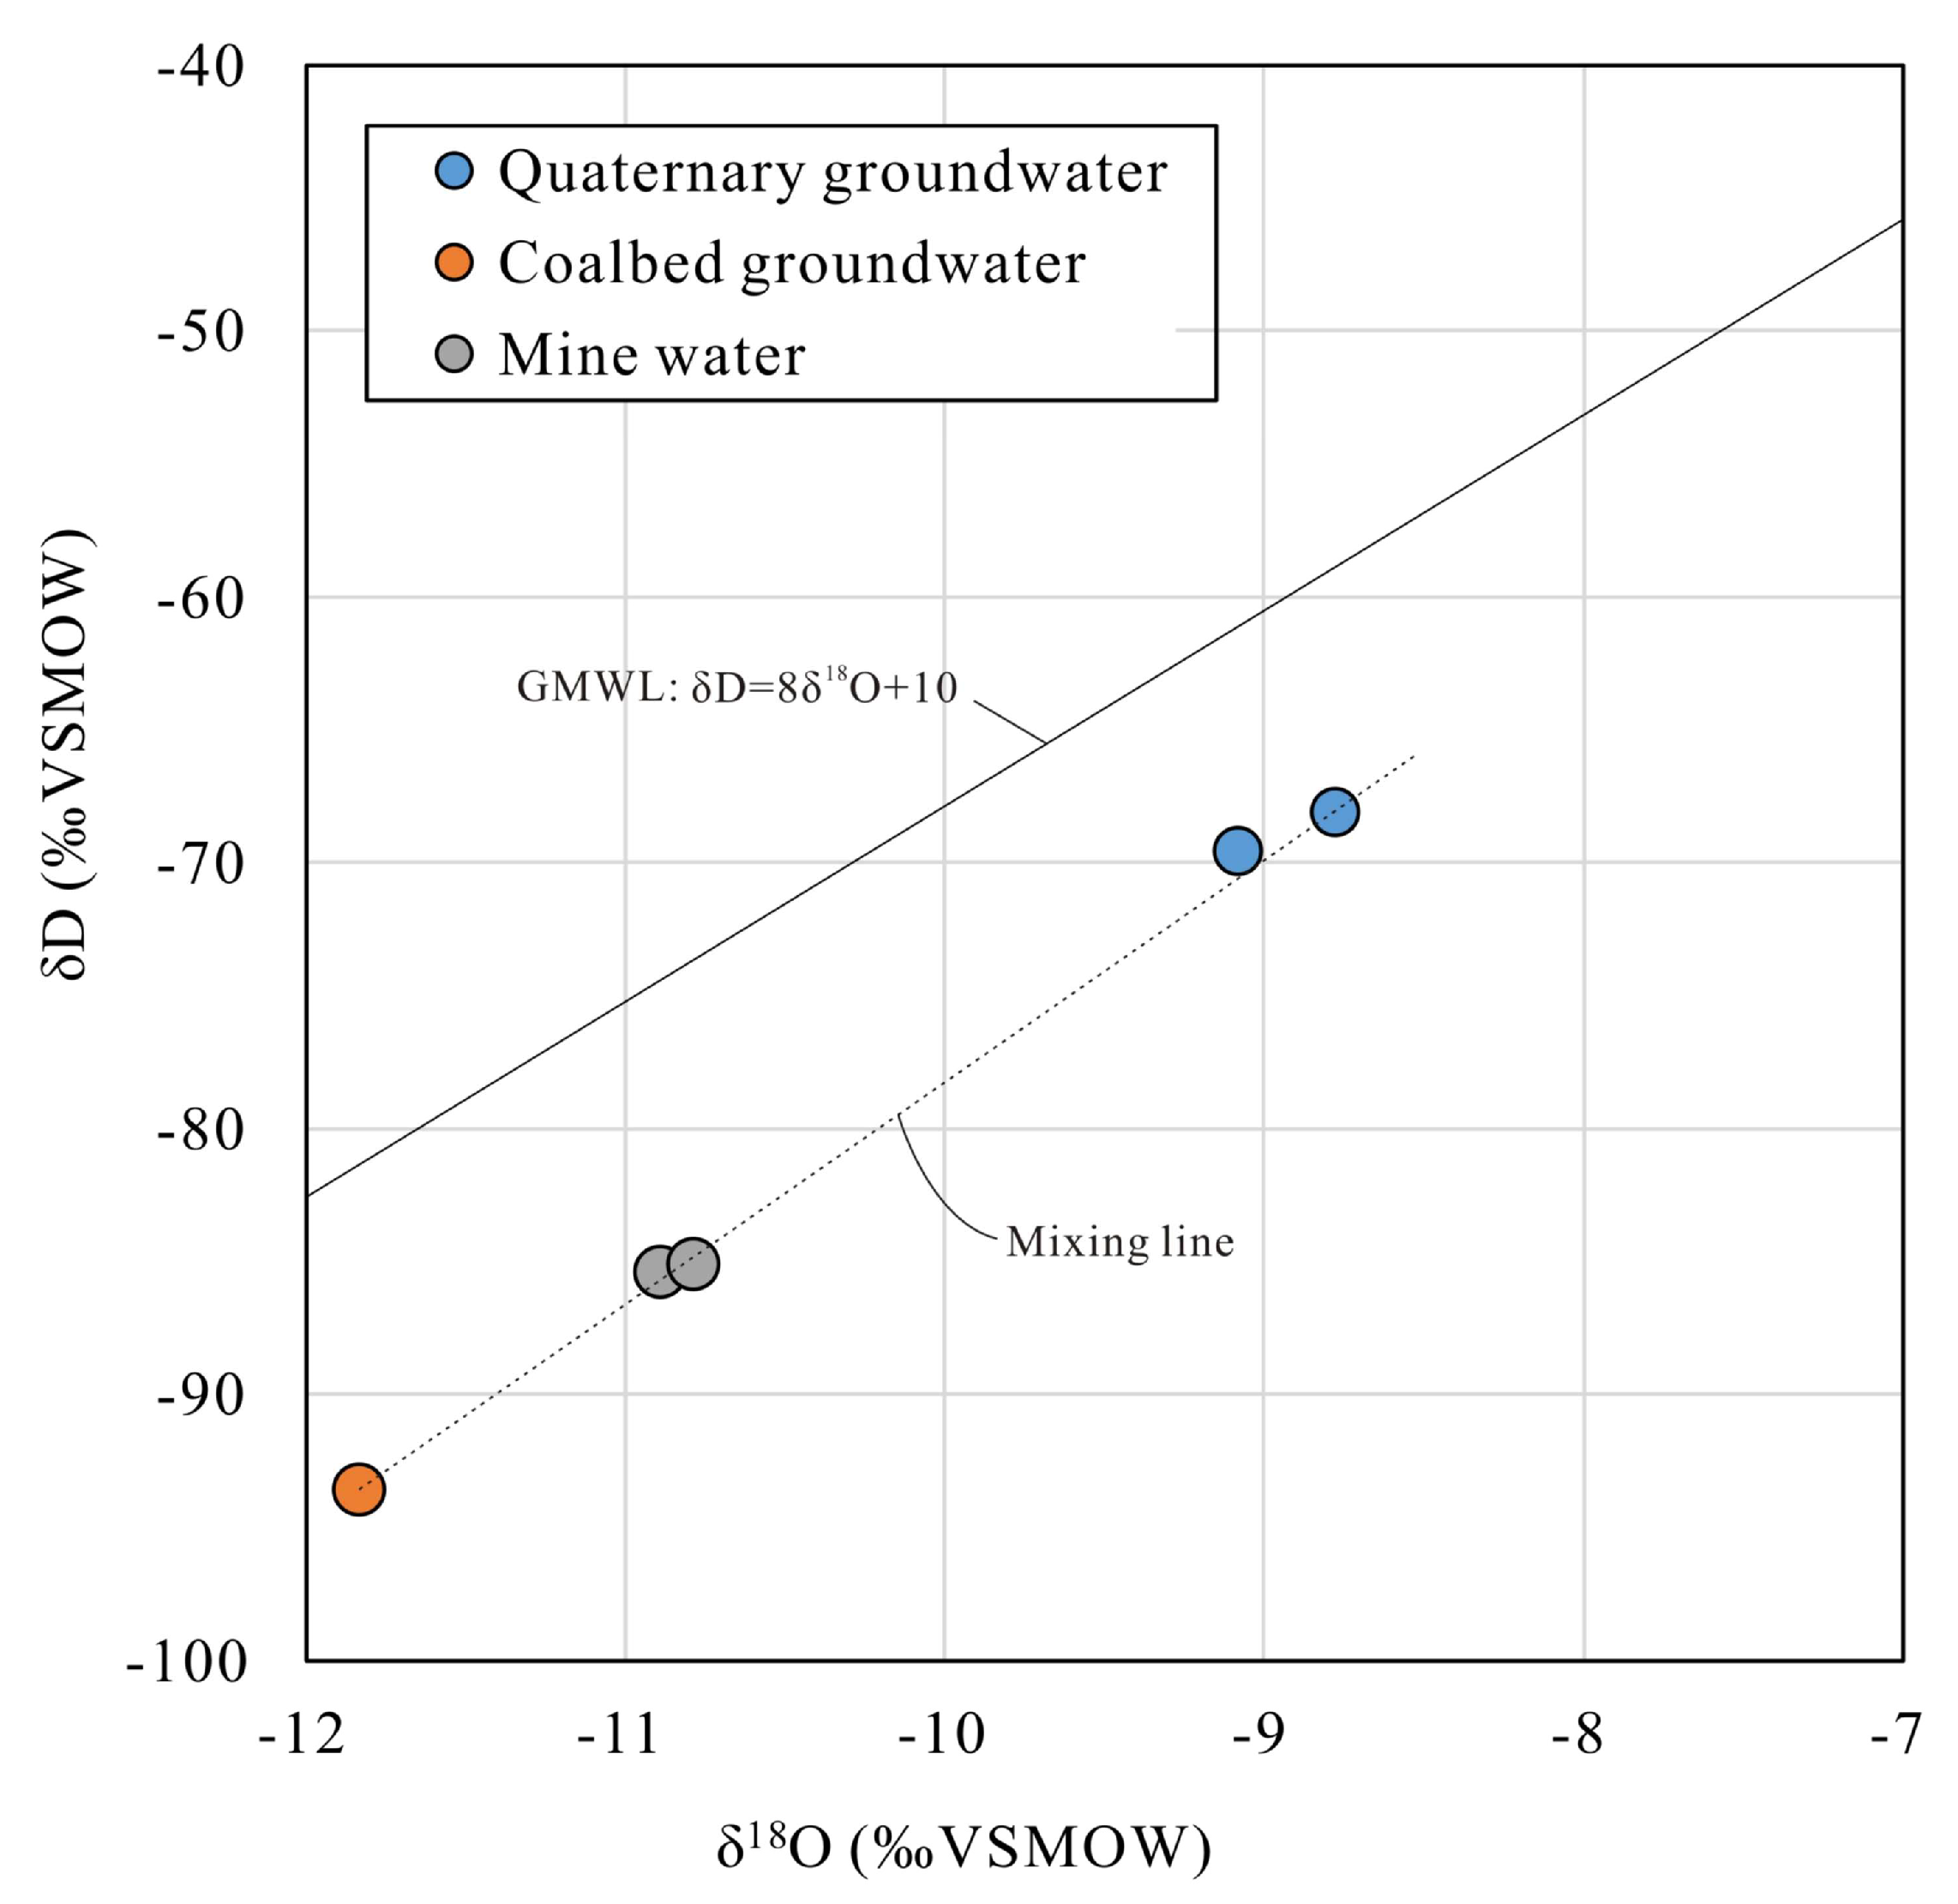
The deuterium–oxygen isotope relationship is shown in Figure 3. The deuterium and oxygen values of mine water, coal seam water, and Quaternary groundwater all lie below the Global Meteoric Water Line (GMWL), indicating that groundwater is derived from atmospheric precipitation and has been affected by evaporation during the groundwater seepage process. The three form a good linear relationship, and the isotopic values of mine water fall between those of Quaternary groundwater and coal seam water, indicating that coal mining has caused significant mixing of different aquifers in the study area, which is consistent with the conclusions of hydrochemical analysis. Based on the binary linear mixing relationship, and combined with the principle of isotope mass conservation, the proportion of different sources of mine water can be calculated as follows:
XC δDC + XQ δDQ = δDM
XC + XQ = 1
XQ = (δDC − δDQ)/(δDM − δDQ)
where: XC—the mixing ratio of coal seam water in mine water; XQ—the mixing ratio of Quaternary groundwater in mine water (%); δDC, δDQ, δDM = δD values of coal seam water, Quaternary groundwater, and mine water, respectively (‰VSMOW).
The contribution ratios of coal seam water and Quaternary groundwater to the mine groundwater are estimated as follows: XC = 55%, XQ = 45%.

5. Evolution of Flow Field Under Long-Term Coal Mining

5.1. Characteristics of Groundwater Level Changes

To clearly grasp the characteristics of groundwater level changes in the mining area, a total of 16 dynamic groundwater level monitoring wells were arranged at different horizons in Jinjitan Coal Mine (Figure S1). Among them, six are for Quaternary groundwater, six for Jurassic weathered fractured water, two for the Jurassic Zhiluo Formation, and two for the Jurassic Yan’an Formation.
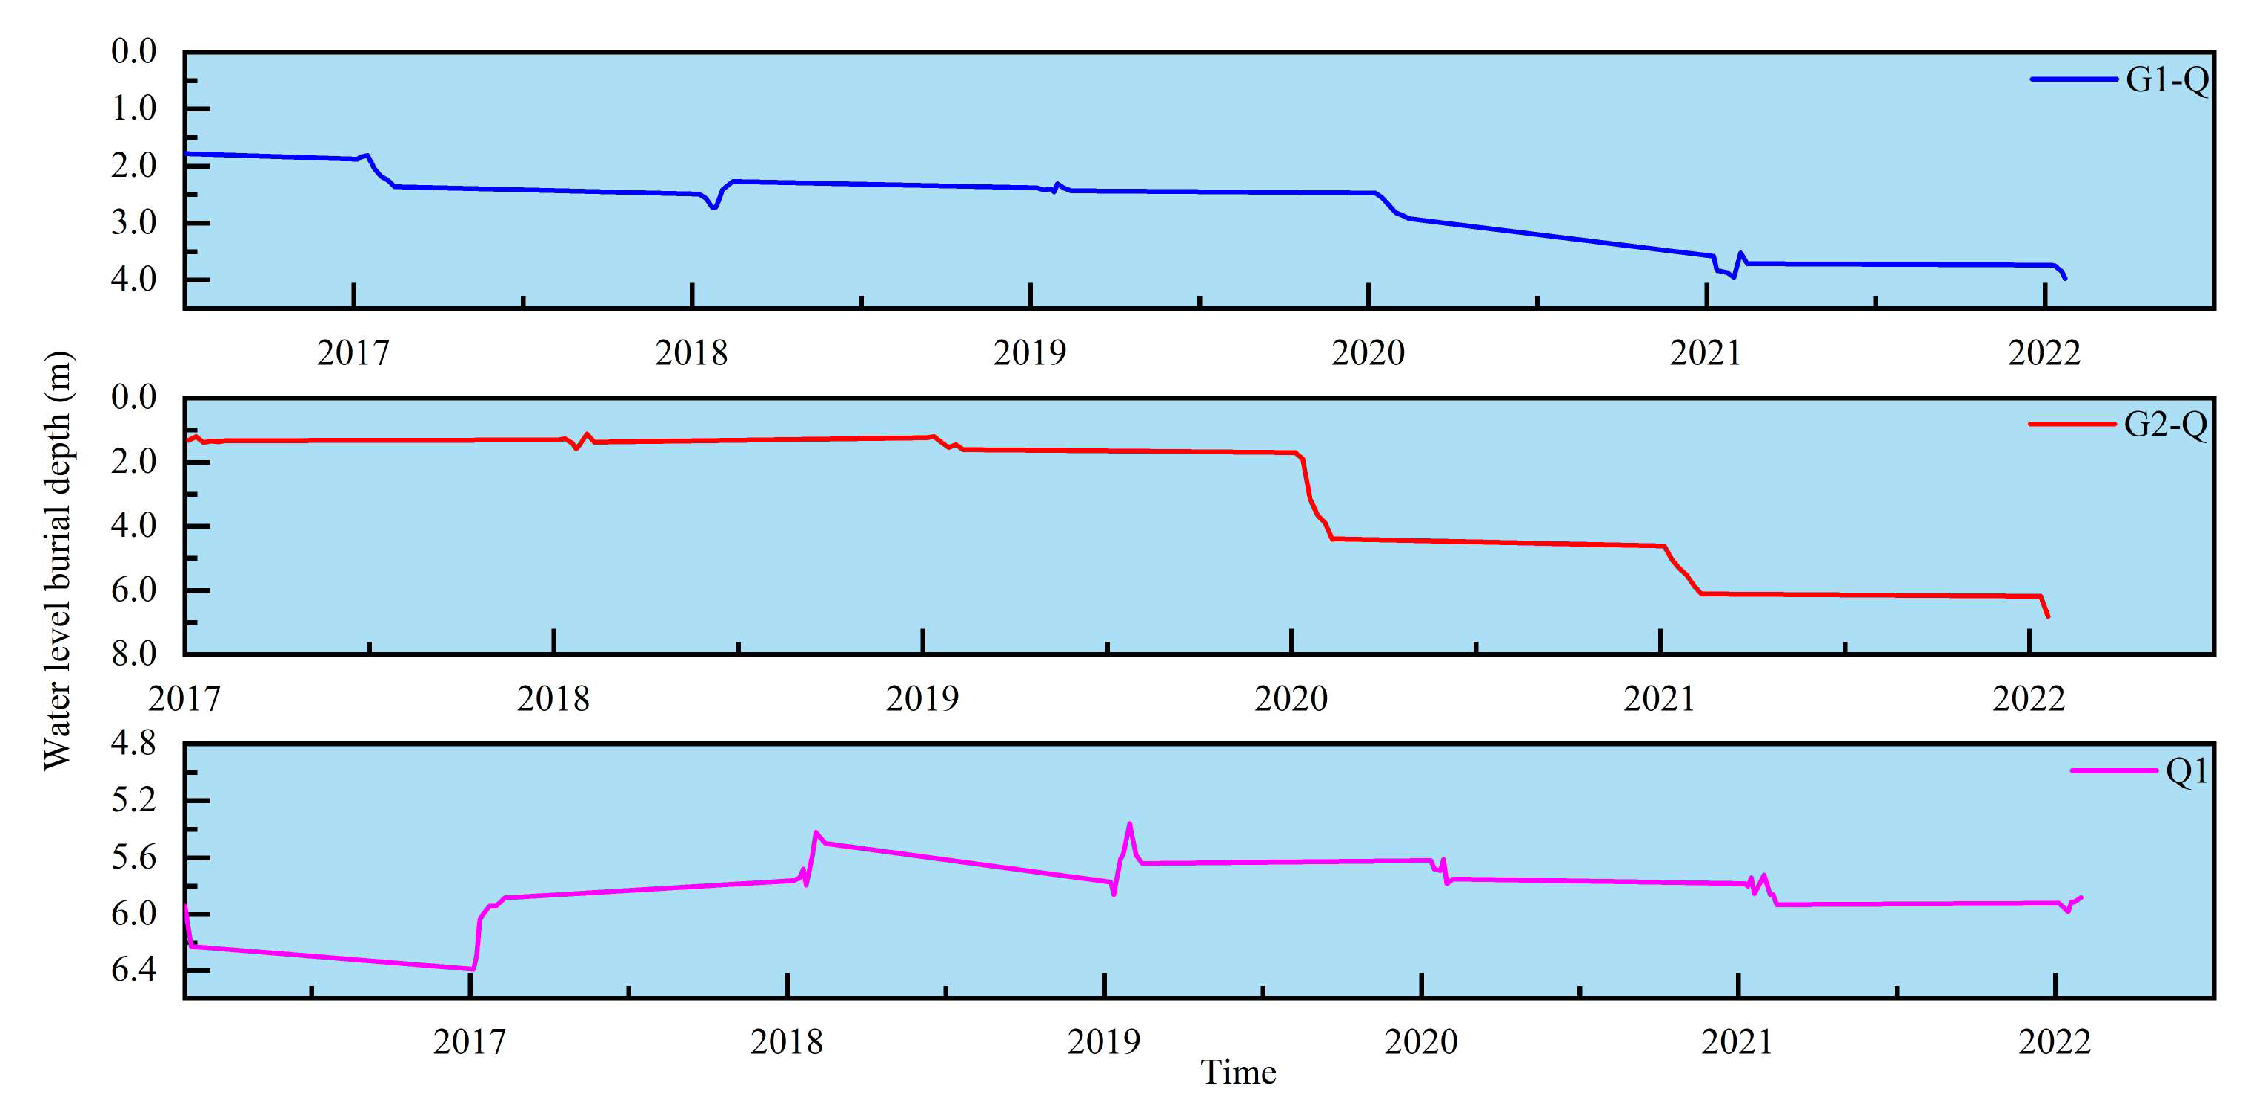
Groundwater level dynamic curves were plotted based on long-term dynamic observation data of groundwater levels in the study area. As shown in Figure 4, affected by the long-term artificial extraction of Quaternary groundwater and coal seam mining, the Quaternary groundwater level has decreased to varying degrees. According to the decline trends, the level changes can be divided into two types: stable type (Monitoring Point Q1) and sustained decline type (Monitoring Points G1-Q and G2-Q). Combined with the mining situation in the study area, it is found that the groundwater level at stable-type monitoring points is mainly affected by mine water inflow from the main and auxiliary inclined shafts, ventilation shafts during the construction period, and the first mining face. Although the Quaternary groundwater level has dropped by approximately 4 m, it has basically stabilized at present. In contrast, the decline amplitude of the sustained decline-type groundwater level is related to the distance between the monitoring well and the mining face as well as the coal mining methods. The closer the distance to the mining face, the greater the decline amplitude, and vice versa.
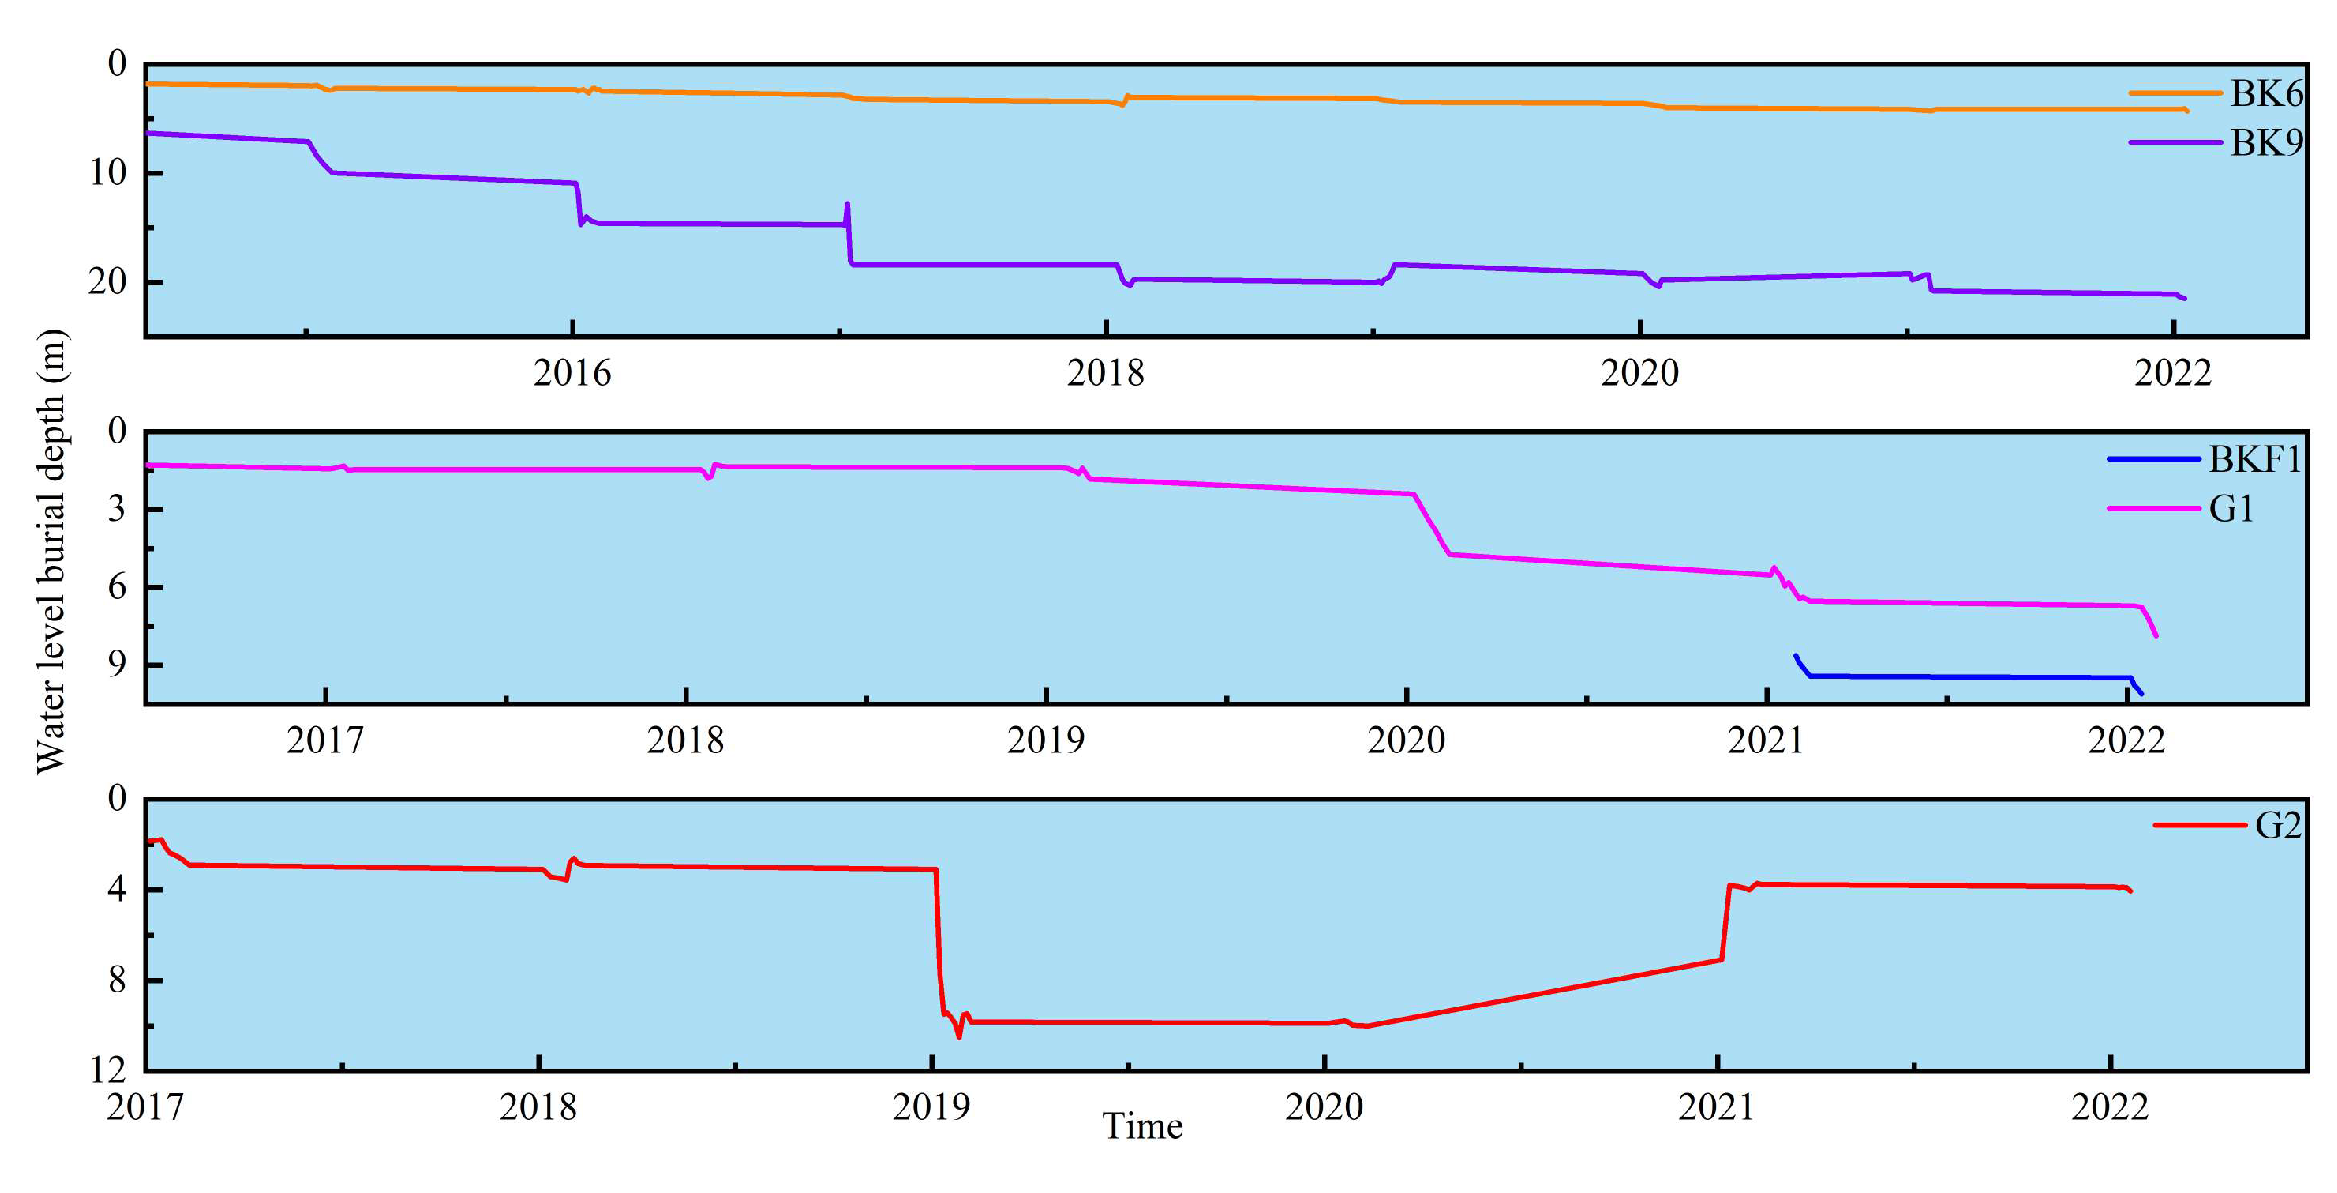
The primary influencing factor for the dynamic changes of Jurassic groundwater level is coal seam mining. Based on the current monitoring data of weathered fractured water and groundwater in the Zhiluo Formation (Figure 5), the groundwater level of this type generally shows a decreasing trend on an interannual basis. In addition to the distance between the monitoring well and the mining face as well as coal mining methods, the decline amplitude is also related to the occurrence horizon. Overall, the relatively upper weathered fractured water in the Jurassic System has a smaller relative decline amplitude (Monitoring Points G1, G2, and BKF1), with the decline not exceeding 10 m. Meanwhile, the groundwater level at Monitoring Point G2 first decreased and then increased, which may be due to the intensified hydraulic connection between the Jurassic and Quaternary aquifers under the influence of long-term mining, resulting in recharge from Quaternary groundwater. The groundwater at Monitoring Points BK6 and BK9 has a relatively large decline amplitude, among which the water level at BK9 dropped by more than 18 m. The reason is that BK9 is close to the mining face and significantly affected by dewatering drainage, leading to remarkable dynamic changes in water level.

5.2. Evolution of Flow Field

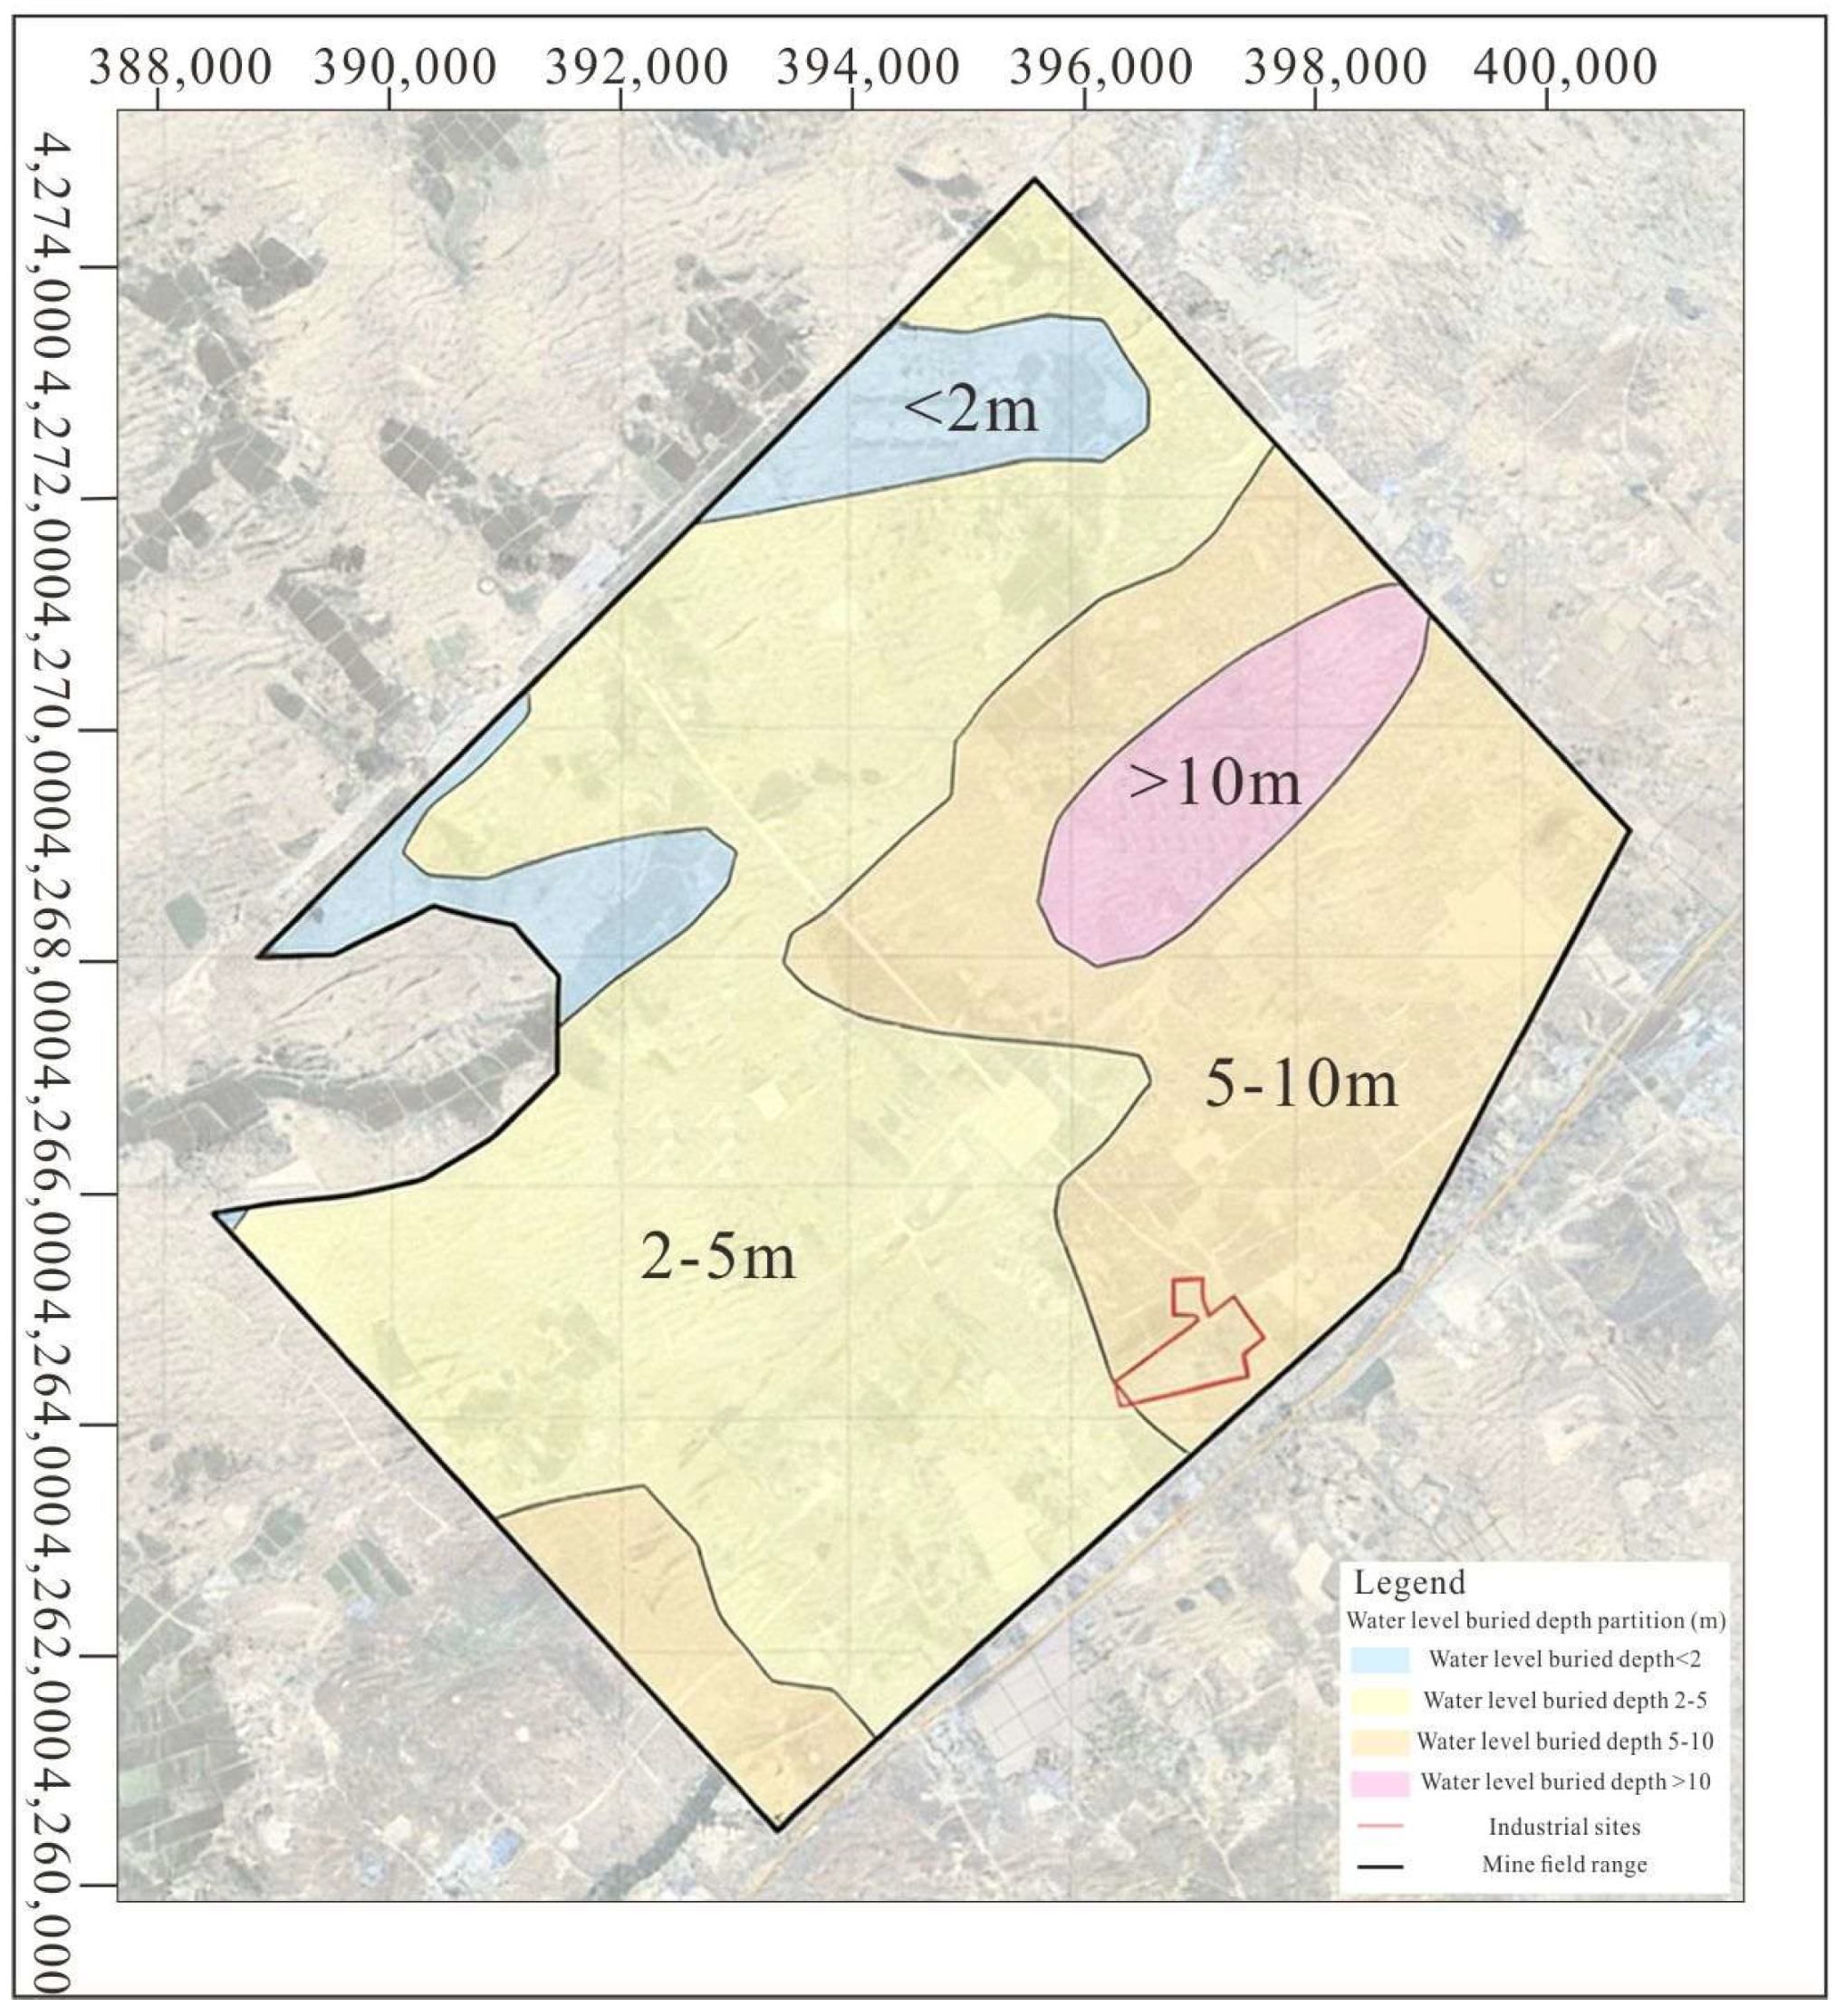
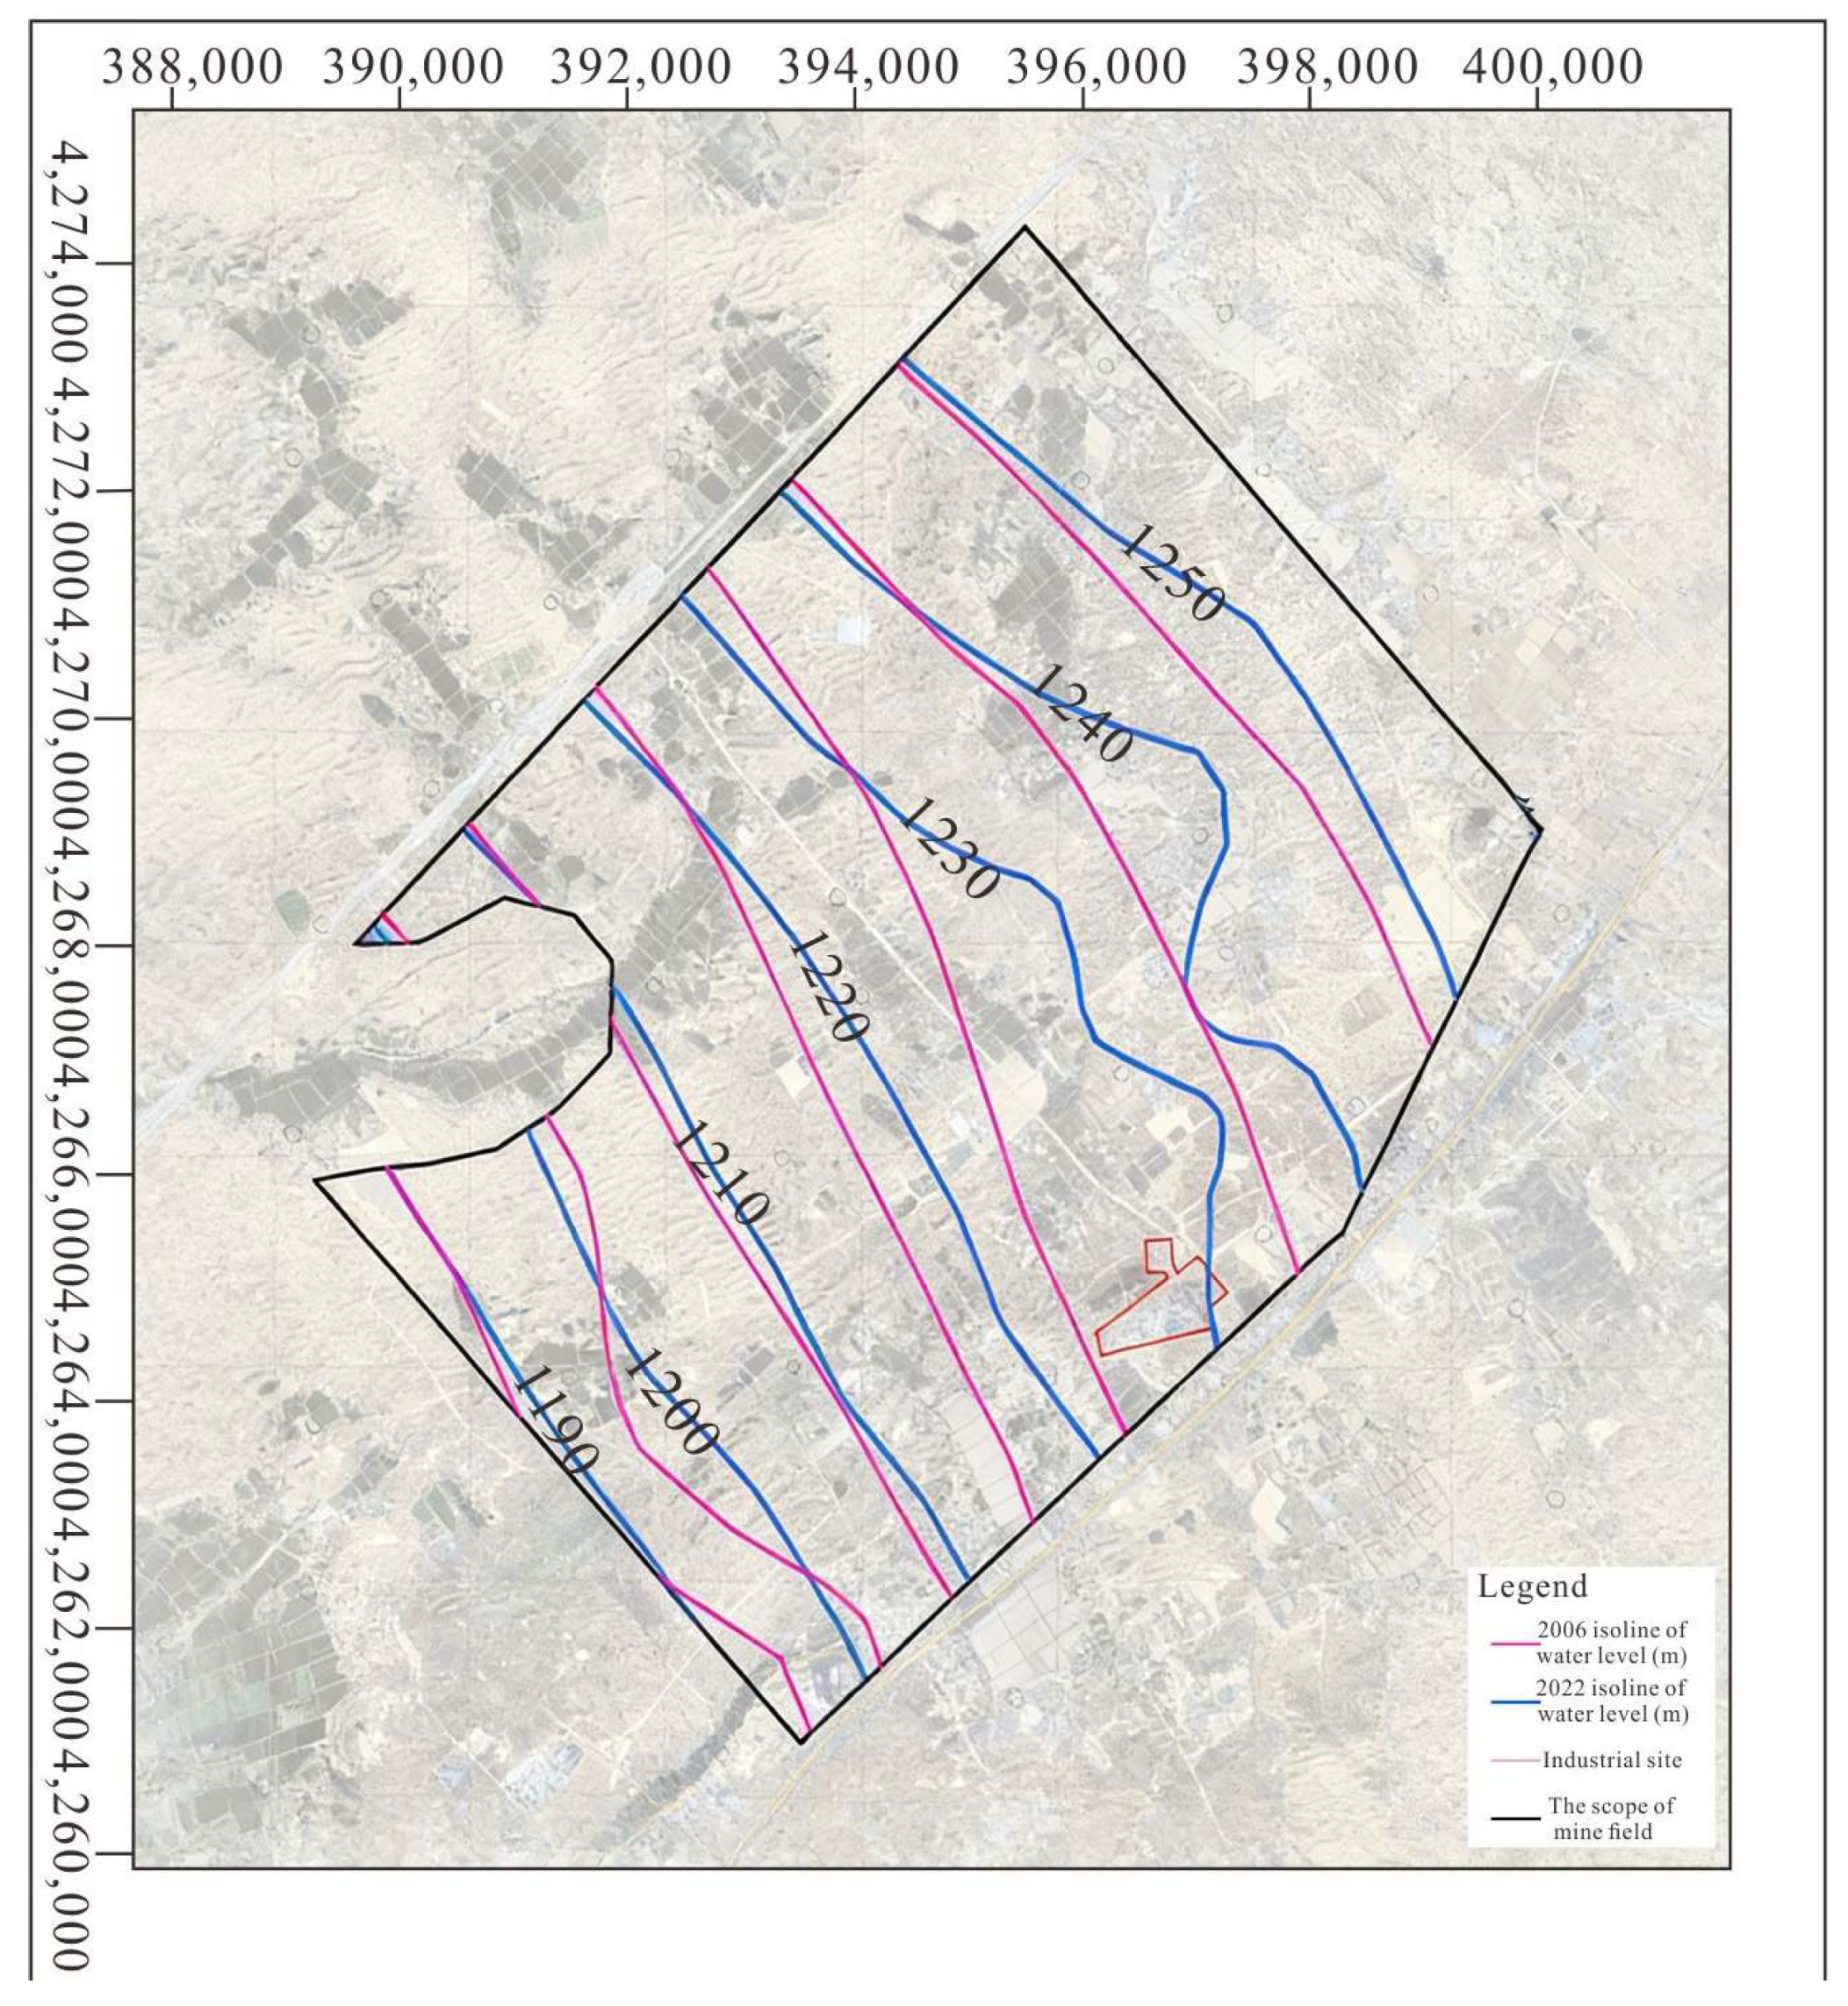
The groundwater flow field of the aquifer has changed under long-term mining disturbance. To analyze the impact of long-term mining disturbance on the evolution of the aquifer flow field, groundwater level monitoring was conducted in the study area. A total of 97 groundwater level monitoring points were set up, with the main monitoring horizon being the Quaternary aquifer (see Figure S2 for the distribution of monitoring points). Based on the measured water level data, the contour maps of the groundwater flow field and the influence maps of water level burial depth of the aquifer in 2006 and 2022 were plotted (Figure 6).
As shown in Figure S3, before mining, the burial depth of Quaternary pore water level in the study area was generally between 1–3 m, and greater than 3 m in local areas with higher terrain. After long-term mining, the groundwater level burial depth in the southwest and northwest of the study area is generally between 2–4 m, with a general decline range of 1–2 m compared with that before coalfield mining; Figure S4 shows that compared with before mining, in the northeast of the study area, the groundwater level burial depth is between 4–12 m, the burial depth has changed significantly, the decline range is 3–10 m, and more than 10 m in local areas. According to the classification criteria in Table S3, the impact degree of the Quaternary aquifer after coalfield mining was plotted (Figure 7). It can be seen that the aquifer in the southwest and northwest of the coalfield is basically unaffected. The northeast of Yangjiatan is affected by coal seam mining, and although the water level decline is not very large (generally about 4 m), the aquifer impact degree is severe due to the thin aquifer. The Liujiahuochang area is affected by fully mechanized top-coal caving mining, with a large water level decline (more than 10 m in local areas), and the aquifer impact degree is relatively severe. The impact degree in other areas is slight. In addition, by comparing the Quaternary pore water flow field before and after long-term mining (Figure 6), it is found that the Quaternary pore water flow field in the northern and northeastern parts of the industrial site has changed to some extent due to coal seam mining, but the overall runoff pattern from northeast to southwest has not changed, and no local or regional groundwater depression cone has appeared.

5.3. Numerical Simulation

Long-term coal mining-induced water-conducting fracture zones and mine drainage will gradually lower the water level of the Zhiluo-Yanan Formation aquifer, which serves as the direct aquifer for mine water inflow. This change will alter the original hydraulic equilibrium relationship between the Zhiluo-Yanan Formation aquifer and the Quaternary aquifer, increasing the leakage discharge of the Quaternary aquifer through the relatively impermeable layer at the lower part of the Anding Formation and consequently causing variations in the water level of the Quaternary aquifer [39,40,41]. Therefore, Visual MODFLOW(Flex 8.0) was adopted to establish a numerical model of groundwater flow in the simulated area. The hydrogeological conditions and parameters of the model were identified, and the numerical model was verified using water level hydrographs of typical observation wells. This model was further used to predict and analyze the impact of long-term coal seam mining on the groundwater flow field in the Jinjitan Mining Area.

5.3.1. Model Overview and Boundary Condition Generalization

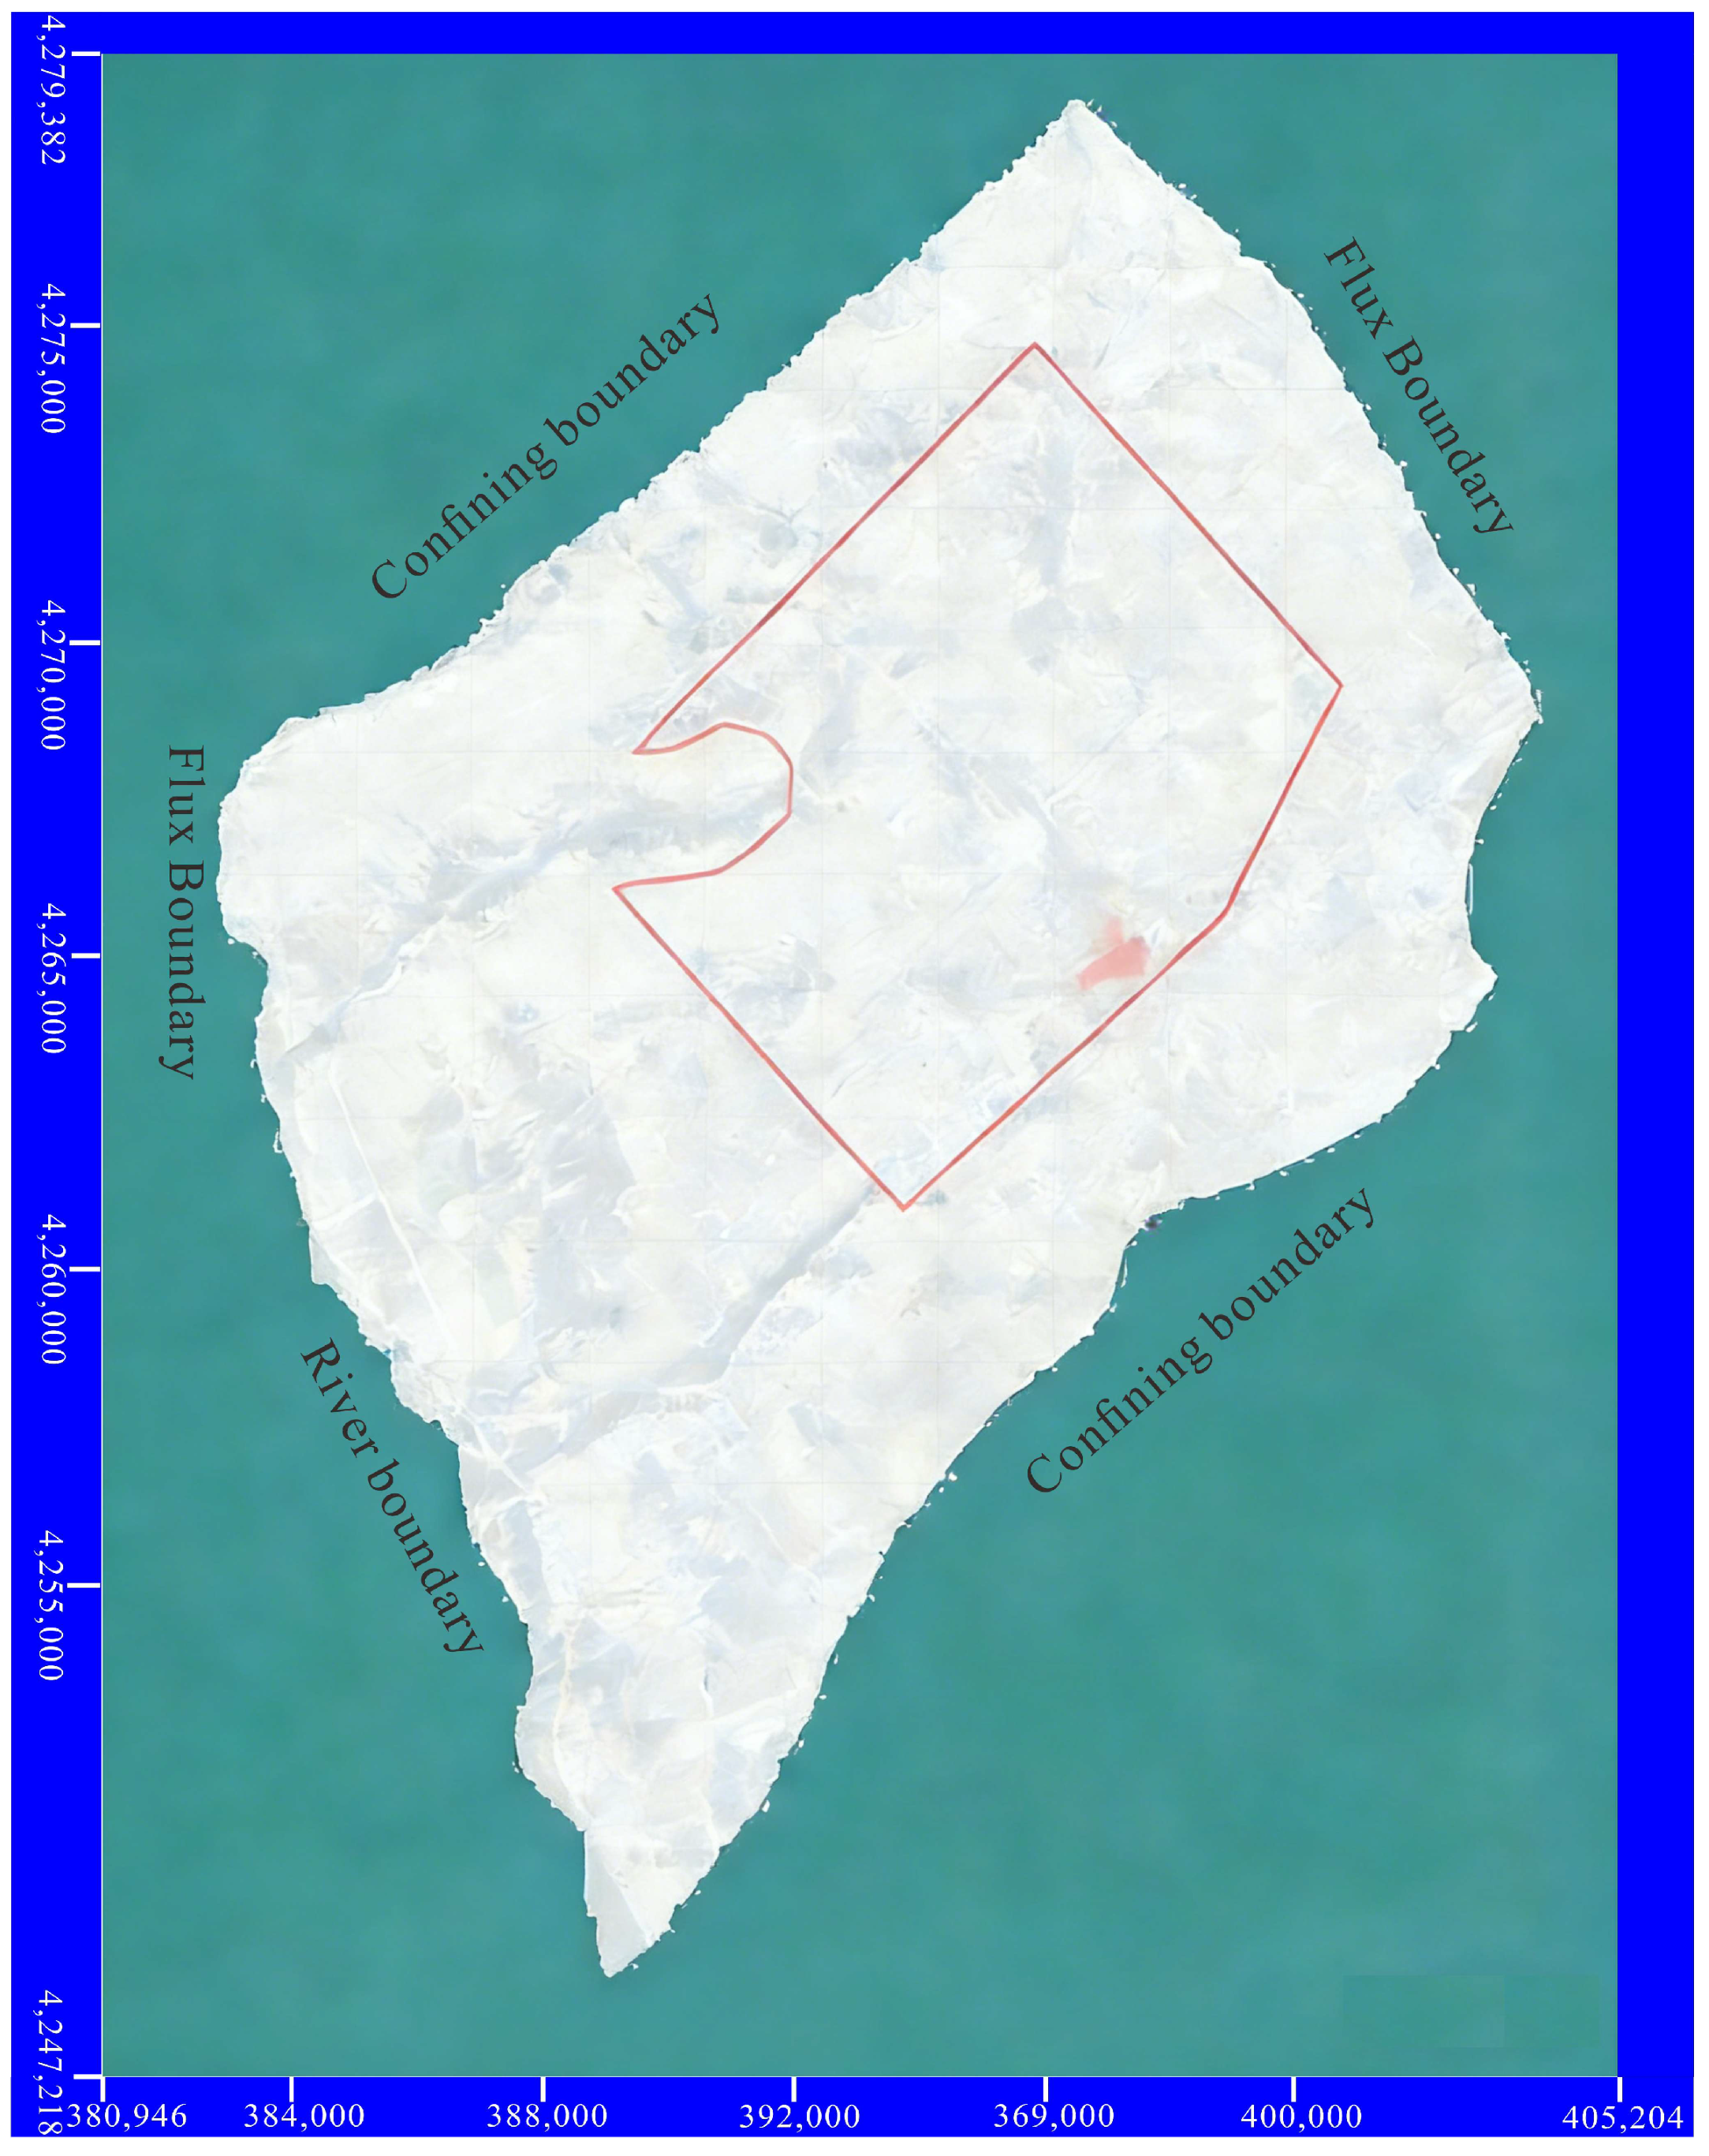
The model scope extends from Xibeisi Daoheze in the northwest to the Southwest Yuxi River; the southeast is bounded by the surface water divide between Toudaoheze and Erdaoheze; the northeast reaches the line from Jiamingtantan Village to Yanglianhaize. Based on a comprehensive analysis of hydrogeological conditions and the surrounding water environment in the study area, the model boundaries are determined as follows: The top boundary of the model area is the phreatic surface; the eastern side of the model is a groundwater recharge area, designated as a flux boundary; the northwest part is partially a flux boundary, the southwest is a river boundary, and the remaining surrounding areas are impermeable boundaries (the model boundaries are shown in Figure 8); the bottom boundary of the model is the impermeable boundary of the No. 2 coal seam floor. Meanwhile, the groundwater system in the simulated area is vertically generalized into five layers (Figure S5), from top to bottom as follows: (1) Quaternary porous phreatic aquifer, composed of sand layers of the Holocene Series and Upper Pleistocene Salawusu Formation; (2) impermeable layer, composed of clay from the Middle Pleistocene Lishi Formation of the Quaternary and clay from the Pliocene Baode Formation of the Neogene; (3) Jurassic Middle Series Anding-Zhiluo Formation confined aquifer; (4) Jurassic Middle Series Yan’an Formation confined water; and (5) Jurassic Middle Series Yan’an Formation coal seam aquifer.
According to the modular design structure of Visual MODFLOW software and the characteristics of different sources and sinks, the following approaches were adopted for source and sink term treatment in the model:
(1)
Atmospheric precipitation infiltration recharge
The infiltration recharge from atmospheric precipitation in the model can be expressed by the following equation:
Q = i a i P i A i
where: ai represents the atmospheric precipitation infiltration recharge coefficient of each calculation zone; Pi represents the precipitation amount of each calculation zone (m/d); Ai represents the area of each calculation zone (m2).
The precipitation infiltration recharge was input using the Recharge package, and the relevant coefficient values were obtained from project reports, including the Hydrogeological Classification Report of Jinjitan Coal Mine, the Environmental Impact Report of Caojiatan Mine Construction Project, and the Hydrogeological Report of Xuemiaotan Coal Mine (Integration Area).
(2)
Phreatic evaporation
Evaporative discharge was processed using the EVT package (Visual MODFLOW(Flex 8.0)). According to the hydrogeological investigation results of the project, the maximum evaporation depth in the simulated area was set as 3.5 m.
(3)
Lateral groundwater flow
The lateral flow during the identification and validation periods was calculated using Darcy’s law (q = KI(h − b)) based on the hydraulic gradient of the flow field at the flux boundary, aquifer thickness, and hydraulic conductivity at the boundary. Here, q represents the unit-width flow rate of the second-type boundary (m2/d); I represents the hydraulic gradient; h represents the groundwater elevation; and b represents the elevation of the aquifer bottom.
The Well package (WEL) (Visual MODFLOW(Flex 8.0)) was used to input the inflow and outflow rates of each boundary into the corresponding boundary grids in the form of point sources. The distribution of boundary inflow and outflow rates was appropriately adjusted through fitting of the flow field near the boundaries.
(4)
River
The exchange flux between river water and groundwater was calculated using the following equation:
Q = K H i j H r M A = C r ( H i j H r )
where: K′ represents the vertical hydraulic conductivity of the riverbed (m/d); M represents the thickness of riverbed sediments (m); A represents the seepage area of the river channel (m2); Hr represents the river water level (m); Hij represents the groundwater level (m); and Cr represents the river leakage intensity (m2/d).
The exchange flux between rivers and groundwater was simulated and analyzed using the River module in MODFLOW.
In the horizontal plane of the study area model, the equidistant finite difference discretization method is adopted for automatic subdivision of the aquifer medium in the seepage zone. The coordinate axis direction is consistent with the geographic coordinate direction: the X-axis is due east, the Y-axis is due north, and the Z-axis is vertically upward. This subdivision uses a 200 m × 200 m equidistant grid, which is divided into 161 rows and 122 columns in total, and five layers vertically.
The geological and hydrogeological conditions of the simulated area are relatively simple. Based on a comprehensive analysis of factors such as the pumping test results of the simulated area (including hydraulic conductivity, storage coefficient, specific yield, and specific capacity), aquifer distribution law, flow field characteristics, and differences in geological conditions, the parameters and zoning of the simulated area are determined through model identification and verification. The parameter zoning of aquifers such as the phreatic aquifer, aquitard, Anding-Zhiluo Formation, Yan’an Formation, and No. 2-2 coal seam is shown in Figure S6, and the parameter values of each zone are listed in Table 1.
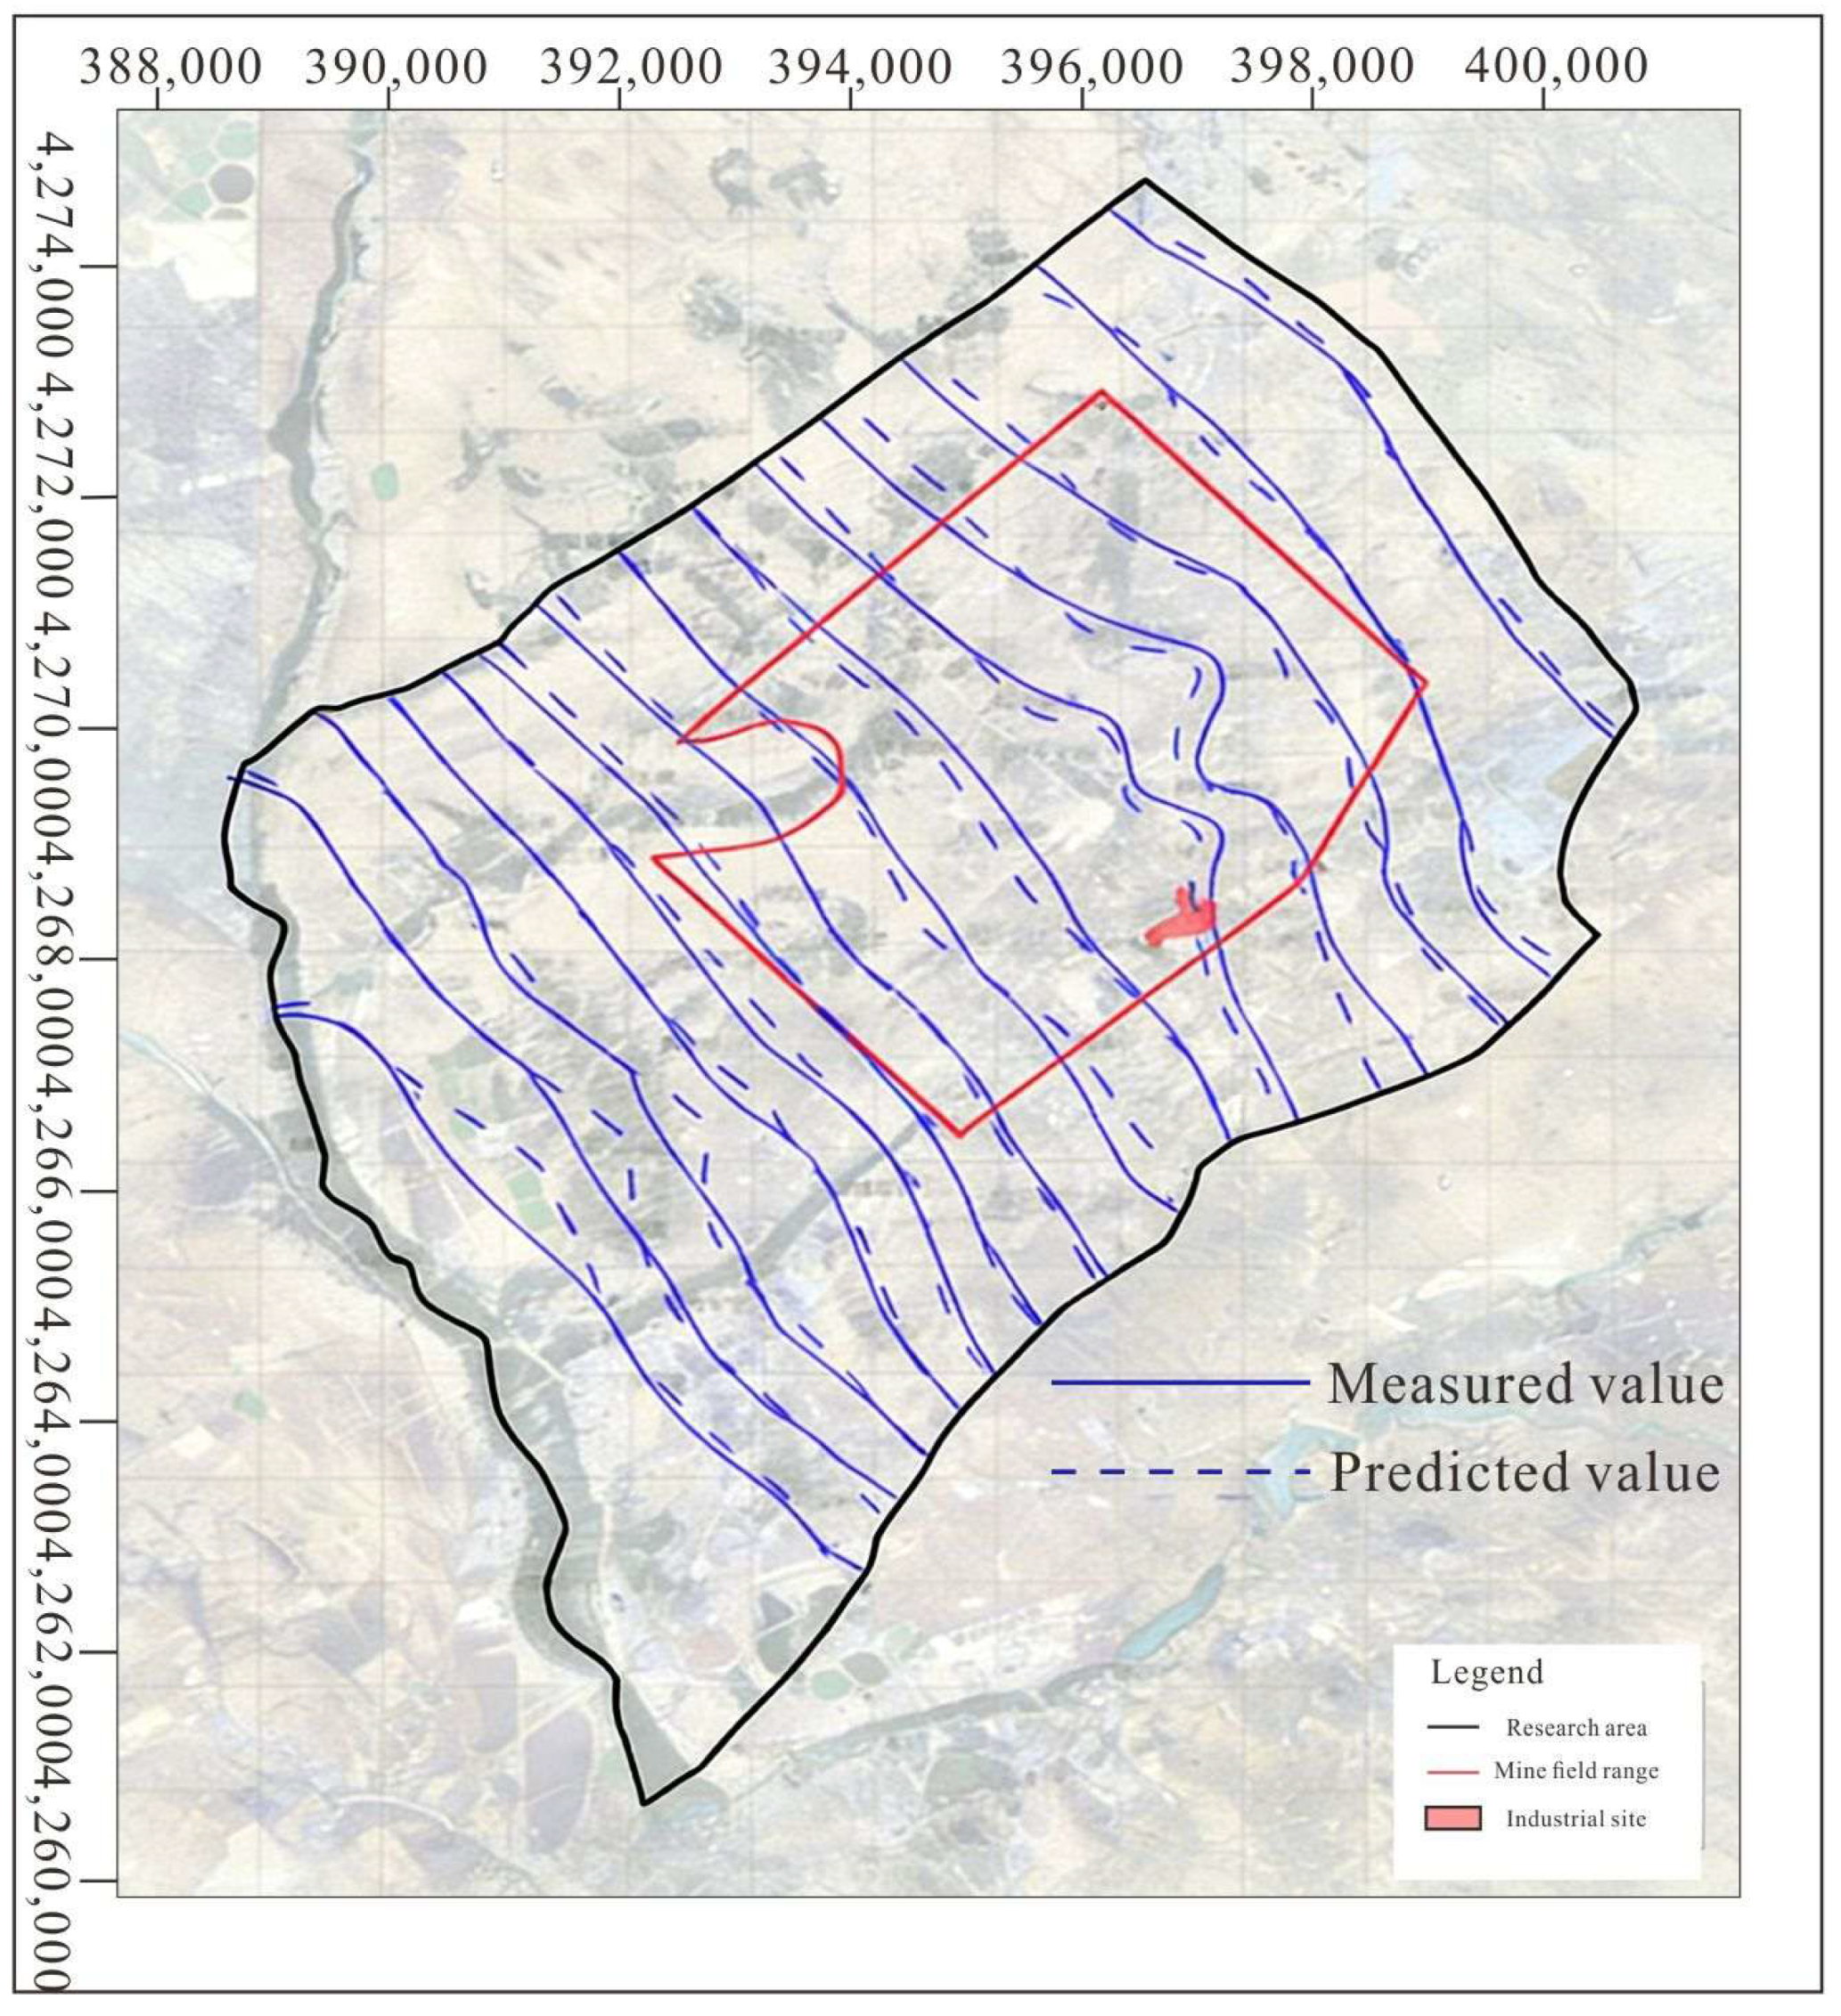
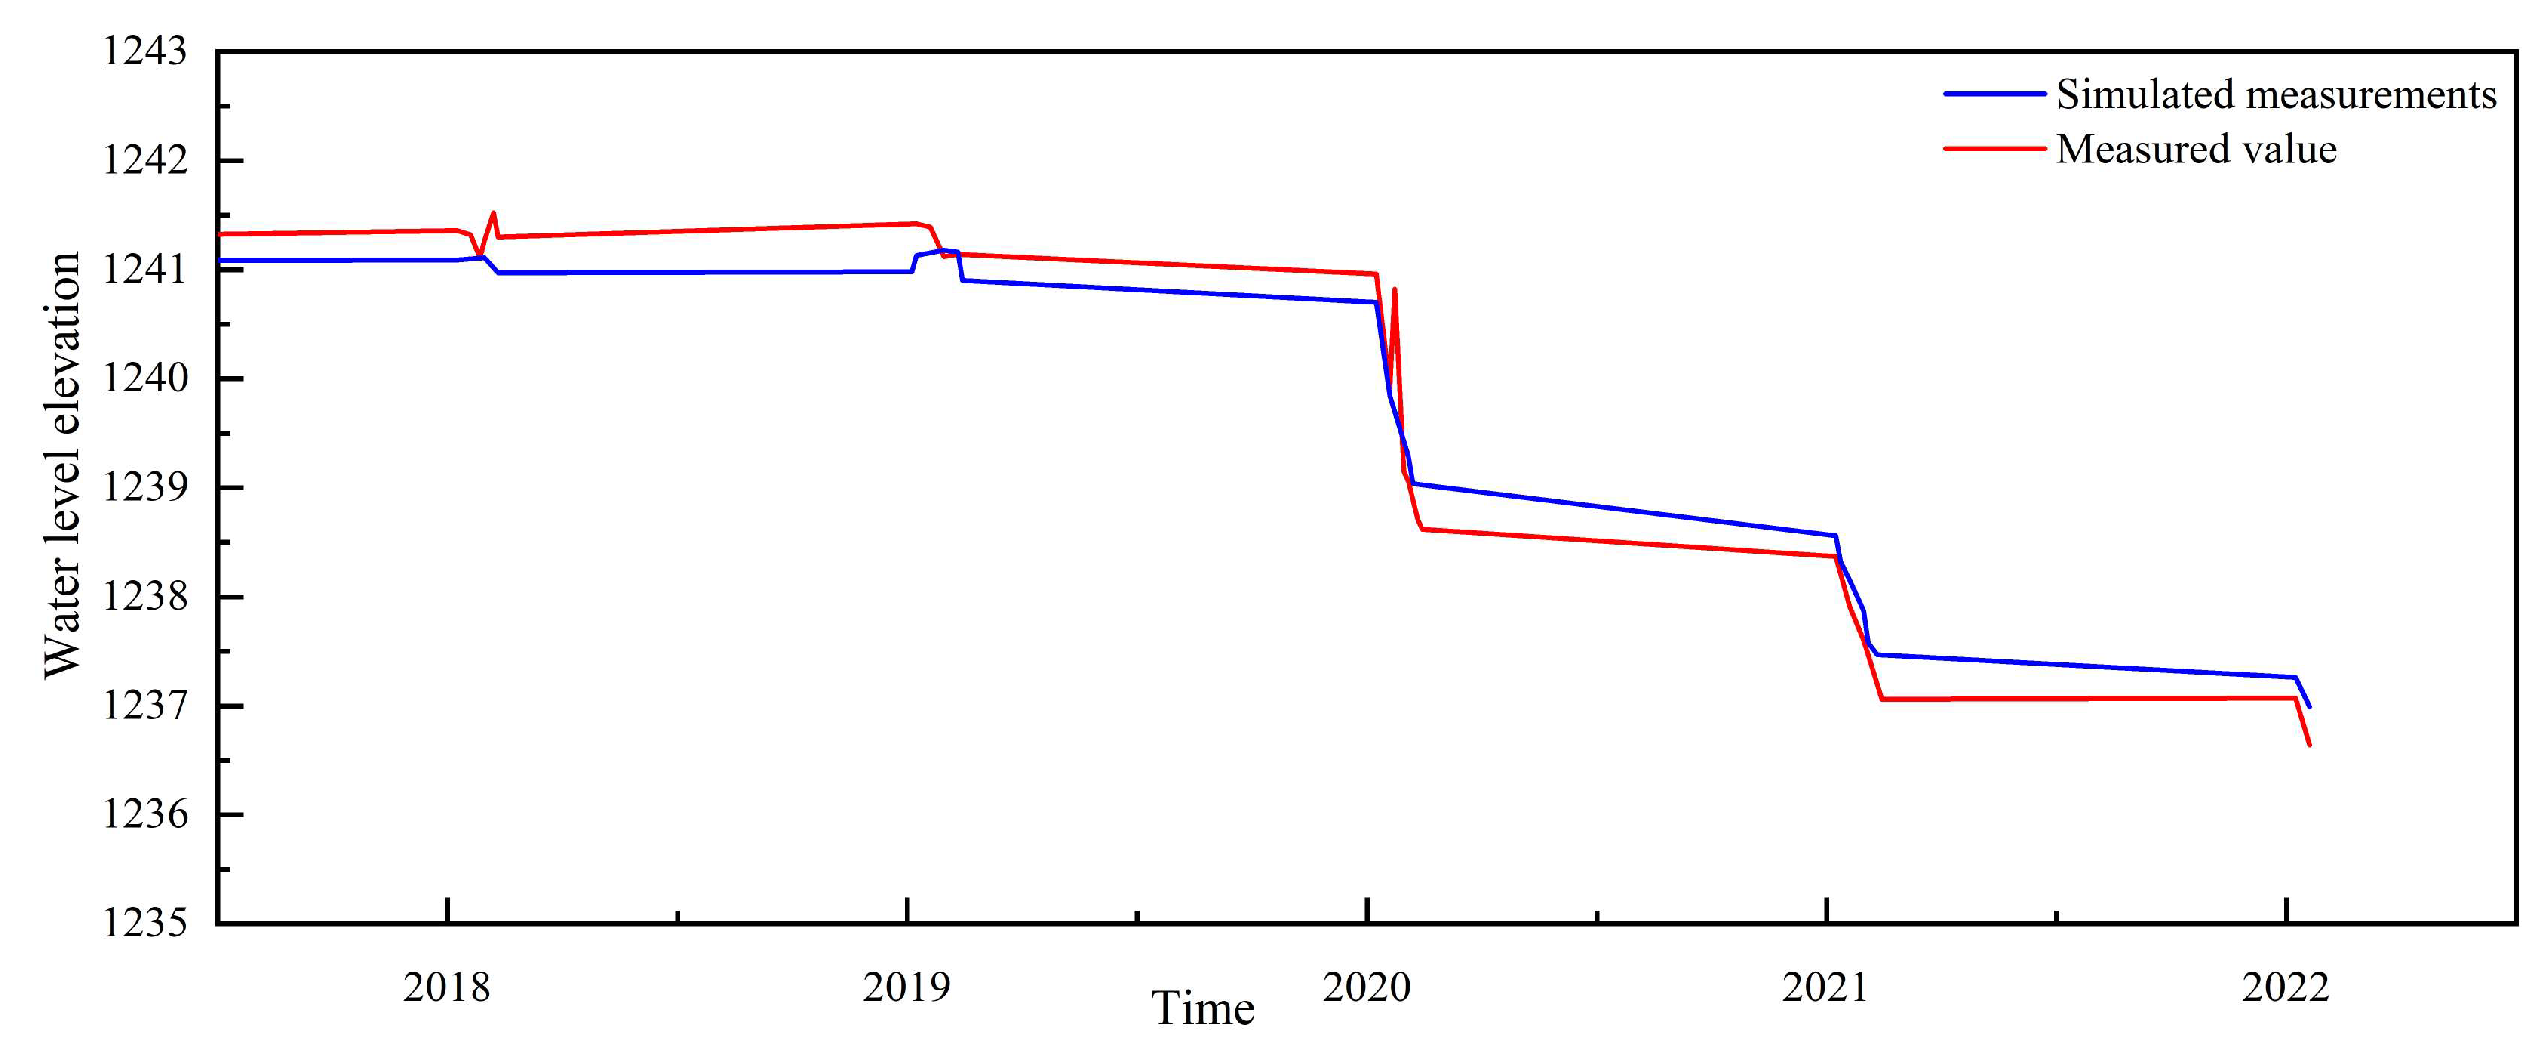
The water level one year before the start of mining at the pre-mining working face was used as the initial flow field of the model. The data used were obtained from the water level accounting records of observation wells, with a total of 10 observation wells set up. The model ran continuously for 12 months. The simulated head values obtained after one year of model operation were compared with the measured values, and the model parameters and boundary conditions were continuously adjusted. The fitting results between the calculated flow field and the measured flow field at the end of identification are shown in Figure 9, and the fitting of water level changes is shown in Figure 10. Independent time-series groundwater level monitoring data were used for model validation, and the fitting accuracy was quantitatively evaluated using the mean absolute error (MAE), root mean square error (RMSE), mean relative error (MRE), and coefficient of determination (R2). The error metrics of observation wells in the Quaternary phreatic aquifer and Jurassic confined aquifers were statistically analyzed by layer. The overall values were MAE = 0.40 m, RMSE = 0.50 m, MRE = 2.86%, and R2 = 0.93. The errors of each aquifer layer met the acceptable thresholds for groundwater numerical simulation in coal mining areas. The simulated groundwater level variations showed high agreement with observed dynamics, indicating the rationality of the model parameters and boundary conditions. The error indicators during the validation period showed no significant differences from those during the calibration period, and no overfitting occurred. The developed three-dimensional groundwater flow model can be used to predict groundwater levels and flow fields under long-term mining conditions.

5.3.2. Impact of Coal Mining on the Evolution of Groundwater Flow Field

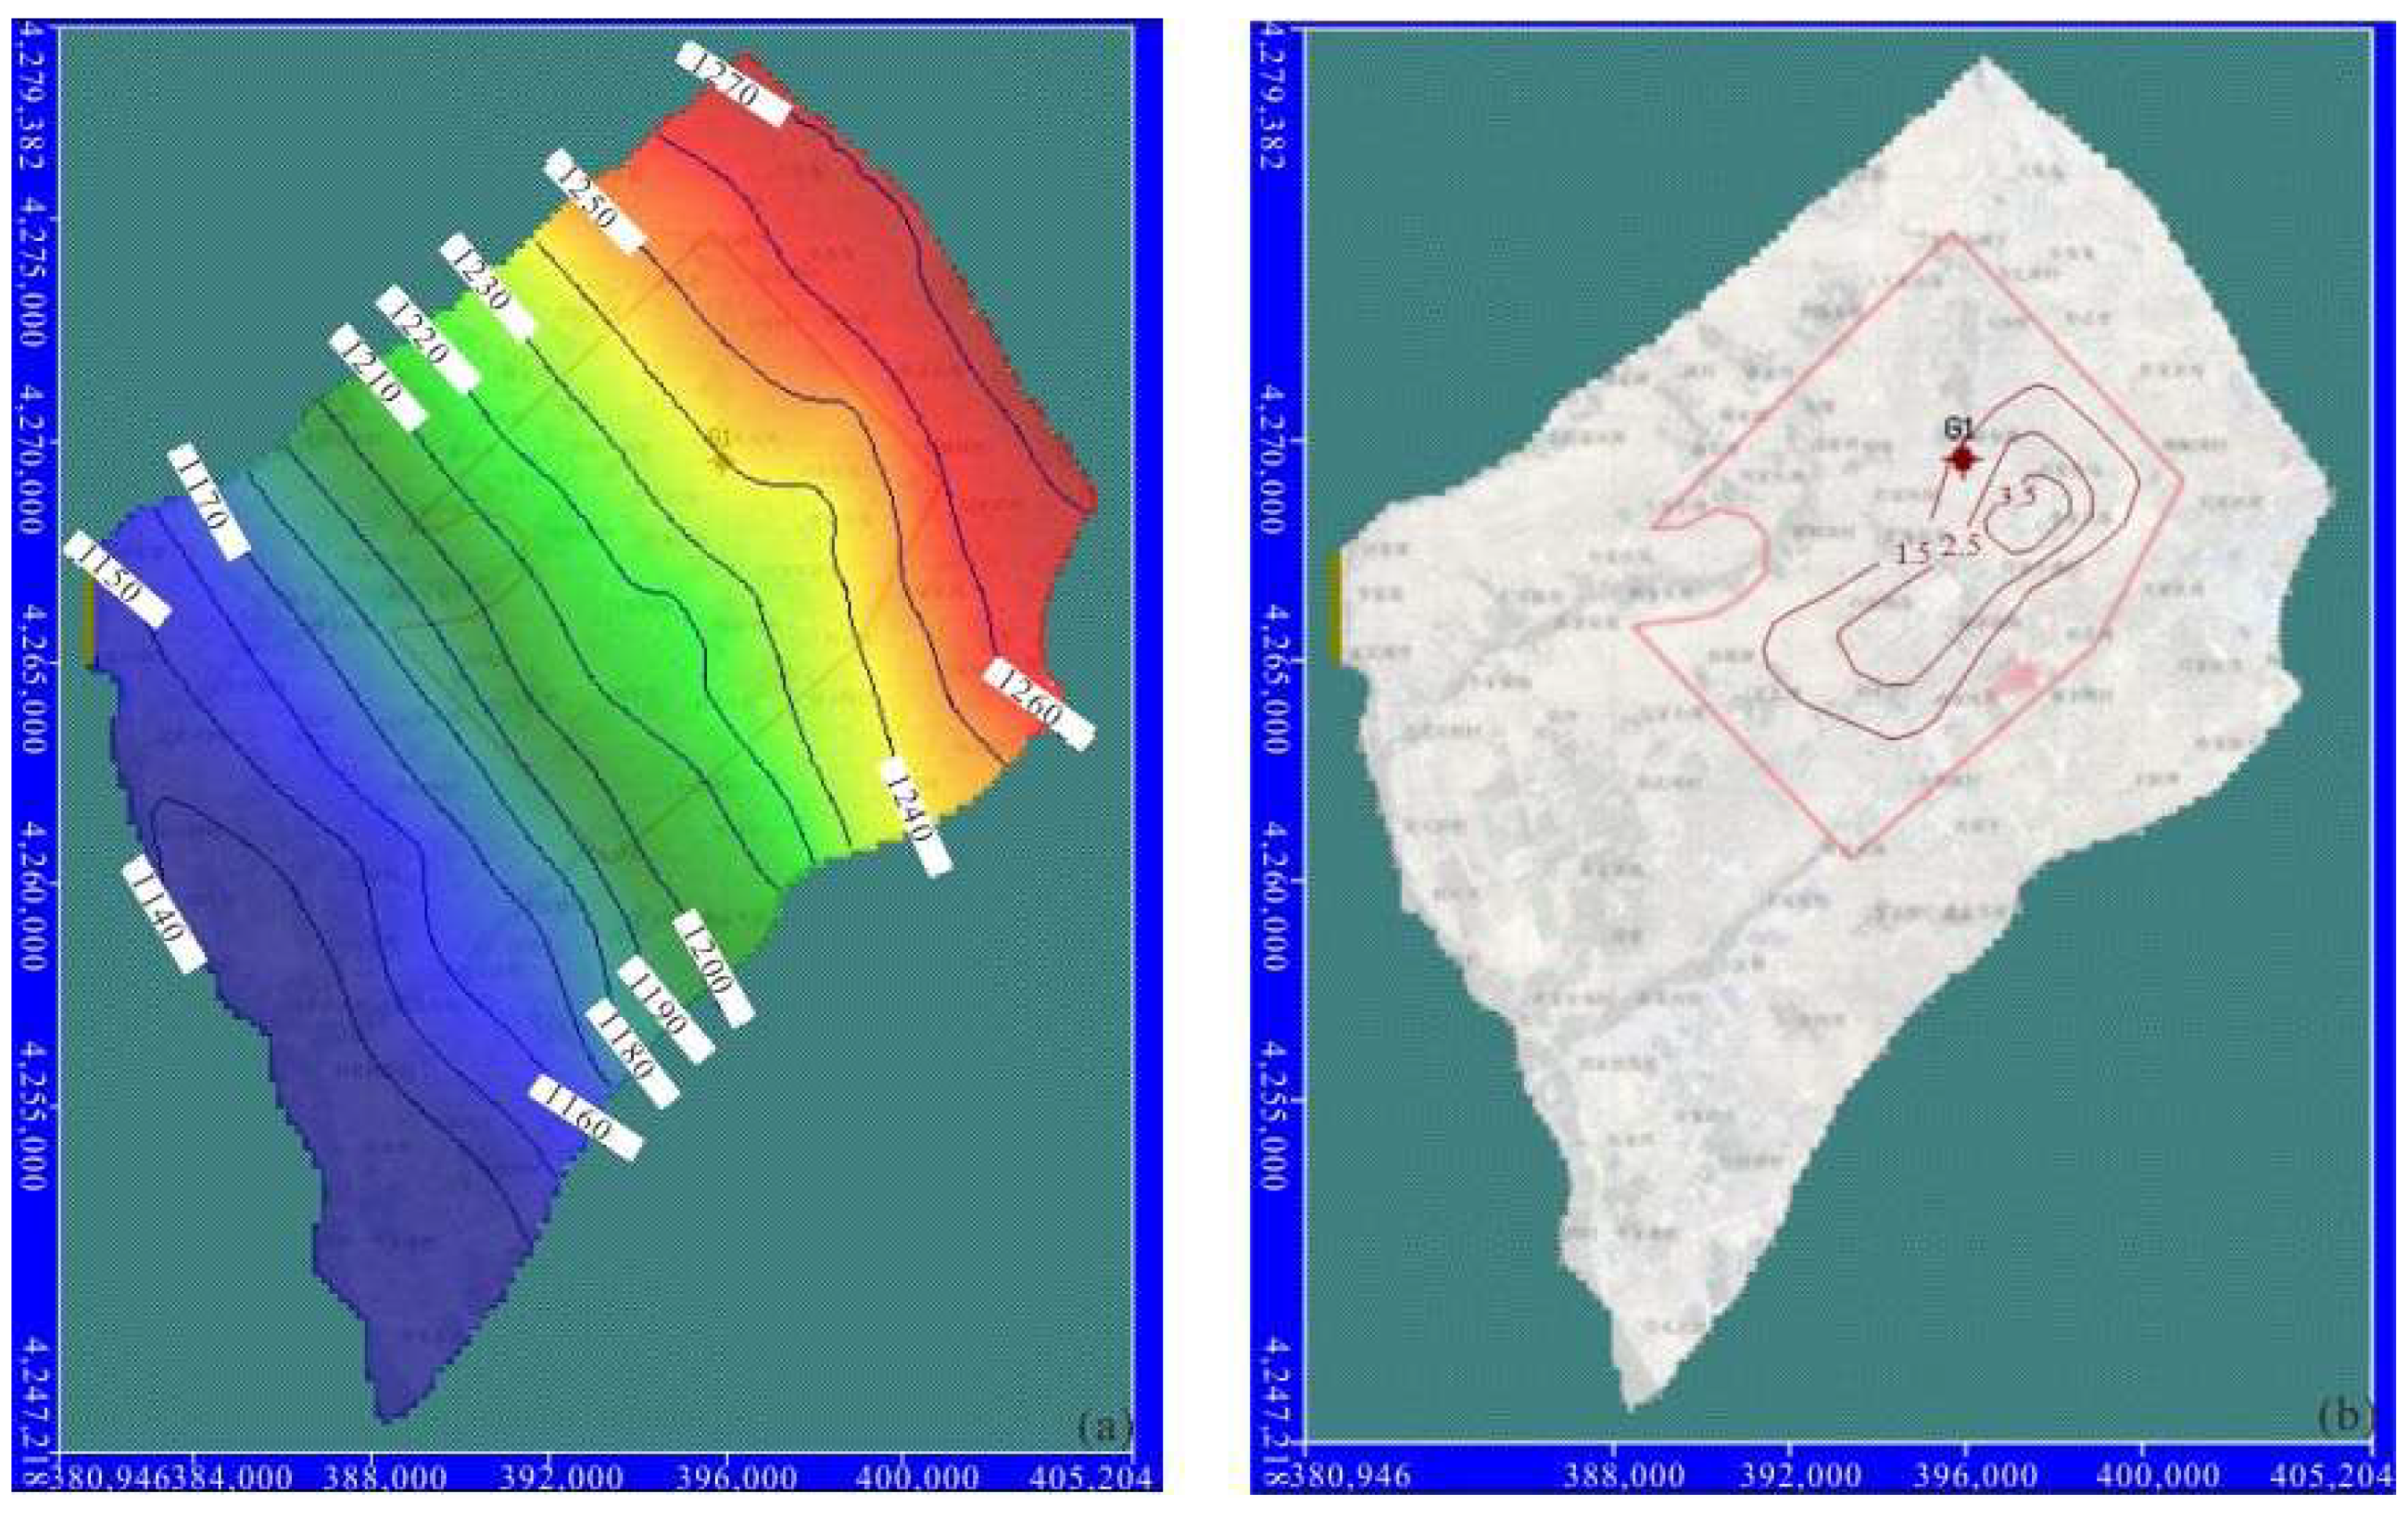
The previous analysis focused on the changes in groundwater flow field during coal mining. Here, numerical simulation is further employed to explore the future impact of coal mining on the groundwater flow field. After coal seam mining, the stress balance of the overlying strata is disrupted, leading to strata fracture. The resulting water-conducting fracture zones connect the overlying aquifers, and the hydrogeological parameters of the water-conducting fracture development zones are reset. The development height of the water-conducting fracture zone is calculated as 19.9 times the mining thickness on the east wing and 22.33 times the mining thickness on the west wing. The development height of the water-conducting fracture zone was determined based on mine borehole data and the calculation formula for water-conducting fracture zones under hard rock conditions specified in the Mining Regulations Under Buildings, Water Bodies and Railways (“Three Under” Mining Regulations). Using the measured flow field in 2022 as the initial flow field, the model was run for 10 years to obtain the groundwater flow field and water level drawdown map of the study area in 2033.
As shown in Figure 11, 10 years after coal mining, the Quaternary groundwater still generally flows from northeast to southwest. The trend of groundwater discharge into the Yuxi River has not changed, and no local or regional groundwater depression cone has appeared. However, the water level has decreased to varying degrees. Compared with the initial groundwater level, the average decline of the groundwater level during this period is 1.36 m, with a maximum decline of 4.89 m. In the east wing mining area, due to the large coal seam mining thickness and significant stratum subsidence, the decline of water level elevation in this area is the most obvious. In general, with the continuous mining of coal mines in the study area, the formed subsidence basin is also expanding, leading to a significant decline in water level elevation.

5.4. Prediction of Pollutant Transport

5.4.1. Key Pollutant and Prediction Scenarios

Under abnormal conditions, some facilities or devices may have impacts on the groundwater environment. These facilities mainly include mine water treatment stations, domestic sewage treatment stations, and gas stations. Considering the potential pollution pathways of pollution sources to groundwater, they can be divided into two types: one is short-term pollutant leakage, and the other is continuous pollutant leakage.
Based on the comprehensive characteristics of various devices and facilities of the construction projects in the study area, the identified potential continuous groundwater pollution sources under abnormal conditions are shown in Table 2. Based on the above pollution source identification, the domestic sewage tank is selected as a representative, and the numerical method is adopted to predict and evaluate the potential impacts on the groundwater environment. For the specific prediction, the solute transport model is established using MT3D. According to the Groundwater Survey Report of the Northern Shaanxi Energy and Chemical Industry Base (2008), the porosity of the Quaternary aquifer is determined to be 0.30, and the dispersivity is set to 5 m.
Assume that the damaged area at the bottom of the domestic sewage equalization tank accounts for 5% of the total area of the tank. The leakage from the damaged part is calculated using the formula Q = K·A·I, where: Q = leakage from the damaged part (m3/d); K = vertical hydraulic conductivity; A = leakage area of the damaged part (m2); and I = hydraulic gradient (dimensionless).
According to the requirements (HJ 610~2016) [42], the standard index ranking method is adopted by category to determine specific predicted pollution factors. Based on the water quality results in the study area (Table S1), the standard indices of petroleum hydrocarbons and oxygen consumption are the largest among their respective categories. Therefore, petroleum hydrocarbons and oxygen consumption are selected as the predicted evaluation factors.
According to the location of the pollution source, the setting position of the pollution tracking monitoring wells, and the numerical simulation results, when leakage of the regulating reservoir occurs for 200 d, the pollution monitoring wells should be able to detect it significantly, and the sewage leakage should be terminated in a timely manner. Thus, the leakage duration is determined as 200 d.

5.4.2. Pollutant Prediction

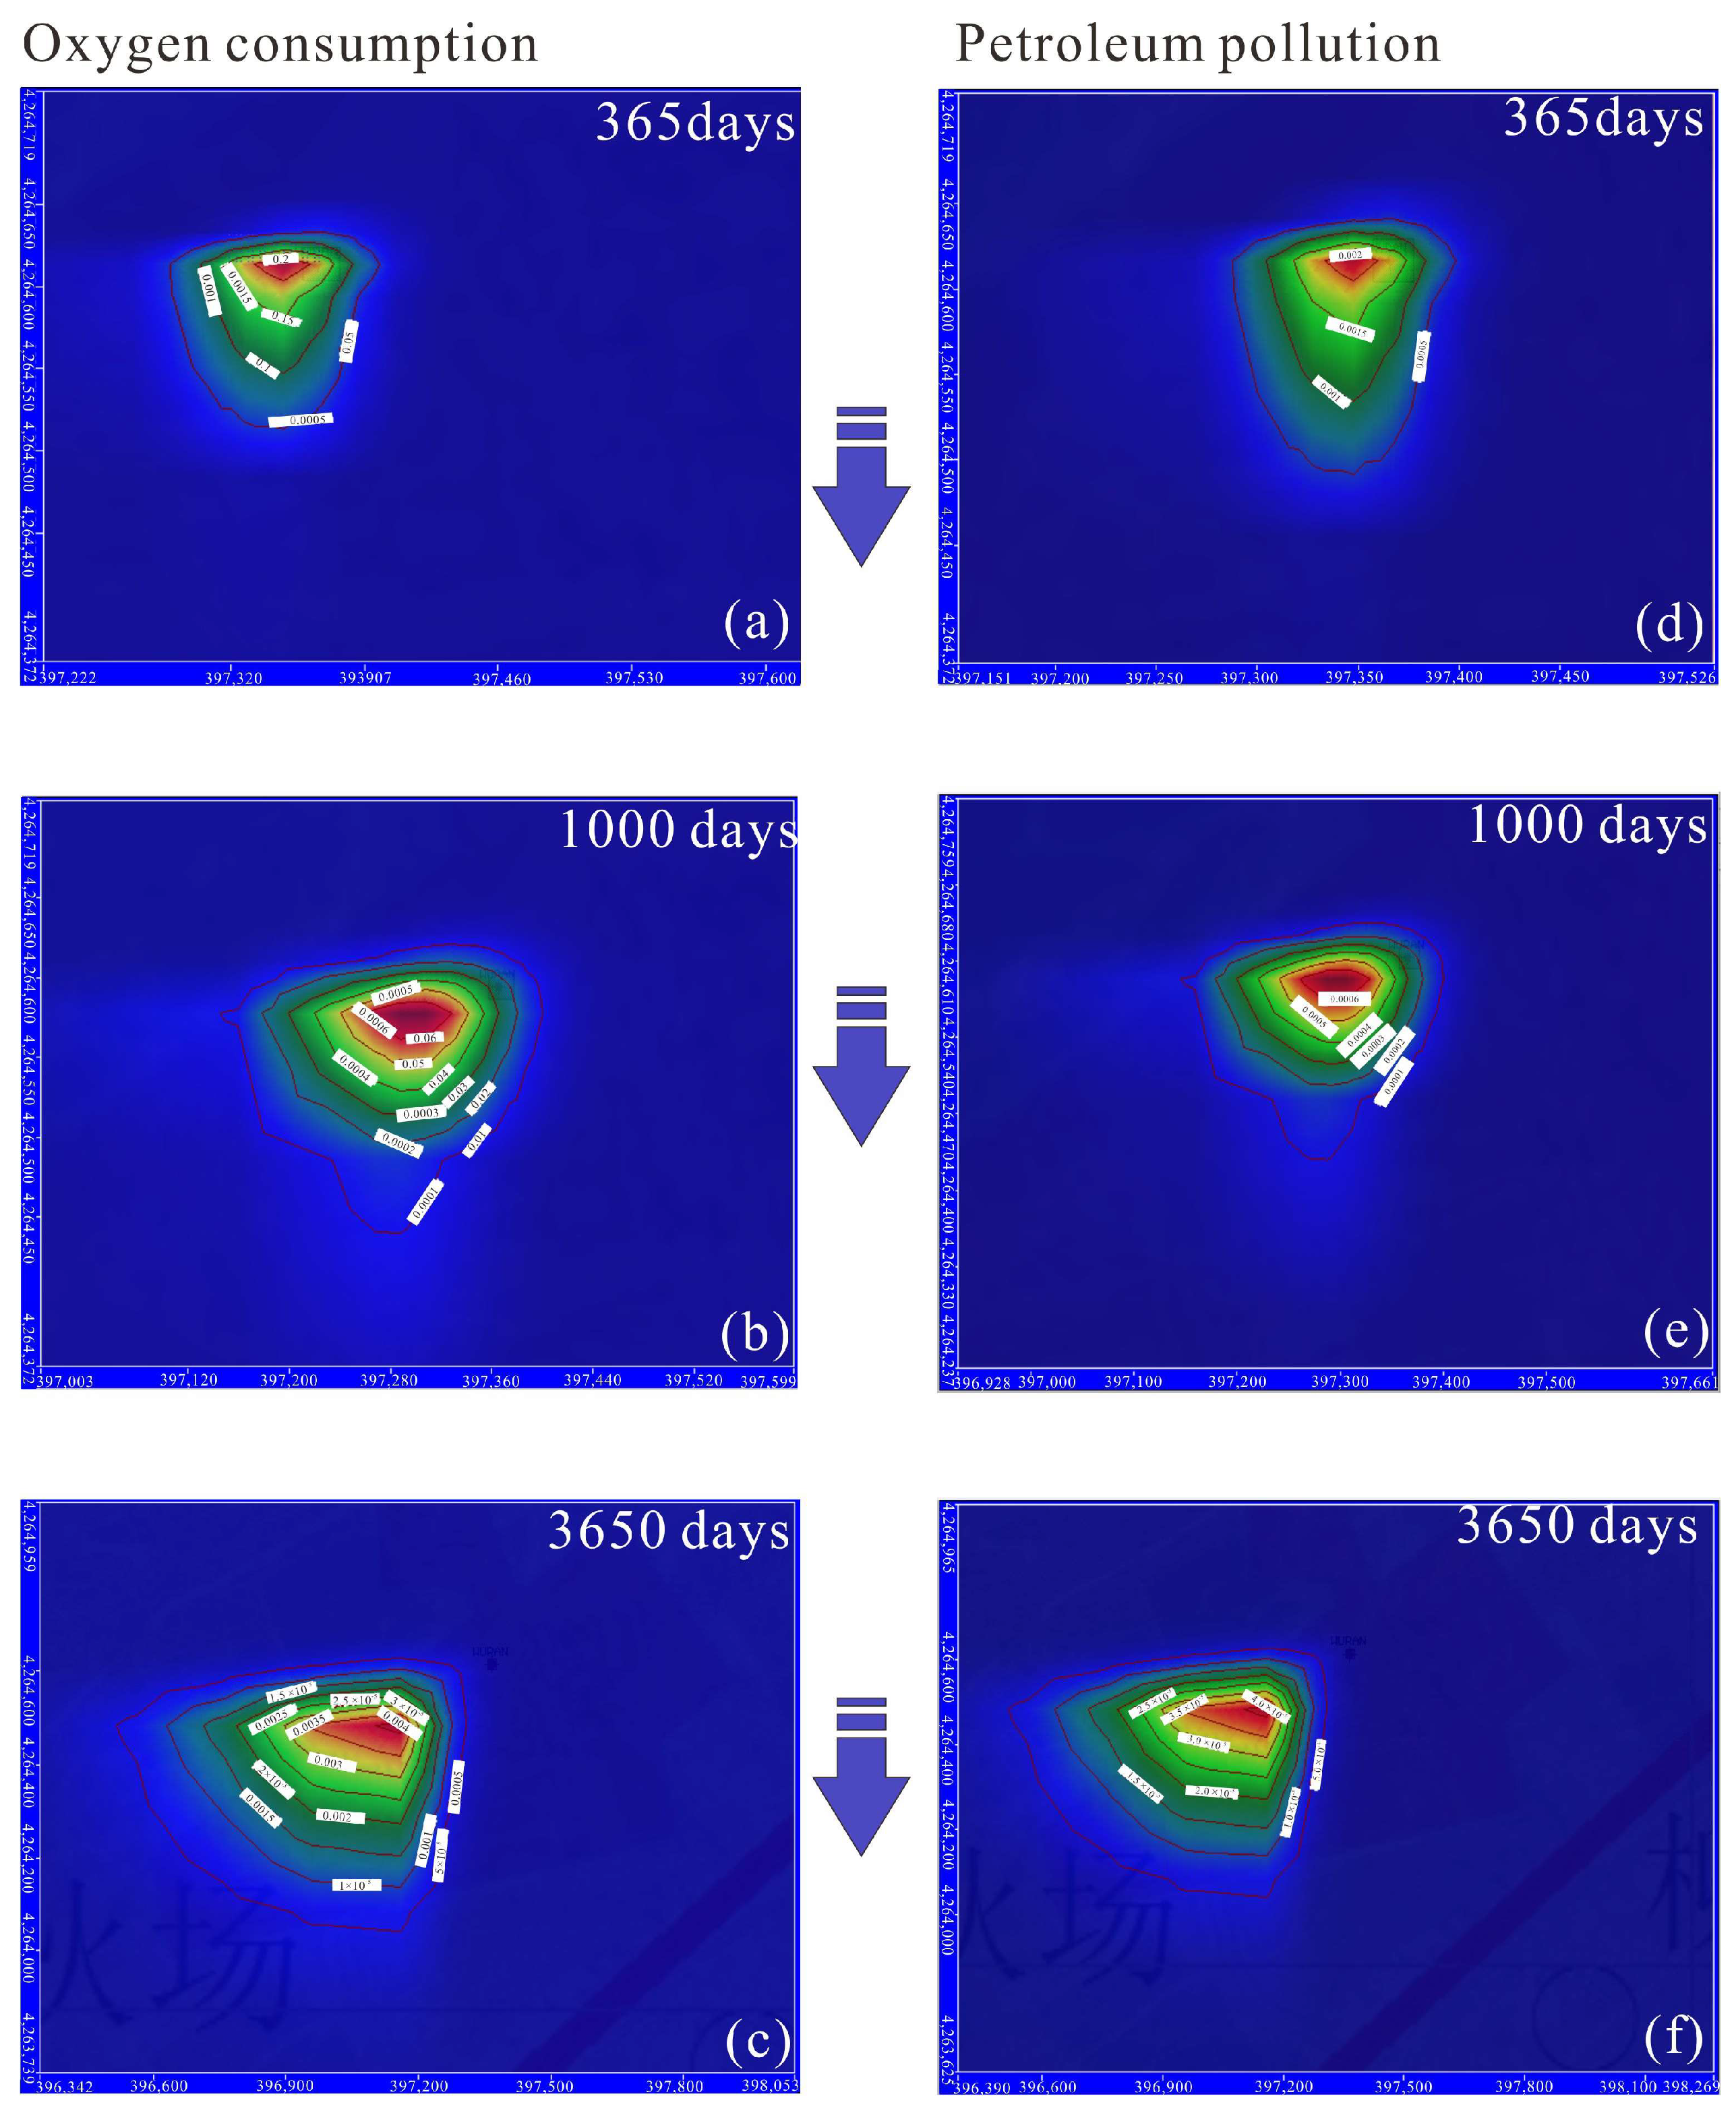
Based on the aforementioned groundwater flow model, Visual MODFLOW software coupled with MT3D was adopted to predict the potential impacts of sewage equalization tank leakage on the groundwater environment, with no consideration of medium adsorption. The pollutant infiltration from the source was treated as an injection well format. During the specific prediction, the leakage volume was generalized as a continuous infiltration point source and incorporated into the prediction model. Key periods prone to groundwater pollution were selected as the prediction periods, divided into three phases: short-term (365 d), medium-term (1000 d), and long-term (3650 d). The prediction results are presented in Table 3 and Figure 12.
As can be seen from Figure 12a–c, the pollution plume of oxygen consumption formed in the short term is limited to the vicinity of the regulating reservoir, basically spreading outward in a concentric circle pattern. The diffusion range is relatively small, basically confined within the site, with the maximum migration distance of the pollution plume being 16.7 m. Compared with the short-term pollution plume, the medium-term pollution plume obviously spreads downstream along the groundwater flow direction, with the concentration gradually decreasing (the maximum is 0.07 mg/L) and the maximum migration distance reaching 73.68 m. Although the pollution plume migrates out of the treatment station, it is limited within the industrial site. During the long-term prediction period, although the pollution plume migrates out of the industrial site, under the further self-restoration of the aquifer, the concentration is lower than the detection limit, which is far below the limit of the Class III groundwater quality standard. For petroleum hydrocarbons, the long-term pollution plume expands further under the drive of the hydrodynamic field and dispersion compared with the short-term and medium-term ones, with the maximum migration distance of 254.27 m (Figure 12d–f), migrating out of the industrial site. However, the central concentration of the pollution plume is close to the detection limit, which is far below the limit of the Class III groundwater quality standard.

6. Conclusions

This study systematically analyzed the evolution of groundwater flow field and characteristics of pollutant transport under long-term mining conditions in Jinjitan Coal Mine through an integrated multi-method technical approach. The main conclusions are as follows:
The groundwater in the study area originates from atmospheric precipitation and is affected by evaporation during the seepage process. Mine water is a mixture of coal seam water and Quaternary groundwater, with their contribution ratios being 55% and 45% respectively. Both hydrochemical cluster analysis and deuterium–oxygen isotope analysis have confirmed the mixing effect between different aquifers.
The Quaternary groundwater level exhibits two types of changes under the influence of mining: stable type and sustained decline type. The stable type decreases by approximately 4 m due to mine water inflow during the construction period and then stabilizes. The decline amplitude of the sustained decline type is related to the distance from the observation well to the mining face and coal mining methods. The Jurassic groundwater level generally shows a downward trend: the decline amplitude of weathered fractured water is small (≤10 m), while the decline amplitude of some observation wells in the Zhiluo Formation and Yan’an Formation exceeds 18 m. Locally, the water level first decreases and then increases due to the enhanced hydraulic connection between aquifers.
Long-term mining has not changed the overall pattern of groundwater runoff from northeast to southwest and discharge into the Yuxi River in the study area, nor has it formed local or regional groundwater depression cones. Numerical simulation predictions show that by 2033, the average groundwater level in the study area will drop by 1.36 m. The east wing mining area has the most prominent water level decline with a maximum of 4.89 m due to large mining thickness and significant stratum subsidence.
The transport of oxygen consumption and petroleum hydrocarbons caused by the leakage of domestic sewage tanks is controlled by the groundwater hydrodynamic field and dispersion. In the short term (365 d), the pollution plume is confined within the site; in the medium term (1000 d), it spreads to the boundary of the industrial site along the runoff direction; in the long term (3650 d), although it migrates out of the industrial site, the concentration is far lower than the limit of the Class III groundwater quality standard, resulting in limited impact on the regional groundwater environment.

Supplementary Materials

The following supporting information can be downloaded at: https://www.mdpi.com/article/10.3390/w18141752/s1, Table S1. Groundwater environmental quality monitoring results in the study area (mg/L, except for pH); Table S2. Water isotopes of the groundwater in the study area; Table S3. Impact degree of the Quaternary aquifer; Figure S1. Distribution of groundwater monitoring wells in the study area; Figure S2. Distribution of the Quaternary groundwater level monitoring wells in the study area; Figure S3. Zoning of the Quaternary groundwater level in the study area (April 2006); Figure S4. Zoning of the Quaternary groundwater burial depth in the study area (June 2022); Figure S5. 3D hydrogeologic model of the study area; Figure S6. Parameter zoning of aquifers (a) phreatic aquifer; (b) Anding-Zhiluo Group aquifer; (c) Yan ′an Formation aquifer.

Author Contributions

Conceptualization, R.H.; Methodology, R.H.; Software, X.C.; Validation, R.H., X.C. and F.Y.; Formal analysis, R.H.; Investigation, R.H. and X.C.; Resources, R.H.; Data curation, X.C.; Writing—original draft, X.C.; Writing—review & editing, F.Y.; Visualization, X.C. and F.Y.; Supervision, F.Y.; Project administration, F.Y. All authors have read and agreed to the published version of the manuscript.

Funding

This research received no external funding.

Data Availability Statement

The original contributions presented in this study are included in the article/Supplementary Materials. Further inquiries can be directed to the corresponding author.

Conflicts of Interest

The authors declare no conflicts of interest.

References

  1. Wang, W.F.; Li, X.T.; Wu, X.L. Research on the extraction method of surface subsidence boundary based on multi-source data fusion of DS-InSAR and SBAS-InSAR. Sci. Surv. Mapp. 2025, 50, 61–68. [Google Scholar] [CrossRef]
  2. Wang, Z.K.; Li, W.P.; Dai, J.Q.; Zhang, J.; Chen, S.Y. Study on engineering geological properties of deep-buried unsaturated Lishi Formation loess. China Min. Mag. 2025, 34, 286–297. [Google Scholar] [CrossRef]
  3. Xu, G.Q.; Pan, S.Q.; Li, Y.H.; Shu, Y.G.; Jin, X.R.; Chen, Y.P. Dynamic Characteristics and Forming Models of Groundwater in Northern Ordos. J. Anhui Univ. Sci. Technol. (Nat. Sci.) 2021, 41, 7–14. [Google Scholar]
  4. Huang, P.H.; Zhang, Y.N.; Li, Y.M.; Gao, H.F.; Cui, M.K.; Chai, S.W. A multiple isotope (S, H, O and C) approach to estimate sulfate increasing mechanism of groundwater in coal mine area. Sci. Total Environ. 2023, 900, 165852. [Google Scholar] [CrossRef] [Scilit] [PubMed]
  5. Zhang, P.S.; Wang, H.W.; Hong, H.; Xu, D.Q.; Chen, Z.B.; Deng, Y.C.; Liang, Z.; Li, J.K.; Chen, W.H.; Cui, Q. Mechanical properties and energy evolution law of deep-buried sandstone under seepage-mining stress coupling. Rock Soil Mech. 2025, 46, 1997–2010. [Google Scholar] [CrossRef]
  6. Zhang, Q.C.; Tu, M.; Fu, B.J.; Zhang, X.Y.; Dang, J.X. Analysis of spatiotemporal evolution characteristics of floor rock mass and roadway failure under mining influence. Coal Sci. Technol. 2024, 52, 302–313. [Google Scholar] [CrossRef]
  7. Liu, F.; Wang, G.C.; Li, B.; Wang, C.Y.; Du, S.; Liao, F. Rare earth element behaviors of groundwater in overlying aquifers under the influence of coal mining in northern Ordos Basin, China. Environ. Sci. Pollut. Res. 2024, 31, 13284–13301. [Google Scholar] [CrossRef] [Scilit] [PubMed]
  8. Wang, H.; Wang, Q.M.; Dong, S.N.; Wang, X.D.; Ge, G.R.; Zhang, X.Y.; Cao, S.M.; Zhang, Q. Hydrogeological effects of mining and its restoration ways in coal mining areas of Western China. J. China Coal Soc. 2025, 50, 610–622. [Google Scholar] [CrossRef]
  9. Qi, Y.M.; Zhou, P.; Zhou, L.; Jiang, D.; Yang, Y.Q.; Liu, Y.Z. Sulphate contamination in an abandoned coal mine in light of mining effects. Coal Geol. Explor. 2024, 52, 89–100. [Google Scholar] [CrossRef]
  10. Wang, W.K.; Yang, Z.Y.; Kong, J.L.; Cheng, D.H.; Duan, L.; Wang, Z.F. Ecological impacts induced by groundwater and their thresholds in the arid areas in Northwest China. Environ. Eng. Manag. J. 2013, 12, 1497–1507. [Google Scholar] [CrossRef] [Scilit]
  11. Barbeta, A.; Peñuelas, J. Relative contribution of groundwater to plant transpiration estimated with stable isotopes. Sci. Rep. 2017, 7, 10580. [Google Scholar] [CrossRef] [Scilit] [PubMed]
  12. Koirala, S.; Jung, M.; Reichstein, M.; de Graaf, I.E.M.; Camps-Valls, G.; Ichii, K.; Papale, D.; Ra’duly, B.; Schwalm, C.R.; Tramontana, G. Global distribution of groundwater-vegetation spatial covariation. Geophys. Res. Lett. 2017, 44, 4134–4142. [Google Scholar] [CrossRef] [Scilit]
  13. Migaszewski, Z.M.; Gałuszka, A.; Dołęgowska, S. Stable isotope geochemistry of acid mine drainage from the Wiśniówka area (south-central Poland). Appl. Geochem. 2018, 95, 45–46. [Google Scholar] [CrossRef] [Scilit]
  14. Sun, J.; Kobayashi, T.; Strosnider, W.; Wu, P. Stable sulfur and oxygen isotopes as geochemical tracers of sulfate in karst waters. J. Hydrol. 2017, 551, 245–252. [Google Scholar] [CrossRef] [Scilit]
  15. Kim, D.M.; Yun, S.T.; Yoon, S.; Mayer, B. Signature of oxygen and sulfur isotopes of sulfate in ground and surface water reflecting enhanced sulfide oxidation in mine areas. Appl. Geochem. 2019, 100, 143–151. [Google Scholar] [CrossRef] [Scilit]
  16. Yi, M.S.; Zhu, W.B.; Li, L.; Zhao, X.; Xu, J.H. Water-inrush mechanism and prevention for fourth panel roof in Bulianta coal mine. J. China Coal Soc. 2008, 33, 241–245. [Google Scholar] [CrossRef] [Scilit]
  17. Xu, J.L.; Wang, X.Z.; Liu, W.T.; Wang, Z.G. Effects of primary key stratum location on height of water flowing fracture zone. J. Rock Mech. Geotech. Eng. 2009, 28, 380–385. [Google Scholar] [CrossRef]
  18. Xu, J.G. Study on developing law of water–conducting fracture zone in fully mechanized caving face in shallow buried coal mine with thin bedrock. China Coal. 2019, 45, 98–105. [Google Scholar] [CrossRef]
  19. Cong, S.; Chen, J.H.; Wang, Y.H.; Duan, J.H. Study on microseismic monitoring of height of water flowing fracture zone. China Min. Mag. 2017, 26, 126–131. [Google Scholar]
  20. Han, B.P.; Zheng, S.S.; Xie, K.J.; Gan, Z.J. An Approach to the Hydrogeologic Effect Induced by Underground Coal Mining. J. China Univ. Min. Technol. 1994, 23, 70–77. [Google Scholar]
  21. Li, J.Z.; Zhou, A.G.; Zhou, J.W.; Chai, B.; Feng, H.B.; Su, D.H. Risk Assessment of Aquifer Destruction in Underground Mining Coal of North China: A Case Study of Hongshan Mine in Zibo City. Earth Sci. 2020, 45, 1027–1040. [Google Scholar]
  22. Xu, F.; Jin, D.W.; Gao, Z.Y.; He, Y.; Wang, S.D.; Shi, L.; Huang, H.; Duam, J.H. Study on law of groundwater resources leakage under high intensity repeated mining. Coal Sci. Technol. 2022, 50, 131–139. [Google Scholar]
  23. Liu, W.Q.; Zhou, H.Q. Measure and simulation for development height of water conducted crack zone of mining under water. Coal. Technol. 2016, 35, 206–208. [Google Scholar] [CrossRef]
  24. Hua, Z.L.; Zhang, Y.; Meng, S.H.; Wang, L.; Wang, X.J.; Lv, Y.; Li, J.M.; Ren, S.F.; Bao, H.; Zhang, Z.H. Response Characteristics and Water Inflow Prediction of Complex Groundwater Systems under High-Intensity Coal Seam Mining Conditions. Water 2023, 15, 3376. [Google Scholar] [CrossRef] [Scilit]
  25. Ma, Y.Q.; Xu, S.G. Numerical simulation of groundwater pollution in a mining area based on GMS. J. Geol. Hazards Environ. Preserv. 2024, 35, 123–128. [Google Scholar]
  26. Chen, S.M.; Liu, H.W.; Ma, Z.; Guo, X.; Du, D.; Wang, W.; Miao, J.J. The research of sea-salted water intrusion in the northern coastal areas of Weifang City based on three-dimensional variable density flow simulation. J. Nat. Disasters. 2020, 3, 203–212. [Google Scholar] [CrossRef]
  27. Harbaugh, A.W. MODFLOW-2005, the U.S. Geological Survey Modular Groundwater Model—The Groundwater Flow Process; U.S. Geological Survey Techniques and Methods 6-A16; U.S. Geological Survey: Reston, VA, USA, 2005.
  28. Zhang, W.J.; Deng, X.Y.; Xiao, Y.; Zhang, J.; Ren, C.; Lu, W.; Long, A.H. Study on the suitable ecological groundwater depth and the suitable well-canal combined irrigation ratio in the Weigan River irrigation district. Sustainability 2023, 15, 15097. [Google Scholar] [CrossRef] [Scilit]
  29. Bai, J.Z.; Li, J.; Zhou, Z.X.; Zhang, Y.; Wang, C.H.; Liu, X.F.; Li, B.Y. Spatiotemporal evolution and driving mechanism of water ecosystem services in the Yellow River Basin under coupled climate-hydrological processes. Acta Geogr. Sin. 2026, 81, 2248–2267. [Google Scholar]
  30. Chen, P.F.; Yin, F.; Meng, M.F.; Ning, Z.P.; Liu, Y.Z. Advances in Modeling and Application for Predicting Leachate from Industrial Solid Waste Landfills. Earth Environ. 2026, 1–12. [Google Scholar]
  31. Zou, Y.H.; Peng, X.; Yang, F.Q.; Yuan, H.Q. A Posterior Error Estimation and Octree-based Adaptive Solver for 3D Groundwater Contaminant Transport Modeling. China Environ. Sci. 2026, 1–27. [Google Scholar] [CrossRef]
  32. Mao, H.R.; Wang, C.Y.; Qu, S.; Liao, F.; Wang, G.C.; Shi, Z.M. Source and evolution of sulfate in the multi-layer groundwater system in an abandoned mine—Insight from stable isotopes and Bayesian isotope mixing model. Sci. Total Environ. 2023, 859, 160368. [Google Scholar] [CrossRef] [Scilit] [PubMed]
  33. Huang, P.H.; Li, Y.M.; Yu, Z.H.; Peng, W.Y. Study on the migration law of sulfate in limestone water of typical high ground temperature coal mines. Sci. Rep. 2025, 15, 23647. [Google Scholar] [CrossRef] [Scilit] [PubMed]
  34. Astel, A.; Tsakovski, S.; Barbieri, P.; Simeonov, V. Comparison of self-organizing maps classification approach with cluster and principal components analysis for large environmental data sets. Water Res. 2007, 41, 4566–4578. [Google Scholar] [CrossRef] [Scilit] [PubMed]
  35. Vesanto, J.; Alhoniemi, E. Clustering of the self-organizing map. IEEE Trans. Neural Netw. 2000, 11, 586–600. [Google Scholar] [CrossRef] [Scilit] [PubMed]
  36. Wang, C.; Lek, S.; Lai, Z.; Tudesque, L. Morphology of Aulacoseira filaments as indicator of the aquatic environment in a large subtropical river: The Pearl River, China. Ecol. Indic. 2017, 81, 325–332. [Google Scholar] [CrossRef] [Scilit]
  37. Du, H.P. Study on Migration Rules and Numerical Simulation of Petroleum Characteristic Pollutants in Soil and Groundwater. Master’s Thesis, Zhengzhou University, Zhengzhou, China, 2025. [Google Scholar]
  38. Lian, H.Q.; Wu, Q.; Li, D. Adsorption and transportation of petroleum pollutants in shallow porous aquifer medium. J. Liaoning Tech. Univ. (Nat. Sci.) 2005, 24, 936–939. [Google Scholar]
  39. Duan, H.Y.; Ma, Z.S.; Ma, D.; Liu, Y.; Wang, Z.X.; Zou, L.H. Analysis of borehole stability during hydrothermal energy exploitation in underground mines. Energy 2026, 352, 140947. [Google Scholar] [CrossRef] [Scilit]
  40. Duan, H.Y.; Zou, L.C.; Cvetovic, V. Sensitivity analysis of hydraulic erosion and calibration of the erosion coefficient. Eng. Geol. 2024, 338, 107624. [Google Scholar] [CrossRef] [Scilit]
  41. Duan, H.Y.; Ma, D.; Kong, S.B.; Ma, Z.S.; Zou, L.C. Hydraulic erosion-heat transfer coupling model for coal and geothermal energy co-exploitation. Renew. Energy 2025, 248, 123109. [Google Scholar] [CrossRef] [Scilit]
  42. HJ 610-2016; Technical guidelines for environmental impact assessment. Groundwater environment. National Environmental Protection Standard of the People ′s Republic of China: Beijing, China, 2016.
Figure 1. Maps of the study area. (a) relief map; (b) Fence diagram.
Water 18 01752 g001
Figure 2. Hydrochemical Statistical Diagrams. (a) Self-organizing classification diagram; (b) correlation analysis chart.
Water 18 01752 g002
Figure 3. Characteristics of water isotopes in the study area.
Water 18 01752 g003
Figure 4. Groundwater level dynamics of the Quaternary aquifer.
Water 18 01752 g004
Figure 5. Groundwater level dynamics of the Jurassic aquifer.
Water 18 01752 g005
Figure 6. Zoning of impact degree of Quaternary groundwater level in the well field.
Water 18 01752 g006
Figure 7. Changes of Quaternary pore water flow field before and after coal mining.
Water 18 01752 g007
Figure 8. Model boundary.
Water 18 01752 g008
Figure 9. Predicted and measured groundwater levels at the end of the calibration period.
Water 18 01752 g009
Figure 10. Comparison of simulated and measured groundwater levels for one of the monitoring wells.
Water 18 01752 g010
Figure 11. (a) Groundwater level of the phreatic aquifer after coal mining in 10 years; (b) drawdown contour lines of groundwater.
Water 18 01752 g011
Figure 12. Pollutant migration diagram: (ac) oxygen consumption; (df) petroleum pollutants.
Water 18 01752 g012
Table 1. List of simulated zones and the parameter values.
TypeNumberingPermeability Coefficient K (m/d)μ or Ss (1/m)
Phreatic aquifer2.150.09
3.630.11
5.10.13
Aquitard0.00251 × 10−5
Anding-Zhiluo Formation aquifer0.061 × 10−5
0.081 × 10⁻⁵
Yan’an Formation confined aquifer0.021 × 10−5
0.031 × 10⁻⁵
Coal seam aquifer0.0051 × 10−5
Table 2. Statistical table of the characteristics of possible persistent pollution sources in the study area.
Possible Sources of PollutionKey Pollutant
Mine waste water treatmentPetroleum, volatile phenol, etc.
Sewage treatment stationAmmonia nitrogen, oxygen consumption, etc.
Table 3. Statistical table of pollution halo.
PredictorPrediction PeriodCenter Concentration of Pollution Plume (mg/L)Migration Distance (m)
Oxygen consumptionShort-term (365 d)0.216.7
Mid-term (1000 d)0.0773.68
Long-term (3650 d)0.004253.47
PetroleumShort-term (365 d)0.002518.2
Mid-term (1000 d)0.000774.03
Long-term (3650 d)0.000045254.27
Disclaimer/Publisher’s Note: The statements, opinions and data contained in all publications are solely those of the individual author(s) and contributor(s) and not of MDPI and/or the editor(s). MDPI and/or the editor(s) disclaim responsibility for any injury to people or property resulting from any ideas, methods, instructions or products referred to in the content.