Article

Microbial Enzyme Activities Outperform Conventional Indicators in Revealing Systematic Patterns of Dissolved Organic Matter-Driven Microbial Changes Across a Human-Impacted Lake Network


1
Changjiang River Scientific Research Institute, Changjiang Water Resources Commission, Wuhan 430010, China
2
Mid-Route Source of South-to-North Water Transfer Co., Ltd., 87 Yanjiang Ave, Danjiangkou, Shiyan 442700, China
3
Future Environment Laboratory, Innovation Center of Yangtze River Delta, Zhejiang University, Jiaxing 310027, China
4
Wuhan Changjiang Kechuang Technology Development Co., Ltd., Wuhan 430014, China
5
Departamento de Ingeniería Agroforestal, Escuela Técnica Superior de Ingeniería Agronómica, Alimentaria y de Biosistema, Technical University of Madrid, 28040 Madrid, Spain
*
Authors to whom correspondence should be addressed.
These authors contributed equally to this work.
Water 2026, 18(14), 1675; https://doi.org/10.3390/w18141675
Submission received: 20 May 2026 / Revised: 18 June 2026 / Accepted: 30 June 2026 / Published: 10 July 2026
(This article belongs to the Section Water Quality and Contamination)

Abstract

Dissolved organic matter (DOM) plays a key role in shaping lake microbiomes and water quality, yet its spatial variability and regional links to microbial activity remain unclear. Using three-dimensional excitation–emission matrix and self-organizing map analysis on 38 samples from a human-impacted lake network in Hubei (affected by tourism, agriculture, and urban areas), this study clarifies DOM heterogeneity and its environmental connections. Microbial metabolic activity represented by total bacterial content (BC) and Escherichia coli (E. coli) activity was rapidly and automatically measured with a ColiMinder device. Random forest (RF) modeling and principal component analysis (PCA) were applied to identify key drivers of microbial activity and to clarify correlations between DOM characteristics and microbial activitiy. Results indicated that although DOM in all three sectors primarily originated from microbial activities during the flat-water period, Tuanhu (TH) exhibited a higher degree of DOM humification and a larger average relative molecular mass, reflecting stronger terrestrial source characteristics. RF analysis identified NH4+ as the main predictor of both BC and E. coli levels, while total organic carbon (TOC) and total nitrogen (TN) were also important predictors. PCA further revealed clear differences in DOM composition across the lakes. DOM in TH was predominantly autochthonous, whereas DOM in Miaohu (MH) and Guozheng (GZ) was mainly of humic origin. This study adopts an integrated method combining rapid microbial detection, EEM and DOM–microbe correlation analysis to analyze human disturbances across segmented connected lakes in Hubei. It provides scientific support for targeted water quality management of human-influenced freshwater.

1. Introduction

Lakes are vital components of freshwater resources, providing critical ecosystem services such as water supply, biodiversity conservation, and recreational opportunities [1,2,3]. The trophic status of lake water quality is influenced by a multitude of environmental factors, including both natural processes and anthropogenic drivers. Currently, human activities have become dominant stressors, significantly altering the health status of lakes worldwide [4,5]. These activities (e.g., agricultural non-point source pollution, industrial effluent discharge, domestic wastewater emissions, and tourism) have collectively imposed severe negative impacts on lake water quality. Such pressures not only elevate nutrient concentrations but also introduce substantial amounts of organic compounds and heavy metals, thereby accelerating eutrophication and water quality deterioration [6]. More than 85% of large Chinese lakes with areas greater than 10 km2 are eutrophic [7]; while in the Yangtze River Basin, the intensity of human activities within watersheds exhibits a strong positive correlation with the trophic status of lakes [8].
Dissolved organic matter (DOM), a complex heterogeneous mixture of aromatic and aliphatic organic compounds with diverse functional groups and molecular structures, is ubiquitously present in aquatic systems [9,10,11]. As a primary carbon and energy source for heterotrophic microorganisms, the characteristics of DOM directly modulate microbial metabolic activities, community structure, and ecological functions [12,13,14,15]. Meanwhile, total bacterial content (BC) and Escherichia coli (E. coli), as key conventional microbial indicators, are closely related to water quality dynamics. BC reflects the overall activity of aquatic microbial communities and their role in nutrient cycling, while E. coli is a well-recognized marker of anthropogenic pollution (e.g., domestic sewage contamination) and may pose a potential risk to water safety and public health [16,17,18]. The correlation between DOM and microbial presence represents a critical link for understanding lake ecosystem health. DOM bioavailability and molecular composition influence microbial growth, reproduction, and pollutant transformation, while microbial metabolism in turn drives DOM decomposition, humification, and source turnover [19,20]. Dissecting this mutual feedback mechanism is critical for unraveling the ecological consequences of anthropogenic disturbances and refining lake environmental management strategies [21].
Numerous studies have confirmed that human activities significantly alter the sources and molecular composition of DOM in lakes through land-use changes. For instance, urbanization leads to an increase in protein-like components, while agricultural activities introduce substantial amounts of terrestrial humic substances [22]. Simultaneously, microbial community responses to anthropogenic stress, such as shifts in spatial distribution, co-occurrence networks, and community assembly, have been widely studied [16]. However, in lake ecosystems subject to multiple coexisting disturbance types (e.g., tourism, intensive agriculture, and urbanization), the mechanisms by which DOM composition drives bacterial metabolic activity, as distinct from merely shaping community composition or diversity, remain poorly understood. Rarely have studies explored how DOM molecular composition regulates the metabolism of E. coli and total bacteria, though this relationship matters greatly to water safety [23]. Since E. coli endangers public health and responds sensitively to DOM carbon and nutrients, clarifying the role of DOM in controlling E. coli shifts is vital for evaluating human pollution risks.
In recent years, fluorescence spectroscopy has emerged as a well-established technique for characterizing the organic matter profile and physicochemical properties of water, while also showing great promise for the analysis of DOM [24,25,26,27,28]. Fluorescence data are represented as three-dimensional excitation–emission matrices (EEMs), in which fluorescence intensity varies as a function of excitation and emission wavelengths [29]. Traditional statistical approaches (e.g., multiple linear regression, Pearson correlation) assume linearity and independence, but DOM data have multicollinearity, non-linearity, and high dimensionality. Thus, they fail to resolve overlapping signals and complex DOM–microbe couplings, potentially masking key ecological patterns. However, integrating advanced spectroscopy with machine learning offers a more effective approach to overcome these limitations. Specifically, EEMs combined with self-organizing map (SOM) neural networks can effectively characterize the sources and structural features of DOM by projecting high-dimensional fluorescence data onto a two-dimensional topological space, thereby intuitively revealing similarities and gradient variations across samples from different anthropogenic disturbance types [30,31]. Furthermore, random forest algorithms and principal component analysis (PCA) help identify the key environmental factors that control the variability of these microbial indicators. These advanced approaches enable us to decipher the complex, non-linear relationships between DOM properties and microbial indicators, particularly the response of E. coli to DOM composition, which traditional linear methods fail to capture. These approaches provide powerful tools for deciphering DOM sources, composition, and ecological effects in aquatic environments [32,33,34].
In this study, we focused on a typical human-impacted lake network, selecting tourism, intensive agriculture, and urbanization sub-lakes representing distinct anthropogenic disturbance. By integrating EEM spectroscopy, SOM, and statistical analyses, we aimed to: (i) characterize the spectral properties, source origins, and spatial heterogeneity of DOM across the three lake sectors; (ii) quantify the correlation between DOM characteristics (e.g., humification degree, bioavailability, and source type) and the activity of BC and E. coli; and (iii) identify DOM-related and environmental factors regulating microbial indicator dynamics. Unraveling the correlation between DOM and conventional microbial indicators is critical for advancing our understanding of anthropogenic disturbance impacts on lake ecosystems, as it bridges organic matter cycling and microbial responses, providing a scientific basis for assessing water quality risks, optimizing pollution control measures, and developing targeted lake management strategies. By explicitly linking DOM molecular signatures to E. coli and BC variations, this study addresses a key knowledge gap in aquatic microbial ecology and offers practical guidance for safeguarding freshwater ecosystem health and public water safety in human-impacted lake environments.

2. Materials and Methods

2.1. Sample Collection and Processing

Our study area is a typical human-impacted lake located in Hubei Province, which comprises a network of interconnected sub-lakes. The interconnected water bodies form a large, extensive aquatic system, ranking it among China’s largest urban lakes [35,36]. Considering the divergent water quality and pollution features across the lake network, three representative sub-lake zones were chosen for investigation: Guozheng (GZ), Tuanhu (TH), and Miaohu (MH). The three zones correspond to three typical anthropogenic disturbance sources: tourism activities, agricultural runoff, and urban domestic sewage discharge. These differing pressures result in varied physicochemical conditions; hence, this study aims to elucidate how these differences shape DOM composition.
The GZ area is dominated by tourism, and various human activities in its surroundings impact the local water quality. As GZ is a scenic area, strict environmental protection measures have been imposed to maintain good water quality and provide ecological protection. TH is an intensive agricultural area, with agricultural activities occurring widely in the surrounding region and a relatively high intensity of agricultural surface source inputs affecting water quality. In addition, as MH is situated in a densely populated urban area, its water quality is heavily influenced by domestic activities.
Detailed information on the sampling area and specific sampling points is shown in Figure 1. A total of 38 water samples were collected, 12 from GZ, 13 from TH, and 13 from MH. Sampling was conducted in April 2024, when the average temperature was 28 °C, the relative humidity was 64%, the light intensity was 500.37 W/m2, the average air pressure was 1027.52 hPa, and there was no rainfall on the sampling day. At each sampling point, 3 individual samples were collected using an organic glass water sampler, then mixed thoroughly, transferred into brown glass bottles, and stored at 4 °C in the dark. The basic water quality parameters were measured in situ with portable instruments. All measurements for the 38 water samples were completed within 3 days. Aquatic plant cover on the water surface was visually estimated and recorded as percentage coverage. The 38 water samples were collected solely for preliminary exploratory purposes.
Our results, derived from a single sampling event, provide spatially explicit information and serve as an exploratory study. Future research incorporating multi-seasonal and interannual monitoring is required to validate and expand upon these findings.

2.2. Measurement of Water Quality Parameters

In situ measurements included water temperature (T), oxidation-reduction potential (ORP), and electrical conductivity (EC) using a portable meter (Model EC300, YSI, Yellow Springs, OH, USA), while pH was measured with a pH meter (PhSJ-4F, LeiMagnet, Shanghai, China), and dissolved oxygen (DO) was determined using a portable DO meter (ProODO, YSI, USA).
The remaining measurements were completed in the laboratory. For each sample, 500 mL of water was collected and filtered through a pre-combusted (400 °C for 4 h in a muffle furnace) 0.45 µm glass fiber membrane for subsequent analysis of total organic carbon (TOC) and three-dimensional EEM fluorescence spectra. TOC concentration (mg/L) was measured using a total organic carbon analyzer (TOC-V CPH, Shimadzu, Kyoto, Japan). The procedure for EEM fluorescence spectral analysis is detailed in Section 2.3.
Total BC and E. coli were measured using a water quality monitoring device (ColiMinder, VWM (Vienna Water Monitoring), Vienna, Austria). The instrument functions as a fully automated fluorescence photometer designed for real-time enzymatic activity detection in liquid samples. It processes liquid samples automatically in batches with a total volume of 6.5 mL. All measurement and calibration parameters, including temperature, assay duration, and volumes of buffer, substrate, or calibration solutions, can be configured either manually or remotely via the E-Trace Control software (V2.6) [37]. Compared with traditional culture-based methods, the ColiMinder system offers several advantages: it provides real-time microbial enzyme activity results within minutes, whereas traditional methods require 24–48 h of incubation; its automated fluorescence measurement reduces manual labor and errors; and it detects both culturable and viable-but-non-culturable (VBNC) bacteria by targeting constitutive enzyme activities (β-D-galactosidase and β-D-glucuronidase). However, this method has limitations: enzyme activity does not strictly correlate with CFU, background fluorescence may interfere, and live vs. dead cells cannot be distinguished. QA/QC included daily calibration, field blanks for every 20 samples, duplicate measurements (RSD < 10%), and regular inter-laboratory comparisons.
Total nitrogen (TN), total phosphorus (TP), ammonia nitrogen (NH4+), and chemical oxygen demand (COD) were measured specifically as shown in Table 1.

2.3. Fluorescence Spectroscopy Analysis

Samples were kept at ambient temperature and shielded from light prior to measurements. The ultraviolet-visible absorption spectra (UV-vis) of the water samples were acquired with a spectrophotometer (N5000PLUS, Yoke Instruments; Shanghai, China), using a 1 cm path length quartz cuvette. The absorbance of the water samples was scanned from 200 nm to 800 nm at a 1 nm scanning interval. Ultrapure water was used as a blank control, and spectral calibration was performed in the 680–800 nm band range. The UV-vis parameter SUVA254 calculation method was performed according to a previously reported method [42].
The EEM of all water samples were measured using a fluorescence spectrophotometer (F4600, Hitachi, Chiyoda City, Japan). The instrument parameters were as follows: the light source was a 150 W xenon light source; the photomultiplier voltage (PMT) was set to 700 V; the excitation and emission slit widths were both set to 5 nm; the excitation wavelength (Ex) range was 200–500 nm and the emission wavelength (Em) range was 200–550 nm, both of which were measured at 5 nm intervals; the scanning speed was set to 1200 nm/min; and a 1 cm optical path was achieved using a four-pass quartz fluorescence cuvette, with the EEMs of ultrapure water measured simultaneously. Finally, the fluorescence index (FI), humification index (HIX) and autochthonous index (BIX) were calculated according to previously reported literature [43,44].

2.4. Data Analysis Methods

Matlab v. 2021a, Origin v. 2021b (learning version), ArcMap v. 10.7, and R v. 4.0.5 (ggplot2 toolkit) were used for data plotting.
Statistical analyses (with significance thresholds of p < 0.05, p < 0.01 and p < 0.001 fordifferent statistical levels) were performed using R software (v. 4.0.5), including the t-test, one-way ANOVA followed by Tukey’s HSD post hoc test, principal component analysis (PCA) and permutational multivariate analysis of variance Adonis multivariate ANOVA (vegan package), and the data were processed using the dreem toolbox in Matlab v. 2021a. Random forests (RF) models were constructed using R (v. 4.0.5) with the “randomForest” and “rfPermute” packages applied to analyze the selected water quality indicators (i.e., COD, TOC, TN, TP, NH4+, FI, BIX, and HIX) as predictor variables, while BC and E. coli were applied as response variables to identify the factors with the most influence on BC and E. coli in the three tested lake sectors. The significance level of the RF model was determined using the “A3” data package, based on 999 random permutations. Ultimately, these results were visualized using the “ggplot2” package. In the RF analysis, the number of decision trees (n_estimators) was set to 100 [45,46], with all other parameters, including min_samples_leaf = 1 and min_samples_split = 2, retained at their default settings [47].
The dreem toolbox was also used to process the EEM data for the water samples, and the “statistics toolbox” was used to determine the k-means clustering algorithm and the DBI, while finally the “som toolbox” was used to establish the SOM data. The formulas and parameters involved in the SOM implementation followed those reported in previous studies [6,8,9,48,49,50]. The SOM model was trained using the Matlab platform, in which the three-dimensional fluorescence data (i.e., EEMs) were assigned to best match units. Thus, the SOM results are presented in grid form, where each cell contains raw EEM data, the spectral properties of which change gradually according to the input data characteristics [51,52,53,54]. The grid size was decided based on the heuristic equation and the number of input samples, which recommends that the number of neurons (m) should be approximately equal to 5 n , where n is the number of input samples. In this study, with n = 38 water samples, several rectangular grid configurations close to this value were considered (e.g., 5 × 6, 4 × 8, 3 × 10, and 10 × 3). The optimal grid was selected based on a comparison of the quantization error (QE) and terrain error (TE). Lower QE and TE values indicate superior representation accuracy and topological preservation, respectively. Considering QE and TE, the final neural matrix consisted of 10 × 3 neurons, which resulted in a QE of 0.326 and a TE of 0.008. Then, after training the SOM, the resulting component planes were clustered using the K-means algorithm. The Davies–Bouldin Index (DBI) was employed to determine the optimal number of clusters [55]. The DBI evaluates the ratio of within-cluster scatter to between-cluster separation, with lower values corresponding to better-defined clusters.

3. Results and Discussion

3.1. General Water Quality Indices

As shown in Table 2, after verifying that the data met the assumptions of normality and homogeneity of variance for parametric testing, one-way ANOVA followed by Tukey’s HSD post hoc test was used for comparison. The results showed that the pH in TH was significantly higher than that in the other two lake sectors (p < 0.05), which may be attributed to its location within an intensive agricultural area. Such areas typically exhibit elevated soil pH, particularly when lime is applied to neutralize acidity and improve crop growth conditions. Alkaline substances from these soils can be transported into the lake via rainfall and surface runoff, thereby increasing the water pH [56]. Additionally, plant residues (e.g., crop stalks and weeds) from agricultural activities are often left in fields and may enter the lake system. Their subsequent decomposition consumes dissolved carbon dioxide, further contributing to the rise in pH. The higher pH in TH is ecologically relevant because it can alter DOM properties and microbial activity, thereby shaping DOM–microbe interactions across the three lake sectors [57]. In contrast, GZ is situated in a tourism zone and MH in a densely populated urban area. Water bodies in these regions frequently receive discharges of domestic and industrial wastewater, which often contain acidic components (e.g., sulfuric acid and hydrochloric acid) and organic matter, thereby lowering the water pH and reducing its alkalinity. Moreover, leisure and tourism activities introduce substantial amounts of organic waste, such as food scraps and detergents, into the water, further weakening its alkalinity. This distinct pH gradient not only underscores the differential anthropogenic impacts across the three lake sectors but also highlights pH as a pivotal environmental filter that governs DOM transformation pathways; therefore, pH regulation should be considered a key strategy for managing DOM dynamics and mitigating eutrophication risks in these urban-influenced water bodies.
In addition, the DO levels were significantly higher in GZ than in the other two lake sectors (p < 0.01). This may be attributed to the artificial aeration measures commonly implemented in GZ, a leisure and tourism area, such as fountains and water pumps. These installations enhance water mobility and promote oxygen dissolution. Furthermore, the abundant aquatic plants and wetlands in GZ release substantial oxygen through photosynthesis, significantly increasing the DO concentration. In contrast, the water bodies in the urban residential (MH) and intensive agricultural (TH) sectors are more susceptible to pollutants from domestic sewage, industrial effluents, pesticides, and fertilizers. The decomposition of these pollutants consumes dissolved oxygen, leading to lower DO levels.
The ORP in the TH sector was significantly lower than that in the other two lake sectors (p < 0.01). This pattern appears inconsistent with the DO trend, which showed higher values in TH. Sampling was conducted during warm seasonal conditions (i.e., the average water temperature was 28 °C) when thermal stratification may have occurred, whereby sunlight heats the surface water, forming a stable, low-density layer (epilimnion) with high dissolved oxygen (DO). This layer resists mixing with the colder, denser water below (hypolimnion). In the isolated hypolimnion, the decomposition of organic matter consumes oxygen and generates reducing substances, resulting in the observed low redox potential.
These spatial patterns confirm that EC is a sensitive indicator of anthropogenic disturbance in freshwater ecosystems. The lower EC in GZ reflects the efficacy of regulatory interventions in reducing ion inputs, whereas the elevated EC in MH and TH highlights the cumulative impact of urban and agricultural runoff. Given that domestic wastewater and agricultural fertilizers introduce substantial ionic loads (e.g., chlorides, sulfates, and nitrates), EC may serve as a cost-effective proxy for assessing overall water quality impairment in urban-influenced lakes [58].
Taken together, these findings indicate that land-use intensity and anthropogenic activities may jointly shape the physicochemical conditions of urban-influenced lakes, with aeration and pollution control being potential management options. The relationships among DO, ORP, and EC provide mechanistic clues for understanding water quality degradation.
As shown in Table 3, significant differences in water quality were observed among the three lake sectors, primarily driven by the distinct anthropogenic activities in each region. The COD and TOC concentrations in the TH sector were significantly higher than those in the other two lake sectors (p < 0.01), which may be attributed to its location in an intensive agricultural area. These elevated levels may reflect considerable inputs of agricultural organic pollutants, such as pesticides and fertilizers. Agricultural-dominated land use has been shown to elevate nutrient pollution and eutrophication risks, with intensive farming activities and runoff contributing to elevated COD concentrations in receiving water bodies [59].
In contrast, the GZ sector, situated in a leisure and tourism zone, exhibited lower overall organic matter pollution, possibly due to stricter environmental regulations and maintenance practices that help mitigate contamination. The TN concentration was significantly lower in the MH sector than in the other two lake sectors (p < 0.01). Although MH is surrounded by a densely populated urban area and receives domestic wastewater discharge, its contribution to nitrogen pollution appears less pronounced compared to agricultural sources in TH. In terms of TP, no significant differences were detected among the three lake sectors (p > 0.05). Notably, the NH4+ concentration was significantly higher in GZ than in the other two lake sectors (p < 0.01), suggesting that dissolved ammonium may be a dominant form of nitrogen present in the GZ sector. These findings indicate that bulk organic matter (COD/TOC) and nitrogen species (TN vs. NH4+) respond differently to land-use types, suggesting that water quality assessments should incorporate multiple indicators rather than relying on a single parameter.
Overall, these findings suggest that water quality in the lake network may be affected by predominant land use and anthropogenic activities occurring in the surrounding region.

3.2. Three-Dimensional Fluorescence Characteristics of Dissolved Organic Matter (DOM)

3.2.1. Fluorescence Parameter Analysis

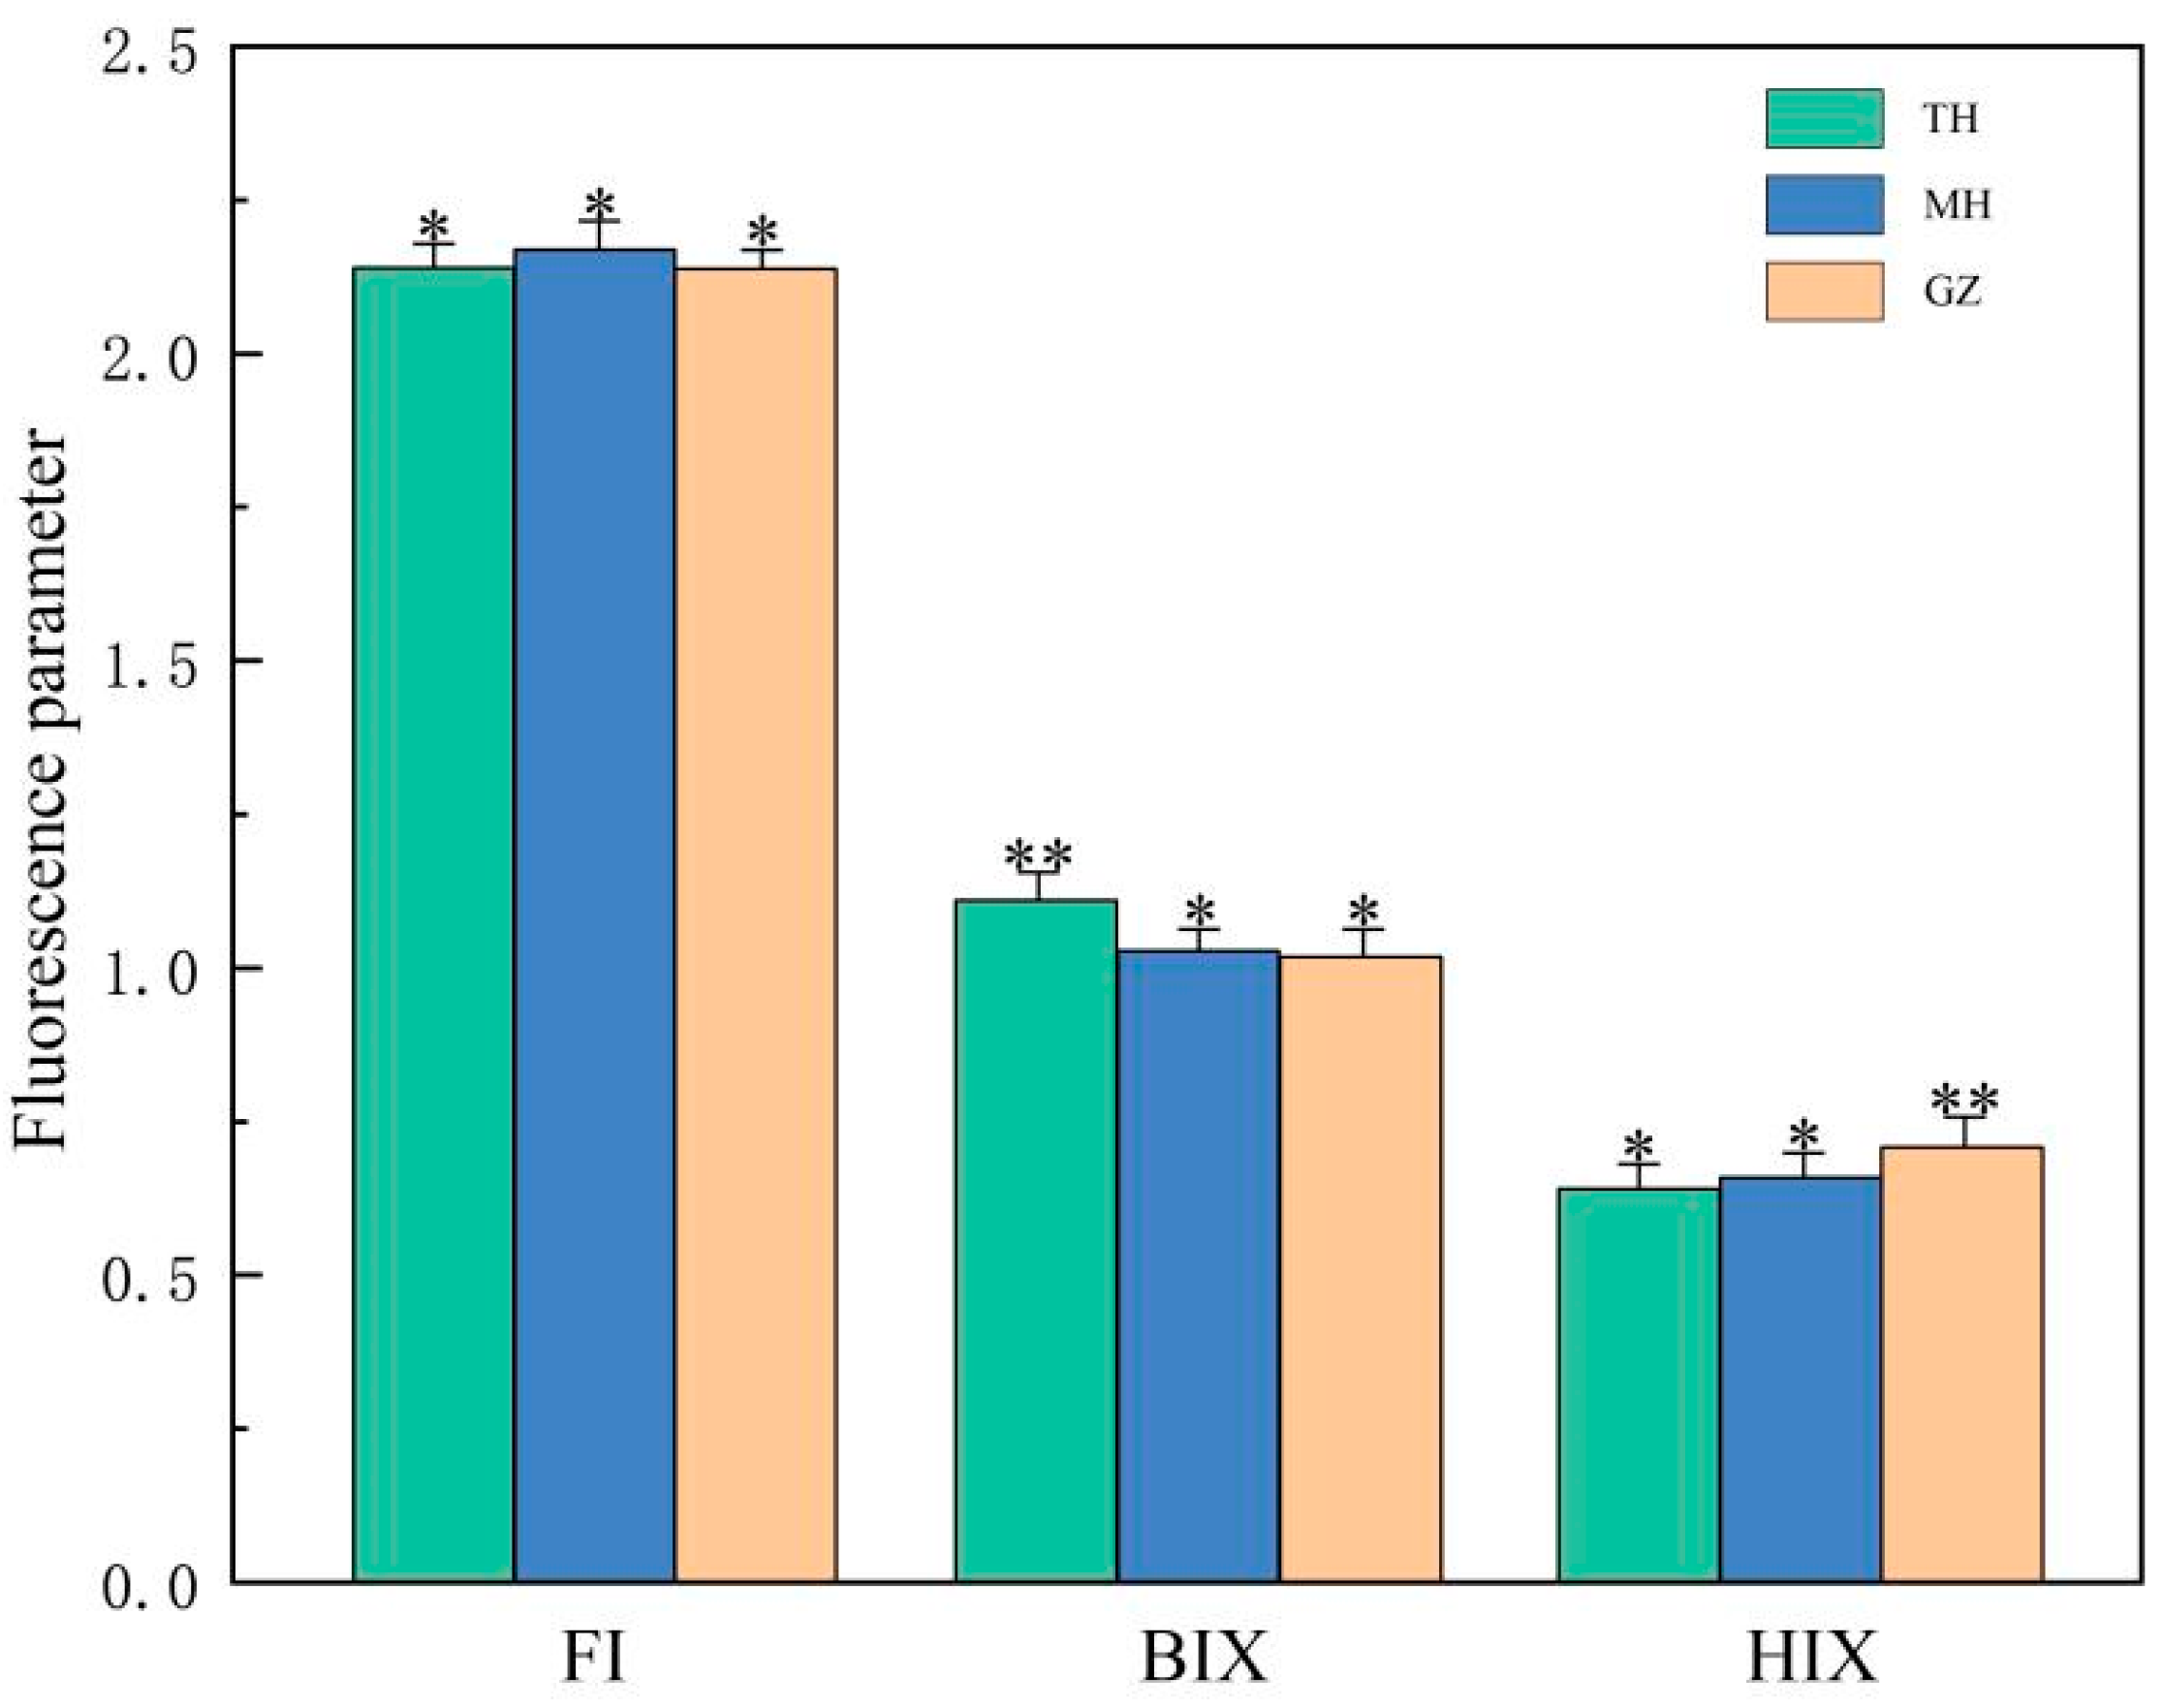
In all three tested lake sectors, DOM originated from both heterogeneous and non-heterogeneous inputs, as distinguished by the fluorescence index (FI), biological index (BIX), and humification index (HIX). The FI reflects the origin of humic-like components in DOM, with values > 1.9 typically suggesting predominantly microbial-derived sources and values < 1.4 suggesting terrestrial inputs [60]. As shown in Figure 2, the FI values for TH (2.14 ± 0.06), 95% CI [2.10, 2.18], MH (2.17 ± 0.09), 95% CI [2.11, 2.23], and GZ (2.14 ± 0.10), 95% CI [2.08, 2.20] did not differ significantly (p > 0.05, t-test) and all exceeded 1.9, indicating a predominance of autochthonous DOM sources across all sectors. Notably, these values are much higher than the conventional FI range of 1.2–1.8 for natural freshwater bodies. Long-term anthropogenic nutrient inputs greatly promote microbial growth and metabolic activities in water, potentially leading to the accumulation of abundant microbially derived DOM and consequently helping to maintain overall elevated FI levels across the whole water area.
BIX was used to characterize the degree of autochthonous origin and bioavailability of DOM. A BIX value > 1 suggests strong autochthonous microbial contributions, while 0.8 < BIX < 1 indicates a moderate autochthonous contribution, and BIX < 0.6 indicates predominantly terrestrial-derived DOM. The BIX value in TH (1.11 ± 0.04) (CI [1.08, 1.14]) was significantly higher than that in MH (1.03 ± 0.03) (95% CI [1.01, 1.05]) and GZ (1.02 ± 0.05) (95% CI [0.99, 1.05]) (p < 0.001, t-test), indicating a possible stronger autochthonous microbial signature and higher bioavailability of DOM in the agricultural sector.
HIX reflects the degree of humification of DOM and has been shown to be negatively correlated with carbohydrate content [61]. HIX values > 6 correspond to strongly humified, terrestrial-derived DOM, while HIX < 4 indicates weakly humified DOM of autochthonous origin. The HIX values in GZ (0.71 ± 0.04) (95% CI [0.68, 0.74]) were significantly higher than those in TH (0.64 ± 0.01) (95% CI [0.63, 0.65]) and MH (0.66 ± 0.07) (95% CI [0.61, 0.71]) (p < 0.001, t-test), with all three lake sectors having HIX values below 4, consistent with weak humification.
Combined with the fluorescence indices, the humic-like components of DOM in all three lake areas were mainly derived from microbial activities during the flat-water period. TH had higher BIX and lower HIX values, indicating that endogenous organic matter production was more prominent than that in urban and tourism areas.
The overall average optical characteristics of lake regions cannot represent the component differences in all water samples. Subsequent fine SOM clustering further reveals the source differentiation of fluorescent components and local terrestrial input characteristics within each region.

3.2.2. SOM Model Analysis for EEMs

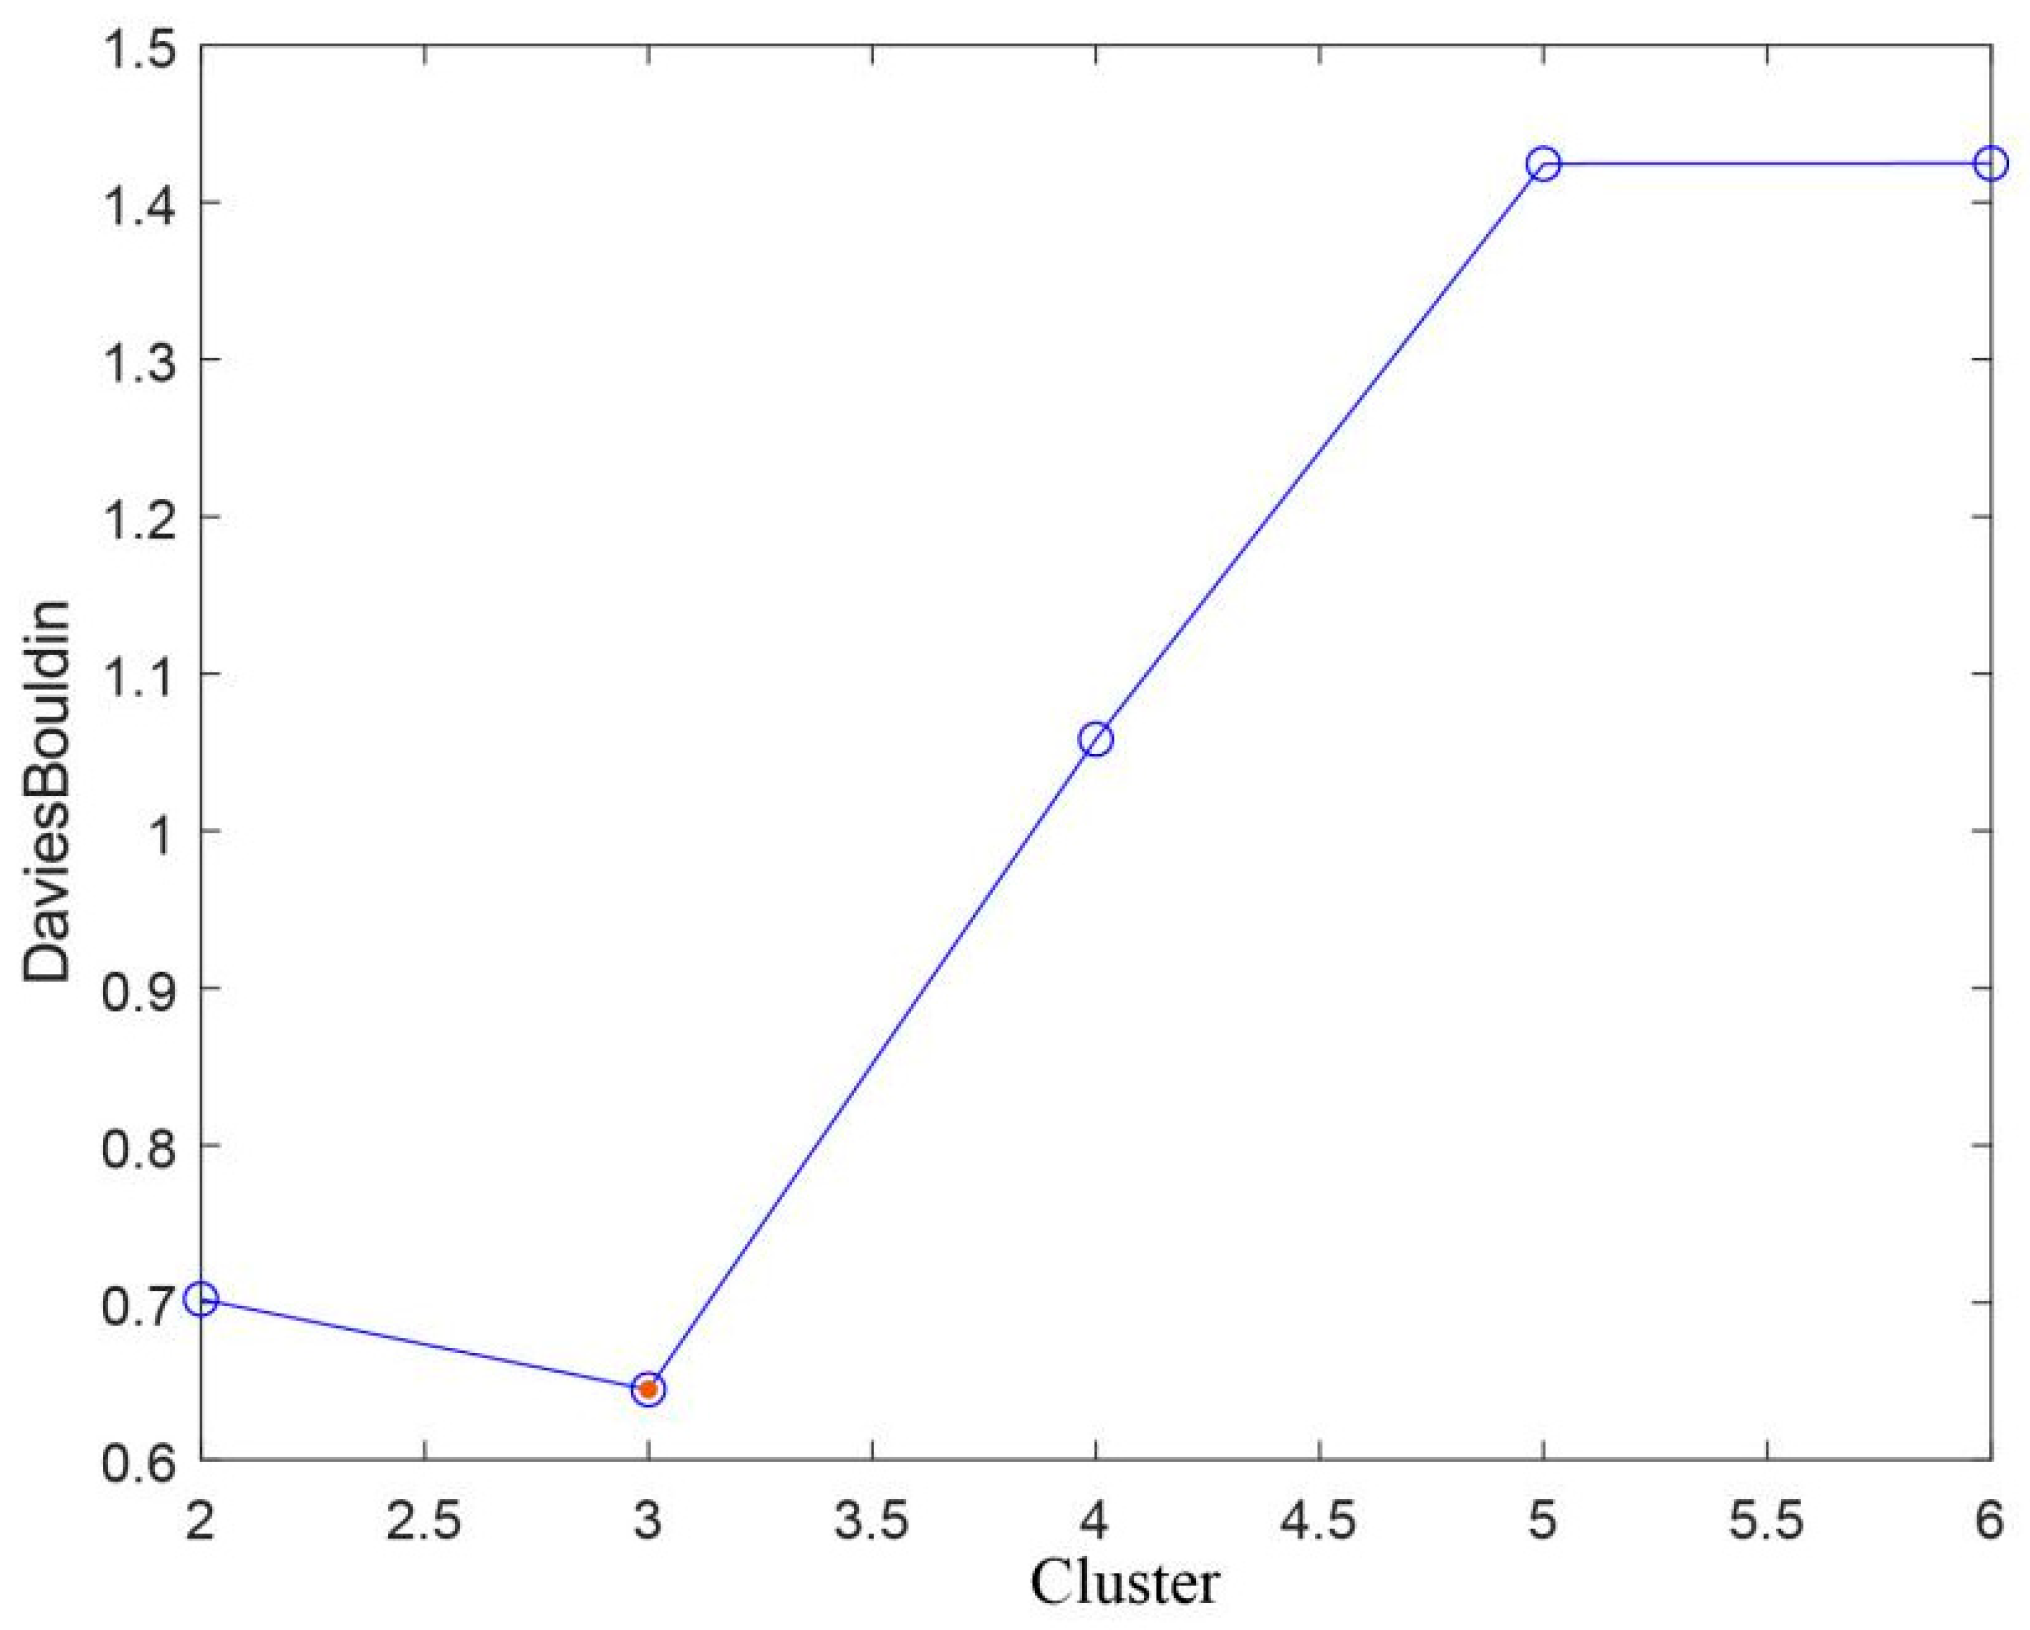
As shown in Figure 3, the DBI reached its minimum at three clusters. Consequently, the fluorescence spectrum was divided into three distinct regions.
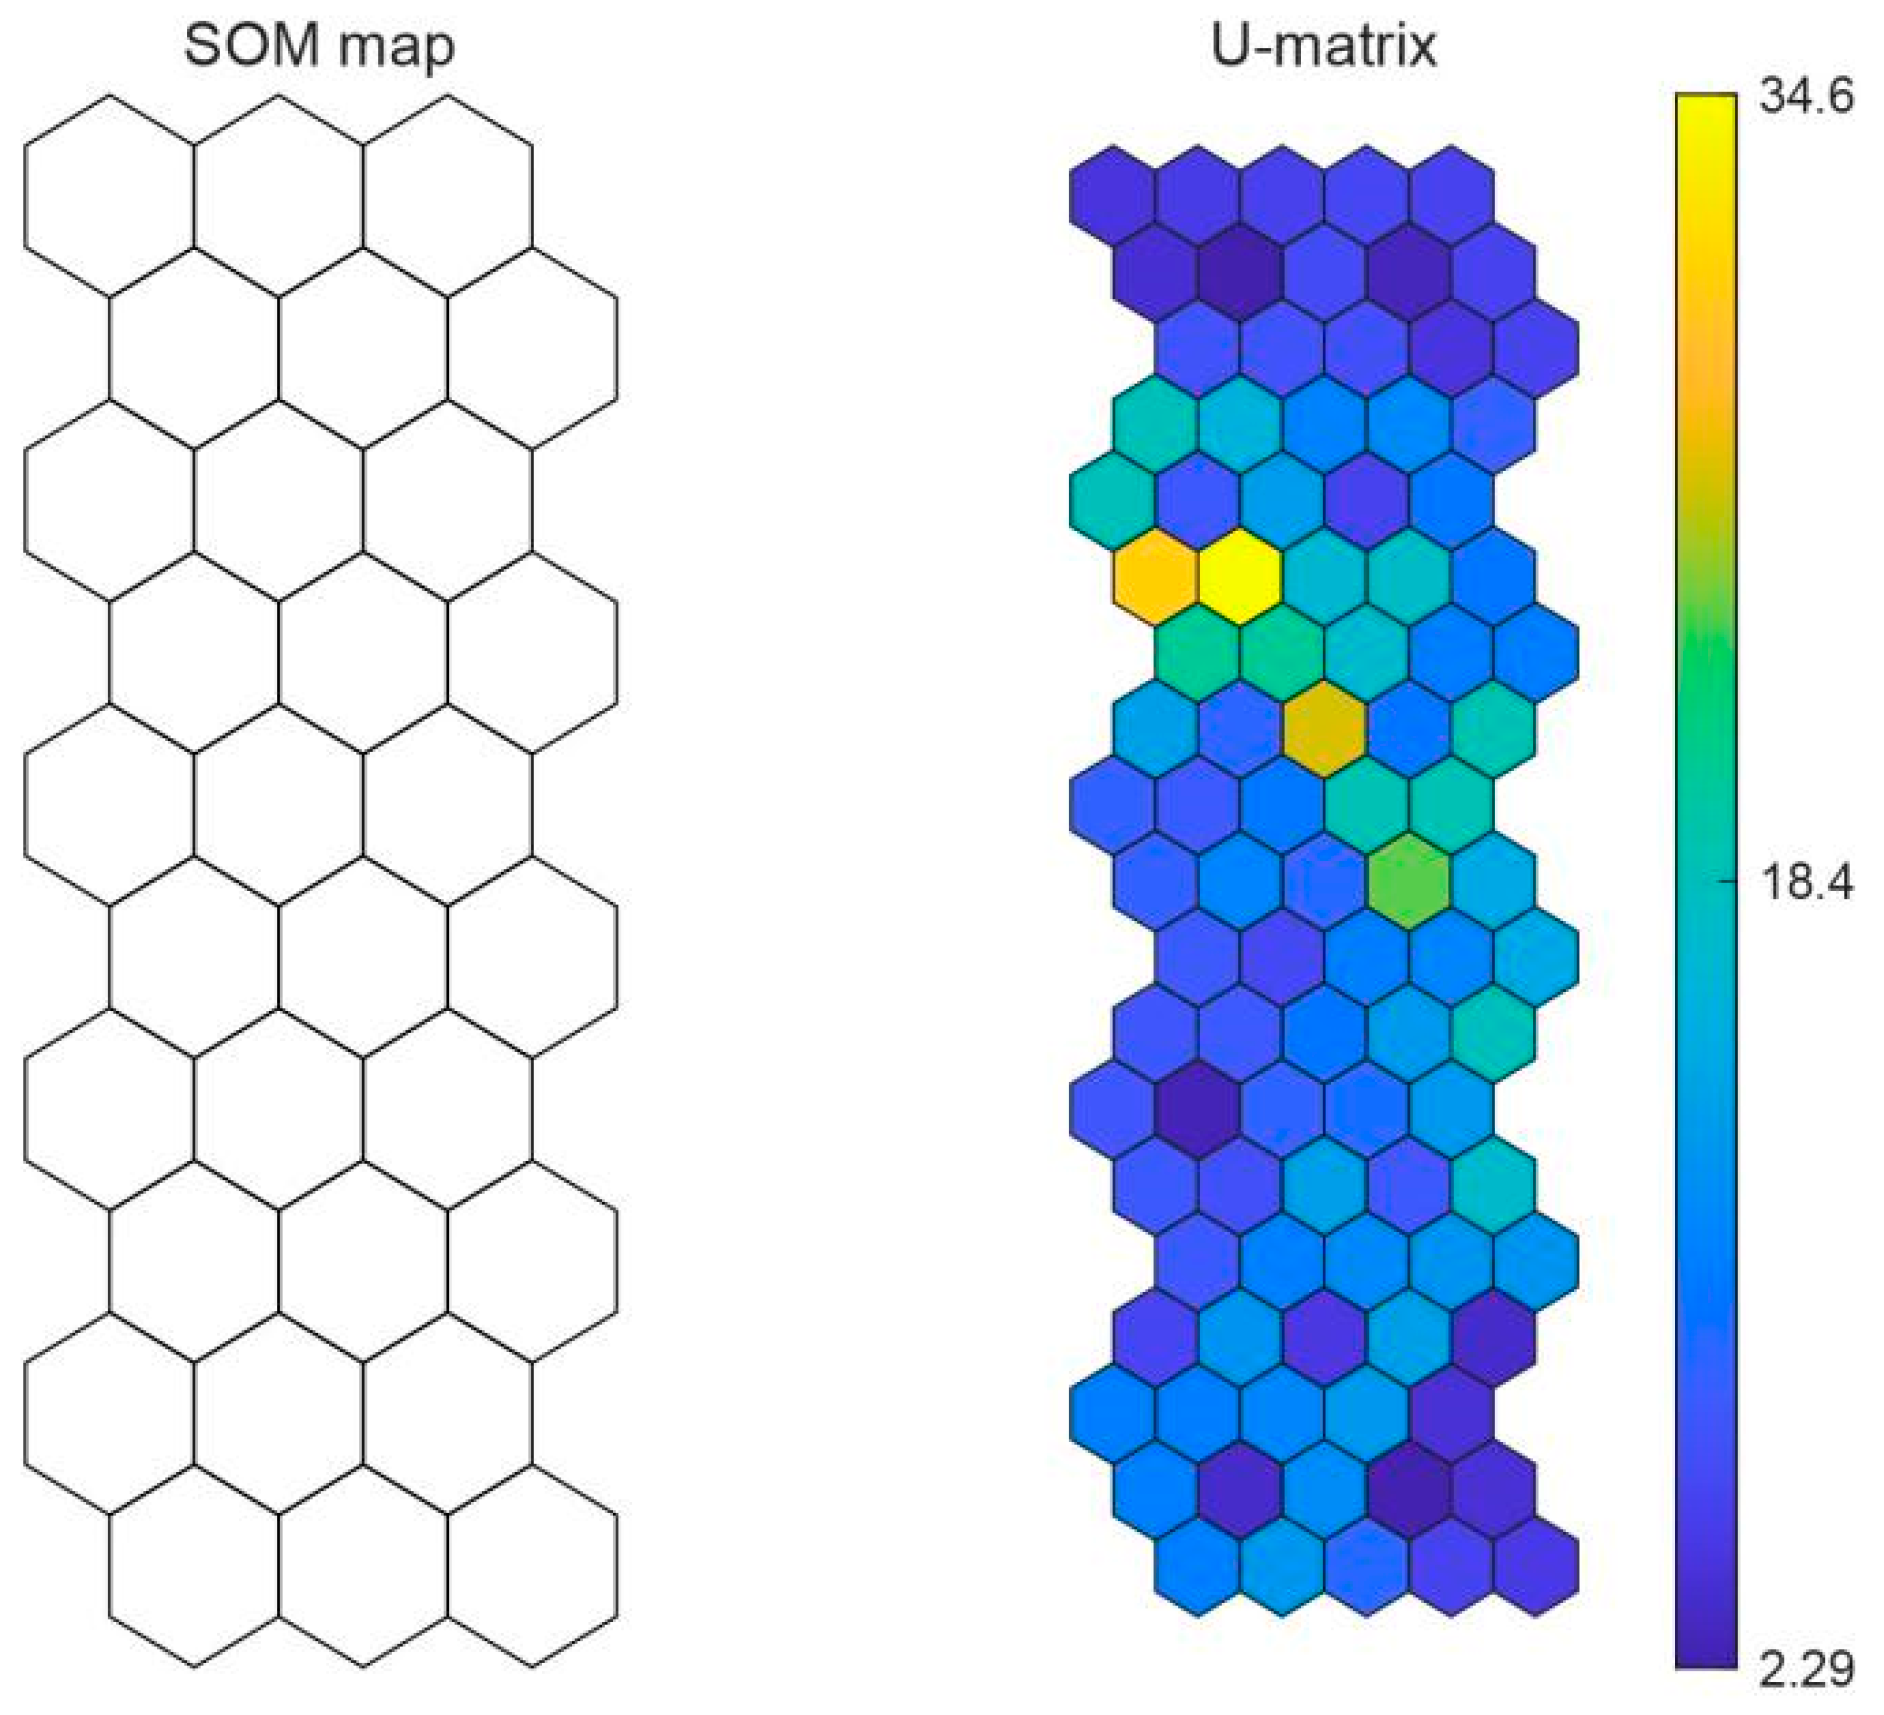
In the SOM grid, highly correlated variables were assigned to the same neuron, while moderately correlated variables were grouped into nearby neurons. A color scale was used to indicate the intensity of specific wavelength coordinates from the original EEMs across different neurons, forming the component planes. As shown in Figure 4, the SOM consisted of 10 × 3 neurons. The U-matrix visualization includes additional mapping units that represent inter-neuron distances, where high values indicate greater dissimilarity between neighboring neurons.
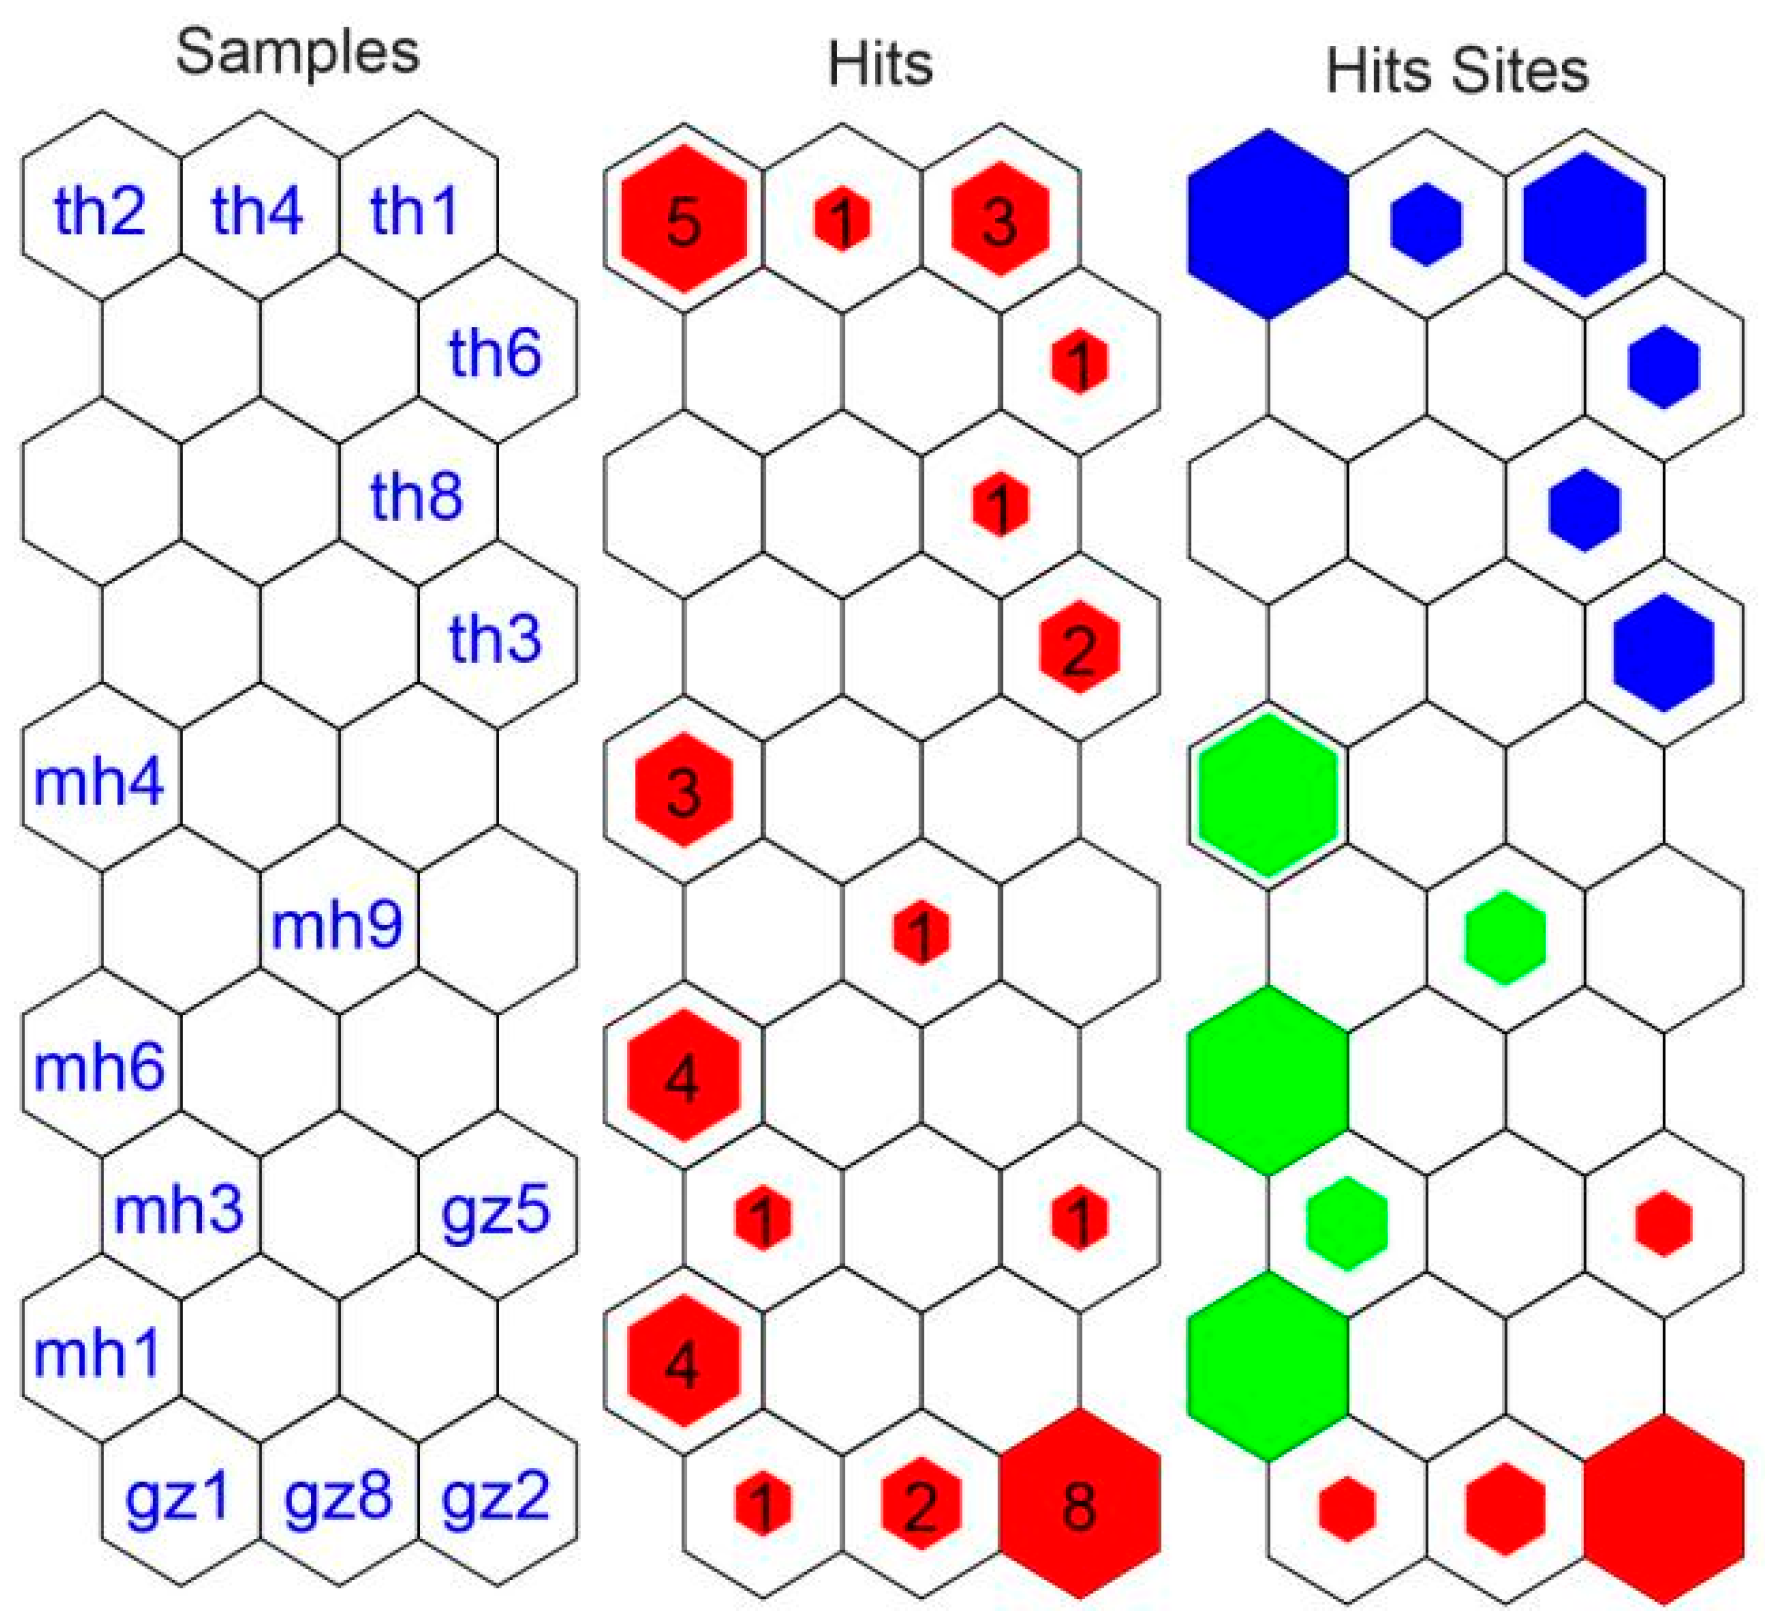
The labeling of the SOM neurons was performed based on the highest similarity between input samples and neuron weight vectors. The resulting distribution of samples across the SOM is visualized in Figure 5. Spatially, samples from the TH region were predominantly clustered in the top right corner of the map, exhibiting a centralized pattern. In contrast, samples from MH and GZ showed a more dispersed distribution. This distinct spatial segregation indicates significant differentiation in the fluorescence profiles of water samples from the three lake sectors.
The hit count for each neuron, represented by the color block size in Figure 5, further elucidates sample representation. Neurons located at the edges of the map recorded the highest hit frequencies. Analysis of the dominant sample type per neuron revealed that Neuron 1 was most representative of TH samples. Similarly, Neurons 7 and 9 were most characteristic of MH, while Neuron 30 best represented the fluorescence signature of GZ samples.
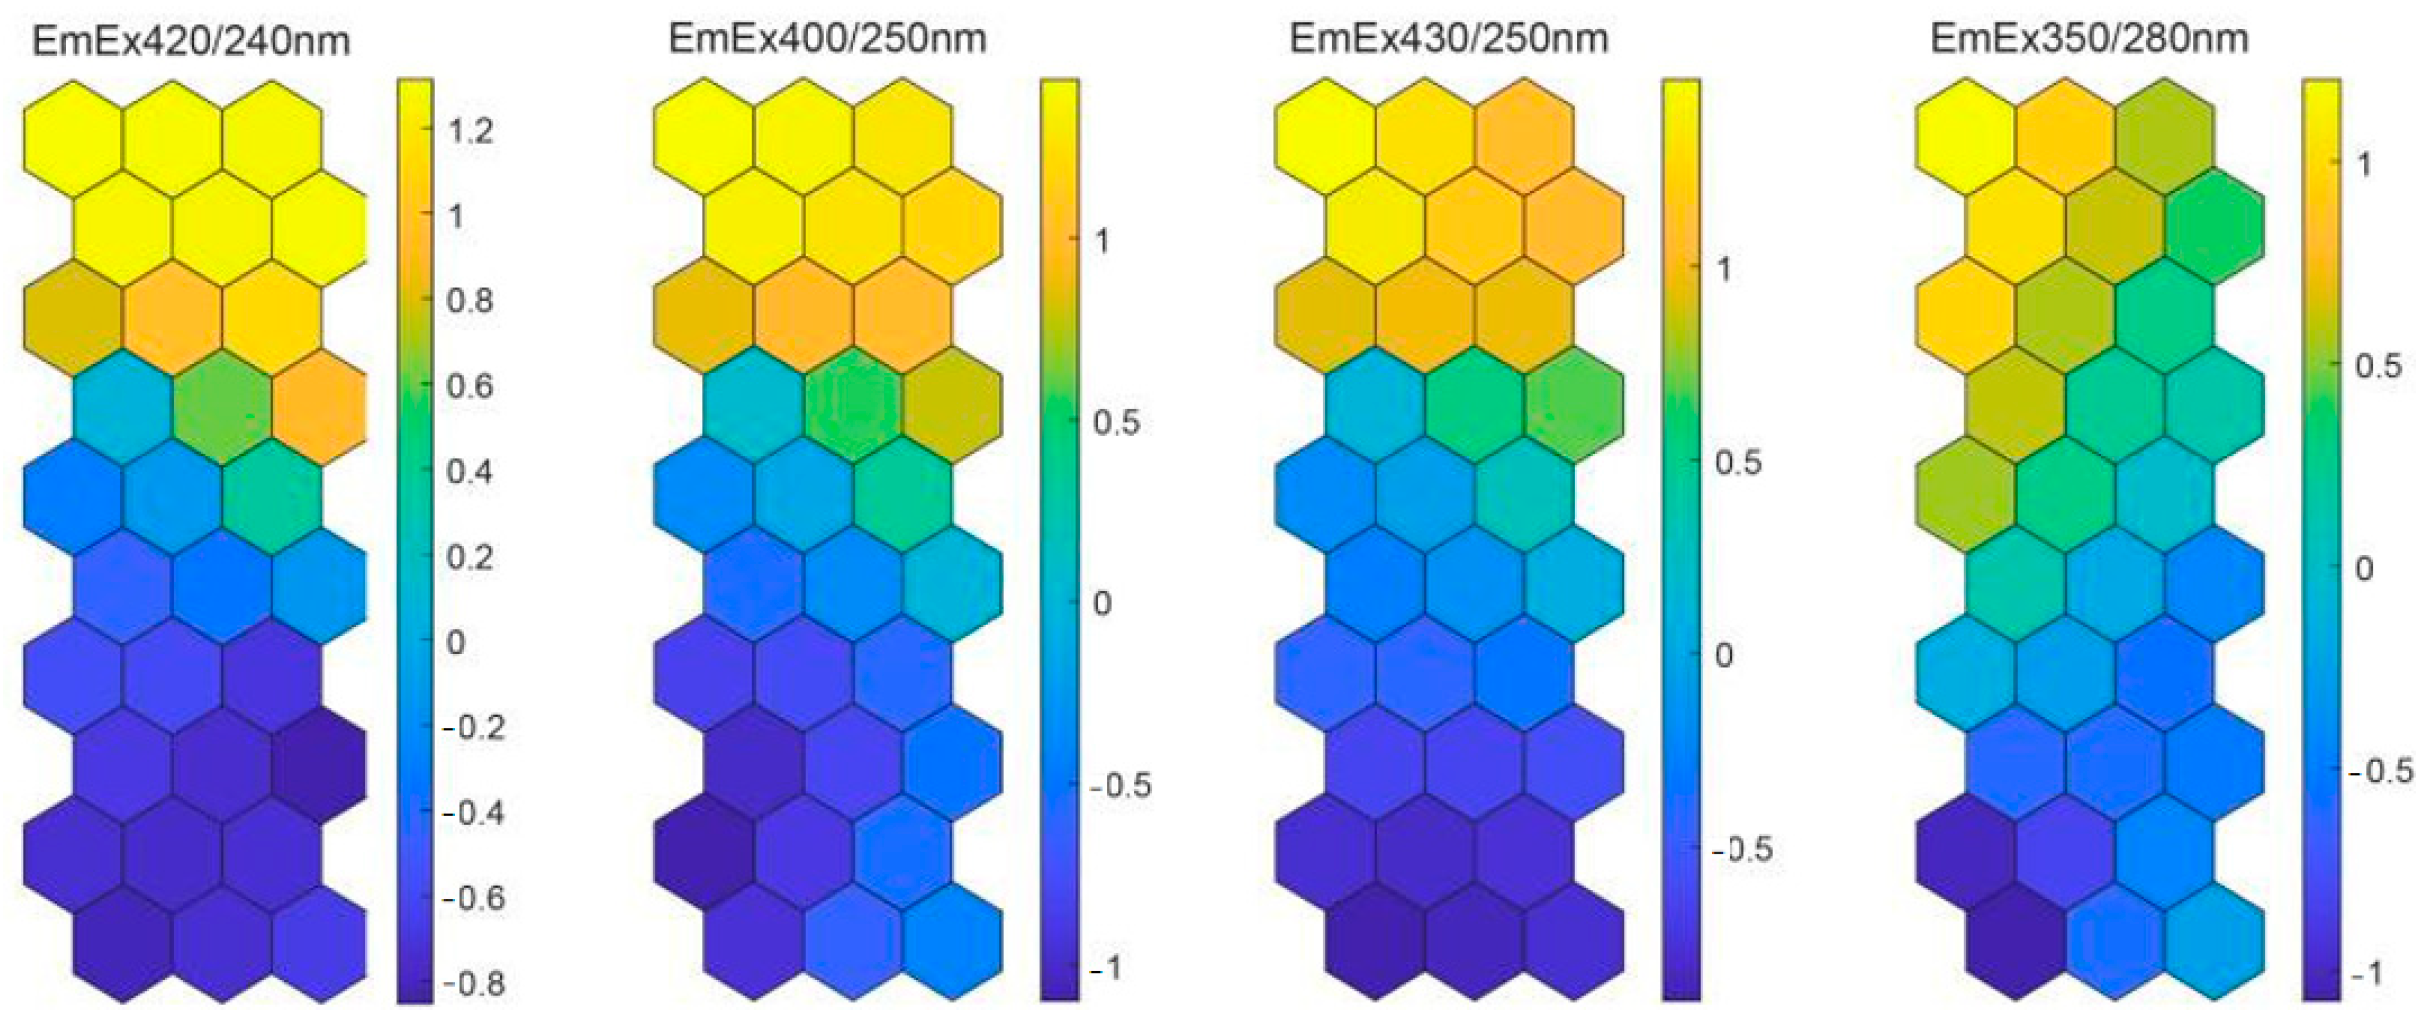
Figure 6 shows the visualization results for the four neurons in the SOM model, showing that each neuron exhibited a similar distribution of component colors, indicating a certain degree of correlation between neurons.
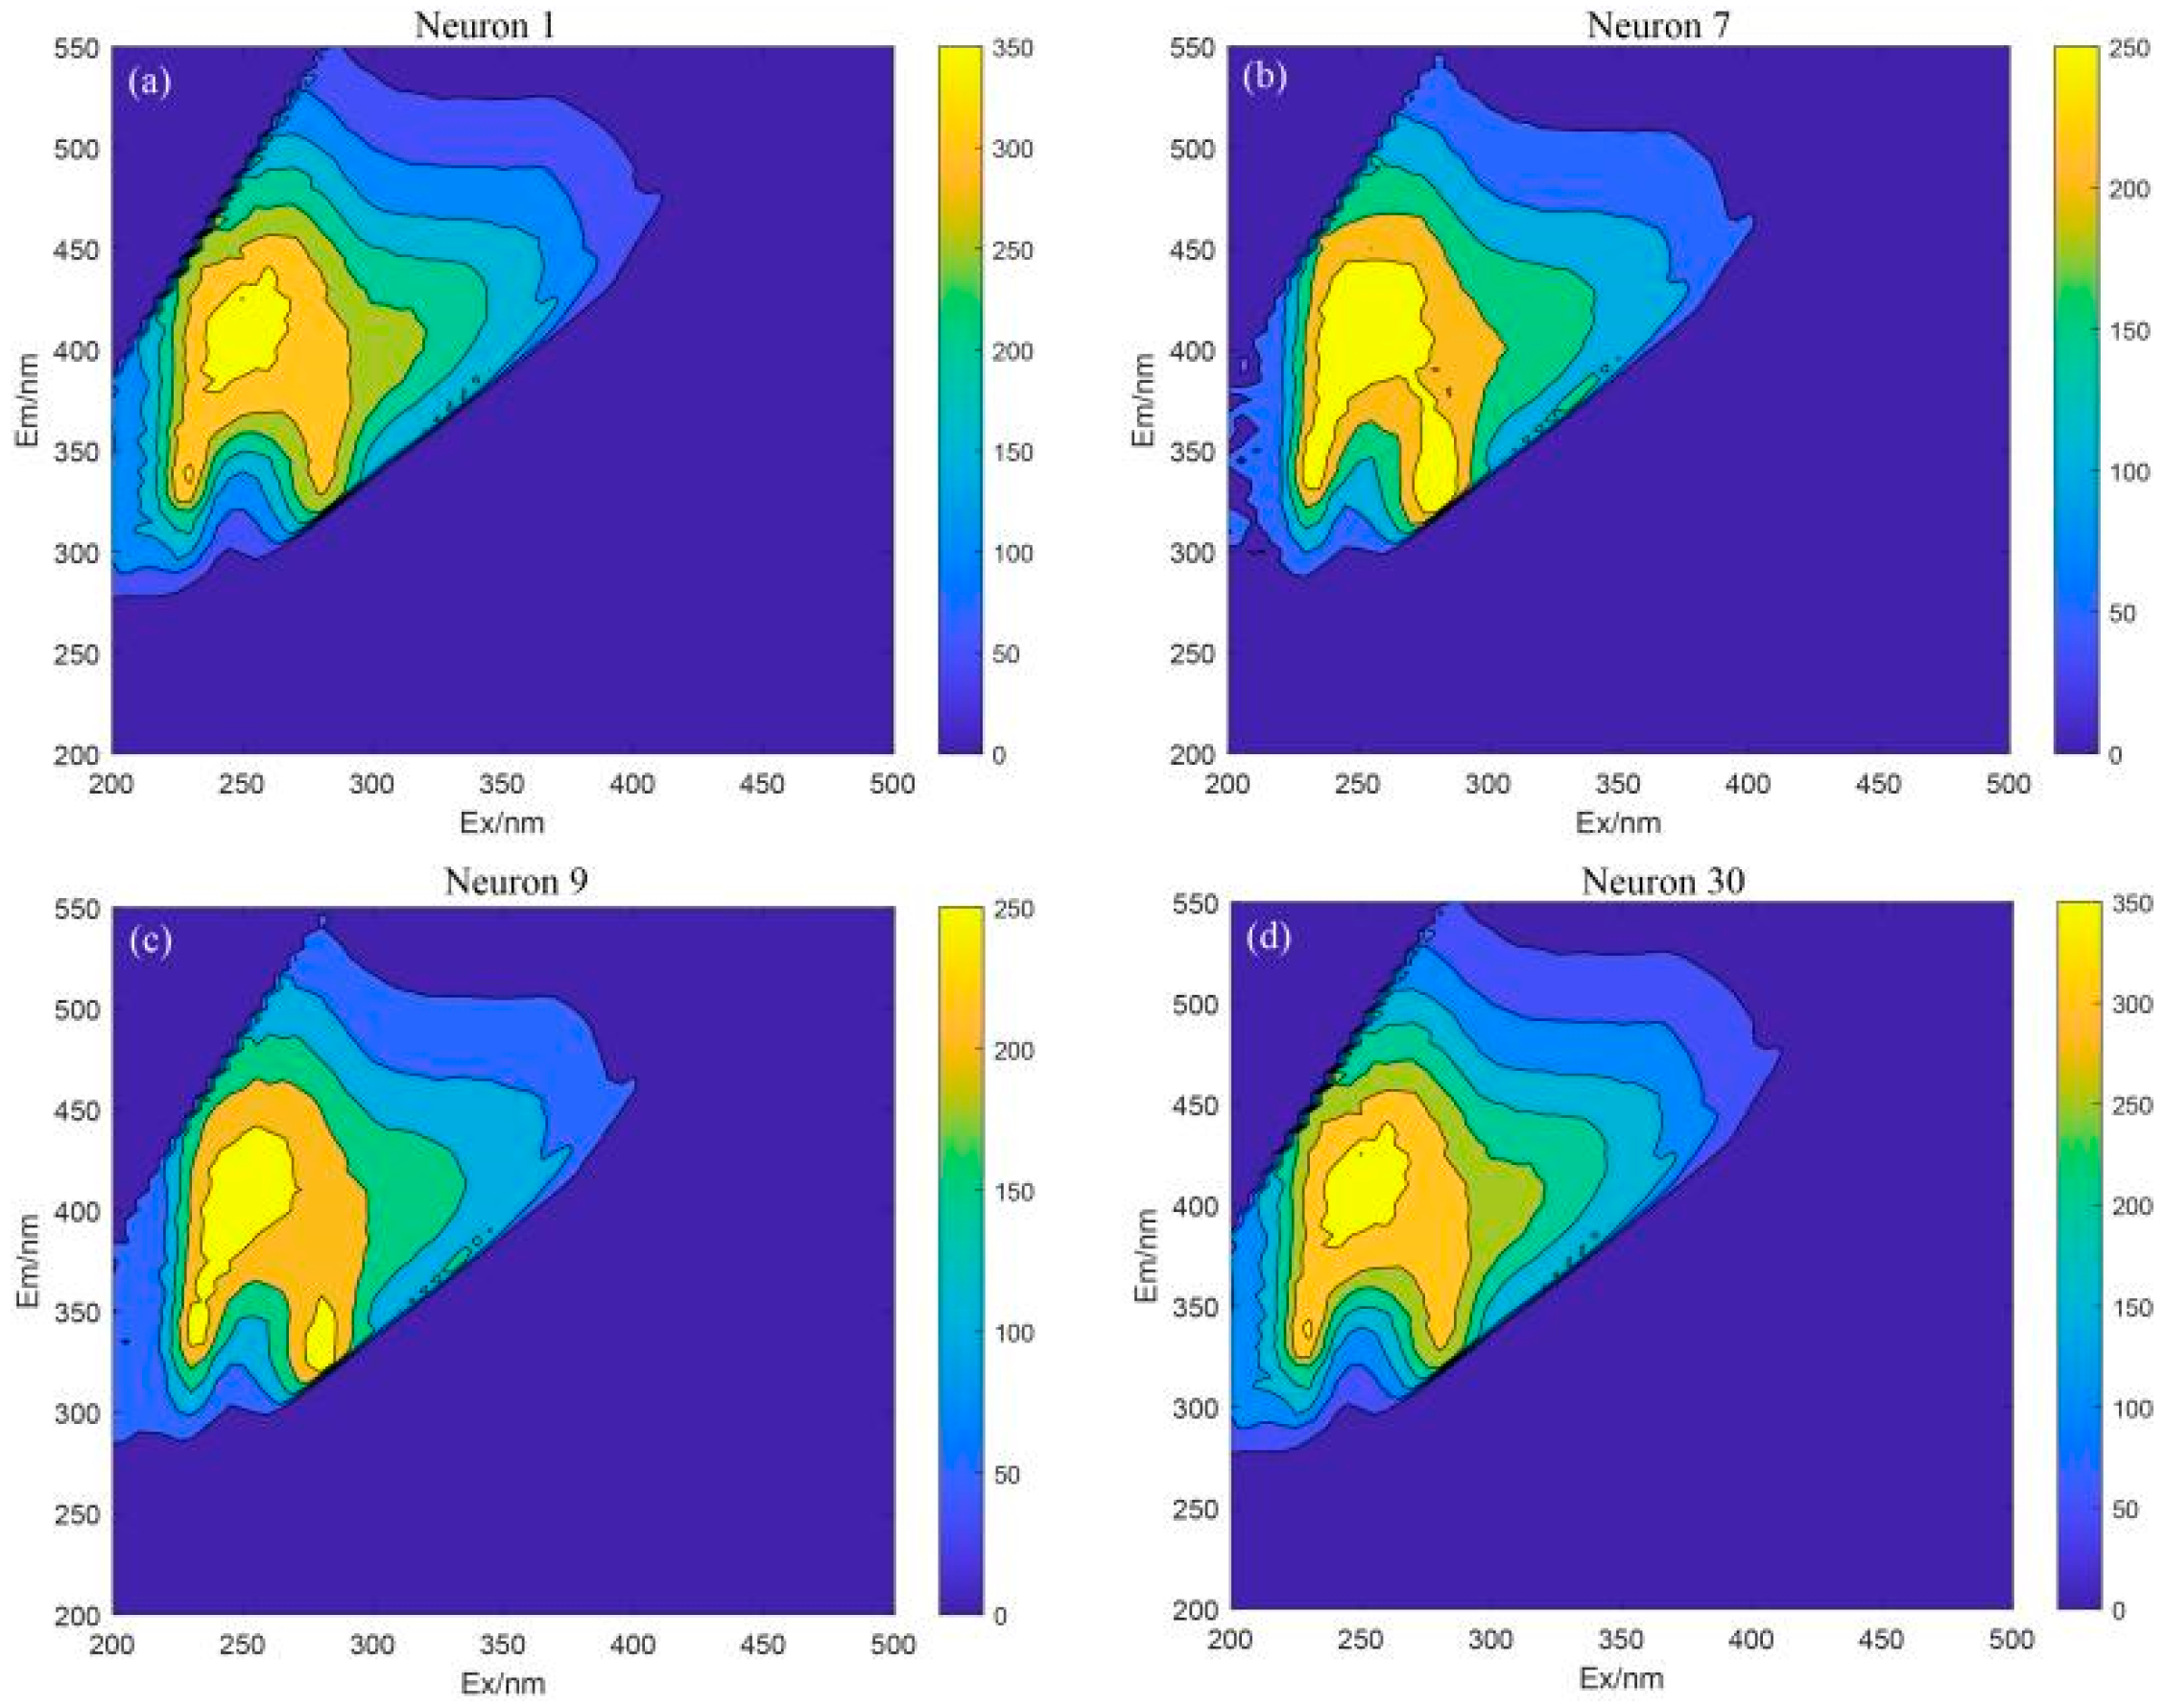
The dispersion of EEMs among the four representative neurons (1, 7, 9, and 30) was analyzed, and as shown in Figure 7. Neuron 1 exhibited primary excitation and emission peaks at Ex > 250 nm and Em > 380 nm, respectively, along with secondary peaks at Ex < 250 nm and Em: 330–380 nm. Neurons 7 and 9 both showed primary peaks at Ex < 250 nm and Em: 330–380 nm, while Neuron 30 displayed a primary peak at Ex < 250 nm and Em > 380 nm. The primary peak of Neuron 1, located in the short-wave UV region, was consistent with UVC fulvic acid (similar to Peak A [62]), whereas its secondary peak matched the signature of tryptophan-like aromatic proteins (similar to Peak T) [63,64,65]. The primary peaks of Neurons 7 and 9 were also categorized as protein-like, resembling Peak T. The primary peak of Neuron 30 was identified as UVA fulvic acid, analogous to Peak A.
The spectral classifications were further interpreted in relation to potential sources and environmental contexts. Neuron 1, representing the TH region, an area characterized by intensive agriculture, showed a dominant humus-like signal, likely derived from zooplankton, decaying plants, farmland compost, and other waste biomass. Its minor protein-like signal may be associated with anthropogenic activities near croplands [66]. Neurons 7 and 9, associated with the urban-centered MH region, were dominated by protein-like substances. As phytoplankton is the only major exception [67], organic matter in natural water bodies mainly originates from land-based inputs [68]. These substances likely originate from microbial degradation of algal detritus, indicating predominantly autochthonous dissolved organic matter, as well as from protein-rich wastewater discharges typical of densely populated areas. Neuron 30, corresponding to the GZ recreational and tourism zone, exhibited a UVA fulvic acid peak. This signal may be attributed to enhanced microbial decomposition of organic matter, promoted by high hydrological flow and anthropogenic nutrient inputs. Additionally, tourism-related pollutants such as detergents, sunscreens, and plastic debris may decompose into fulvic acid-like, UV-absorbing organic substances. Furthermore, without applying parallel factor analysis (PARAFAC) to decompose the EEM data, the interpretation of fluorescence components remains incomplete. Future studies would benefit from incorporating PARAFAC modeling to achieve a more robust characterization of DOM composition.

3.3. Random Forests Analysis

In the RF regression model, the importance of predictor variables was evaluated based on the percent increase in mean squared error, which reflects the contribution of each variable to the model’s predictions. Higher values indicate that a predictor is more important to the predictive performance of the model.
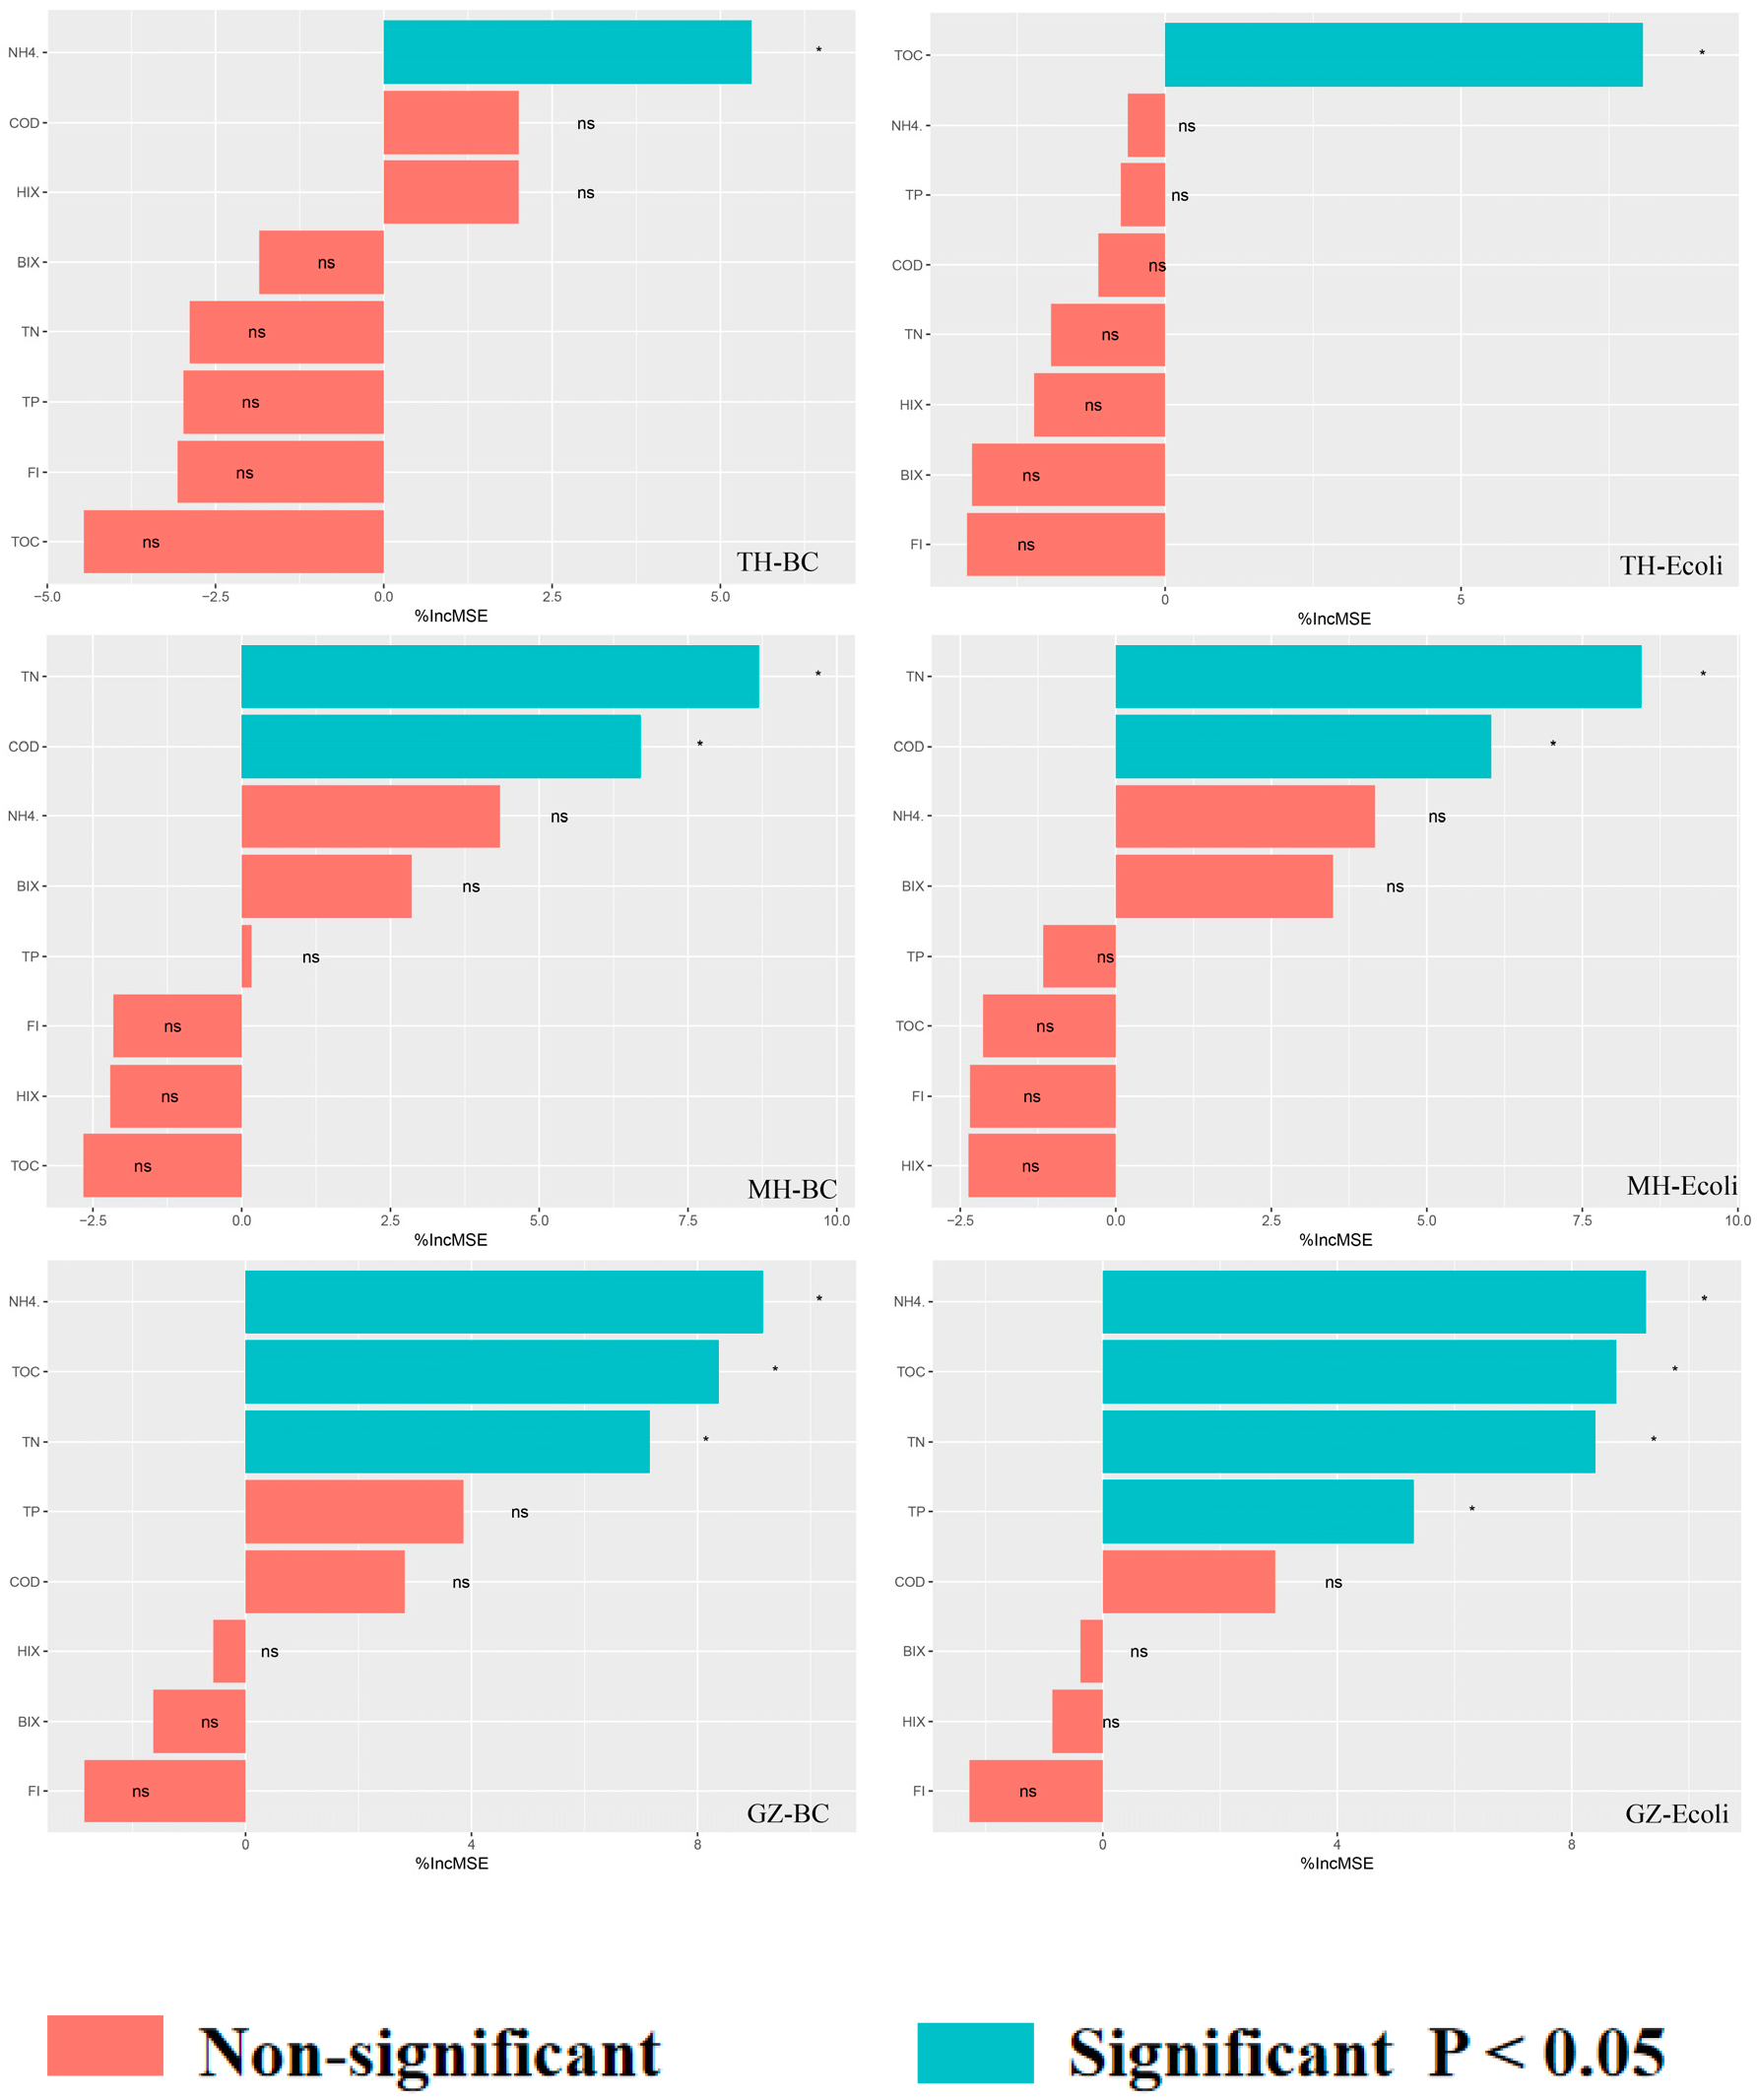
As shown in Figure 8, the influencing factors of total BC in the TH ranked by the percentage increase in mean squared error are: NH4+ > COD > HIX > BIX > TN > TP > FI > TOC. Among them, NH4+ is the most critical predictor, indicating a significant correlation between total BC and concentration of NH4+ in the TH. NH4+ is an indispensable nutrient salt in river and lake ecosystems. Field monitoring data demonstrate that the background concentration of ammonium nitrogen in the TH is generally low. Under such low-nutrient conditions, NH4+ serves as a limiting nutrient for bacterial growth and reproduction. Even slight variations in NH4+ derived from mild agricultural pollution can greatly affect BC. Furthermore, low-concentration NH4+ from trace agricultural inputs may tend to enrich dominant bacterial species that can efficiently utilize it for metabolism. These bacteria can exhibit faster reproduction rates and stronger niche competitiveness, which may reshape the microbial community structure and ultimately govern the dynamics of total bacterial abundance in this region.
For E. coli in TH, the parameter ranking is TOC > NH4+ > TP > COD > TN > HIX > BIX > FI, with TOC as the dominant predictor. This reflects a correlation between E. coli content and TOC concentration in TH. Higher TOC means more organic matter is available for bacterial decomposition and utilization. E. coli can break down complex organic matter into simple nutrient salts, which in turn facilitate its own growth and reproduction. Meanwhile, increased TOC is often accompanied by water quality changes, such as reduced dissolved oxygen and altered pH. These conditions can also favor the growth of fouling-related bacteria like E. coli, which is known to be facultatively anaerobic and capable of surviving and reproducing under anaerobic or low-oxygen environments as well.
For BC in MH, the parameter ranking is TN > COD > NH4+ > BIX > TP > FI > HIX > TOC. TN is the most dominant predictor, followed by COD, indicating that BC in MH correlates with TN and COD concentrations. High TN promotes phytoplankton growth, which serves as the main food source for zooplankton. Increased zooplankton populations then provide additional nutrients for bacteria via trophic transfer, significantly stimulating bacterial growth and increasing BC. Although the average COD concentration in urban lake areas is lower than that in agricultural lake areas, COD still acts as a key influencing factor for bacterial abundance in urban lakes. The COD in urban areas mainly originates from easily biodegradable organic matter in domestic sewage and wastewater discharge, which possesses high bioavailability to bacteria and can markedly facilitate bacterial growth. The variation trend of E. coli in urban lakes appears to be consistent with that of bacterial abundance, and its concentration also seems to be closely correlated with TN and COD levels.
For total BC in GZ, the parameter ranking is NH4+ > TOC > TN > TP > COD > HIX > BIX > FI. NH4+ is the most important predictor, with TOC and TN as secondary factors. Since nitrogen in GZ is mainly in dissolved form, bacteria capable of utilizing dissolved nitrogen dominate the microbial community. For E. coli in GZ, the parameter ranking is NH4+ > TOC > TN > TP > COD > BIX > HIX > FI. NH4+ is the most dominant predictor, with TOC, TN, and TP as secondary variables. Compared with BC, E. coli in the tourism area is more affected by TP. Frequent leisure and tourism activities introduce exotic species, cause overfishing, and damage the lake’s benthic ecosystem. This impairs the lake’s phosphorus absorption and fixation capacity, leading to phosphorus accumulation and enhanced phosphorus utilization by E. coli.

3.4. Principal Component Analysis

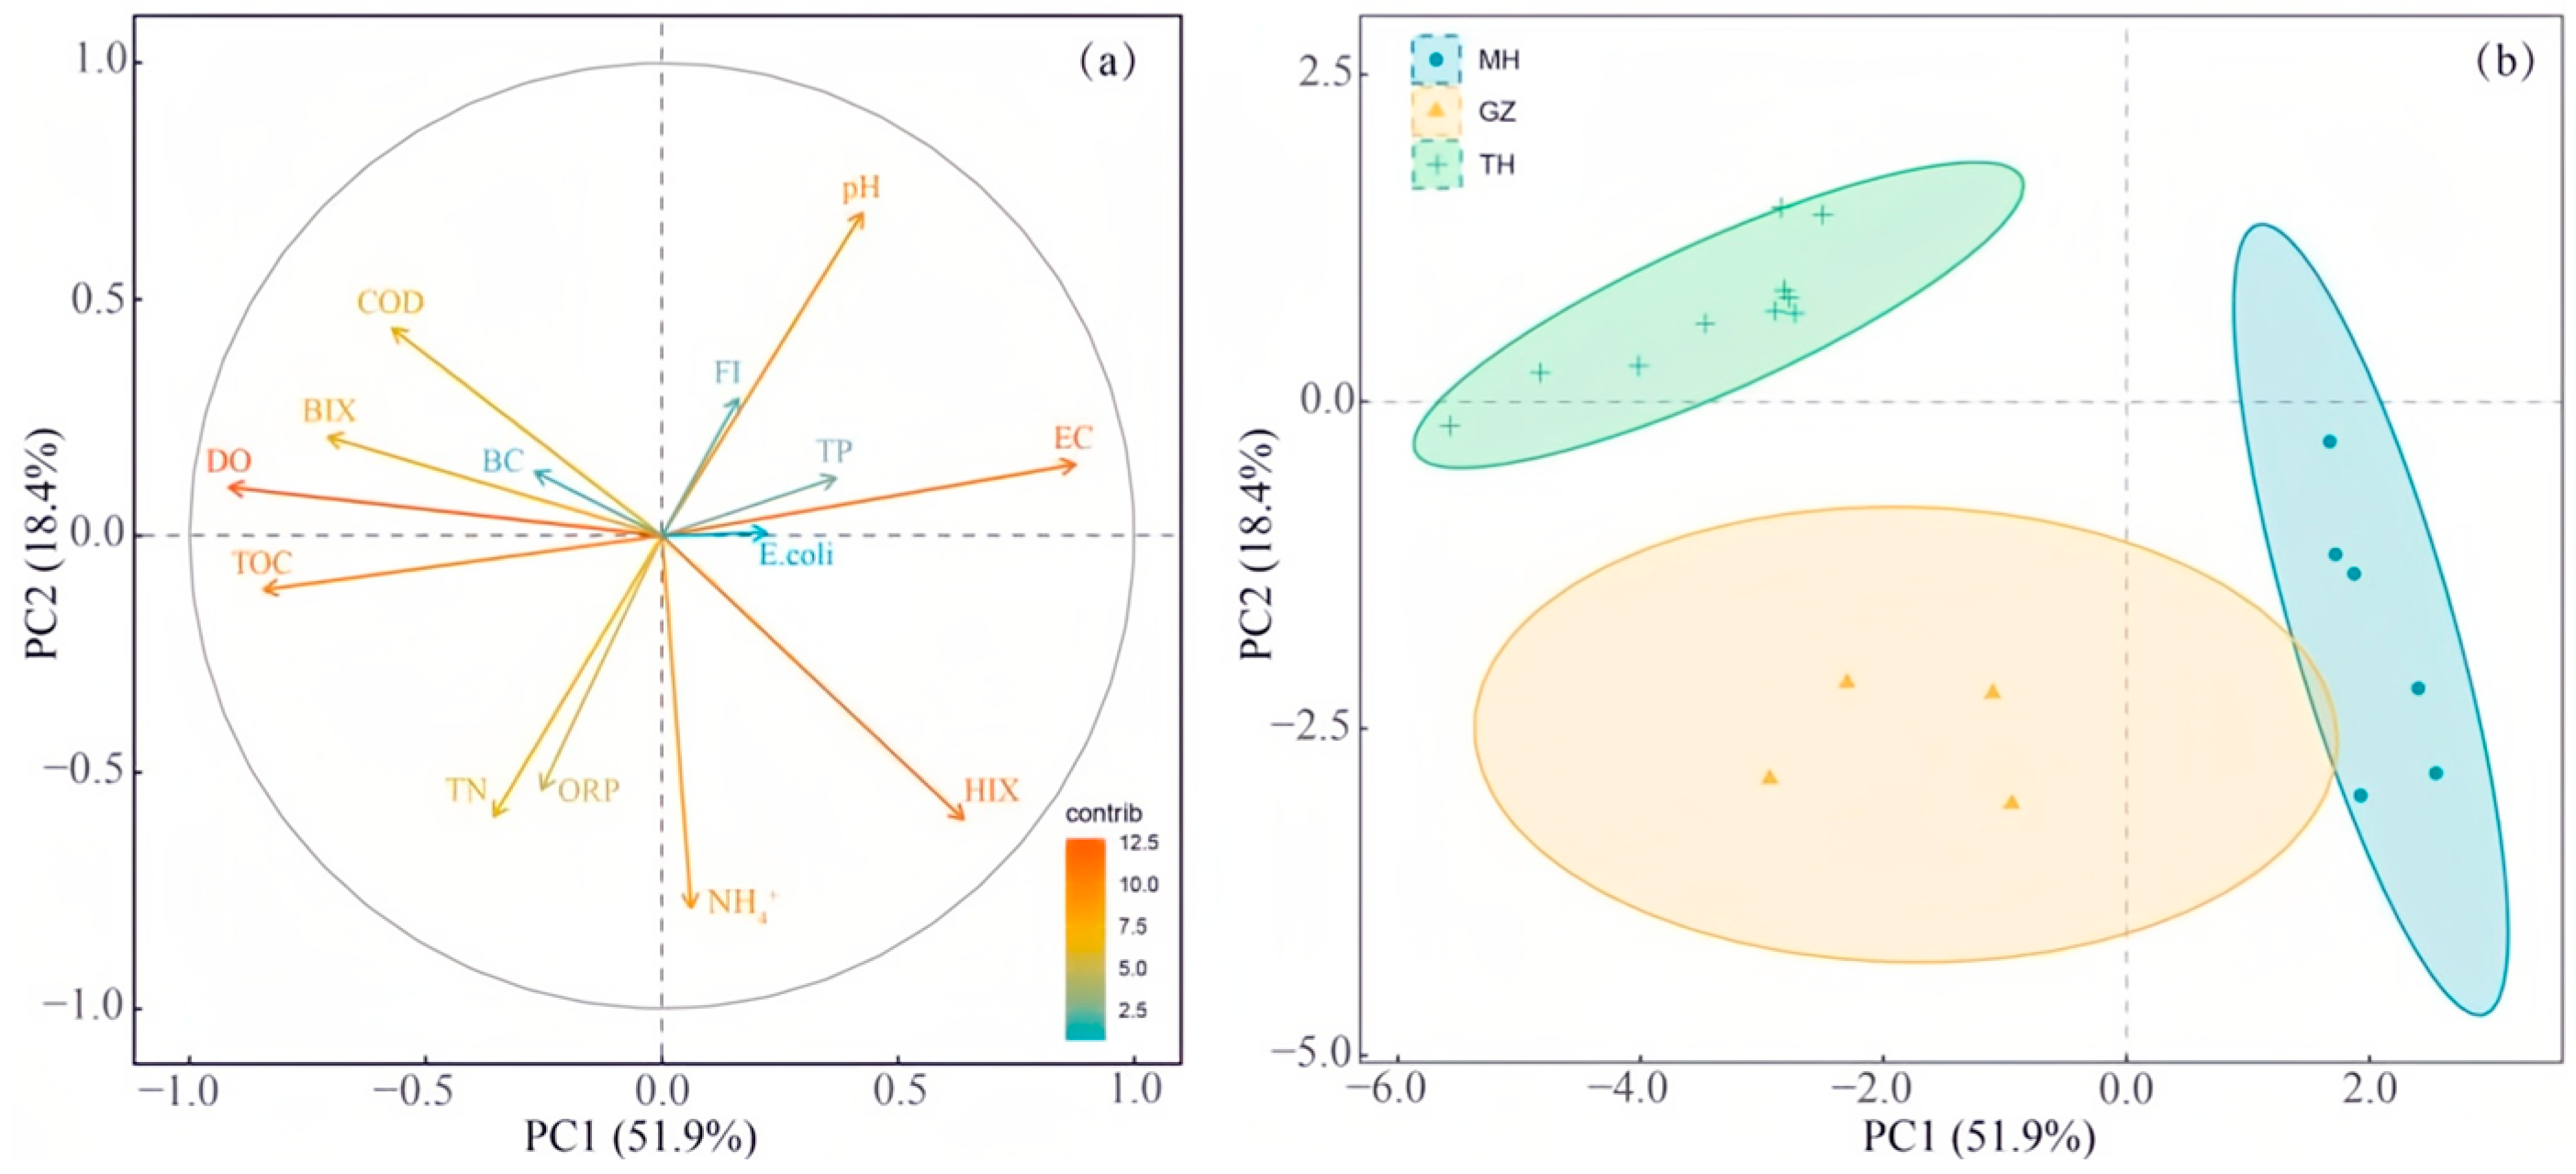
Principal component analysis (PCA) and Adonis analysis were utilized to explore the associations between spectral parameters and both urban and agricultural lakes [69]. The KMO value of the selected indicators (0.84) and the Bartlett’s sphericity test result (p < 0.001) showed that the selected indicators were suitable for analysis by PCA. As shown in Figure 7, PC1 and PC2 together accounted for 70.3% of the variation in the selected indicators, with PC1 explaining 51.9% and PC2 explaining 18.4%. The 95% confidence interval for the explanatory rate of PC1 was [47.6%, 55.8%], and the 95% confidence interval for the explanatory rate of PC2 was [15.3%, 21.2%], which indicates that the principal component extraction results possess favorable robustness.
In Figure 9a, the positive correlations of NH4+, TP, E. coli, HIX, and other indicators with PC1 (in the direction of the positive PC1 loading) were larger. This indicates that the water bodies were strongly influenced by autochthonous sources, while E. coli was positively correlated with these autochthonous sources. E. coli is capable of efficiently metabolizing a variety of carbon sources, including simple sugars, organic acids, alcohols, and several complex organic substances. The substrates released during the metabolism of autochthonous sources, such as fermentation and biodegradation processes, can be effectively utilized by E. coli, promoting its growth and reproduction. In contrast, the negative PC1 negative loading direction indicates water bodies with a high degree of humification. Total BC showed a positive correlation with humification. During humification, microorganisms utilize nutrients such as nitrogen, phosphorus, and sulfur, which are released from organic matter. An increase in the total BC implies greater microbial involvement in this cyclic process, accelerating nutrient decomposition and cycling, and potentially promoting the formation of humus. The variation explained by PC2 was relatively low and underrepresented.
As shown in Figure 9b, different lake sectors were grouped, and Adonis multivariate ANOVA [70] with 999 permutations confirmed significant separation between the two groups (p < 0.001). MH was distributed along with the negative loading direction of PC1, while TH was distributed along with the positive loading direction. This indicates that the DOM composition of MH was dominated by humic substances and contained higher levels of E. coli, whereas the DOM in TH appeared to be mainly derived from autochthonous sources and contained higher BC.

4. Conclusions

This study investigated the spatial heterogeneity of DOM characteristics and their associations with conventional microbial indicators in a human-impacted lake network in Hubei Province, China, covering three distinct sectors, which are the tourism zone (GZ), the intensive agricultural zone (TH), and the urban zone (MH). By integrating multiple analytical methods with rapid microbial activity detection, several key findings are summarized as follows:
(1) DOM characteristics significantly differed among TH, MH, and GZ. In TH, UVC fulvic acid was dominant, while protein-like substances and UVA fulvic acid prevailed in MH and GZ. Combined with the SOM model, the humic fraction (represented by neuron 1) was most prominent in TH, likely primarily derived from agricultural surface sources. TH also showed a significantly higher degree of humification and relative molecular mass compared to the other sites (p < 0.001). In MH, DOM displayed stronger autochthonous source characteristics and higher biological activity, largely originating from the surrounding densely populated urban environment. In GZ, DOM was mainly influenced by leisure and tourism activities nearby. During the flat-water period, TH, which was predominantly affected by agricultural surface runoff, exhibited mainly terrestrial source characteristics, although the humus-like fractions in its DOM still originated largely from microbial activities.
(2) Microbial indicators (total bacterial count and E. coli activity) were quantified using the Austrian ColiMinder device, allowing rapid and automated detection of microbial metabolic activity. Random forests analysis identified sector-specific key drivers: NH4+ was the primary predictor of BC in TH and GZ; TOC best predicted E. coli activity in TH; and TN was the top driver for both indicators in MH. These drivers reflect the distinct anthropogenic pressures in each sector: agricultural nutrient runoff in TH, urban domestic sewage in MH, and tourism-related inputs in GZ.
Specifically, in TH, BC was mainly influenced by NH4+, while E. coli was more affected by TOC. In MH, both BC and E. coli levels were primarily associated with TN and COD concentrations; high COD in this urban area likely promoted bacterial growth. In GZ, BC, and E. coli were mainly related to NH4+, TOC, and TN. Notably, E. coli in GZ showed relatively higher phosphorus utilization compared to the other two lakes.
(3) Correlations between DOM spectral properties and microbial activity were sector-specific. Autochthonous DOM (indicated by high BIX) strongly correlated with total BC activity, whereas humic-like DOM was linked to E. coli activity. PCA clearly separated the three sectors: TH tended to cluster with autochthonous DOM and high BC, MH with humic-like DOM and elevated E. coli activity, and GZ appeared to exhibit intermediate characteristics.
In summary, the spatial distribution results of this study may provide preliminary regulatory ideas for zone water environment management. Based on the spatial variation patterns observed in April, it is tentatively suggested to appropriately control agricultural-source ammonium nitrogen and total organic carbon inputs in agricultural areas, regulate domestic total nitrogen emissions in urban areas, and reduce nitrogen and organic matter inputs caused by tourism activities in scenic areas.

Author Contributions

Conceptualization, Z.H.; methodology, Q.L. and S.Z.; formal analysis, X.J. and S.L.; investigation, D.C. and S.Z.; writing—original draft preparation, Z.G.; writing—review and editing, Q.L. and D.L.; project administration, H.Q.; funding acquisition, Z.G., Z.H. and D.L. All authors have read and agreed to the published version of the manuscript.

Funding

This research was funded by National Key Research and Development Program of China (No.: 2022YFE0117000), CRSRI Open Research Pro-gram (Program SN: CKWV20231180/KY), the Fundamental Research Fund for Central Public Welfare Research Institutes (No. CKSF20241025/TG8 and CKSF2025533/TG8) and research fund from Mid-route Source of South-to-North Water Transfer Co., Ltd. (No. ZSY/YG-ZX(2024)045).

Data Availability Statement

The original contributions presented in this study are included in the article. Further inquiries can be directed to the corresponding authors.

Conflicts of Interest

Authors Quanhong Li, Dongdong Cui, and He Qin were employed by the company Mid-route Source of South-to-North Water Transfer Co., Ltd. Author Xincheng Jin was employed by the company Wuhan Changjiang Kechuang Technology Development Co., Ltd. The remaining authors (Zhuofan Gao, Shuli Liu, Dan Lu, Zhuo Huang, Sergio Zubelzu) declare that the research was conducted in the absence of any commercial or financial relationships that could be construed as a potential conflict of interest. The authors declare that this study received funding from Changjiang River Scientific Research Institute, Changjiang Water Resources Commission, and Mid-route Source of South-to-North Water Transfer Co., Ltd. The funder was not involved in the study design, collection, analysis, interpretation of data, the writing of this article, or the decision to submit it for publication.

References

  1. Dudgeon, D.; Arthington, A.H.; Gessner, M.O.; Kawabata, Z.I.; Knowler, D.J.; Lévêque, C.; Naiman, R.J.; Prieur-Richard, A.-H.; Soto, D.; Stiassny, M.L.J.; et al. Freshwater biodiversity: Importance, threats, status and conservation challenges. Biol. Rev. 2006, 81, 163–182. [Google Scholar] [CrossRef]
  2. Reid, A.J.; Carlson, A.K.; Creed, I.F.; Eliason, E.J.; Gell, P.A.; Johnson, P.T.; Kidd, K.A.; MacCormack, T.J.; Olden, J.D.; Ormerod, S.J.; et al. Emerging threats and persistent conservation challenges for freshwater biodiversity. Biol. Rev. 2019, 94, 849–873. [Google Scholar] [PubMed]
  3. Woelmer, W.; Gregersen, R.; Özkundakci, D. Lake trophic state indicator shows non-stationary relationships with environmental drivers. Ecol. Indic. 2025, 180, 114347. [Google Scholar] [CrossRef]
  4. Heino, J.; Alahuhta, J.; Bini, L.M.; Cai, Y.; Heiskanen, A.S.; Hellsten, S.; Kortelainen, P.; Kotamäki, N.; Tolonen, K.T.; Vihervaara, P.; et al. Lakes in the era of global change: Moving beyond single-lake thinking in maintaining biodiversity and ecosystem services. Biol. Rev. 2021, 96, 89–106. [Google Scholar]
  5. Huang, S.; Zhang, K.; Lin, Q.; Liu, J.; Shen, J. Abrupt ecological shifts of lakes during the Anthropocene. Earth-Sci. Rev. 2022, 227, 103981. [Google Scholar] [CrossRef]
  6. Ogola, H.J.O.; Odhiambo, K.A. From Waste to Water Quality: How Human Activities Are Shaping Lake Victoria’s Microbiome and Ecosystem Health. In Urban Watershed Microbiology, Volume 2: Environmental Indicators, Regional Case Studies, and Bioremediation Strategies; Springer: Berlin/Heidelberg, Germany, 2025; pp. 953–1000. [Google Scholar]
  7. Qin, B.; Zhang, Y.; Zhu, G.; Gao, G. Eutrophication control of large shallow lakes in China. Sci. Total Environ. 2023, 881, 163494. [Google Scholar] [CrossRef] [PubMed]
  8. Miao, T.; Shen, L.; Zhao, H.; Zhang, H.; Ji, Y.; Hu, Y.; Zhou, N.; Zhou, C. Multi-Level Driving Mechanisms: Cascading Relationships Among Physical Factors, Nutrient Cycling, and Biological Responses in the Yangtze River–Lake Ecosystems. Sustainability 2025, 17, 9928. [Google Scholar] [CrossRef]
  9. Song, F.; Wu, F.; Feng, W.; Liu, S.; He, J.; Li, T.; Zhang, J.; Wu, A.; Amarasiriwardena, D.; Xing, B. Depth-dependent variations of dissolved organic matter composition and humification in a plateau lake using fluorescence spectroscopy. Chemosphere 2019, 225, 507–516. [Google Scholar] [CrossRef] [PubMed]
  10. Yan, P.; Hu, Z.; Yu, H.; Li, W.; Liu, L. Fluorescence quenching effects of antibiotics on the main components of dissolved organic matter. Environ. Sci. Pollut. Res. 2016, 23, 5667–5675. [Google Scholar]
  11. Wang, Y.; Zhang, M.; Fu, J.; Li, T.; Wang, J.; Fu, Y. Insights into the interaction between carbamazepine and natural dissolved organic matter in the Yangtze Estuary using fluorescence excitation–emission matrix spectra coupled with parallel factor analysis. Environ. Sci. Pollut. Res. 2016, 23, 19887–19896. [Google Scholar] [CrossRef]
  12. Maizel, A.C.; Remucal, C.K. The effect of advanced secondary municipal wastewater treatment on the molecular composition of dissolved organic matter. Water Res. 2017, 122, 42–52. [Google Scholar] [CrossRef] [PubMed]
  13. Kamjunke, N.; von Tümpling, W.; Hertkorn, N.; Harir, M.; Schmitt-Kopplin, P.; Norf, H.; Weitere, M.; Herzsprung, P. A new approach for evaluating transformations of dissolved organic matter (DOM) via high-resolution mass spectrometry and relating it to bacterial activity. Water Res. 2017, 123, 513–523. [Google Scholar] [CrossRef] [PubMed]
  14. Rochelle-Newall, E.J.; Fisher, T.R. Chromophoric dissolved organic matter and dissolved organic carbon in Chesapeake Bay. Mar. Chem. 2002, 77, 23–41. [Google Scholar] [CrossRef]
  15. Harun, S.; Baker, A.; Bradley, C.; Pinay, G. Spatial and seasonal variations in the composition of dissolved organic matter in a tropical catchment: The Lower Kinabatangan River, Sabah, Malaysia. Environ. Sci. Process. Impacts 2016, 18, 137–150. [Google Scholar] [CrossRef] [PubMed]
  16. Meng, Y.; Jiang, X.; Li, Y.; Qing, C.; Long, X.; Xia, P. Response of dissolved organic matter and bacterial community to anthropogenic disturbances in a plateau lake. Front. Microbiol. 2025, 16, 1554202. [Google Scholar] [CrossRef] [PubMed]
  17. Pereira, V.M.G.; Gomes, R.B.; do Carmo, M.V. Correlation between Escherichia coli and limnological variables in water samples of the Lagoa da Maraponga, Fortaleza, Ceará State, Brazil. Acta Sci. Biol. Sci. 2011, 33, 145–151. [Google Scholar] [CrossRef]
  18. Farnleitner, A.H.; Ryzinska-Paier, G.; Reischer, G.H.; Burtscher, M.M.; Knetsch, S.; Kirschner, A.K.; Dirnböck, T.; Kuschnig, G.; Mach, R.L.; Sommer, R. Escherichia coli and enterococci are sensitive and reliable indicators for human, livestock and wildlife faecal pollution in alpine mountainous water resources. J. Appl. Microbiol. 2010, 109, 1599–1608. [Google Scholar] [CrossRef] [PubMed]
  19. Olmsted, C.N.; Gahler, M.; Roden, E.; Peterson, B.; Lazarcik, J.; Tran, P.Q.; Berg, M.; Bryant, D.A.; Goudeau, D.; Malmstrom, R.R. Cryptic cycling by electroactive bacterioplankton in Trout Bog Lake. Appl. Environ. Microbiol. 2025, 91, e0178924. [Google Scholar] [CrossRef] [PubMed]
  20. Yang, F.; Hou, J.; Li, Q.; Nie, L.; Yu, H.; Song, Y. Insight into Seasonal Dynamics of DOM and Analysis of Various Factors Influencing Microbial Communities from Typical Water Bodies: Based on Gray Influence Analysis and Structural Equation Modeling. ACS ES&T Water 2025, 5, 2467–2478. [Google Scholar] [CrossRef]
  21. Engel, A.; Pontiller, B.; Becker, K.W.; Amano, C.; Zhao, Z.; Herndl, G.J.; Lee, C. Microbial diagenesis of dissolved organic matter from the ocean’s surface to abyssal depths: A case study in the Humboldt upwelling system. Front. Microbiol. 2025, 16, 1677097. [Google Scholar] [CrossRef] [PubMed]
  22. Song, Y.; Cao, X.; Li, S.A.; Li, Z.; Grossart, H.P.; Ma, H. Human activities-impacted lake dissolved organic matter (DOM) affects phycosphere microbial diversity and DOM diversification via carbon metabolism. J. Environ. Manag. 2024, 367, 122011. [Google Scholar] [CrossRef]
  23. Chen, M.; Hur, J.; Gu, J.D.; Yamashita, Y. Microbial degradation of various types of dissolved organic matter in aquatic ecosystems and its influencing factors. Sci. China Earth Sci. 2023, 66, 169–189. [Google Scholar] [CrossRef]
  24. Zhang, Y.; Yin, Y.; Feng, L.; Zhu, G.; Shi, Z.; Liu, X.; Zhang, Y. Characterizing chromophoric dissolved organic matter in Lake Tianmuhu and its catchment basin using excitation-emission matrix fluorescence and parallel factor analysis. Water Res. 2011, 45, 5110–5122. [Google Scholar] [CrossRef] [PubMed]
  25. Song, F.; Wu, F.; Xing, B.; Li, T.; Feng, W.; Giesy, J.P.; Guo, W.; Wang, H.; Liu, S.; Bai, Y. Protonation-dependent heterogeneity in fluorescent binding sites in sub-fractions of fulvic acid using principle component analysis and two-dimensional correlation spectroscopy. Sci. Total Environ. 2018, 616, 1279–1287. [Google Scholar] [CrossRef] [PubMed]
  26. Derrien, M.; Yang, L.; Hur, J. Lipid biomarkers and spectroscopic indices for identifying organic matter sources in aquatic environments: A review. Water Res. 2017, 112, 58–71. [Google Scholar] [CrossRef] [PubMed]
  27. Brogi, S.R.; Ha, S.Y.; Kim, K.; Derrien, M.; Lee, Y.K.; Hur, J. Optical and molecular characterization of dissolved organic matter (DOM) in the Arctic ice core and the underlying seawater (Cambridge Bay, Canada): Implication for increased autochthonous DOM during ice melting. Sci. Total Environ. 2018, 627, 802–811. [Google Scholar] [CrossRef]
  28. Zhao, L.; Du, C.; Zhang, Q.; Sun, C.; Wang, S.; Luo, S. The ultraviolet–visible absorbance and fluorescence characterization of dissolved organic matter derived from the leaf litter of Populus simonii, Artemisia desertorum, Salix cheilophila, and Populus tomentosa. Environ. Sci. Pollut. Res. 2020, 27, 36439–36449. [Google Scholar] [CrossRef]
  29. Ishii, S.K.; Boyer, T.H. Behavior of reoccurring PARAFAC components in fluorescent dissolved organic matter in natural and engineered systems: A critical review. Environ. Sci. Technol. 2012, 46, 2006–2017. [Google Scholar] [CrossRef] [PubMed]
  30. Kohonen, T. Essentials of the self-organizing map. Neural Netw. 2013, 37, 52–65. [Google Scholar] [CrossRef] [PubMed]
  31. He, X.; Fan, Q. Investigating the effect of landfill leachates on the characteristics of dissolved organic matter in groundwater using excitation–emission matrix fluorescence spectra coupled with fluorescence regional integration and self-organizing map. Environ. Sci. Pollut. Res. 2016, 23, 21229–21237. [Google Scholar] [CrossRef]
  32. Gad, M.; Khomami, N.T.S.; Krieg, R.; Schor, J.; Philippe, A.; Lechtenfeld, O.J. Environmental drivers of dissolved organic matter composition across central European aquatic systems: A novel correlation-based machine learning and FT-ICR MS approach. Water Res. 2025, 273, 123018. [Google Scholar] [CrossRef] [PubMed]
  33. Mercado-Bettín, D.; Paíz, R.; McCarthy, V.; Jennings, E.; de Eyto, E.; Gallegos, A.M.; Dillanee, M.; Garcia, J.C.; Rodríguez, J.J.; Marcé, R. A machine learning approach to driver attribution of dissolved organic matter dynamics in two contrasting freshwater systems. EGUsphere 2025, 23, 2661–2685. [Google Scholar]
  34. Herzsprung, P.; Wentzky, V.; Kamjunke, N.; von Tumpling, W.; Wilske, C.; Friese, K.; Boehrer, B.; Reemtsma, T.; Rinke, K.; Lechtenfeld, O.J. Improved understanding of dissolved organic matter processing in freshwater using complementary experimental and machine learning approaches. Environ. Sci. Technol. 2020, 54, 13556–13565. [Google Scholar] [CrossRef] [PubMed]
  35. Ding, L.; Chen, K.; Cheng, S.; Wang, X. Water ecological carrying capacity of urban lakes in the context of rapid urbanization: A case study of East Lake in Wuhan. Phys. Chem. Earth 2015, 89, 104–113. [Google Scholar] [CrossRef]
  36. Chen, K.; Liu, X.; Chen, X.; Guo, Y.; Dong, Y. Spatial characteristics and driving forces of the morphological evolution of East Lake, Wuhan. J. Geog. Sci. 2020, 30, 583–600. [Google Scholar] [CrossRef]
  37. Koschelnik, J.; Vogl, W.; Epp, M.; Lackner, M. Rapid analysis of β-D-glucuronidase activity in water using fully automated technology. WIT Trans. Ecol. Environ. 2015, 196, 471–481. [Google Scholar] [CrossRef]
  38. HJ 636-2012; Water Quality-Determination of Total Nitrogen-Alkaline Potassium Persulfate Digestion UV Spectrophotometric Method. China Environmental Science Press: Beijing, China, 2012.
  39. GB 11893-89; Water Quality-Determination of Total Phosphorus-Ammonium Molybdate Spectrophotometric Method. China Standard Press: Beijing, China, 1989.
  40. HJ 535-2009; Ministry of Environmental Protection of China. Water Quality-Determination of Ammonia Nitrogen-Nessler’s Reagent Spectrophotometry. China Environmental Science Press: Beijing, China, 2009.
  41. HJ 828-2017; Water Quality-Determination of Chemical Oxygen Demand-Dichromate Method. China Environmental Science Press: Beijing, China, 2017.
  42. Yu, X.; Cui, Y.; Chen, H.; Zhu, J.; Li, Y.; Guo, Y.; Zhou, Y.; Han, L. Sources and optical dynamics of chromophoric dissolved organic matter in different types of urban water bodies. Environ. Sci. 2021, 42, 3719–3729. [Google Scholar] [CrossRef]
  43. Zhang, Z.; Zhou, S.; Chen, Z.; Zhang, T.; Dong, W.; Zhen, Y.; Zhang, X.; Yao, B.; Cui, J. Spatial Distribution Characteristics of the Spectrum, Source Analysis, and Nitrogen Response of Dissolved Organic Matter in Summer Rainfall in the Hebei Province. Environ. Sci. 2021, 42, 5250–5263. [Google Scholar] [CrossRef]
  44. Liu, Y.Y.; Qin, J.H.; Liu, C.; Sun, H.; Tang, X.Y.; Fan, S.Y. Characteristics of chromophoric dissolved organic matter (CDOM) in rivers of western Sichuan Plateau based on EEM-PARAFAC analysis. Environ. Sci. 2018, 39, 720–728. [Google Scholar]
  45. Breiman, L. Random forests. Mach. Learn. 2001, 45, 5–32. [Google Scholar] [CrossRef]
  46. Sadorsky, P. A random forests approach to predicting clean energy stock prices. J. Risk Financ. Manag. 2021, 14, 48. [Google Scholar] [CrossRef]
  47. Wang, L.; Wu, P.; Wang, Q. Comparative Analysis of Parameter Optimization Algorithms in Random Forest Models. J. Shenyang Norm. Univ. (Nat. Sci. Ed.) 2024, 42, 420–426. [Google Scholar]
  48. Bieroza, M.; Baker, A.; Bridgeman, J. Exploratory analysis of excitation-emission matrix fluorescence spectra with self-organizing maps as a basis for determination of organic matter removal efficiency at water treatment works. J. Geophys. Res. Biogeosci. 2009, 114, G00F07. [Google Scholar] [CrossRef]
  49. Chen, X.; Gao, L. Spectral characteristics change in dissolved organic matter in urban river under the influences of different intensities of non-point source pollution. Environ. Sci. 2022, 43, 3149–3159. [Google Scholar] [CrossRef]
  50. Chen, J.; He, Z.; Dang, L.; Wang, M.; Shi, X.; Wang, L.; Ding, R.; Tian, D. Characterization of dissolved organic matter in the surface water of the Yinchuan Wetlands using spectroscopic analysis. Environ. Chem. 2021, 40, 2524–2534. [Google Scholar] [CrossRef]
  51. Zhu, G.; Wu, X.; Ge, J.; Liu, F.; Zhao, W.; Wu, C. Influence of mining activities on groundwater hydrochemistry and heavy metal migration using a self-organizing map (SOM). J. Clean. Prod. 2020, 257, 120664. [Google Scholar] [CrossRef]
  52. Liu, Z.; Feng, S.; Zhangsong, A.; Han, Y.; Cao, R. Long-term evolution of groundwater hydrochemistry and its influencing factors based on self-organizing map (SOM). Ecol. Indic. 2023, 154, 110697. [Google Scholar] [CrossRef]
  53. Vesanto, J.; Alhoniemi, E. Clustering of the self-organizing map. IEEE Trans. Neural Netw. 2000, 11, 586–600. [Google Scholar] [CrossRef] [PubMed]
  54. Wei, J. Research on Water Quality and Health Risk Assessment of Shallow Groundwater in Yinchuan Basin. Master’s Thesis, Jilin University, Changchun, China, 2025. [Google Scholar]
  55. Li, N. Water Quality Evaluation in Urban Water Distribution Network Based on SOM Algorithm. Master’s Thesis, Harbin Institute of Technology, Harbin, China, 2008. [Google Scholar]
  56. Li, K.W.; Lu, H.L.; Nkoh, J.N.; Hong, Z.N.; Xu, R.K. Aluminum mobilization as influenced by soil organic matter during soil and mineral acidification: A constant pH study. Geoderma 2022, 418, 115853. [Google Scholar] [CrossRef]
  57. Kajan, K.; Osterholz, H.; Stegen, J.; Udovič, M.G.; Orlić, S. Mechanisms shaping dissolved organic matter and microbial community in lake ecosystems. Water Res. 2023, 245, 120653. [Google Scholar] [CrossRef] [PubMed]
  58. de Sousa, D.N.R.; Mozeto, A.A.; Carneiro, R.L.; Fadini, P.S. Electrical conductivity and emerging contaminant as markers of surface freshwater contamination by wastewater. Sci. Total Environ. 2014, 484, 19–26. [Google Scholar] [CrossRef] [PubMed]
  59. Xu, J.; Mo, Y.; Jiang, Q.; Kong, L.; Wu, J.; Ding, Z.; Jin, G.; Li, L. Rainfall-dependent influence of water parameter interactions and land use on lake water quality: A hybrid ensemble approach and management implications. J. Hydrol. 2025, 662, 134019. [Google Scholar] [CrossRef]
  60. McKnight, D.M.; Boyer, E.W.; Westerhoff, P.K.; Doran, P.T.; Kulbe, T.; Andersen, D.T. Spectrofluorometric characterization of dissolved organic matter for indication of precursor organic material and aromaticity. Limnol. Oceanogr. 2001, 46, 38–48. [Google Scholar] [CrossRef]
  61. Birdwell, J.E.; Engel, A.S. Characterization of dissolved organic matter in cave and spring waters using UV–Vis absorbance and fluorescence spectroscopy. Org. Geochem. 2010, 41, 270–280. [Google Scholar] [CrossRef]
  62. Zito, P.; Podgorski, D.C.; Johnson, J.; Chen, H.; Rodgers, R.P.; Guillemette, F.; Kellerman, A.M.; Spencer, R.G.; Tarr, M.A. Molecular-level composition and acute toxicity of photosolubilized petrogenic carbon. Environ. Sci. Technol. 2019, 53, 8235–8243. [Google Scholar] [CrossRef] [PubMed]
  63. Cabrera, J.M.; Garcia, P.E.; Pedrozo, F.L.; Queimaliños, C.P. Dynamics of the dissolved organic matter in a stream-lake system within an extremely acid to neutral pH range: Agrio-Caviahue watershed. Spectrochim. Acta Part A 2020, 235, 118278. [Google Scholar] [CrossRef]
  64. Kim, J.; Kim, T.; Park, S.R.; Lee, H.J.; Kim, J.K. Factors controlling the distributions of dissolved organic matter in the East China Sea during summer. Sci. Rep. 2020, 10, 11854. [Google Scholar] [CrossRef] [PubMed]
  65. Yan, C.; Sheng, Y.; Ju, M.; Ding, C.; Li, Q.; Luo, Z.; Ding, M.; Nie, M. Relationship between the characterization of natural colloids and metal elements in surface waters. Environ. Sci. Pollut. Res. 2020, 27, 31872–31883. [Google Scholar] [CrossRef]
  66. Li, M.; Song, Y.; Zhang, X.; Huang, H. Removal Behavior of Protein-like Dissolved Organic Matter During Different Water Treatment Processes in Full-Scale Drinking Water Treatment Plants. Environ. Sci. 2021, 42, 3348–3357. [Google Scholar]
  67. Zhang, Y.; van Dijk, M.A.; Liu, M.; Zhu, G.; Qin, B. The contribution of phytoplankton degradation to chromophoric dissolved organic matter (CDOM) in eutrophic shallow lakes: Field and experimental evidence. Water Res. 2009, 43, 4685–4697. [Google Scholar] [CrossRef] [PubMed]
  68. Rochelle-Newall, E.; Fisher, T. Production of chromophoric dissolved organic matter fluorescence in marine and estuarine environments: An investigation into the role of phytoplankton. Mar. Chem. 2002, 77, 7–21. [Google Scholar] [CrossRef]
  69. Zhou, S.; Sun, Y.; Yuan, S.; Peng, R.; Liu, S.; Yue, G.; Zhang, H.; Wang, Z.; Li, Z.; Luo, X. Temporal and spatial distribution characteristics and difference analysis of chromophoric dissolved organic matter in sediment interstitial water from Gangnan reservoir. Environ. Sci. 2020, 41, 2635–2645. [Google Scholar]
  70. Anderson, M.J. A new method for non-parametric multivariate analysis of variance. Austral. Ecol. 2001, 26, 32–46. [Google Scholar] [CrossRef]
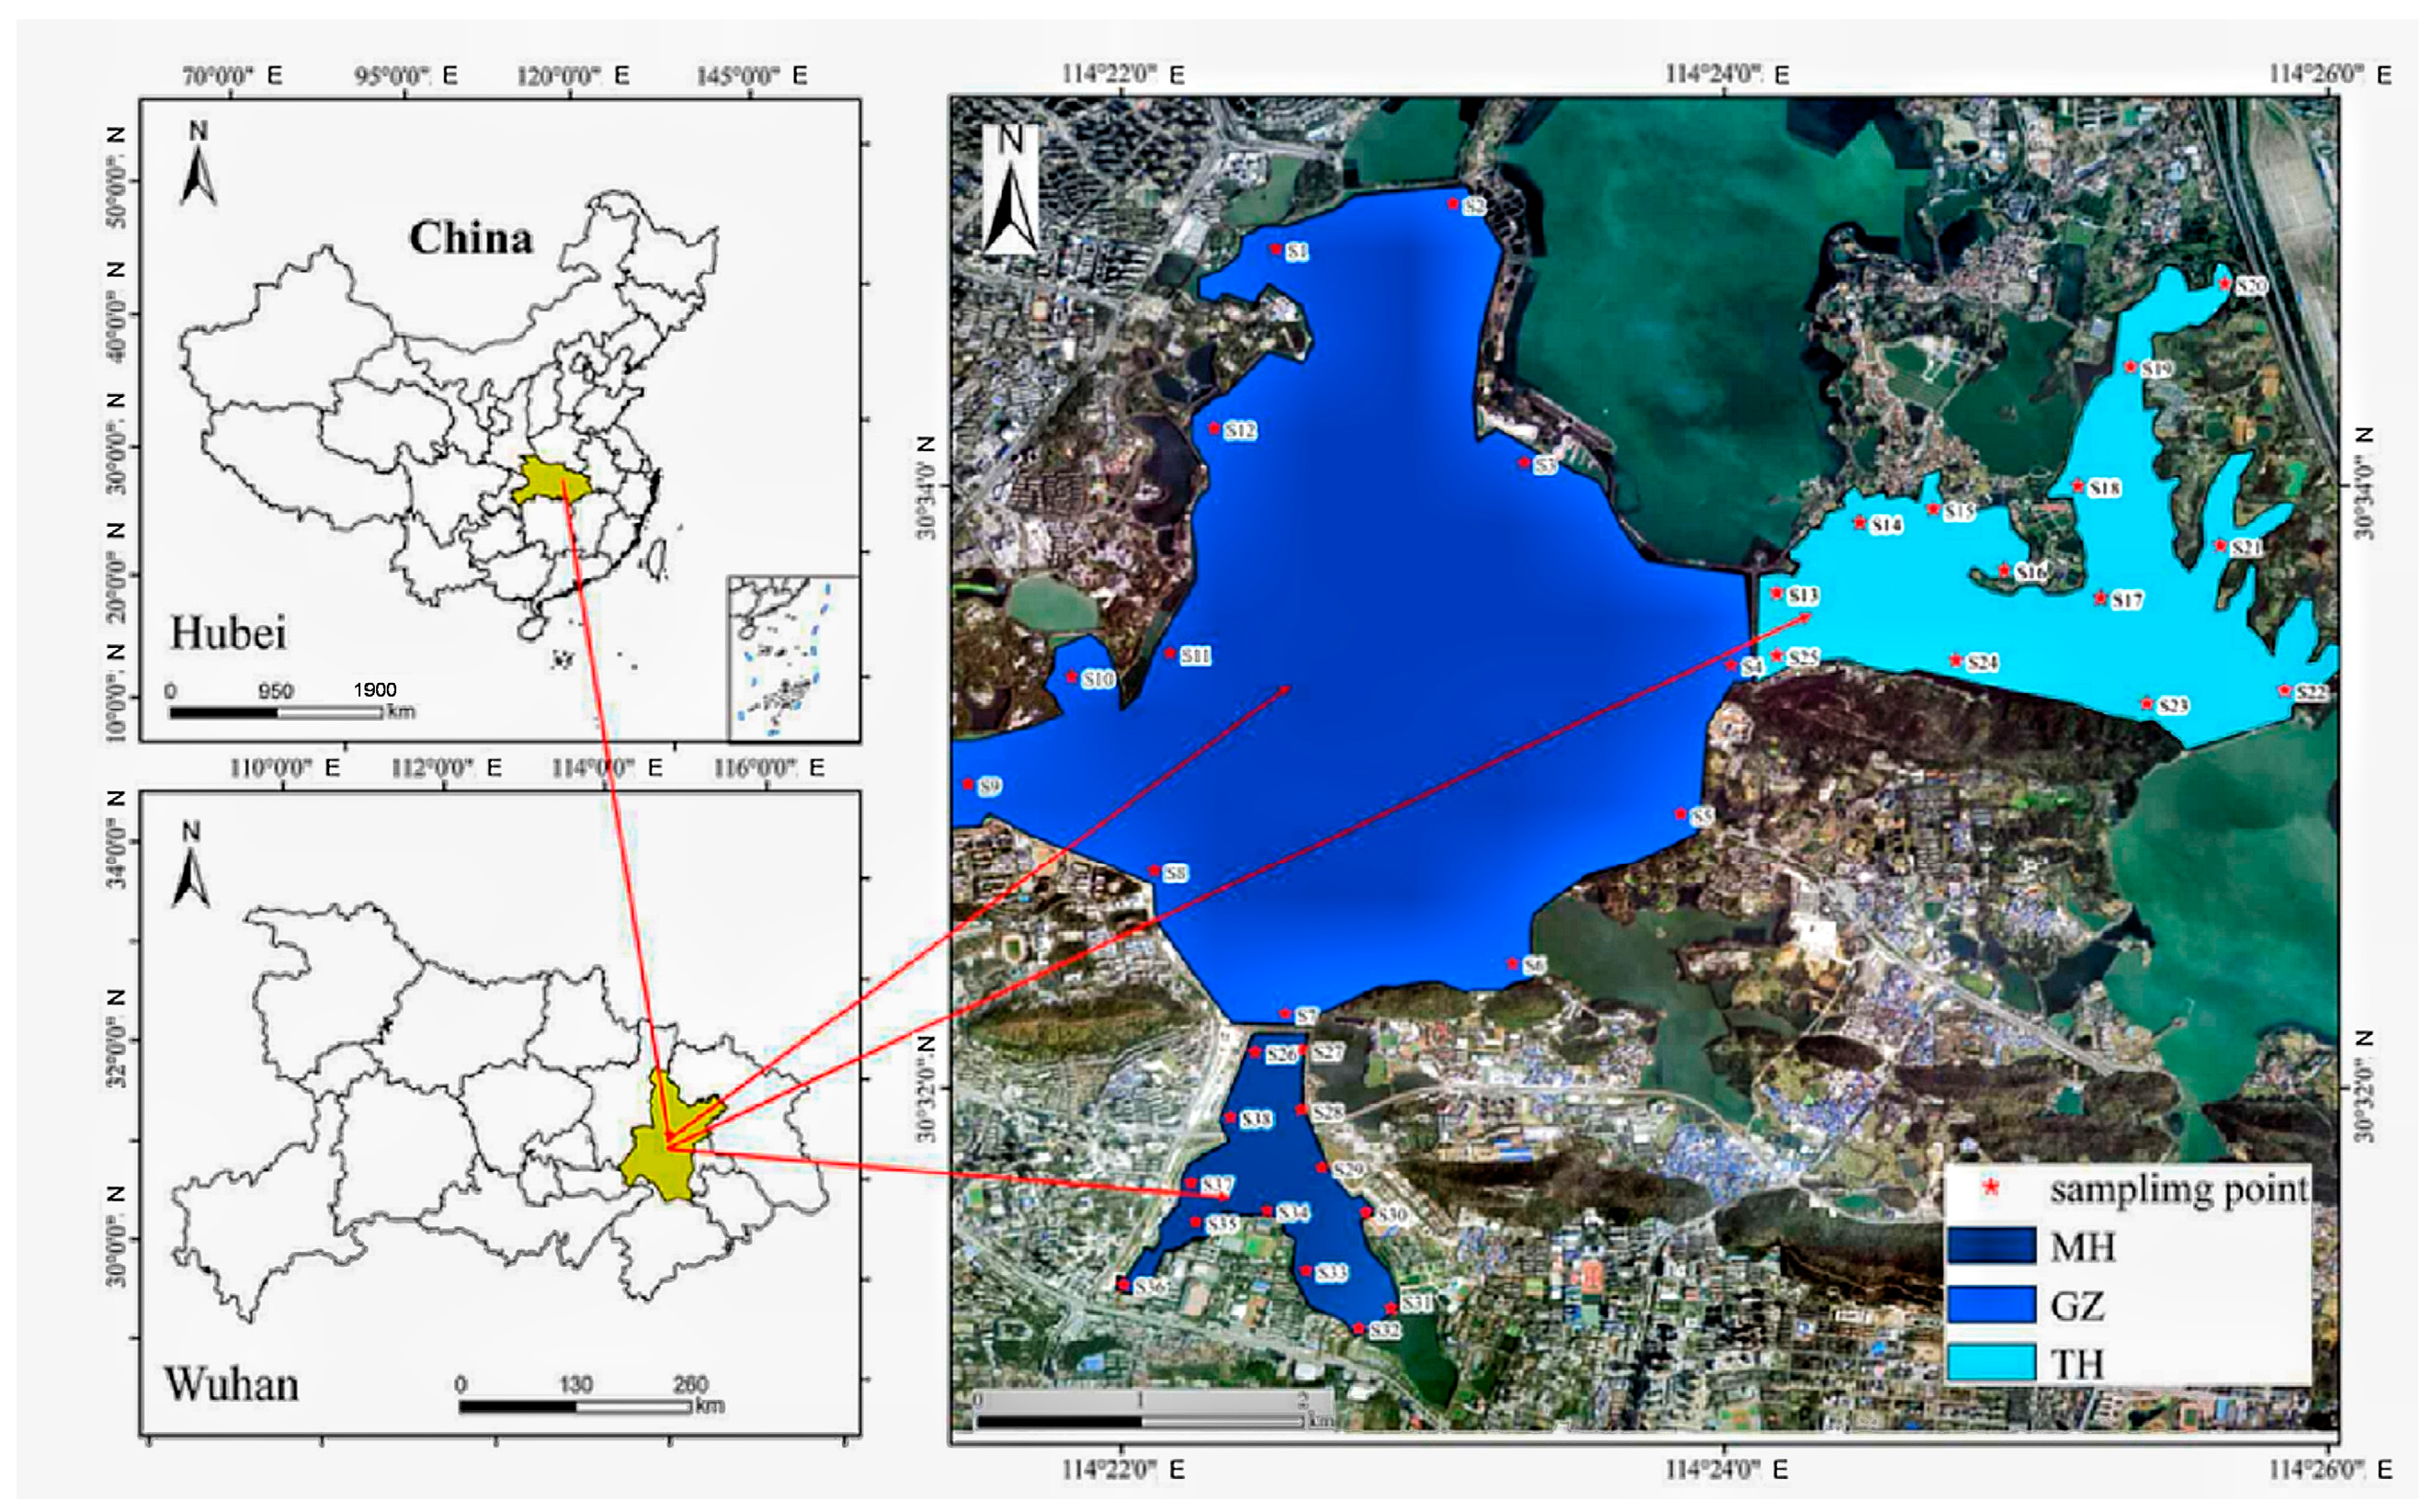
Figure 1. Distribution of sampling points in different water bodies within the typical lake network.
Water 18 01675 g001
Figure 2. Fluorescence parameter values (FI, BIX, and HIX) for three lake sectors located in a typical human-impacted lake network (Note: Asterisks denote statistically significant differences between samples for a given parameter: “*” indicates non-significant difference, p < 0.05, t-test; “**” indicates significant difference, p < 0.001, t-test).
Water 18 01675 g002
Figure 3. Davies–Bouldin index (DBI) values.
Water 18 01675 g003
Figure 4. The self-organizing map for all water samples from three lake sectors located in a typical human-impacted lake network.
Water 18 01675 g004
Figure 5. Histogram of SOM neuron hits in samples from three lake sectors located in a typical human-impacted lake network (Color-coded: blue for TH, green for MH, red for GZ).
Water 18 01675 g005
Figure 6. SOM-based visualization diagram of four representative EEM neurons.
Water 18 01675 g006
Figure 7. Three-dimensional fluorescence spectra information (in Raman Units, R.U.) provided in (a) neuron 1; (b) neuron 7; (c) neuron 9; and (d) neuron 30.
Water 18 01675 g007
Figure 8. Random forests analysis of total bacterial content (BC) and E. coli content in the three tested sectors within the lake network (p < 0.05). The asterisk (*) denotes a significant association at the p < 0.05 level based on random forest analysis.
Water 18 01675 g008
Figure 9. Distribution of PCA spectral parameters between PC1 and PC2 for the three tested lake sectors. (a) PCA parameters; (b) Scatter plot of samples by lake sector.
Water 18 01675 g009
Table 1. Water quality parameters and the experimental methods applied.
ParameterExperimental Method
TNAlkaline potassium persulfate digestion UV spectrophotometry) [38]
TPAmmonium molybdate spectrophotometry [39]
NH4+Nessler’s reagent spectrophotometry [40]
CODDichromate analysis with standard COD digestion apparatus (K-100) [41]
Table 2. Water physicochemical parameters at sampling sites from three lake sectors located in a typical human-impacted lake network.
Lake SectorpHDOORPEC
GZ8.09 ± 0.07 a8.23 ± 0.11 a398.65 ± 22.56 a297.75 ± 16.77 a
TH8.72 ± 0.12 b6.07 ± 0.23 b376.69 ± 17.23 b356.46 ± 25.46 b
MH8.08 ± 0.05 a5.13 ± 0.02 b396.23 ± 18.91 a356.69 ± 23.28 b
Note: Different lowercase letters indicate significant differences between groups for the same parameter (p < 0.05). Data expressed as mean values ± standard deviation (SD).
Table 3. Water pollution and nutrient Indicators at sampling sites from three lake sectors located in a typical human-impacted lake network.
Lake SectorCODTOCTNTPNH4+
GZ12.00 ± 1.05 a3.94 ± 0.06 a0.74 ± 0.12 a0.08 ± 0.02 a0.38 ± 0.08 a
TH30.33 ± 0.77 b5.48 ± 0.15 b0.78 ± 0.16 a0.07 ± 0.01 a0.14 ± 0.03 b
MH18.00 ± 0.56 a3.85 ± 0.08 a0.53 ± 0.05 b0.07 ± 0.01 a0.09 ± 0.05 b
Note: Different lowercase letters indicate significant differences between groups for the same parameter (p < 0.05). Data are expressed as mean values ± standard deviation (SD).
Disclaimer/Publisher’s Note: The statements, opinions and data contained in all publications are solely those of the individual author(s) and contributor(s) and not of MDPI and/or the editor(s). MDPI and/or the editor(s) disclaim responsibility for any injury to people or property resulting from any ideas, methods, instructions or products referred to in the content.