Article

Drivers of Runoff–Sediment Load Nexus Evolution in the Liujiaxia–Heishanxia Reach of the Upper Yellow River: Natural Variability Versus Anthropogenic Interventions


1
Baiyin City Water Resource Bureau of Gansu Province, Baiyin 730900, China
2
State Key Laboratory of Ecological Safety and Sustainable Development in Arid Lands, Northwest Institute of Eco-Environment and Resources, Chinese Academy of Sciences, Lanzhou 730000, China
3
University of Chinese Academy of Sciences, Beijing 100083, China
4
Institute of Ecological Environment and Industry-Education Integration for the Yellow River Basin, Lanzhou Resources & Environment Voc-Tech University, Lanzhou 730021, China
5
Baiyin District Water Resource Bureau of Gansu Province, Baiyin 730900, China
*
Authors to whom correspondence should be addressed.
These authors contributed equally to this work.
Water 2026, 18(12), 1490; https://doi.org/10.3390/w18121490
Submission received: 7 May 2026 / Revised: 9 June 2026 / Accepted: 13 June 2026 / Published: 17 June 2026
(This article belongs to the Section Water Erosion and Sediment Transport)

Abstract

The Liujiaxia–Heishanxia reach is critical for water and sediment regulation in the upper Yellow River, where changes in runoff–sediment relationships greatly affect downstream channel stability and flood safety. Climate change and intensive human activities have substantially altered local hydrological regimes in recent decades. Using long-term hydrological records from five stations during 1956–2020, this study applied the Mann–Kendall test, moving t-test, wavelet analysis and XGBoost algorithms to analyze the trends, abrupt changes and periodic features of runoff and sediment load, and quantify the contributions of natural and human drivers. The results show that both runoff and sediment load decreased significantly, with a sharper decline in sediment load. Major abrupt changes occurred in 1969, 1986, 1996 and 2008, and both variables presented a dominant 40-year interdecadal cycle. Human-induced landscape changes became the leading factor driving hydrological variations after 1996. Our findings suggest that future watershed management should combine landscape optimization and climate adaptation to maintain stable runoff-sediment conditions. This work provides scientific references for water resource management and the construction of the Heishanxia Water Conservancy Project.

1. Introduction

Runoff and sediment represent critical forms of material and energy flux within terrestrial surface systems. Their governing factors are multifaceted and mutually intertwined, resulting in a high degree of complexity [1]. In recent decades, driven by climate change and intensive anthropogenic activities, the runoff and sediment regimes of major rivers worldwide have undergone pronounced alterations [2,3]. Existing research indicates that 24% of the world’s large rivers have experienced significant shifts in runoff magnitude, while 40% have seen substantial changes in sediment flux. Notable global trends include reduced water and sediment loads in major Asian rivers and elevated suspended sediment concentrations in the Amazon River [4]. Rivers exhibiting dramatic changes in sediment transport are predominantly concentrated in developing countries. For example, the sediment load of major Chinese rivers has declined sharply, with the annual average sediment flux into the Pacific Ocean plummeting from 1.92 Gt during 1954–1968 to 0.352 Gt during 2014–2024 [5,6]. Thus, further investigation into the long-term variations in the runoff–sediment load relationship and its driving forces can provide a critical scientific foundation for watershed water resource planning, utilization, management, and operation, as well as for soil and water conservation and aquatic environment governance.
The evolutionary dynamics of runoff–sediment load relationships in large rivers and their underlying drivers have garnered widespread attention in the international academic community, yielding a series of significant findings. Studies have demonstrated that while runoff in the Amazon River remains relatively stable, its suspended sediment concentration has increased significantly, a trend attributed to exacerbated soil erosion induced by basin-scale land use changes [7,8]. Over the past 50 years, global sea-level rise, land subsidence, and drastic shifts in sediment dynamics have disrupted the hydraulic functioning of the lower Mississippi River, triggering deltaic wetland degradation and intensified coastal erosion [9,10]. Large-scale hydropower development on the Mekong River’s mainstream and tributaries has caused a dramatic decline in its sediment flux, posing severe threats to the sustainability of its downstream delta [11]. The Ganges–Brahmaputra system, subjected to the combined and complex impacts of climate change and intensive human activities, exhibits even more intricate variations in its runoff–sediment load processes [12,13]. Furthermore, a growing body of research identifies reservoir and dam construction and operation as the primary anthropogenic factor trapping sediment and altering natural runoff–sediment load dynamics [14,15,16]. In addition, basin-scale vegetation restoration and land use transitions further reshape fluvial runoff–sediment load relationships by modifying surface runoff generation and sediment yield mechanisms [17,18,19]. However, when analyzing driving mechanisms, existing studies often focus on single dominant factors or bivariate response relationships between climate and hydrological variables. Few studies have integrated a comprehensive set of factors—including climate, topography, landscape pattern spatial configuration, and socioeconomic activities—into a unified analytical framework. The lack of this holistic perspective limits in-depth understanding and systematic attribution of the intrinsic mechanisms governing runoff–sediment load changes in complex environmental settings.
The Yellow River, China’s second-largest river, is also renowned as the river with the world’s highest sediment load and concentration [20,21]. Although its runoff accounts for a mere 2% of China’s total water resources, the river irrigates 13% of the nation’s farmland and sustains 12% of its population [22]. However, affected by natural and anthropogenic factors, the runoff and sediment transport processes in this basin have undergone significant changes [23,24]. Studies indicate that the river’s annual sediment load and runoff have exhibited decreasing trends over the past century: compared with the baseline period of 1919–1959, the average water discharge and sediment load during 2000–2018 decreased by approximately 45% and 85%, respectively [25,26]. In the Yellow River source region, climate change dominates runoff variations during the flood season, whereas underlying surface conditions exert primary control during the non-flood season [27]. Preliminary assessments of the historical patterns, future evolution, and attribution of water and sediment yields in the Yellow River’s northeastern Tibetan Plateau reach suggest that climate factors exert a greater influence on the spatial variability of runoff and sediment than underlying surface factors [28]. Taking the Ningxia reach as a case study, Miao et al. (2022) investigated the evolutionary patterns and spatial sources of water and sediment discharge over the past 70 years (1951–2020), revealing a consistent decreasing trend in both variables [29]. Nevertheless, most existing studies focus solely on runoff or sediment change trends at individual spatial or temporal scales, and on quantifying the contributions of climate change and human activities to hydrological and sedimentary alterations in the Yellow River’s middle and lower reaches [30,31,32]. Quantitative research on the evolutionary characteristics of runoff and sediment load in the Liujiaxia–Heishanxia (LJX–HSX) reach and the multifactor contributions to their changes remains insufficient. To address this gap, this study identifies historical abrupt change points and periodic patterns of runoff–sediment dynamics in the LJX–HSX reach using the Mann–Kendall trend test, sequential cluster analysis, and wavelet analysis, and identifies the relative importance of natural and anthropogenic factors across different spatial units based on the Mantel test and XGBoost model. These findings are expected to enhance understanding of runoff-sediment variation mechanisms and provide a scientific basis for targeted ecological restoration and evidence-based compensation strategies in the LJX–HSX reach.
The LJX–HSX reach is characterized by a topographic gradient of higher elevations in the west and south, and lower elevations in the east and north, with an alternating distribution of gorges and alluvial plains typical of the upper Yellow River. As a critical corridor connecting the river’s upstream and downstream segments, this reach serves as a core hub regulating the evolution of the Yellow River’s runoff–sediment load processes. Changes in its hydrological and sedimentary dynamics directly impact water resource management strategies for the entire basin. The Liujiaxia Reservoir operates as a key regulation infrastructure in the upper Yellow River, while the Heishanxia Reservoir is a planned pivotal control node. Fed by inflows from the upstream Tibetan Plateau, the LJX–HSX reach’s output water and sediment volume, regimes, and characteristics directly govern the erosion–deposition evolution of the downstream Ningxia–Inner Mongolia reach. Therefore, accurately investigating the patterns of runoff and sediment load changes in the LJX–HSX reach, and revealing the impacts of natural and anthropogenic factors on these variations, constitutes a scientific prerequisite for further understanding the mechanisms governing runoff–sediment evolution in this reach and identifying key influencing factors. It can also provide a fundamental reference for the regulation of runoff and sediment in the downstream Ningxia–Inner Mongolia reach.
In this study, we pursue three core objectives: (1) to reveal the spatiotemporal evolution characteristics of runoff and sediment load and their long-term trends; (2) to detect historical abrupt change points and dominant periodic oscillations in the runoff–sediment dynamics; (3) to assess the relative importance of natural versus anthropogenic factors in explaining the observed variations. These analyses were implemented using linear regression, the coefficient of variation, the Mann–Kendall trend test, sequential cluster analysis, wavelet analysis, the Pettitt test, and Extreme Gradient Boosting (XGBoost) models. The findings of this study are expected to enhance understanding of runoff–sediment load variation patterns and their underlying mechanisms, providing a scientific basis for targeted ecological restoration and evidence-based compensation strategies specifically in the LJX–HSX reach. XGBoost.

2. Materials and Methods

2.1. Study Area

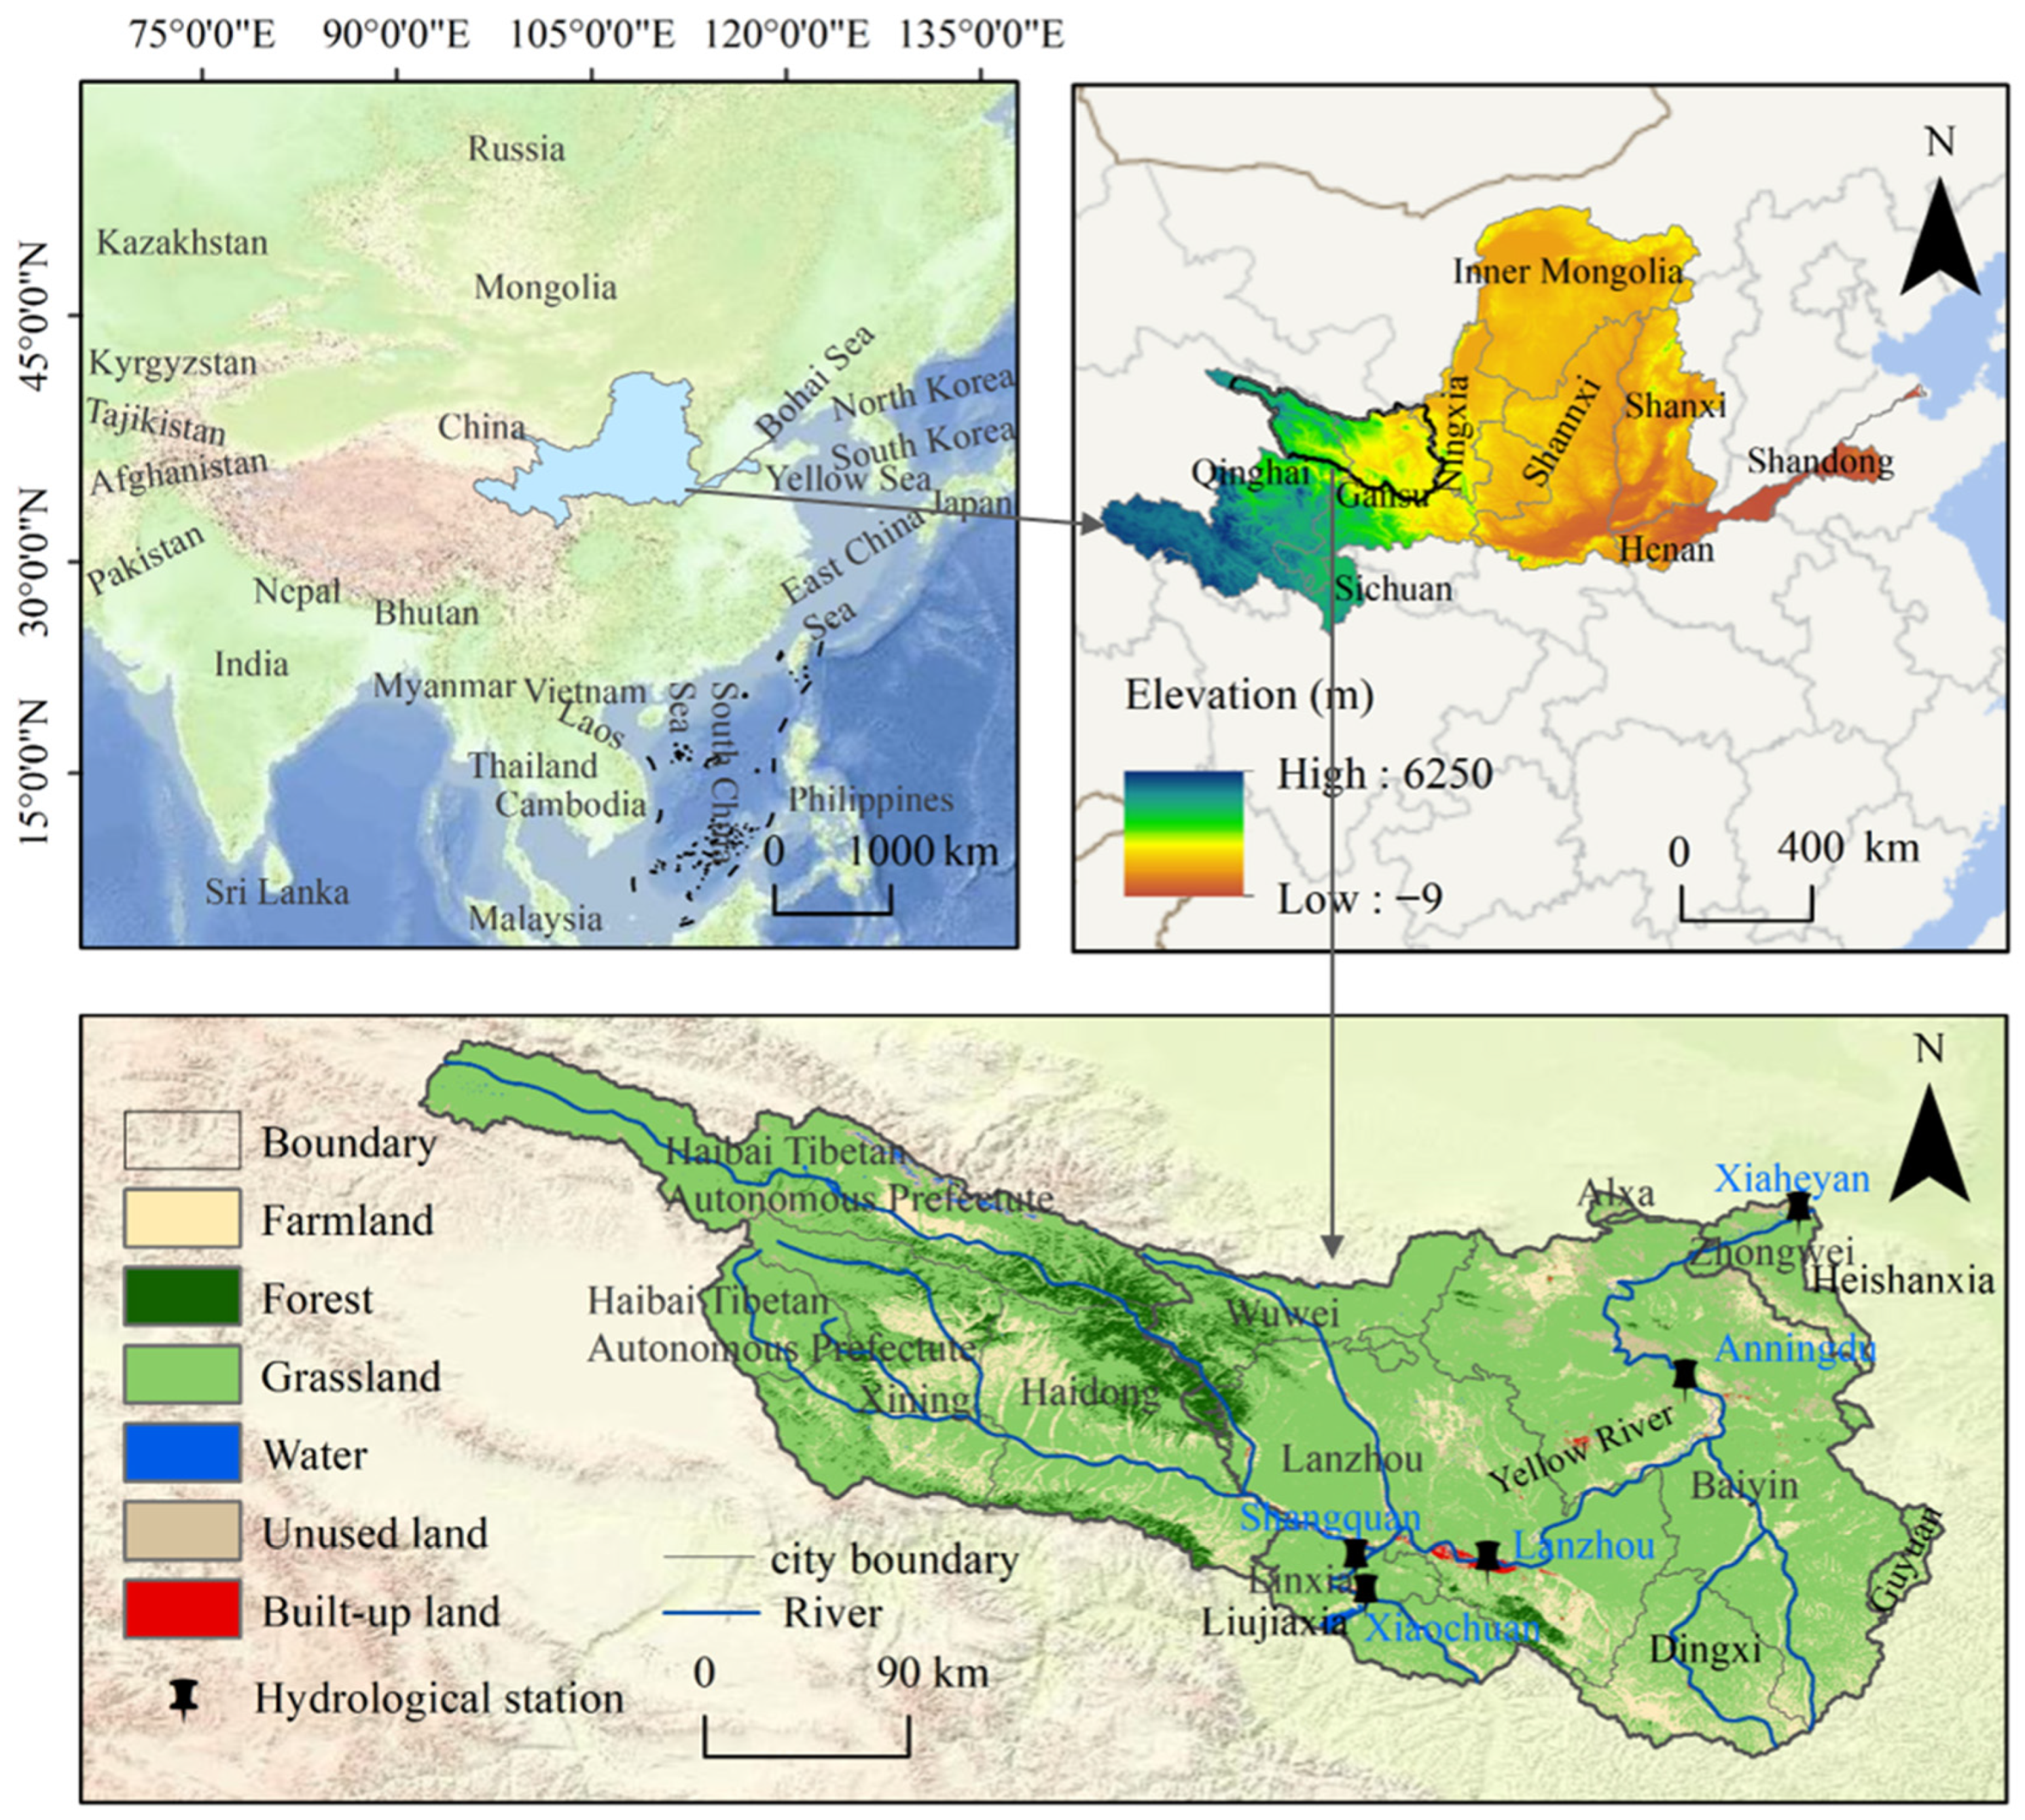
The LJX–HSX reach, spanning the border of Gansu and Ningxia provinces, is designated in planning as the last canyon segment in the upper Yellow River suitable for constructing a high-dam, large-reservoir project (Figure 1). Geographically situated at the boundary of China’s first and second topographic steps, this reach is characterized by low sediment content and distinct advantages for high-altitude water supply. It plays a strategic role in the integrated regulation of water, sediment, and hydropower in the Yellow River Basin, acting as a pivotal link that bridges upstream and downstream management, enhances ecological and socioeconomic benefits, and mitigates natural hazards. As such, it represents a critical asset for realizing optimal temporal and spatial allocation of Yellow River water resources.
The Heishanxia Water Conservancy Project (HWCP), one of seven core control projects planned for the mainstream of the Yellow River, is primarily designed for water–sediment regulation and is expected to significantly influence runoff and sediment dynamics in the LJX–HSX reach upon completion. The study area is dominated by a temperate continental climate, featuring low precipitation, high evaporation, and a large diurnal temperature range. Mean annual precipitation ranges from 200 to 400 mm, predominantly derived from summer monsoon rainfall events that are prone to triggering rainstorms, thereby elevating river flood peaks and sediment concentrations. In winter, influenced by cold air masses from Siberia, precipitation occurs mainly as snow, though snowfall amounts are relatively limited. Precipitation exhibits substantial interannual variability, with marked discrepancies between wet and dry years; this variability may amplify fluctuations in river runoff volumes.
As the core hub governing the evolution of runoff–sediment load processes in the Yellow River, the LJX–HSX reach holds immense hydrological significance. The Liujiaxia Reservoir operates as a key regulation and storage facility in the upper Yellow River, while the Heishanxia Gorge is slated to become a critical control node via future construction. Fed by inflows originating from the upstream Qinghai–Tibet Plateau, the water and sediment discharge, regimes, and characteristics of this reach directly dictate the erosion and deposition dynamics of the downstream Ningxia–Inner Mongolia segment. In recent years, an imbalanced runoff–sediment load relationship in the Ningxia–Inner Mongolia reach has exacerbated channel siltation, with the emergence of “new suspended rivers” becoming an increasingly prominent threat. This phenomenon poses severe risks to regional flood control and ice-jam prevention safety. Therefore, precise characterization of runoff–sediment load variations in the LJX–HSX reach constitutes a scientific prerequisite for diagnosing the drivers of downstream channel siltation and formulating targeted regulation strategies.

2.2. Data

The datasets used in this study mainly include the measured runoff and sediment load records from five hydrological stations (Xiaochuan, Shangquan, Lanzhou, Anningdu, and Xiaheyan), digital elevation model (DEM) data, land use/cover change (LUCC) data, normalized difference vegetation index (NDVI) data, population density (POP) data, meteorological data (annual mean temperature, annual mean precipitation, and annual potential evapotranspiration), and basic geographic data of the study area (administrative boundaries, river networks, and locations of hydrological stations). Considering the diversity of data sources, all raster datasets were standardized to a uniform spatial resolution of 1 km and projected to the Albers coordinate system. Land use data were resampled using the nearest neighbor method to strictly preserve the original categorical pixel values without generating new artificial values. Digital elevation data were resampled via the cubic convolution algorithm, which ensures favorable spatial continuity and minimizes overall geometric distortion. The detailed sources and fundamental characteristics of the datasets are presented in Table 1.

2.3. Method

2.3.1. Mann–Kendall Test Method

The Mann–Kendall (M–K) test is a widely used non-parametric method for analyzing trends in time series data [33]. Unlike parametric tests, it does not require data to conform to a specific distribution, making it particularly suited for trend analysis of environmental and meteorological time series. For a given time series X1, X2, …, Xn, the test first defines a statistic S and constructs a standardized test statistic Z. At a specified significance level, if |Z| > Z1−α/2, the time series exhibits a statistically significant upward or downward trend: a positive Z-value indicates an increasing trend, while a negative value denotes a decreasing trend [34].
S = i = 1 n 1 j = i + 1 n s g n ( x j x i )
Z = S 1 V a r ( S ) , S > 0 0 ,   S = 0 S + 1 V a r ( S ) ,   S < 0
U F k = S k E ( S k ) V a r ( S k ) k = 1 , 2 ,   , n
U B k = U F k , k = n + 1 k
where UFk is a normal distribution statistic, E (Sk) is the mean of Sk, Var (S) is the variance of Sk, k is the sample, and UBk is the reverse order statistic.

2.3.2. Sliding t-Test

When multiple intersection points emerge in the M–K test results for a time series, a significance test is required to validate whether these points represent true abrupt changes. The mean difference t-test is applied for this purpose: the time series is split into two sub-periods, and if the difference in their mean values is statistically significant at a predefined confidence level, the intersection point is confirmed as an abrupt change point [35]. The calculation formula for the t-statistic is as follows:
t = x ¯ 1 x ¯ 2 s 1 n 1 + 1 n 2
s = n 1 s 1 2 + n 2 s 2 2 n 1 n 2 2
where x is a certain hydrological time series, s is the variance of series x, x1 and x2 are two sub-series before and after the sliding division point, and n1 and n2 are the sample sizes of the two sub-series, with means of x ¯ 1 and x ¯ 2 , and variances of s12 and s22. t is the test statistic.

2.3.3. Wavelet Analysis

Wavelet analysis is a powerful tool for identifying periodic patterns in hydrometeorological time series [36]. This method involves applying a wavelet transform to the hydrometeorological dataset and integrating squared wavelet coefficients across different scales to derive the wavelet variance, which quantifies the contribution of each scale to the total variance of the series [37]. Given the typical non-stationarity and multi-scale oscillatory nature of hydrological runoff and sediment load time series, the complex-valued Morlet wavelet was selected as the mother wavelet in this study. It offers excellent resolution in both the time and frequency domains, enabling simultaneous capture of the amplitude and phase information of the signal, which allows for accurate identification of time-varying periodic oscillations across different frequencies [38]. This method has also been widely validated in hydrological applications, ensuring its reliability for this analysis. Morlet wavelet analysis—one of the most commonly used wavelet techniques—approximates a time series or signal using a family of Morlet wavelet functions [39]. A key advantage of this approach is its ability to simultaneously reveal local characteristics of a time series in both the time and frequency domains. The Morlet mother wavelet and its daughter wavelets are defined as follows [40]:
Ψ x = Π 1 / 4 e i c x e x 2 / 2
Ψ a b x = 1 a Ψ x b a
where Ψ x is the mother wavelet function, and Ψ a b x is the daughter wavelet; a is the scale factor, which characterizes the period length of the wavelet, and b is the translation factor, which indicates the shift in time.
For the runoff/sediment load series f(t), the continuous wavelet transform is defined as [41]:
W f a , b = 1 a + f t Ψ t b a ¯   d t
where W f a , b is the wavelet transform coefficient and Ψ t b a ¯ is the complex conjugate of Ψ x b a .
To quantify the contribution of each scale to the total signal energy, wavelet variance is further calculated as [42]:
V a r a = 1 n j = 1 n W a , x j 2
where V a r a is the wavelet variance corresponding to scale a, reflecting the average energy of the signal at that scale; a is the scale factor, corresponding to the analyzed time period; n is the length of the time series; W a , x j is the wavelet transform coefficient at scale and time position; and W a , x j 2 is the wavelet power, representing the energy intensity of the signal at that time–frequency location. Combined with the time–frequency distribution of the wavelet power spectrum, this method enables the identification of the stability and abrupt changes in the dominant periods.

2.3.4. Mantel Test

The Mantel test is a non-parametric statistical method based on distance matrices, designed to assess the correlation between two multivariate distance matrices [43]. Traditional correlation analyses only evaluate the bivariate association between a single explanatory variable and a dependent variable [44], while multiple regression analysis is constrained by strict assumptions, which limit its applicability to complex hydrological datasets. In contrast, the Mantel test enables the construction of a multi-factor distance matrix (integrating climate, landscape, and anthropogenic factors) and a runoff–sediment load characteristic distance matrix, facilitating an overall correlation analysis of the complex relationships within hydrological time series. For distance matrix construction, Euclidean distance was uniformly adopted as the distance metric for both the independent variable matrix and the dependent variable matrix. All distance calculations were performed across the five sub-catchments within the LJX–HSX reach, consistent with the defined spatial scope of this study. For this reason, the Mantel test was adopted in this study, implemented using the “vegan” package in R version 4.2.3.

2.3.5. XGBoost Model

XGBoost is an optimized gradient boosting ensemble algorithm, which has been widely applied in hydrological simulation and environmental prediction due to its high computational efficiency and strong generalization performance [45]. It takes decision trees as base learners and iteratively minimizes the residual error between predicted and observed values [46]. Regularization and subsampling strategies are embedded in the algorithm to effectively avoid overfitting.
In this study, two XGBoost models were established for runoff and sediment load prediction, respectively. The main hyperparameters were set as follows: the total number of iterations was 100; the objective function was set as reg: squarederror for regression tasks; the learning rate was 0.1; the maximum depth of a single tree was 6; both subsample and colsample bytree were 0.8. Three official importance metrics of XGBoost were adopted to quantify the contribution of each variable. Gain represents the total reduction of prediction error brought by a feature, which was used to determine the final feature importance ranking. Cover reflects the number of samples covered by the feature, and Frequency refers to the number of times a feature is used across all decision trees. The three indicators jointly evaluate the influence of driving factors. Visualization of feature importance bubble charts was implemented in R version 4.2.3.

2.3.6. Driving Factors

Based on the natural and socioeconomic characteristics of the study area, seven driving factors were selected, covering both natural and anthropogenic aspects. The natural driving factors include four variables: mean annual temperature (T), precipitation (Pr.), evapotranspiration (ET), and elevation (Elev.). The anthropogenic driving factors include three variables: normalized difference vegetation index (NDVI), population density (POP), and landscape metrics. The landscape metrics specifically comprise the following nine indices: Number of Patches (NP), Patch Density (PD), Largest Patch Index (LPI), Landscape Shape Index (LSI), Contagion Index (CONTAG), Distance Index (DI), Division Index (DIVISION), Shannon’s Diversity Index (SHDI), and Aggregation Index (AI). These landscape characteristics directly regulate surface runoff generation, flow convergence and soil erosion processes, and are closely associated with the laws of runoff and sediment transport in the study area.

3. Results

3.1. Variation Trends of Runoff and Sediment Load

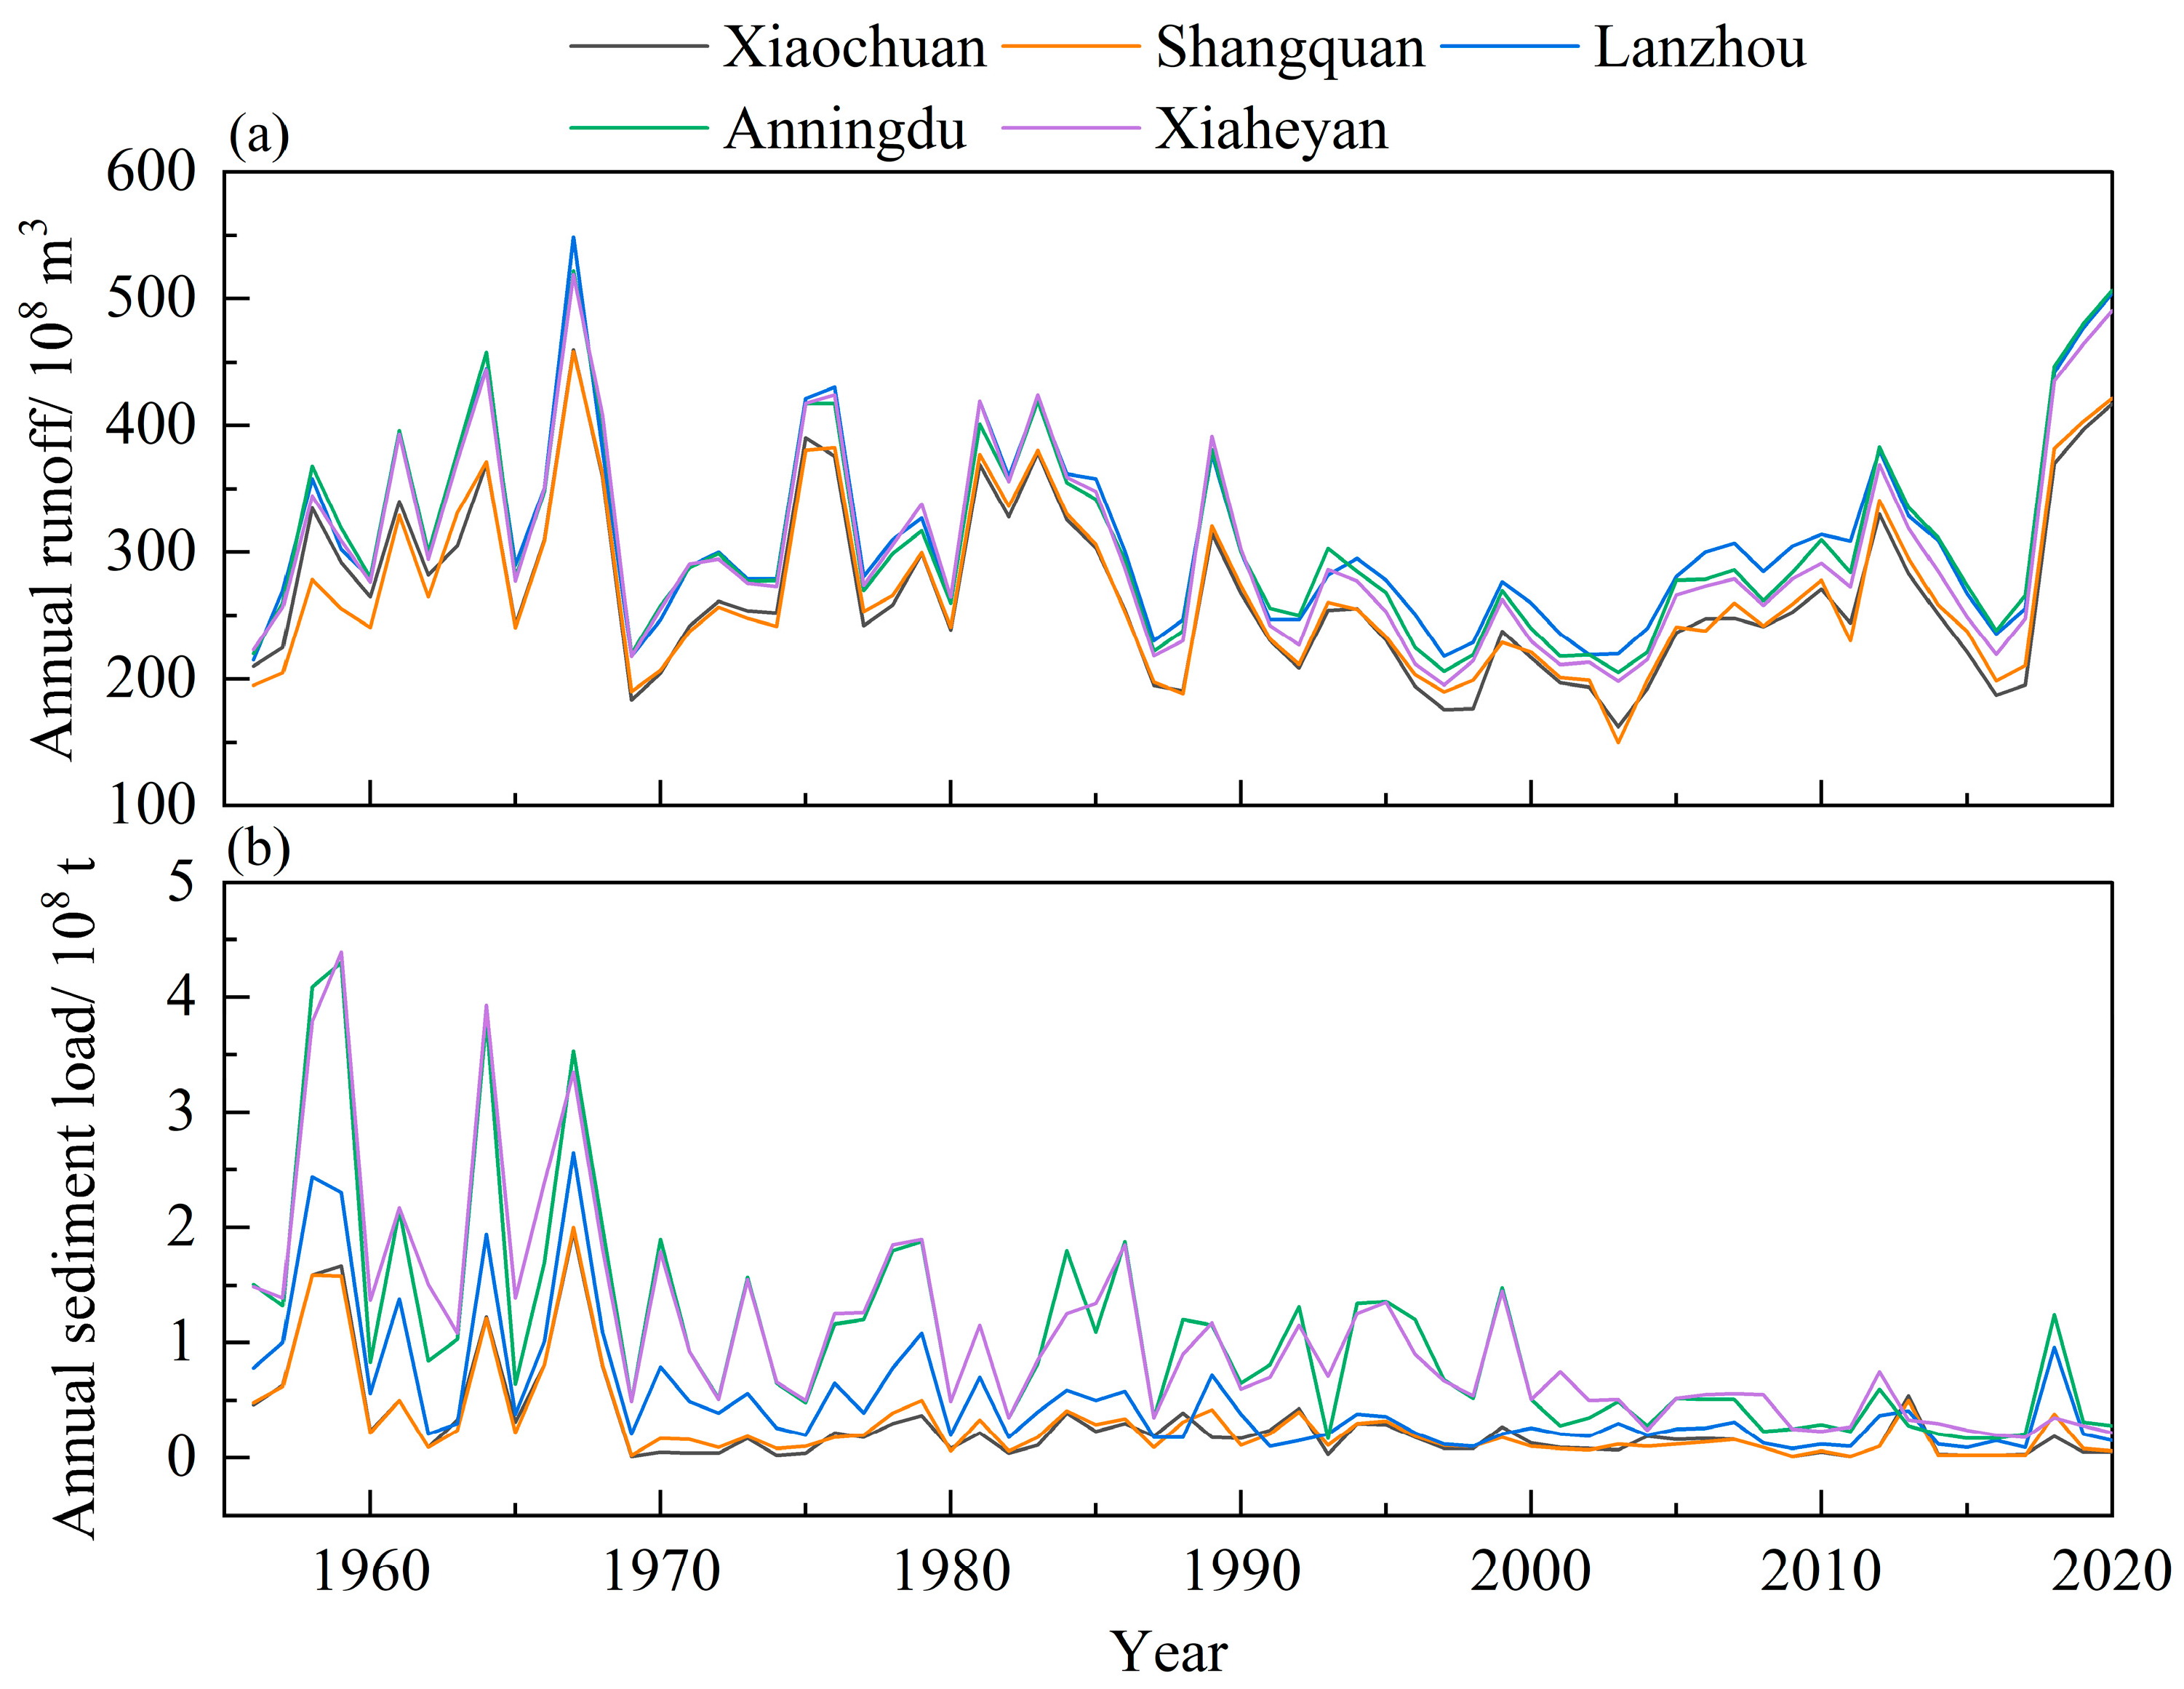
Table 2 summarizes the statistical characteristics of annual runoff and sediment load recorded at five hydrological stations in the LJX–HSX reach of the Yellow River Basin over the period 1955–2020. Across the five stations, the mean annual runoff ranged from 268.38 × 10⁸ m3 to 312.81 × 10⁸ m3, whereas the mean annual sediment load varied between 0.28 × 10⁸ t and 1.07 × 10⁸ t. The maximum annual runoff was observed at Lanzhou Station, reaching 549 × 108 m3, while the minimum annual runoff was recorded at Shangquan Station, with a value of 162.30 × 10⁸ m3. For annual sediment load, the highest value (4.39 × 10⁸ t) was measured at Xiaheyan Station, whereas the lowest annual value (0.01 × 10⁸ t) was detected at both Xiaochuan and Shangquan Stations.
Furthermore, referring to the classification criteria [47,48] for the coefficient of variation (CV) from relevant literature, annual runoff at all five stations exhibited moderate variability, falling within the range of 0.1 ≤ CV ≤ 1. In contrast, sediment load at Xiaochuan, Shangquan, and Lanzhou Stations displayed a CV > 1, indicating high variability and substantial fluctuations in sediment transport dynamics. By comparison, sediment load at Anningdu and Xiaheyan Stations remained within the moderate variability range.
As illustrated in Figure 2, annual runoff and sediment load at the major hydrological stations in the LJX–HSX reach exhibited distinct temporal variation patterns. Overall, annual runoff at each station underwent pronounced interannual fluctuations (Figure 2a). During 1956–1967, runoff fluctuated sharply with an overall upward trend, peaking in 1967, with a secondary peak observed in 1964 and the lowest value recorded in 1956. From 1968 to 2010, under the influence of reservoir regulation, runoff exhibited a steady declining trend. However, after 2014, runoff showed a slight recovery, with a renewed upward trend emerging particularly from 2016 onward. This change may result from reduced regional water abstraction and continuous ecological water replenishment in the upper reaches.
In terms of sediment load, interannual variability patterns were consistent across all stations (Figure 2b). Between 1956 and 1969, sediment load fluctuated intensely with multiple prominent peaks. After 1970, sediment load decreased significantly across the board and gradually stabilized at a relatively low level across all monitoring stations. This marked reduction in sediment transport is likely attributable to the combined effects of soil and water conservation measures implemented within the basin, as well as climate change-driven alterations in precipitation and runoff regimes, which collectively contributed to the observed sharp decline in sediment load.

3.2. Abrupt Change Detection in Runoff and Sediment Load

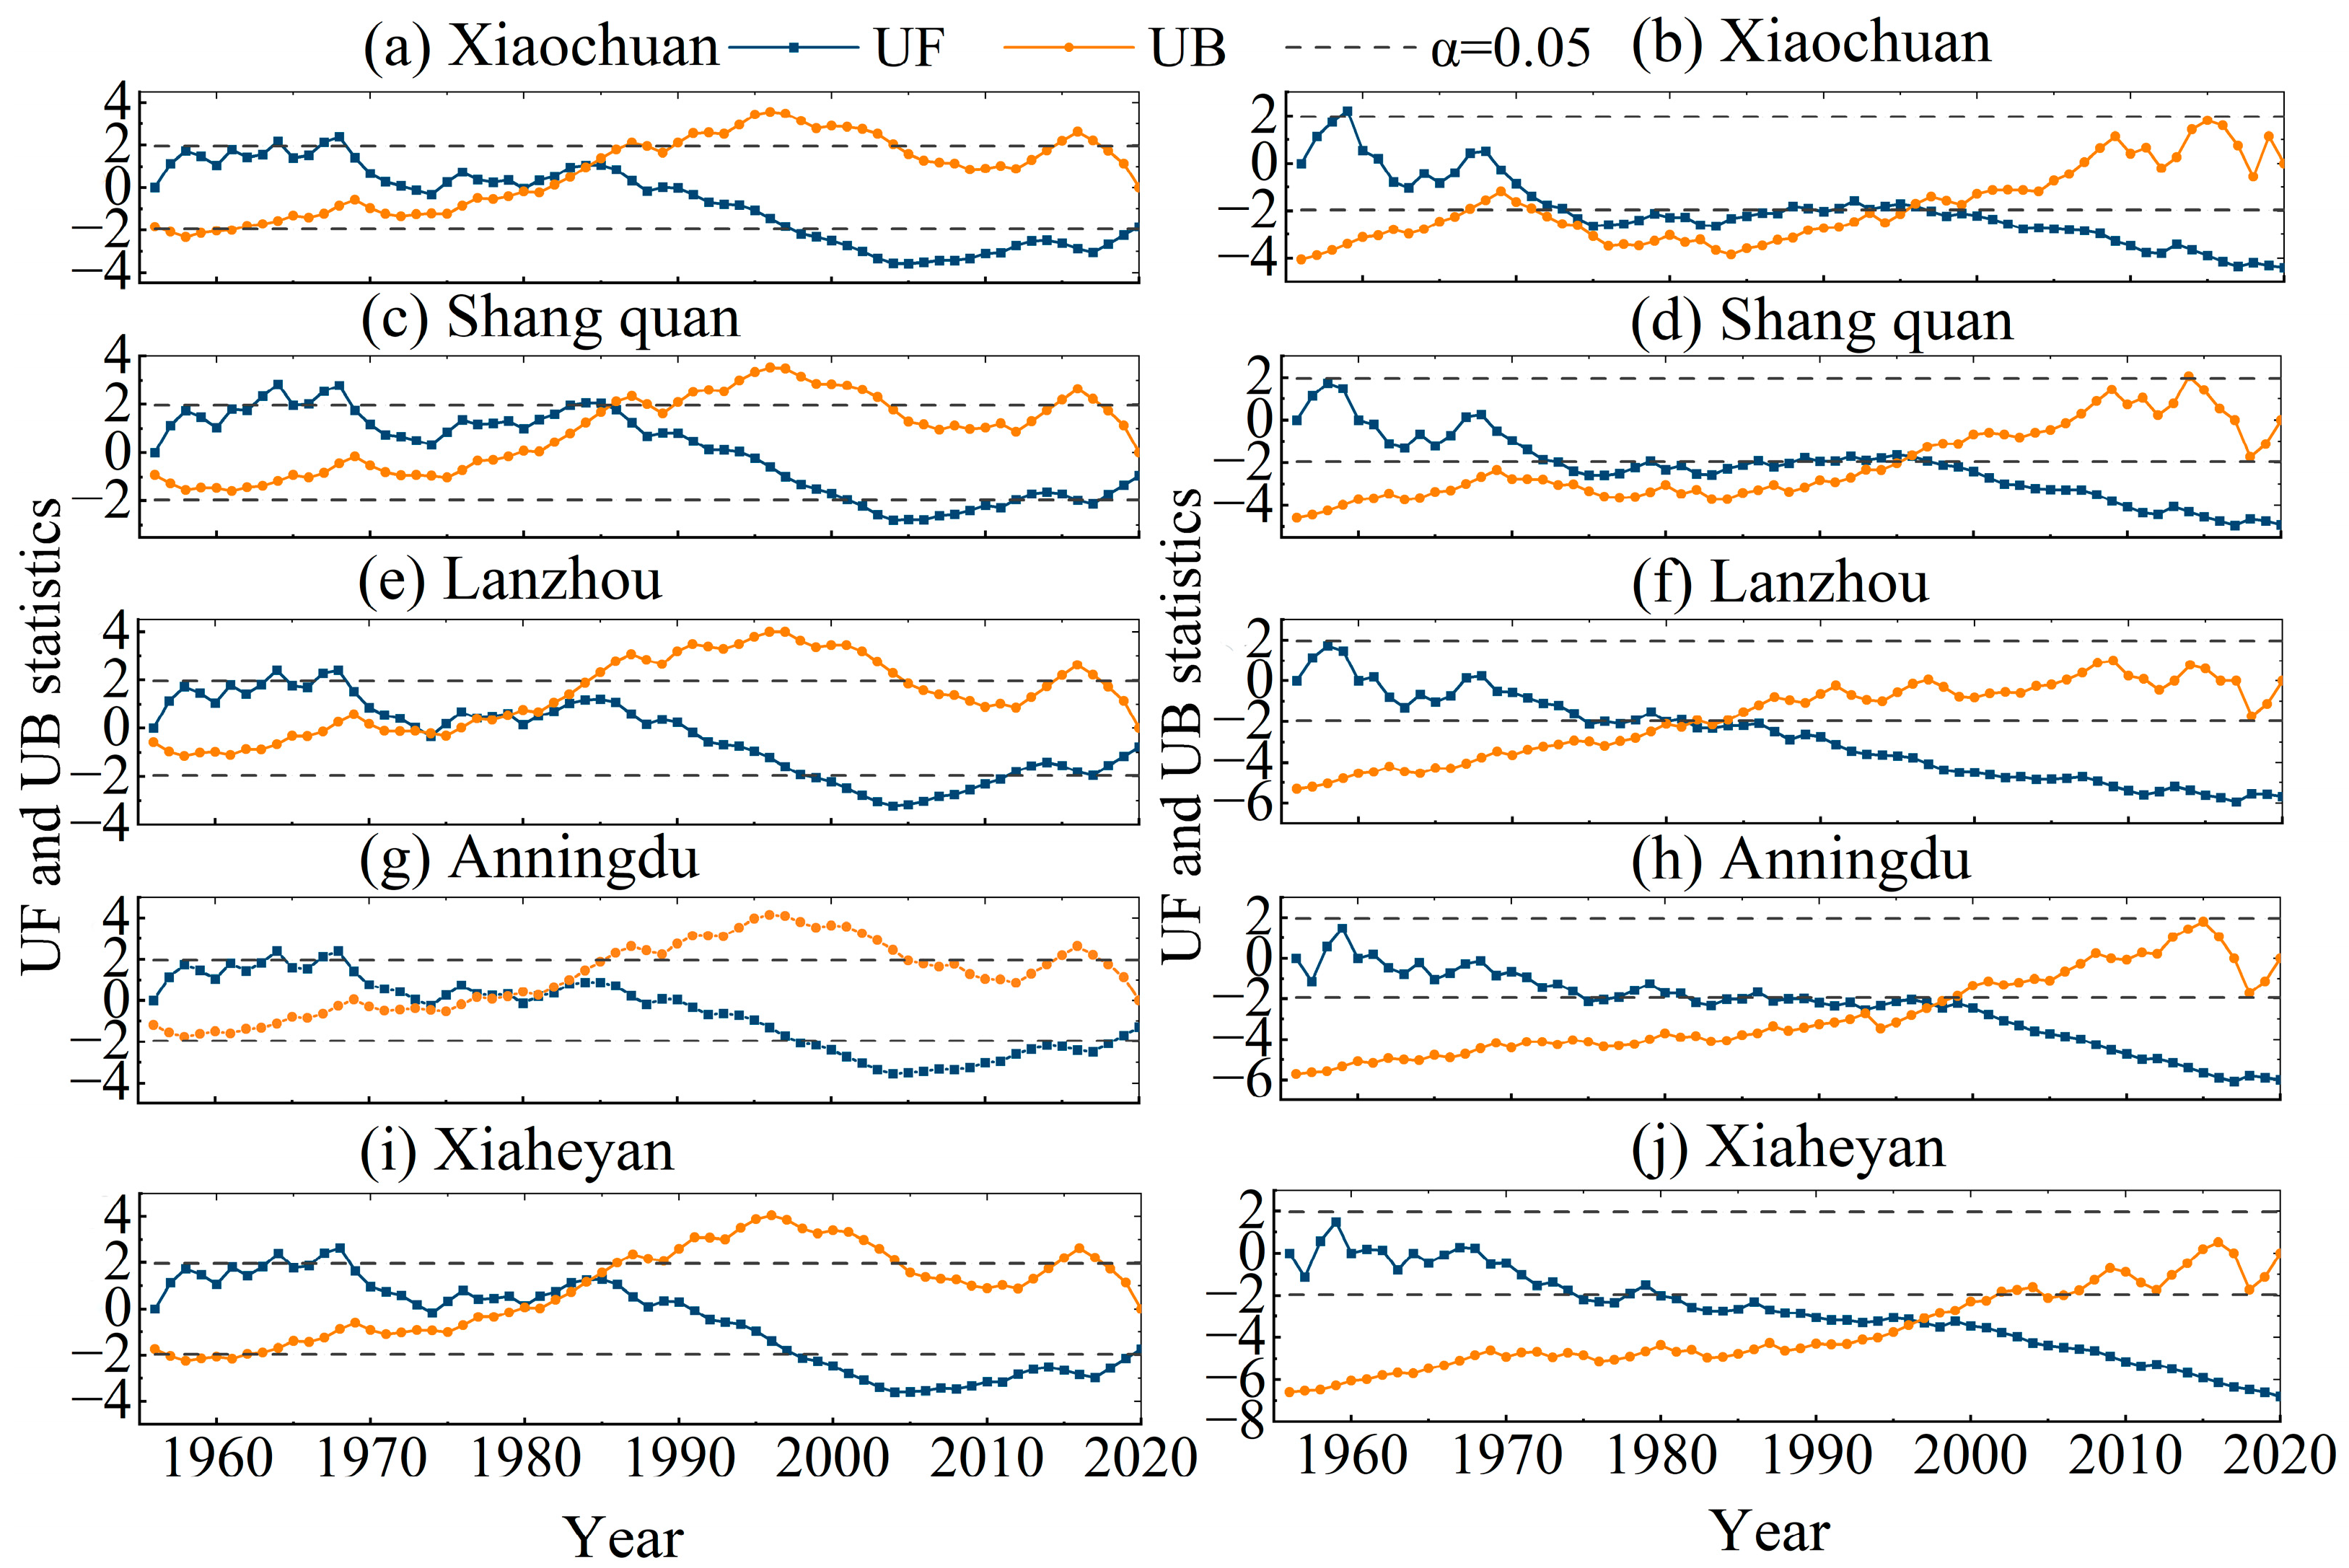
The Mann–Kendall (M–K) abrupt change detection results indicated statistically significant abrupt shifts in both runoff and sediment load across all monitoring stations over the period 1956–2020. These change points were defined as the intersection points of the forward (UF) and backward (UB) series curves (Figure 3).
Specifically, at Xiaochuan Station, runoff exhibited an abrupt change during 1985–1986 (Figure 3a), whereas sediment load underwent a sudden shift in 1996 (Figure 3b). A consistent temporal pattern was observed at Shangquan Station, where runoff changed abruptly in 1985–1986 (Figure 3c) and sediment load in 1996 (Figure 3d). In contrast, Lanzhou Station recorded multiple abrupt changes in runoff, with significant transitions detected in 1974, 1975, 1979, and 1982 (Figure 3e); its sediment load exhibited a single abrupt shift in 1982 (Figure 3f). At Anningdu Station, runoff changed abruptly in 1980 (Figure 3g) and sediment load in 1998 (Figure 3h), while Xiaheyan Station showed abrupt changes in runoff in 1984 (Figure 3i) and sediment load in 1997 (Figure 3j).
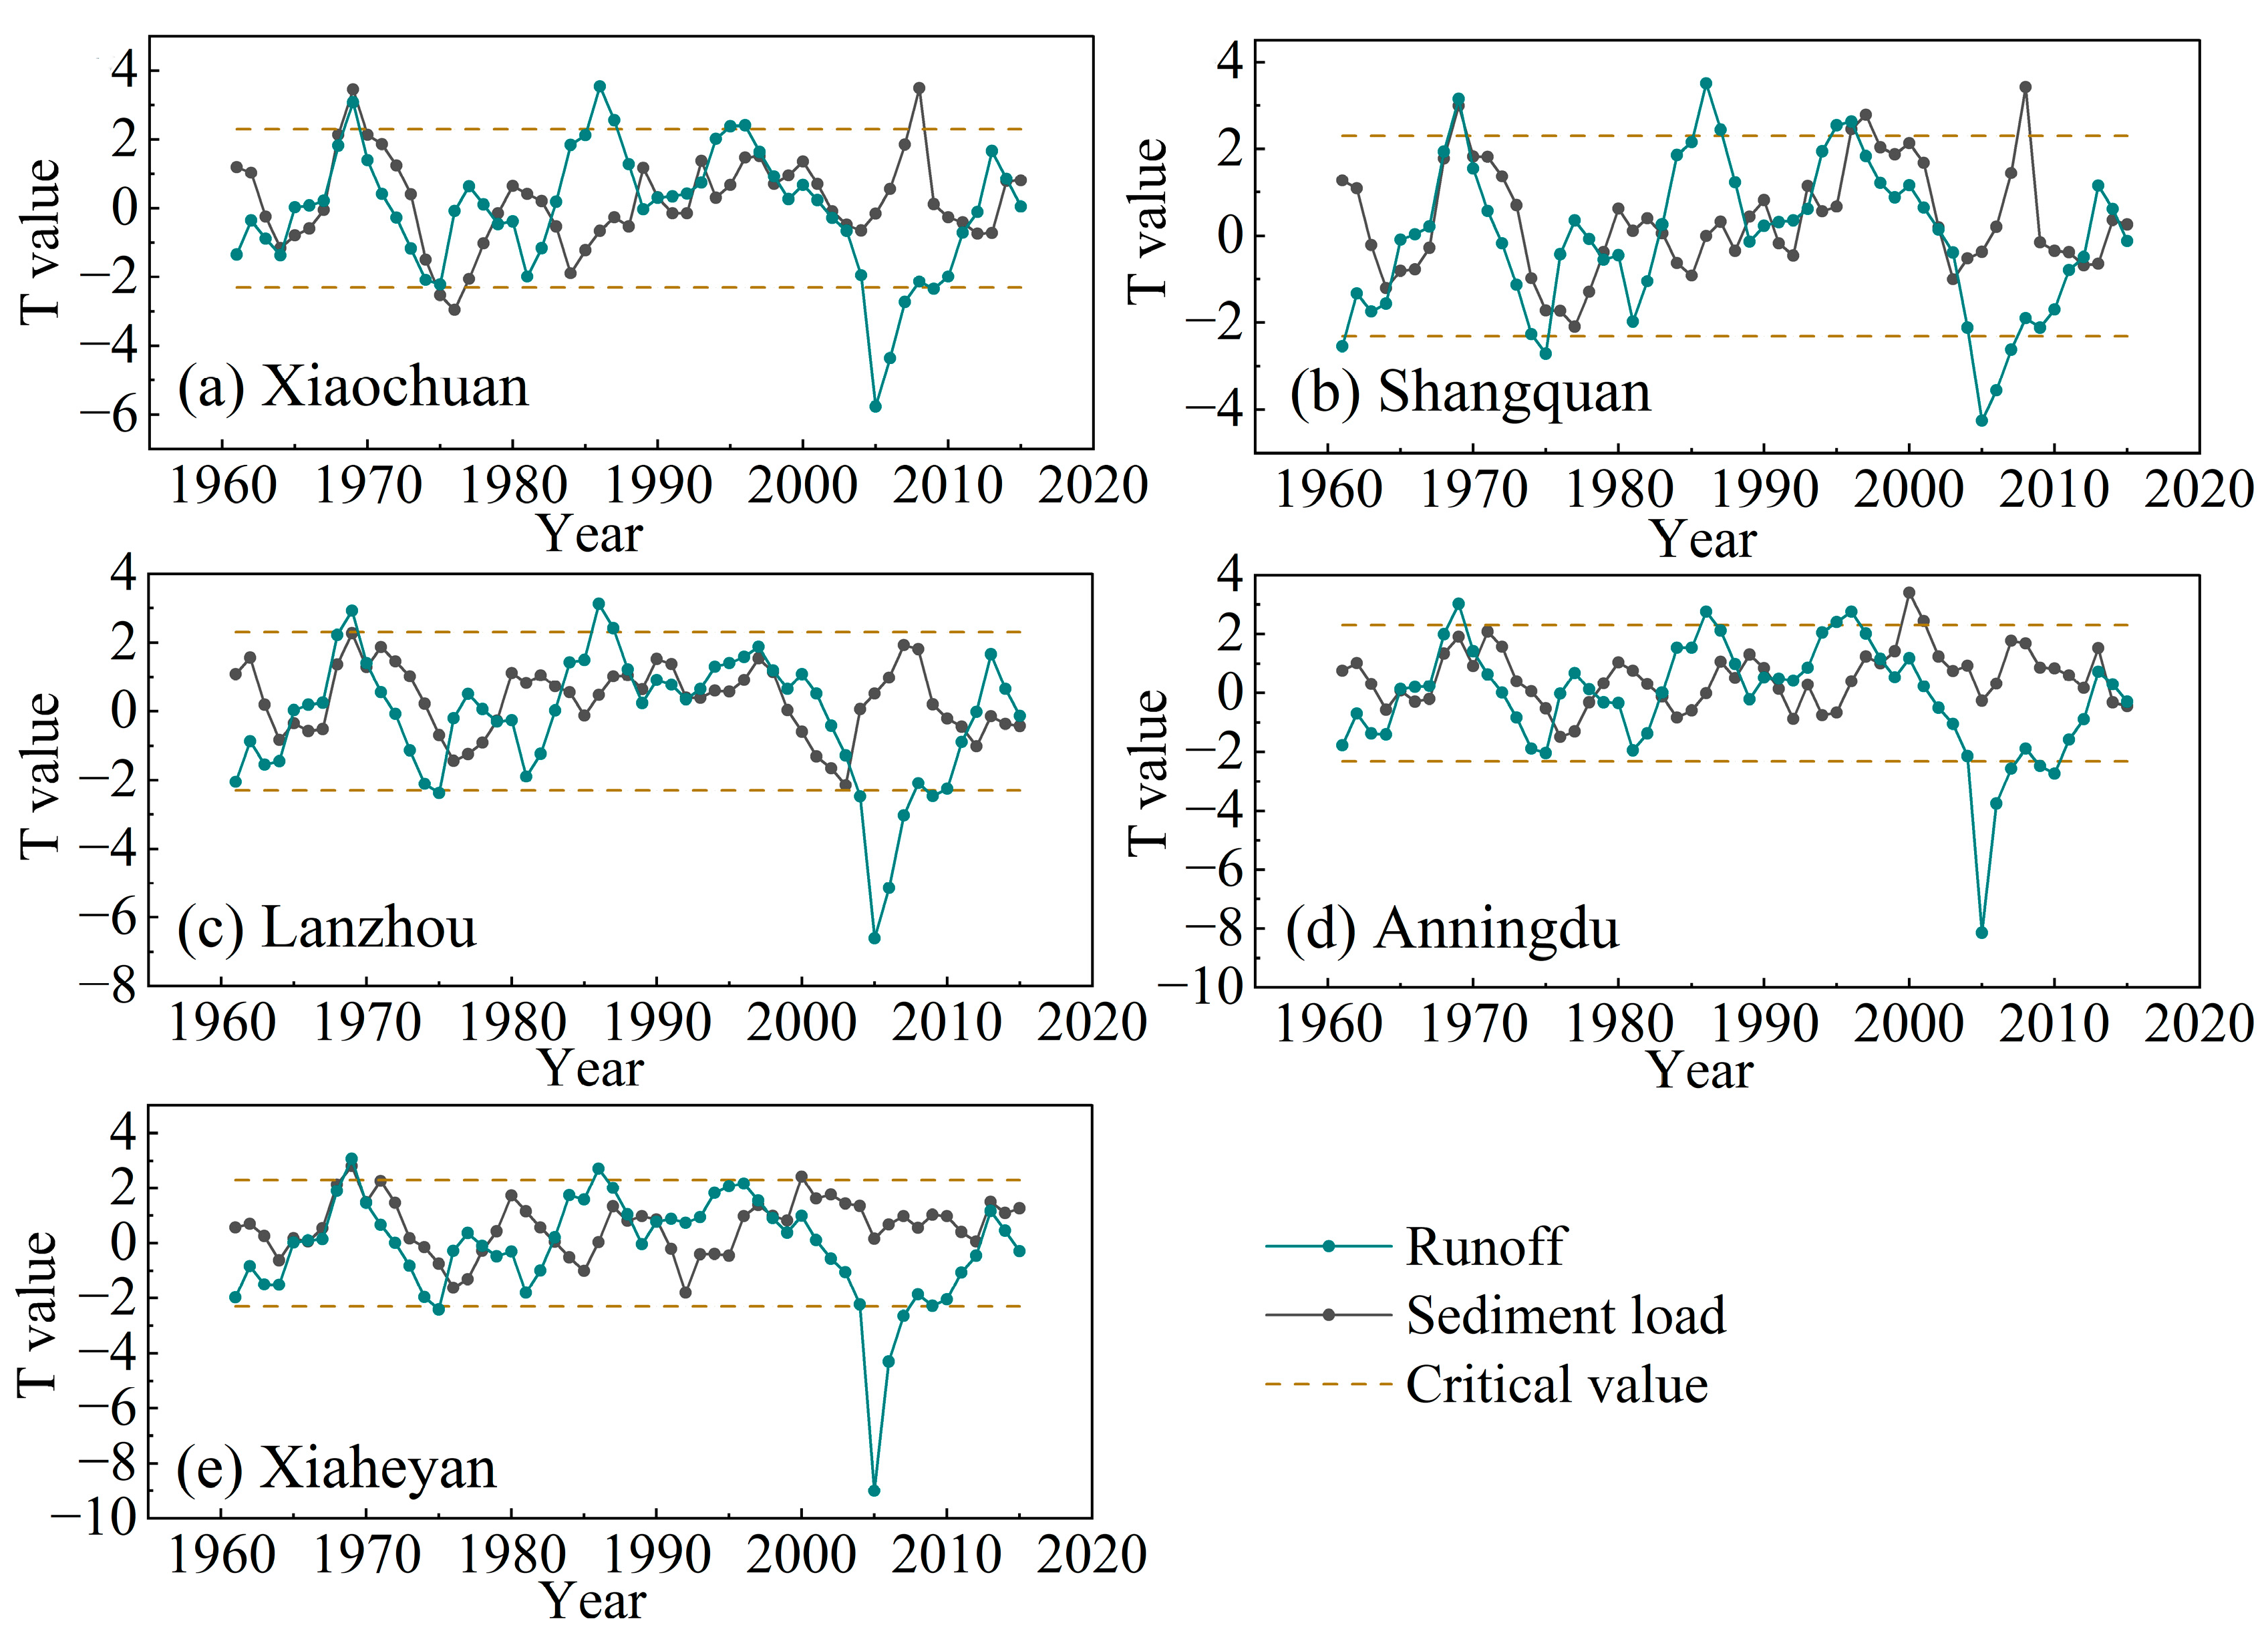
Complementary results from the Moving t-test further confirmed significant abrupt variations in runoff and sediment load across all stations during 1956–2020 (Figure 4). For runoff series, change points were relatively consistent across stations, with major transitions occurring in 1969, 1986, and 2005–2008; an additional significant runoff shift was identified at Shangquan Station in 1996. By contrast, sediment load series displayed distinct station-specific variability in change point timing. Significant shifts in sediment load were detected at Xiaochuan Station in 1969, 1976, and 2008; at Shangquan Station in 1969, 1996, and 2008; and at Anningdu Station in 2000 and 2001. Xiaheyan Station recorded significant sediment load transitions in 1969 and 2000, while Lanzhou Station showed no statistically significant changes in sediment load throughout the study period.

3.3. Periodic Characteristics of Runoff and Sediment Load

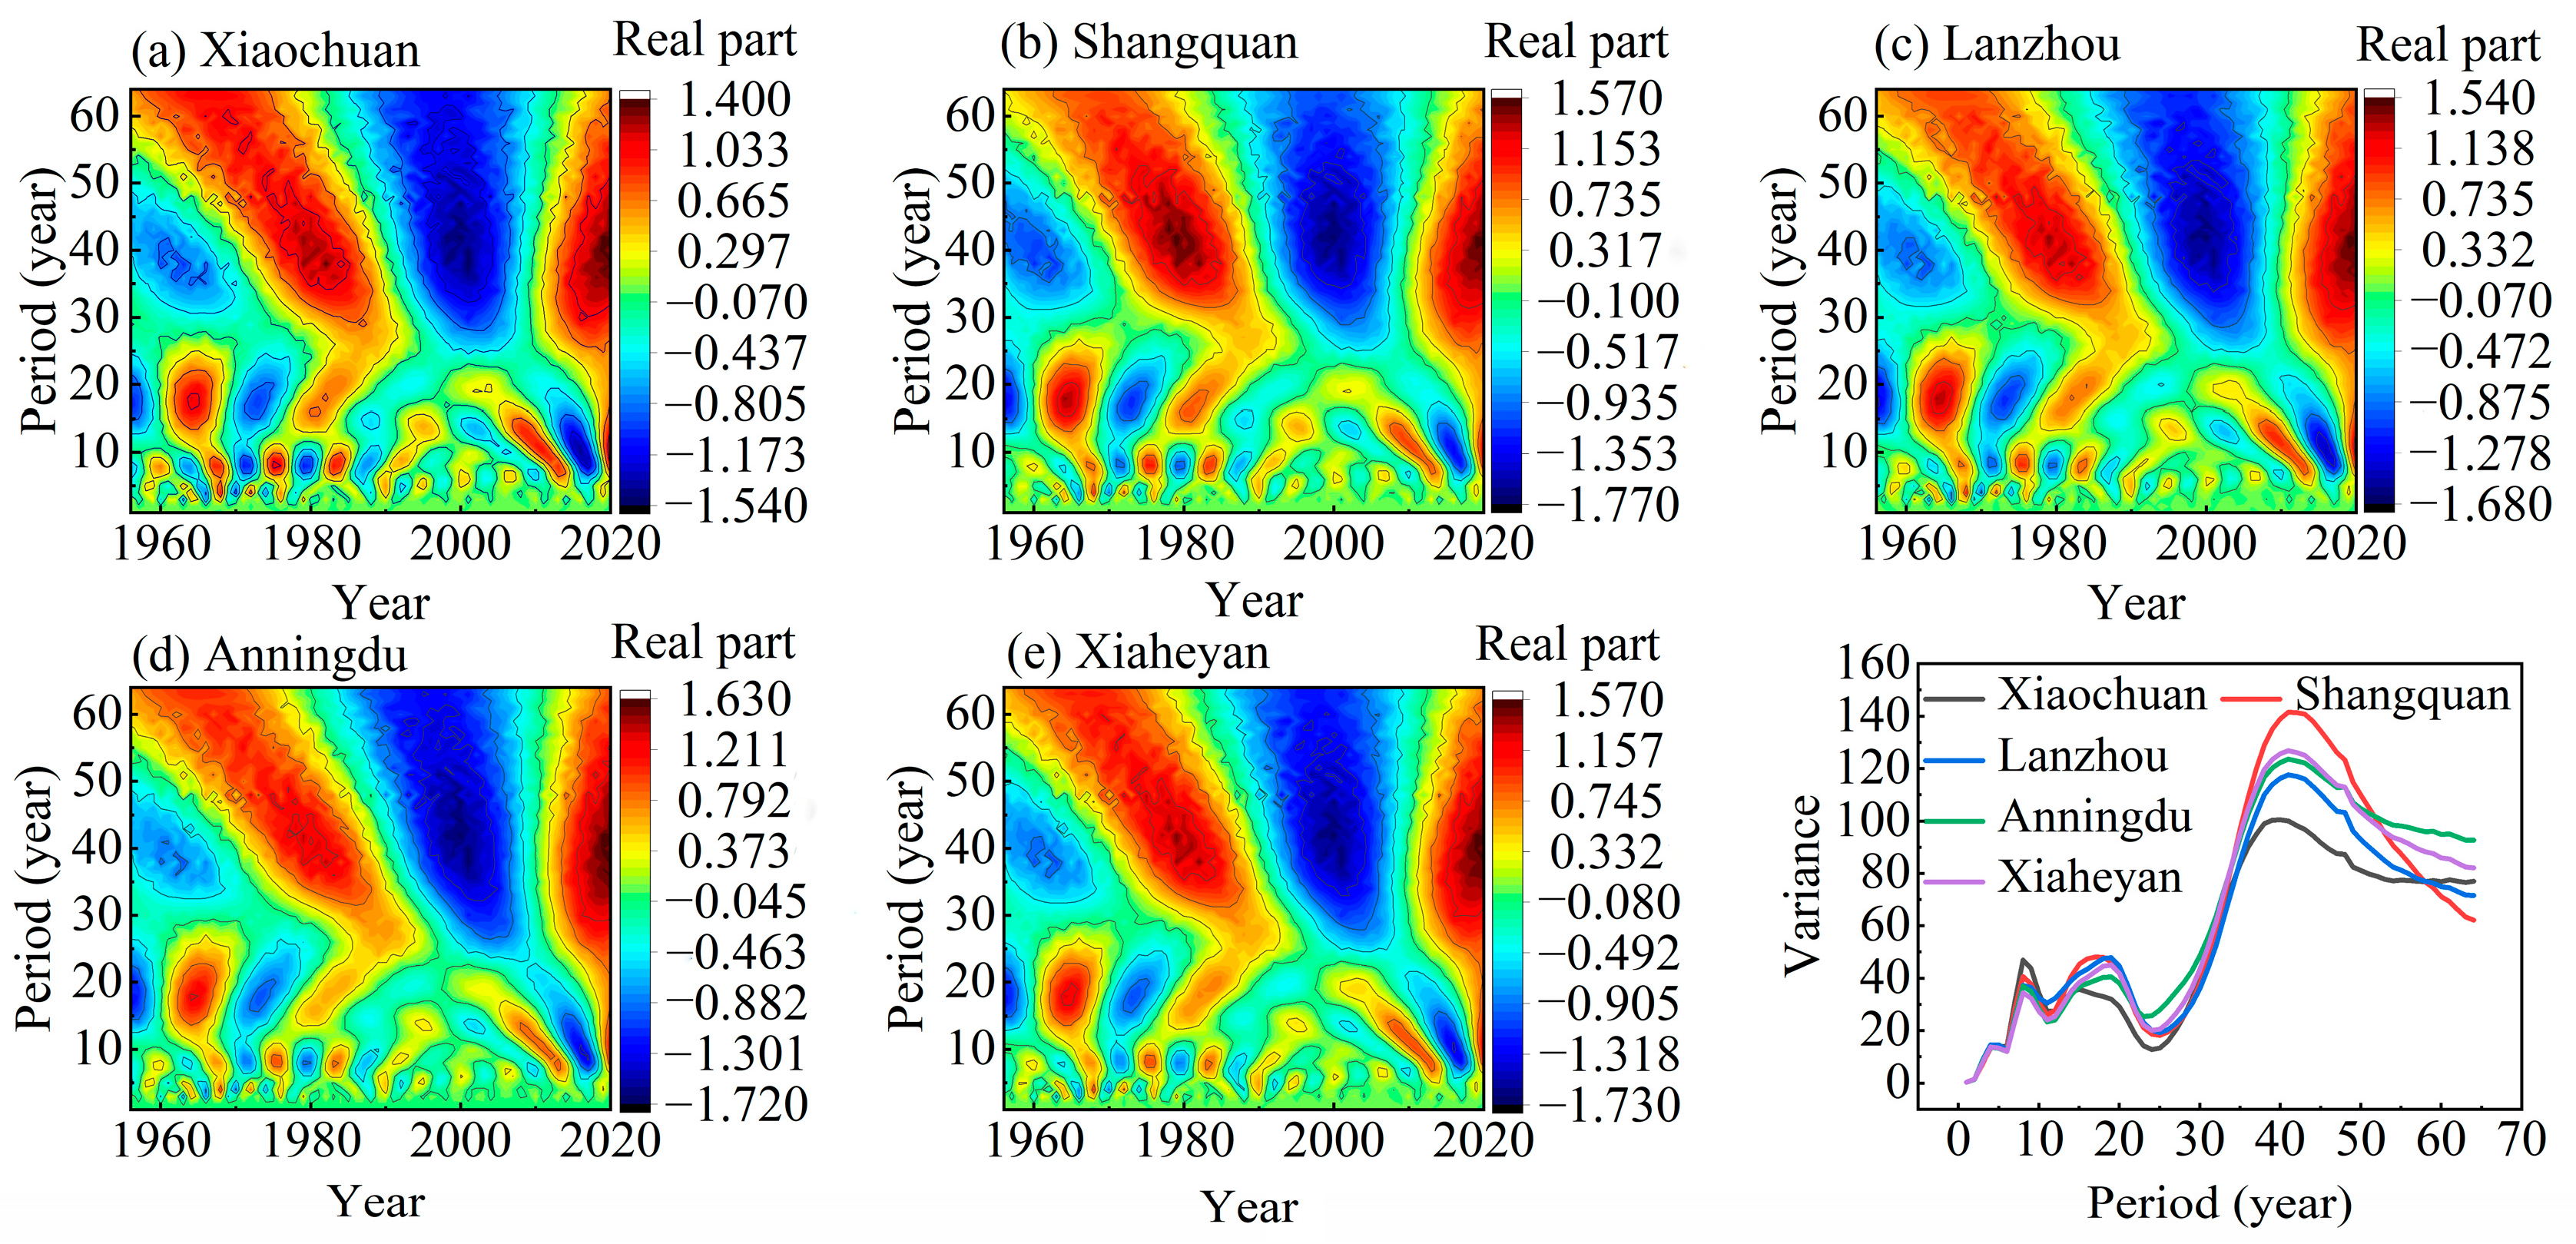
Wavelet analysis unveiled pronounced interannual and interdecadal periodic patterns in both runoff and sediment load across the LJX–HSX reach (Figure 5 and Figure 6). As illustrated in Figure 5, the runoff series at Xiaochuan and Shangquan Stations each featured three dominant periodicities: 8, 15, and 40 years for Xiaochuan Station, and 8, 17, and 41 years for Shangquan Station. By contrast, the other three stations (Lanzhou, Anningdu, and Xiaheyan) each exhibited four dominant periodicities, namely, 4, 8, 19, and 41 years. Over the study period (1956–2020), runoff series at all five stations underwent cyclical alternation between dry and wet phases.
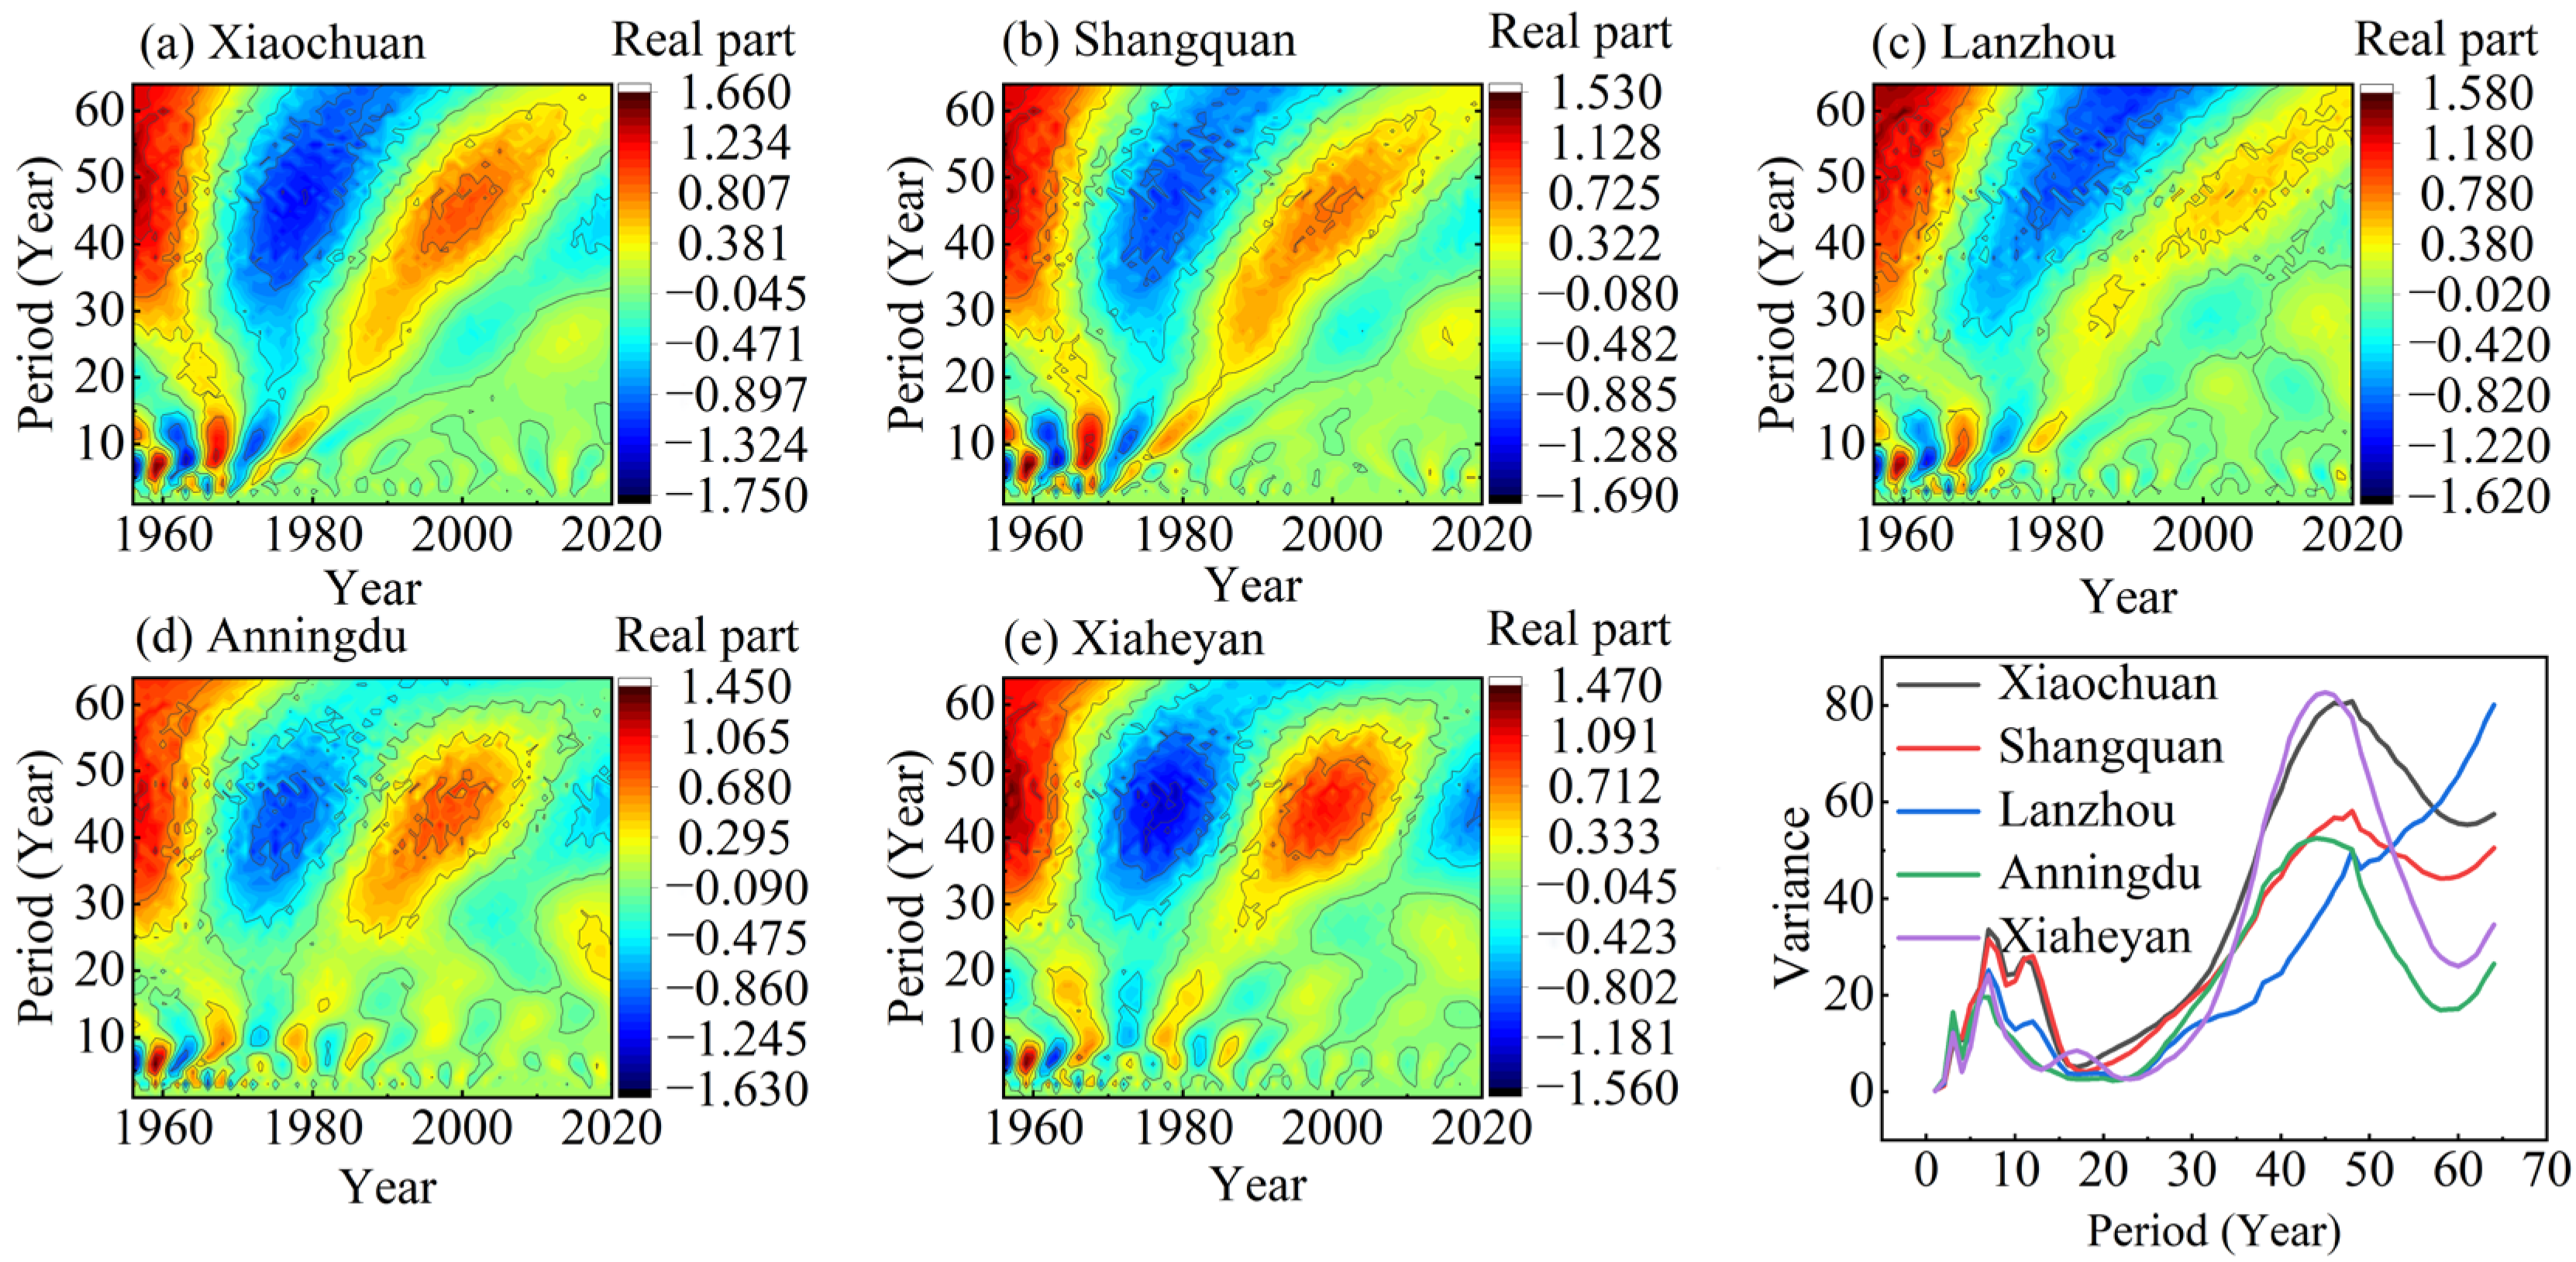
Based on the contour maps of wavelet coefficient real parts and wavelet variance spectra for sediment load (Figure 6), all five stations displayed three dominant periodicities. Specifically, Xiaochuan and Shangquan Stations shared identical dominant periods of 11, 18, and 41 years for sediment load; Lanzhou Station had dominant periods of 3, 7, and 48 years; Anningdu Station showed 3, 6, and 44 years; and Xiaheyan Station recorded 3, 7, and 45 years. Collectively, sediment load series at these stations experienced cyclical fluctuations between low-sediment and high-sediment phases throughout 1956–2020.

3.4. Analysis of Influencing Factors of Runoff and Sediment Transport Volume

3.4.1. Analysis of Factors Influencing Runoff and Sediment Transport in Sudden-Change Years

Integrated results from the Moving T-test and Mann–Kendall (M–K) test identified abrupt changes in runoff and sediment load across the five stations in 1969, 1986, 1996, and 2008. The abrupt shifts observed in 1969 and 1986 were primarily ascribed to the construction and subsequent operation of the Liujiaxia and Longyangxia reservoirs. Conversely, the drivers underlying the 1996 and 2008 abrupt changes remain elusive. To address this knowledge gap, in this study, we employed Mantel tests and Pearson correlation analysis to investigate the driving factors governing runoff and sediment load variations during the abrupt change years (1996 and 2008) as well as the recent reference year (2020).
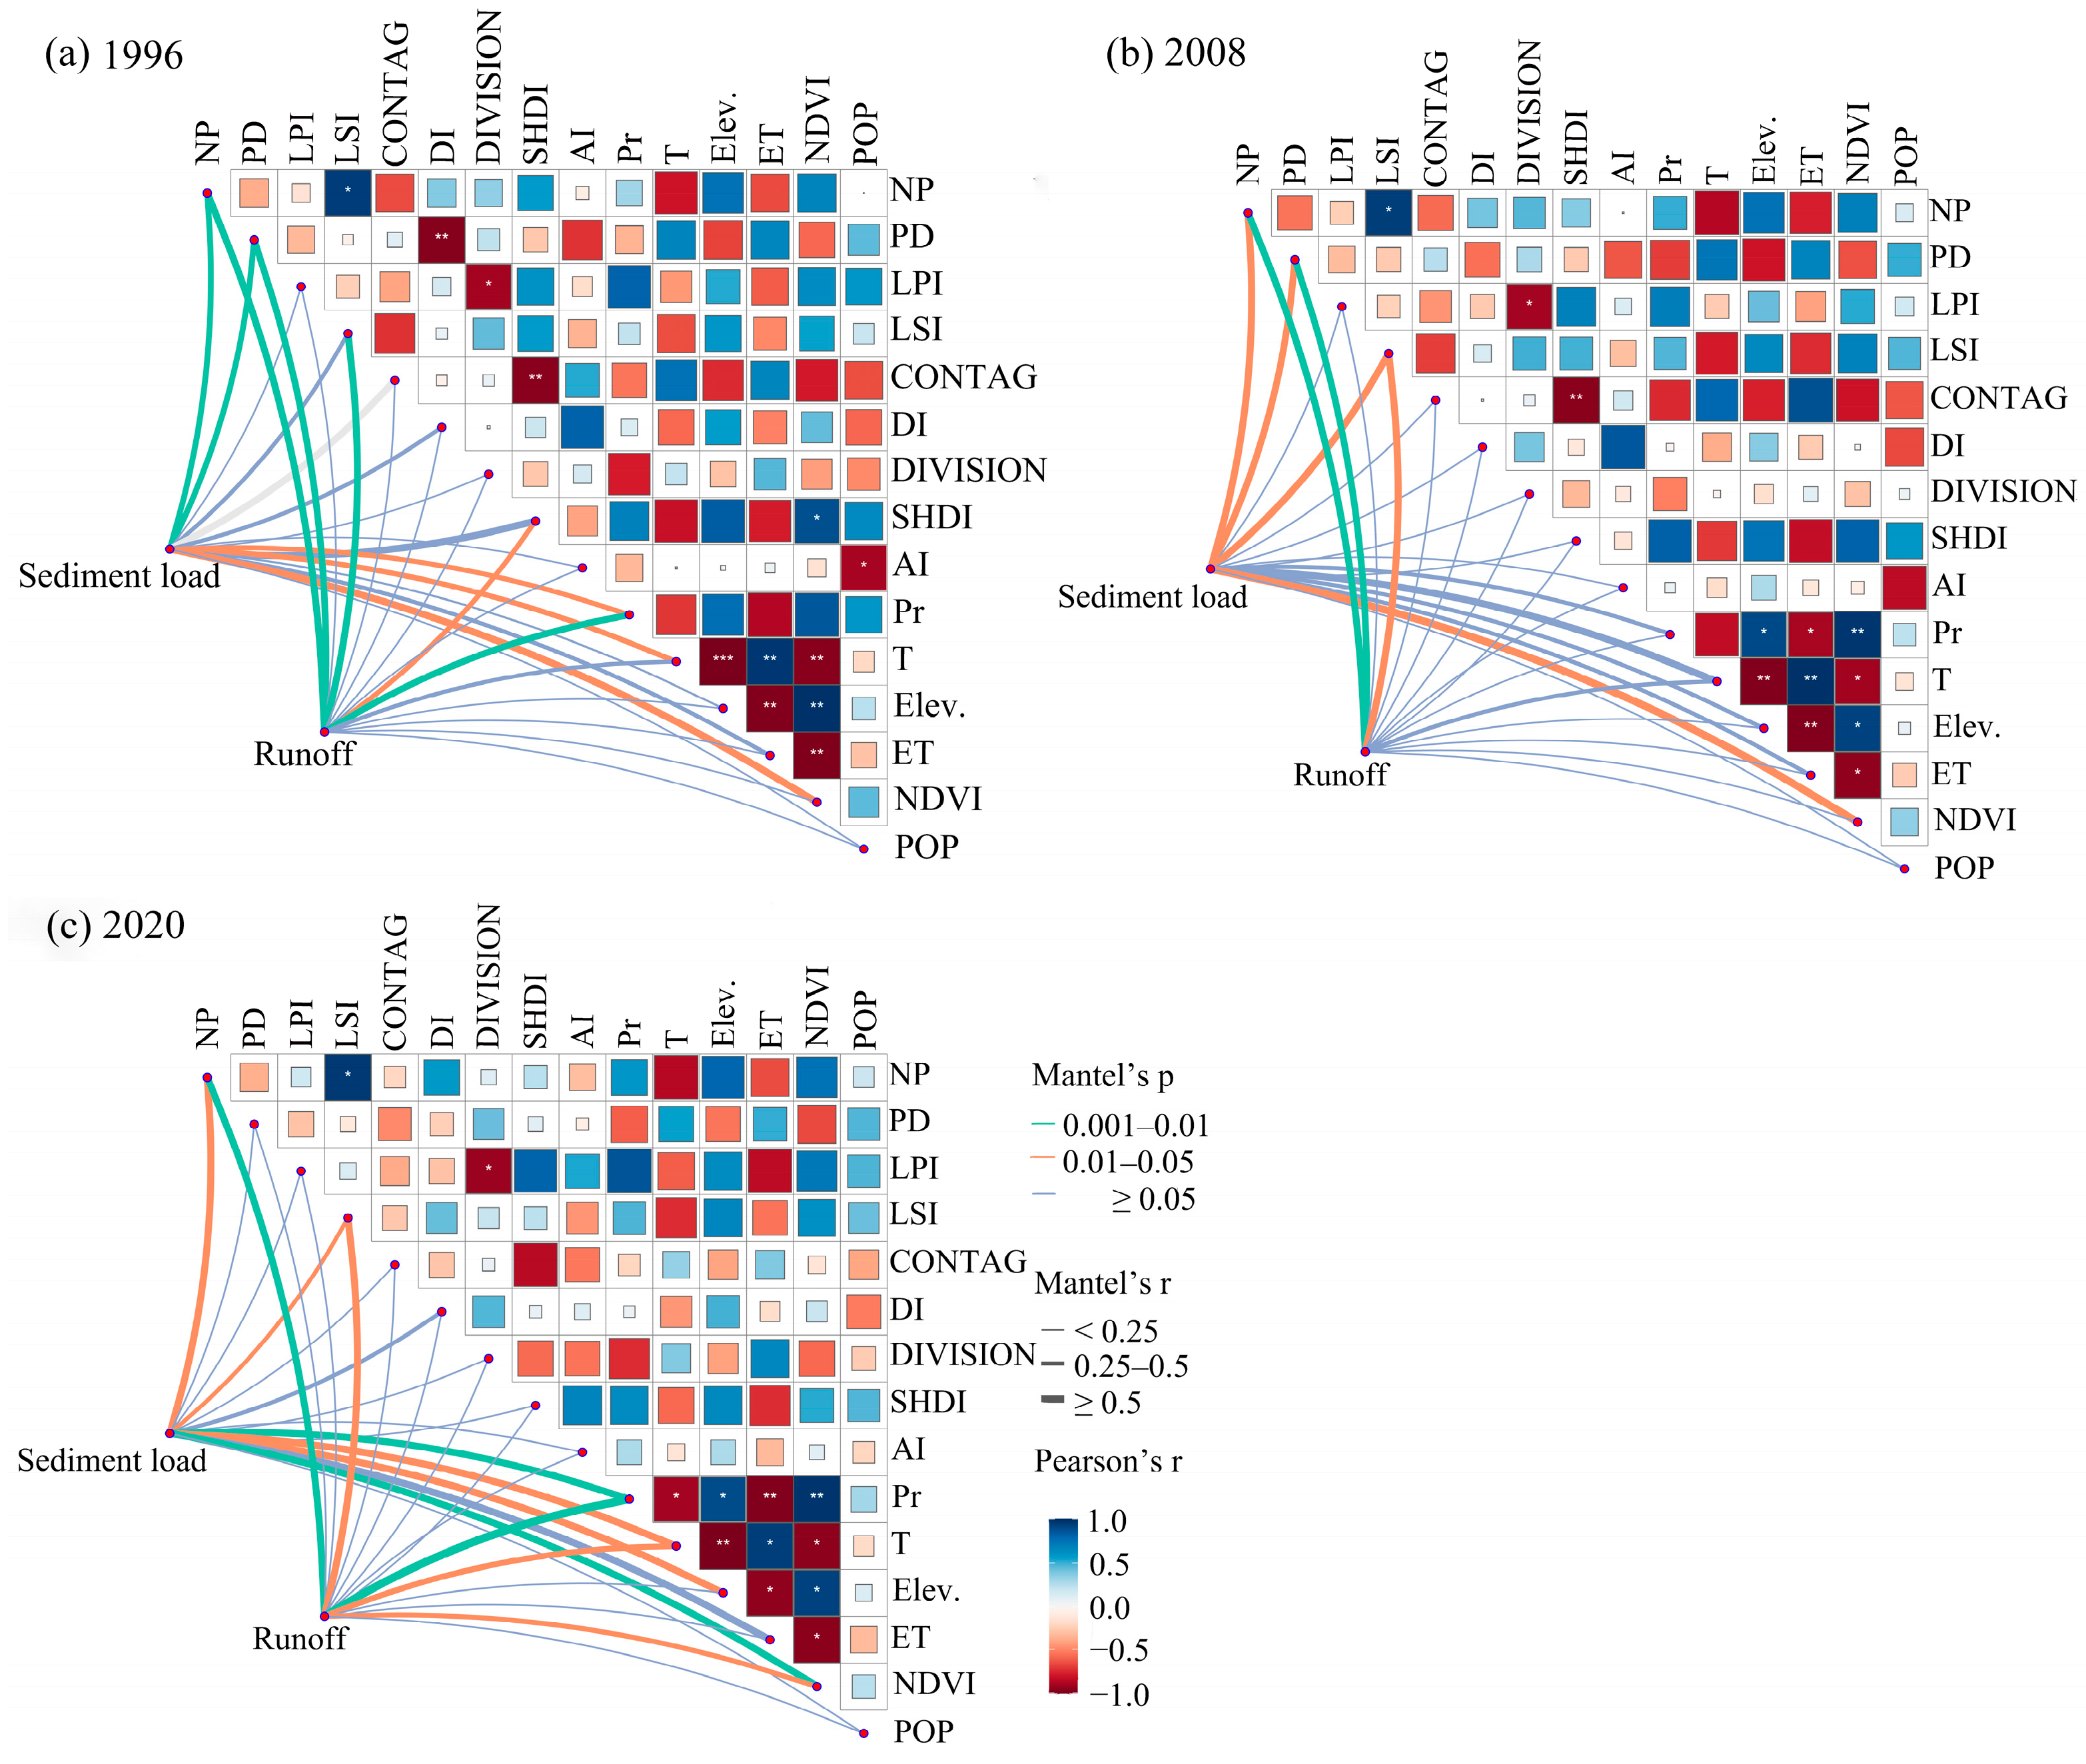
The correlation analysis results (Figure 7a) demonstrated that in 1996, four variables—NP, PD, LSI, and Pr.—exhibited highly significant positive correlations with runoff (0.001 ≤ p < 0.01, |r| ≥ 0.5). SHDI showed a moderately significant correlation with runoff, whereas all other indicators displayed negligible correlations. For sediment load, NP and PD were identified as significantly correlated variables; Pr., T, and NDVI also exhibited moderate correlations, while the remaining indicators showed weak associations. Within the correlation matrix, LSI, DIVISION, SHDI, and AI displayed strong linear relationships with precipitation and temperature, with negative correlations being predominant. By contrast, a positive correlation dominated the relationship between precipitation and elevation.
As illustrated in Figure 7b, the 2008 correlation patterns showed that both NP and PD maintained highly significant correlations with runoff (0.001 ≤ p < 0.01, |r| ≥ 0.5), while LSI exhibited a moderate correlation; all other indicators showed negligible associations. This demonstrates that landscape fragmentation and patch shape complexity are key factors affecting surface runoff generation and convergence. For sediment load, NP, PD, LSI, and NDVI displayed moderate correlations, whereas the correlations between other variables and sediment load were weak. It indicates that fragmented landscape, irregular patch morphology and vegetation coverage jointly influence soil erosion and sediment delivery. The internal correlation matrix further revealed a marginal reduction in correlation strength across the dataset, particularly for the pairwise relationships between SHDI or AI and precipitation or temperature. Such changes reflect the weakened interactive linkage between landscape spatial configuration and regional hydrothermal conditions.
In 2020 (Figure 7c), NP and precipitation were found to have highly significant correlations with runoff (0.001 ≤ p < 0.01, |r| ≥ 0.5). Additionally, LSI, temperature, and NDVI exhibited moderate correlations with runoff, while all other indicators showed negligible associations. This means precipitation and landscape fragmentation dominate runoff variation, and vegetation and thermal conditions also impose certain impacts on hydrological processes. For sediment load, precipitation and NDVI displayed highly significant correlations, and NP, LSI, temperature, and elevation showed moderate correlations; the remaining variables had weak correlations with sediment load. Notably, the internal correlation matrix indicated that climatic factors and NDVI were more strongly interrelated with each other than with landscape metrics. Furthermore, NDVI and POP exhibited enhanced associations with temperature and ET in 2020, implying that vegetation dynamics and anthropogenic activities have increasingly become the dominant drivers regulating the hydrological and sedimentary processes of the study area.
To further explain the driving factors of the abrupt changes in runoff and sediment load in 1996 and 2008, in this study, we analyzed the area changes in key land use types from 1996 to 2008 based on the land use transfer matrix (Table 3). The results show that built-up land expanded most dramatically, with a net increase of 78.29 km2 (53.74%), making it the fastest-growing land use type among all categories during this period. The expansion of built-up land led to an increase in impervious surface area, which explains the slowly rising trend in runoff between 1996 and 2008. Forest land increased by a net 121.53 km2 (3.37%), reflecting the initial effectiveness of ecological restoration policies such as the Grain-for-Green Program. Water area increased by a net 94.91 km2 (31.95%), which may be related to reservoir construction and river channel storage projects. The increase in both forest land and water area jointly suppressed sediment transport, leading to an abrupt decline in sediment load in 2008. Farmland decreased by a net 371.28 km2 (−3.39%), representing the largest net loss among all land use types, with the converted area primarily transferred to built-up land, forest land, and unused land. The reduction in farmland alleviated soil erosion caused by agricultural cultivation, playing an auxiliary role in the decline of sediment transport. Traditional tillage disturbs topsoil and aggravates soil loss, so the shrinkage of farmland helps mitigate sediment loss.

3.4.2. Analysis of Multi-Year Runoff and Sediment Load in Relation to Influencing Factors

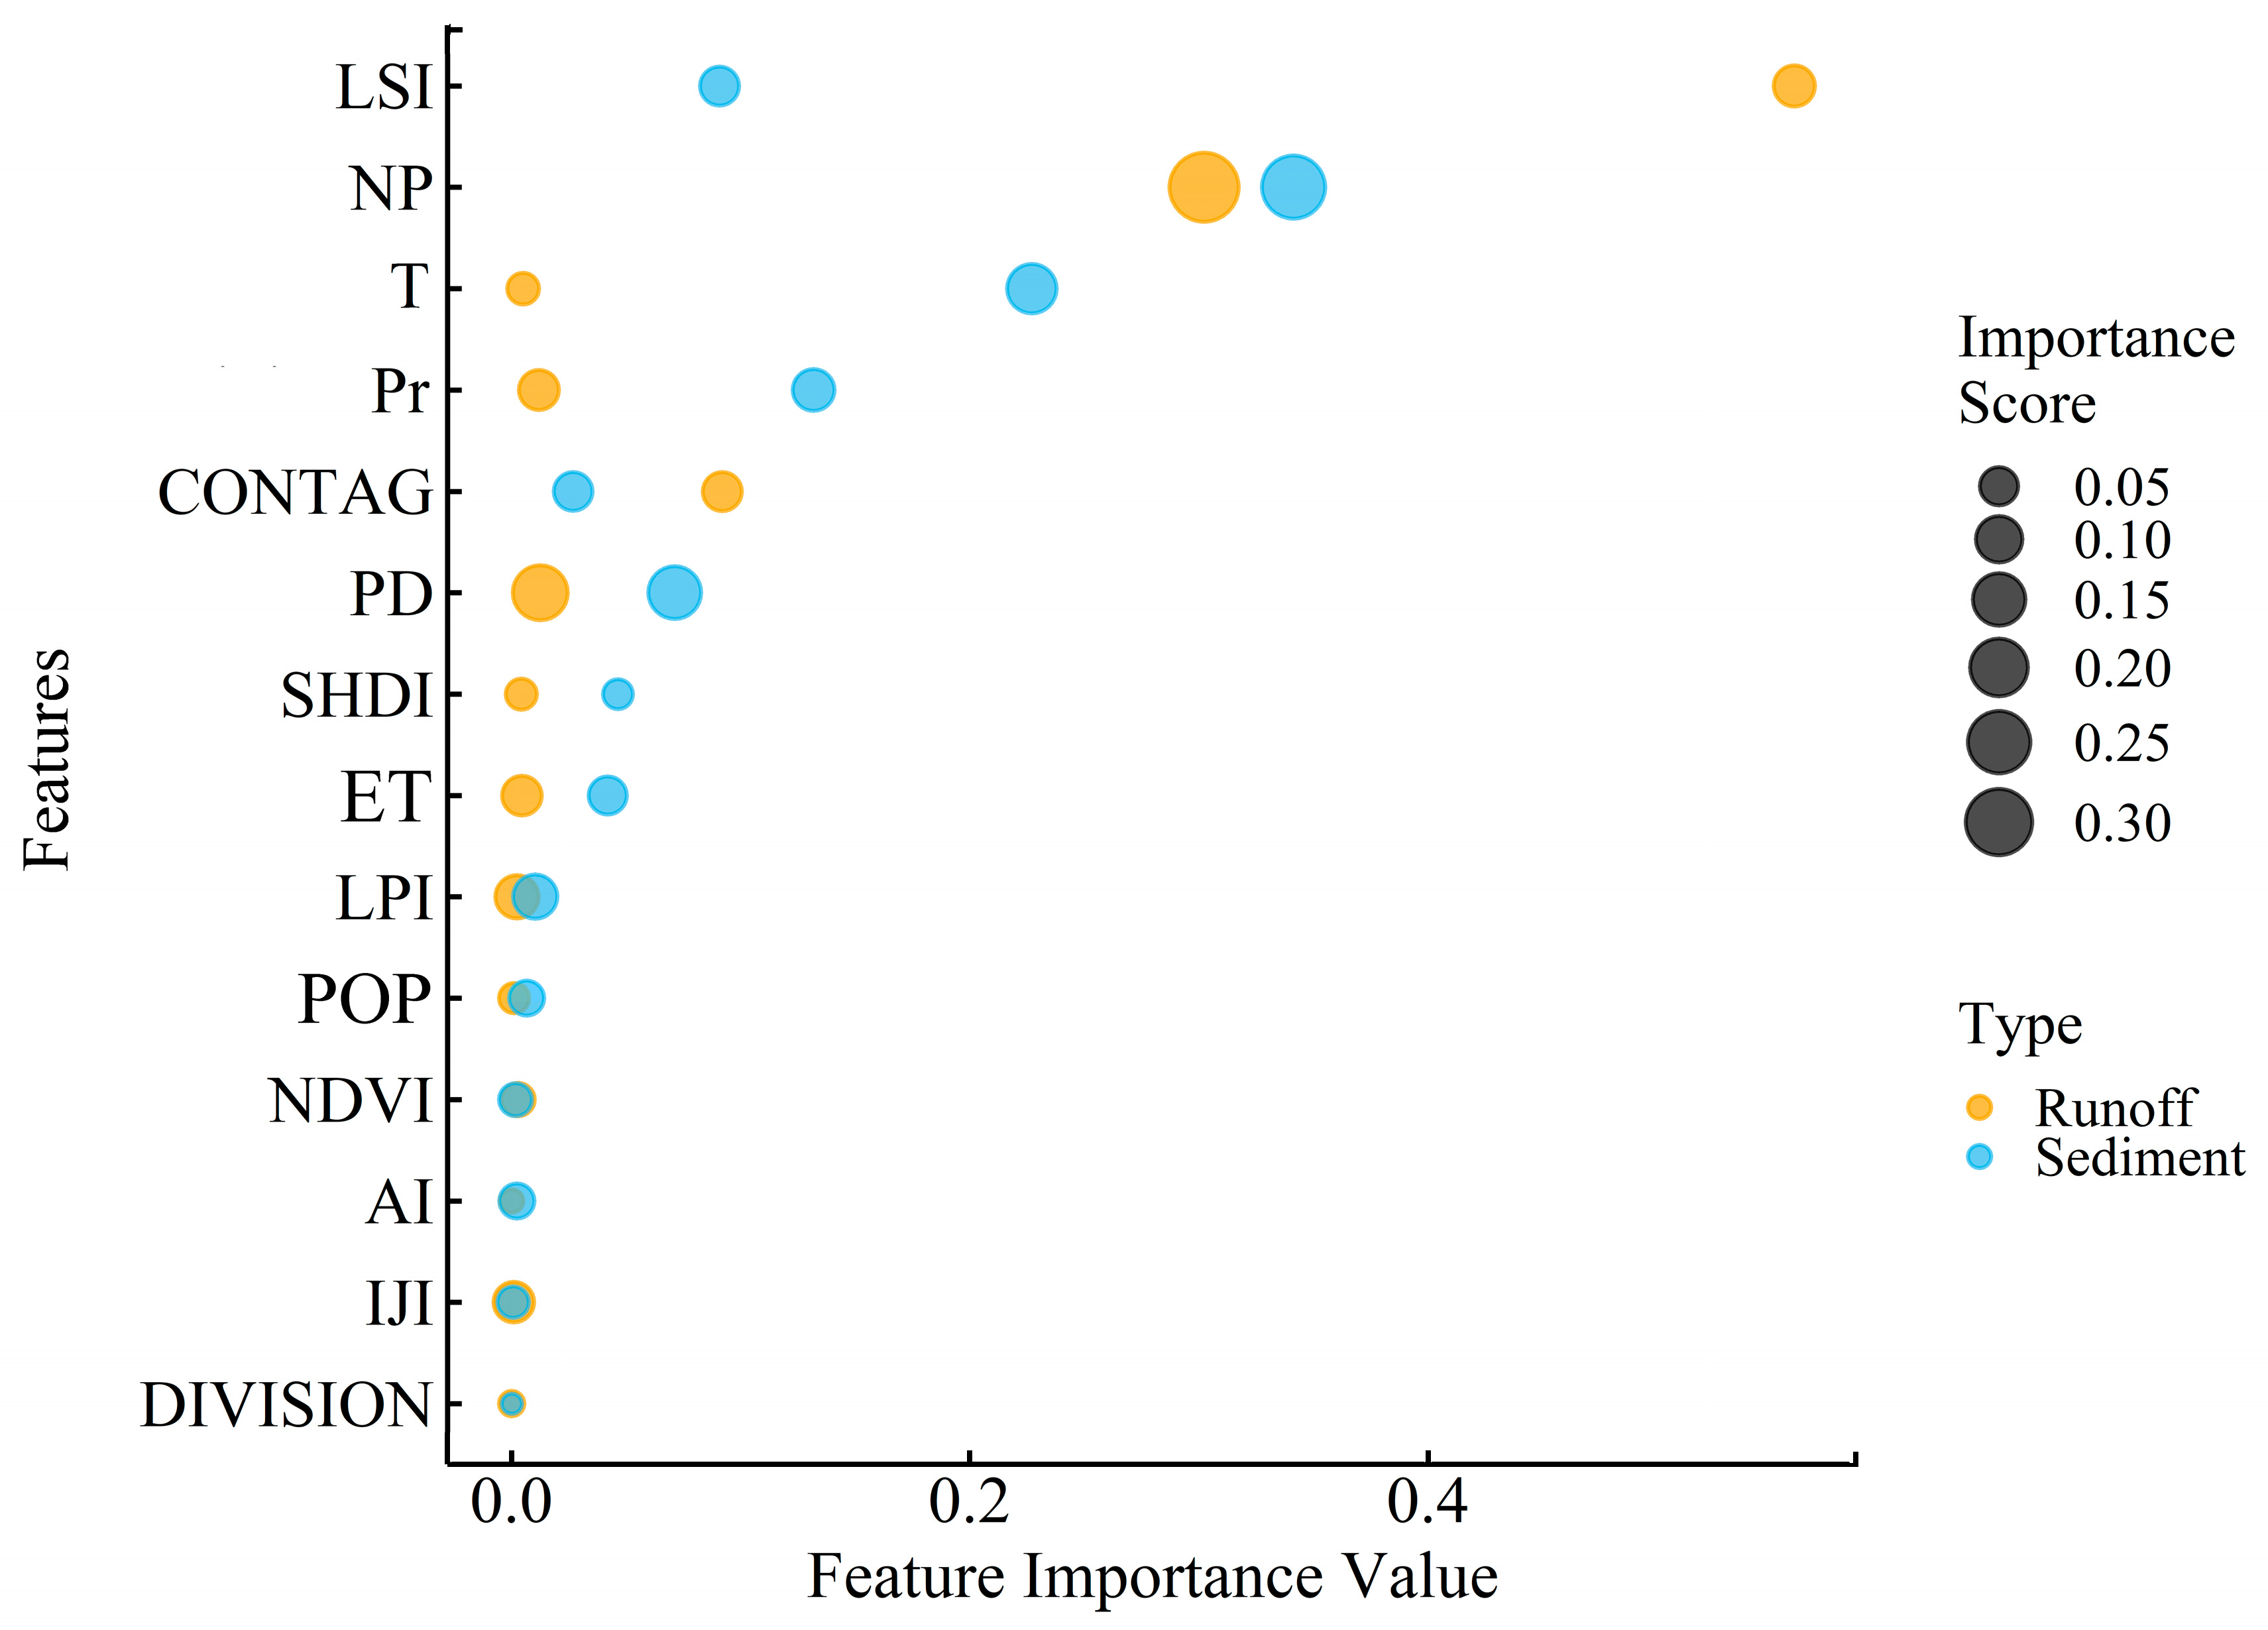
Based on the XGBoost model, the factors influencing runoff and sediment load in the Liujiaxia–Heishanxia reach of the upper Yellow River from 1996 to 2020 were evaluated. Both the runoff and sediment load prediction models achieved excellent performance, with coefficients of determination (R2) of 0.9998 and 0.9995, root mean square errors (RMSEs) of 0.0101 and 0.0197, and mean absolute errors (MAEs) of 0.0053 and 0.0102, respectively. These results indicate a high agreement between model simulations and observed values. The results (Figure 8) demonstrate that runoff dynamics are primarily governed by the LSI and landscape fragmentation metrics, whereas climatic factors play only a secondary regulatory role. Specifically, LSI exhibited the highest importance in modulating runoff variability, with a contribution value of approximately 0.45, underscoring its dominant role in explaining hydrological fluctuations across the study reach. CONTAG and PD displayed broad coverage but relatively low contribution values, implying that while these metrics exert widespread influences on the hydrological system, their individual explanatory power remains limited. Variables including AI, DIVISION, SHDI, and NDVI clustered in the lower-left quadrant of the plot, indicating negligible impacts on runoff; this may be ascribed to their indirect association with surface hydrological processes. T and Pr. contributed moderately to runoff generation, serving as supplementary drivers rather than dominant controls relative to landscape pattern metrics.
For sediment load dynamics, landscape fragmentation metrics (NP and LSI) and climatic factors (T and Pr.) exert synergistic control over sediment yield processes. NP demonstrated the most pronounced influence, with a consistently high contribution value of approximately 0.25, highlighting the strong regulatory effect of landscape fragmentation on sediment production and transport. Temperature and precipitation emerged as the most critical climatic drivers following NP, corroborating the coupled relationship among energy input, runoff erosivity, and sediment transport dynamics. ET and LSI also exhibited relatively high importance values, indicative of interactive effects between vegetation cover conditions and surface erosion resistance. POP, AI, and NDVI showed low importance but moderate coverage, suggesting that these variables exert diffuse yet weak influences on sediment load—likely linked to regional land use patterns and vegetation management practices.

4. Discussion

4.1. Specificity and Commonality of Water–Sediment Variations in the LJX–HSX Reach

The runoff–sediment load dynamics in the LJX–HSX reach are consistent with the overall evolutionary trajectory of the Yellow River Basin while exhibiting distinctive characteristics shaped by its unique geographical location and hydrological functions. A cross-comparison with domestic and international studies further elucidates the specificities of this reach relative to other river systems.
In terms of commonalities, the annual sediment load in the LJX–HSX reach decreased markedly over the period 1956–2020, which aligns with the dramatic sediment reduction observed in the middle and lower Yellow River. For instance, Wang and Sun (2021) reported an 85% decline in the basin-wide average sediment load during 2000–2018 compared with the baseline period 1919–1959 [25]. The widespread post-1970 sediment load reduction across all monitoring stations in the LJX–HSX reach is of a comparable magnitude, driven primarily by reservoir interception and large-scale soil conservation practices. This finding corroborates the conclusion of Gao et al. (2011), who identified anthropogenic activities as the dominant driver of sediment load attenuation in the middle Yellow River [49]. Furthermore, the long-term trend of runoff in the LJX–HSX reach—characterized by a fluctuating yet gradual decline—mirrors the pervasive pattern of “runoff reduction induced by reservoir construction and vegetation restoration” documented by Yang et al. (2022) in their analysis of 64 watersheds across mainland China, reflecting the universal impacts of human interventions on fluvial hydrological regulation [50].
Regarding unique characteristics, a prominent hydrological divergence emerges between the LJX–HSX reach and the Yellow River source region. Our observed results show that runoff in the LJX–HSX reach has presented an obvious recovery trend after 2014, especially a continuous upward tendency since 2016. By contrast, the Yellow River source region has experienced sustained runoff decline throughout recent decades, as documented by Ni et al. (2023), who attributed the persistent reduction of non-flood season runoff in the source area to altered underlying surface conditions [27]. This contrasting trend fully reveals the spatial heterogeneity of hydrological evolution across different segments of the upper Yellow River. Conversely, the runoff recovery detected in the LJX–HSX reach post-2016 is analogous to the findings of Miao et al. (2022) in the Ningxia reach, where a modest hydrological recovery emerged in the late 2010s as a result of upstream water supplementation and optimized reservoir operation strategies [29]. This divergence underscores the locational specificity of the LJX–HSX reach: its hydrological regime is sustained by inflows originating from the Tibetan Plateau and modulated by adaptive reservoir management practices. Additionally, the LJX–HSX reach exhibits striking spatial heterogeneity in sediment load, with the mean sediment load at Xiaheyan Station being 3.8 times higher than that at Xiaochuan Station. This spatial disparity shares mechanistic similarities with the tributary-driven sediment load variability reported by Zhou et al. (2025) in the Dongting Lake confluence area of the middle Yangtze River [51]. However, the spatial heterogeneity of sediment supply in the LJX–HSX reach is amplified by its alternating gorge–floodplain terrain. Notably, downstream stations subjected to intensive agricultural activities and substantial tributary inputs exhibit significantly greater sediment load stability compared with their upstream counterparts.
Moreover, the LJX–HSX reach is representative of large global rivers in that it features a moderate runoff variation coefficient coupled with a high sediment load variation coefficient. Li et al. (2020) noted that 40% of the world’s large rivers exhibit high sediment concentration variability, a pattern predominantly observed in rivers of developing countries impacted by intensive anthropogenic activities [4]. The variation characteristics of the LJX–HSX reach conform closely to this global trend. Nevertheless, its runoff variability is lower than that of major international rivers such as the Amazon and Mississippi, a discrepancy that highlights the strong regulatory capacity of the Liujiaxia Reservoir in mitigating flow fluctuations.

4.2. Synergistic Effects and Dominant Mechanisms of Influencing Factors

A key finding revealed by this study through XGBoost modeling and correlation analysis is that, during the period 1996–2020, landscape pattern factors exhibited greater explanatory power over runoff–sediment variations than traditional climatic factors. This provides a new perspective for understanding water–sediment mechanisms in highly anthropologically disturbed basins. We found that LSI and PD are the most important factors influencing runoff. LSI characterizes the complexity of landscape patch shape, while PD reflects landscape fragmentation. High LSI indicates irregular and complex patch geometries across the study area, which leads to an increase in overall patch edge density. The expanded patch edges break the continuity of surface soil and vegetation cover, reduce soil infiltration capacity, and consequently facilitate the development of overland flow. Landscape fragmentation reflected by a high PD further exacerbates this effect. Fragmented land cover generates numerous discontinuous flow pathways and lowers surface roughness, collectively promoting surface runoff generation and restraining subsurface infiltration. In contrast, while precipitation positively correlates with runoff, its relative importance in the model is lower. This suggests that the runoff generation efficiency of precipitation in the LJX–HSX reach is significantly modulated by the landscape structure of the underlying surface. Human activities such as urbanization, road networks, and fragmented vegetation restoration enhance the runoff generation capacity indirectly by increasing landscape fragmentation, partially offsetting the runoff reduction effect caused by reservoir impoundment.
The sediment transport process, however, exhibits more complex multi-factor synergistic control. NP emerged as the most important driving factor, again highlighting the strong promoting effect of landscape fragmentation on sediment yield. A fragmented landscape implies more edge areas where soil is more susceptible to erosion and provides convenient pathways for sediment to enter channels. Concurrently, the importance of climatic factors closely follows, indicating that the sediment transport process requires a power source, i.e., precipitation providing energy for erosion and transport. T might indirectly affect soil erodibility by influencing freeze–thaw cycles and vegetation growth. Furthermore, the coupling of landscape fragmentation and intense precipitation events can greatly exacerbate sediment production and transport. This aligns with our observation of enhanced correlation between NP and sediment load after transition years like 1996 and 2008.
The direct contributions of NDVI and POP in the model were relatively low, but this does not imply that they are unimportant. The significant negative correlation between NDVI and sediment load indicates that vegetation cover suppresses sediment by consolidating soil and slowing runoff. Its lower contribution might stem from uneven spatial distribution within the watershed or collinearity with other factors. Population density likely acts as a proxy for human activity intensity, driving changes in landscape patterns through alterations in land use, thereby indirectly influencing water–sediment processes.

4.3. Limitations and Future Research Directions

This study, for the first time, systematically clarifies the dominant role of landscape patterns in modulating runoff–sediment load relationship evolution within the LJX–HSX reach of the Yellow River via a suite of integrated methodologies. This work provides novel quantitative evidence for deciphering the driving mechanisms of hydrological–sedimentary dynamics in intensively managed river basins, representing the core innovation and primary contribution of the research. Nevertheless, this study has certain limitations, which also point to promising avenues for future research.
First, the spatial resolution of the employed land use datasets may be inadequate for accurately characterizing landscape alterations in key functional geomorphic units. In particular, during data processing, we upscaled the 30 m DEM and land use data to 1 km to enable integrated analysis. This upscaling operation inevitably smoothed or eliminated fine-scale features—including narrow gullies, small terraces, and riparian buffer strips—that are critical for hillslope hydrological processes and sediment connectivity. Consequently, the hydrological effects of these features may be underestimated in our results. This aggregation may affect the calculation of landscape metrics, particularly those sensitive to spatial resolution, such as edge density and patch complexity. Future studies should employ uniformly higher-resolution remote sensing data to more precisely quantify the relationship between landscape patterns and hydrological processes, especially in heterogeneous gorge-dominated river segments. Second, this study primarily establishes statistical correlations between variables, with the interpretation of underlying physical mechanisms remaining somewhat limited. For example, although we identified the high importance of LSI and NP, the precise pathways through which these indices influence runoff concentration times and soil erosion rates require further exploration. Distributed hydrological models or physics-based process models should be employed to translate statistical correlations into mechanistic hydrological causalities. Third, this study focuses on landscape pattern and climatic factors at the reach scale, while the impact of large hydraulic projects is not separately quantified and discussed. The Liujiaxia Reservoir acts as the most critical anthropogenic intervention in this reach, and its long-term operational regime changes and sediment trapping efficiency exert profound impacts on downstream runoff and sediment regimes. However, the current data-driven analysis cannot isolate the independent contribution of the reservoir, and relevant water–sediment regulation effects are not fully addressed in the attribution analysis due to the lack of complete high-frequency reservoir operation and sediment balance data across the entire study period.
Building on the findings and limitations of this study, future research could pursue three key directions. First, incorporate landscape pattern metrics as dynamic variables into coupled hydrological–sedimentary models to quantify their contributions to runoff–sediment load fluxes under multiple scenarios, thereby advancing beyond statistical associations to reveal inherent physical mechanisms. Second, simulate the potential future evolution of runoff–sediment load relationships in the LJX–HSX reach by integrating climate change projections and land use planning scenarios; this would provide a robust scientific basis for ecological impact assessments and optimized operational strategies for the proposed Heishanxia Hydraulic Project. Third, integrate the concept of landscape connectivity into basin-scale management frameworks. Future watershed management practices should not only prioritize vegetation coverage expansion but also emphasize the integrity and connectivity of landscape systems. Incorporating reducing landscape fragmentation as a core strategy into regional soil and water conservation and ecological restoration policy frameworks could facilitate the synergistic control of water and soil loss in the study area. In addition, follow-up research will combine process-based water–sediment models to quantitatively assess the hydrological and sediment effects of the Liujiaxia Reservoir, and integrate reservoir regulation characteristics into comprehensive hydrological attribution analysis.

5. Conclusions

In this study, we systematically analyzed the spatiotemporal evolution of runoff and sediment transport processes in the LJX–HSX reach of the upper Yellow River over the 65-year period from 1956 to 2020, while quantifying and interpreting the underlying driving mechanisms of observed changes. The key conclusions are summarized as follows:
(1) Over the past six-and-a-half decades, both streamflow and sediment load in the LJX–HSX reach exhibited statistically significant decreasing trends, with the magnitude of sediment load reduction being substantially more drastic than that of streamflow. This differential response indicates that the basin’s sediment transport system is far more sensitive to internal and external disturbances than its hydrological flow system. Using the M–K test and moving T-test, abrupt transition points in the runoff–sediment load series were identified around 1969, 1986, and 1996. These critical time points are closely related to regional climate fluctuations and changes in the intensity of human activities within the basin.
(2) Wavelet analysis indicates that the runoff–sediment processes in the LJX–HSX reach exhibit distinct interannual and interdecadal periodicities, which may be associated with large-scale climate oscillations. However, since the 1970s, continuously intensifying human activities have significantly weakened this natural periodic characteristic, particularly in the sediment load series, where the fluctuation amplitudes have been substantially suppressed. This finding suggests that the runoff–sediment regime of the LJX–HSX reach has transitioned from a naturally dominated system to one co-regulated by natural and anthropogenic factors. Notably, landscape pattern indices, serving as key proxies of human activities, have outperformed traditional climatic factors in explaining runoff–sediment variations.
(3) This study reveals that, during the period 1996–2020, landscape pattern metrics have replaced climatic factors as the dominant drivers governing runoff and sediment load variations in the Liujiaxia–Heishanxia reach. The results derived from the XGBoost model and correlation analysis show that runoff dynamics are dominated by the Landscape Shape Index (LSI) and Patch Density (PD): heightened landscape geometric complexity and fragmentation facilitate surface runoff generation and accelerate flow concentration. In contrast, sediment transport processes are subject to synergistic control by the Number of Patches (NP) and climatic factors. Specifically, a highly fragmented underlying surface provides abundant source material and preferential pathways for soil erosion, while precipitation supplies the hydrodynamic power required for soil particle detachment and downstream sediment conveyance.
(4) The results of this study indicate that landscape pattern optimization is a key measure for regulating the runoff–sediment relationship in the LJX–HSX reach of the upper Yellow River. Since landscape pattern indices exhibit significantly stronger explanatory power for runoff–sediment variations in the study area than traditional climatic factors, and landscape fragmentation represents the core driver controlling runoff–sediment processes, future soil and water conservation and ecological restoration should not merely pursue increased vegetation coverage as a sole objective, but should prioritize enhancing landscape integrity and connectivity and reducing landscape fragmentation.

Author Contributions

Conceptualization, Z.W., X.W. and J.W.; methodology, Z.W.; software, X.W.; validation, C.C., Y.P. and Y.W.; formal analysis, X.W.; investigation, C.C.; resources, J.W.; data curation, Y.W.; writing—original draft preparation, Z.W. and X.W.; writing—review and editing, X.W. and J.W.; visualization, Y.P. and Y.W.; supervision, J.W.; project administration, J.W.; funding acquisition, J.W. All authors have read and agreed to the published version of the manuscript.

Funding

This research was funded by the Scientific Research Project of the Water Resources Utilization Center of the Shule River Basin in Gansu Province, grant number SLH/KYXM-2025-01; the Study on the Runoff–Sediment Load Relationship and Reservoir Sedimentation Characteristics in the Heishanxia Section of the Yellow River Basin, grant number BJZG-ZC25034-001; the National Natural Science Foundation of China, grant number 42330512; and the Gansu Provincial Water Conservancy Scientific Experimental Research and Technology Promotion Program, grant number 26GSLK029. The APC was funded by the Gansu Provincial Water Conservancy Scientific Experimental Research and Technology Promotion Program.

Data Availability Statement

The original contributions presented in this study are included in the article material. Further inquiries can be directed to the corresponding authors.

Acknowledgments

The authors would like to thank ASTER GDEM, the Resource and Environment Science and Data Center, the Chinese Academy of Sciences, the National Cryosphere Desert Data Center, the National Catalog Service for Geographic Information, and the National Earth System Science Data Center for providing the data and the editors and anonymous reviewers for their valuable feedback, which has improved the quality of this article.

Conflicts of Interest

The authors declare no conflicts of interest.

Abbreviations

The following abbreviations are used in this manuscript:
HWCPHeishanxia Water Conservancy Project
LJX–HSXLiujiaxia–Heishanxia
M–KMann–Kendall
NPNumber of Patches
PDPatch Density
LPILargest Patch Index
LSILandscape Shape Index
CONTAGContagion Index
Pr.Precipitation
TTemperature
ETEvapotranspiration
SHDIShannon’s Diversity Index
AIAggregation Index
NDVINormalized Difference Vegetation Index
Elev.Elevation
POPPopulation Density

References

  1. Guo, W.; Li, Y.; Wang, H.; Cha, H. Temporal variations and influencing factors of river runoff and sediment regimes in the Yangtze River, China. Desalination Water Treat. 2020, 174, 258–270. [Google Scholar] [CrossRef]
  2. Dethier, E.N.; Renshaw, C.E.; Magilligan, F.J. Rapid changes to global river suspended sediment flux by humans. Science 2022, 376, 1447–1452. [Google Scholar] [CrossRef] [PubMed]
  3. Owens, P.N. Soil erosion and sediment dynamics in the Anthropocene: A review of human impacts during a period of rapid global environmental change. J. Soils Sediments 2020, 20, 4115–4143. [Google Scholar] [CrossRef]
  4. Li, L.; Ni, J.; Chang, F.; Yue, Y.; Frolova, N.; Magritsky, D.; Borthwick, A.G.L.; Ciais, P.; Wang, Y.; Zheng, C.; et al. Global trends in water and sediment fluxes of the world’s large rivers. Sci. Bull. 2020, 65, 62–69. [Google Scholar] [CrossRef] [PubMed]
  5. Li, T.; Wang, S.; Liu, Y.; Fu, B.; Zhao, W. Driving forces and their contribution to the recent decrease in sediment flux to ocean of major rivers in China. Sci. Total Environ. 2018, 634, 534–541. [Google Scholar] [CrossRef] [PubMed]
  6. Liu, C.; He, Y.; Li, Z.; Chen, J.; Li, Z. Key drivers of changes in the sediment loads of Chinese rivers discharging to the oceans. Int. J. Sediment Res. 2021, 36, 747–755. [Google Scholar] [CrossRef]
  7. Narayanan, A.; Cohen, S.; Gardner, J.R. Riverine sediment response to deforestation in the Amazon basin. Earth Surf. Dynam. 2024, 12, 581–599. [Google Scholar] [CrossRef]
  8. Marengo, J.A.; Souza, C.M.; Thonicke, K.; Burton, C.; Halladay, K.; Betts, R.A.; Alves, L.M.; Soares, W.R. Changes in Climate and Land Use Over the Amazon Region: Current and Future Variability and Trends. Front. Earth Sci. 2018, 6, 228. [Google Scholar] [CrossRef]
  9. Kemp, G.P.; Day, J.W.; Freeman, A.M. Restoring the sustainability of the Mississippi River Delta. Ecol. Eng. 2014, 65, 131–146. [Google Scholar] [CrossRef]
  10. Day, J.W.; Hunter, R.; Kemp, G.P.; Moerschbaecher, M.; Brantley, C.G. The “Problem” of New Orleans and Diminishing Sustainability of Mississippi River Management—Future Options. Water 2021, 13, 813. [Google Scholar] [CrossRef]
  11. Bussi, G.; Darby, S.E.; Whitehead, P.G.; Jin, L.; Dadson, S.J.; Voepel, H.E.; Vasilopoulos, G.; Hackney, C.R.; Hutton, C.; Berchoux, T.; et al. Impact of dams and climate change on suspended sediment flux to the Mekong delta. Sci. Total Environ. 2021, 755, 142468. [Google Scholar] [CrossRef] [PubMed]
  12. Chow, J.; Keleman-Saxena, A.; Saxena, A.; Jia Bi, E. Chapter 4: Climate and cultivation in the Ganges-Brahmaputra-Meghna river delta. In Handbook of Behavioral Economics and Climate Change; Edward Elgar Publishing: Cheltenham, UK, 2022; pp. 73–97. [Google Scholar]
  13. Yang, H.; Mei, T.; Chen, X. Variation of Satellite-Based Suspended Sediment Concentration in the Ganges–Brahmaputra Estuary from 1990 to 2020. Remote Sens. 2024, 16, 396. [Google Scholar] [CrossRef]
  14. Polyakov, V.O.; Nichols, M.H.; McClaran, M.P.; Nearing, M.A. Effect of check dams on runoff, sediment yield, and retention on small semiarid watersheds. J. Soil Water Conserv. 2014, 69, 414–421. [Google Scholar] [CrossRef]
  15. Shi, P.; Zhang, Y.; Ren, Z.; Yu, Y.; Li, P.; Gong, J. Land-use changes and check dams reducing runoff and sediment yield on the Loess Plateau of China. Sci. Total Environ. 2019, 664, 984–994. [Google Scholar] [CrossRef] [PubMed]
  16. Bui, T.T.P.; Kantoush, S.; Kawamura, A.; Du, T.L.T.; Bui, N.T.; Capell, R.; Nguyen, N.T.; Du Bui, D.; Saber, M.; Tetsuya, S.; et al. Reservoir operation impacts on streamflow and sediment dynamics in the transboundary river basin, Vietnam. Hydrol. Process. 2023, 37, e14994. [Google Scholar] [CrossRef]
  17. Gao, H.; Wu, Z.; Jia, L.; Pang, G. Vegetation change and its influence on runoff and sediment in different landform units, Wei River, China. Ecol. Eng. 2019, 141, 105609. [Google Scholar] [CrossRef]
  18. Murphy, J.C. Changing suspended sediment in United States rivers and streams: Linking sediment trends to changes in land use/cover, hydrology and climate. Hydrol. Earth Syst. Sci. 2020, 24, 991–1010. [Google Scholar] [CrossRef]
  19. Bartley, R.; Poesen, J.; Wilkinson, S.; Vanmaercke, M. A review of the magnitude and response times for sediment yield reductions following the rehabilitation of gullied landscapes. Earth Surf. Process. Landf. 2020, 45, 3250–3279. [Google Scholar] [CrossRef]
  20. Wang, S.; Fu, B.; Liang, W.; Liu, Y.; Wang, Y. Driving forces of changes in the water and sediment relationship in the Yellow River. Sci. Total Environ. 2017, 576, 453–461. [Google Scholar] [CrossRef] [PubMed]
  21. Liu, Y.; Song, H.; An, Z.; Sun, C.; Trouet, V.; Cai, Q.; Liu, R.; Leavitt, S.W.; Song, Y.; Li, Q.; et al. Recent anthropogenic curtailing of Yellow River runoff and sediment load is unprecedented over the past 500 y. Proc. Natl. Acad. Sci. USA 2020, 117, 18251–18257. [Google Scholar] [CrossRef] [PubMed]
  22. Ge, J.; Hu, Y. The Yellow River Civilization and the Yangtze River Civilization. In A Historical Survey of the Yellow River and the River Civilizations; Ge, J., Hu, Y., Eds.; Springer: Singapore, 2021; pp. 49–84. [Google Scholar]
  23. Wang, S.; Song, S.; Zhang, H.; Yu, L.; Jiao, C.; Li, C.; Wu, X.; Zhao, W.; Best, J.; Roberts, P.; et al. Anthropogenic impacts on the Yellow River Basin. Nat. Rev. Earth Environ. 2025, 6, 656–671. [Google Scholar] [CrossRef]
  24. Hao, L.; Jiang, E.; Qu, B.; Liu, C.; Jia, J.; Liu, Y.; Li, J. Integrated Allocation of Water-Sediment Resources and Its Impacts on Socio-Economic Development and Ecological Systems in the Yellow River Basin. Water 2025, 17, 2821. [Google Scholar] [CrossRef]
  25. Wang, H.; Sun, F. Variability of annual sediment load and runoff in the Yellow River for the last 100 years (1919–2018). Sci. Total Environ. 2021, 758, 143715. [Google Scholar] [CrossRef] [PubMed]
  26. Xu, J.; Jiang, X.; Sun, H.; Xu, H.; Zhong, X.; Liu, B.; Li, L. Driving forces of nature and human activities on water and sediment changes in the middle reaches of the Yellow River in the past 100 years. J. Soils Sediments 2021, 21, 2450–2464. [Google Scholar] [CrossRef]
  27. Ni, Y.; Lv, X.; Yu, Z.; Wang, J.; Ma, L.; Zhang, Q. Intra-annual variation in the attribution of runoff evolution in the Yellow River source area. CATENA 2023, 225, 107032. [Google Scholar] [CrossRef]
  28. Xu, R.; Qiu, D.; Gao, P.; Mu, X. Water and sediment yield in the source region of the Yellow River, northeastern Tibetan Plateau: Historical pattern, future evolution, and attribution analysis. CATENA 2025, 258, 109280. [Google Scholar] [CrossRef]
  29. Miao, J.; Zhang, X.; Zhao, Y.; Wei, T.; Yang, Z.; Li, P.; Zhang, Y.; Chen, Y.; Wang, Y. Evolution patterns and spatial sources of water and sediment discharge over the last 70 years in the Yellow River, China: A case study in the Ningxia Reach. Sci. Total Environ. 2022, 838, 155952. [Google Scholar] [CrossRef] [PubMed]
  30. Xu, Z.; Zhang, S.; Yang, X. Water and sediment yield response to extreme rainfall events in a complex large river basin: A case study of the Yellow River Basin, China. J. Hydrol. 2021, 597, 126183. [Google Scholar] [CrossRef]
  31. Yin, S.; Gao, G.; Ran, L.; Li, D.; Lu, X.; Fu, B. Extreme streamflow and sediment load changes in the Yellow River Basin: Impacts of climate change and human activities. J. Hydrol. 2023, 619, 129372. [Google Scholar] [CrossRef]
  32. Wang, S.; Wang, X. Changes in Water and Sediment Processes in the Yellow River and Their Responses to Ecological Protection during the Last Six Decades. Water 2023, 15, 2285. [Google Scholar] [CrossRef]
  33. Güçlü, Y.S. Improved visualization for trend analysis by comparing with classical Mann-Kendall test and ITA. J. Hydrol. 2020, 584, 124674. [Google Scholar] [CrossRef]
  34. Ashraf, M.S.; Ahmad, I.; Khan, N.M.; Zhang, F.; Bilal, A.; Guo, J. Streamflow Variations in Monthly, Seasonal, Annual and Extreme Values Using Mann-Kendall, Spearmen’s Rho and Innovative Trend Analysis. Water Resour. Manag. 2021, 35, 243–261. [Google Scholar] [CrossRef]
  35. Du, R.; Shang, F.; Ma, N. Automatic mutation feature identification from well logging curves based on sliding t test algorithm. Clust. Comput. 2019, 22, 14193–14200. [Google Scholar] [CrossRef]
  36. Juez, C.; Garijo, N.; Nadal-Romero, E.; Vicente-Serrano, S.M. Wavelet analysis of hydro-climatic time-series and vegetation trends of the Upper Aragón catchment (Central Spanish Pyrenees). J. Hydrol. 2022, 614, 128584. [Google Scholar] [CrossRef]
  37. Partal, T. Wavelet based periodical analysis of the precipitation data of the Mediterranean Region and its relation to atmospheric indices. Model. Earth Syst. Environ. 2018, 4, 1309–1318. [Google Scholar] [CrossRef]
  38. Guo, T.; Zhang, T.; Lim, E.; López-Benítez, M.; Ma, F.; Yu, L. A Review of Wavelet Analysis and Its Applications: Challenges and Opportunities. IEEE Access 2022, 10, 58869–58903. [Google Scholar] [CrossRef]
  39. Abebe, S.A.; Qin, T.; Zhang, X.; Yan, D. Wavelet transform-based trend analysis of streamflow and precipitation in Upper Blue Nile River basin. J. Hydrol. Reg. Stud. 2022, 44, 101251. [Google Scholar] [CrossRef]
  40. Boughdadi, S.; Ait Brahim, Y.; El Alaoui El Fels, A.; Saidi, M.E. Rainfall Variability and Teleconnections with Large-Scale Atmospheric Circulation Patterns in West-Central Morocco. Atmosphere 2023, 14, 1293. [Google Scholar] [CrossRef]
  41. Rashid, M.M.; Beecham, S.; Chowdhury, R.K. Assessment of trends in point rainfall using Continuous Wavelet Transforms. Adv. Water Resour. 2015, 82, 1–15. [Google Scholar] [CrossRef]
  42. Li, Q.; He, P.; He, Y.; Han, X.; Zeng, T.; Lu, G.; Wang, H. Investigation to the relation between meteorological drought and hydrological drought in the upper Shaying River Basin using wavelet analysis. Atmos. Res. 2020, 234, 104743. [Google Scholar] [CrossRef]
  43. Dray, S.; Pélissier, R.; Couteron, P.; Fortin, M.J.; Legendre, P.; Peres-Neto, P.R.; Bellier, E.; Bivand, R.; Blanchet, F.G.; De Cáceres, M.; et al. Community ecology in the age of multivariate multiscale spatial analysis. Ecol. Monogr. 2012, 82, 257–275. [Google Scholar] [CrossRef]
  44. Quilodrán, C.S.; Currat, M.; Montoya-Burgos, J.I. Benchmarking the Mantel test and derived methods for testing association between distance matrices. Mol. Ecol. Resour. 2025, 25, e13898. [Google Scholar] [CrossRef] [PubMed]
  45. Basha, L.; Shyti, B.; Bekteshi, L. Evaluating the performance of machine learning approaches in predicting Albanian Shkumbini River’s waters using water quality index model. J. Environ. Eng. Landsc. Manag. 2024, 32, 117–127. [Google Scholar] [CrossRef]
  46. Hameed, M.M.; Masood, A.; Hamid, A.; Elbeltagi, A.; Razali, S.F.M.; Salem, A. Forecasting monthly runoff in a glacierized catchment: A comparison of extreme gradient boosting (XGBoost) and deep learning models. PLoS ONE 2025, 20, e0321008. [Google Scholar] [CrossRef] [PubMed]
  47. Niu, K.; Hu, Q.; Wang, Y.; Yang, H.; Liang, C.; Wang, L.; Li, L.; Li, X.; Du, Y.; Li, C. Analysis on the Variation of Hydro-Meteorological Variables in the Yongding River Mountain Area Driven by Multiple Factors. Remote Sens. 2021, 13, 3199. [Google Scholar] [CrossRef]
  48. Brocca, L.; Tullo, T.; Melone, F.; Moramarco, T.; Morbidelli, R. Catchment scale soil moisture spatial–temporal variability. J. Hydrol. 2012, 422–423, 63–75. [Google Scholar] [CrossRef]
  49. Gao, P.; Mu, X.M.; Wang, F.; Li, R. Changes in streamflow and sediment discharge and the response to human activities in the middle reaches of the Yellow River. Hydrol. Earth Syst. Sci. 2011, 15, 1–10. [Google Scholar] [CrossRef]
  50. Yang, L.; Zhao, G.; Tian, P.; Mu, X.; Tian, X.; Feng, J.; Bai, Y. Runoff changes in the major river basins of China and their responses to potential driving forces. J. Hydrol. 2022, 607, 127536. [Google Scholar] [CrossRef]
  51. Zhou, W.; Sun, Z.; Yang, Z.; Guo, G. Confluence Effects of Dongting Lake in the Middle Yangtze River: Discontinuous Fluvial Processes and Their Driving Mechanisms. Water Resour. Res. 2025, 61, e2024WR039030. [Google Scholar] [CrossRef]
Figure 1. Overview of the study area.
Water 18 01490 g001
Figure 2. Interannual variation trend of annual runoff and sediment load in LJX–HSX section. (a) Trend of annual runoff variation. (b) Trend of annual sediment load variation.
Water 18 01490 g002
Figure 3. M–K test curves for annual runoff (left) and sediment load (right) in the LJX–HSX section.
Water 18 01490 g003
Figure 4. Moving T-test for annual runoff and sediment load in the LJX–HSX section.
Water 18 01490 g004
Figure 5. Real part contour lines and wavelet variances of the wavelet coefficients for runoff at each hydrological station.
Water 18 01490 g005
Figure 6. Real part contour lines and wavelet variances of the wavelet coefficients for sediment load at each hydrological station.
Water 18 01490 g006
Figure 7. Correlation analysis of runoff, sediment load, and influencing factors in 1996, 2008, and 2020. Note: The color gradient in the heatmap represents Pearson’s correlation coefficient, and symbols *, **, and *** denote statistical significance at p < 0.05, p < 0.01 and p < 0.001, respectively. Lines connecting landscape/hydro-meteorological factors with runoff and sediment load represent Mantel test results, where line color indicates Mantel’s p-value and line thickness denotes Mantel’s r coefficient.
Water 18 01490 g007
Figure 8. Influencing factors of runoff and sediment load.
Water 18 01490 g008
Table 1. Data sources and characteristics.
NameTypeSpatiotemporal
Resolution, Period
Data SourceWebsite
DEMRasterStatic, 30 mASTER GDEMhttp://www.gscloud.cn (accessed on 12 June 2026)
Land useRasterAnnual, 30 m,
1985, 1990–2020
Resource and Environment Science and Data Center, Chinese Academy of Scienceshttps://www.resdc.cn (accessed on 12 June 2026)
NDVIRaster16 d, 1 km,
1996–2020
National Cryosphere Desert Data Centerhttps://www.escience.org.cn/metadata
(accessed on 12 June 2026)
POPRasterAnnual, 1 km,
1996–2020
National Tibetan Plateau Data Center; National Earth System Science Data Centerhttps://www.tpdc.ac.cn; (accessed on 12 June 2026)
https://www.geodata.cn/data/index.html (accessed on 12 June 2026)
Meteorological dataRasterAnnual, 1 km,
1996–2020
Resource and Environment Science and Data Center, Chinese Academy of Scienceshttps://www.resdc.cn (accessed on 12 June 2026)
Vector dataVector-National Catalog Service for
Geographic Information
https://www.webmap.cn (accessed on 12 June 2026)
Runoff and sediment loadObserved
hydrological data
Annual, 1956–2023National Earth System Science Data Centerhttp://www.geodata.cn
(accessed on 12 June 2026)
Table 2. Descriptive statistical analysis of annual runoff and sediment transport in LJX–HSX section.
NameRunoff/108 m3Sediment Load/108 t
MaximumMinimumAverageCVMaximumMinimumAverageCV
Xiaochuan460.00162.30268.380.2521.970.010.281.379
Shangquan458.72150.00269.060.2512.000.010.291.307
Lanzhou549.00215.00312.810.2392.650.080.511.089
Anningdu522.00205.00308.460.2484.300.171.040.887
Xiaheyan519.13195.21302.680.2584.390.181.070.843
Table 3. Land use transfer matrix from 1996 to 2008.
Land Use TypeArea in 1996 (km2)Area in 2008 (km2)1996–2008 Transfer Area (km2)Change Rate
1996–2008 (%)
Farmland10,952.8410,581.56−371.2761−3.39
Forest3608.363729.89121.53063.37
Grassland56,387.0156,405.2518.23670.03
Water297.05391.9594.905931.95
Unused land1016.531074.8458.31645.74
Built-up land145.67223.9578.286553.74
Disclaimer/Publisher’s Note: The statements, opinions and data contained in all publications are solely those of the individual author(s) and contributor(s) and not of MDPI and/or the editor(s). MDPI and/or the editor(s) disclaim responsibility for any injury to people or property resulting from any ideas, methods, instructions or products referred to in the content.