Article

Variation and Influencing Factors of Water Alkalinity in Estuary-Bay Waters of Zhanjiang Bay, China


1
College of Chemistry and Environmental Science, Guangdong Ocean University, Zhanjiang 524088, China
2
Second Institute of Oceanography, Ministry of Natural Resources, Hangzhou 310012, China
3
Analytical and Testing Center, Guangdong Ocean University, Zhanjiang 524088, China
*
Authors to whom correspondence should be addressed.
Water 2026, 18(12), 1453; https://doi.org/10.3390/w18121453
Submission received: 21 April 2026 / Revised: 4 June 2026 / Accepted: 6 June 2026 / Published: 12 June 2026
(This article belongs to the Section Oceans and Coastal Zones)

Abstract

This study investigated the spatial distribution, seasonal variation, and drivers of surface seawater alkalinity (Alk) in Zhanjiang Bay (ZJB) using high-frequency seasonal sampling in the summers and winters of 2023. Surface Alk ranged from 525.3 to 2213.3 μmol·L−1, with mean values of 1373.1 ± 420.9 μmol·L−1 (summer, n = 28) and 1612.3 ± 343.7 μmol·L−1 (winter, n = 20). Spatially, Alk increased progressively from the estuary to the inner bay and further to the bay mouth, reflecting a typical dilution gradient. Correlation analyses showed that summer Alk was positively correlated with salinity (ρ = 0.706, p < 0.001), indicating that salinity changes associated with conservative mixing were a dominant control, whereas the weaker winter correlation (ρ = 0.473, p < 0.001) suggested that biological processes may play a more important role. Tidal forcing was significantly associated with diurnal Alk variations, particularly in the estuary and inner bay. In the estuary, high Alk occurred during high tide, consistent with tidal mixing; in the inner bay, elevated Alk was observed during low tide, suggesting a possible tidal pumping effect. These findings provide baseline data on Alk dynamics in a subtropical estuarine bay and contribute to understanding the carbonate system and buffering capacity in similar coastal systems. However, because measurements of dissolved inorganic carbon and pCO2 were unavailable, a quantitative assessment of carbon sink capacity requires further investigation.

1. Introduction

Since the Industrial Revolution, advances in science and technology, together with rapid urbanisation, have released large amounts of greenhouse gases, such as carbon dioxide (CO2), into the atmosphere [1], resulting in global warming [2] and more frequent extreme weather events [3] on Earth. The ocean is Earth’s most important carbon sink and reservoir, absorbing about one-third of anthropogenic CO2 emissions and playing a key role in mitigating the rise in atmospheric CO2 [4]. However, the ocean’s excess uptake of CO2 alters the marine carbonate system [5] and exacerbates ocean acidification [6,7]. Therefore, understanding the marine carbonate system and the mechanisms of the ocean’s carbon cycle has become a critical focus in the frontier field of marine science.
Alkalinity (Alk) quantifies the proton deficit of seawater relative to a chosen reference state. It is a fundamental measure of seawater’s buffer capacity and a master variable governing the marine carbonate system [8]. Changes in Alk can reflect shifts in the water’s acid–base equilibrium, carbonate ion input in local coastal areas [9], and ecosystem status [10]. These processes also control the pH of coastal waters [11] and the release and uptake of carbon from the coastal carbon pool [12,13,14]. Generally, the principle of acid titration to the alkalinity equivalence point (pH ≈ 4.3) [15] and open-cell potentiometric methods [16] are used for Alk measurement. In most situations, Alk is conservative during the physical mixing of seawater and freshwater, so understanding changes in seawater Alk is important for elucidating the evolution of the seawater carbonate system [17,18,19], for characterising the mechanism of seawater acidification [20], and for assessing the inorganic carbon sink in the ocean [21].
Compared with open-sea areas, coastal and estuarine areas are transfer channels [22] for the exchange of various materials between land and sea [23] and are important regions of human economic activity. These areas exhibit several characteristics, including high carbon dioxide flux at the water–air interface [24], complex carbonate-chemistry kinetics [25], and rapid production or decomposition of organic matter [26]. These distinctive features make the mechanism of carbonate system change in coastal waters intricate, resulting in controversy [27] over whether CO2 was buried [28] or re-released into the atmosphere [29]. As a relatively conservative parameter in carbonate systems, the seasonal variation in Alk in coastal areas is controlled by river–sea mixing processes [30] and influenced by coastal weathering products derived from river input. Seasonal variations in precipitation and evaporation affect water salinity and, in turn, lead to changes in Alk [31], as reflected in studies of the Amazon Basin [32] and the Pearl River Basin [33]. In the meantime, biogeochemical processes such as calcification, oxygen respiration, photosynthetic production, organic matter mineralisation, and nitrification–denitrification will also affect seawater Alk and salinity gradients, which no longer show a good linear relationship [15,34], potentially becoming the dominant factor in Alk change [35]. Similar results were found in the coastal waters of Narragansett Bay [34] and Tong’an Bay in Xiamen, China [36].
Zhanjiang Bay (ZJB) is a prominent natural harbour in southern China. Rapid urban development, frequent industrial activity, and large-scale mariculture result in substantial wastewater and sewage discharge into the bay [37], triggering eutrophication [38] and frequent phytoplankton blooms in summer [39], while also posing a potential risk of heavy metal pollution [40]. The Suixi River estuary at the top of ZJB is an excellent oyster base in Zhanjiang, with an oyster culture area of 8.53 × 10⁶ m2 and an annual output of up to 1.1 × 10⁶ tons [41]. During oyster growth, a large amount of carbonate ions in the water can be incorporated into their calcareous shells. Meanwhile, organic waste is excreted, resulting in a decrease in pH in water bodies [42]. If calcification material dissolves, the water’s alkalinity will increase. With rising CO2 emissions from industry and worsening water eutrophication, the likelihood of seawater acidification will increase [43], significantly impacting oyster farming [44] and the capacity of marine ecosystem services [45]. However, the specific processes, key influencing factors, and mechanisms underlying the adverse effects and threats mentioned above remain unclear. Therefore, this study aims to (1) characterise the spatial and temporal distribution of Alk in ZJB, (2) identify the factors causing changes in Alk in ZJB, and (3) elucidate the change process and the influence mechanism of the bay carbon sink from estuary to bay and near-shore sea areas.

2. Materials and Methods

2.1. Study Area

Zhanjiang Bay lies in the northeast of the Leizhou Peninsula in Guangdong Province, borders the South China Sea, and is surrounded by numerous islands and the densely populated city of Zhanjiang [41]. It is a typical semi-closed bay, characterised by a subtropical monsoon climate with an average annual temperature of 23.8 °C [46]. There is a marked difference in precipitation between summer (May to September) and winter (December to February). Summer precipitation accounts for more than 80% of annual rainfall, and the bay is susceptible to extreme weather events, including typhoons [37]. The bay covers about 490 km2, with a maximum depth of 50 metres [46]. A relatively large number of rivers and sewage outfalls are located along the coastline. Affected by the Donghai dam barrier in the southwest of the bay, the bay’s water is connected to the South China Sea only through a narrow channel of less than 2 km at the southeast end of the bay mouth [46]. Hydrodynamic conditions in the bay are generally weak. The bay is mainly affected by the discharge of the Suixi River (annual average flow of 10.4 × 10⁸ m3) in the northern part of the bay [47], and by seawater from the western Guangdong coastal current, which influences the hydrodynamic environment outside the bay [48]. The tidal regime in the ZJB is irregular semidiurnal; during the flood tide, rising seawater flows from outside the bay into the bay and up to the upper estuary area. When the tide ebbs, the top-bay water flows southeast out of the bay; the average tide height is 2.17 m, and the highest tidal level can reach 5.45 m. The ebb speed is generally higher than the flood speed [40].

2.2. Sample Collection and Determination

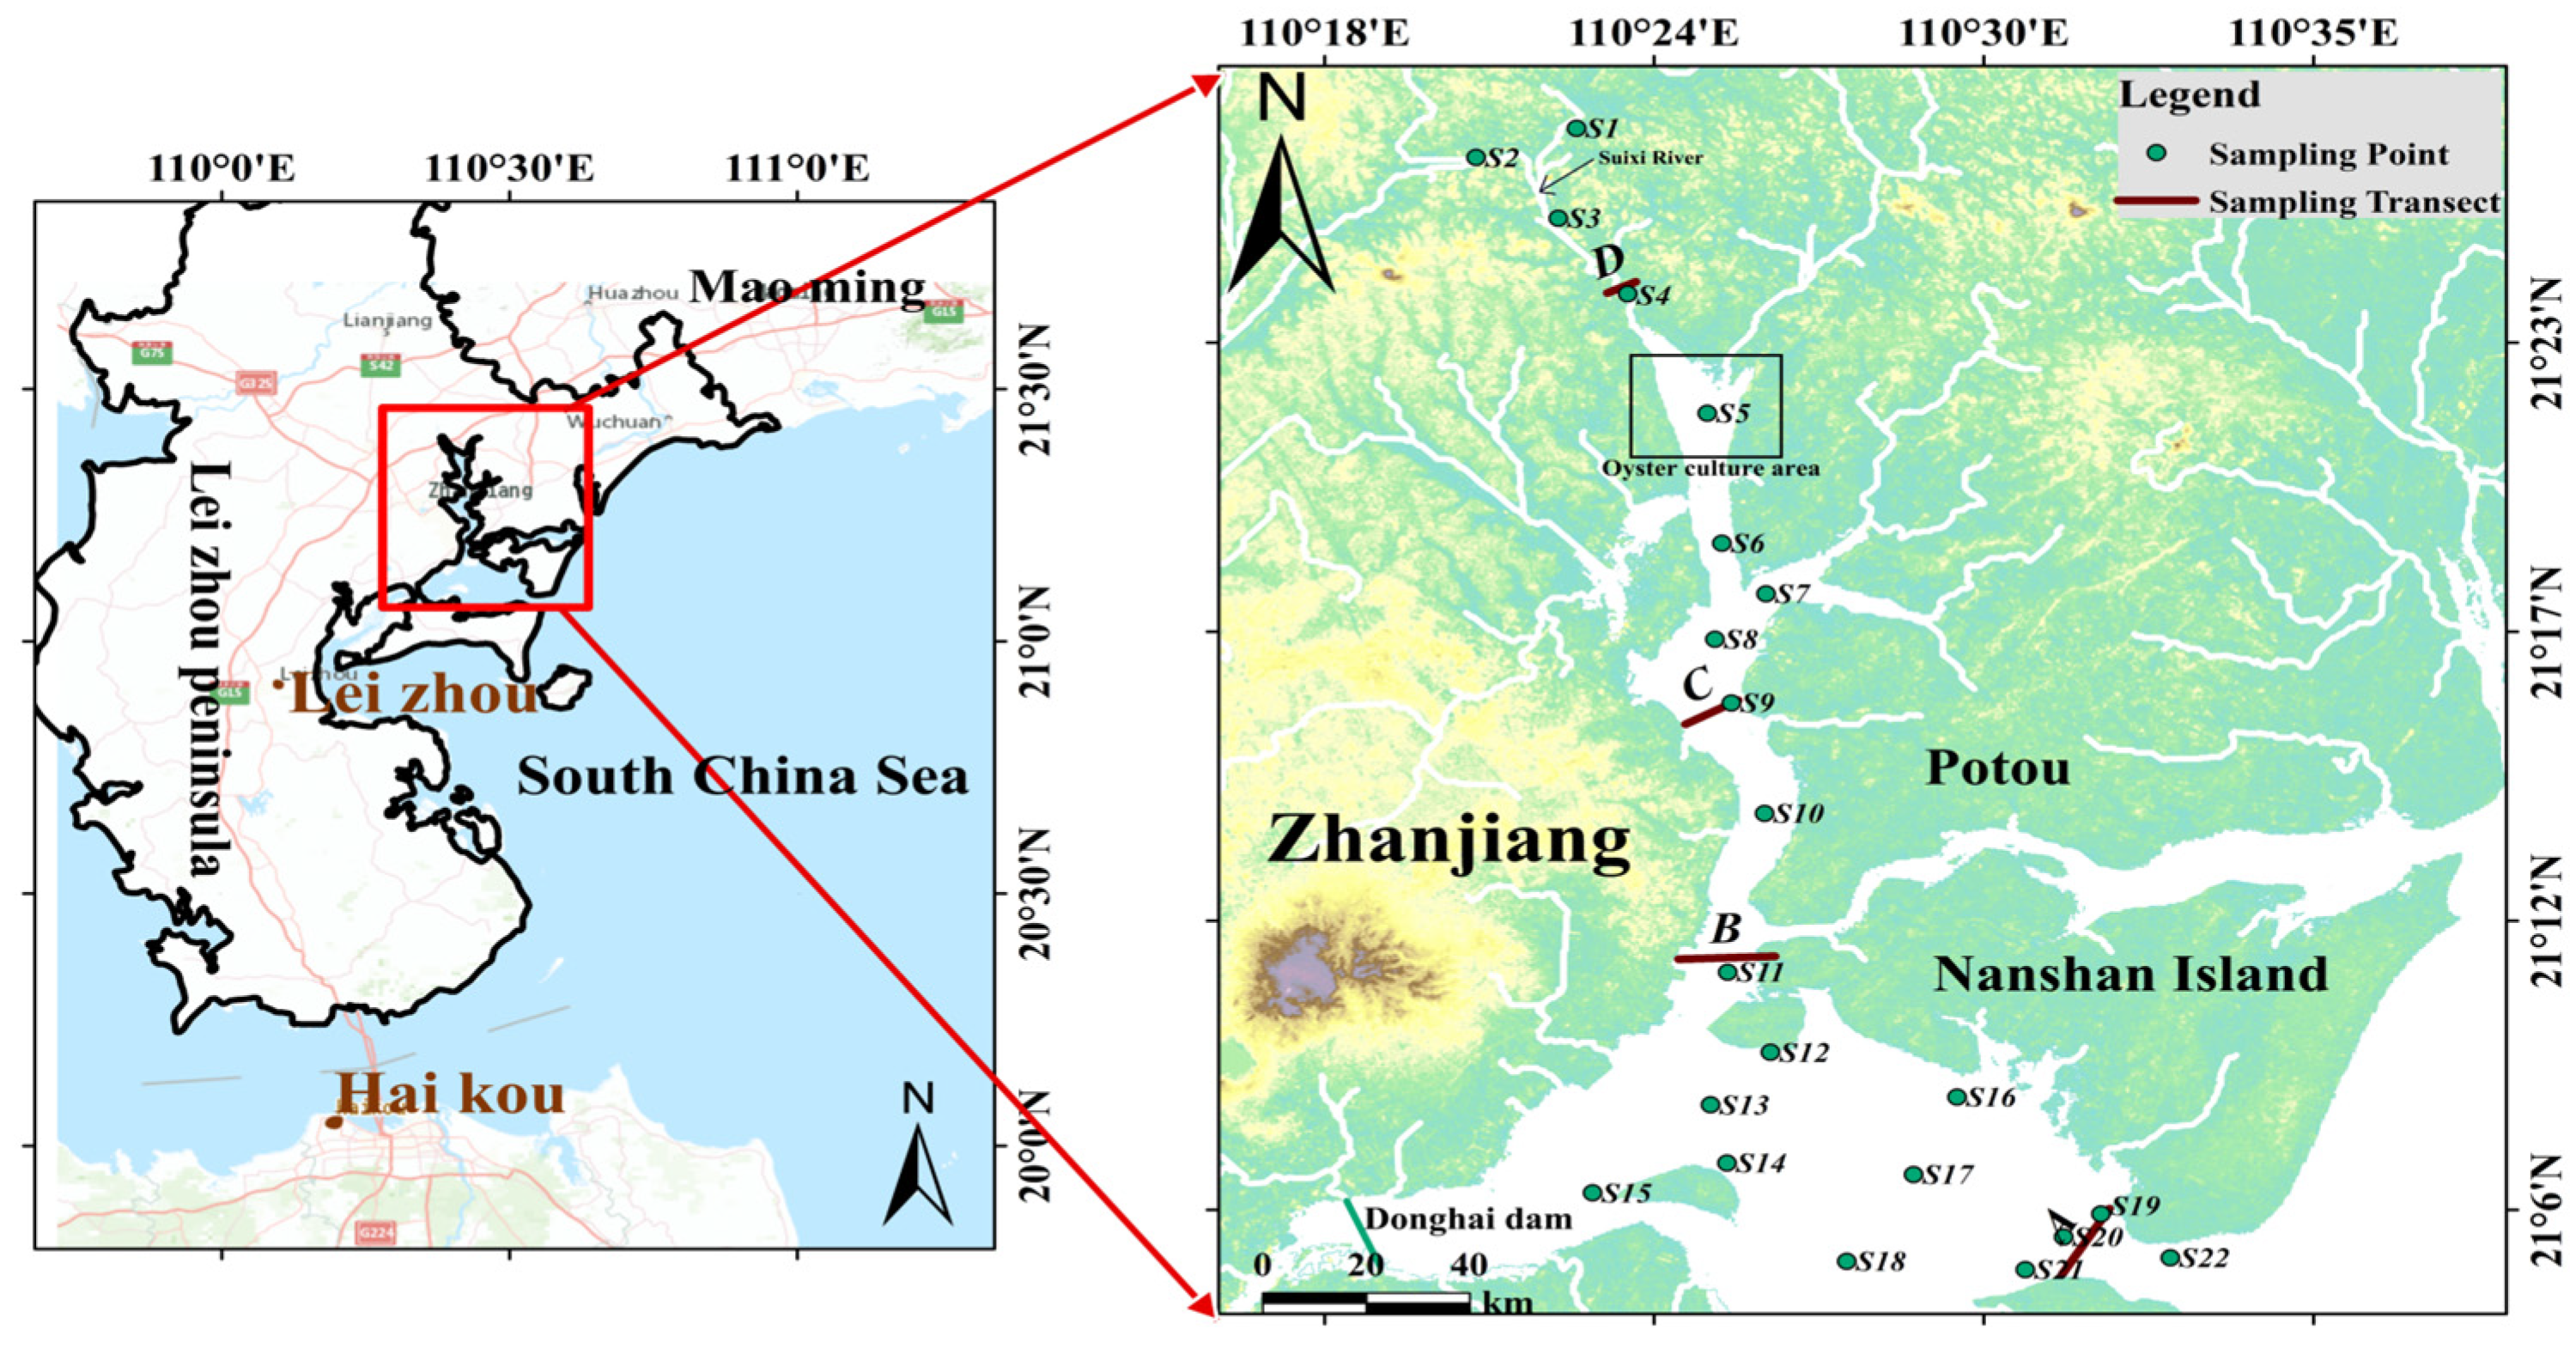
To investigate the spatial and temporal distribution characteristics, concentration levels, and influencing factors of Alk in ZJB, seasonal field surveys were conducted in summer (May to September) and winter (December) in 2023. The 22 sampling stations and four cruise sampling sections are shown in Figure 1. These stations were selected to capture regional differences between ZJB and its surrounding terrestrial environment. The study area was divided into four zones (estuary, inner bay, mid-bay, and bay mouth; Figure 1) to capture the transition from river-influenced to marine conditions. This salinity-based division facilitates direct comparison of Alk dynamics across distinct hydrographic regimes (Section 3.1, Results).
Summer sampling comprised two independent cruises. First cruise: 12–15 May 2023, a shipboard survey covering 22 stations (S1–S22), from which 58 water samples were collected. Second cruise: 16–17 September 2023, a continuous tidal observation at six representative stations (S1, S2, S4, S9, S11, S21) along the four transects, with sampling every 4 h, yielding 36 water samples. The summer Alk value for each station was calculated as the arithmetic mean of measurements taken in May and September (where both were available) to obtain a robust estimate of the mean summer Alk level for seasonal comparison. The summer mean Alk value for each zone was obtained by equally averaging the Alk values of all stations within that zone. The overall summer mean Alk value for the entire study area was calculated as the equally weighted average of all stations (n = 28), consisting of single measurements from 22 stations in May and tidal-averaged data from 6 stations in September.
Winter sampling: A continuous tidal observation was conducted at 20 stations along the same four transects from 28–29 December 2023, with sampling every 4 h, yielding 102 water samples. The winter Alk value for each station was calculated as the arithmetic mean of repeated measurements over the tidal cycle. The winter mean Alk value for each zone was obtained by averaging the Alk values of all stations within that zone, and the overall winter mean Alk value for the study area was calculated as the equally weighted average of all stations (n = 20). The winter survey focused on capturing tidal-cycle variability because winter conditions in ZJB are hydrographically more stable, making a tidal-cycle mean a robust estimate of the winter mean state.
All cruising sampling and water parameter measurements were completed within 48 h. During the survey, water samples were collected from a depth of 0.5 m below the sea surface using an organic glass water sampler and stored in 5 L polyethylene bottles. Sample collection, storage, and transport followed the guidelines of the “Marine Survey Specifications” (GB 12763-2007; Specifications for oceanographic survey—Part 4: Survey of chemical elements in sea water. Standards Press of China: Beijing, China, 2007) and the “Marine Monitoring Specifications” (GB 17378-2007; The specification for marine monitoring—Part 3: Sample collection, storage and transportation. Standards Press of China: Beijing, China, 2007) and were transported to the laboratory for filtration analysis on the same day.
Seawater samples were filtered through a 0.45 μm glass fiber filter membrane within 24 h of sample collection, and the filter membranes were then wrapped in tin foil and stored in a refrigerator at −20 °C. The filter membrane was extracted with an acetone solution, and the concentration of chlorophyll a (Chl-a) was then determined by spectrophotometry [49]. The environmental parameters, such as water temperature, salinity, pH, and dissolved oxygen, were measured on-site using a multi-parameter water-quality instrument (AQUAREAD AP7000 (Aquaread, Kent, UK)).
Alk samples in polyethylene plastic sample bottles were stored at 4 °C and analyzed within 72 h. The determination of water Alk was performed in accordance with “Determination of seawater Alk” (HY/T 178-2014; Determination of alkalinity in seawater using pH potentiometric titration. Standards Press of China: Beijing, China, 2014) [50] using an automatic titrator (Metrohm Titrando 905 (Metrohm AG, Herisau, Switzerland)). The number of samples was calculated from the titration endpoint, determined using the sample volume, titrant volume, and the chemical equivalence relationship. Before the test, the pH electrode was calibrated using a three-point method with buffer solutions at pH 4.00, 6.96, and 9.00 to ensure the electrode was normal and stable. During the sample testing process, Alk solution standard (GBW (E) 083386; National Institute of Metrology, Beijing, China) was used as reference material, and quality control of the determination process was carried out for every 10 samples to ensure that the relative average deviation did not exceed 2%.
The Alk was calculated as follows:
A l k = V H c l × C H c l V w × 50.04 × 1000
where Alk (μmol·L−1) is the alkalinity of the seawater sample; VHcl (cm3) is the volume of standard hydrochloric acid solution; CHcl (mol·L−1) is the concentration of standard hydrochloric acid solution; and VW is the volume of seawater sample.

2.3. Methods of Data Statistical Analysis

2.3.1. Two-Endmember Mixing Model

To differentiate the relative contributions of physical mixing versus biological and chemical processes to the observed Alk distribution, a two-endmember mixing model was employed, with salinity serving as a conservative tracer. The freshwater end-member (salinity = 0) was constrained using the measured Alk value at station S3, which had the lowest observed salinity (0.2) and an Alk concentration of 713.66 μmol·L−1. The seawater end-member was defined using the background Alk value of the open South China Sea (salinity = 33, Alk = 2213 μmol·L−1). Under the assumption of conservative mixing, the measured salinity (S) of any sample can be expressed as a linear combination of freshwater and seawater end-members:
f r w + f s w = 1
S r w × f r w + S s w × f s w = S
where f fw and f sw are the mixing fractions of freshwater and seawater, respectively, and S fw and S sw are their corresponding salinities (with S fw = 0 and S sw = 33 ). The conservative Alk (Alkcons) at observation salinity (S) is derived from the proportion of the end-member mixing:
A l k c o n s = A l k r w + A l k s w A l k r w S s w × S
Substituting the end-member values ( A l k r w = 713.66 μmol·L−1, A l k s w = 2213 μmol·L−1, S s w = 33) yields:
A l k c o n s = 713.66 + 42 × S
The deviation from conservative mixing (d Alk) was then calculated for each sample as:
d   A l k = A l k m e a s u r e A l k c o n s

2.3.2. Statistical Graph Analysis

Normality was assessed using the Shapiro–Wilk test. Because the Alk data were non-normally distributed (p < 0.001), non-parametric tests were used throughout. Seasonal differences in Alk were tested using the Mann–Whitney U test, and seasonal comparisons were performed using Fisher’s z-transformation. Relationships between Alk and salinity variables were evaluated using Spearman’s rank correlation coefficient (ρ); linear regression was fitted to the data for visualization purposes only. For tidal-scale analysis, Pearson’s correlation (R) was used for zone–season combinations that met the normality assumption (p > 0.05); the mid-bay summer data were described qualitatively. PCA was performed after z-score normalization, with components retained by eigenvalues > 1 and varimax rotation. All tests were two-tailed with α = 0.05, conducted in SPSS 26.0. Figures were generated using ArcGIS 10.2, Surfer 18.1, and Origin 2021software.

3. Results

3.1. Marine Environmental Status in ZJB

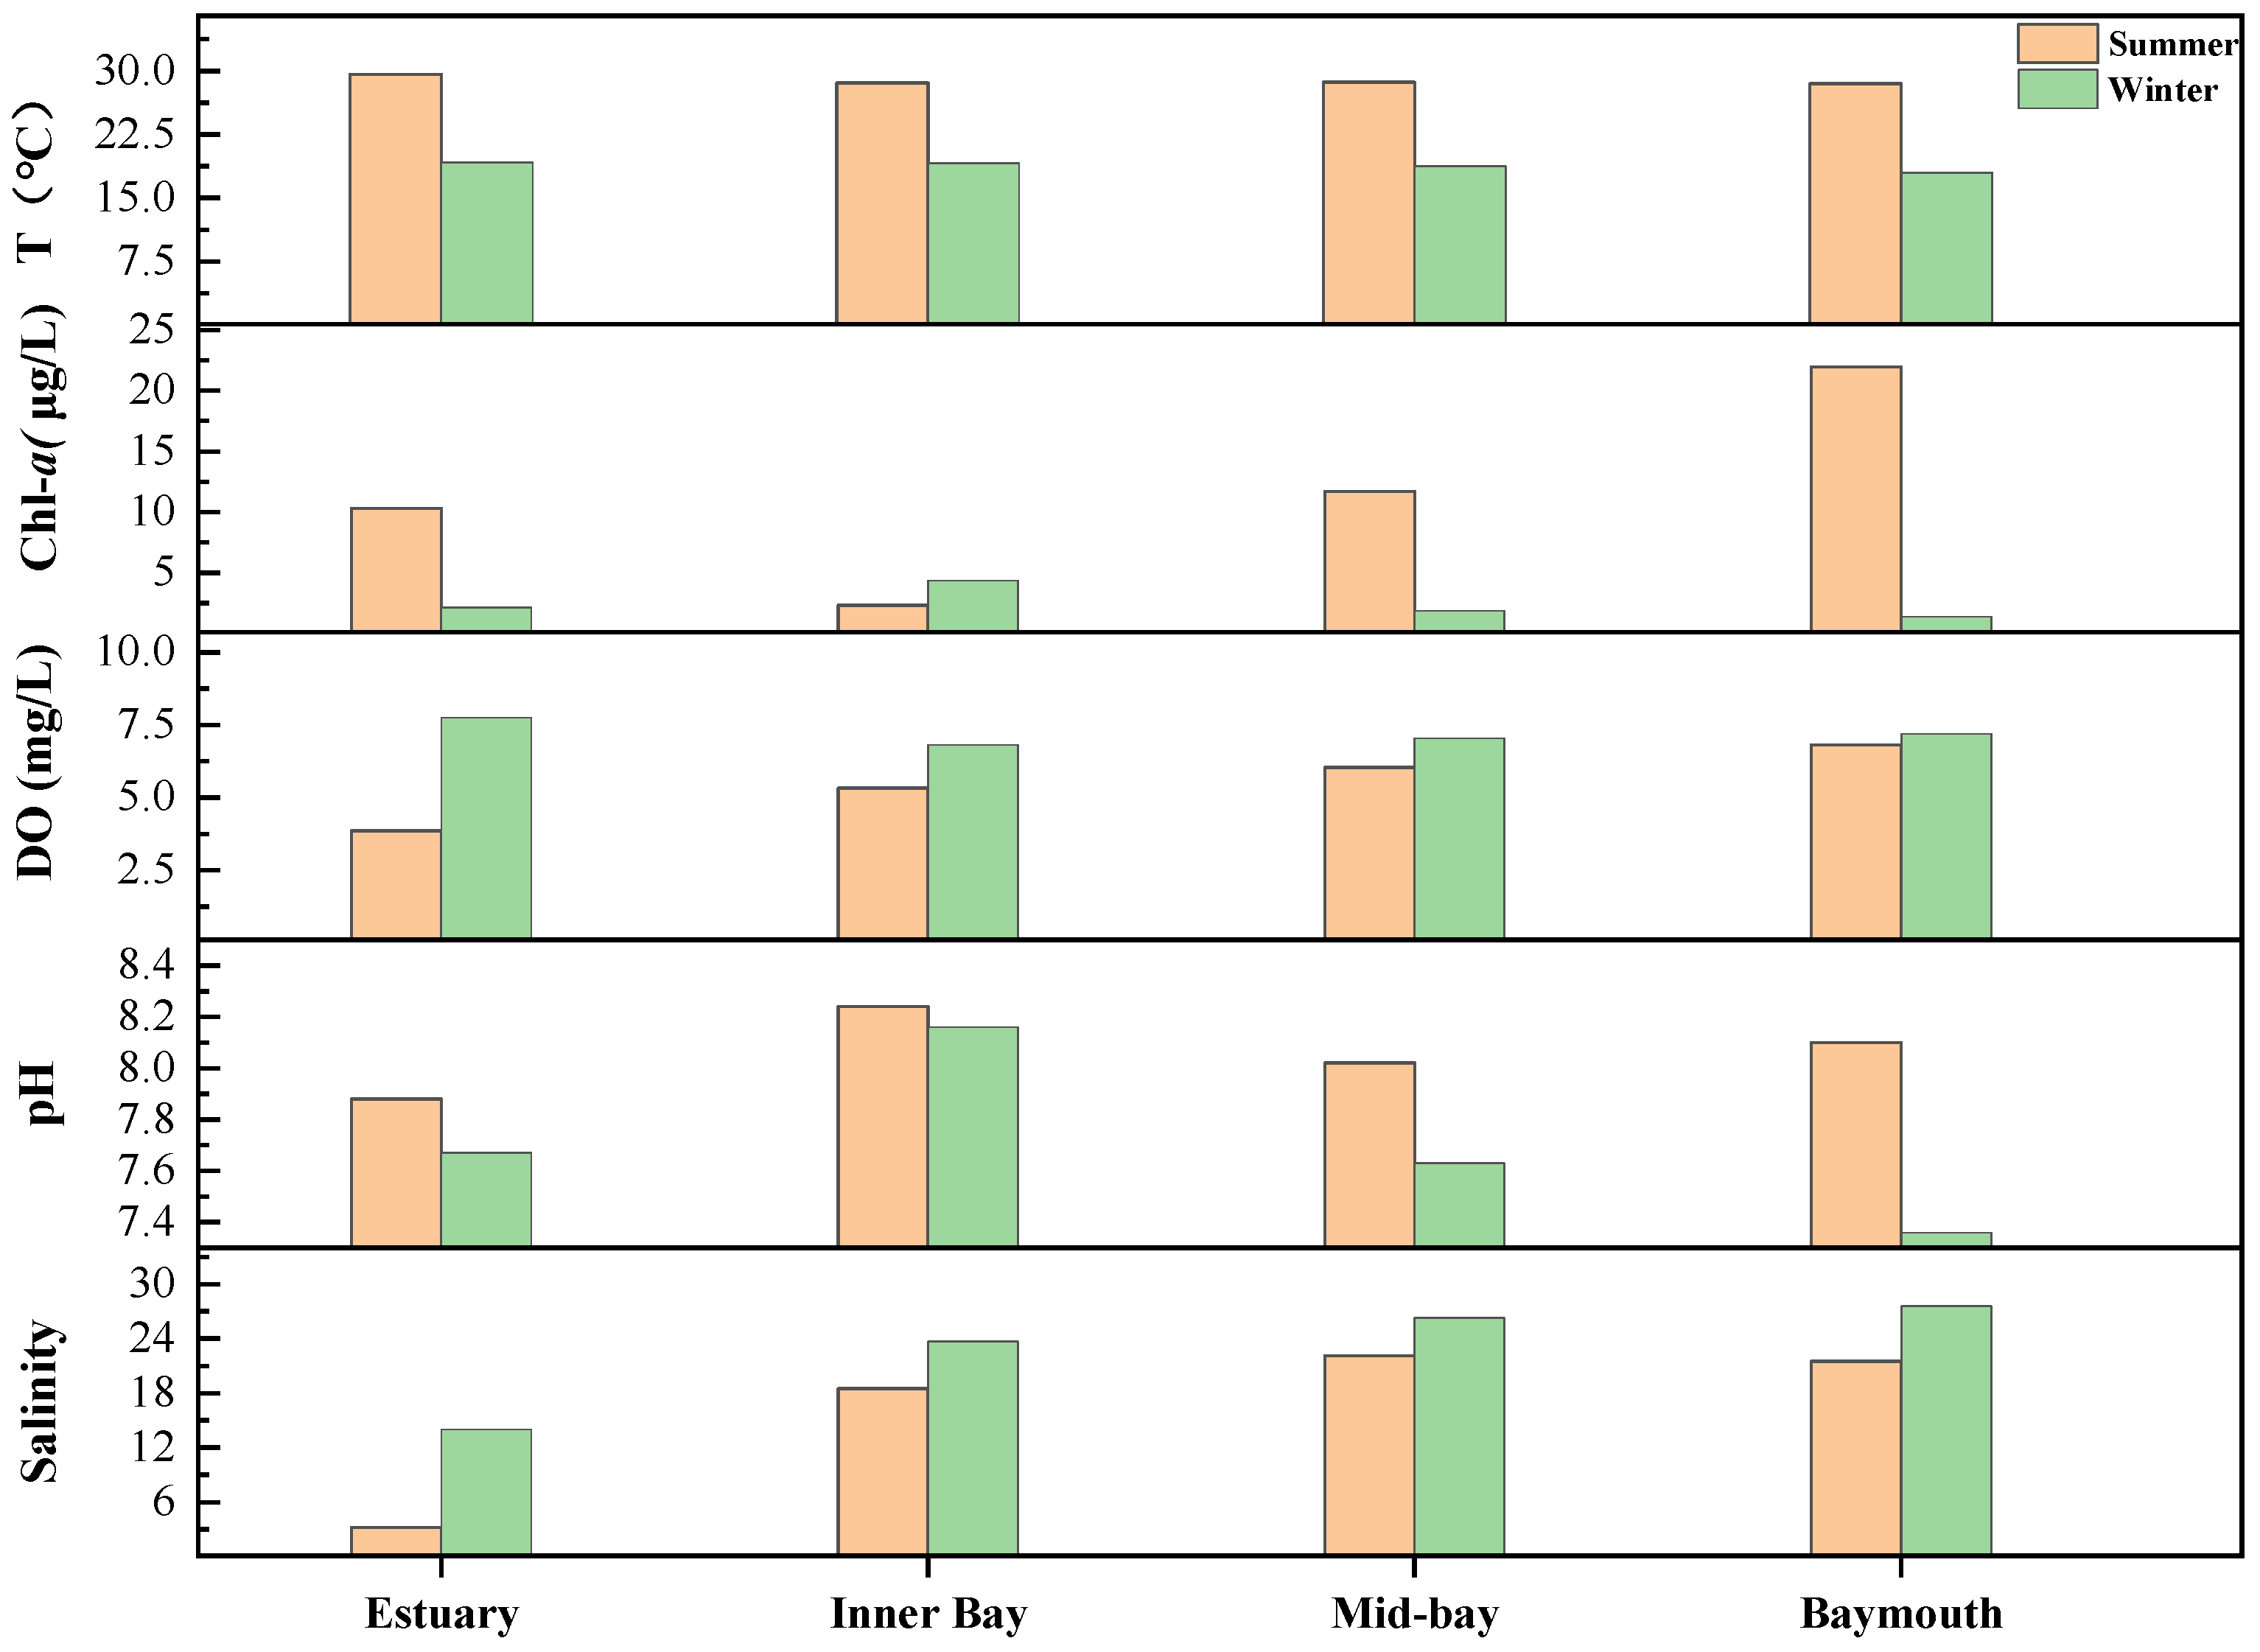
The seasonal variations in seawater temperature, salinity, pH, and dissolved oxygen (DO) in ZJB are shown in Figure 2. Surface temperature and salinity exhibited clear seasonal differences. The average temperature was 28.2 ± 0.6 °C in summer and 18.7 ± 0.5 °C in winter, while the average salinity was 17.5 ± 7.8 in summer and 23.9 ± 4.9. Due to monsoon-driven freshwater input and typhoon rainfall, salinity was generally lower in summer than in winter. Spatial variability was also evident, with the lowest salinity observed in the estuary (8.6 ± 7.6), ranging from 0.9 to 14.3 and primarily controlled by riverine input. In contrast, salinity was higher at the bay mouth (20.7–27.7), with an average of 24.6 ± 4.3. Dissolved oxygen concentrations were lower in summer (3.22–7.15 mg·L−1; mean 5.63 ± 1.31 mg·L−1), particularly in estuarine areas (3.7 ± 0.50 mg·L−1), whereas winter values were higher and more homogeneous (6.60–7.81 mg·L−1; mean 7.16 ± 0.34 mg·L−1). Chlorophyll-a concentrations were higher in summer, especially in the estuary (9.04 ± 4.21 μg·L−1), and lower in winter (2.35 ± 1.23 μg·L−1). The pH ranged from 6.94 to 8.93 (mean 7.84 ± 0.45) in summer and from 7.26 to 8.20 (mean 7.68 ± 0.30) in winter.

3.2. Spatiotemporal Variation Characteristics of Alk in ZJB

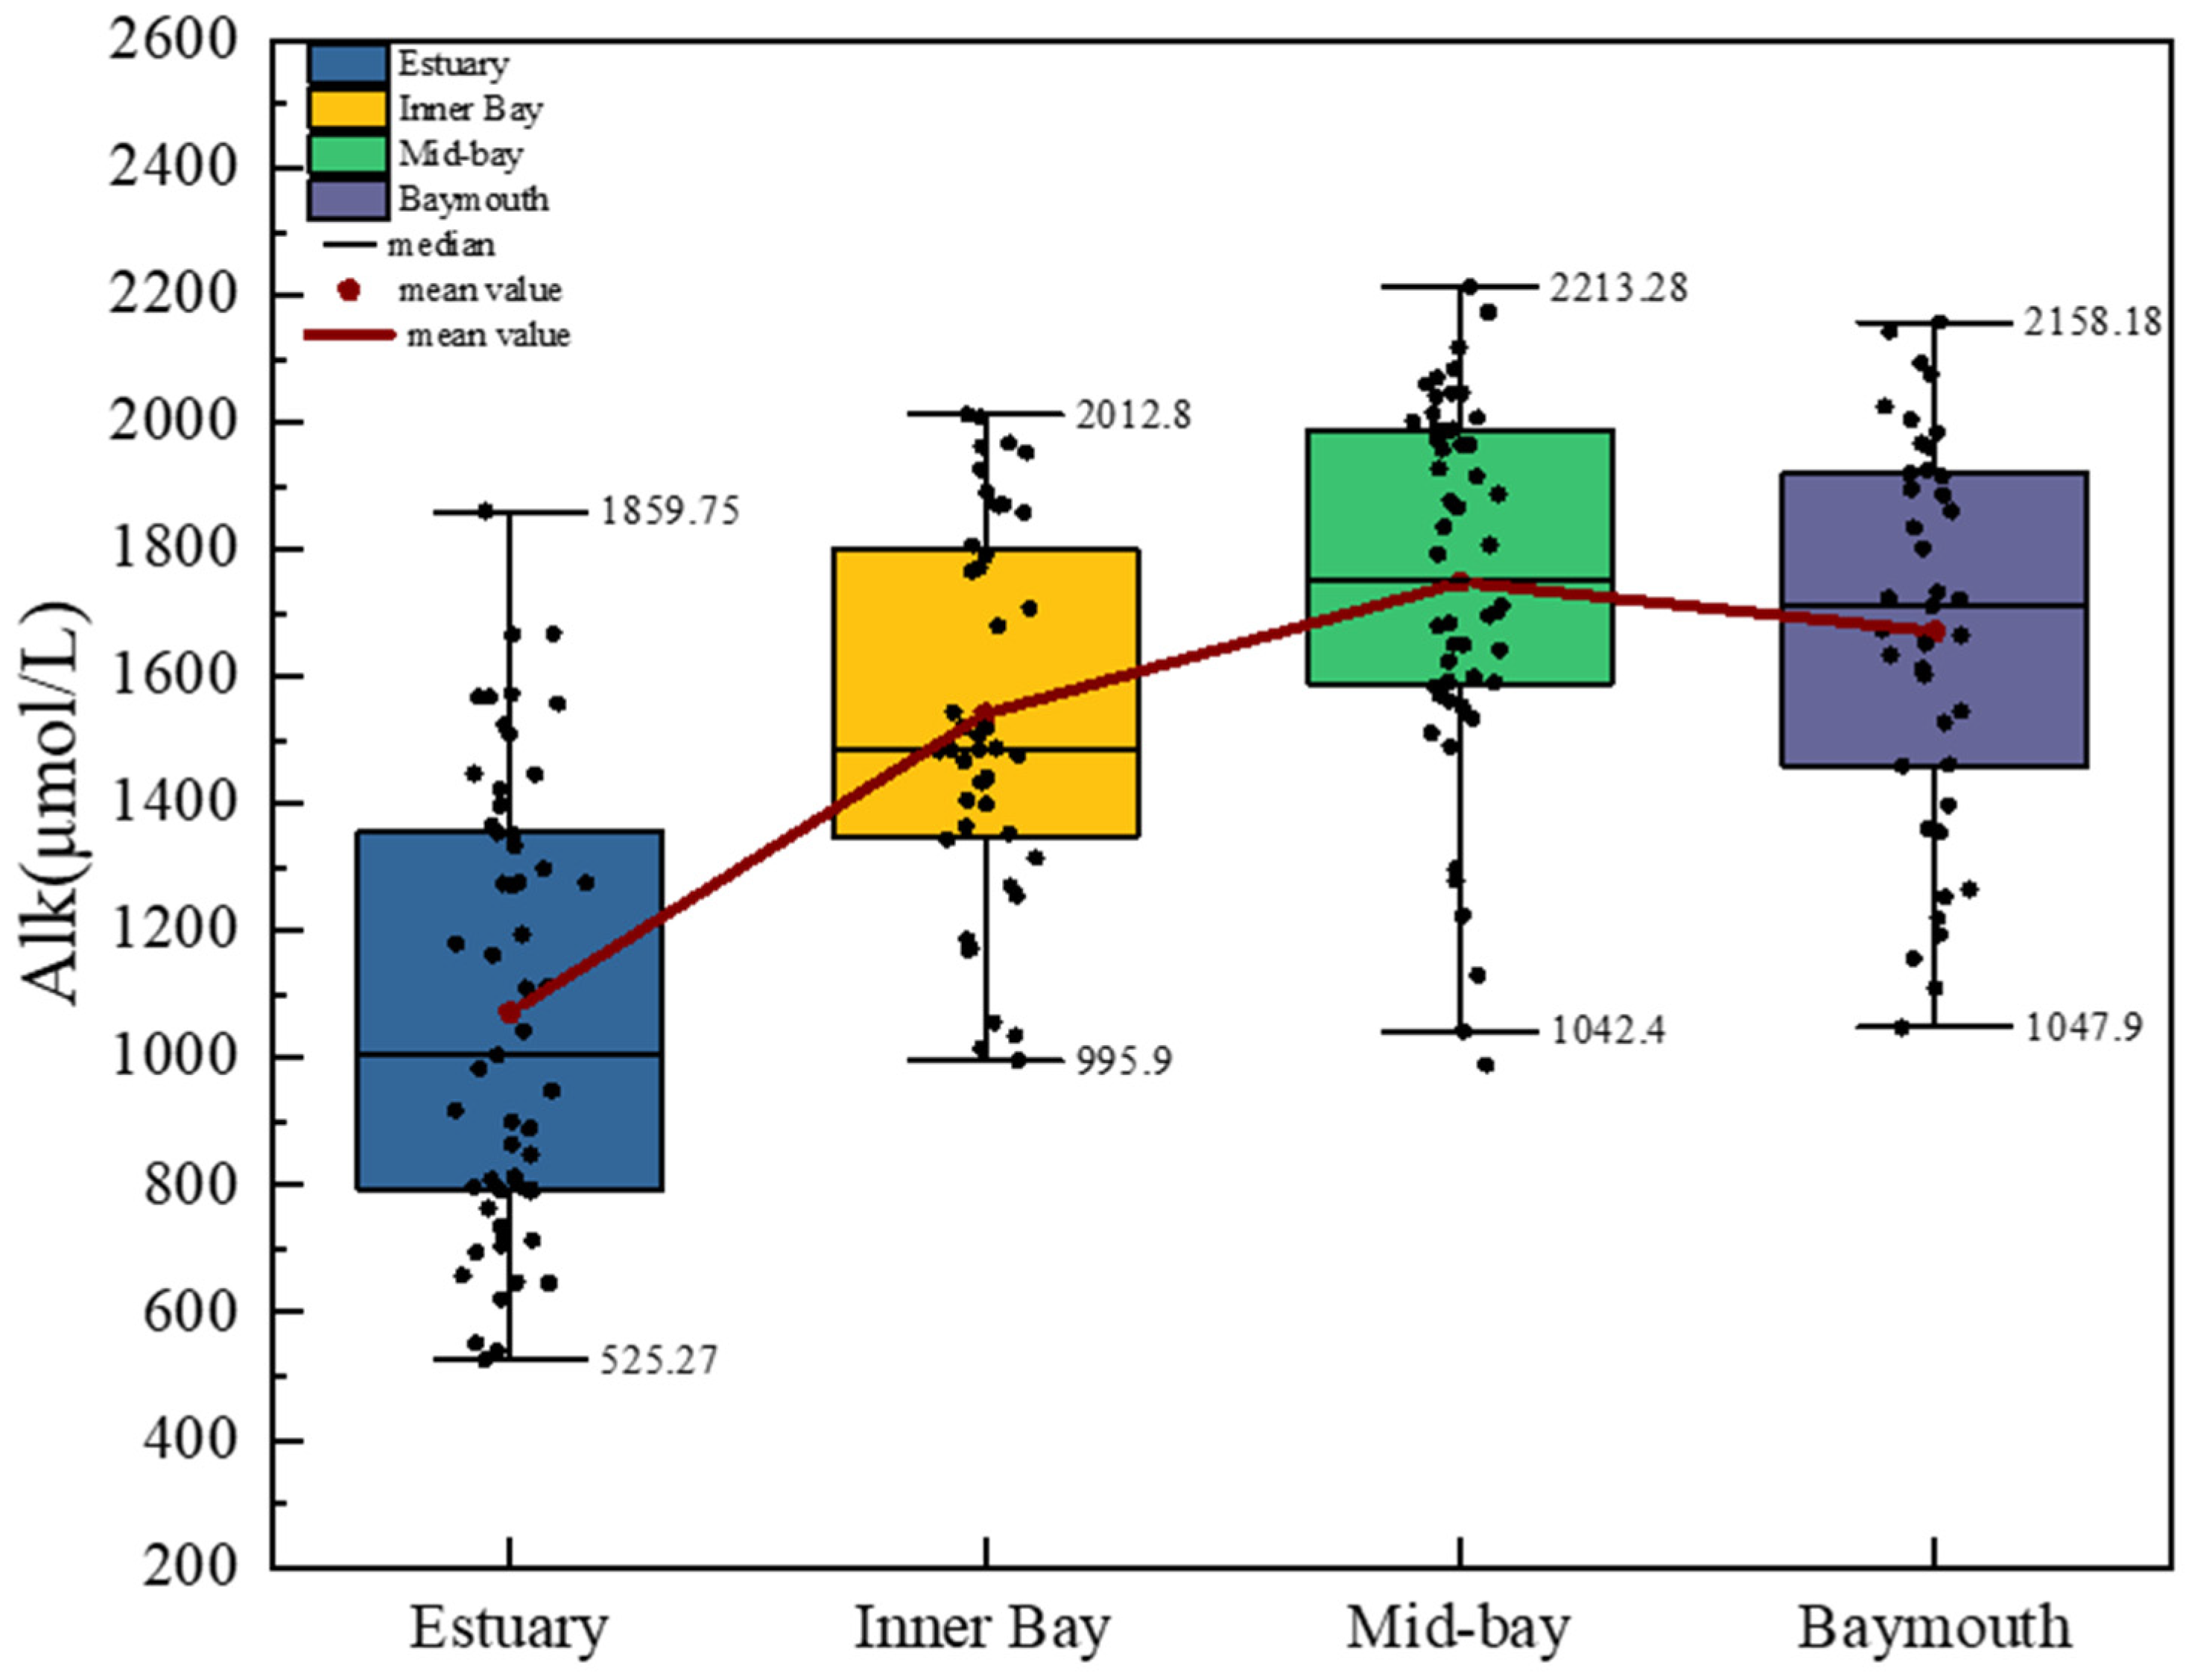
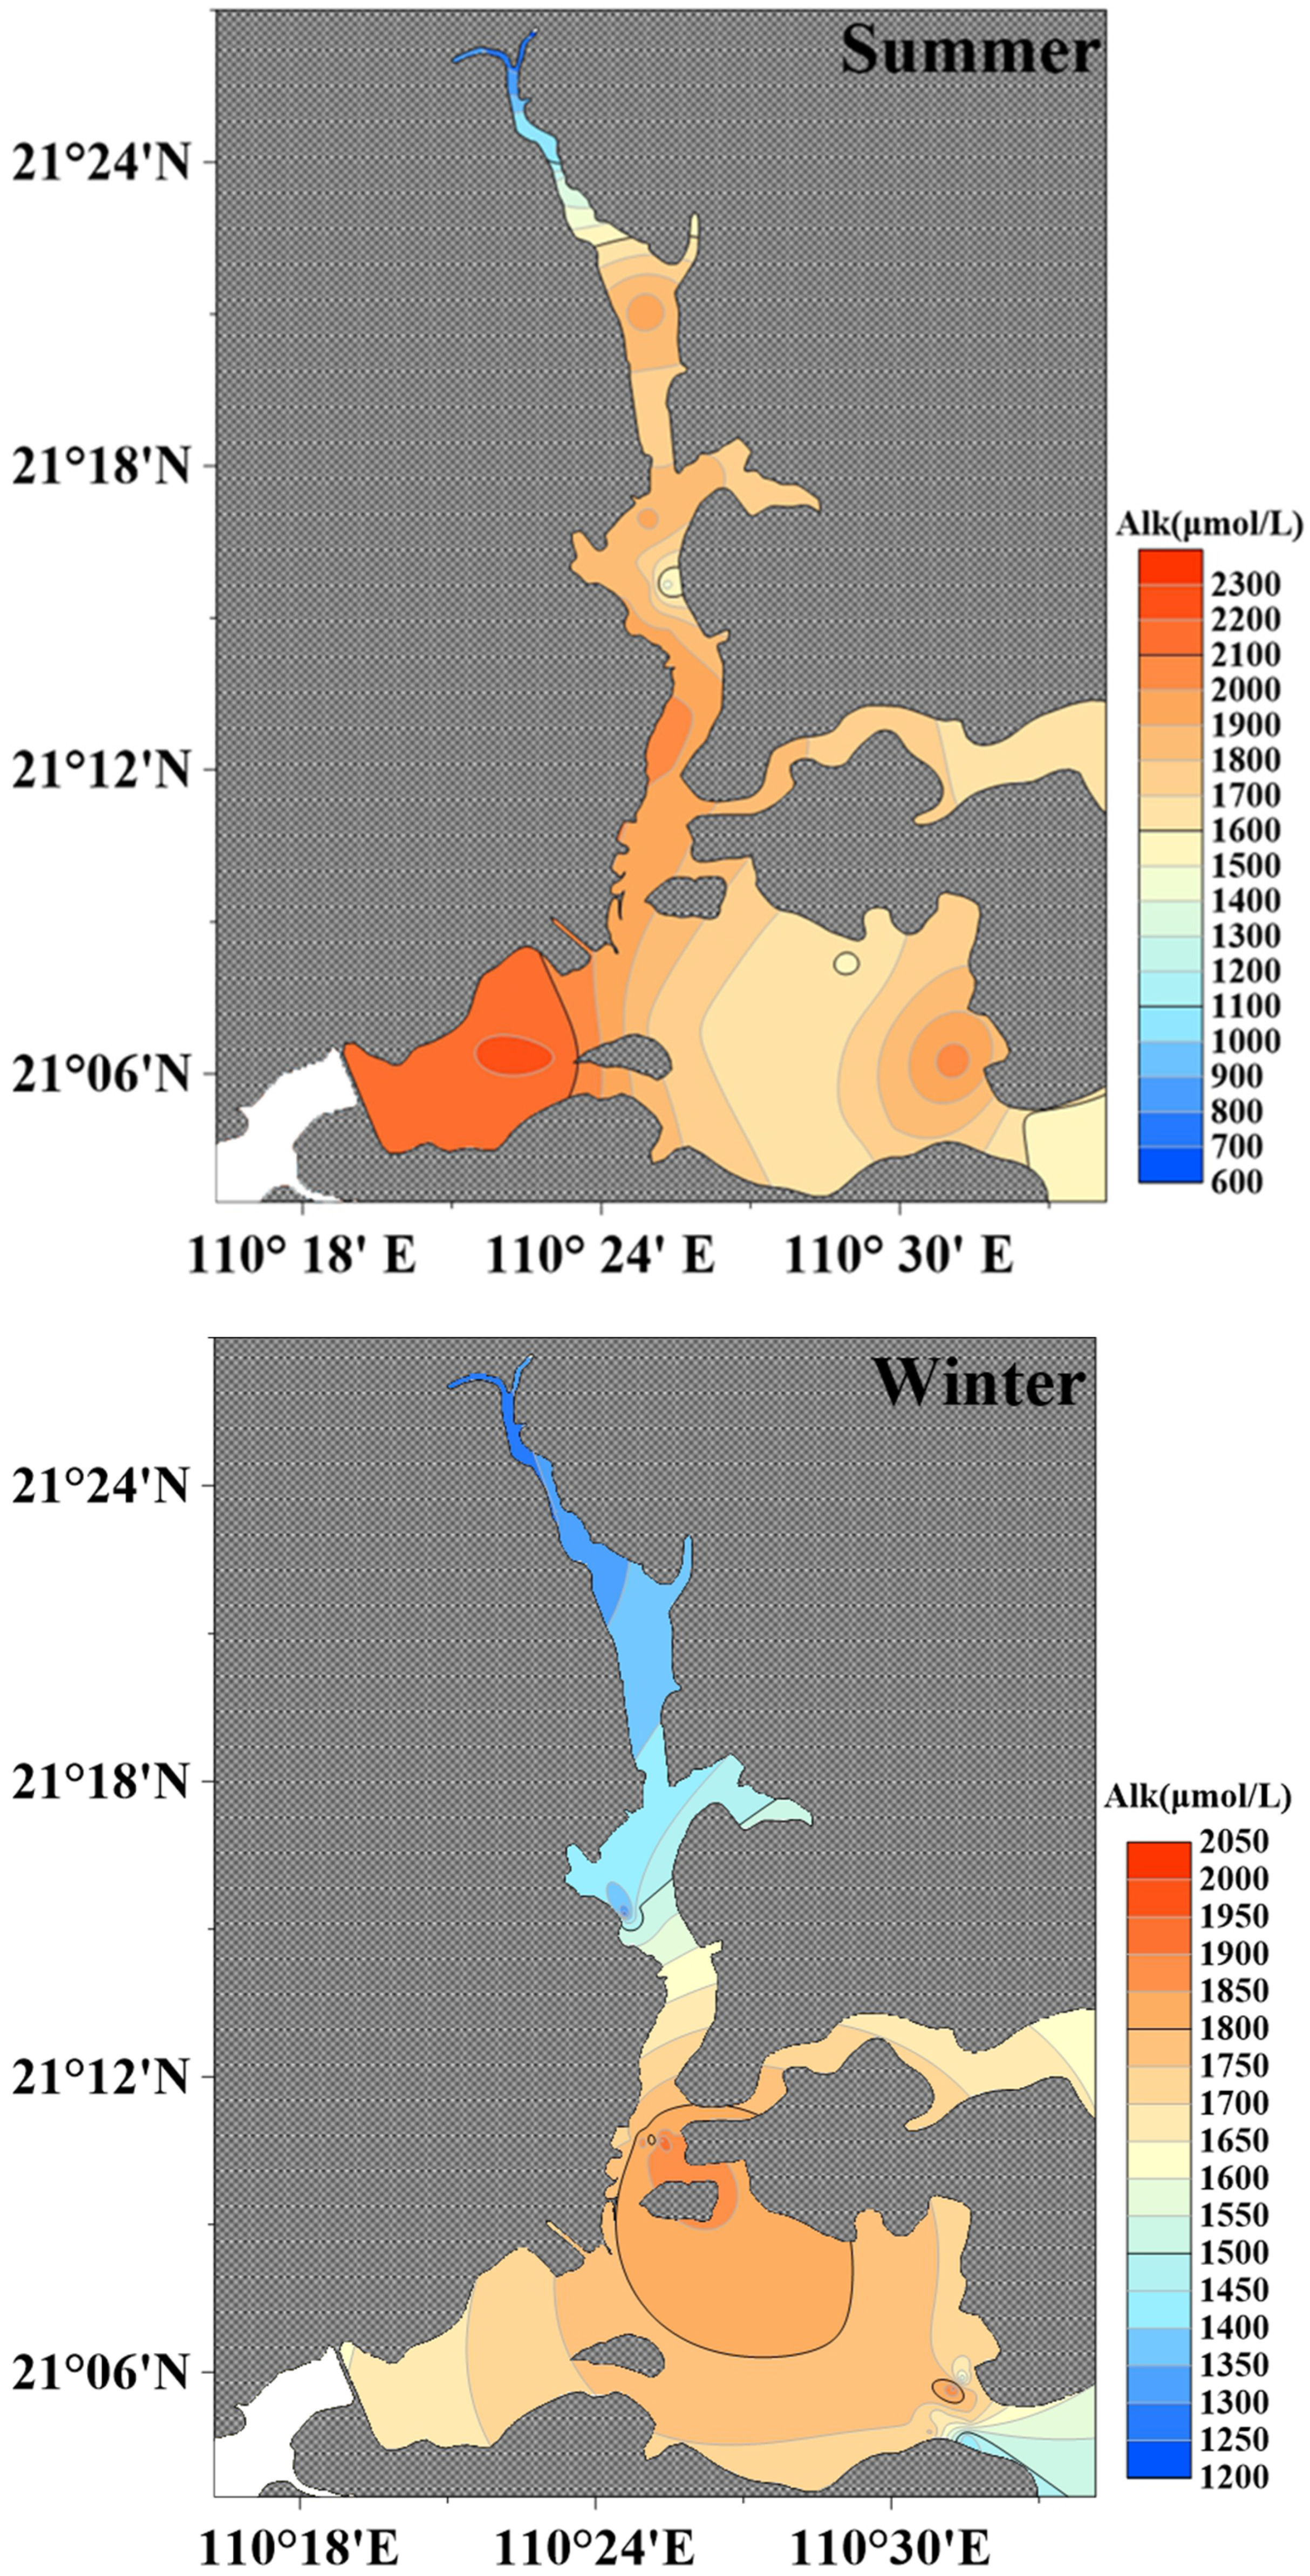
The spatial distribution of surface seawater alkalinity (Alk) in the ZJB during 2023 is shown in Figure 3. Alk values followed a clear spatial gradient: estuary area (1071.7 ± 351.1 μmol·L−1, n = 57) < inner bay area (1541.4 ± 295.8 μmol·L−1, n = 44) < mid-bay area (1748.4 ± 288.8 μmol·L−1, n = 54) ≈ bay mouth area (1671.5 ± 309.2 μmol·L−1, n = 41), indicating a progressive increase from estuarine area toward the inner and mid-bay area, with comparable levels observed at the bay mouth area. The minimum Alk value (525.3 μmol·L−1) occurred in the estuary, while the maximum (2213.3 μmol·L−1) was recorded in the mid-bay. The range (maximum–minimum) of Alk was 334.5 μmol·L−1 in the estuary, increasing substantially to 1016.9 μmol·L−1 in the inner bay, 1170.9 μmol·L−1 in the mid-bay, and 1110.3 μmol·L−1 in the bay mouth area. Overall, Alk variability, as indicated by the range, was markedly higher in the inner, mid, and bay mouth areas than in the estuary area.
There were pronounced spatial and seasonal variations in surface seawater Alk in ZJB, as shown in Figure 4. Overall, winter Alk (1612.3 ± 343.7 μmol·L−1, n = 20) was significantly higher (Mann–Whitney U = 3460.0, p < 0.01) than summer Alk (1373.1 ± 420.9 μmol·L−1, n = 28). In summer, surface Alk showed a wide range (679.72–2213.28μmol·L−1, n = 28) and exhibited strong spatial heterogeneity. From the estuary to the bay mouth, Alk increased progressively, reaching the highest values in the inner bay (1851.9 ± 155.1 μmol·L−1), and then remained relatively stable toward the bay mouth. In winter, the spatial variation in Alk was narrower (1232.9–1962.8μmol·L−1, n = 20) than in summer, where Alk increased from the estuary to the mid-bay, where it reached the highest values (1881.8 ± 193.5 μmol·L−1), and then decreased toward the bay mouth. Compared with summer, winter Alk was higher in the estuary area (Mann–Whitney U = 138.0, p < 0.01) but lower in the inner bay area (Mann–Whitney U = 108.0, p < 0.01), while values in the bay mouth area remained comparable (Mann–Whitney U = 137.0, p > 0.05) between the two seasons. The lowest values of Alk were in the estuary area (958.7 ± 345.7 μmol·L−1 in summer, 1316.4 ± 215.2 μmol·L−1 in winter). In general, the surface Alk of seawater in ZJB was higher in winter, and the spatial differences between the two seasons were small.

3.3. Diurnal Variation in Surface Water Alk with Tidal Changes in ZJB

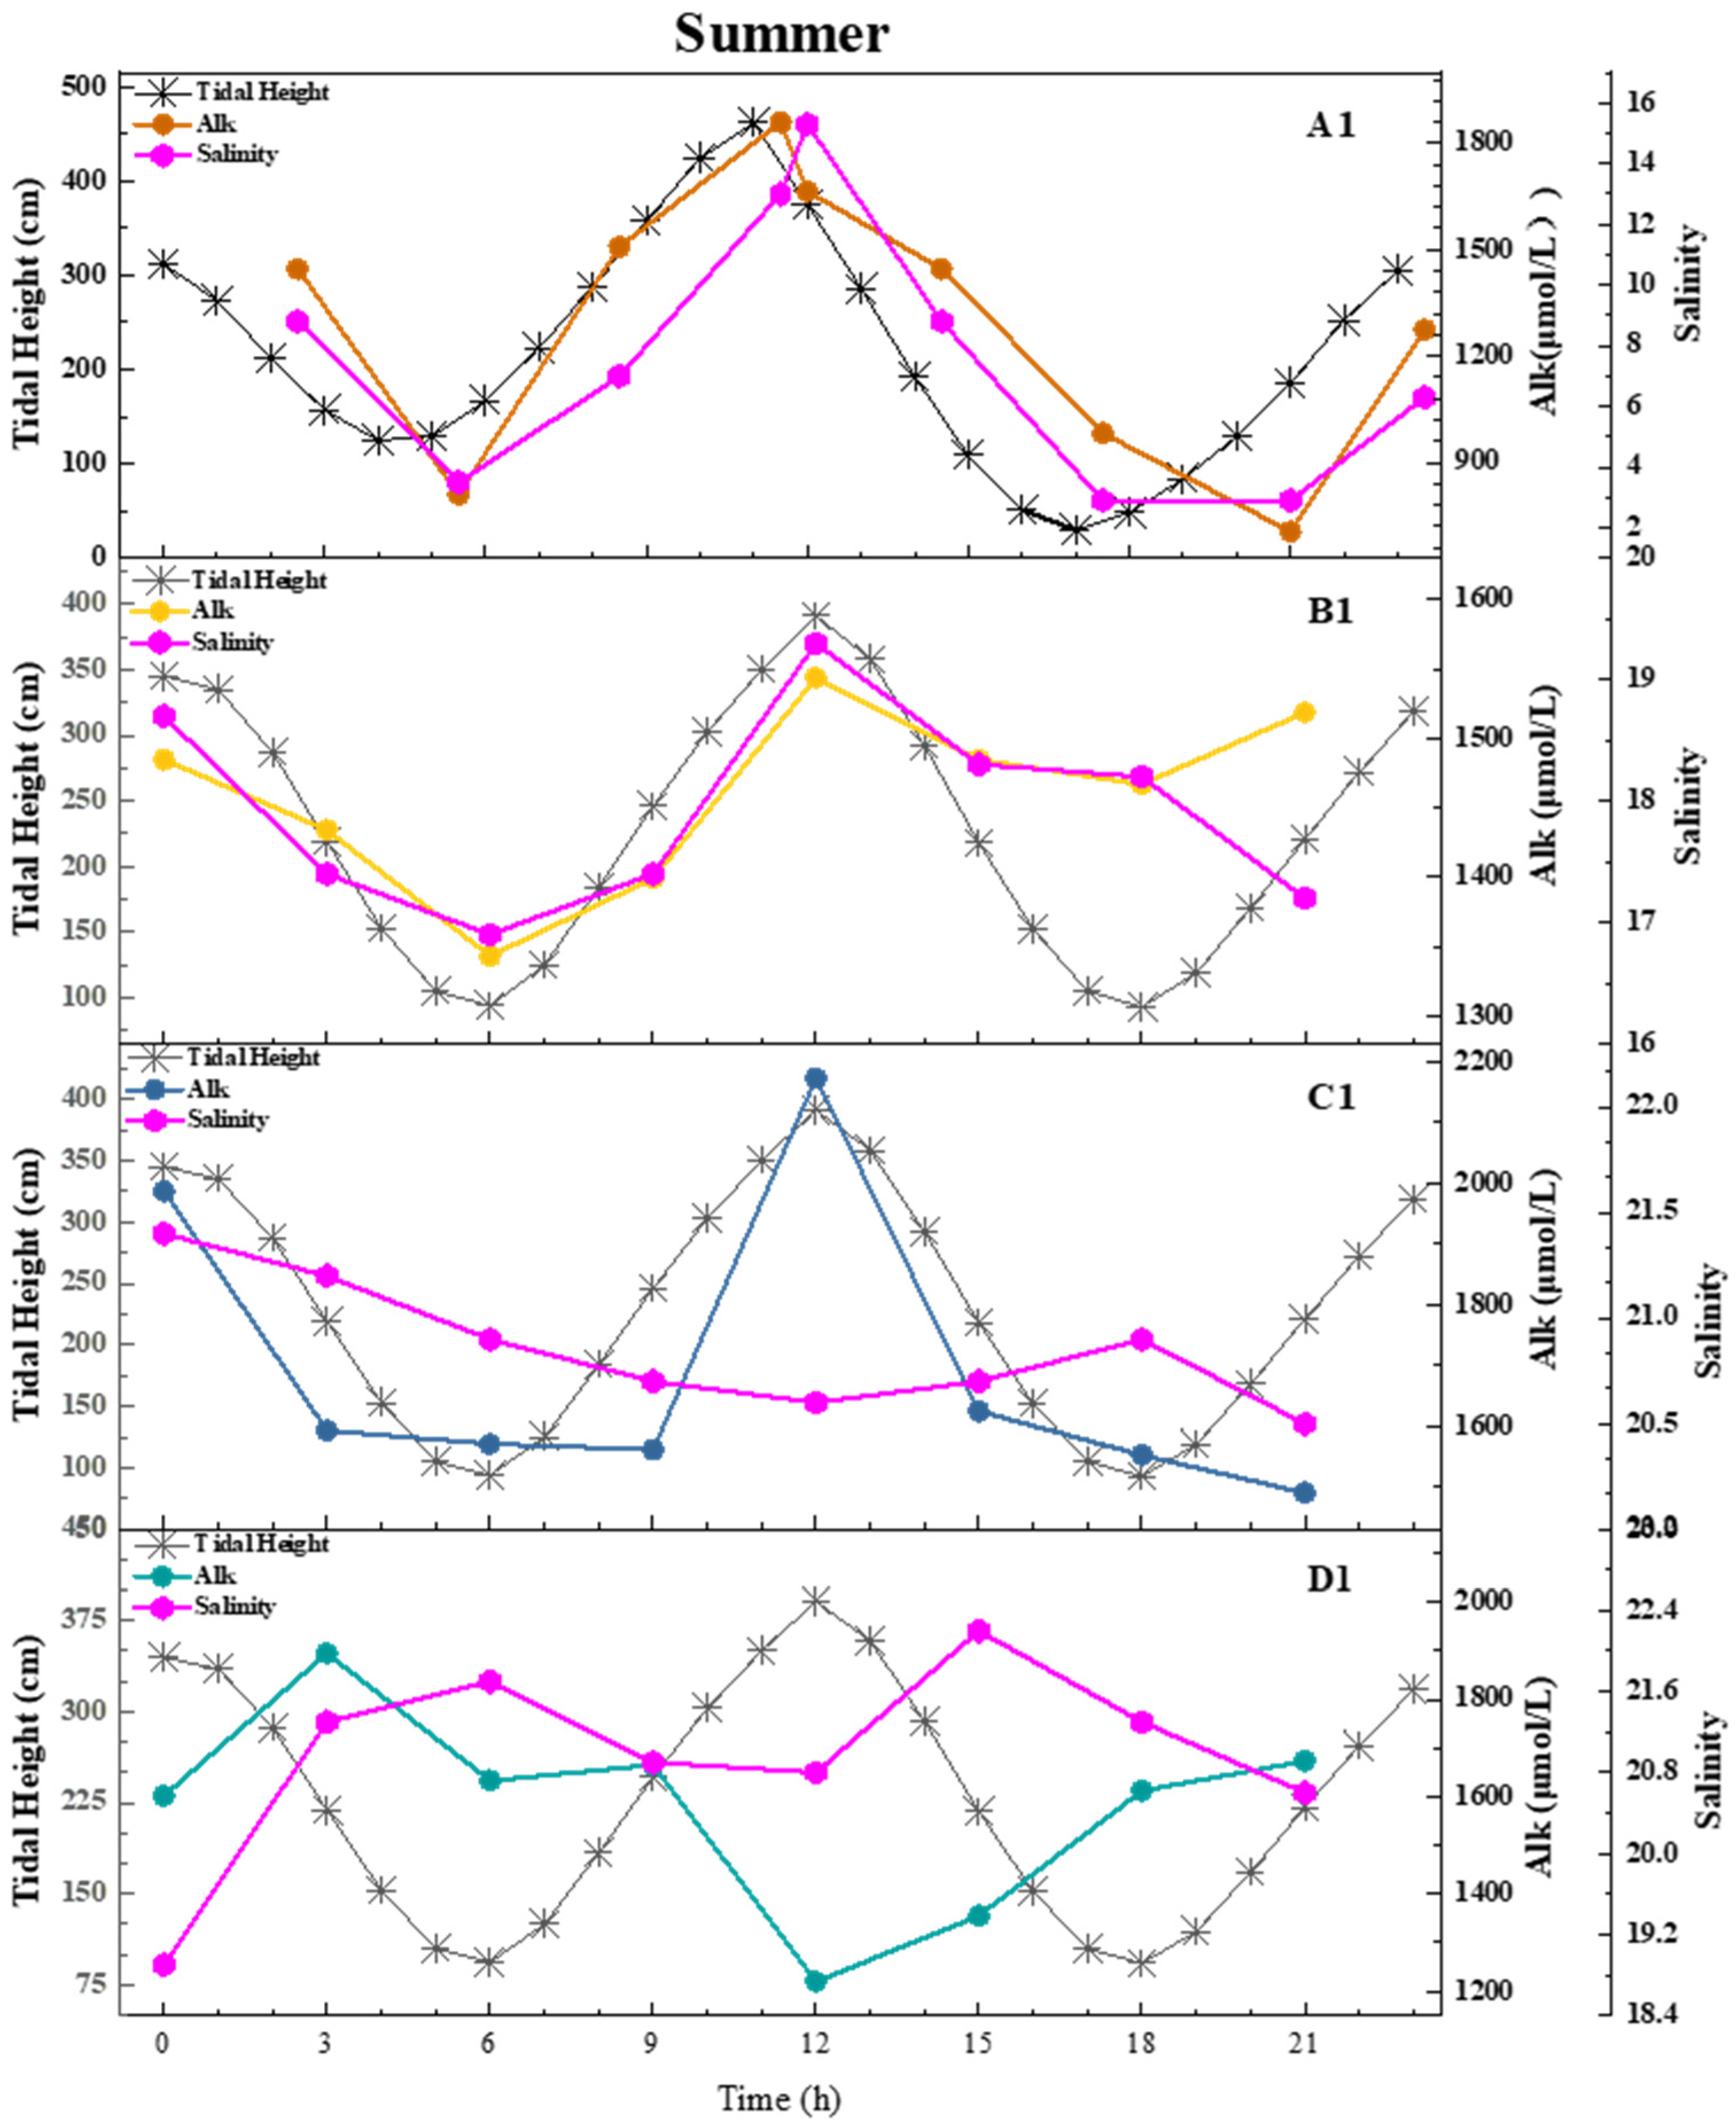
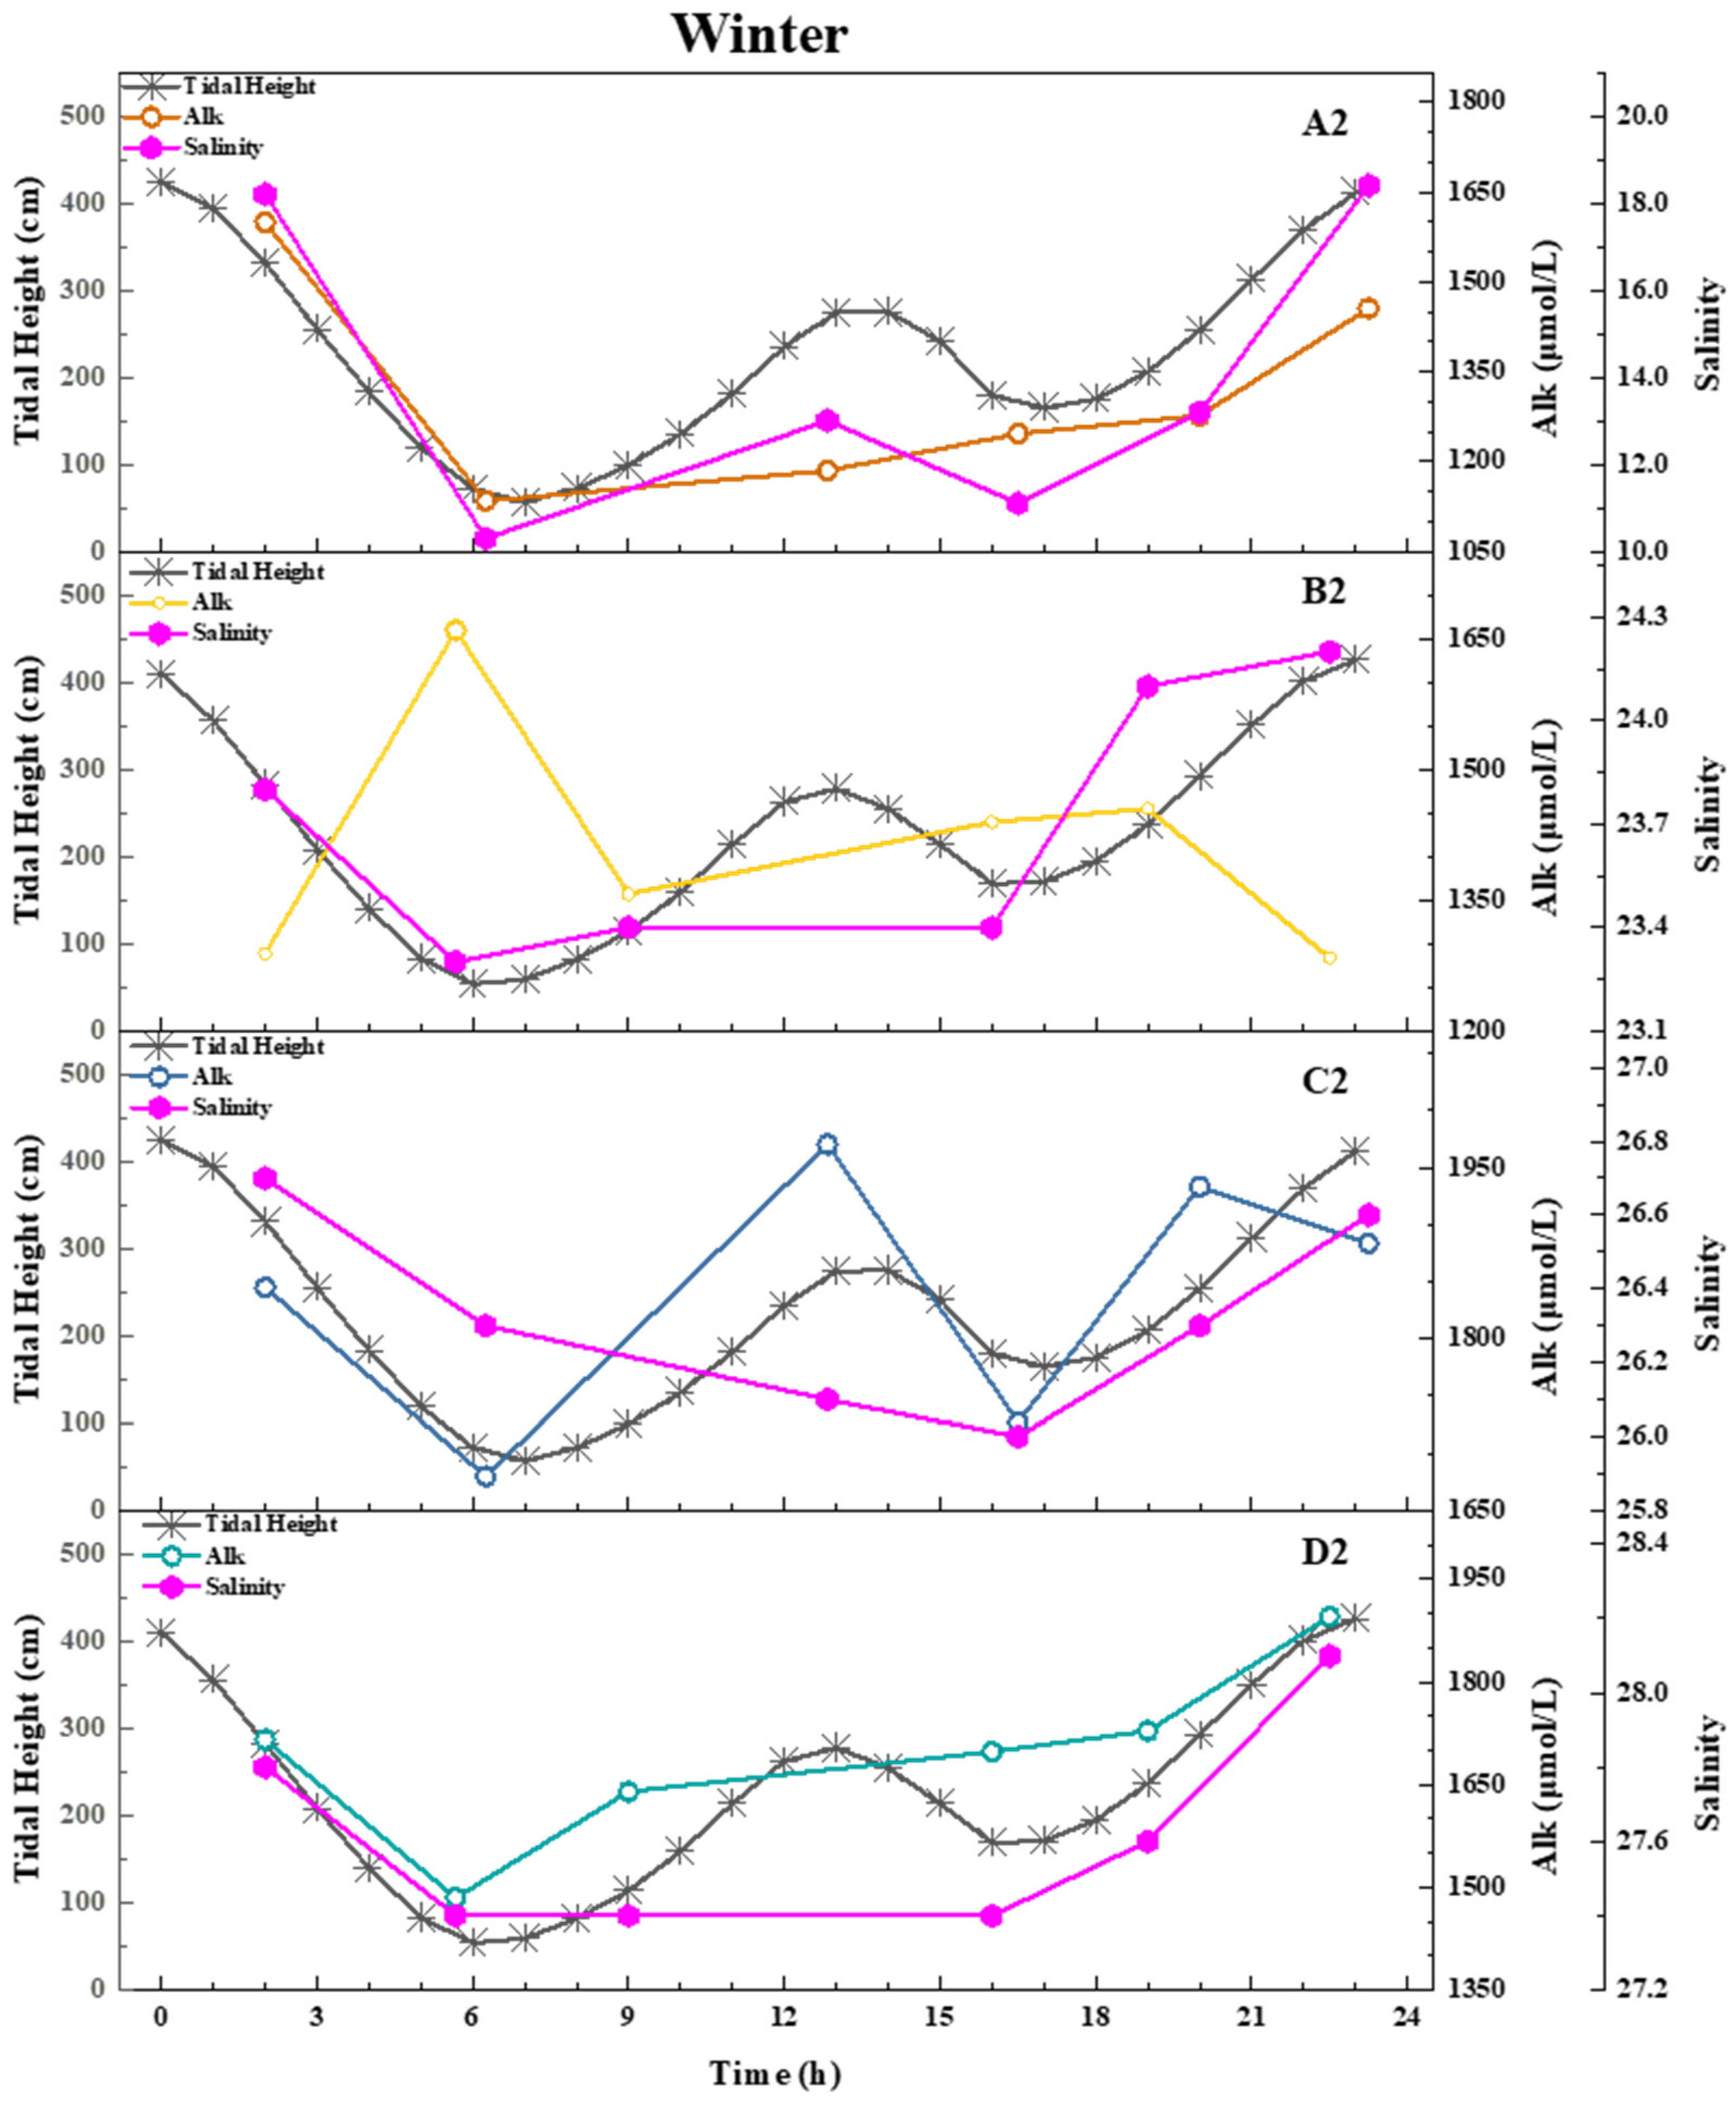
To investigate the variations in sea water alkalinity (Alk) under tidal forcing, four monitoring sections (sections A, B, C, and D) were established, and measurements were conducted over a single tidal cycle (approximately 24 h). The diurnal variation in surface Alk and salinity in relation to tidal stage in the ZJB is presented in Figure 5 (summer) and Figure 6 (winter). The diurnal range of surface Alk was 704.5–2173.4 μmol·L−1 in summer (n = 36) and 1134.3–1970.3 μmol·L−1 in winter (n = 102), with mean values of 1502.5 ± 291.3 μmol·L−1 and 1566.0 ± 252.8 μmol·L−1, respectively. These results indicate diurnal variations in surface Alk across both seasons.
The tides in the ZJB were of the irregular semidiurnal type. During the summer monitoring period, two high tides occurred at 12:00 and 0:00, with heights of 391 cm and 345 cm, respectively, and two low tides occurred at 6:00 and 18:00, with heights of 94 cm and 18 cm. The tidal range was 373 cm. During the winter monitoring period, two high tides occurred at 14:00 and 0:00, with heights of 275 cm and 424 cm, respectively, and two low tides occurred at 7:00 and 17:00, with heights of 57 cm and 165 cm. The tidal range was 367 cm.
In summer, the highest Alk values during the tidal cycle were observed in the estuarine, inner bay, and mid-bay area during high tide, whereas the lowest values occurred in the bay mouth area. In winter, the highest Alk values during the tidal cycle were observed in the estuarine, mid-bay, and bay mouth area during high tide, although the timing of these maxima varied among sections. In contrast, the highest Alk values in the inner bay occurred during low tide. Correlations between surface seawater Alk and tidal height in different regions of the ZJB were also examined. In summer, significant positive correlations were found between daily Alk variation and tidal height in the estuary (R = 0.791, p < 0.05, n = 9) and inner bay (R = 0.862, p < 0.05, n = 8). In the mid-bay, Alk variation followed the same trend as tidal height, and no clear relationship was observed in the bay mouth area. In winter, a significant correlation was observed only in the estuary (R = 0.811, p < 0.05, n = 6), whereas no clear relationship was found in the inner bay, mid bay, or bay mouth areas.

3.4. Integrated Analysis of Factors Influencing Alk Variability

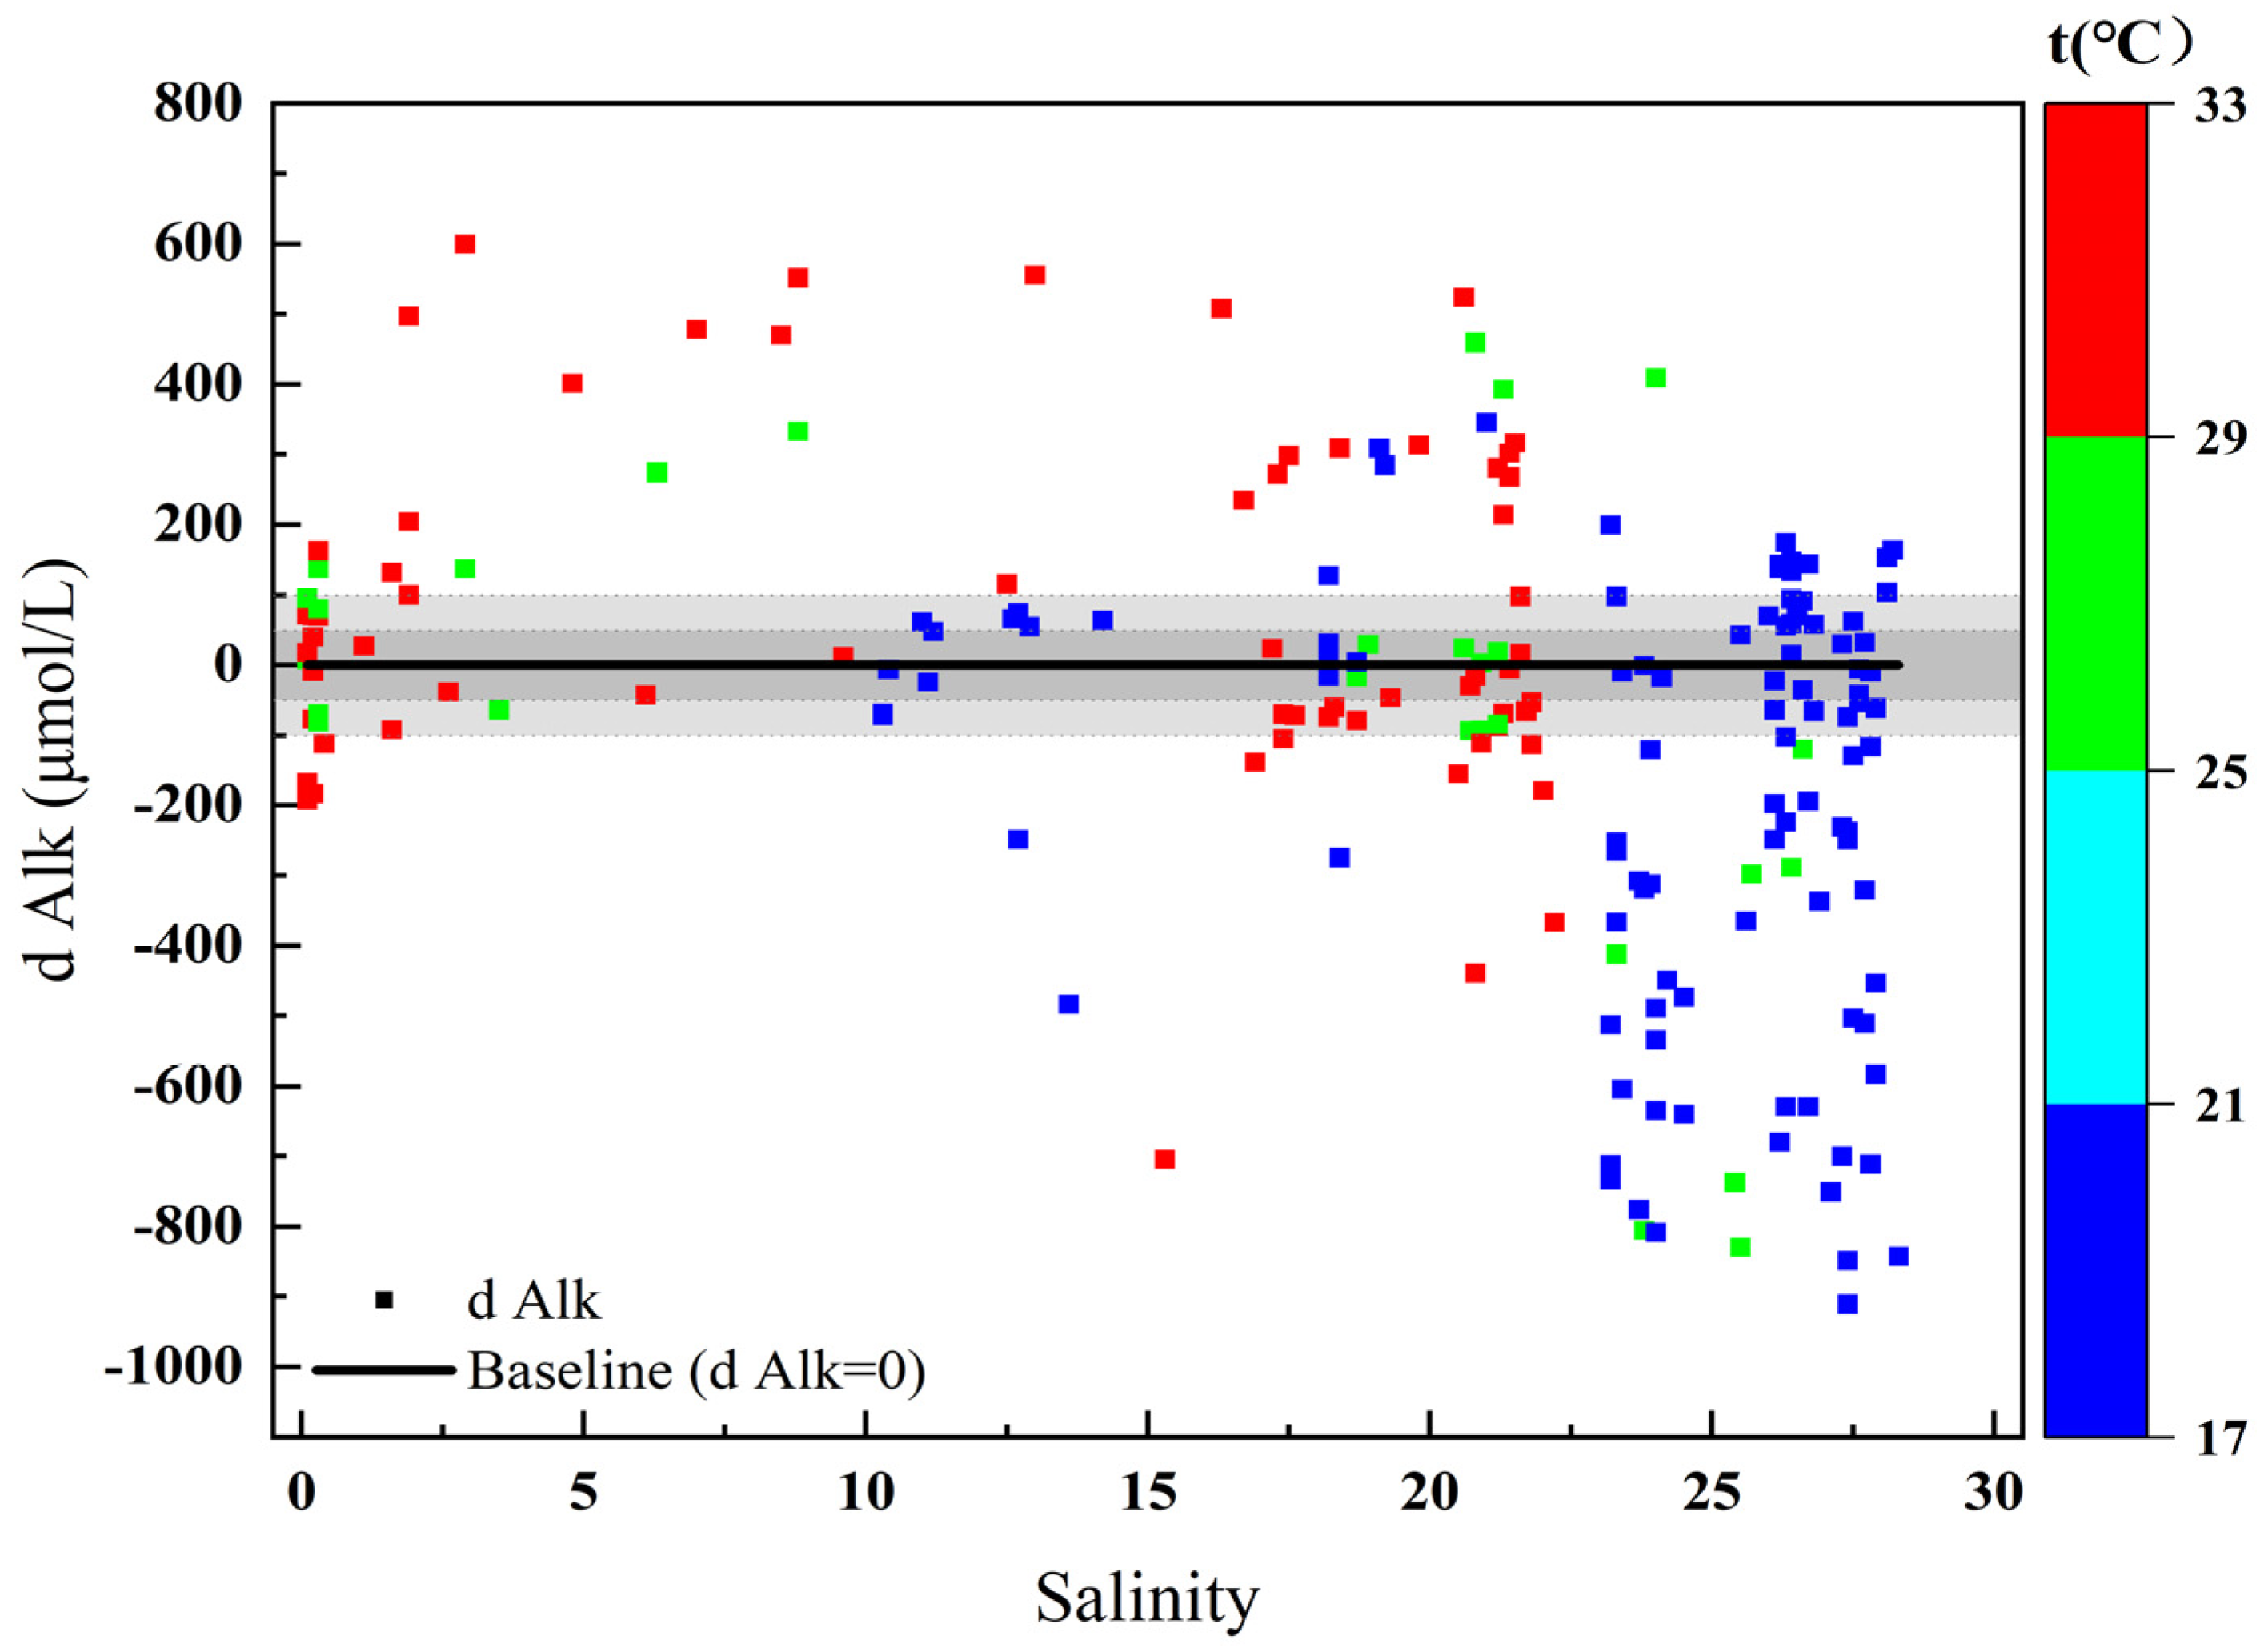
The deviation of measured alkalinity from the theoretical conservative mixing line (d Alk) along the salinity gradient is shown in Figure 7 for all surface water samples (n = 196). Positive dAlk values indicate net alkalinity addition, while negative values indicate net alkalinity removal. The d Alk values ranged widely from −910.27 to 600.74 μmol·L−1, with approximately 50% of the data falling within ±100 μmol·L−1 of the conservative mixing baseline (d Alk = 0). This distribution suggests that conservative mixing and non-conservative processes jointly influence variability in surface alkalinity. Seasonal differences in non-conservative biogeochemical processes were evident. In summer (t > 25 °C), net alkalinity addition (d Alk > 0) dominated, particularly in low-salinity regions (S < 10), i.e., the estuary zone. In winter (t < 21 °C), net alkalinity removal (d Alk < 0) prevailed in high-salinity regions (S > 20), corresponding to the inner, middle, and outer bay areas. The marked variation in d Alk along the salinity gradient reflects spatial heterogeneity in the dominant processes across different zones of Zhanjiang Bay. In the low-salinity zone (S < 5), net alkalinity addition was the primary process. In the transitional mid-salinity zone (S = 5–15), both addition and removal processes co-occurred. In the high-salinity zone (S > 15), net alkalinity removal was the dominant control.
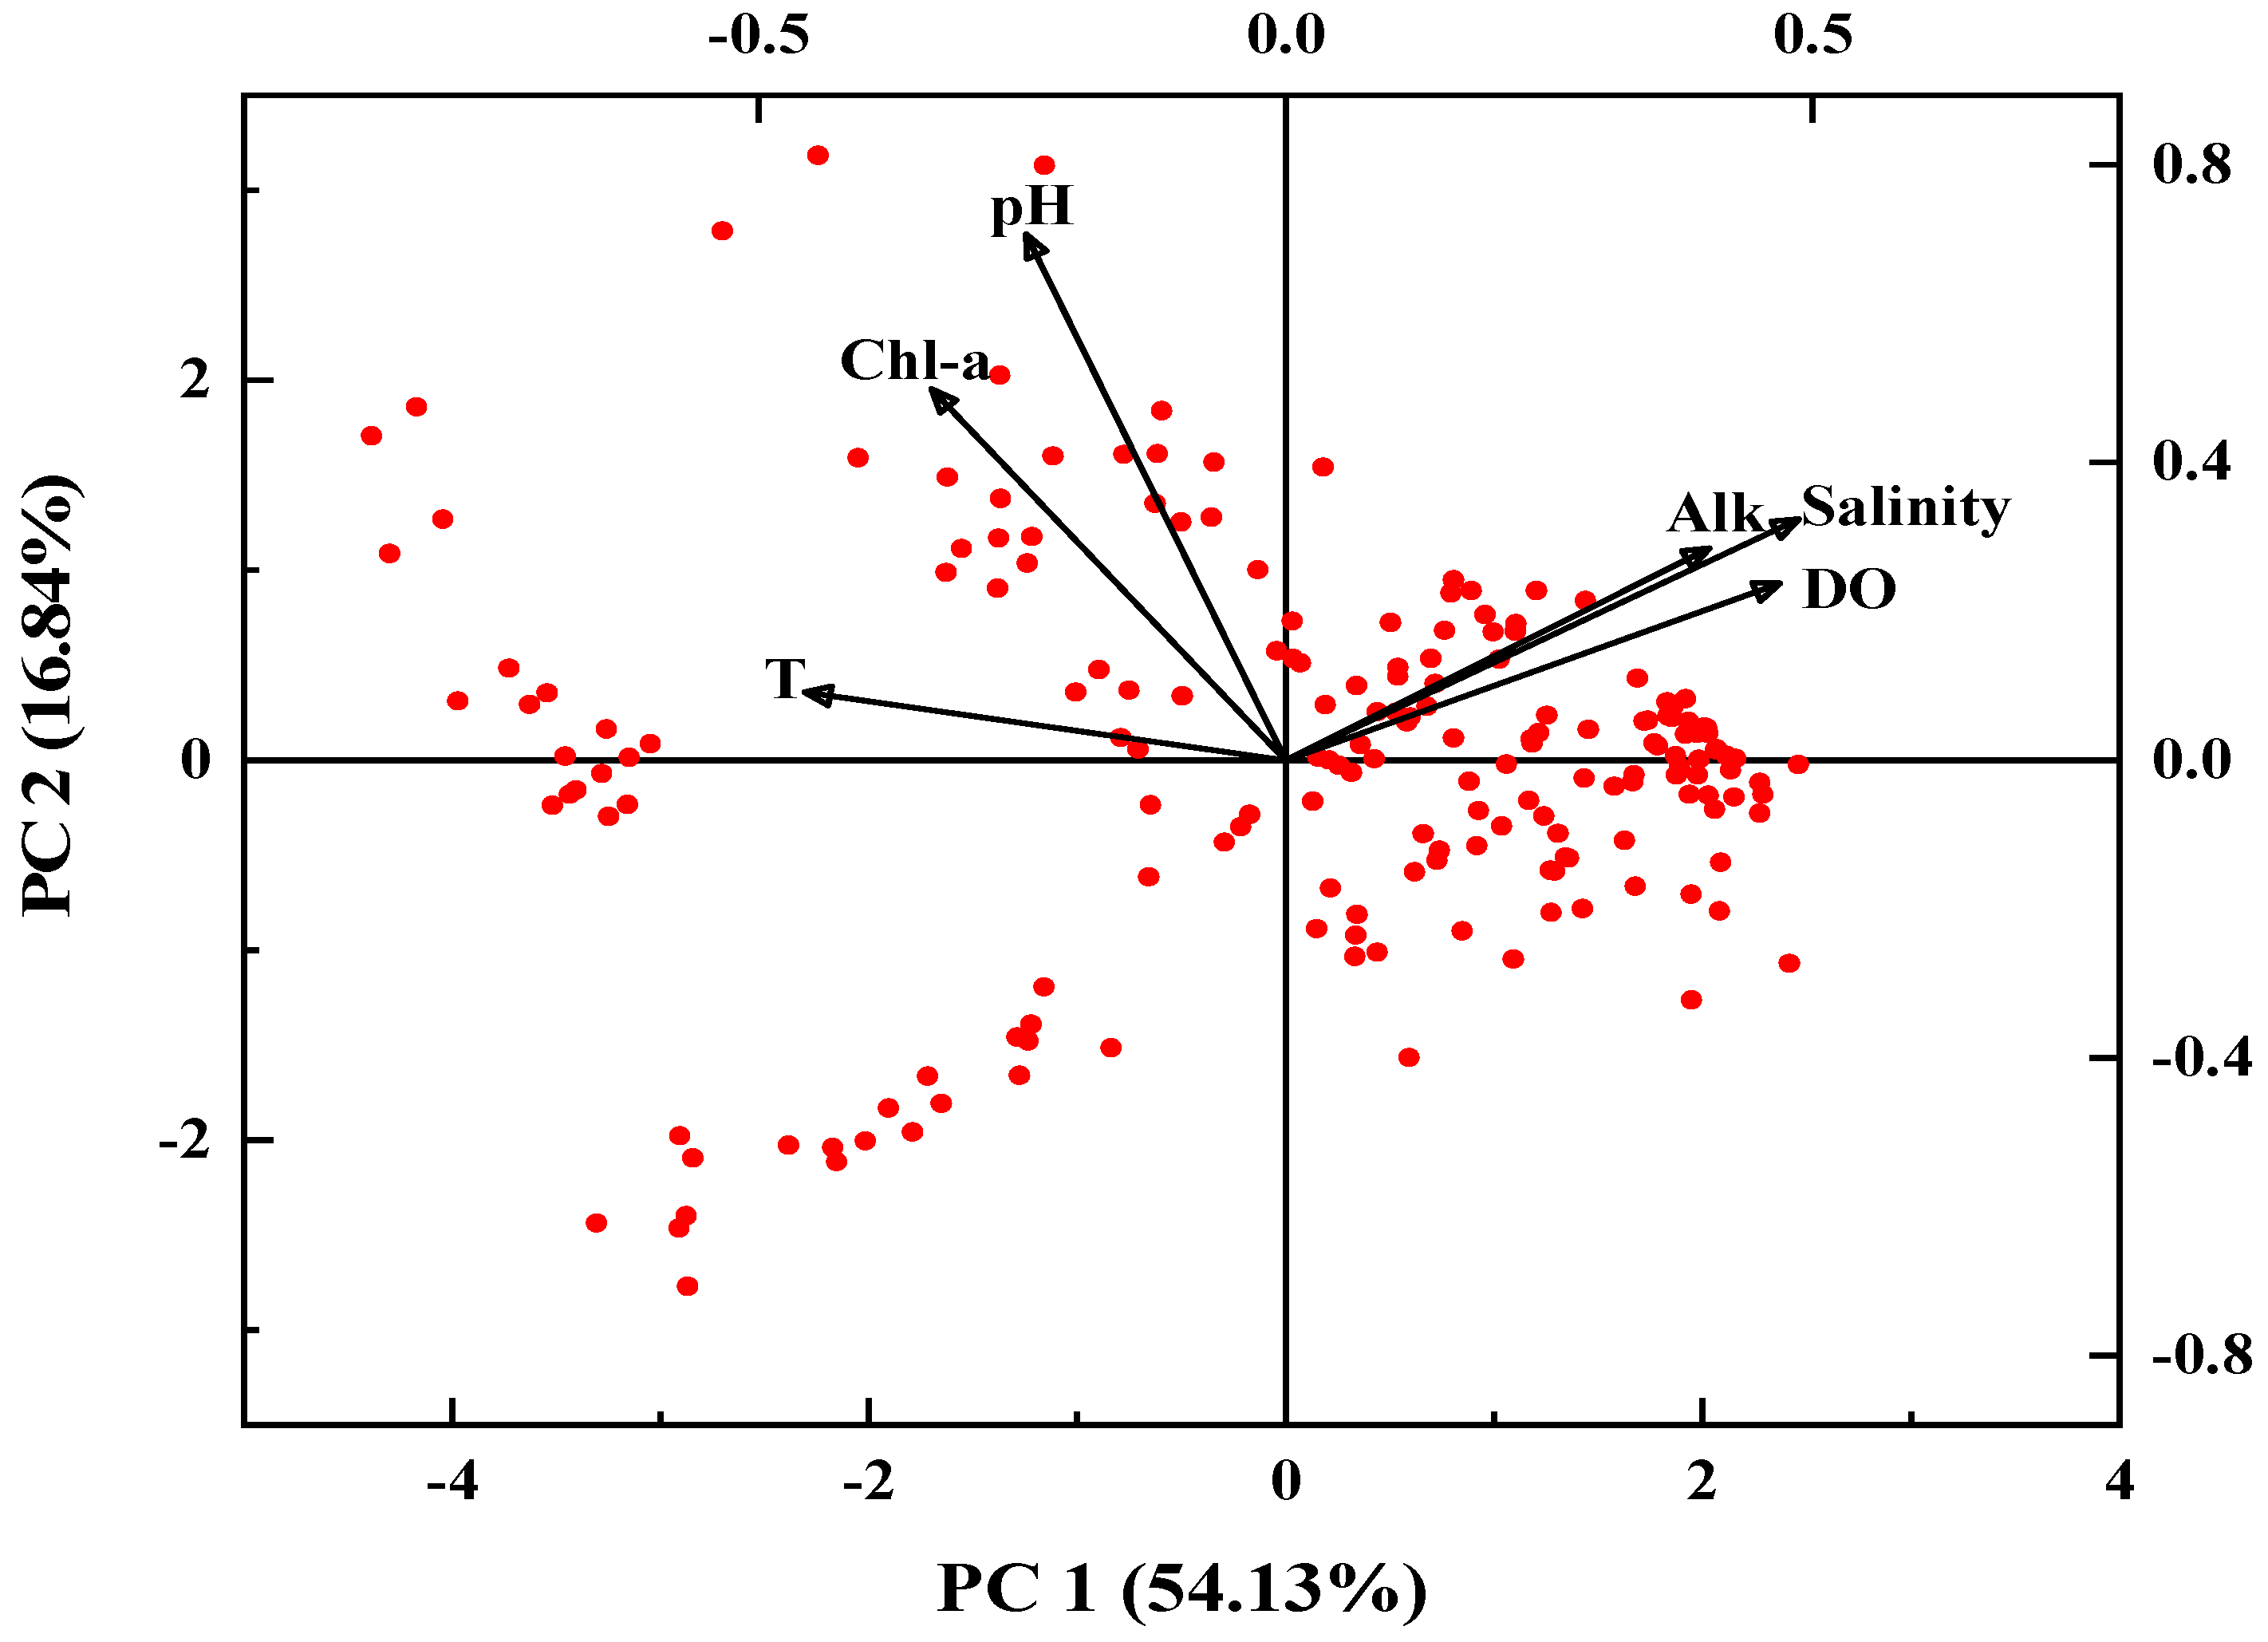
To identify environmental factors associated with alkalinity variability, principal component analysis (PCA) was performed on five variables: pH, chlorophyll a (Chl-a), salinity, dissolved oxygen (DO), and temperature (T). The results are presented in Figure 8. The first principal component (PC1) explained 54.13% of the total variance and showed strong positive loadings for Alk and salinity, and negative loadings for pH, Chl-a, and temperature. The close association between alkalinity and salinity on PC1 is consistent with the dAlk analysis, indicating that conservative mixing between freshwater and seawater accounts for approximately 50% of the variability in alkalinity. The second principal component (PC2) explained 16.84% of the total variance and was characterized primarily by positive loadings on pH and Chl-a, suggesting covariation between these two biological variables. Together, PC1 and PC2 indicate that biological activity (as reflected by pH and Chl-a) and thermal variability represent independent secondary gradients, likely related to seasonal differences or spatial heterogeneity in water residence time. These secondary factors may contribute to the remaining 50% of Alk variability not explained by conservative mixing.

4. Discussion

4.1. Comparison of Surface Alk Patterns with Other Estuaries and Bays

Compared with other estuaries and bays (Table 1), the overall mean surface Alk in ZJB (1489.02 ± 414.29 μmol·L−1) was generally lower and showed pronounced spatial and temporal heterogeneity. Specifically, Alk values in the ZJB were lower than those reported for temperate systems such as Narragansett Bay, Roskilde Fjord, Skive Fjord, Kiel Fjord, the Main Basin of Puget Sound, and Jiaozhou Bay. However, they were comparable to the lower Alk values observed in the Patos Lagoon Estuary, which, like the ZJB, is located in a subtropical region influenced by monsoon precipitation. In such subtropical settings, substantial freshwater input from precipitation and adjacent rivers leads to generally lower surface salinity in estuaries and bays, which in turn provides a reasonable explanation for the overall lower Alk levels [26].
Under the influence of seawater intrusion from the outer bay, surface salinity in the ZJB exhibited a decreasing gradient from the bay mouth towards the estuary (Table 1). Correspondingly, Alk showed an increasing trend from the estuary to the mid-bay, with values ranging from 1071.7 ± 351.1 μmol·L−1 in the estuary to 1748.4 ± 288.8 μmol·L−1 in the mid-bay area. This inverse relationship between salinity and Alk is consistent with the typical mixing pattern observed in other coastal systems, such as the progressive increase in Alk from river-dominated upper bays to marine-influenced lower bays reported in Narragansett Bay [34] and Chesapeake Bay [51].
Seasonally, the ZJB exhibited higher winter Alk in the estuary, mid-bay, and bay mouth area. This pattern aligns with observations in the Changjiang River estuary and in the Upper and Mid-Bay of Chesapeake Bay, where winter Alk also exceeded summer Alk. In all these systems, elevated winter Alk is likely driven by reduced freshwater dilution and increased mixing with high-Alk offshore water. Notably, the inner bay of the ZJB showed the opposite pattern, which will be discussed in detail in 4.2. However, quantifying the contributions of mixing versus other potential drivers (e.g., biological production, sediment exchange) would require additional carbonate system measurements.
Table 1. The concentrations of Alk for bays and estuaries worldwide.
Study AreaAlk (μmol/L)Reference
SummerWinter
Narragansett Bay (North)1881 ± 231820 ± 41[34]
Narragansett Bay (South)2012 ± 132022 ± 20[34]
Changjiang
River estuary
1767 ± 352156 ± 156[52]
Chesapeake Bay
(Upper Bay)
989.8 ± 141.01249.2 ± 100.9[51]
Chesapeake Bay
(Mid-Bay)
1504.6 ± 98.41571.4 ± 77.6[51]
Chesapeake Bay
(Lower Bay)
1902.5 ± 195.01866.9 ± 136.0[51]
Roskilde Fjord/1970 ± 28[53]
Skive Fjord/2070 ± 310[53]
Kiel Fjord1970 ± 21.5/[54]
Main Basin
(Puget Sound)
2052 ± 202041 ± 6[55]
Pearl River
(upper estuarine)
746–15702444–3094[33]
Patos Lagoon Estuary1364 ± 6071300 ± 618[26]
Jiaozhou Bay, China2049–2378/[56]
ZJB (Estuary)958.72 ± 345.721316.38 ± 215.21This study
ZJB (Inner Bay)1851.91 ± 155.111491.77 ± 244.88This study
ZJB (Mid-Bay)1628.14 ± 173.921881.78 ± 193.47This study
ZJB (Baymouth)1688.57 ± 241.541692.75 ± 215.21This study
Note(s): (“/” representation without monitoring data).

4.2. Saltwater Mixing and Its Influence on Seasonal Alkalinity Variation

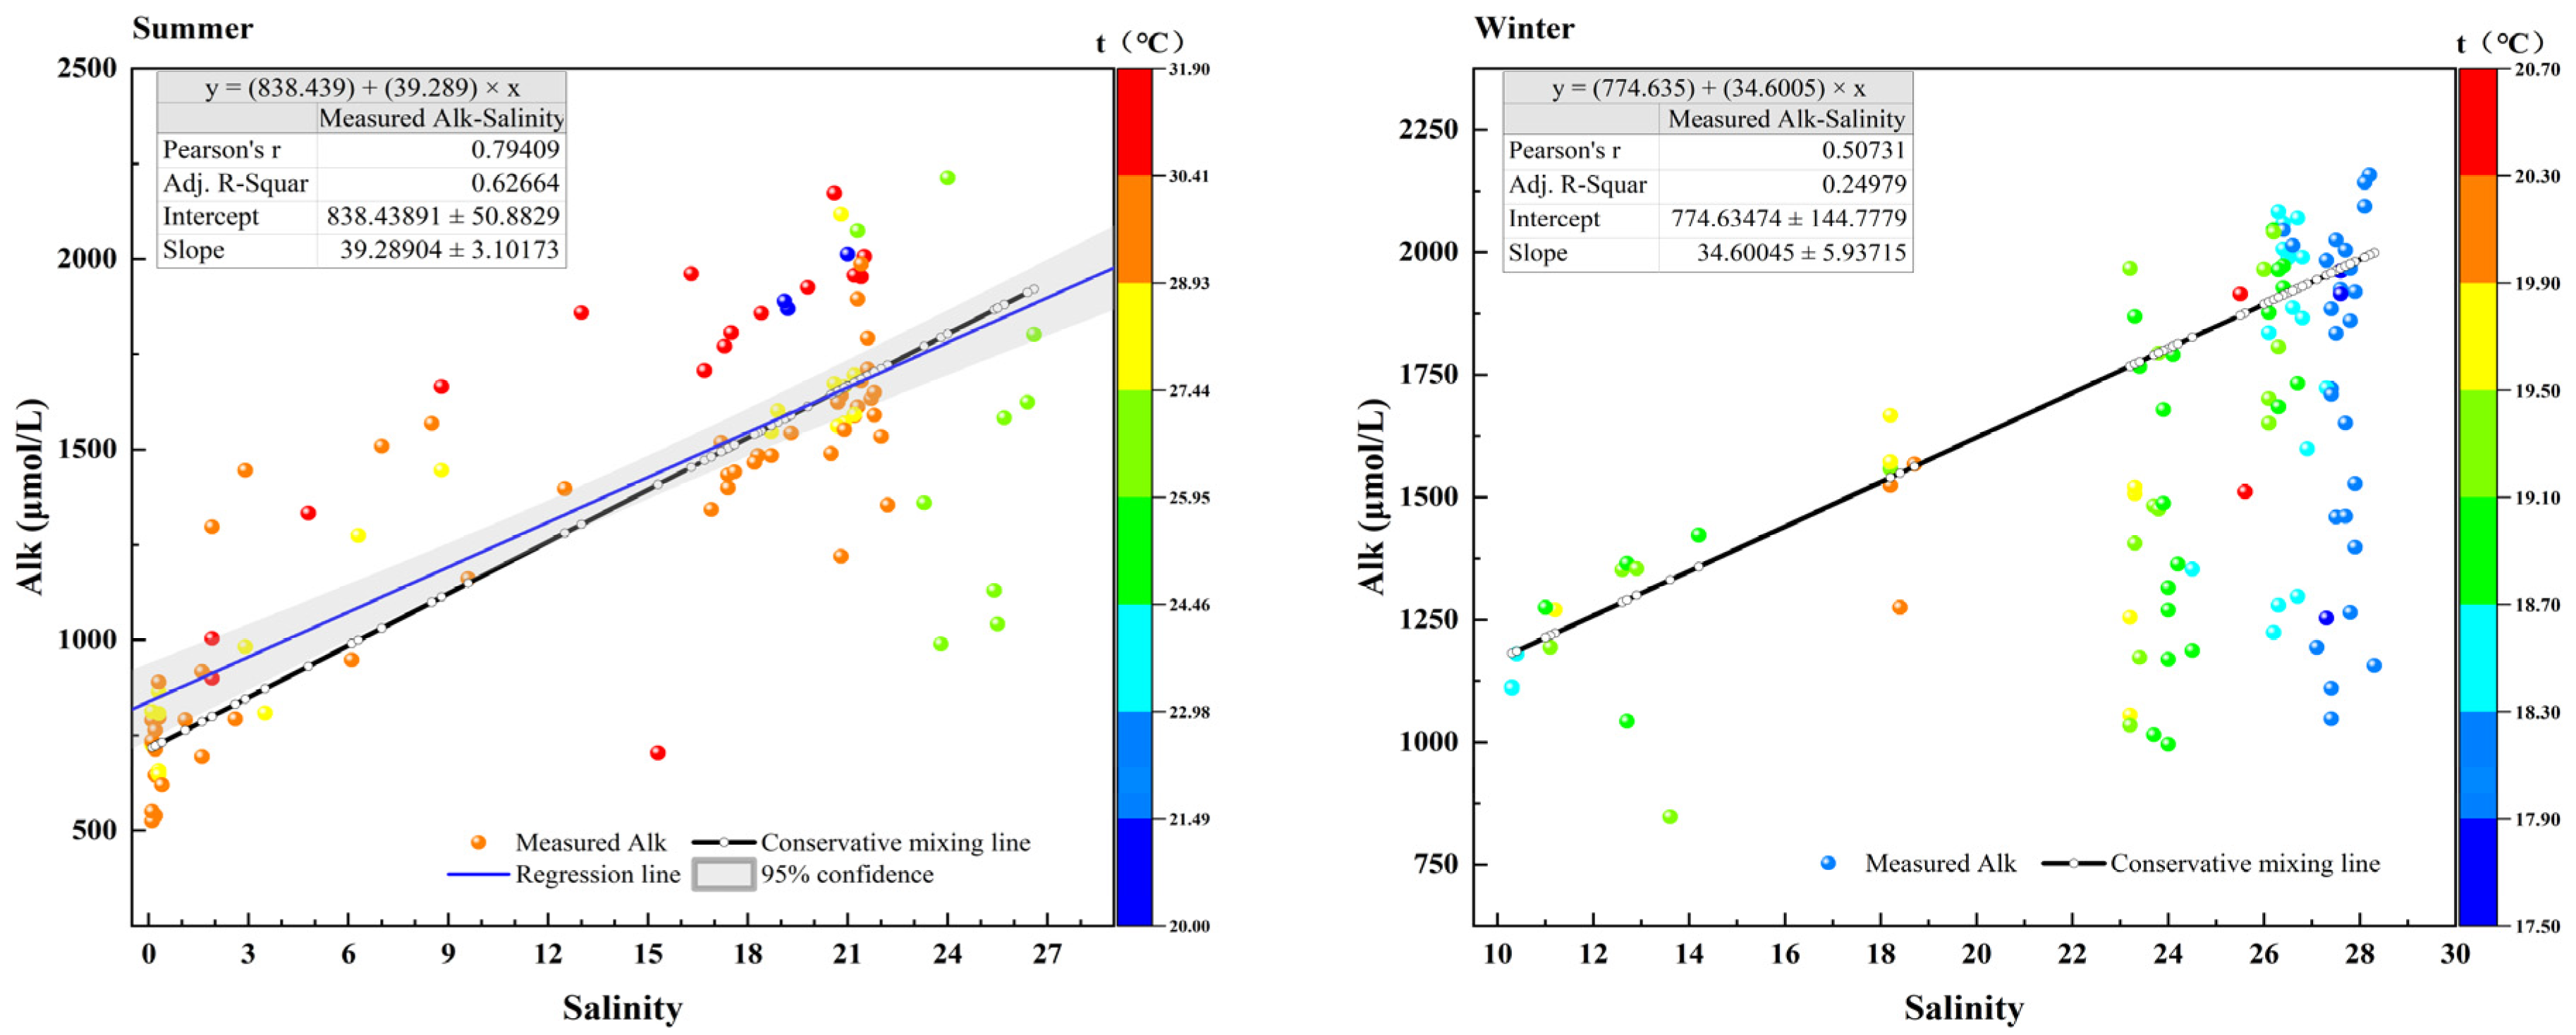
In most areas of the ZJB, winter Alk is higher than in summer. In contrast, the inner bay shows the opposite trend, suggesting that multiple environmental factors shape seasonal Alk patterns in this system. It is well established that in subtropical waters, the Alk-salinity ratio remains relatively constant, and salinity fluctuations driven by hydrological balance (such as precipitation, river runoff, and water mixing) explain approximately 80% of total Alk variation [57]. The Alk-salinity relationship in the ZJB exhibits significant seasonal differences (Figure 9). Assuming conservative mixing between riverine freshwater and offshore South China Sea water, the S-Alk distribution follows a single mixing line (Figure 9). The positions of summer and winter data points relative to this conservative mixing line show marked seasonal differences.
In the low-salinity zone (S < 10), tidal observations indicate a deviation from conservative mixing (d Alk) of 97.86 ± 254.70 μmol·L−1. This large standard deviation, which exceeds the mean, indicates substantial variability in non-conservative processes near the freshwater end-member. The modest net Alk addition (d Alk > 0) observed in the estuary zone may be attributed to two factors: (1) contrasting Alk backgrounds of the river inputs at Stations S1 and S2, and (2) the relatively low abundance of weathering products (silicate and carbonate minerals) in rivers of the subtropical Zhanjiang region [58].
The correlation between Alk and salinity was significantly stronger in summer (Fisher’s z = 2.52, p = 0.012; Spearman’s ρ = 0.706, n = 96, p < 0.001) than in winter (Spearman’s ρ = 0.473, n = 100, p < 0.001). The theoretical conservative mixing line fell within the 95% confidence interval of the summer regression line (fitted for visualisation purposes only) (Figure 9). These results indicate that summer Alk variation was primarily controlled by salinity changes associated with conservative mixing. In contrast, the weaker winter correlation suggests that non-conservative processes (e.g., biological respiration, mineralisation, and photosynthesis) may play a more important role. Such seasonal differences in Alk associated with freshwater fluxes (evaporation, precipitation, and runoff) have been reported in other subtropical systems [59], including the Patos Lagoon Estuary [26], the Pearl River Estuary [60], and Kinvara Bay [19].
Heavy precipitation dilutes seawater, increasing the solubility of substances and lowering alkalinity. In estuarine areas dominated by riverine input, increased precipitation increases net river discharge, diluting seawater salinity and reducing Alk [57], except in limestone catchment areas. Consistent with this mechanism, summer 2023 in Zhanjiang received exceptionally high precipitation (2033.4 mm; Zhanjiang Climate Bulletin 2023) [61], including heavy rainfall during May–June and additional rainfall associated with Typhoon Haikui in September. Consequently, freshwater discharge into ZJB increased substantially, leading to strong dilution of surface seawater and resulting in significantly lower salinity and Alk in summer than in winter (Figure 2).
Sea surface salinity (SSS) and sea surface temperature (SST) can be used to analyse seawater Alk [62], and the observed correlation between temperature and Alk variations aligns with our PCA results (Figure 8). In winter, evaporation is the dominant process governing water volume in the ZJB, increasing salinity and, consequently, Alk, with the most pronounced effect in the estuary area (Figure 4). However, due to the complex interactions among hydrological and biological processes in coastal estuarine waters, it is difficult to establish a simple linear relationship between Alk and salinity or temperature in the ZJB [57], unlike in open ocean environments.

4.3. Non-Conservative Processes: Biological and Biogeochemical Controls on Seasonal Alkalinity Variation

Temperature influences Alk indirectly by modulating biological processes. In summer, high temperatures and typhoons create favorable conditions for algal blooms [7]. The subsequent decomposition of large amounts of organic matter consumes oxygen and releases CO2, which can decrease Alk in the water column. This may partly explain why summer Alk (1373 μmol·L−1) is lower than winter Alk (1602 μmol·L−1) in the ZJB. However, the strong positive Alk–salinity correlation in summer (ρ = 0.706, p < 0.001) suggests that physical mixing, rather than biological processes, is the primary control on Alk distribution during summer. In the mid- to high-salinity zone (S > 10), localized biological processes such as denitrification [39,63] may partially offset the Alk decrease caused by respiration. These complex interactions may explain why the seasonal Alk difference between summer and winter is relatively small in the mid-bay and estuary regions.
The inner bay of the ZJB has long been a concentrated area for oyster farming [47]. During the summer oyster bloom, low Chl-a concentrations were observed in the inner bay [41], attributable to intensive phytoplankton filtration by oysters [64]. Oyster feeding activities produce large amounts of organic matter, which can enhance organic carbon deposition and increase benthic respiration. Additionally, the dissolution of calcium carbonate (CaCO3) in sediments from the oyster farming area may elevate Alk [65], contributing to the higher Alk observed in the inner bay compared to other areas. However, due to a lack of measurement data on the sedimentary carbonate system, it is difficult to clearly determine the specific impact of current oyster farming on changes in alkalinity.
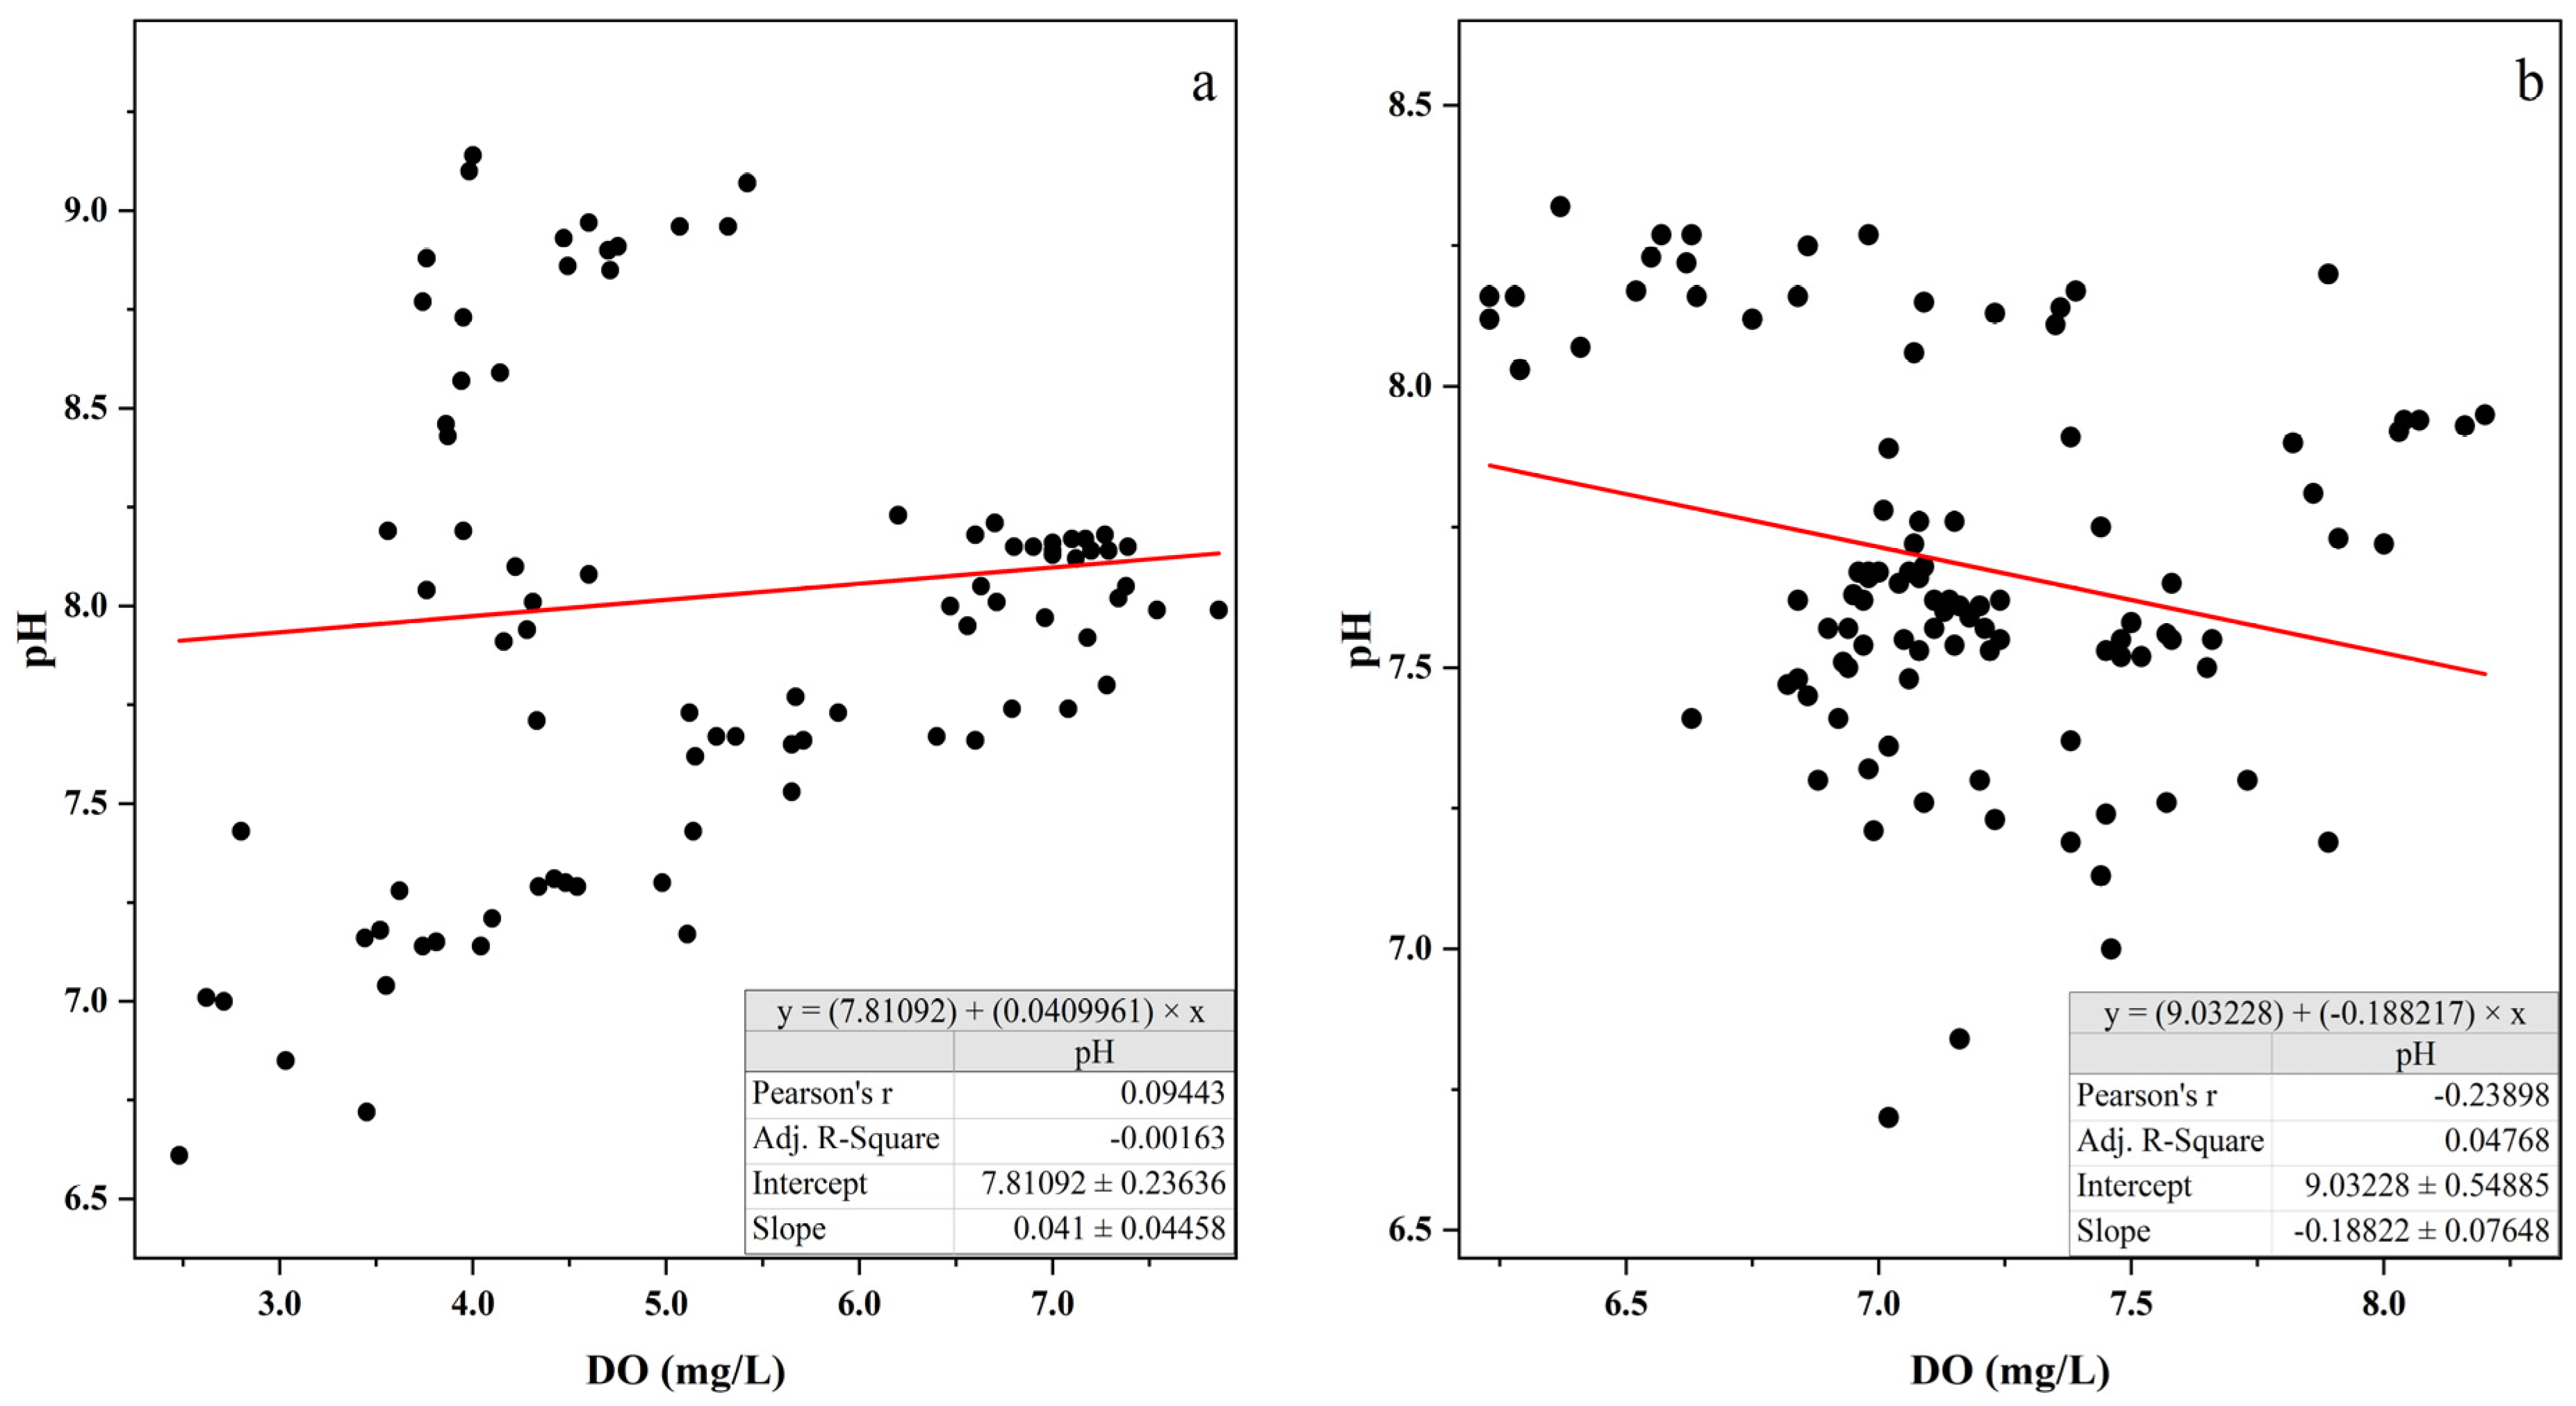
Except for the inner bay area, low DO, high Chl-a, and high pH were observed in summer, whereas high DO, low Chl-a, and low pH were observed in winter (Figure 2). Spearman’s rank correlation analysis of DO-pH (Figure 10) showed no significant correlation in summer (ρ = 0.095, n = 96, p = 0.356), but a weak negative correlation in winter (ρ = −0.224, n = 102, p = 0.023). Lower DO in summer (associated with higher Chl-a) suggests enhanced biological respiration and decomposition following algal blooms. This process consumes organic matter and releases CO2, which can decrease Alk. This interpretation is consistent with the observation that summer Alk (1373 μmol·L−1) is lower than winter Alk (1602 μmol·L−1).
The significant winter DO-pH correlation implies a closer coupling between biological respiration and carbonate chemistry during winter. The weaker Alk–salinity correlation in winter (ρ = 0.473) compared to summer (ρ = 0.706) suggests that biological processes play a relatively more important role in modulating Alk dynamics during winter, a pattern similar to that reported in Tong’an Bay, Xiamen [36]. The metabolism of benthic communities is known to significantly influence carbon and oxygen dynamics in subtropical estuarine waters [66].
Future studies should include systematic investigations of benthic ecological communities in the ZJB to constrain better the influence of benthic biological activity on Alk dynamics. At present, it is difficult to quantitatively separate the effects of calcium carbonate precipitation/dissolution and biological processes on seasonal Alk variations, owing to the lack of sediment surveys in oyster-farming areas and the absence of key carbonate system parameters, including calcium carbonate saturation state, pCO2, and dissolved inorganic carbon (DIC), in the ZJB water column.

4.4. Influence of Tide Forcing on Diurnal Alk Variations in ZJB

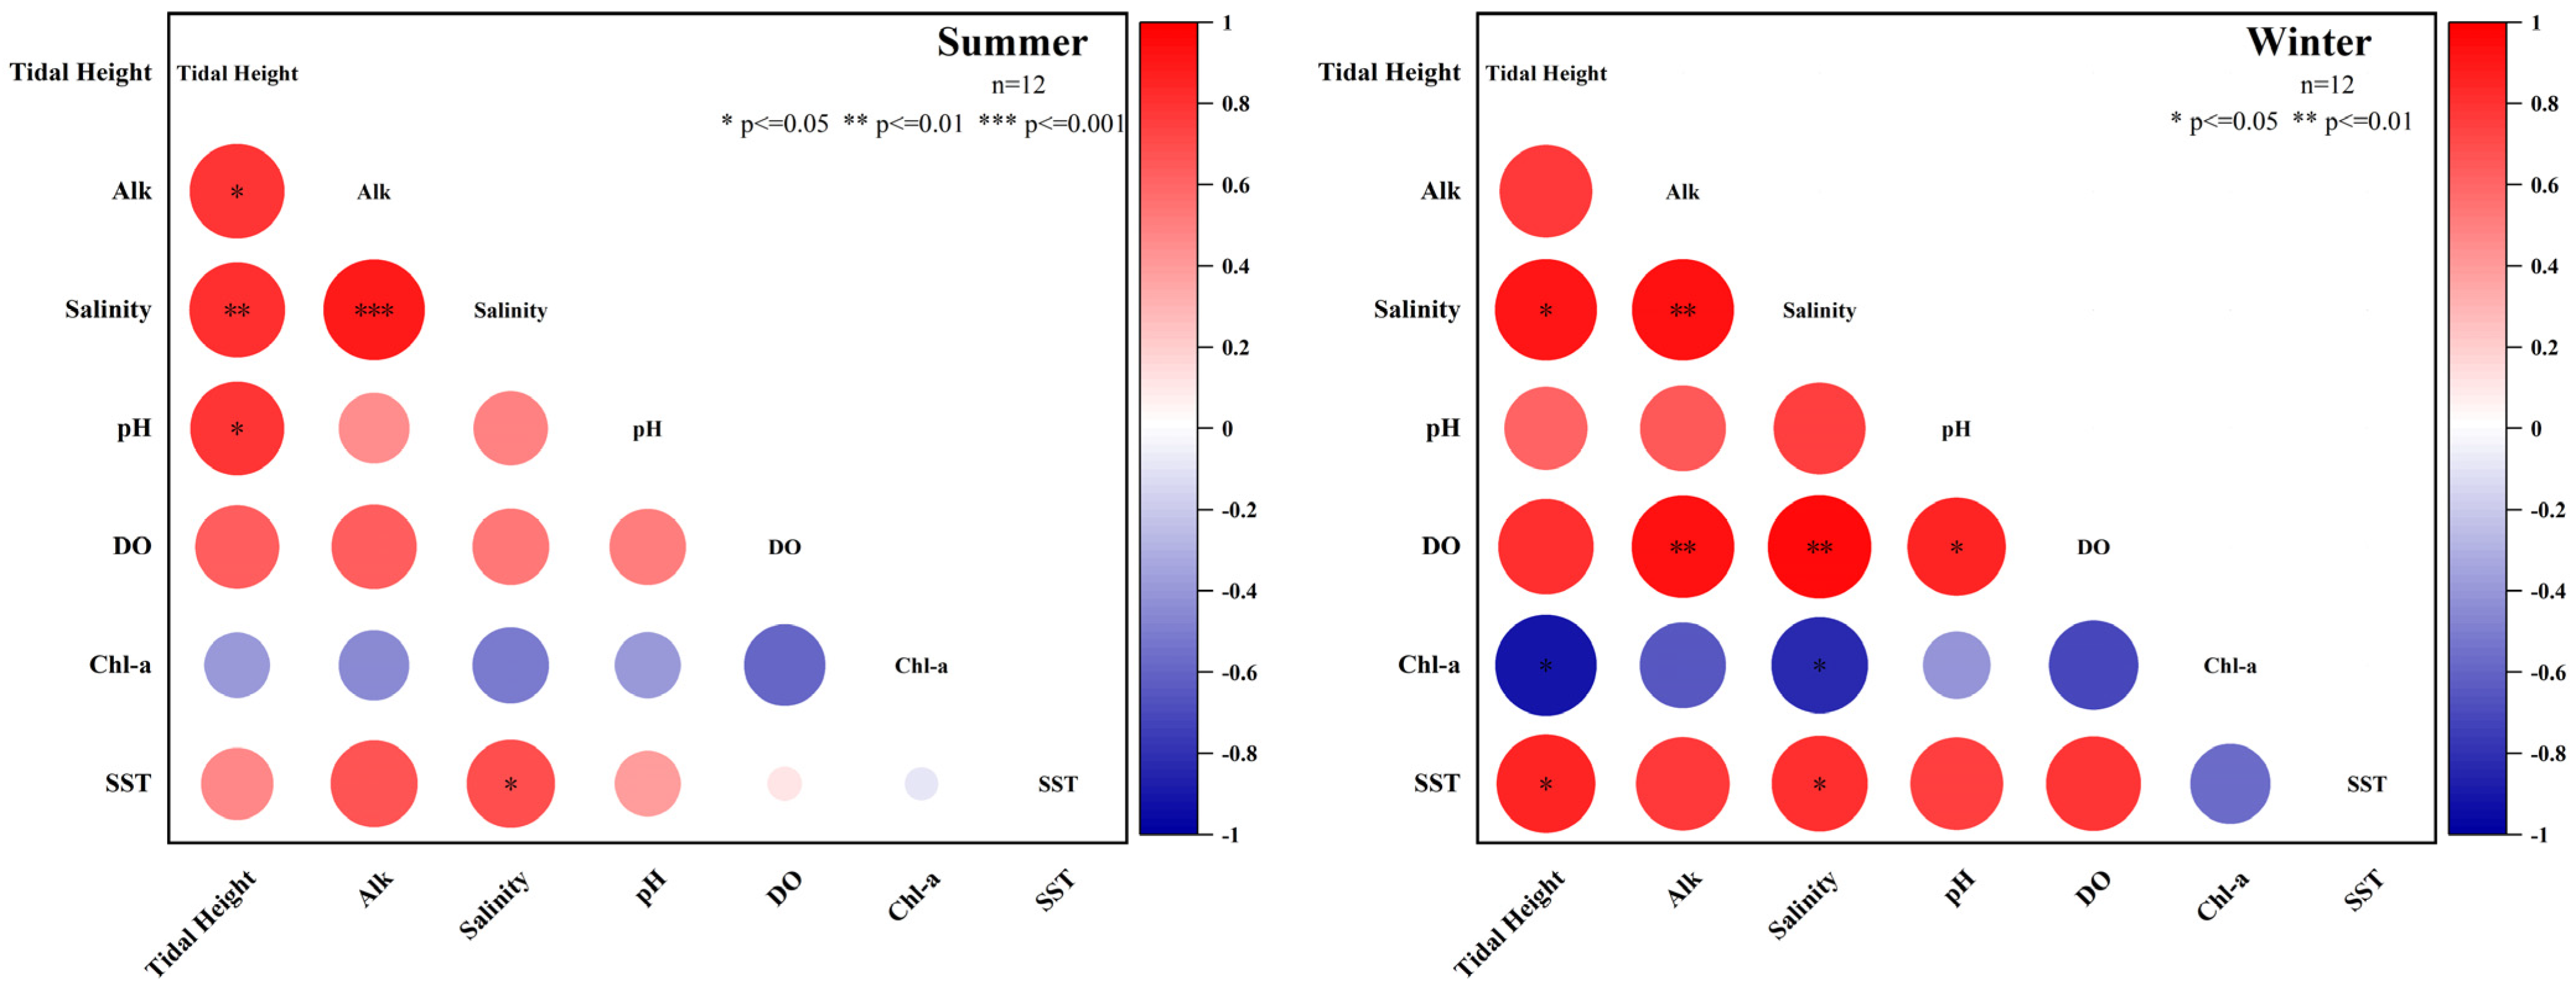
In the estuarine region, salinity and Alk exhibited consistent tidal patterns, with higher salinity and Alk at high tide and lower values at low tide (Figure 5 and Figure 6). A strong positive correlation was observed (showed in Figure 11) between salinity and Alk in both summer (R = 0.690, p < 0.01) and winter (R = 0.702, p < 0.01). Tidal action drives dramatic salinity changes by mixing high-salinity seawater from the outer bay with low-salinity freshwater from upriver [47]. Given this strong coupling, rapid salinity variation is likely a primary driver of diurnal Alk variation in the estuarine region. In summer, surface salinity in the inner bay was anomalously low due to heavy precipitation. Nevertheless, a positive correlation was observed between Alk and salinity (R = 0.551, p < 0.05), suggesting that tidal-driven salinity changes may be one environmental factor affecting diurnal Alk variation in this area.
In winter, the highest Alk values in the inner bay were observed at low tide (Figure 6), and salinity changes were significantly correlated with tidal range (R = 0.892, p < 0.05). Similar observations of high Alk at low tide have been reported in the Wadden Sea [67] and Tongan Bay [36], where tidal pumping of remineralised organic matter from intertidal flats increases surface-water Alk. Oyster farming has enriched the inner-bay sediments with abundant organic matter. In winter, lower dissolved oxygen in the inner bay compared with other areas (Figure 2) is consistent with ongoing aerobic mineralisation of organic matter, which may increase surface-water Alk under tidal pumping [68]. During ebb tide, inorganic substances produced by intertidal organisms are transported into the water column, potentially contributing to the higher Alk observed at low tide.
In the mid-bay and bay-mouth regions, no significant correlation was observed between tidal forcing and salinity variations. However, Alk variation in the mid-bay followed the tidal height trend. This pattern may be associated with upwelling-driven input of high-Alk seawater from outside the bay [46], which could increase Alk in the mid-bay region. Overall, although the influence of tides on Alk variations exhibited regional differences, tidal forcing can still be considered an indirect factor affecting the spatial distribution of Alk in the ZJB.

5. Conclusions

This study investigated the spatial and seasonal variations in surface seawater alkalinity (Alk) and their associations with environmental factors (salinity, dissolved oxygen, and temperature) in the ZJB during the summers and winters of 2023. The main findings are as follows:
(1)
Driven by precipitation and river discharge, the mean surface Alk in the ZJB was 1373.06 ± 420.95 μmol·L−1 in summer and 1612.31 ± 343.71 μmol·L−1 in winter. Compared with other estuaries and bays worldwide, overall Alk levels in the ZJB were generally lower, but the spatial and seasonal variation patterns were broadly similar.
(2)
Salinity, temperature, and dissolved oxygen (DO) were significantly associated with Alk variations in the ZJB. The significant positive correlation between Alk and salinity in summer suggests that high-salinity seawater input was a dominant influence. In contrast, the weaker Alk–salinity correlation in winter suggests that biological processes linked to DO variations may play a more important role in modulating Alk dynamics during winter.
(3)
Tidal forcing was significantly correlated with diurnal Alk variations in the estuary and inner bay (p < 0.05). The mechanisms underlying these diurnal variations appeared to differ between regions: tidal-driven mixing between freshwater and seawater was the primary factor influencing diurnal Alk variation in the estuary, whereas tidal pumping may explain the elevated Alk observed during low tide in the inner bay.
This study provides baseline data on the spatial and seasonal variation in surface Alk in the ZJB and identifies potential environmental drivers of these patterns. These findings advance understanding of the inorganic carbon cycle and buffering capacity in subtropical estuarine bays. However, several limitations should be acknowledged. First, organic alkalinity in biologically productive coastal estuaries may introduce uncertainty into Alk measurements. Second, the lack of sediment Alk data and the absence of key carbonate system parameters (e.g., partial pressure of carbon dioxide, dissolved inorganic carbon) preclude a detailed assessment of biological effects on Alk dynamics. Therefore, future studies should include long-term, systematic monitoring of the full carbonate system in the ZJB to constrain better the mechanisms controlling Alk variations.

Author Contributions

L.S.: Investigation, Formal analysis, Visualization, Writing—original draft, Writing—editing & review. Y.H.: Investigation, Formal analysis, Visualization, Writing—original draft, Writing—editing & review. X.H.: Formal analysis, Visualization. G.Y.: Resources, Visualization, Funding acquisition. J.Z.: Conceptualization, Funding acquisition, Methodology & project administration, Writing—review. P.Z.: Writing—review, supervision, and Funding acquisition. All authors have read and agreed to the published version of the manuscript.

Funding

Research and Development Projects in Key Areas of Guangdong Province (2020B1111020004), Guangdong Basic and Applied Basic Research Foundation (2020A1515110483), Guangdong Basic and Applied Basic Research Foundation (2023A1515012769), University Scientific Research Fund for a Ph.D Start-up of Guangdong Ocean University (No. R25020).

Data Availability Statement

The original contributions presented in this study are included in the article. Further inquiries can be directed to the corresponding authors.

Acknowledgments

Thanks for the financial support provided by Research and Development Projects in Key Areas of Guangdong Province (2020B1111020004), Guangdong Basic and Applied Basic Research Foundation (2020A1515110483), Guangdong Basic and Applied Basic Research Foundation (2023A1515012769), and University Scientific Research Fund for a Ph.D Start-up of Guangdong Ocean University (No. R25020). Special thanks to reviewers for their careful review and constructive suggestions. Thanks to all members of the research team and others involved in this study.

Conflicts of Interest

The authors declare that they have no known competing financial interests or personal relationships that could have appeared to influence the work reported in this paper.

References

  1. Friedlingstein, P.; O’sullivan, M.; Jones, M.W.; Andrew, R.M.; Hauck, J.; Olsen, A.; Peters, G.P.; Peters, W.; Pongratz, J.; Sitch, S.; et al. Global Carbon Budget 2020. Earth Syst. Sci. Data 2020, 12, 3269–3340. [Google Scholar] [CrossRef]
  2. Rogelj, J.; Popp, A.; Calvin, K.V.; Luderer, G.; Emmerling, J.; Gernaat, D.; Fujimori, S.; Strefler, J.; Hasegawa, T.; Marangoni, G.; et al. Scenarios towards limiting global mean temperature increase below 1.5 °C. Nat. Clim. Change 2018, 8, 325–332. [Google Scholar] [CrossRef]
  3. Park, M.; Johnson, N.C.; Delworth, T.L. The driving of North American climate extremes by North Pacific stationary-transient wave interference. Nat. Commun. 2024, 15, 7318. [Google Scholar] [CrossRef] [PubMed]
  4. Gruber, N.; Clement, D.; Carter, B.R.; Feely, R.A.; van Heuven, S.; Hoppema, M.; Ishii, M.; Key, R.M.; Kozyr, A.; Lauvset, S.K.; et al. The oceanic sink for anthropogenic CO2 from 1994 to 2007. Science 2019, 363, 1193–1199. [Google Scholar] [CrossRef] [PubMed]
  5. Orr, J.C.; Fabry, V.J.; Aumont, O.; Bopp, L.; Doney, S.C.; Feely, R.A.; Gnanadesikan, A.; Gruber, N.; Ishida, A.; Joos, F.; et al. Anthropogenic ocean acidification over the twenty-first century and its impact on calcifying organisms. Nature 2005, 437, 681–686. [Google Scholar] [CrossRef] [PubMed]
  6. Yao, H.; Wang, J.; Han, Y.; Jiang, X.; Chen, J. Decadal acidification in a subtropical coastal area under chronic eutrophication. Environ. Pollut. 2022, 293, 118487. [Google Scholar] [CrossRef]
  7. Zhang, Z.; Yi, L. Processes controlling seawater acidification in offshore aquaculture system of China. Reg. Stud. Mar. Sci. 2024, 75, 103582. [Google Scholar] [CrossRef]
  8. Egleston, E.S.; Sabine, C.L.; Morel, F.M.M. Revelle revisited: Buffer factors that quantify the response of ocean chemistry to changes in DIC and alkalinity. Glob. Biogeochem. Cycles 2010, 24, GB1002. [Google Scholar] [CrossRef]
  9. Lehmann, N.; Stacke, T.; Lehmann, S.; Lantuit, H.; Gosse, J.; Mears, C.; Hartmann, J.; Thomas, H. Alkalinity responses to climate warming destabilise the Earth’s thermostat. Nat. Commun. 2023, 14, 1648. [Google Scholar] [CrossRef]
  10. Fakhraee, M.; Planavsky, N.J.; Reinhard, C.T. Ocean alkalinity enhancement through restoration of blue carbon ecosystems. Nat. Sustain. 2023, 6, 1087–1094. [Google Scholar] [CrossRef]
  11. Aufdenkampe, A.K.; Mayorga, E.; Raymond, P.A.; Melack, J.M.; Doney, S.C.; Alin, S.R.; Aalto, R.E.; Yoo, K. Riverine coupling of biogeochemical cycles between land, oceans, and atmosphere. Front. Ecol. Environ. 2011, 9, 53–60. [Google Scholar] [CrossRef]
  12. Cotovicz, L.C.; Vidal, L.O.; De Rezende, C.E.; Bernardes, M.C.; Knoppers, B.A.; Sobrinho, R.L.; Cardoso, R.P.; Muniz, M.; dos Anjos, R.M.; Biehler, A.; et al. Carbon dioxide sources and sinks in the delta of the Paraíba do Sul River (Southeastern Brazil) modulated by carbonate thermodynamics, gas exchange and ecosystem metabolism during estuarine mixing. Mar. Chem. 2020, 226, 103869. [Google Scholar] [CrossRef]
  13. Lenton, A.; Matear, R.J.; Keller, D.P.; Scott, V.; Vaughan, N.E. Assessing carbon dioxide removal through global and regional ocean alkalinization under high and low emission pathways. Earth Syst. Dynam. 2018, 9, 339–357. [Google Scholar] [CrossRef]
  14. Najjar, R.G.; Herrmann, M.; Cintrón Del Valle, S.M.; Friedman, J.R.; Friedrichs, M.A.M.; Harris, L.A.; Shadwick, E.H.; Stets, E.G.; Woodland, R.J. Alkalinity in Tidal Tributaries of the Chesapeake Bay. J. Geophys. Res. Ocean. 2020, 125, e2019JC015597. [Google Scholar] [CrossRef]
  15. Wolf-Gladrow, D.A.; Zeebe, R.E.; Klaas, C.; Körtzinger, A.; Dickson, A.G. Total alkalinity: The explicit conservative expression and its application to biogeochemical processes. Mar. Chem. 2007, 106, 287–300. [Google Scholar] [CrossRef]
  16. Bockmon, E.E.; Dickson, A.G. An inter-laboratory comparison assessing the quality of seawater carbon dioxide measurements. Mar. Chem. 2015, 171, 36–43. [Google Scholar] [CrossRef]
  17. Bartoloni, S.E.; Walter, R.K.; Wewerka, S.N.; Higgins, J.; O’Leary, J.K.; Bockmon, E.E. Spatial distribution of seawater carbonate chemistry and hydrodynamic controls in a low-inflow estuary. Estuar. Coast. Shelf Sci. 2023, 281, 108195. [Google Scholar] [CrossRef]
  18. Cameselle, S.; Velo, A.; Doval, M.D.; Gómez-Gesteira, M.; Álvarez-Salgado, X.A. Long-term trends of pH, alkalinity, and hydrogen ion concentration in an upwelling-dominated coastal ecosystem: Ría de Vigo, NW Spain. Sci. Rep. 2024, 14, 17929. [Google Scholar] [CrossRef]
  19. McGrath, T.; McGovern, E.; Gregory, C.; Cave, R.R. Local drivers of the seasonal carbonate cycle across four contrasting coastal systems. Reg. Stud. Mar. Sci. 2019, 30, 100733. [Google Scholar] [CrossRef]
  20. Xue, L.; Cai, W.-J. Total alkalinity minus dissolved inorganic carbon as a proxy for deciphering ocean acidification mechanisms. Mar. Chem. 2020, 222, 103791. [Google Scholar] [CrossRef]
  21. Sharp, J.D.; Byrne, R.H. Interpreting measurements of total alkalinity in marine and estuarine waters in the presence of proton-binding organic matter. Deep. Sea Res. Part I Oceanogr. Res. Pap. 2020, 165, 103338. [Google Scholar] [CrossRef]
  22. Dürr, H.H.; Laruelle, G.G.; Van Kempen, C.M.; Slomp, C.P.; Meybeck, M.; Middelkoop, H. Worldwide Typology of Nearshore Coastal Systems: Defining the Estuarine Filter of River Inputs to the Oceans. Estuaries Coasts 2011, 34, 441–458. [Google Scholar] [CrossRef]
  23. Bauer, J.E.; Cai, W.-J.; Raymond, P.A.; Bianchi, T.S.; Hopkinson, C.S.; Regnier, P.A.G. The changing carbon cycle of the coastal ocean. Nature 2013, 504, 61–70. [Google Scholar] [CrossRef]
  24. Borges, A.V.; Delille, B.; Schiettecatte, L.-S.; Gazeau, F.; Abril, G.; Frankignoulle, M. Gas transfer velocities of CO2 in three European estuaries (Randers Fjord, Scheldt, and Thames). Limnol. Oceanogr. 2004, 49, 1630–1641. [Google Scholar] [CrossRef]
  25. Li, M.; Li, R.; Cai, W.-J.; Testa, J.M.; Shen, C. Effects of Wind-Driven Lateral Upwelling on Estuarine Carbonate Chemistry. Front. Mar. Sci. 2020, 7, 588465. [Google Scholar] [CrossRef]
  26. Albuquerque, C.; Kerr, R.; Monteiro, T.; Orselli, I.B.M.; de Carvalho-Borges, M.; Carvalho, A.d.C.O.; Machado, E.d.C.; Mansur, J.K.; Copertino, M.d.S.; Mendes, C.R.B. Seasonal variability of carbonate chemistry and its controls in a subtropical estuary. Estuar. Coast. Shelf Sci. 2022, 276, 108020. [Google Scholar] [CrossRef]
  27. Cai, W.-J. Estuarine and Coastal Ocean Carbon Paradox: CO2 Sinks or Sites of Terrestrial Carbon Incineration? Annu. Rev. Mar. Sci. 2011, 3, 123–145. [Google Scholar] [CrossRef]
  28. Regnier, P.; Resplandy, L.; Najjar, R.G.; Ciais, P. The land-to-ocean loops of the global carbon cycle. Nature 2022, 603, 401–410. [Google Scholar] [CrossRef]
  29. Li, M.; Guo, Y.; Cai, W.-J.; Testa, J.M.; Shen, C.; Li, R.; Yu, L. Projected increase in carbon dioxide drawdown and acidification in large estuaries under climate change. Commun. Earth Environ. 2023, 4, 68. [Google Scholar] [CrossRef]
  30. Cai, W.-J.; Hu, X.; Huang, W.-J.; Jiang, L.-Q.; Wang, Y.; Peng, T.-H.; Zhang, X. Alkalinity distribution in the western North Atlantic Ocean margins. J. Geophys. Res. Ocean. 2010, 115, C08014. [Google Scholar] [CrossRef]
  31. Cotovicz, L.C.; Marins, R.V.; Silva, A.R.F.D. Eutrophication Amplifies the Diel Variability of Carbonate Chemistry in an Equatorial, Semi-Arid, and Negative Estuary. Front. Mar. Sci. 2022, 9, 767632. [Google Scholar] [CrossRef]
  32. Cooley, S.R.; Coles, V.J.; Subramaniam, A.; Yager, P.L. Seasonal variations in the Amazon plume-related atmospheric carbon sink. Glob. Biogeochem. Cycles 2007, 21, 0886–6236. [Google Scholar] [CrossRef]
  33. Guo, X.; Cai, W.-J.; Zhai, W.; Dai, M.; Wang, Y.; Chen, B. Seasonal variations in the inorganic carbon system in the Pearl River (Zhujiang) estuary. Cont. Shelf Res. 2008, 28, 1424–1434. [Google Scholar] [CrossRef]
  34. Pimenta, A.R.; Oczkowski, A.; Mckinney, R.; Grear, J. Geographical and seasonal patterns in the carbonate chemistry of Narragansett Bay, RI. Reg. Stud. Mar. Sci. 2023, 62, 102903. [Google Scholar] [CrossRef]
  35. Salt, L.A.; Beaumont, L.; Blain, S.; Bucciarelli, E.; Grossteffan, E.; Guillot, A.; L’Helguen, S.; Merlivat, L.; Repecaud, M.; Quemener, L.; et al. The annual and seasonal variability of the carbonate system in the Bay of Brest (Northwest Atlantic Shelf, 2008–2014). Mar. Chem. 2016, 187, 1–15. [Google Scholar] [CrossRef]
  36. Qiu, L.; Jiang, K.; Li, Q.; Yuan, D.; Chen, J.; Yang, B.; Achterberg, E.P. Variability of total alkalinity in coastal surface waters determined using an in-situ analyzer in conjunction with the application of a neural network-based prediction model. Sci. Total Environ. 2024, 908, 168271. [Google Scholar] [CrossRef]
  37. Zhao, L.; Zhao, Z.; Zhang, J.; Zhang, P. Seasonal variation, spatial distribution, and sources of PAHs in surface seawater from Zhanjiang bay influenced by land-based inputs. Mar. Environ. Res. 2023, 188, 106028. [Google Scholar] [CrossRef]
  38. Zhang, J.; Zhang, Y.; Zhang, P.; Li, Y.; Li, J.; Luo, X.; Xu, J.; Zhao, L. Seasonal phosphorus variation in coastal water affected by the land-based sources input in the eutrophic Zhanjiang Bay, China. Estuar. Coast. Shelf Sci. 2021, 252, 107277. [Google Scholar] [CrossRef]
  39. Cai, S.; Lao, Q.; Chen, C.; Zhu, Q.; Chen, F. The impact of algal blooms on promoting in-situ N2O emissions: A case in Zhanjiang bay, China. J. Environ. Manag. 2024, 358, 120935. [Google Scholar] [CrossRef]
  40. Peng, D.; Zhang, J.; Fan, C.; Zhu, B.; Fu, M.; Zhang, P. Effects of terrestrial input on heavy metals in Zhanjiang Bay, a typical subtropical bay in the South China Sea. Mar. Pollut. Bull. 2024, 199, 116015. [Google Scholar] [CrossRef]
  41. Chen, F.; Lao, Q.; Liu, M.; Huang, P.; Chen, B.; Zhou, X.; Chen, P.; Chen, K.; Song, Z.; Cai, M. Impact of intensive mariculture activities on microplastic pollution in a typical semi-enclosed bay: Zhanjiang Bay. Mar. Pollut. Bull. 2022, 176, 113402. [Google Scholar] [CrossRef]
  42. Xie, L.; Yang, B.; Xu, J.; Lu, D.; Zhu, W.; Cui, D.; Huang, H.; Zhou, J.; Kang, Z. The increasing influence of oyster farming on sedimentary organic matter in a semi-closed subtropical bay. Sci. Total Environ. 2024, 951, 175824. [Google Scholar] [CrossRef]
  43. Cai, M.; Liu, Y.; Chen, K.; Huang, D.; Yang, S. Quantitative analysis of anthropogenic influences on coastal water—A new perspective. Ecol. Indic. 2016, 67, 673–683. [Google Scholar] [CrossRef]
  44. Garner, N.; Ross, P.M.; Falkenberg, L.J.; Seymour, J.R.; Siboni, N.; Scanes, E. Can seagrass modify the effects of ocean acidification on oysters? Mar. Pollut. Bull. 2022, 177, 113438. [Google Scholar] [CrossRef]
  45. Doney, S.C.; Busch, D.S.; Cooley, S.R.; Kroeker, K.J. The Impacts of Ocean Acidification on Marine Ecosystems and Reliant Human Communities. Annu. Rev. Environ. Resour. 2020, 45, 83–112. [Google Scholar] [CrossRef]
  46. Lao, Q.; Lu, X.; Chen, F.; Chen, C.; Jin, G.; Zhu, Q. A comparative study on source of water masses and nutrient supply in Zhanjiang Bay during the normal summer, rainstorm, and typhoon periods: Insights from dual water isotopes. Sci. Total Environ. 2023, 903, 166853. [Google Scholar] [CrossRef]
  47. Lao, Q.; Wu, J.; Chen, F.; Zhou, X.; Li, Z.; Chen, C.; Zhu, Q.; Deng, Z.; Chen, H.; Cai, S. Increasing intrusion of high salinity water alters the mariculture activities in Zhanjiang Bay during the past two decades identified by dual water isotopes. J. Environ. Manag. 2022, 320, 115815. [Google Scholar] [CrossRef]
  48. Chen, F.; Huang, C.; Lao, Q.; Zhang, S.; Chen, C.; Zhou, X.; Lu, X.; Zhu, Q. Typhoon Control of Precipitation Dual Isotopes in Southern China and Its Palaeoenvironmental Implications. J. Geophys. Res. Atmos. 2021, 126, e2020JD034336. [Google Scholar] [CrossRef]
  49. Fu, M.; Lin, J.; Zhang, P.; Luo, W.; Zhang, J. Tide drives nutrients variation and exchange flux in the semi-enclosed Shuidong Bay coastal water in winter, South China Sea. Ocean Coast. Manag. 2023, 242, 106710. [Google Scholar] [CrossRef]
  50. HY/T 178-2014; Determination of Alkalinity in Seawater Using pH Potentiometric Titration. Standards Press of China: Beijing, China, 2014.
  51. Brodeur, J.R.; Chen, B.; Su, J.; Xu, Y.-Y.; Hussain, N.; Scaboo, K.M.; Zhang, Y.; Testa, J.M.; Cai, W.-J. Chesapeake Bay Inorganic Carbon: Spatial Distribution and Seasonal Variability. Front. Mar. Sci. 2019, 6, 2296–7745. [Google Scholar] [CrossRef]
  52. Li, B.-H.; Zhao, H.-L.; Gong, J.-C.; Wu, X.; Liu, C.-Y.; Hu, J.-W.; Yang, G.-P. Emission of CO2 and its related carbonate system dynamics in a hotspot area during winter and summer: The Changjiang River estuary. Mar. Environ. Res. 2024, 198, 106496. [Google Scholar] [CrossRef]
  53. Carstensen, J.; Chierici, M.; Gustafsson, B.G.; Gustafsson, E. Long-Term and Seasonal Trends in Estuarine and Coastal Carbonate Systems. Glob. Biogeochem. Cycles 2018, 32, 497–513. [Google Scholar] [CrossRef]
  54. Qiu, L.; Esposito, M.; Martínez-Cabanas, M.; Achterberg, E.P.; Li, Q. Autonomous high-frequency time-series observations of total alkalinity in dynamic estuarine waters. Mar. Chem. 2023, 257, 104332. [Google Scholar] [CrossRef]
  55. Feely, R.A.; Alin, S.R.; Newton, J.; Sabine, C.L.; Warner, M.; Devol, A.; Krembs, C.; Maloy, C. The combined effects of ocean acidification, mixing, and respiration on pH and carbonate saturation in an urbanized estuary. Estuar. Coast. Shelf Sci. 2010, 88, 442–449. [Google Scholar] [CrossRef]
  56. Liu, X.-Y.; Yang, X.-F.; Li, Y.-X.; Zhang, L.-J. Sea surface pCO2 in an urbanized coastal system (Jiaozhou Bay, China) during summer. Mar. Pollut. Bull. 2019, 146, 767–778. [Google Scholar] [CrossRef]
  57. Millero, F.J.; Lee, K.; Roche, M. Distribution of alkalinity in the surface waters of the major oceans. Mar. Chem. 1998, 60, 111–130. [Google Scholar] [CrossRef]
  58. Wang, S.; Li, J.; Wu, S.; Yan, W.; Huang, W.; Miao, L.; Chen, Z. The distribution characteristics of rare metal elements in surface sediments from four coastal bays on the northwestern South China Sea. Estuar. Coast. Shelf Sci. 2016, 169, 106–118. [Google Scholar] [CrossRef]
  59. Fry, C.H.; Tyrrell, T.; Hain, M.P.; Bates, N.R.; Achterberg, E.P. Analysis of global surface ocean alkalinity to determine controlling processes. Mar. Chem. 2015, 174, 46–57. [Google Scholar] [CrossRef]
  60. Cai, W.-J.; Guo, X.; Chen, C.-T.A.; Dai, M.; Zhang, L.; Zhai, W.; Lohrenz, S.E.; Yin, K.; Harrison, P.J.; Wang, Y. A comparative overview of weathering intensity and HCO3 flux in the world’s major rivers with emphasis on the Changjiang, Huanghe, Zhujiang (Pearl) and Mississippi Rivers. Cont. Shelf Res. 2008, 28, 1538–1549. [Google Scholar]
  61. Guangdong Provincia Meteorological Bureau. Zhanjiang Climate Bulletin of 2023. 2024. Available online: http://gd.cma.gov.cn/zjsqxj/zwgk_2986/gggs_2995/202404/P020240412386895377740.pdf (accessed on 9 June 2025).
  62. Lee, K.; Tong, L.T.; Millero, F.J.; Sabine, C.L.; Dickson, A.G.; Goyet, C.; Park, G.-H.; Wanninkhof, R.; Feely, R.A.; Key, R.M. Global relationships of total alkalinity with salinity and temperature in surface waters of the world’s oceans. Geophys. Res. Lett. 2006, 33, L19605. [Google Scholar]
  63. Middelburg, J.J.; Soetaert, K.; Hagens, M. Ocean Alkalinity, Buffering and Biogeochemical Processes. Rev. Geophys. 2020, 58, e2019RG000681. [Google Scholar] [CrossRef]
  64. Jiang, Z.; Du, P.; Liao, Y.; Liu, Q.; Chen, Q.; Shou, L.; Zeng, J.; Chen, J. Oyster farming control on phytoplankton bloom promoted by thermal discharge from a power plant in a eutrophic, semi-enclosed bay. Water Res. 2019, 159, 1–9. [Google Scholar] [CrossRef]
  65. Yang, B.; Gao, X.; Zhao, J.; Lu, Y.; Gao, T.; Liu, J. Massive shellfish farming might accelerate coastal acidification: A case study on carbonate system dynamics in a bay scallop (Argopecten irradians) farming area, North Yellow Sea. Sci. Total Environ. 2021, 798, 149214. [Google Scholar] [CrossRef]
  66. Yates, K.K.; Dufore, C.; Smiley, N.; Jackson, C.; Halley, R.B. Diurnal variation of oxygen and carbonate system parameters in Tampa Bay and Florida Bay. Mar. Chem. 2007, 104, 110–124. [Google Scholar] [CrossRef]
  67. Voynova, Y.G.; Petersen, W.; Gehrung, M.; Aßmann, S.; King, A.L. Intertidal regions changing coastal alkalinity: The Wadden Sea-North Sea tidally coupled bioreactor. Limnol. Oceanogr. 2019, 64, 1135–1149. [Google Scholar] [CrossRef]
  68. Faber, P.A.; Evrard, V.; Woodland, R.J.; Cartwright, I.C.; Cook, P.L.M. Pore-water exchange driven by tidal pumping causes alkalinity export in two intertidal inlets. Limnol. Oceanogr. 2014, 59, 1749–1763. [Google Scholar] [CrossRef]
Figure 1. Study area and sampling stations of the ZJB in 2023. (Estuary area (S1–S4, including section D), Inner bay area (S5–S10, including section C), Mid-bay area (S11–S18, including section B), and Bay mouth area (S19–S22, including section A)).
Water 18 01453 g001
Figure 2. Seasonal variation in Salinity, pH, Dissolved oxygen (DO), Chlorophyll a (Chl-a), and Temperature (T) in surface seawater of ZJB in 2023.
Water 18 01453 g002
Figure 3. Regional variation in Alk in surface water of ZJB in 2023.
Water 18 01453 g003
Figure 4. Regional variation in Alk in surface seawater of ZJB in summer and winter of 2023.
Water 18 01453 g004
Figure 5. The daily variations in alkalinity (Alk), salinity (S), and tidal height in ZJB. in summer ((A1) the Estuary in summer; (B1) the Inner bay in summer; (C1) the Mid-bay in summer; (D1) the Bay mouth in summer).
Water 18 01453 g005
Figure 6. The daily variations in alkalinity (Alk), salinity (S), and tidal height in ZJB in winter. ((A2) the Estuary in winter; (B2) the Inner bay in winter; (C2) the Mid-bay in winter; (D2) the Bay mouth in winter).
Water 18 01453 g006
Figure 7. Variation in dAlk (deviation from conservative mixing) along the salinity gradient. Color scale representing surface water temperature. The black line indicates the conservative mixing baseline (d Alk = 0); the dotted gray lines at d Alk = ±100 μmol·L−1 indicate the threshold for moderate non-conservative deviation; values beyond this range (shaded areas) are considered indicative of significant non-conservative processes.
Water 18 01453 g007
Figure 8. Principal component analysis (PCA) biplot of five environmental variables: pH, chlorophyll-a (Chl-a), salinity, dissolved oxygen (DO), and temperature (T). PC1 and PC2 explained 54.13% and 16.84% of the total variance, respectively.
Water 18 01453 g008
Figure 9. The relationship between surface water alkalinity vs. salinity (S) for summer and winter in ZJB, colored by temperature (t).
Water 18 01453 g009
Figure 10. The relationship between surface water DO and pH for summer (a) and winter (b) in ZJB. The black dots denote the measured values at each station, while the red line represents the regression line.
Water 18 01453 g010
Figure 11. Correlation analysis of Alk with environmental factors during summer and winter in ZJB’s estuarine region.
Water 18 01453 g011
Disclaimer/Publisher’s Note: The statements, opinions and data contained in all publications are solely those of the individual author(s) and contributor(s) and not of MDPI and/or the editor(s). MDPI and/or the editor(s) disclaim responsibility for any injury to people or property resulting from any ideas, methods, instructions or products referred to in the content.