Article

Nationwide Spatial and Temporal Patterns of Trihalomethanes in Drinking Water

1
Soroka Clinical Research Center (SCRC), Soroka University Medical Center (SUMC), Beer-Sheva 8410101, Israel
2
Faculty of Health Sciences, Ben-Gurion University of the Negev, Beer-Sheva 8410501, Israel
3
Negev Environmental Health Research Institute (NEHRI), Faculty of Health Sciences, Ben-Gurion University of the Negev, Beer-Sheva 8410501, Israel
4
Department of Environmental Health, Harvard T. H. Chan School of Public Health, Harvard University, Boston, MA 02115, USA
5
Department of Environmental Health, Ministry of Health, Jerusalem 9101002, Israel
6
Zuckerberg Institute for Water Research, Blaustein Institutes for Desert Research, Ben-Gurion University of the Negev, Sede Boqer Campus, Midreshet Ben-Gurion, Beersheba 8499000, Israel
7
Goldman Sonnenfeldt School of Sustainability and Climate Change, Ben-Gurion University of the Negev, Beer-Sheva 8410501, Israel
8
Senior Planning Division, Israel Water Authority, Jerusalem 9195021, Israel
*
Author to whom correspondence should be addressed.
Water 2026, 18(11), 1375; https://doi.org/10.3390/w18111375
Submission received: 24 April 2026 / Revised: 29 May 2026 / Accepted: 3 June 2026 / Published: 5 June 2026
(This article belongs to the Section Water Quality and Contamination)

Abstract

Disinfection of drinking water prevents waterborne diseases but can lead to the formation of trihalomethanes (THMs), which are linked to an increased risk of cancer. This study examined the association between water source allocation and THM levels in Israel. A retrospective analysis of water quality reports, published by the Israeli Ministry of Health, was conducted, including only samples collected from the water distribution system between 2015 and 2024. To assess temporal and geographic variability, monthly and annual averages were calculated. Trends were evaluated using interrupted time series regression. Overall, 16,268 samples were included, with a study-wide mean THM level of 30.41 µg/L, mainly due to Bromoform. Elevated THM levels were observed in northern districts, particularly before 2020, with seasonal peaks in the summer months. After 2020, as surface water utilization increased, THM levels also rose in central Israel, with no discernible seasonal pattern. Southern regions, supplied mainly by desalinated water, showed consistently low levels. This analysis indicates that the water source influences THM formation, as increased surface-water use is associated with higher THM concentrations. Mixing surface and groundwater with desalinated water may reduce exposure in areas with high THM levels, highlighting the need for informed water management policies.

1. Introduction

Disinfecting drinking water, defined as water intended for human consumption, is a critical public health measure to prevent the spread of waterborne diseases. The procedure aims to eliminate waterborne pathogens such as bacteria, including Salmonella, Campylobacter jejuni, Escherichia coli O157:H7, Yersinia enterocolitica, Shigella, Vibrio cholerae, Pseudomonas aeruginosa, and Legionella pneumophila; protozoa, such as Giardia and Cryptosporidium parvum; and some enteric viruses [1,2].
However, disinfection in water treatment can lead to the formation of disinfection byproducts (DBPs). Trihalomethanes (THMs), a major class of DBPs, are formed during the chlorination of drinking water, a widely used disinfection method, through the reaction of chlorine with natural organic matter (NOM) [3,4]. The four regulated THM species, namely, chloroform (CHCl3), bromodichloromethane (CHBrCl2), dibromochloromethane (CHBr2Cl), and bromoform (CHBr3), form during drinking water chlorination via the haloform reaction. This reaction involves hypochlorous acid (HOCl) reacting with NOM, particularly phenolic and β-dicarbonyl precursors present in humic substances. The process proceeds via repeated electrophilic chlorination of NOM functional groups, forming polychlorinated intermediates that undergo hydrolysis and ring opening, ultimately releasing the trihalomethyl group as a trihalomethane (THM). The distribution among the four regulated species is governed primarily by the bromide-to-chlorine ratio in source water. When bromide is present, HOCl rapidly oxidizes it to HOBr, which exhibits substantially greater reactivity with NOM. Increasing bromide levels shift speciation from chloroform to bromoform via mixed bromo-chloro trihalomethanes [5].
THMs are associated with an increased risk of bladder and colorectal cancer [6,7]. A recent Meta-analysis suggests that an increase in long-term average residential THM concentrations is associated with an increased risk of bladder cancer (Relative risk (RR) 1.33, 95% Confidence interval (CI): 1.04, 1.71, highest exposed vs. lowest) and colorectal cancer (RR 1.15, 95% CI: 1.07, 1.24, limit of 41 µg/L), even when present in drinking water at levels lower than the regulated limits [8].
Climatic conditions and seasonal variations exert a substantial impact on THM concentrations. Prior research has documented elevated THM levels during spring and summer, with decreases observed in winter [9,10]. Increased temperatures facilitate greater THM formation through both indirect and direct mechanisms, by augmenting NOM levels and altering reaction kinetics [10,11,12]. Several additional factors affect THM levels, including water pH and the chlorine concentration used in treatment plants [13,14].
Additionally, the water source can affect THM levels. A recent study indicated that the allocation of water sources influences THM concentrations within the European Union (EU), with countries exhibiting higher THM levels (exceeding 25 µg/L) predominantly dependent on surface water. This pattern was observed in Cyprus (66.2 µg/L, 58% surface water), Ireland (47.3 µg/L, 82% surface water), Spain (28.8 µg/L, 38% surface water), and Greece (26.3 µg/L, 71% surface water), though Malta represented an exception (49.4 µg/L, desalination as the primary water source) [7].
A review of 120 countries found that while 97% had established regulations for THMs, routine monitoring was conducted in only 53% [15]. The current regulations in the United States and the EU set an annual average limit of less than 80 µg/L and 100 µg/L, respectively [16,17]. Similarly, Israeli regulations require an annual average below 100 µg/L and a two-week average below 150 µg/L. The Israeli advisory committee on drinking water has recommended revising these regulations, and the Ministry of Health (MOH) is updating the standard. To meet this goal, the THMs are monitored by the suppliers and supervised by the MOH. Haloacetic acids (HAAs), another group of DBPs, are not currently monitored in Israel. However, the Advisory Committee on Drinking Water in Israel has recommended their inclusion in routine monitoring beginning in 2026 [18]. The sampling frequency for THMs in the water distribution system varies by location, ranging from once a year to once a week, prioritizing sites with elevated exposure risk [19]. Sampling frequency is higher for distribution sites supplying water for larger residential areas or where surface water is the primary water source [13].
Geographic regions in Israel exhibit various climates and drinking water supply sources [20]. The center of Israel, a semi-arid region, is the most densely populated and encompasses the coastal plain, where temperatures are average, and humidity is relatively high. According to the MOH, this region is supplied by both natural and desalinated water. Northern Israel, a Mediterranean region with the highest mean annual rainfall, includes the Sea of Galilee, a surface-water source that, according to the MOH, serves as the region’s primary water supply. From 2015 to 2019, water abstraction from the Sea of Galilee ranged between 42 and 50 million m3 annually. However, since 2020, due to a policy change regarding water source allocation, the use of water from the Sea of Galilee has increased significantly, reaching between 158 and 221 million m3 annually and accounting for a larger share of the water supply to other regions [21]. In contrast, the southern part of Israel is supplied predominantly by desalinated water. Despite covering approximately 50% of the country’s territory, this arid region remains the least densely populated.
The demand for desalination in Israel is expected to increase from 0.5 billion m3 in 2020 to 1.9 billion m3 in 2065, under a low population growth scenario [22]. This anticipated increase underscores the need to evaluate the impact of water source allocation on THM levels.
This study investigates the association between water source allocation and THM levels in Israel’s drinking water, with particular emphasis on temporal changes in allocation, including a marked shift in surface water utilization in 2020 and the increasing reliance on desalinated water. This study provides nationwide longitudinal evidence on how changes in water-source allocation and increasing desalination use may influence THM exposure patterns over time and across geographic regions.

2. Methods

Israel includes diverse climatic regions despite its relatively small size. Northern Israel has a Mediterranean climate and relies largely on surface water from the Sea of Galilee, whereas southern Israel is arid and supplied mainly by desalinated water. Central Israel receives a mixture of surface water, groundwater, and desalinated water. These regional differences in climate and water-source allocation provide a suitable setting for evaluating spatial and temporal variability in THM concentrations.
The study used the Israel water quality database, which includes quarterly reports from the MOH measuring water quality from 2015 to 2024 as part of Israel’s regulatory requirements. The reports included microbiological and chemical tests conducted at production facilities, treatment facilities, and the supply system. Each record includes the site description, district, date, and sample results. Local municipal water agencies and Mekorot, the national water company, collect water samples from the points in the distribution system, and the results are then reported to the Ministry of Health.
Geocoding was applied to all sampling site addresses to obtain precise geographic coordinates. The analysis of DBPs focused on samples collected within the drinking water distribution system and included the four regulated THM species.
The DBP levels were compared across seven main geographic and administrative districts in Israel, i.e., North, Haifa, Center, Jerusalem, Tel Aviv, Ashkelon, and South, as illustrated in the map presented in Figure S1. We calculated the monthly mean at each sampling point, which served as the smallest unit for computing arithmetic means for larger areas. All means are presented with their 95% confidence intervals. THM levels reported below the Minimum Quantitation Limit (MQL) or the Minimum Reporting Limit (MRL) were imputed by dividing the MRL by the square root of 2 [23]. While MQL and MRL varied over time and across laboratories and substances tested, all values below 1 µg/L were treated as below MRL for consistency. Records of THMs with missing data for at least one component were excluded.
An interrupted time-series analysis using Prais–Winsten regression was conducted to assess changes in average THM exposure over time while accounting for autocorrelation. The segmented regression equation is of the following form:
THM t   =   β 0   +   β 1 ( Timet )   +   β 2 ( Post 2020 t )     +   β 3 ( TimeAfter 2020 t )     +   ϵ t
‘β0’ indicates the baseline level, ‘β1’ the pre-2020 trend, ‘β2’ the immediate impact of the new policy, ‘β3’ the change in trend following the policy’s implementation, and ‘ϵt’ the error term. STL (Seasonal-Trend decomposition using Loess) was applied separately to each study period (2015–2019 and 2020–2024) to decompose THM time series data into three components. The trend component captured long-term directional changes in THM concentrations, the seasonal component isolated recurring periodic fluctuations, and the remainder represented residual variation unexplained by the other two components. All statistical analyses were conducted using RStudio version 4.2.2.
As a sensitivity analysis of the data reported by MOH and the CBS on water source types in Israel, collaboration with the Water Authority was conducted to incorporate their predictive model of water quality across district-level water distribution. This model is routinely used by the water authority to support decision-making regarding the allocation of water sources. In brief, model inputs comprise hydrological scenarios, water demand scenarios, water supply to neighboring countries, climate change trends, and policies for managing natural water resources [24]. The model outputs salinity levels across districts, which serve as an indicator of variation in the mix of water sources supplied to each district, given that greater dependence on desalinated water is associated with lower salinity levels than on surface water.

3. Results

A total of 16,268 samples were analyzed. The overall mean THM concentration across the study was 30.41 ± 29.51 µg/L. Most samples originated from the Northern (48%), Haifa (26%), and Central (12%) districts. These regions exhibited comparatively higher THM concentrations, with mean ± SD values of 32.67 ± 28.85 µg/L in the Northern district, 45.08 ± 29.21 µg/L in the Haifa district, and 16.58 ± 23.09 µg/L in the Central district. In contrast, THM concentrations were lower in the Ashkelon and Southern regions, with mean ± SD values of 1.33 ± 1.77 µg/L and 2.75 ± 3.58 µg/L, respectively. Bromoform exhibited the highest concentration (study period mean ± SD: 29.16 ± 28.43 µg/L) among the compounds measured, while the levels of the other THMs remained relatively low (Table 1).
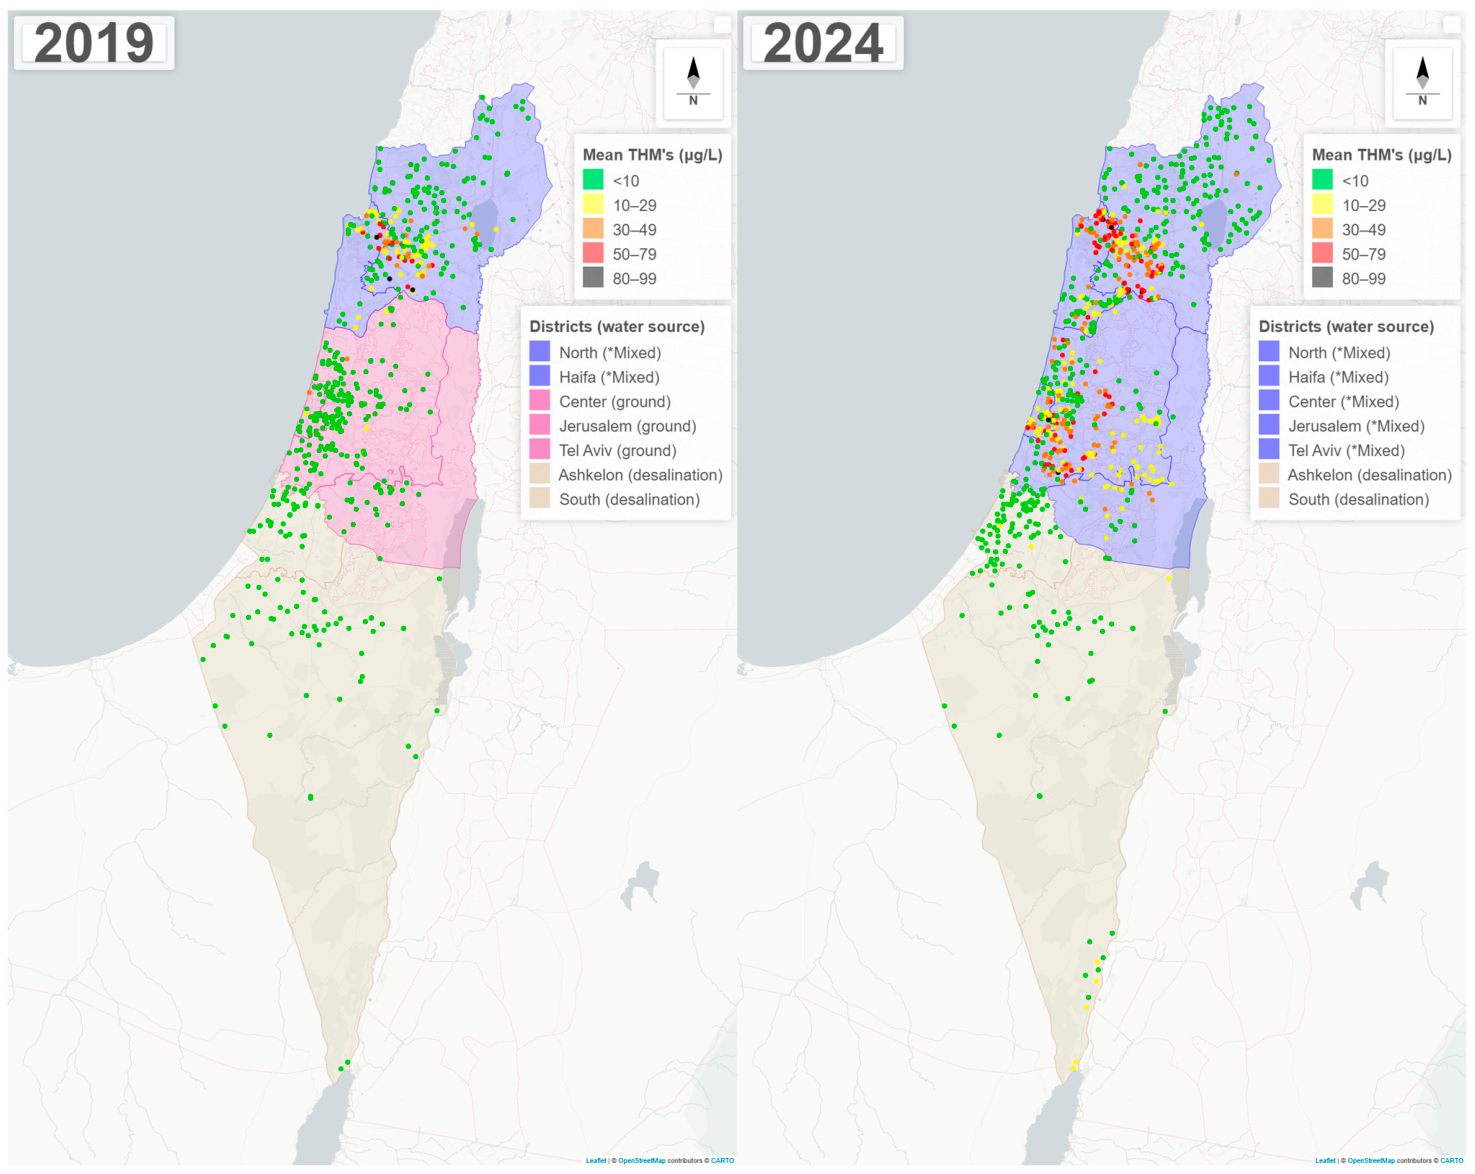
Figure 1 illustrates two cartographic representations depicting the spatial distribution of average monthly THM concentrations in 2019 and 2024. These specific years were selected to establish baseline conditions prior to policy implementation (2019) and to delineate the final year of the study period (2024). In 2019, elevated THM concentrations were predominantly localized within the city of Haifa and its adjacent valley regions. By 2024, the spatial distribution had changed, with increased THM concentrations observed also in the central region of the country. Conversely, the coastal area and northern zones of Haifa, including the Golan Heights, Upper Galilee, Ashkelon, and the Southern District, consistently showed lower THM concentration levels.
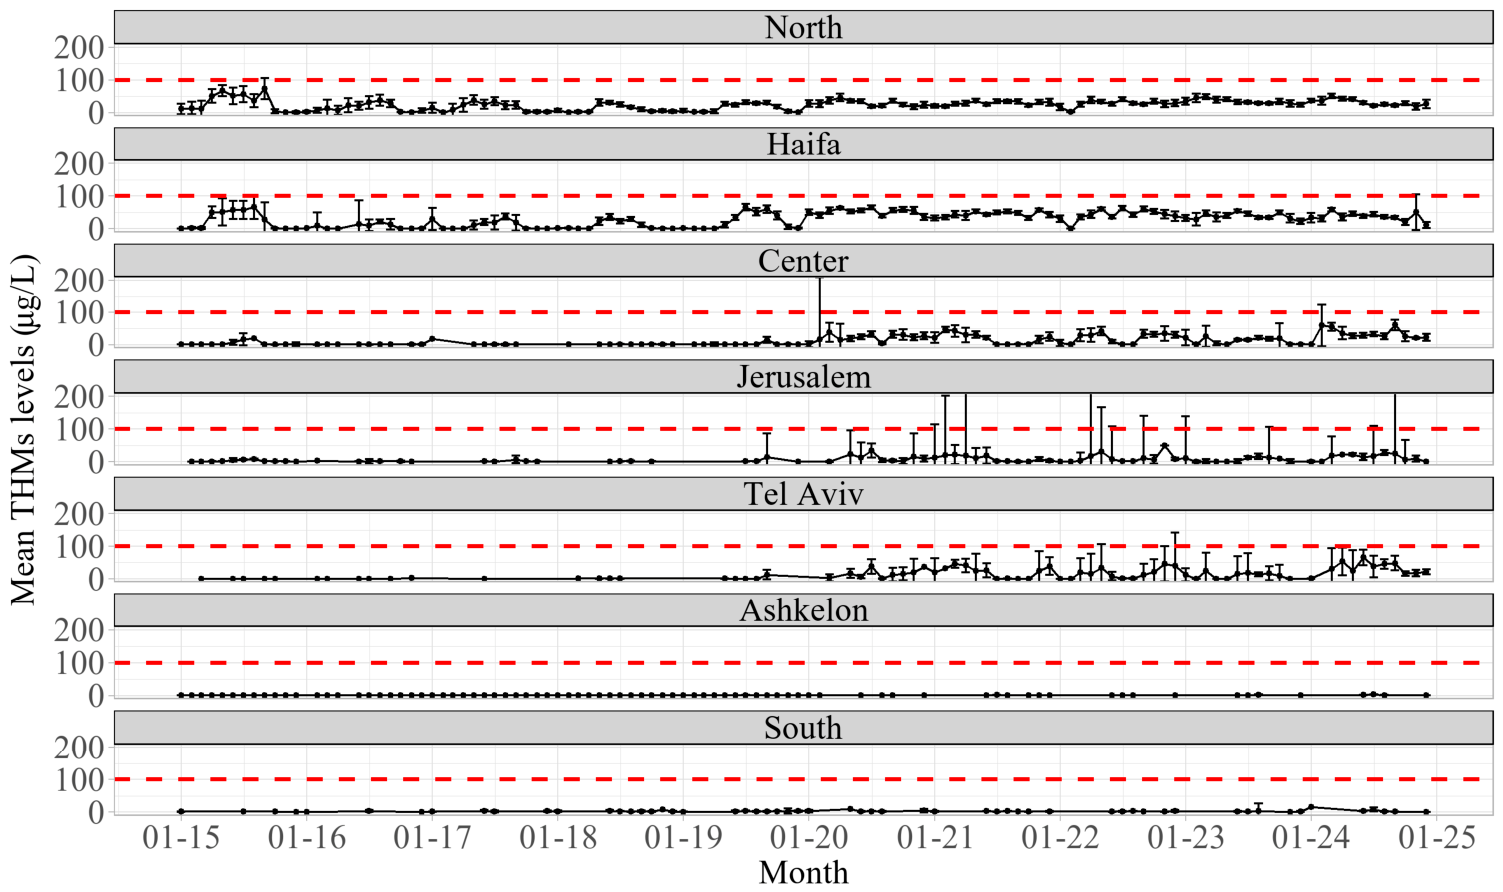
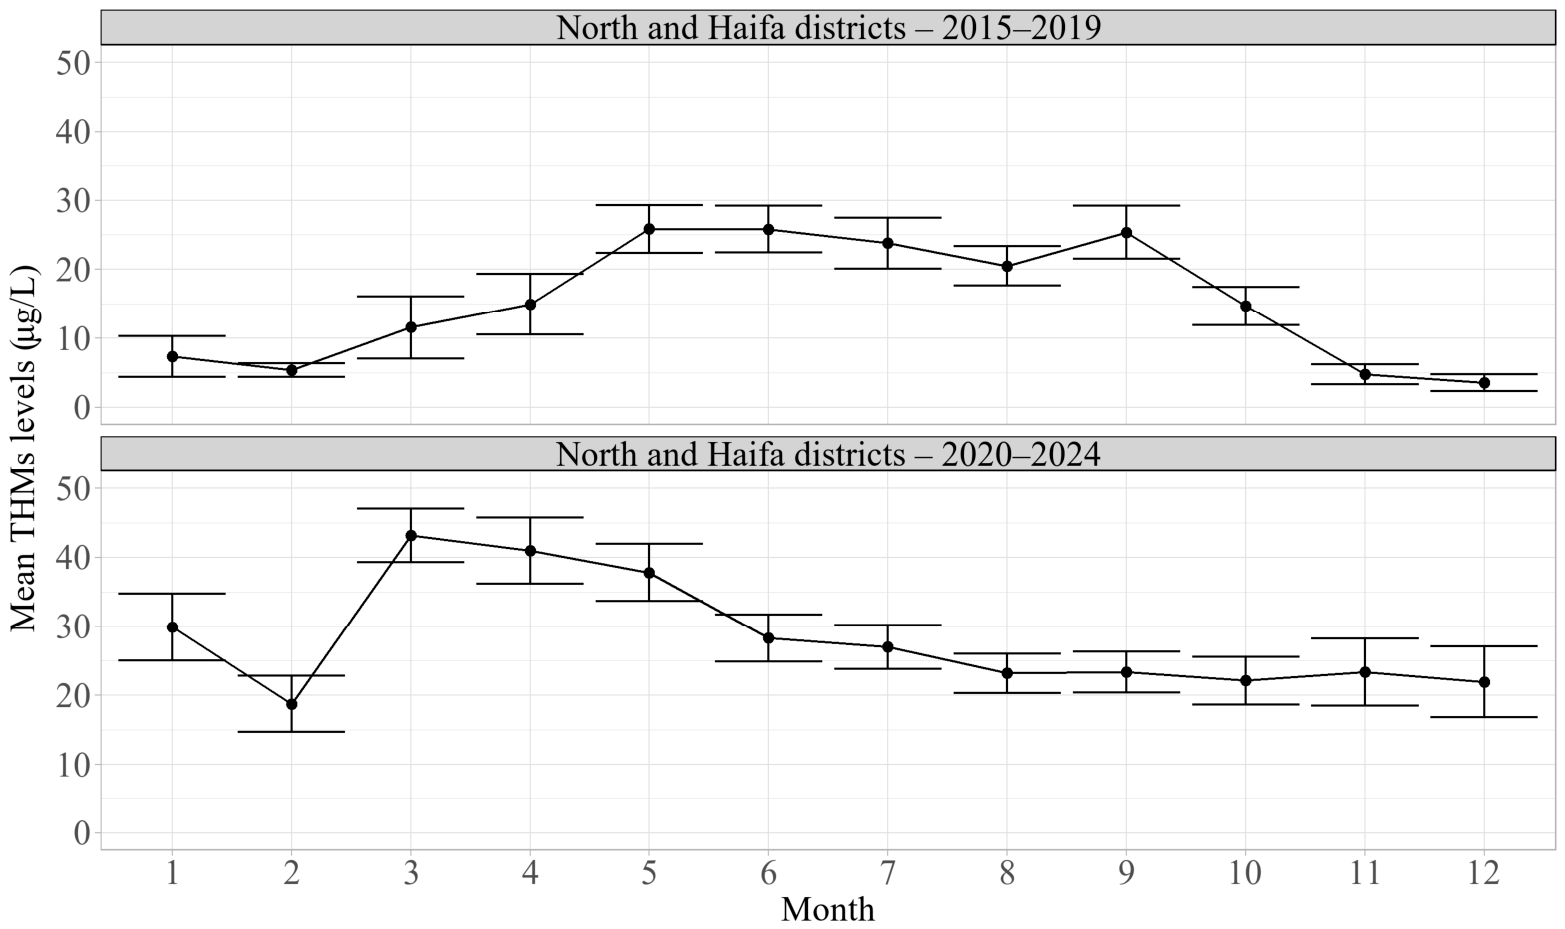
Until 2020, THM levels were generally low across most regions, except in the Northern and Haifa districts. Since 2020, with the change in water sources allocation, the monthly mean has increased significantly by 19 µg/L nationwide (p-value < 0.001, Figure 2) and by 15 µg/L in the combined Haifa and northern districts (p-value < 0.05, Figure 2). STL decomposition of THM levels revealed distinct temporal patterns between the two study periods (Figures S2 and S3). THM levels during 2015–2019 were comparatively lower, with stable, regular seasonality, whereas the 2020–2024 period exhibited higher concentrations and greater variability. Analysis of mean THM levels in the North and Haifa districts demonstrated a pronounced seasonal pattern during 2015–2019, with levels rising from approximately 5–8 µg/L in winter to a peak of ~26 µg/L in May–June before declining through autumn. In contrast, the 2020–2024 period showed a markedly elevated and seasonally attenuated profile, with year-round concentrations averaging ~20–23 µg/L and an anomalous spike reaching ~43 µg/L in March (Figure 3). The Water Authority’s model showed elevated salinity levels in Haifa between August 2015 and 2019, reflecting an increased supply of highly saline water from the Sea of Galilee. A lack of seasonal salinity variation after 2020 was also consistent with our observations. In contrast, as expected, the model consistently indicated low salinity levels throughout the entire study period in the southern district.
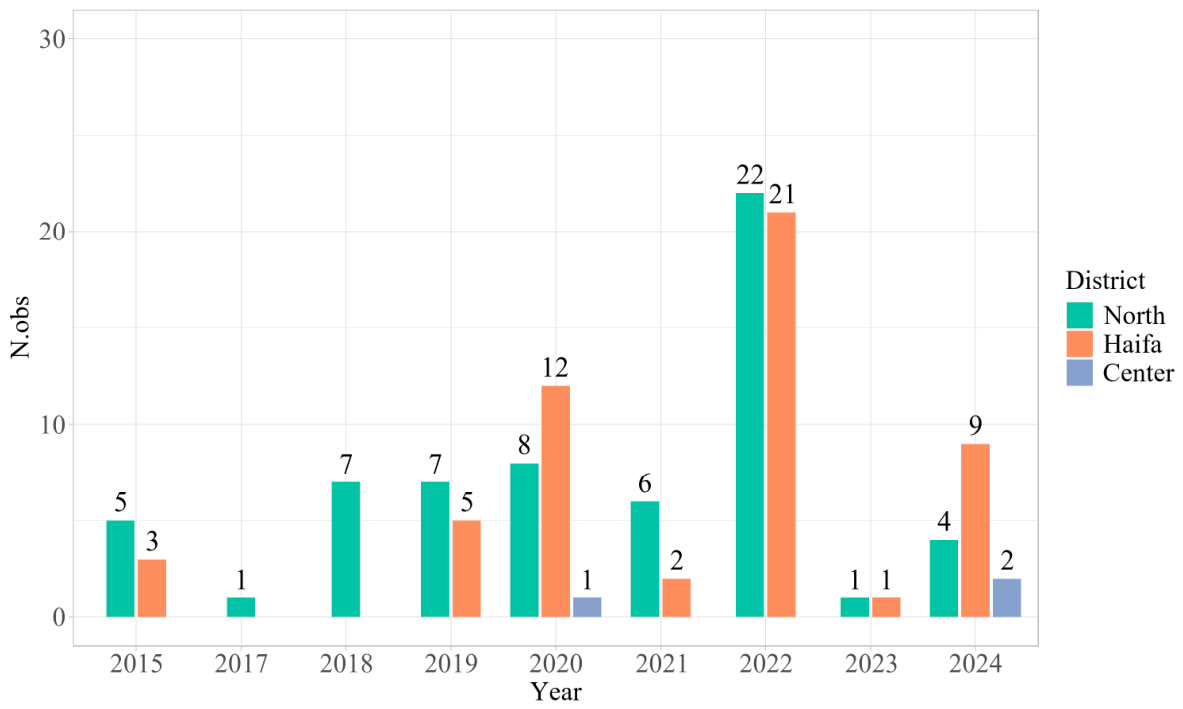
Twenty-four percent (24%) of laboratory results had concentrations below 1 µg/L. None of the annual means exceeded the regulatory limit of 100 µg/L, although the absolute number of individual samples exceeding 100 µg/L varied across years and districts. In 2022, the Northern region recorded 22 samples exceeding 100 µg/L, while Haifa recorded 21. By comparison, the center district had only 3 samples exceeding the regulatory limit throughout the entire period, and no samples exceeded the 100 µg/L regulatory limit in the other districts (Figure 4).

4. Discussion

4.1. Factors Associated with THM Levels

The findings revealed high variability in THM levels across the country and throughout the study period. The northern region of Israel showed evidence of seasonality in THM levels throughout most of the study period. In contrast, central areas demonstrated marked fluctuations only from 2020 onwards, while THM concentrations in the south remained consistently low. While seasonality has often been shown to influence THM formation [10], different water sources may also be linked to varying THM levels due to differences in water composition. Consequently, the water source allocation strategy implemented by Israeli national authorities should include the potential for THM formation as one of several considerations, alongside water demand and availability, costs, and climatic conditions.
THM levels are influenced by a variety of factors, notably thermodynamic conditions. The potential for THM formation is elevated during warmer periods, attributable to increased reaction kinetics. Additionally, natural seasonal patterns and common treatment practices, such as augmented disinfection doses to mitigate the increased risk of microbial proliferation in summer, also contribute to variations in THM concentrations. The elevated bromoform concentrations observed in Israeli drinking water are primarily attributable to the high bromide content of the Sea of Galilee (up to 2 mg/L). During chlorination, bromide is rapidly oxidized to bromine, promoting the formation of brominated THM species. This is further enhanced by the high pH of the lake water (8.2–8.5), the dominance of aliphatic organic precursors, and the spontaneous decomposition of tribromoacetic acid to bromoform [25].
Israel, although geographically a small country, has several additional options and considerations due to the availability of numerous water sources (ground, surface, and desalinated water) that can be adjusted depending upon demand, climatic conditions, etc. However, these different water sources appear to be associated with different THM formation potentials.
For instance, prior to 2020, surface water from the Sea of Galilee was supplied to the Haifa and Northern districts during the summer months, a period that corresponded with elevated THM levels. Surface water tends to contain higher levels of NOM than other natural water sources, increasing the likelihood of THM formation [26]. Conversely, reverse osmosis (RO) desalination removes all dissolved organic matter from the water, resulting in a theoretically much lower THM formation potential [27]. This finding may account for the persistently low THM concentrations in the Ashkelon and Southern regions.
However, after 2020, THM levels began to fluctuate but without a clear seasonal pattern in the central districts. These changes may reflect the increased year-round water allocations from the Sea of Galilee reported by MOH. According to the Ministry of Health, the increase was driven by rising lake levels and concerns about potential flooding, as the water reached an orthometric height of −208.89 m, slightly below the upper red line set at −208.80 m. In addition, this shift aimed to reduce reliance on costly desalination and enhance water turnover in the lake to better manage salinity levels. Data from the Israeli Central Bureau of Statistics (CBS) indicate that the Sea of Galilee accounted for 12% of the national water supply in 2020, compared to just 2.3% in 2019 [21].
To summarize, aside from seasonal fluctuations explained by climatic conditions, the THM levels appeared to depend on the water type supplied to each region. It suggests that for countries with desalination plants, desalinated water may be considered to manage THM concentrations by incorporating it into the water supply during high-risk periods.

4.2. Use of Desalinated Water for Drinking Water

Nonetheless, desalinated water has additional considerations when incorporating it into the water supply system. This water tends to be softer than natural water, characterized by lower levels of dissolved minerals, primarily calcium and magnesium. Low calcium and magnesium levels in drinking water are associated with an increased risk of cardiovascular diseases [28,29]. In addition, soft water can increase the risk of galvanic corrosion and lead to metal leaching from pipes, thereby increasing the risk of water contamination and exposure to heavy metals [30].
The study has several limitations. The MOH establishes the sampling protocol by prioritizing more densely populated locations for sample collection, thereby inherently weighting the results by population risk. Monthly and annual averages were computed instead of raw observations to minimize potential bias, which may have smoothed out spikes and lowered estimates from frequently sampled locations. The study benefited from Israel’s national water quality database, encompassing long-term observational data and the country’s geographic and climatic diversity. The wide range of water sources, from entirely natural to fully desalinated, provided substantial variability, enabling robust analysis.

5. Conclusions

In conclusion, increased use of surface water in Israel was associated with higher THM levels. In addition, given global warming and climate change, the growing reliance on desalinated water may also reduce THM formation by lowering the concentrations of their precursors in drinking water sources [31]. This study provides a basis for future research to assess the effects of THMs in drinking water on public health. Its current findings inform water-source policies and guide decision-making in water-quality management.

Supplementary Materials

The following supporting information can be downloaded at https://www.mdpi.com/article/10.3390/w18111375/s1. Figure S1: Map of the study district by the Israeli Ministry of Health; Figure S2: Decomposition analysis of the period between 2015 and 2019; Figure S3: Decomposition analysis of the period between 2020 and 2024. Table S1. The means of overall THM levels 1 in distal sites, by MOH district (2018–2024).

Author Contributions

Conceptualization, I.H. and N.D.F.; methodology, L.N.; formal analysis, N.S. and D.G.; investigation, T.B. and N.C.; data curation, A.A.; writing—review and editing, R.L. and S.R.; supervision, L.G. All authors have read and agreed to the published version of the manuscript.

Funding

This research was partially supported by the Israeli Ministry of Science and Technology as part of the DesertData project—The DeserTech Knowledge Center for Sustainability (Grant Number 100158460).

Data Availability Statement

The original data presented in the study are openly available at the Israeli Ministry of Health Water Quality Testing Repository: https://www.gov.il/he/departments/dynamiccollectors/water-quality-testing?skip=0 (accessed on 2 June 2026).

Conflicts of Interest

The authors declare no conflicts of interest.

References

  1. Leclerc, H.; Schwartzbrod, L.; Dei-Cas, E. Microbial agents associated with waterborne diseases. Crit. Rev. Microbiol. 2002, 28, 371–409. [Google Scholar] [CrossRef] [Scilit] [PubMed]
  2. King, D.N.; Donohue, M.J.; Vesper, S.J.; Villegas, E.N.; Ware, M.W.; Vogel, E.M.; Furlong, E.F.; Kolpin, D.W.; Glassmeyer, S.T.; Pfaller, S. Microbial pathogens in source and treated waters from drinking water treatment plants in the United States and implications for human health. Sci. Total Environ. 2016, 562, 987–995. [Google Scholar] [CrossRef] [Scilit]
  3. Drogui, P.; Daghrir, R. Chlorine for water disinfection: Properties, applications and health effects. In CO2 Sequestration, Biofuels and Depollution; Springer: Cham, Switzerland, 2015; pp. 1–32. [Google Scholar]
  4. Sun, Y.; Chen, C.; Mustieles, V.; Wang, L.; Zhang, Y.; Wang, Y.X.; Messerlian, C. Association of blood trihalomethane concentrations with risk of all-cause and cause-specific mortality in U.S. adults: A prospective cohort study. Environ. Sci. Technol. 2021, 55, 9043–9051. [Google Scholar] [CrossRef] [Scilit]
  5. Forster, A.L.B.; Wiskur, S.L.; Richardson, S.D. Formation of Eight Classes of DBPs from Chlorine, Chloramine, and Ozone: Mechanisms and Formation Pathways. Environ. Sci. Technol. 2025, 59, 15594–15611. [Google Scholar] [CrossRef] [Scilit] [PubMed]
  6. Helte, E.; Säve-Söderbergh, M.; Larsson, S.C.; Martling, A.; Åkesson, A. Disinfection by-products in drinking water and risk of colorectal cancer: A population-based cohort study. J. Natl. Cancer Inst. 2023, 115, 1597–1604. [Google Scholar] [CrossRef] [Scilit]
  7. Evlampidou, I.; Font-Ribera, L.; Rojas-Rueda, D.; Gracia-Lavedan, E.; Costet, N.; Pearce, N.; Vineis, P.; Jaakkola, J.J.; Delloye, F.; Makris, K.C.; et al. Trihalomethanes in drinking water and bladder cancer burden in the European Union. Environ. Health Perspect. 2020, 128, 17001. [Google Scholar] [CrossRef] [Scilit]
  8. Helte, E.; Söderlund, F.; Säve-Söderbergh, M.; Larsson, S.C.; Åkesson, A. Exposure to drinking water trihalomethanes and risk of cancer: A systematic review of the epidemiologic evidence and dose-response meta-analysis. Environ. Health Perspect. 2025, 133, 16001. [Google Scholar] [CrossRef] [Scilit] [PubMed]
  9. Dong, F.; Pang, Z.; Yu, J.; Deng, J.; Li, X.; Ma, X.; Dietrich, A.M.; Deng, Y. Spatio-temporal variability of halogenated disinfection by-products in a large-scale two-source water distribution system with enhanced chlorination. J. Hazard. Mater. 2022, 423, 127113. [Google Scholar] [CrossRef] [Scilit]
  10. Alver, A.; Baştürk, E.; Kılıç, A. Impact of seasonal variations and water quality parameters on the formation of trihalomethanes and haloacetic acids in drinking water treatment processes. J. Environ. Manag. 2025, 384, 125567. [Google Scholar] [CrossRef] [Scilit]
  11. Evans, C.D.; Chapman, P.J.; Clark, J.M.; Monteith, T.D.; Cresser, M.S. Alternative explanations for rising dissolved organic carbon export from organic soils. Glob. Change Biol. 2006, 12, 2044–2053. [Google Scholar] [CrossRef] [Scilit]
  12. Valdivia-Garcia, M.; Weir, P.; Graham, D.W.; Werner, D. Predicted impact of climate change on trihalomethanes formation in drinking water treatment. Sci. Rep. 2019, 9, 9966. [Google Scholar] [CrossRef] [Scilit]
  13. Sriboonnak, S.; Induvesa, P.; Wattanachira, S.; Rakruam, P.; Siyasukh, A.; Pumas, C.; Wongrueng, A.; Khan, E. Trihalomethanes in water supply system and water distribution networks. Int. J. Environ. Res. Public Health 2021, 18, 9066. [Google Scholar] [CrossRef] [Scilit] [PubMed]
  14. Domínguez-Tello, A.; Arias-Borrego, A.; García-Barrera, T.; Gómez-Ariza, J.L. Seasonal and spatial evolution of trihalomethanes in a drinking water distribution system according to the treatment process. Environ. Monit. Assess. 2015, 187, 558. [Google Scholar] [CrossRef] [Scilit]
  15. Villanueva, C.M.; Evlampidou, I.; Ibrahim, F.; Donat-Vargas, C.; Valentin, A.; Tugulea, A.M.; Echigo, S.; Jovanovic, D.; Lebedev, A.T.; Lemus-Pérez, M.; et al. Global assessment of chemical quality of drinking water: The case of trihalomethanes. Water Res. 2023, 230, 119568. [Google Scholar] [CrossRef] [Scilit]
  16. European Parliament & Council of the European Union. Directive (EU) 2020/2184 of 16 December 2020 on the Quality of Water Intended for Human Consumption (Recast). Off. J. Eur. Union 2020, L 435, 1–62. Available online: https://eur-lex.europa.eu/eli/dir/2020/2184/oj/eng (accessed on 2 June 2026).
  17. United States Environmental Protection Agency (EPA). Comprehensive Disinfectants and Disinfection Byproducts Rules (Stage 1 and Stage 2): Quick Reference Guide; EPA Office of Ground Water and Drinking Water: Washington, DC, USA, 2010.
  18. Ministry of Health, Israel. Haloacetic Acids in Drinking Water in Israel: Survey Results; Department of Public Health: Jerusalem, Israel, 2024.
  19. Ministry of Health, Israel. Public Health Regulations (Sanitary Quality of Drinking Water and Drinking Water Facilities), 2013. Collection of Regulations; No. 7262; Ministry of Health, Israel: Jerusalem, Israel, 2013.
  20. Kutiel, H. Climate of Israel. In World Geomorphological Landscapes; Springer Science and Business Media B.V.: Berlin/Heidelberg, Germany, 2024; Volume Part F2449, pp. 39–47. [Google Scholar]
  21. Central Bureau of Statistics (CBS). Water Production and Consumption Report; Central Bureau of Statistics (CBS): Jerusalem, Israel, 2024.
  22. Kramer, I.; Tsairi, Y.; Roth, M.B.; Tal, A.; Mau, Y. Effects of population growth on Israel’s demand for desalinated water. npj Clean Water 2022, 5, 30. [Google Scholar] [CrossRef] [Scilit]
  23. Baccarelli, A.; Pfeiffer, R.; Consonni, D.; Pesatori, A.C.; Bonzini, M.; Patterson, D.G.; Bertazzi, P.A.; Landi, M.T. Handling of dioxin measurement data in the presence of non-detectable values: Overview of available methods and their application in the Seveso chloracne study. Chemosphere 2005, 60, 898–906. [Google Scholar] [CrossRef] [Scilit]
  24. Gamzin, D.; Zaide, M.; Shamir, U. Master Plan for the National Water System: A Probability Analysis of the Discrepancy Between Demand for Freshwater and Natural Supply, on a National Level, up to 2050; Water Authority: Jerusalem, Israel, 2011.
  25. Heller-Grossman, L.; Manka, J.; Limoni-Relis, B.; Rebhun, M. THM, Haloacetic Acids and Other Organic DBPs Formation in Disinfection of Bromide Rich Sea of Galilee (Lake Kinneret) Water. Water Supply 2001, 1, 259–266. [Google Scholar] [CrossRef] [Scilit]
  26. Schaap, B.D.; Zogorski, J.S. Occurrence of Trihalomethanes in the Nation’s Ground Water and Drinking-Water Supply Wells, 1985–2002; US Geological Survey: Reston, VA, USA, 2005.
  27. Chowdhury, S. Disinfection by-products in desalinated and blend water: Formation and control strategy. J. Water Health 2019, 17, 1–24. [Google Scholar] [CrossRef] [Scilit] [PubMed]
  28. Theisen, C.F.; Wodschow, K.; Hansen, B.; Schullehner, J.; Gislason, G.; Ersbøll, B.K.; Ersbøll, A.K. Drinking water magnesium and cardiovascular mortality: A cohort study in Denmark, 2005–2016. Environ. Int. 2022, 164, 107277. [Google Scholar] [CrossRef] [Scilit]
  29. Marque, S.; Jacqmin-Gadda, H.; Dartigues, J.F.; Commenges, D. Cardiovascular mortality and calcium and magnesium in drinking water: An ecological study in elderly people. Eur. J. Epidemiol. 2003, 18, 305–309. [Google Scholar] [CrossRef] [Scilit] [PubMed]
  30. Bacon, A.P.; Froome, K.; Gent, A.E.; Cooke, T.K.; Sowerby, P. Lead poisoning from drinking soft water. Lancet 1967, 289, 264–266. [Google Scholar] [CrossRef] [Scilit] [PubMed]
  31. Jones, E.; Qadir, M.; van Vliet, M.T.H.; Smakhtin, V.; Kang, S.M. The state of desalination and brine production: A global outlook. Sci. Total Environ. 2019, 657, 1343–1356. [Google Scholar] [CrossRef] [Scilit] [PubMed]
Figure 1. Map of all sample sites in the study colored by the annual means of THM levels 1 in 2019 and 2024. Notes: 1 µg/L mean (SD); * Mixed water includes desalination, groundwater, and surface water.
Water 18 01375 g001
Figure 2. Monthly means of THM levels, by MOH district (2015–2024). The red dotted line at 100 µg/L indicates the maximum permitted annual average concentration of THMs under Israeli regulations.
Water 18 01375 g002
Figure 3. Seasonal means of THM levels, North and Haifa district (2015–2024).
Water 18 01375 g003
Figure 4. The number of samples exceeding 100 µg/L by district and year. Notes: The districts shown in this figure had at least one sample exceeding 100 µg/L. During the study period, the THM concentrations in Jerusalem, Ashkelon, and the Southern districts did not surpass 100 µg/L.
Water 18 01375 g004
Table 1. The means of overall THM levels, by MOH district (2015–2024).
DistrictOverallNorthHaifaCenterJerusalemTel-AvivAshkelonSouth
N.obs16,268787042501959602378633576
THM’s30.41
(29.51)
32.67
(28.85)
45.08
(29.21)
16.58
(23.09)
8.08
(12.01)
16.47
(21.45)
1.33
(1.77)
2.75
(3.58)
CHBr329.16
(28.43)
31.35
(27.79)
43.26
(28.12)
15.94
(22.38)
7.54
(11.69)
15.88
(20.75)
1.23
(1.61)
2.31
(2.99)
CHBrCl20.71
(0.04)
0.71
(0.03)
0.71
(0.02)
0.71
(0.09)
0.71
(0.09)
0.71
(0.00)
0.71
(0.00)
0.71
(0.10)
CHBr2Cl1.45
(0.99)
1.51
(1.04)
1.87
(1.03)
0.98
(0.55)
0.80
(0.25)
0.95
(0.51)
0.72
(0.07)
0.88
(0.55)
CHCl30.71
(0.09)
0.71
(0.02)
0.71
(0.05)
0.72
(0.25)
0.71
(0.00)
0.71
(0.05)
0.71
(0.00)
0.71
(0.00)
Disclaimer/Publisher’s Note: The statements, opinions and data contained in all publications are solely those of the individual author(s) and contributor(s) and not of MDPI and/or the editor(s). MDPI and/or the editor(s) disclaim responsibility for any injury to people or property resulting from any ideas, methods, instructions or products referred to in the content.