Article

Hydrochemical Characteristics and Potash Formation Indications of Subsurface Brine in the Central Bachu Uplift, Tarim Basin


1
School of Geology and Mining Engineering, Xinjiang University, Urumqi 830017, China
2
Urumqi Comprehensive Survey Center on Natural Resources, China Geological Survey, Urumqi 830057, China
3
Innovation Base of Metallogenic Prediction and Prospecting in Central Asia Orogenic Belt, Urumqi 830057, China
4
State Key Laboratory of Geological Processes and Mineral Resources, China University of Geosciences, Wuhan 430074, China
5
MNR Key Laboratory of Metallogeny and Mineral Assessment, Institute of Mineral Resources, Chinese Academy of Geological Sciences, Beijing 100037, China
*
Author to whom correspondence should be addressed.
These authors contributed equally to this work.
Water 2026, 18(11), 1284; https://doi.org/10.3390/w18111284
Submission received: 16 March 2026 / Revised: 29 April 2026 / Accepted: 8 May 2026 / Published: 26 May 2026
(This article belongs to the Section Hydrogeology)

Abstract

In recent years, the distribution of potassium salt resources in the Central Asia–Tarim Basin salt lake chain has shown an asymmetric pattern, and exploration efforts in the northwestern Tarim Basin have not seen significant progress. This study focuses on the central Bachu Uplift within the Central Asia–Tarim Basin salt lake chain. The characteristics of subsurface brines and indicators of potash formation are investigated. By examining various potassium exploration indices, such as the potassium–chlorine coefficient and magnesium–chlorine coefficient, along with comprehensive analysis of hydrogen–oxygen, sulfur, and strontium isotopes, this research serves to evaluate the potential for potash formation in the central Bachu Uplift. Analysis shows a brine salinity of 12.69–88.46 g/L and a potassium concentration of 0.07–0.65 g/L. The hydrochemical coefficients indicate a high nNa/nCl value, with low K × 103/Cl values. All brine samples plot within the halite phase field of the 25 °C Na+,K+,Mg2+//C1-H2O Quaternary metastable phase diagram, clustering towards the Na-rich end. This indicates that the brine likely originated from halite dissolution. In the Na+,K+,Mg2+//C1,SO42−-H2O Quinary metastable phase diagram, the majority of samples project within the mirabilite phase field, trending toward the sylvite field. This suggests that the shallow subsurface brine may still be in the early to middle stages of sylvite deposition. Hydrogen and oxygen isotopes indicate that the brine samples were influenced by water–rock interaction and strong evaporative concentration; strontium isotopes reveal their marine–continental transitional characteristics; and sulfur isotopes suggest that the sulfur in the samples was derived from the weathering of Meso-Cenozoic gypsum in the western Tarim Basin. This integrated evidence implies that the brines in the central Bachu Uplift contain a deep-seated potassium anomaly, with fault zones likely conveying information about deep potash resources. This provides preliminary evidence for potassium exploration in the area and holds significant indicative value for identifying key prospective targets.

1. Introduction

Potassium salts are the primary raw materials for potash fertilizer production and constitute a critical strategic resource for ensuring national food security. As a populous and agriculturally significant country, China views food security as fundamental to nation-building. However, extensive potassium deficiency in China’s cultivated land underscores the urgency of securing stable potassium resources [1,2], potassium salt is often referred to as the “grain of grain,” ranking among the seven major mineral commodities in short supply in China. Currently, the country’s identified KCl resources/reserves above 200 m depth are about one billion tonnes. Moreover, approximately 95% of China’s potash resources are concentrated in the Qaidam Basin (Qinghai Province) and Lop Nor (Xinjiang). Potassium-bearing brine remains the primary resource, while deposits in other regions are relatively small and underexploited [3]. Consequently, discovering new potash deposits to meet domestic demand is of paramount importance.
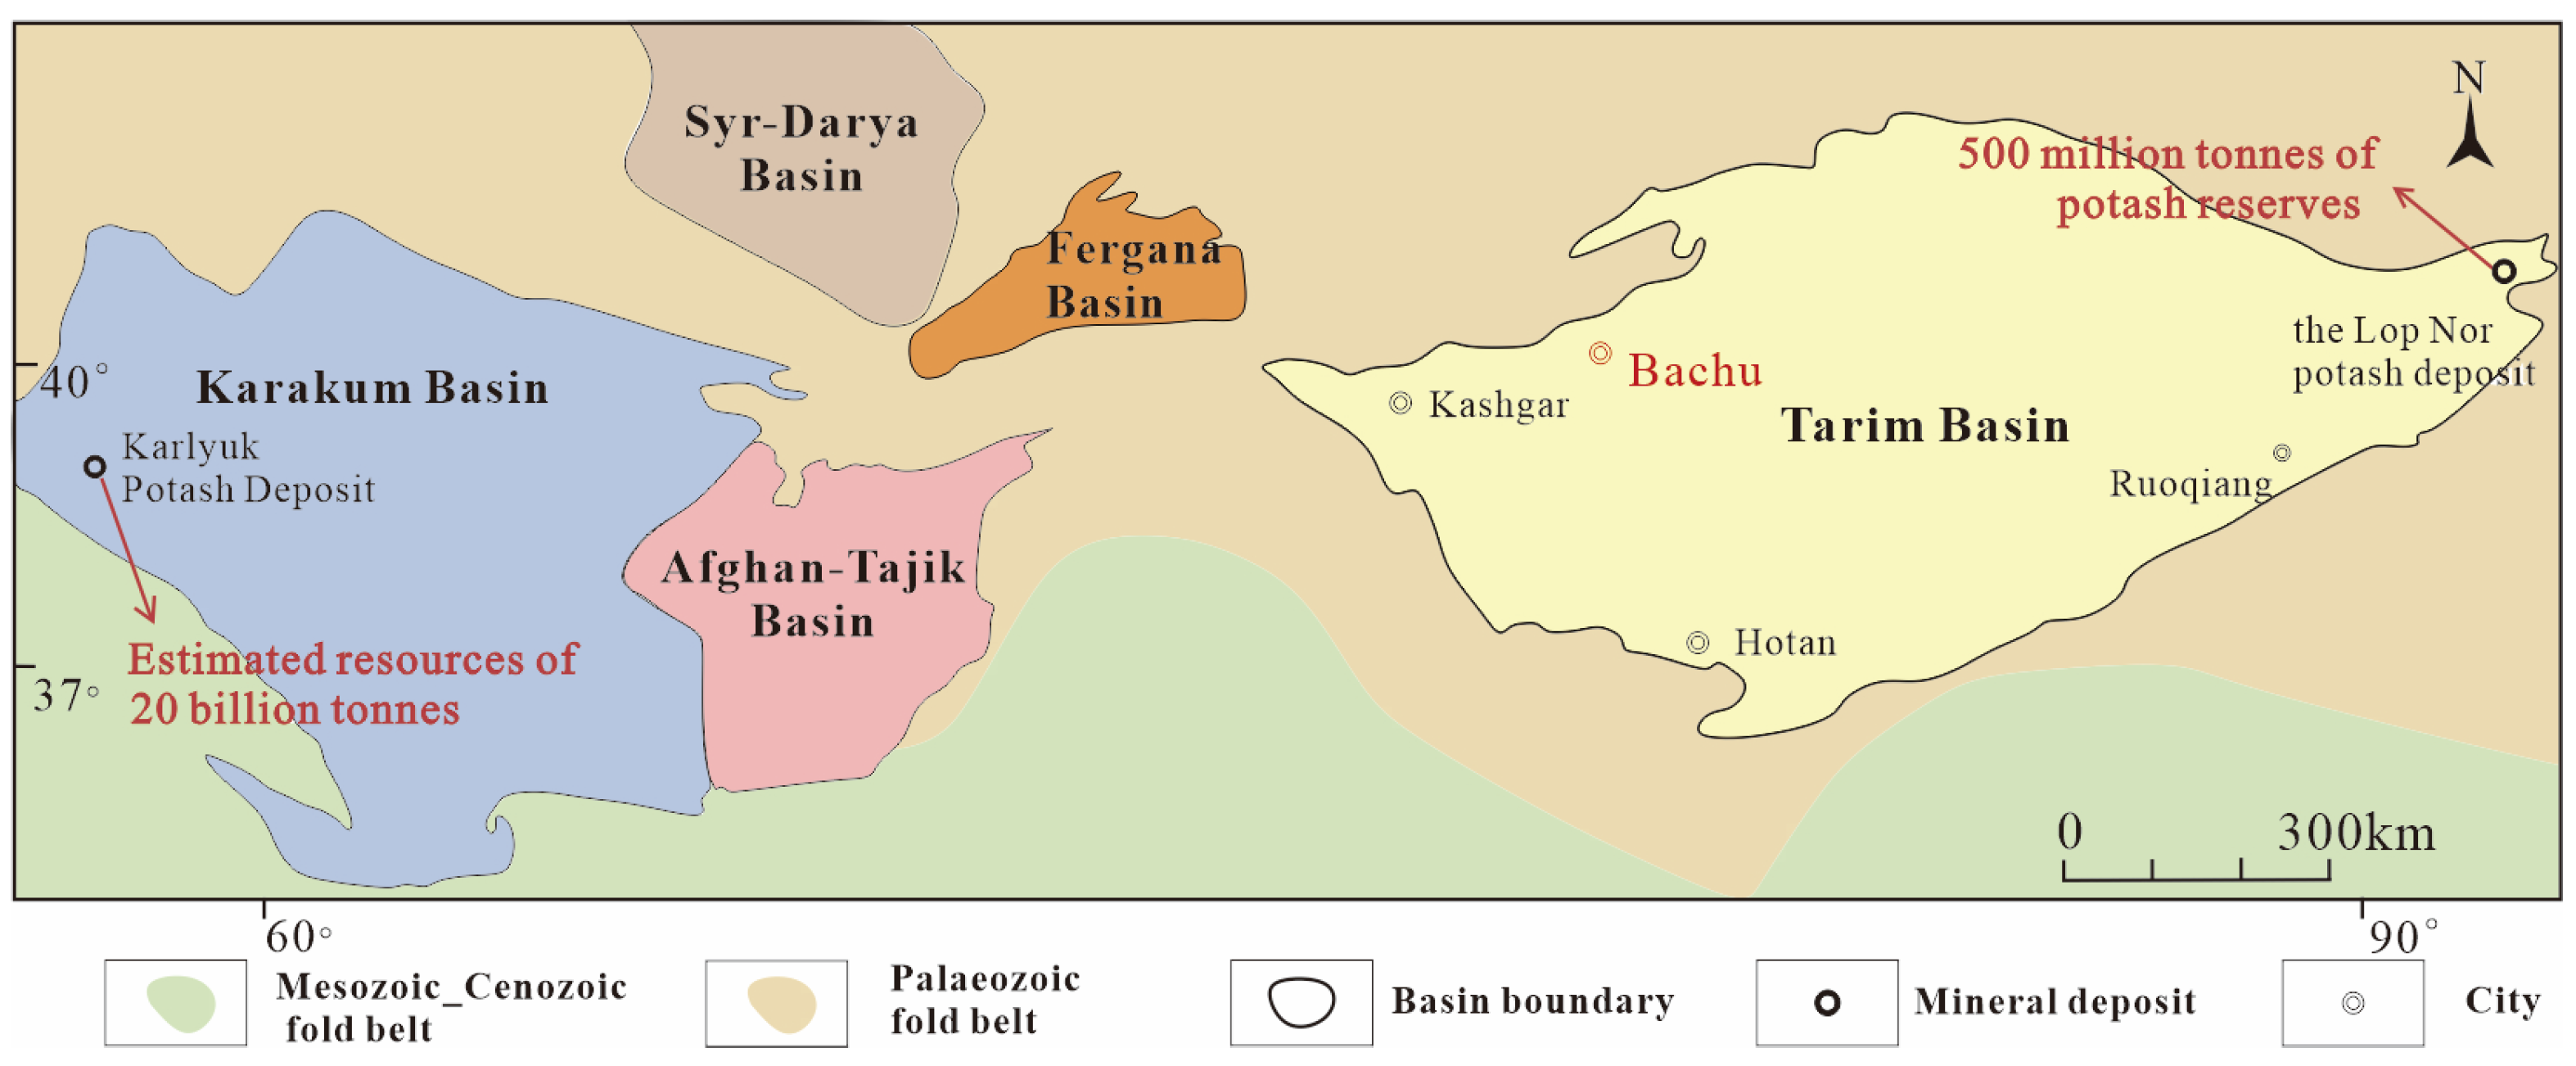
The Tarim Basin in Xinjiang ranks among the most prospective regions in China for potash mineralization and exploration [4,5]. The neighboring Central Asian region that adjoins the Tarim Basin is remarkably endowed with mineral resources, hosting a series of giant, world-class potash deposits—such as those in the Karakum Basin and the Afghanistan–Tajik Basin—with collective reserves reaching tens of billions of tonnes. Located at the eastern margin of the Tarim Basin, the Lop Nor potash deposit alone holds approximately 500 million tonnes of potash reserves, forming a prominent segment of the “Central Asia–Tarim Basin salt-lake chain”(Figure 1) [6,7]. Nevertheless, exploration and research efforts in the central and western portions of the Tarim Basin—belonging to the same metallogenic province—remain comparatively limited, demonstrating a pronounced asymmetry in potash reserves. As such, the discovery of large to super-large potash deposits in these underexplored areas is highly anticipated [8].
Research suggests that the Tethys Ocean region experienced markedly arid climate conditions from the Late Mesozoic through the middle to late Cenozoic [10,11]. The Central Asian basins and the Tarim Basin, both affected by marine transgressions, exhibit similar tectonic evolutionary characteristics [12,13,14]. Under a hot and arid paleoclimate, repeated cycles of transgression and regression gave rise to varying degrees of evaporite formation in each depression, ultimately leading to the emergence of the Mesozoic–Cenozoic salt-lake chain across the Central Asian basins and the Tarim Basin. These lakes gradually coalesced from west to east, with potash-forming epochs becoming progressively younger [8]. The earliest evaporite deposits formed in the western sub-basins of the salt-lake chain. In the east, paleolake waters underwent evaporation-driven concentration [15,16]. Accordingly, large-scale, high-grade solid potash deposits accumulated in the Central Asian basins at the western terminus, while a giant brine potash deposit developed in the Lop Nor region of the Tarim Basin at the eastern terminus [6,17]. Based on the potash-forming regularities established for the proven Lop Nur potash deposit in the Tarim Basin, potash mineralization is governed by a mechanism of “multistage accumulation followed by late-stage intensification,” reflecting the coupled effects of tectonics, climate, and source supply [6]. Climatically, the Tarim Basin is characterized by a typical continental arid regime, marked by scant precipitation, intense evaporation, large diurnal and seasonal temperature fluctuations, and strong winds [18]. From a tectonic perspective, the basin conforms to the theoretical framework of potash formation in a “high-mountain–deep-basin” setting. As a secondary depression in the western Tarim Basin, the central sag of the Bachu Uplift provides favorable conditions for the accumulation and preservation of evaporitic resources, thereby constituting a fundamental prerequisite for the formation of potash deposits. With respect to source supply, the Tarim Basin experienced three large-scale transgressive–regressive cycles and five evaporite depositional cycles from the Late Jurassic to the Miocene. The principal depocenters for evaporite accumulation were the Shache Basin in the southwestern Tarim Basin, the central part of the Bachu Uplift, and the Kuqa sub-basin in the northeast [7,8]. Located in the southwestern corridor of the Tarim Basin’s marine transgression pathway, the Bachu Uplift serves as a vital hub in the salt-lake chain, and its potash potential warrants further exploration. However, in the central Bachu Uplift, extensive Quaternary cover severely obscures the target strata. Although drilling remains the most direct and commonly employed method for concealed mineral exploration, it is costly and entails considerable risk. Conventional geochemical approaches are highly effective for exposed deposits and suboutcropping deposits overlain by residual materials, yet they are of limited utility in the exploration of deeply concealed mineralization [19]. In view of the remarkable success of deep-penetrating geochemical surveys conducted along fault zones during the exploration of concealed potash deposits in the Kuqa Basin, this study adopts an analogous prospecting strategy in the central Bachu Uplift, with the aim of detecting potash-related geochemical signatures and delineating potential loci of potash mineralization.

2. Regional Geological Setting

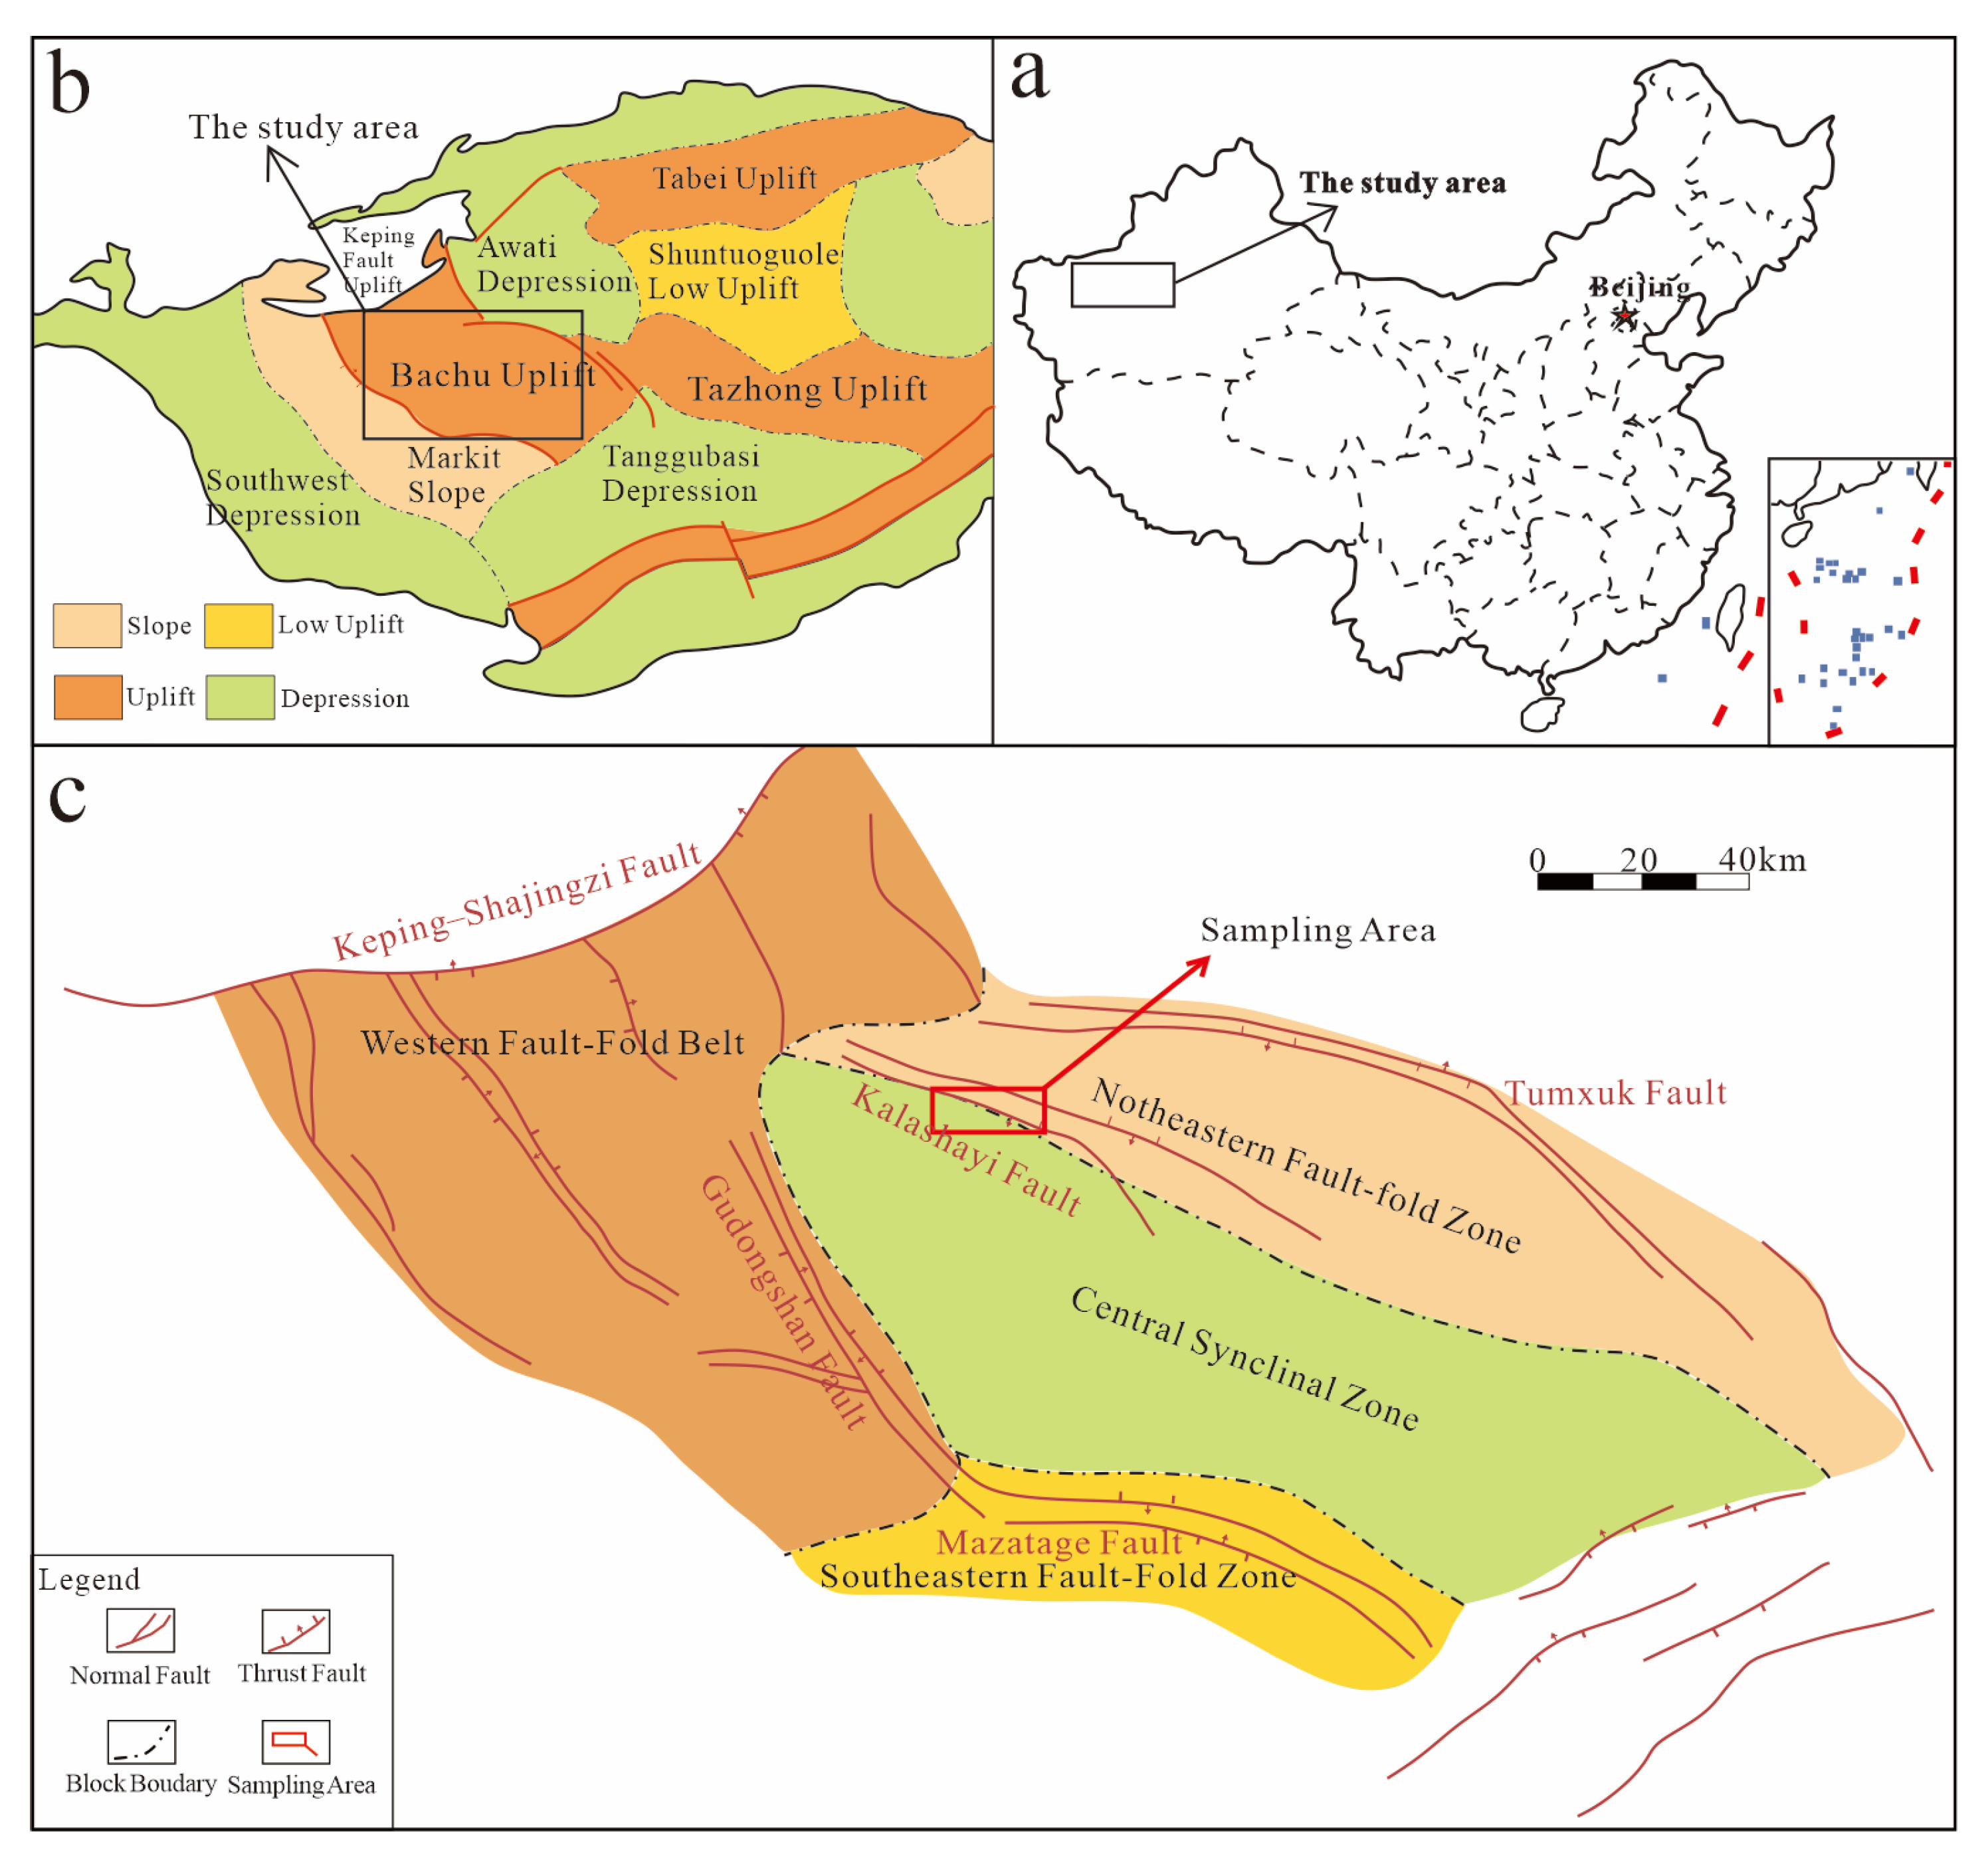
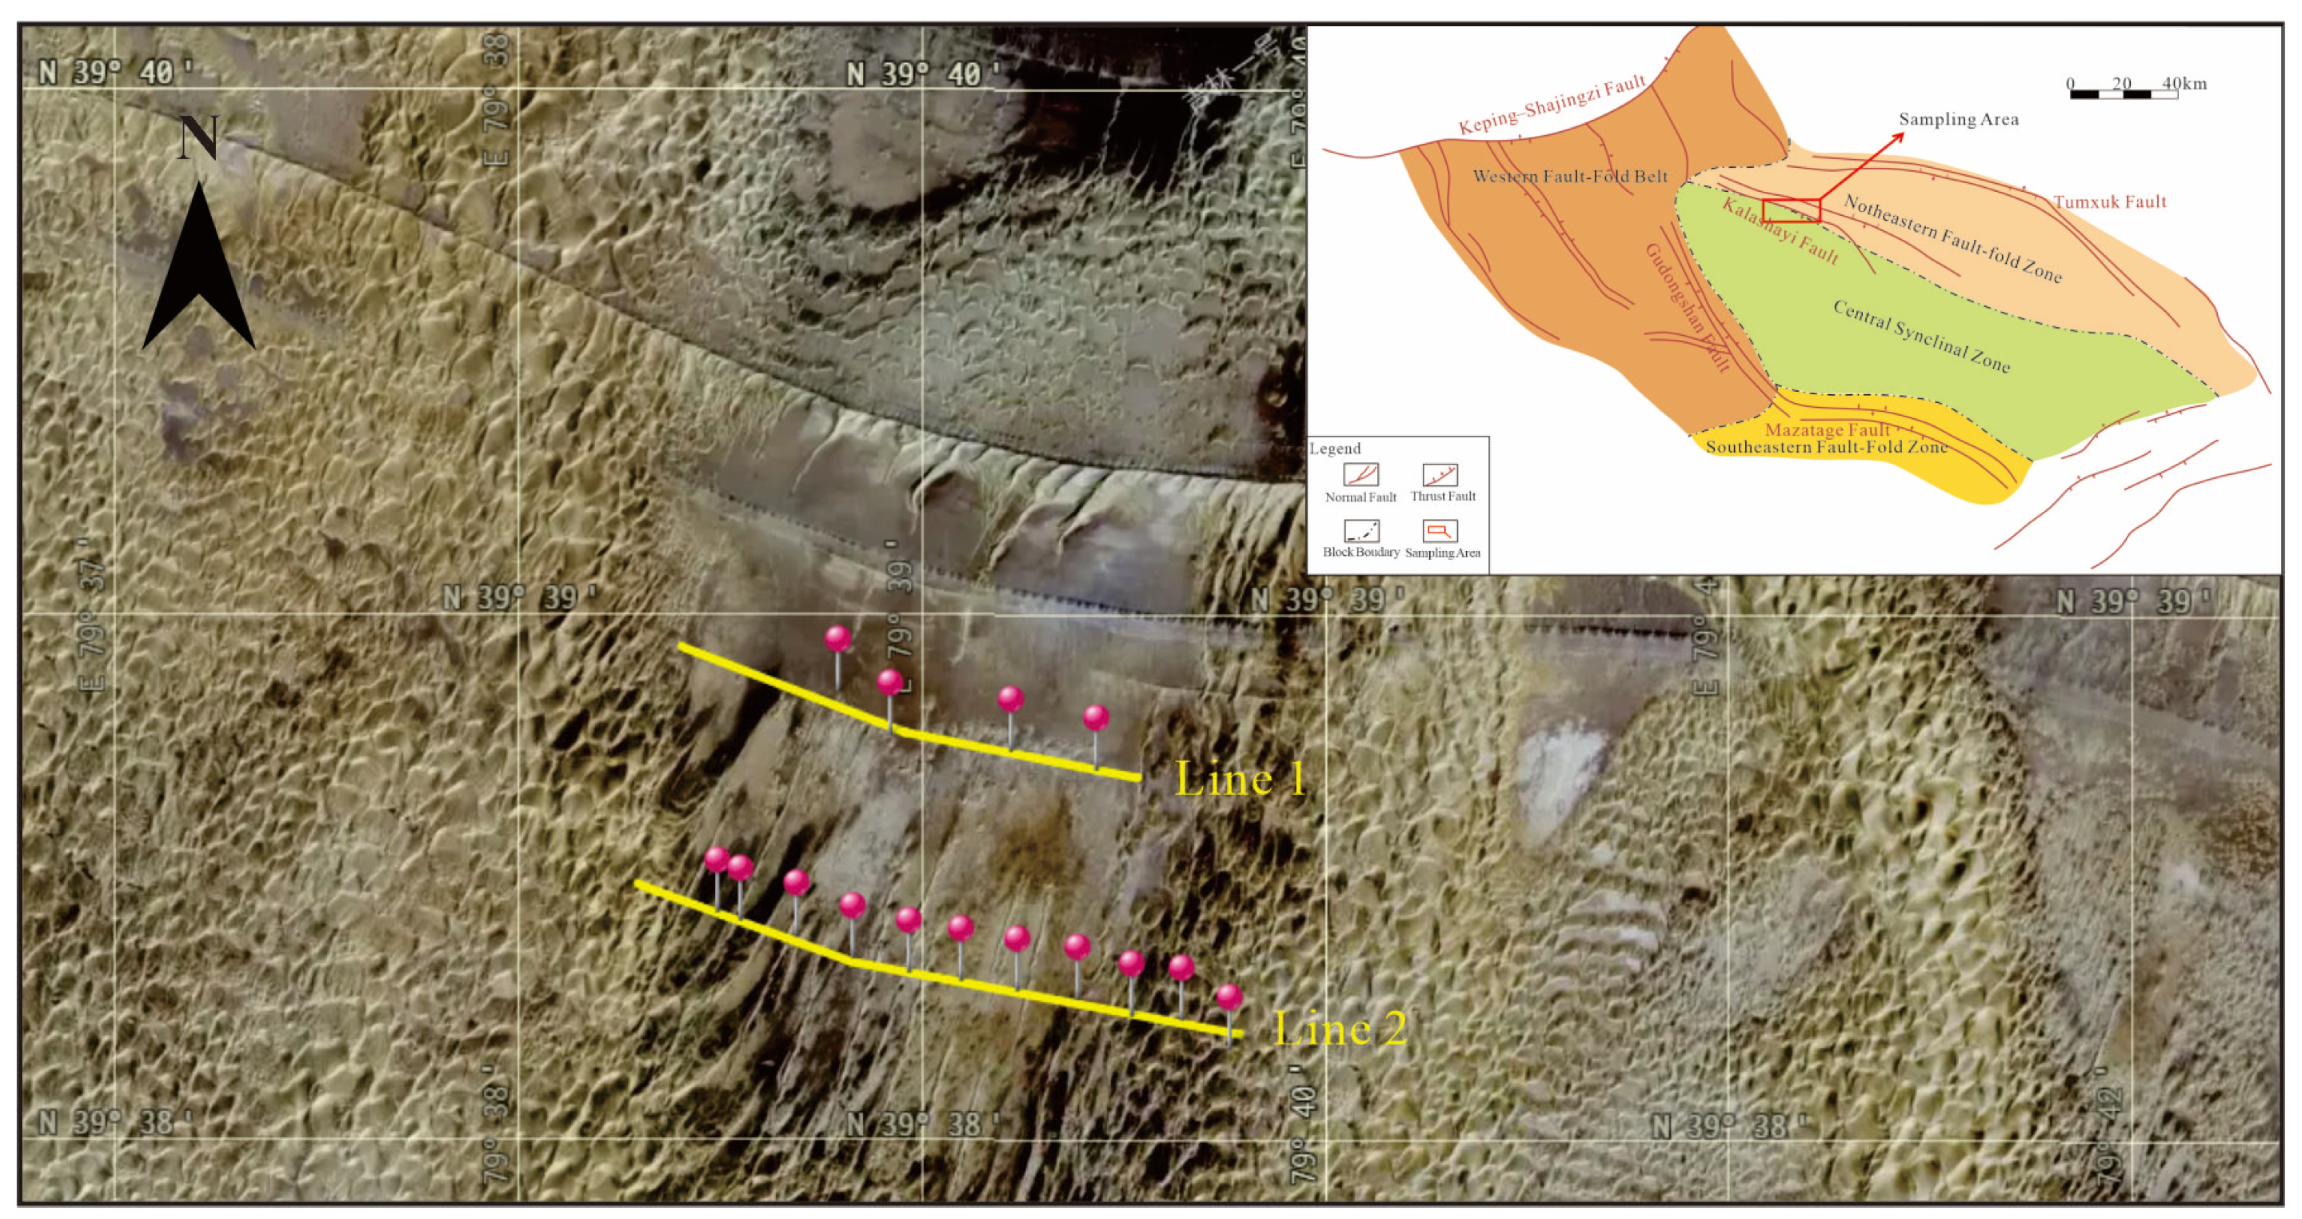
The Bachu Uplift is located in the western part of the Tarim Basin, extending about 500 km from east to west, spanning 80–150 km in width, and covering an area of roughly 4.75 × 10⁴ km2. Overall, it exhibits a northwest-trending, nose-shaped structural high that plunges from the northwest to the southeast. Its northwestern side is linked to the Keping faulted uplift through the Keping–Shajingzi Fault, while the northeastern boundary, demarcated by the Aqia–Tumxuk Fault, adjoins the Awati Depression. To the southeast, it is connected to the Tanggubasi Depression; and on the southwest side, it adjoins the Maigaiti Slope via the Selibuya–Haimiluo–Mazatag Fault system (Figure 2) [20,21]. The overall structural configuration is characterized by “two uplifts flanking one depression.” The study area is situated in the Bachu Central Depression, which is bounded by the Karashayi Fault Belt and the Gudongshan Fault Belt, lying closer to the Karashayi Fault Belt side [22,23,24].

3. Sample Collection and Analysis

3.1. Analytical Methods

Based on a review of previous work and identification of the fault structure distribution in the study area, two deep-penetration geochemical survey lines were laid out along the Karashayi Fault, and near-surface brine samples were collected.
Line 1 begins at 79°38′57.68″ E, 39°38′46.26″ N and ends at 79°39′25.91″ E, 39°38′42.20″ N. The sampling depth ranges from 1.68 m to 4.15 m, averaging 2.67 m, yielding a total of four samples.
Line 2 begins at 79°38′29.67″ E, 39°38′25.98″ N and ends at 79°39′45.94″ E, 39°38′10.36″ N. The sampling depth ranges from 1.61 m to 2.28 m, with an average of 2.12 m, yielding 11 samples in total.
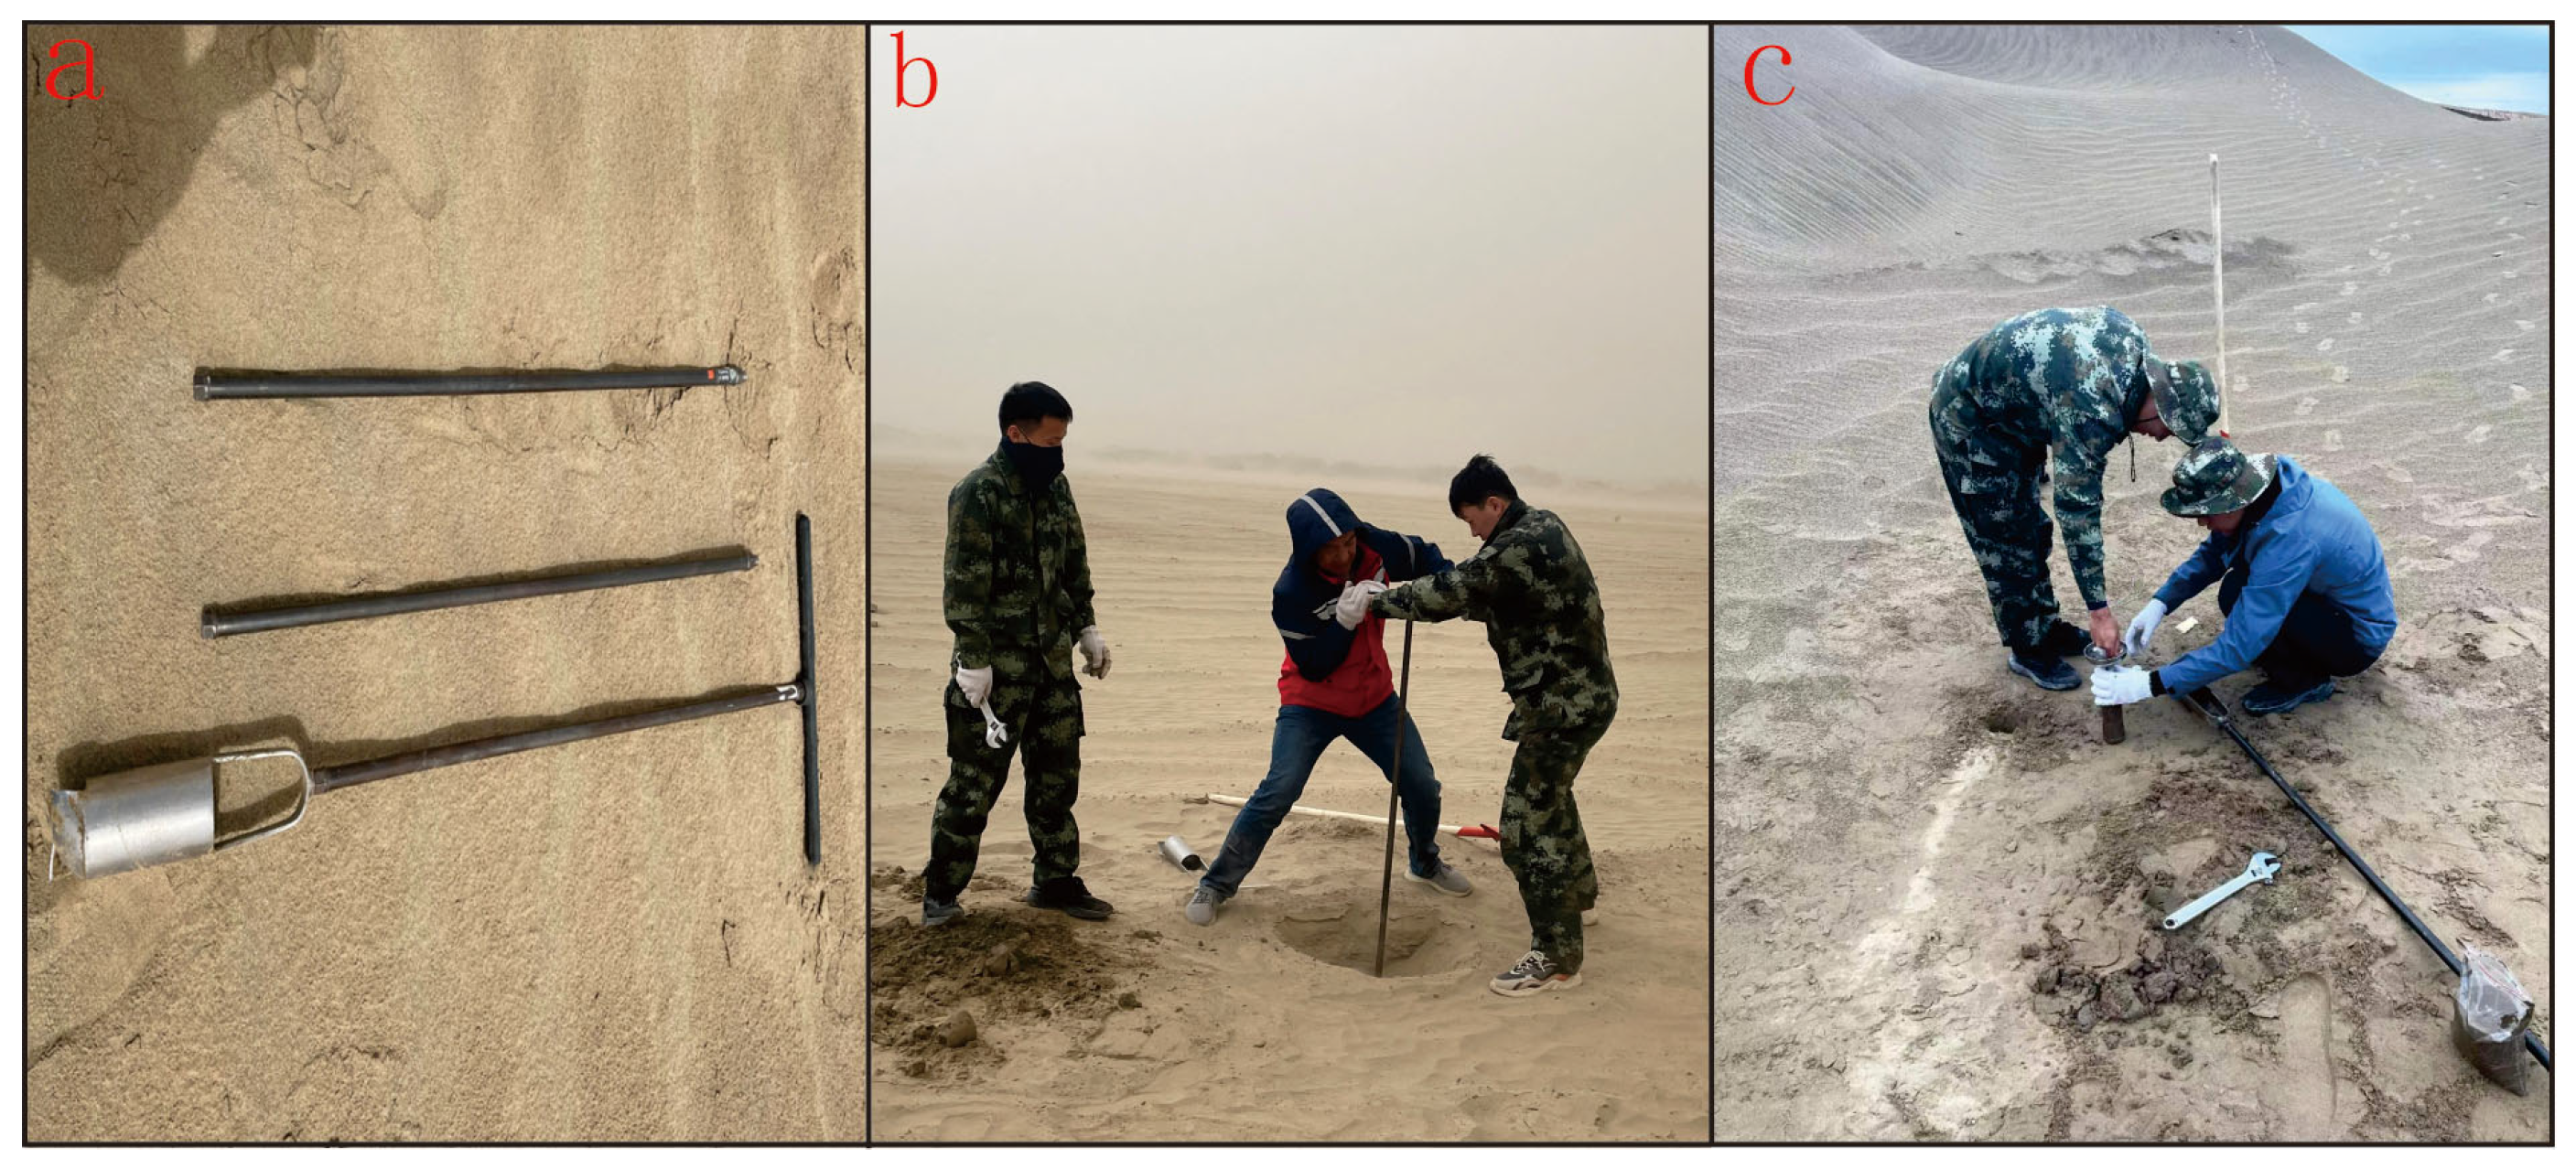
Sampling method: Two survey lines (Lines 1 and 2) were laid out in the southern section of the Karashayi Fault (Figure 3). Sampling was performed using an AMS soil sampler kit (USA). The soil was disturbed to a depth of approximately 4.1 m, and a soil core was extracted to create a shallow surface well. Water sampling was subsequently carried out within this shallow well (Figure 4). For Line 1, which is closer to the fault zone, the sampling density is lower, with samples taken at 400 m intervals. By contrast, points farther from the fault zone are spaced at 250 m, resulting in a higher sampling density. Prior to collecting each brine sample, the sample bottle was rinsed with the same brine to minimize contamination. The stratigraphic horizon and sampling depth were recorded for each collection. The brine samples were sealed in light-proof containers and subsequently transported to the laboratory for subsampling and further analysis.
Major- and trace-element analyses of the brine samples were carried out at the Testing Center of the Urumqi Natural Resources Comprehensive Survey Center, China Geological Survey. Prior to analysis, the samples were filtered and diluted to achieve optimal measurement ranges. Density was determined using an analytical balance, and salinity was measured with a salinometer to calculate total mineralization (TDS). Ion concentrations were determined by Inductively Coupled Plasma Optical Emission Spectrometry (ICP-OES, Thermo Scientific iCAP 7400,Thermo Fisher Scientific, Waltham, MA, USA) and ES JCSB-025 and Inductively Coupled Plasma Mass Spectrometry(ICP-MS)(Agilent 7900,Agilent technologies, Santa Clara, CA, USA),(JCSB-026), and anions (Cl, SO42−) were determined by ion chromatography (IC), with samples appropriately diluted prior to injection to eliminate high-salinity matrix interference. Alkalinity (HCO3 and CO32−) was measured on-site within 24 h of sampling via double-endpoint acid–base titration.
Hydrogen (δ2H) and oxygen (δ18O) stable isotope analyses were carried out at the Analysis and Testing Research Center of the Beijing Research Institute of Uranium Geology, following the method established by Tan Hongbing et al. [25]. Hydrogen and oxygen isotope measurements were performed via a MAT253 isotope ratio mass spectrometer (Thermo Fisher Scientific, Bremen, Germany) connected to a Flash 1112 HT elemental analyzer (Thermo Fisher Scientific, MA, USA).
Strontium isotopes (87Sr/86Sr) were likewise analyzed at the same center. To isolate Sr ions from other cations (especially Rb), the samples were passed through a cation-exchange column containing adequate amounts of ion-exchange resin (50 × 8, produced by Dow Chemical), after which Sr isotopic compositions were determined using a TRITON thermal ionization mass spectrometer (TIMS, Thermo Fisher Scientific, Bremen, Germany).
Sulfur isotope analyses (δ34S) were conducted at the Analysis and Testing Research Center of the Beijing Research Institute of Uranium Geology using a Delta V plus isotope ratio mass spectrometer (Thermo Fisher Scientific, Bremen, Germany) specifically designed for stable sulfur isotope measurements.

3.2. Analytical Results

The results of major and trace ion analyses for the samples are presented in Table 1, Table 2 and Table 3. The ionic composition of most samples is dominated by sodium and chloride, with the overall cation and anion concentrations exhibiting the following order: Cl > SO42− > HCO3 > CO32− > Br for anions, and Na+ > Ca2+ > Mg2+ > K+ for cations.
The K+ concentration along profile 1 ranges from 0.07 to 0.65 g/L, with an average of 0.35 g/L. The Na+ concentration varies between 3.83 and 35.36 g/L, with a mean value of 17.86 g/L. Ca2+ concentrations are between 0.73 and 0.95 g/L, averaging 0.85 g/L. Mg2+ ranges from 0.32 to 1.19 g/L, with an average of 0.72 g/L. Cl concentrations range from 4.6 to 44.83 g/L, with a mean of 22.91 g/L. SO42− varies from 2.89 to 5.8 g/L, with an average value of 4.22 g/L. HCO3 concentrations are between 0.145 and 0.181 g/L, with an average of 0.167 g/L. CO32− is detected in three samples, with concentrations of 2.31 mg/L and an average value of 1.73 mg/L. Br concentrations range from 0.34 to 0.94 mg/L, with an average of 0.42 mg/L.
The K+ concentration along profile 2 ranges from 0.13 to 0.29 g/L, with an average of 0.19 g/L. Na+ concentrations vary between 6.52 and 15.5 g/L, with a mean value of 10.11 g/L. Ca2+ concentrations range from 0.46 to 0.96 g/L, with an average of 0.71 g/L. Mg2+ concentrations are between 0.45 and 0.81 g/L, averaging 0.59 g/L. Cl concentrations range from 8.35 to 19.2 g/L, with a mean of 12.55 g/L. SO42− concentrations are between 2.47 and 3.56 g/L, with an average value of 3.03 g/L. HCO3 concentrations range from 0.131 to 0.21 g/L, with an average of 0.16 g/L. CO32− is detected in five samples, with concentrations ranging from 2.31 to 4.62 mg/L and an average value of 1.68 mg/L. Br concentrations vary from 0.23 to 0.39 mg/L, with an average of 0.32 mg/L.

4. Chemical Characteristics of Brine

4.1. Indication of Major and Trace Elements

According to Shukarev’s hydrochemical classification scheme (Table 4), the sampled underground brines are predominantly of the Cl-Na type. Piper trilinear diagrams also indicate that the water chemistry is mainly Cl-Na type, with some samples classified as the Cl·SO4-Na type. Based on the deep genesis of Cl-Na type brines and the deep-penetrating geochemical theory of the Boyin fault zone, deep material source information can be transported to the surface and captured through fault zones [19,26]. Since the sampling sites are located near the Karashayi fault zone in the central part of the Bachu Uplift, it is considered that the Cl-Na water type may be significantly influenced by the presence of these major faults. Therefore, analyzing samples of this water type can provide insights into the deep-seated ore-bearing potential.
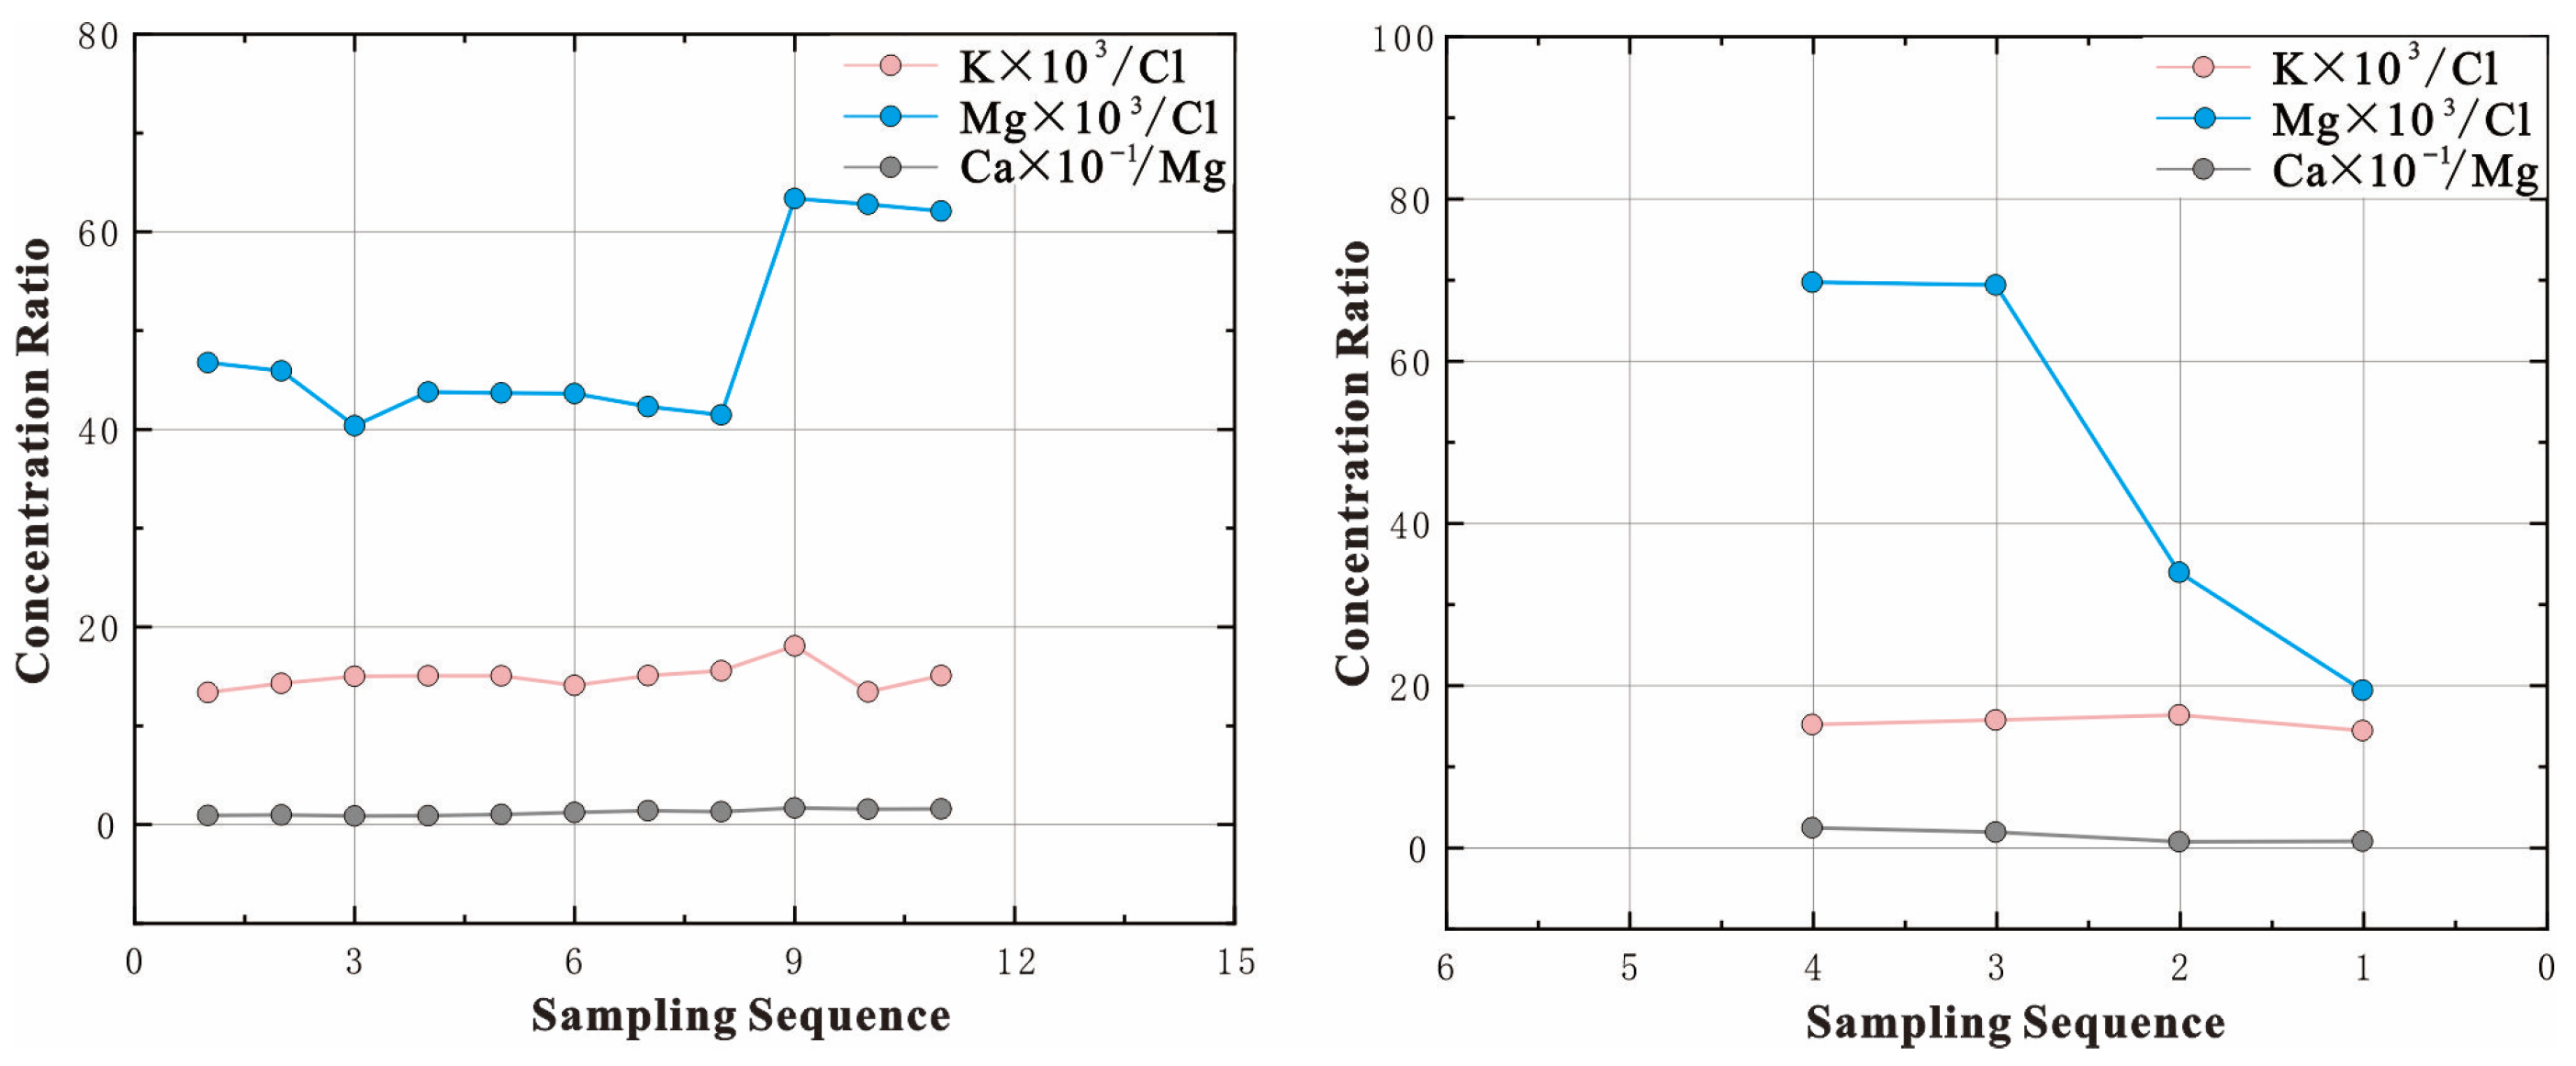
By analyzing the elemental concentrations and ratios in surface profile samples, anomalies can be identified and deep-seated information can be inferred [19]. Using typical hydrochemical characteristic coefficients as indicators for potash exploration provides a reliable basis for delineating favorable potash target areas [24,27]. Br/Cl ratios are commonly used as important indicators in the exploration for typical ancient potash deposits [28,29]. The Tarim Basin has experienced multiple episodes of marine–terrestrial transitional sedimentation, resulting in a relative depletion of bromine in brines and evaporite deposits. Figure 5 illustrates the variations in K/Cl, Mg/Cl, and Ca/Mg ratios along the two sampling profiles. The K/Cl ratios along both Profile 1 and Profile 2 exhibit relatively little variation, with an average value of 15. The Mg/Cl ratios (Mg × 10−3/Cl) are notably higher at sampling points 9–11 on Profile 1 and at points 3 and 4 on Profile 2, with values ranging from 19.43 to 69.73. The Ca/Mg ratios (Ca × 10−1/Mg) show minimal variation, with an average value of 1.2. It is noteworthy that all samples with elevated Mg/Cl ratios are located in the eastern sections of both profiles, adjacent to the central depression of the Bachu Uplift, which may suggest a more favorable prospect for potash exploration in the eastern area of the profiles.
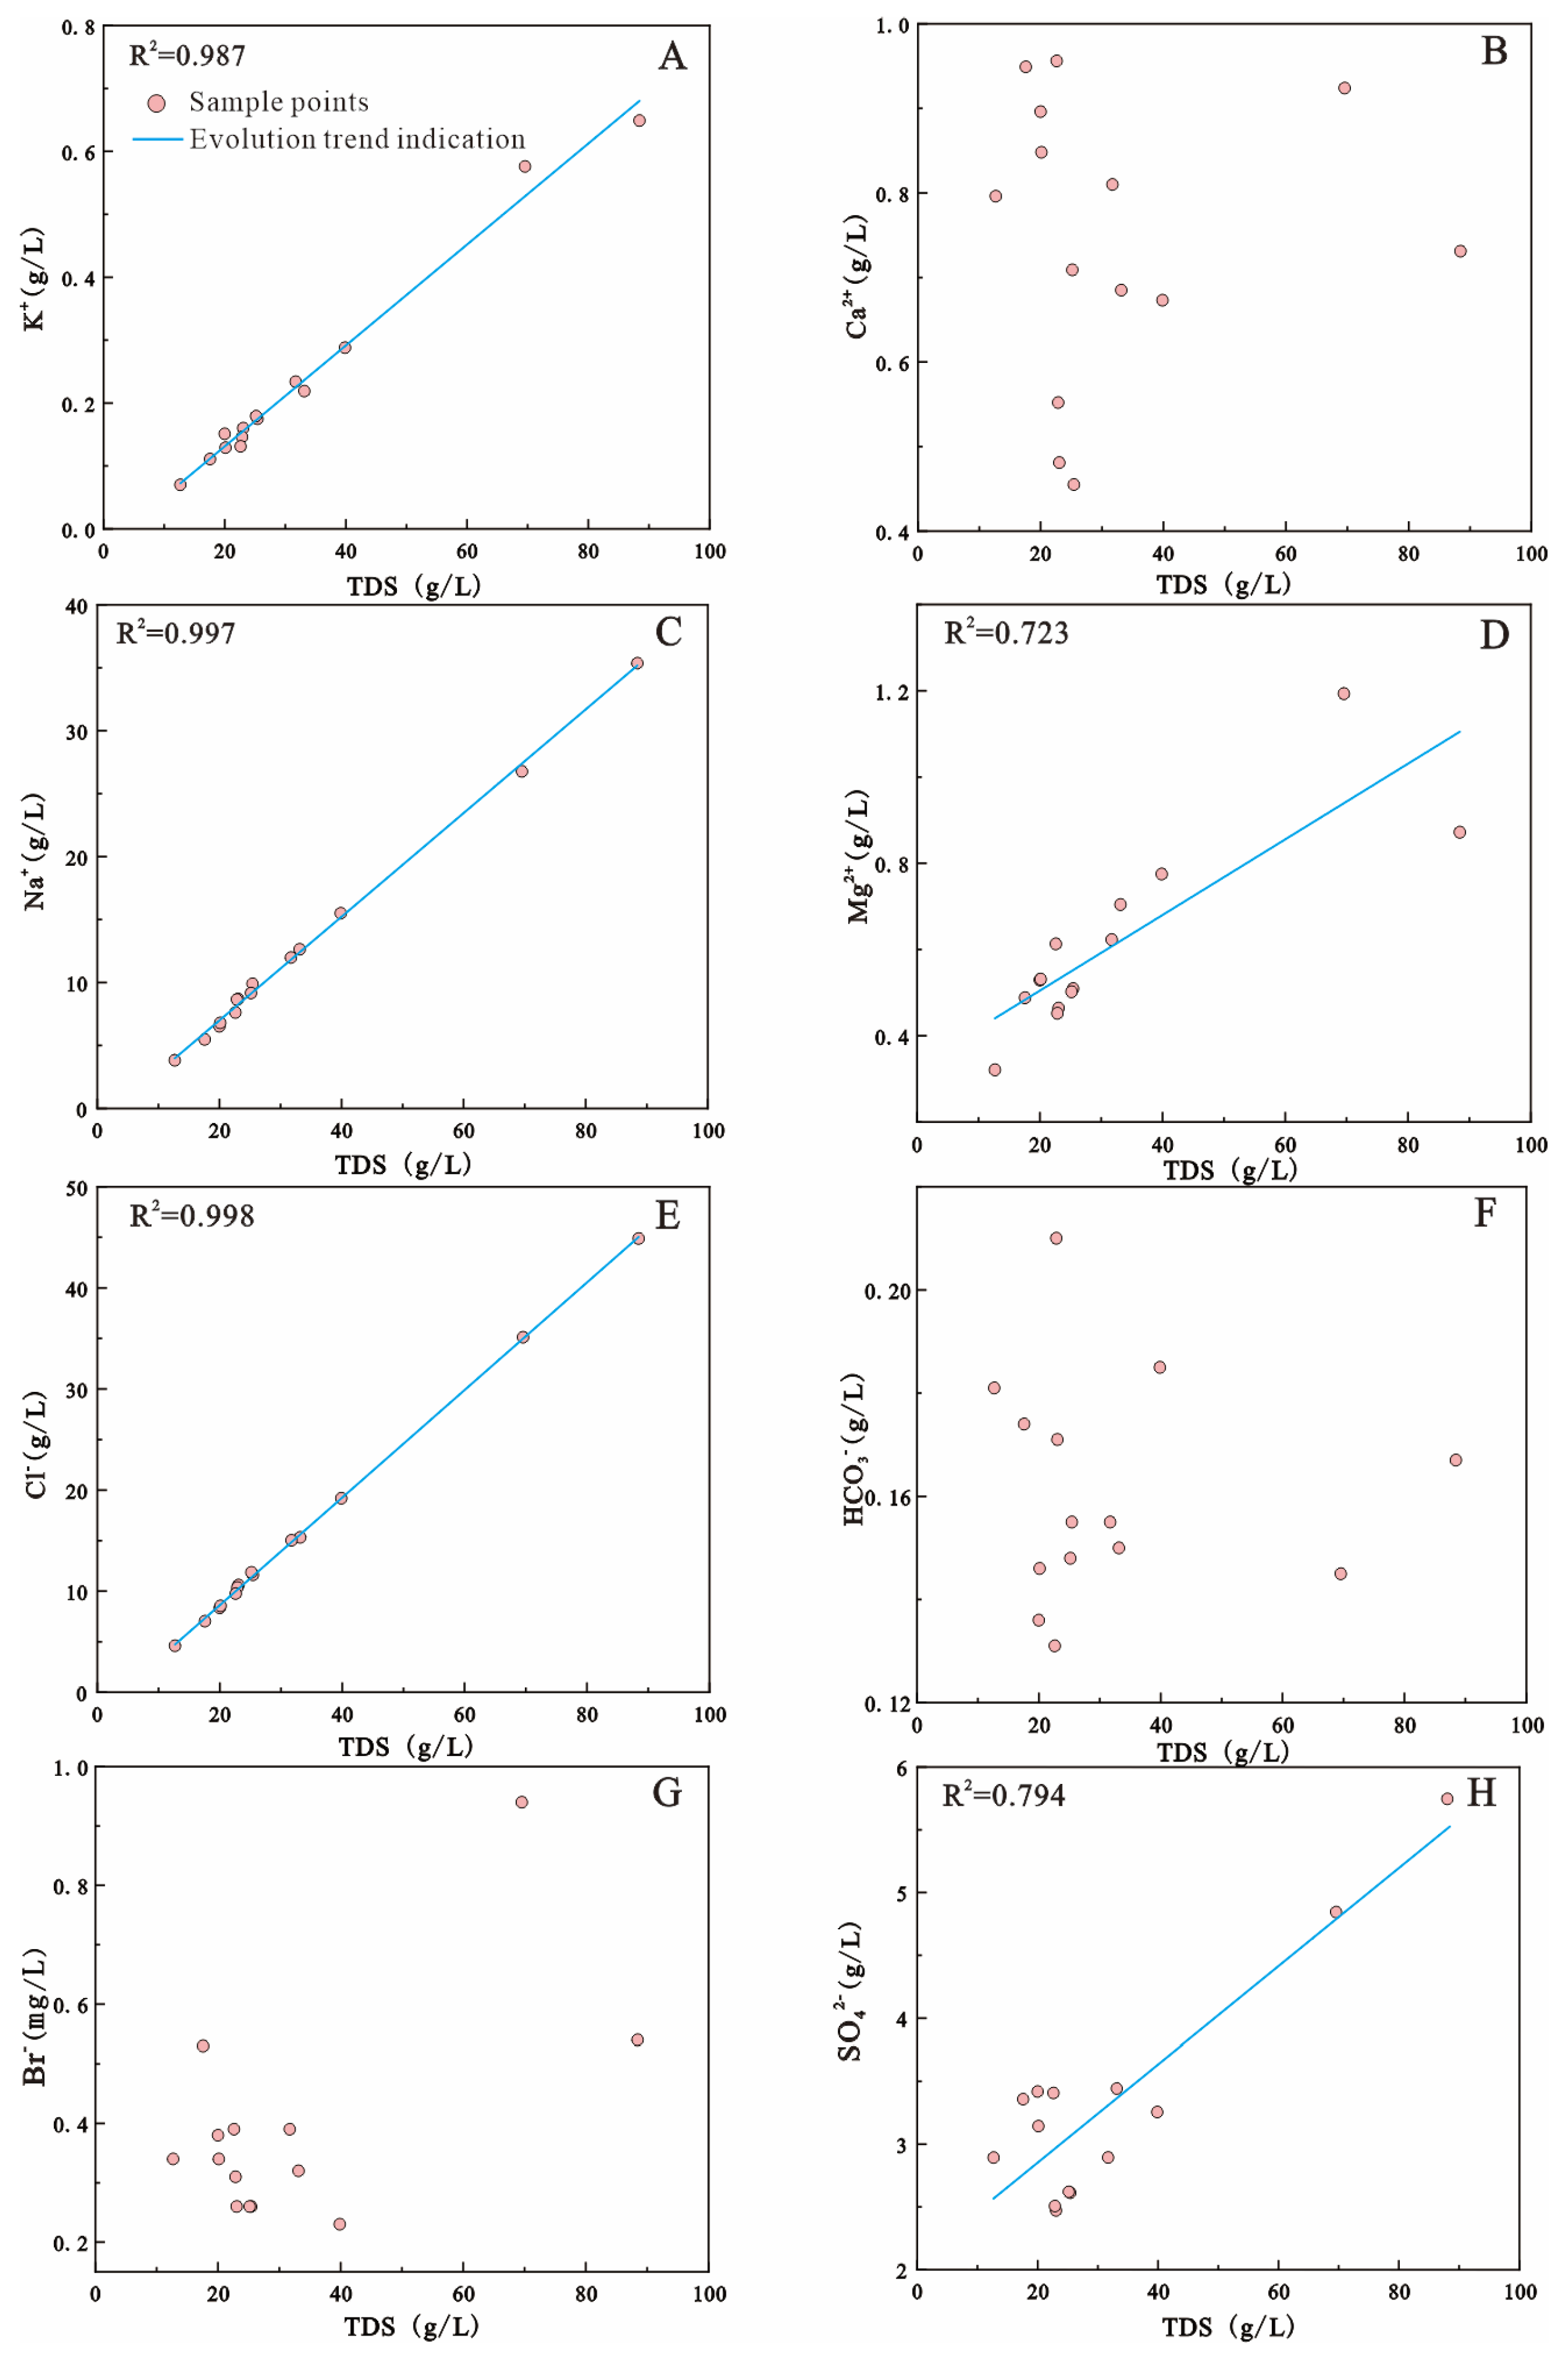
As shown in Figure 6, there is a strong correlation between the concentrations of potassium, sodium, and chloride and the total salinity, with correlation coefficients of K (R2 = 0.987), Na (R2 = 0.997), and Cl (R2 = 0.998), respectively. Sulfate and magnesium ions also exhibit relatively high correlations with salinity, with correlation coefficients of SO42− (R2 = 0.794) and Mg (R2 = 0.723). These results indicate that the major solute sources in the brine samples are primarily derived from the dissolution of halite. The high correlation between K and salinity further suggests that the groundwater may have dissolved potash-bearing salt layers. In contrast, bicarbonate and bromide ions display weak correlations with salinity, and the low correlation between Br and salinity is consistent with the characteristically low Br content of the ancient halite in the Tarim Basin [29].
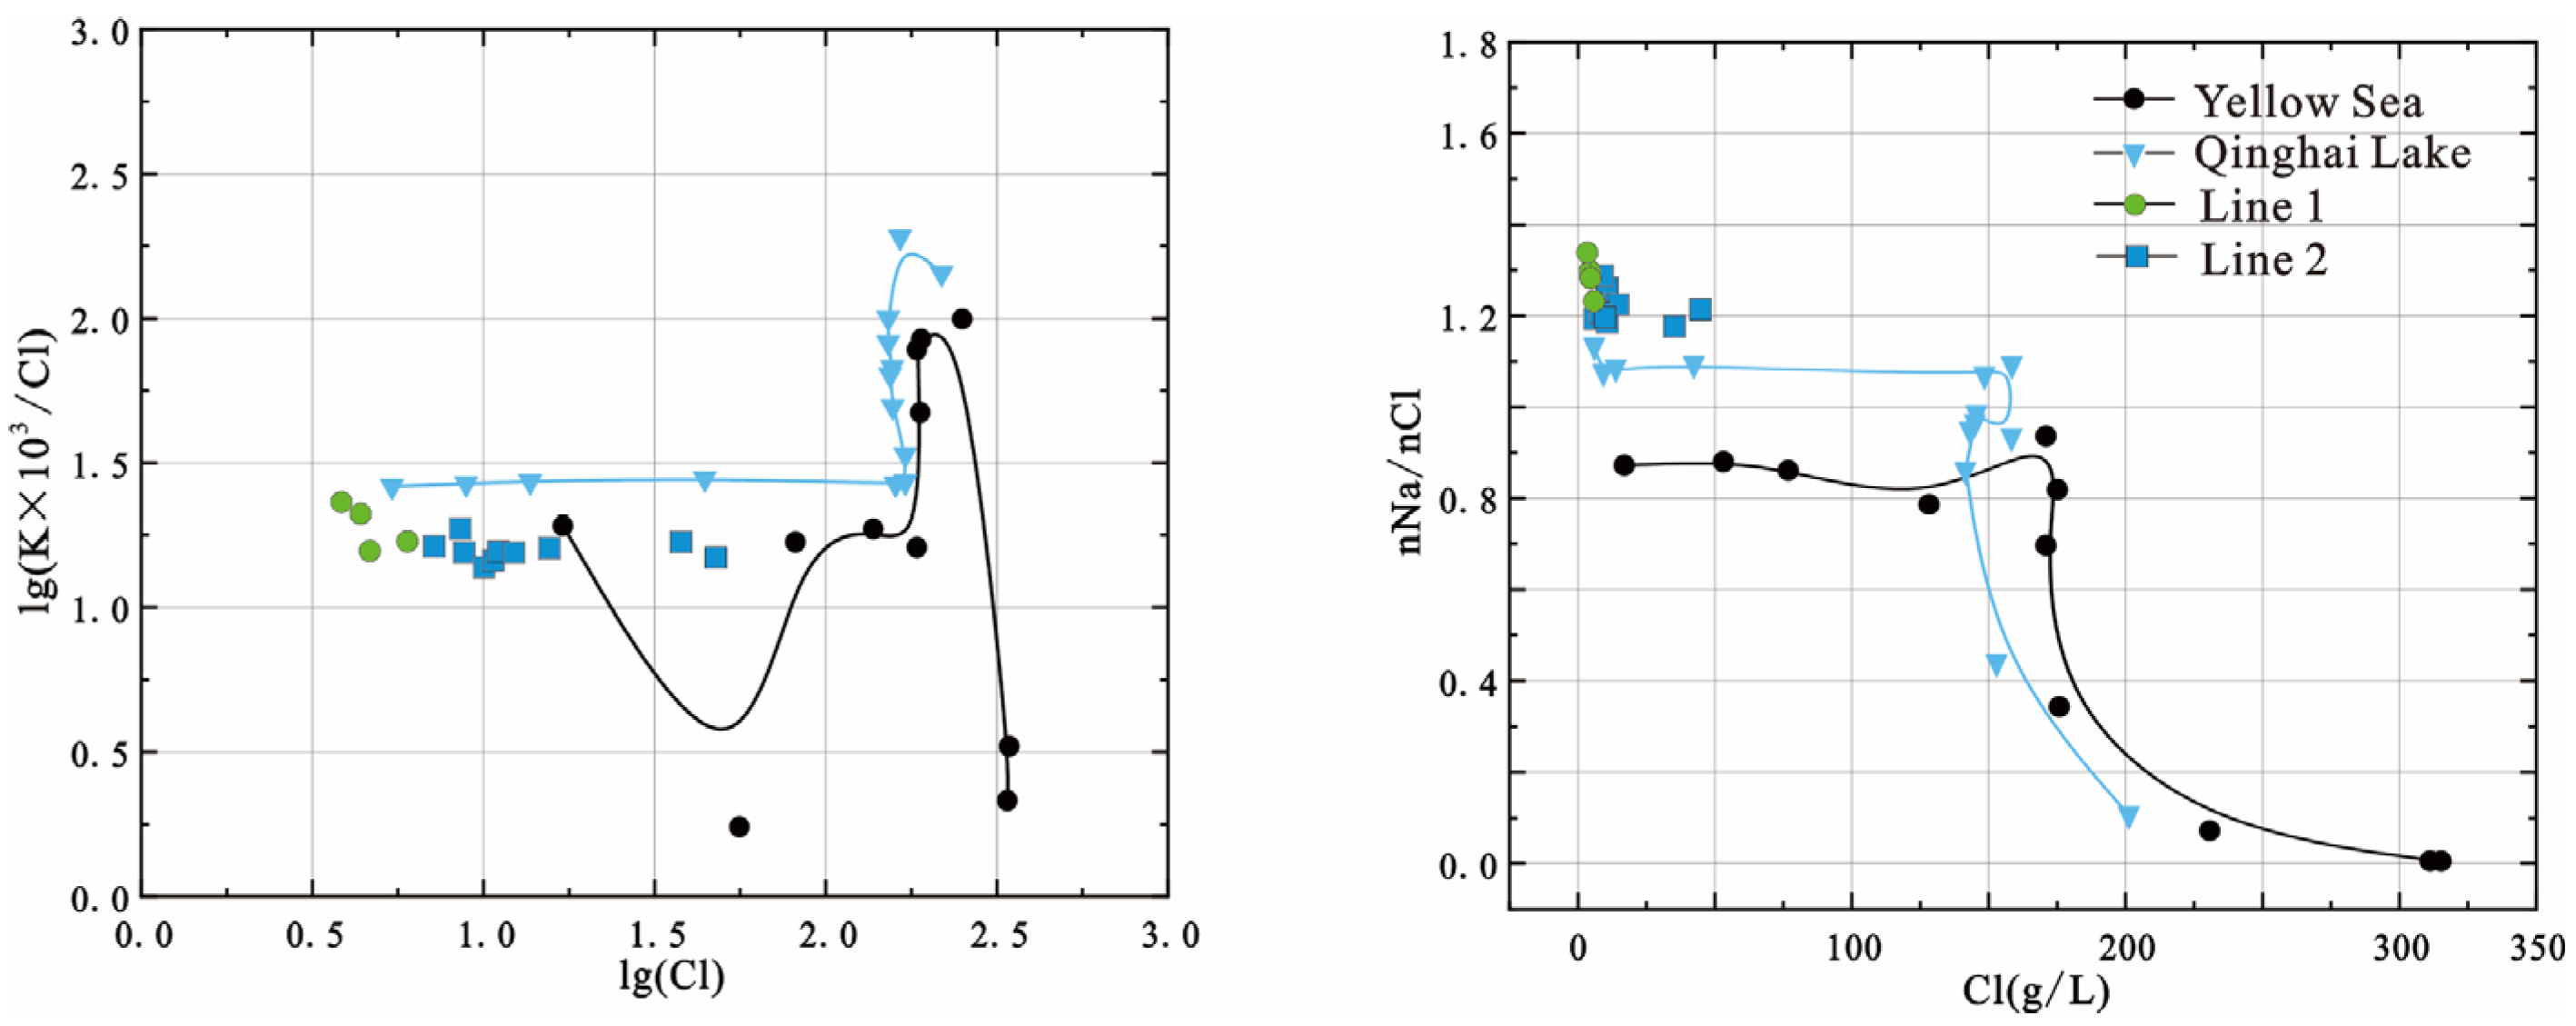
The K/Cl ratio is considered a direct indicator for potash exploration [27,29]. In the K/Cl ratio diagram (Figure 7), all samples from both profiles in this study exhibit K × 103/Cl values lower than those observed in lake water after evaporative concentration. In addition, the cNa/cCl molar ratio and Br × 103/Cl ratio in seawater are considered the most stable indicators. When cNa/cCl is approximately 0.87 and Br × 103/Cl is around 3.3, the brine is classified as marine sedimentary brine. When the cNa/cCl ratio ranges from 0.87 to 0.99 or higher, and the Br × 103/Cl ratio is less than 1, the brine is considered halite-dissolution brine. If the cNa/cCl ratio is less than 0.87 and the Br × 103/Cl ratio is greater than 3.3, the brine is identified as metamorphic sedimentary brine [30,31,32]. In this study, all samples exhibit cNa/cCl values greater than 1 and Br × 103/Cl values less than 1, indicating that the underground brines in the Bachu Uplift are halite-dissolution brines.
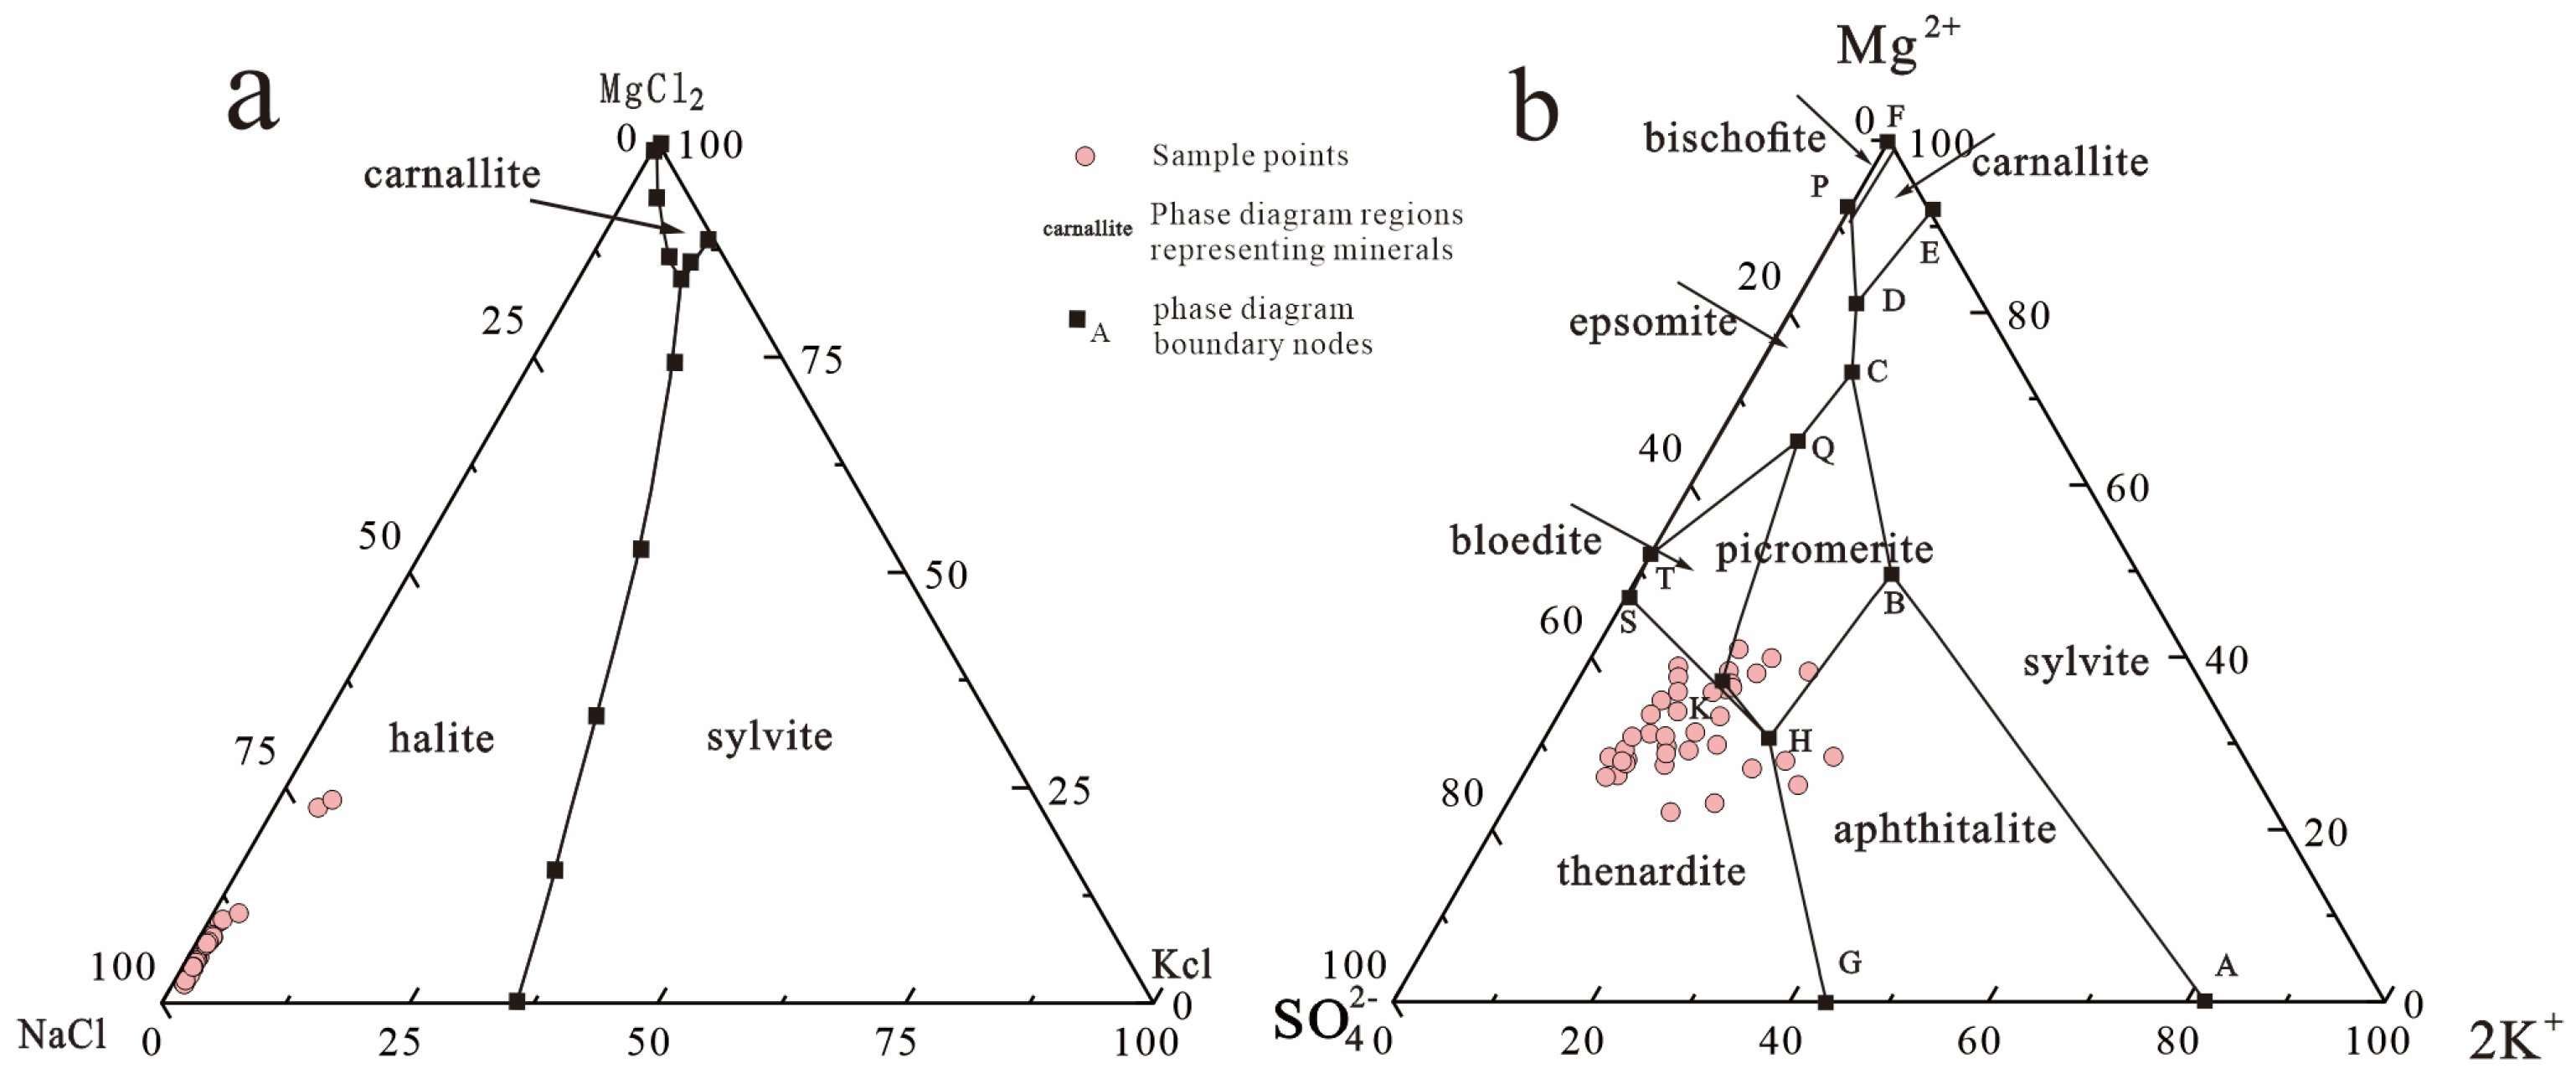
To further validate the hydrochemical evidence, the underground water samples from the Bachu Uplift were plotted on the metastable phase diagram of the Na+,K+,Mg2+//C1-H2O Quaternary system at 25 °C, as well as the metastable phase diagram of the Na+,K+,Mg2+//C1,SO42−-H2O Quinary system, These two phase diagrams are geochemical tools used to predict which evaporite minerals will precipitate sequentially from water at a given temperature as evaporation and concentration proceed. They can be regarded as “mineral crystallization roadmaps,” in which different fields represent the chemical conditions under which specific salts reach saturation and begin to precipitate. When data points “move” toward particular regions, this reflects differences among water samples from different spatial locations, indicating that different mineral dissolution processes dominate their chemistry. At 25 °C. According to the metastable phase diagram of the Na+–K+–Mg2+//Cl–H2O Quaternary system (Figure 8a), all brine samples plot within the halite phase field and cluster toward the high-Na end, indicating that the brine likely originates from the dissolution of halite [21,33]. When the Bachu Uplift brine samples are projected onto the Na+,K+,Mg2+//C1,SO42−-H2O Quinary metastable phase diagram (Figure 8b), they are mainly distributed in the thenardite (Na2SO4) phase field, with the evolutionary trajectory trending towards the schoenite (K2SO4·MgSO4·6H2O) and picromerite (K2SO4·MgSO4·6H2O) phase fields. This suggests that the brine samples correspond to the early to middle stages of potash salt deposition [34,35].
In summary, the results from both the Na+–K+–Mg2+//Cl–H2O Quaternary and the Na+,K+,Mg2+//C1,SO42−-H2O Quinary metastable phase diagrams are consistent with the interpretations based on ion concentration variations and hydrochemical coefficient characteristics. Collectively, these lines of evidence indicate that the underground brines have undergone halite dissolution during subsurface flow through the strata.
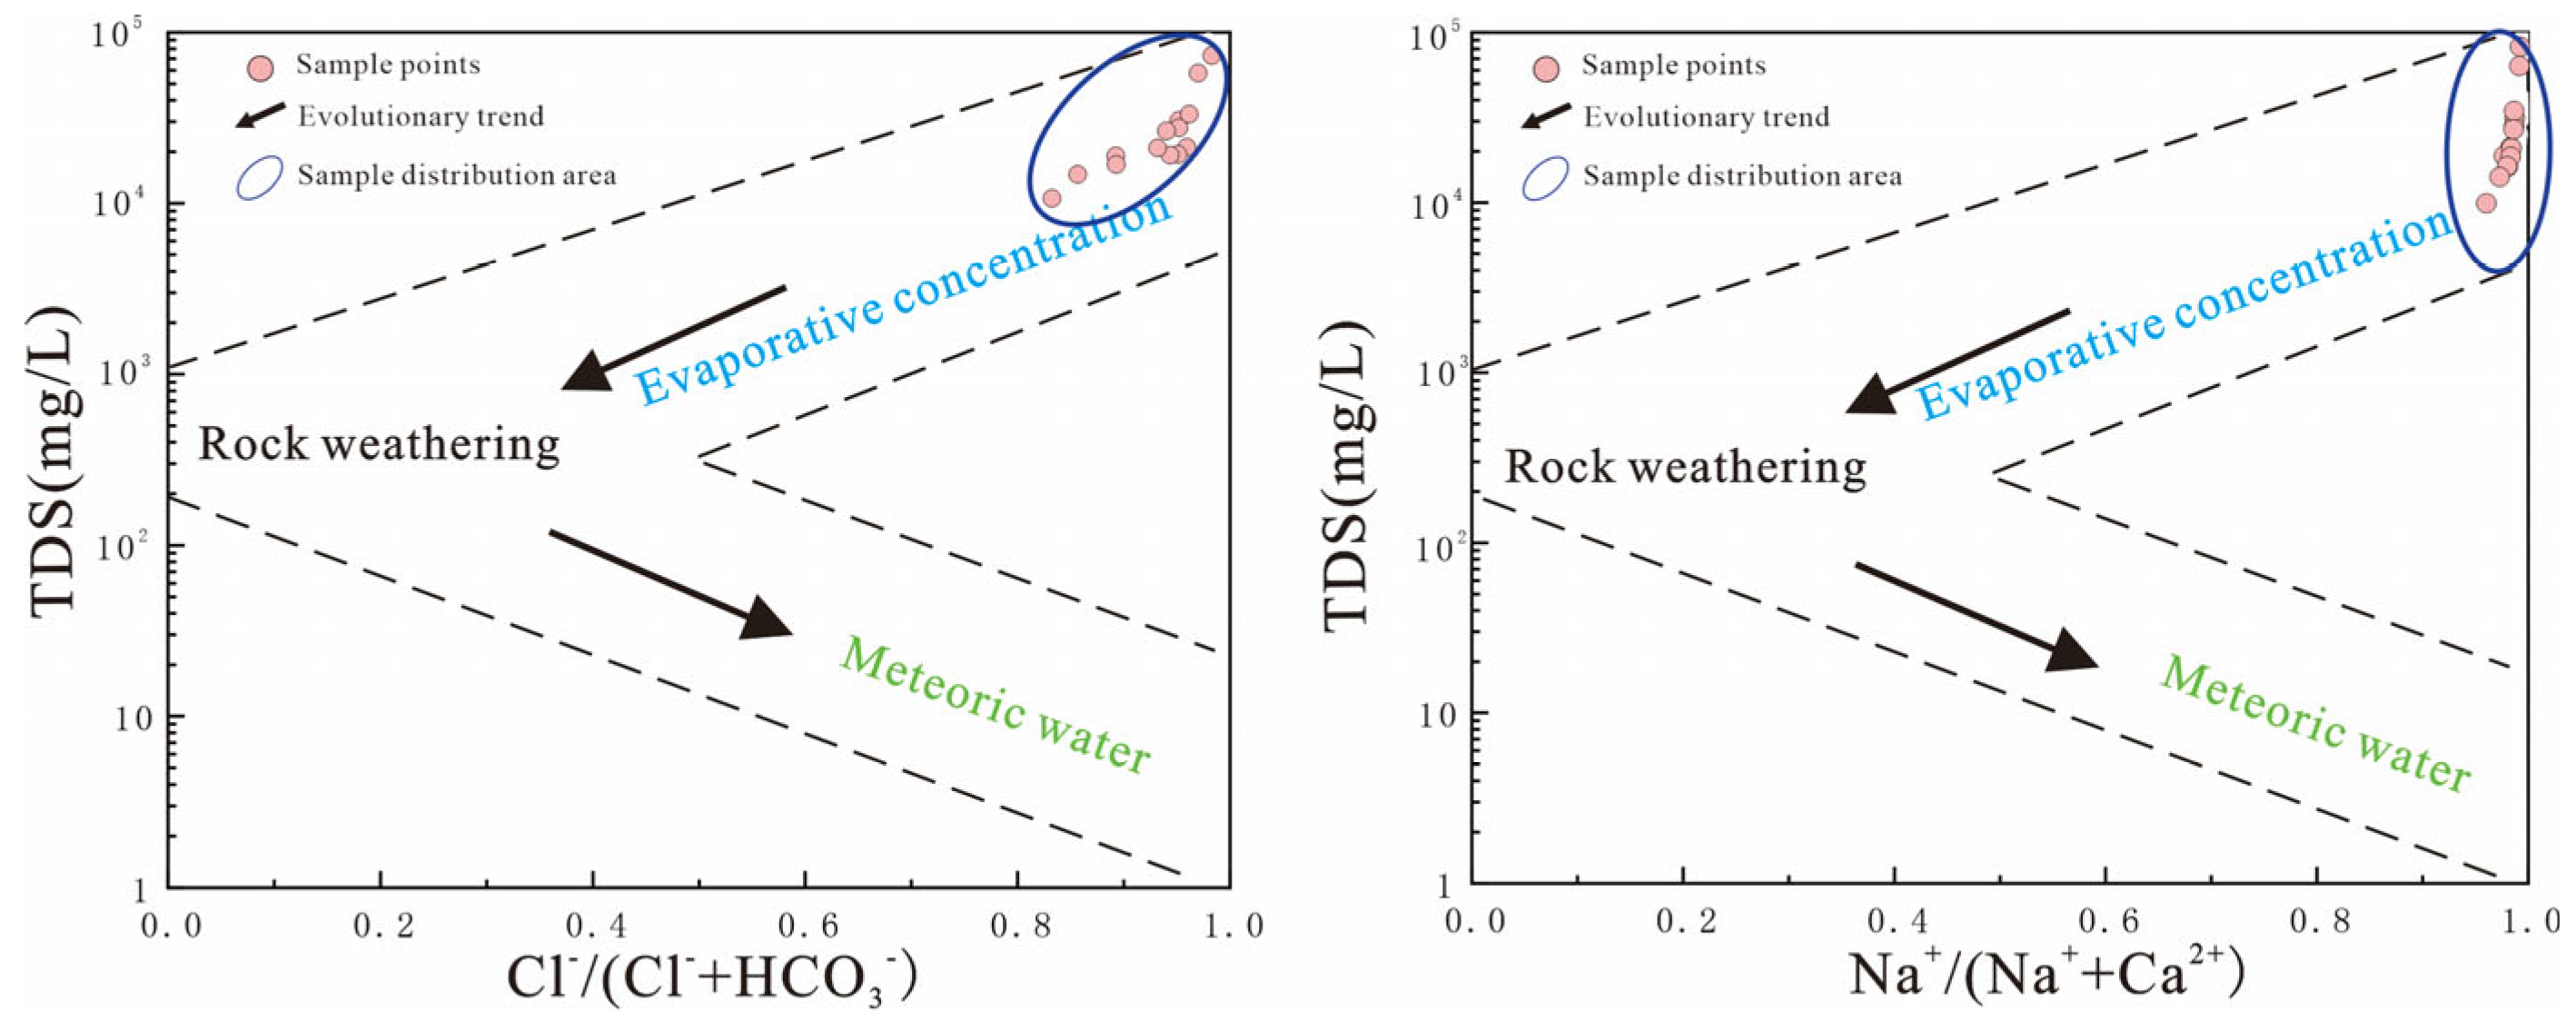
The Gibbs diagram was used to analyze the controlling processes of hydrochemical composition (Figure 9) [28]. This diagram is divided into three control fields: evaporation–crystallization dominance, rock weathering dominance, and precipitation dominance, which correspond to the relative influence of these processes on the major ions in groundwater. The brine samples are mainly distributed within the dashed lines, predominantly falling within the evaporation–crystallization dominance field, indicating that the hydrochemical composition of the brines is primarily controlled by evaporation and concentration processes.

4.2. Isotopic Characteristics and Indications

The stable hydrogen and oxygen isotope compositions vary with factors such as precipitation, temperature, latitude, and elevation. Therefore, the isotope effects related to precipitation amount, temperature, latitude, and elevation can be used to reveal information about groundwater recharge temperature, recharge elevation, recharge processes, geothermal resources, precipitation–runoff relationships, and geochemical evolution [30,36,37].
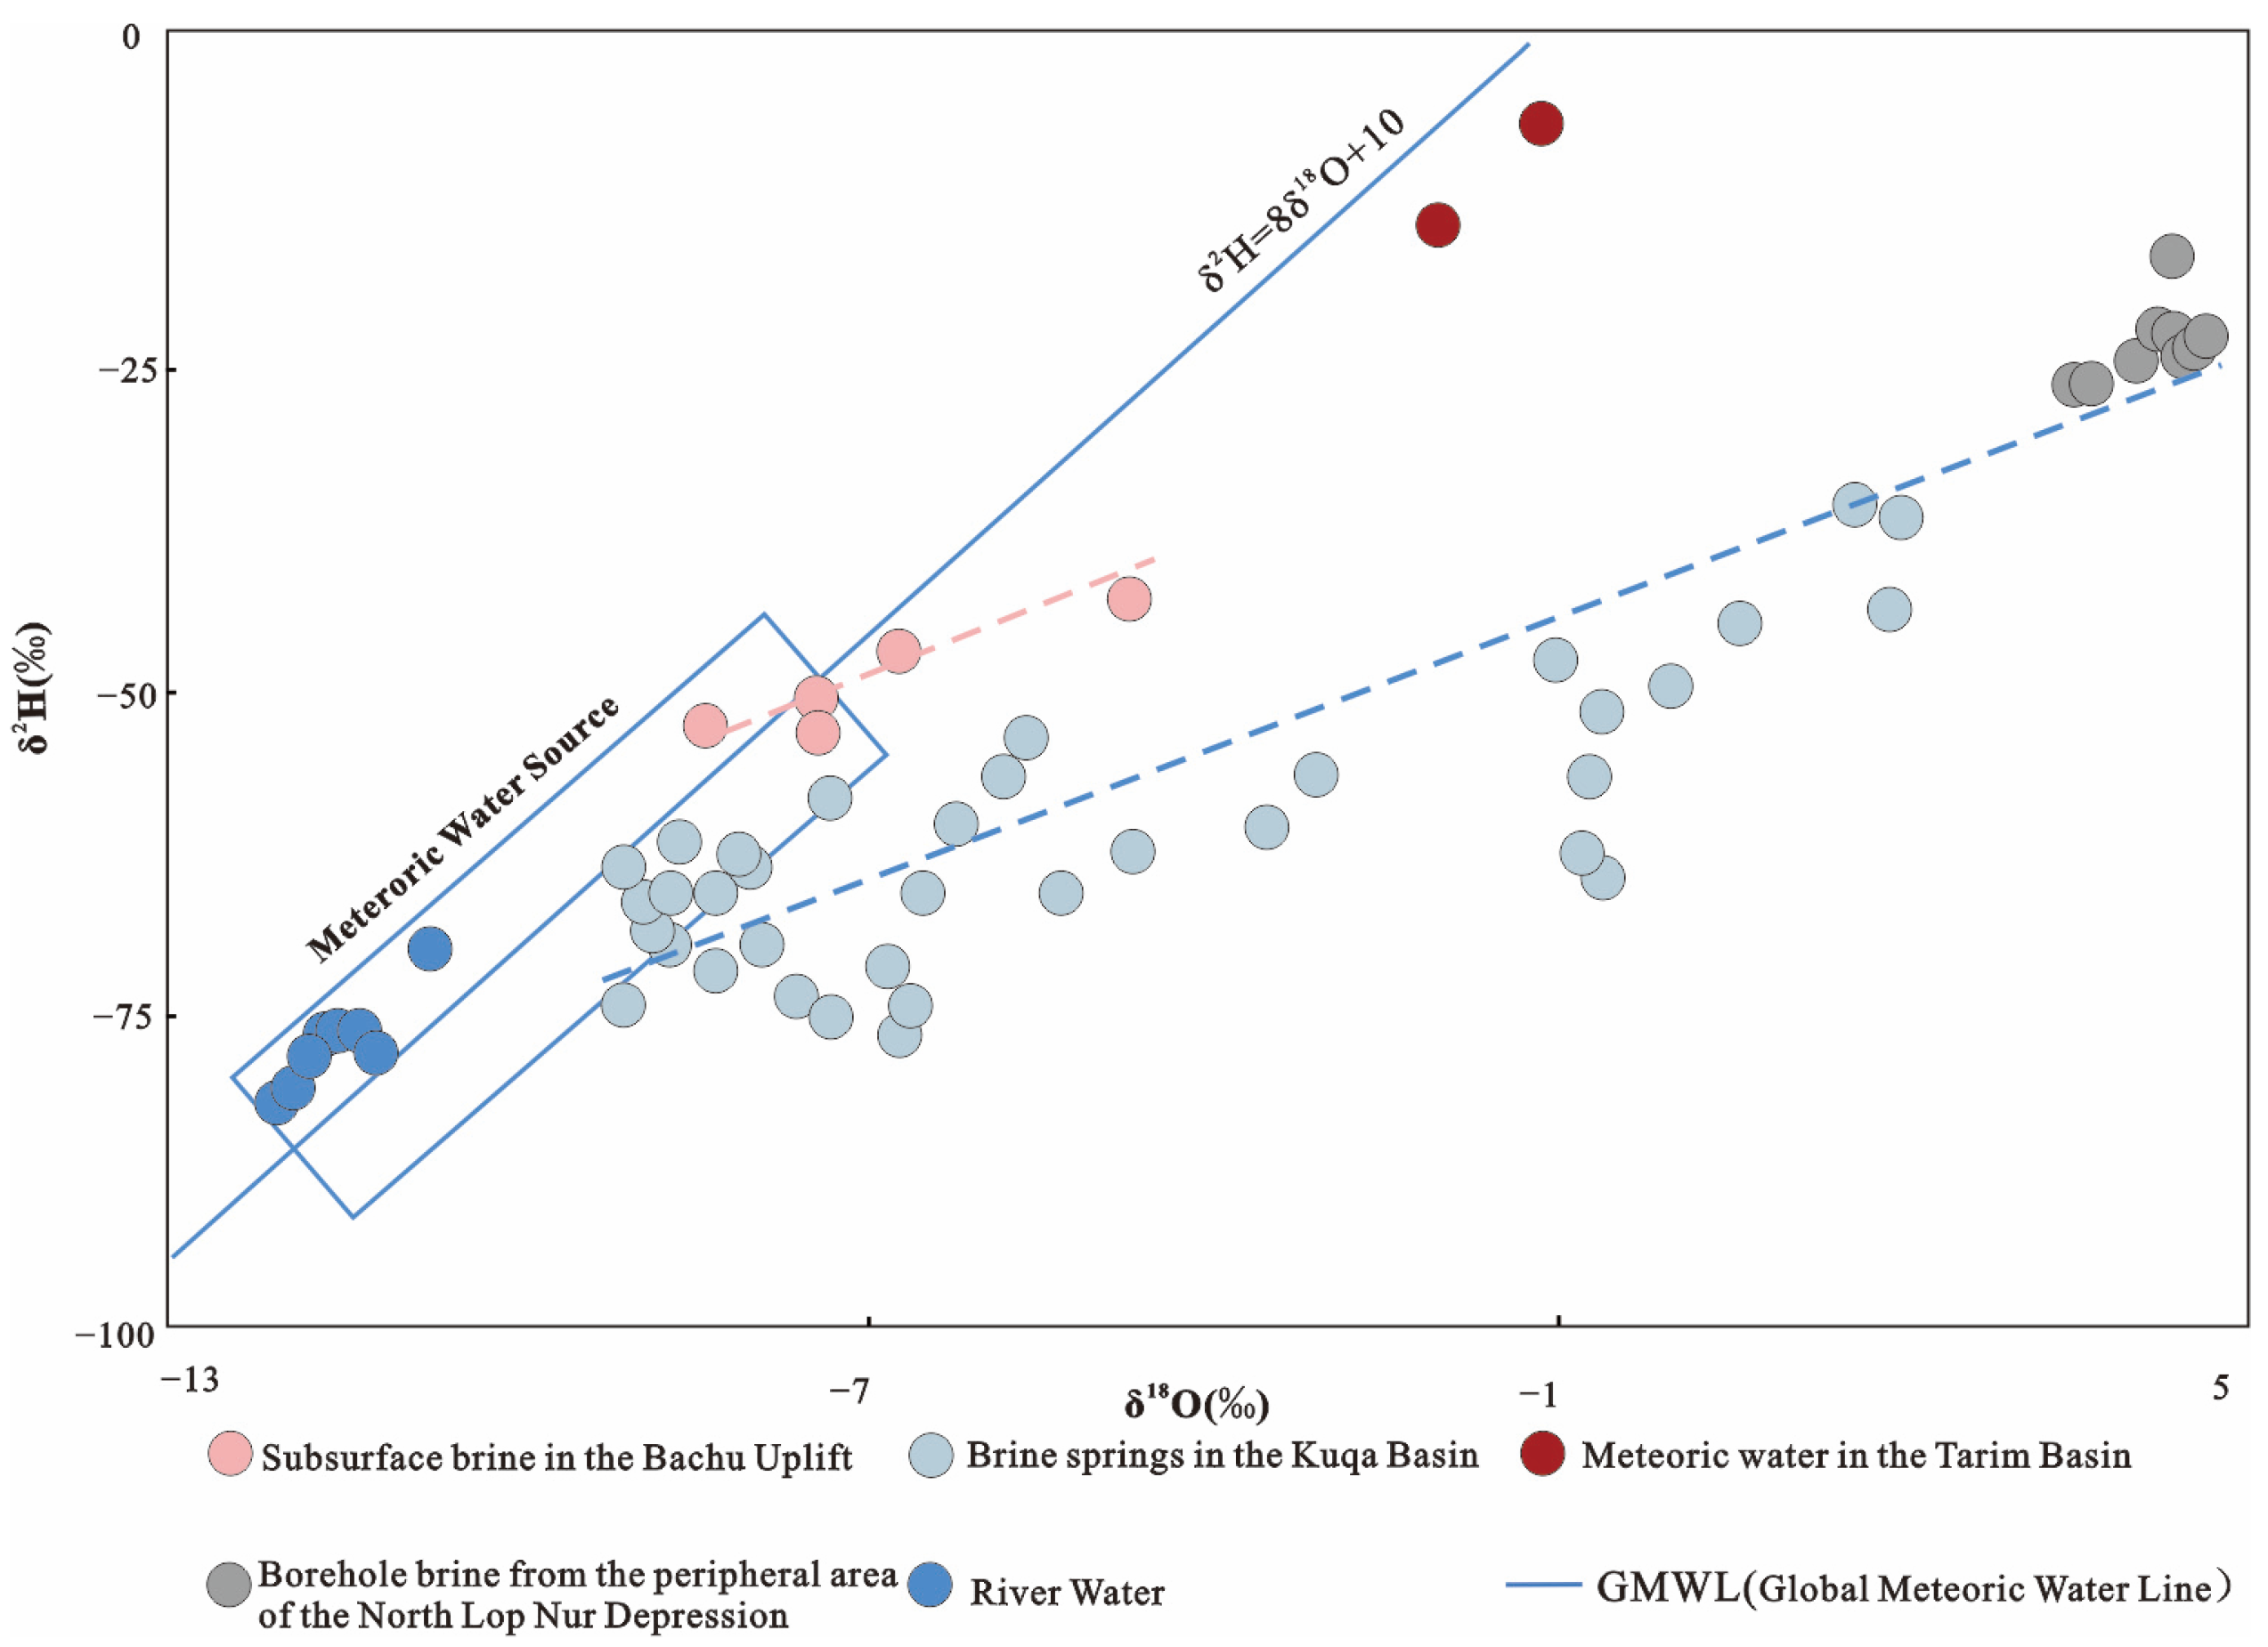
The variations in stable isotopes 2H and 18O in natural waters, resulting from differences in vapor sources and evaporative fractionation, provide distinctive signatures that can be used to trace their different origins [38,39]. The δ2H values of underground brine in the Bachu Uplift range from −47.00‰ to −54.00‰, while δ18O values range from −4.70‰ to −8.50‰. In comparison, the δ2H values of river water range from −70.00‰ to −82.00‰, with an average of −77.3‰, and δ18O values range from −10.80‰ to −12.20‰, with an average of −11.63‰ (Figure 10). Most of the underground brine samples plot near the meteoric water line, indicating that atmospheric precipitation is the primary recharge source for the Bachu Uplift brines. Some samples deviate significantly from the meteoric water line towards the evaporation-enrichment field, suggesting an influence of evaporation concentration. The enrichment in δ18O values further confirms the impact of water–rock interaction processes on the samples [28].
Strontium isotopes are only weakly fractionated by processes such as evaporation, microbial activity, and chemical reactions. Therefore, strontium isotopes can be used to further constrain the sources of the saline materials [40,41].
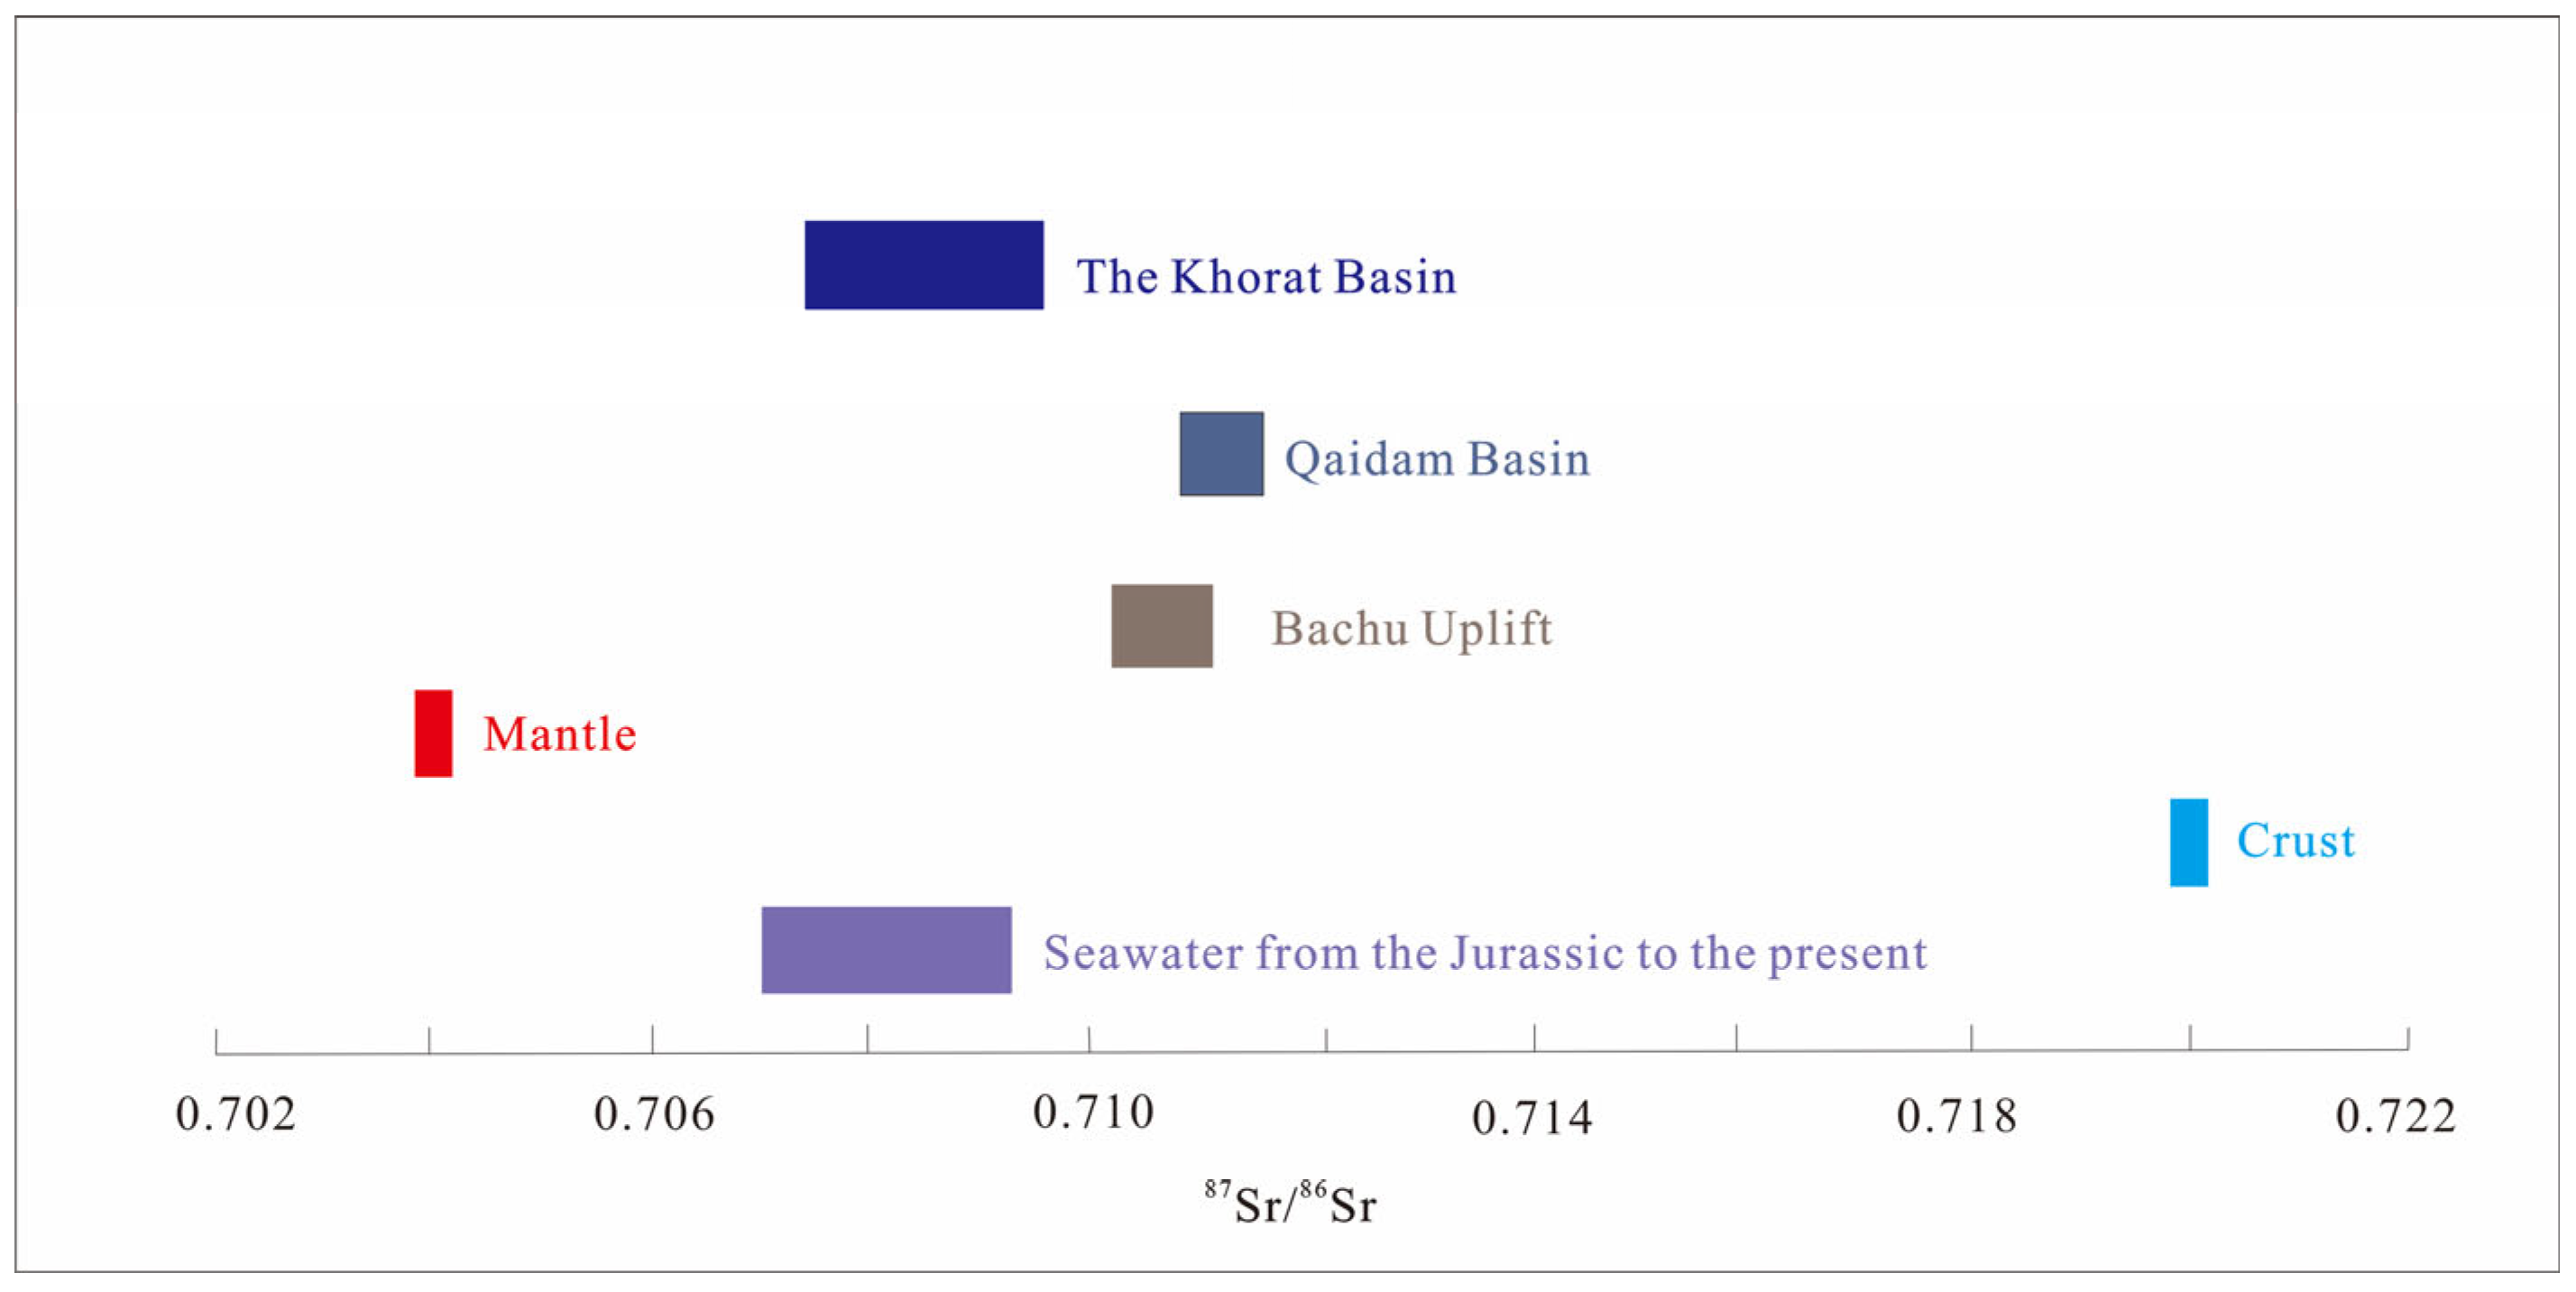
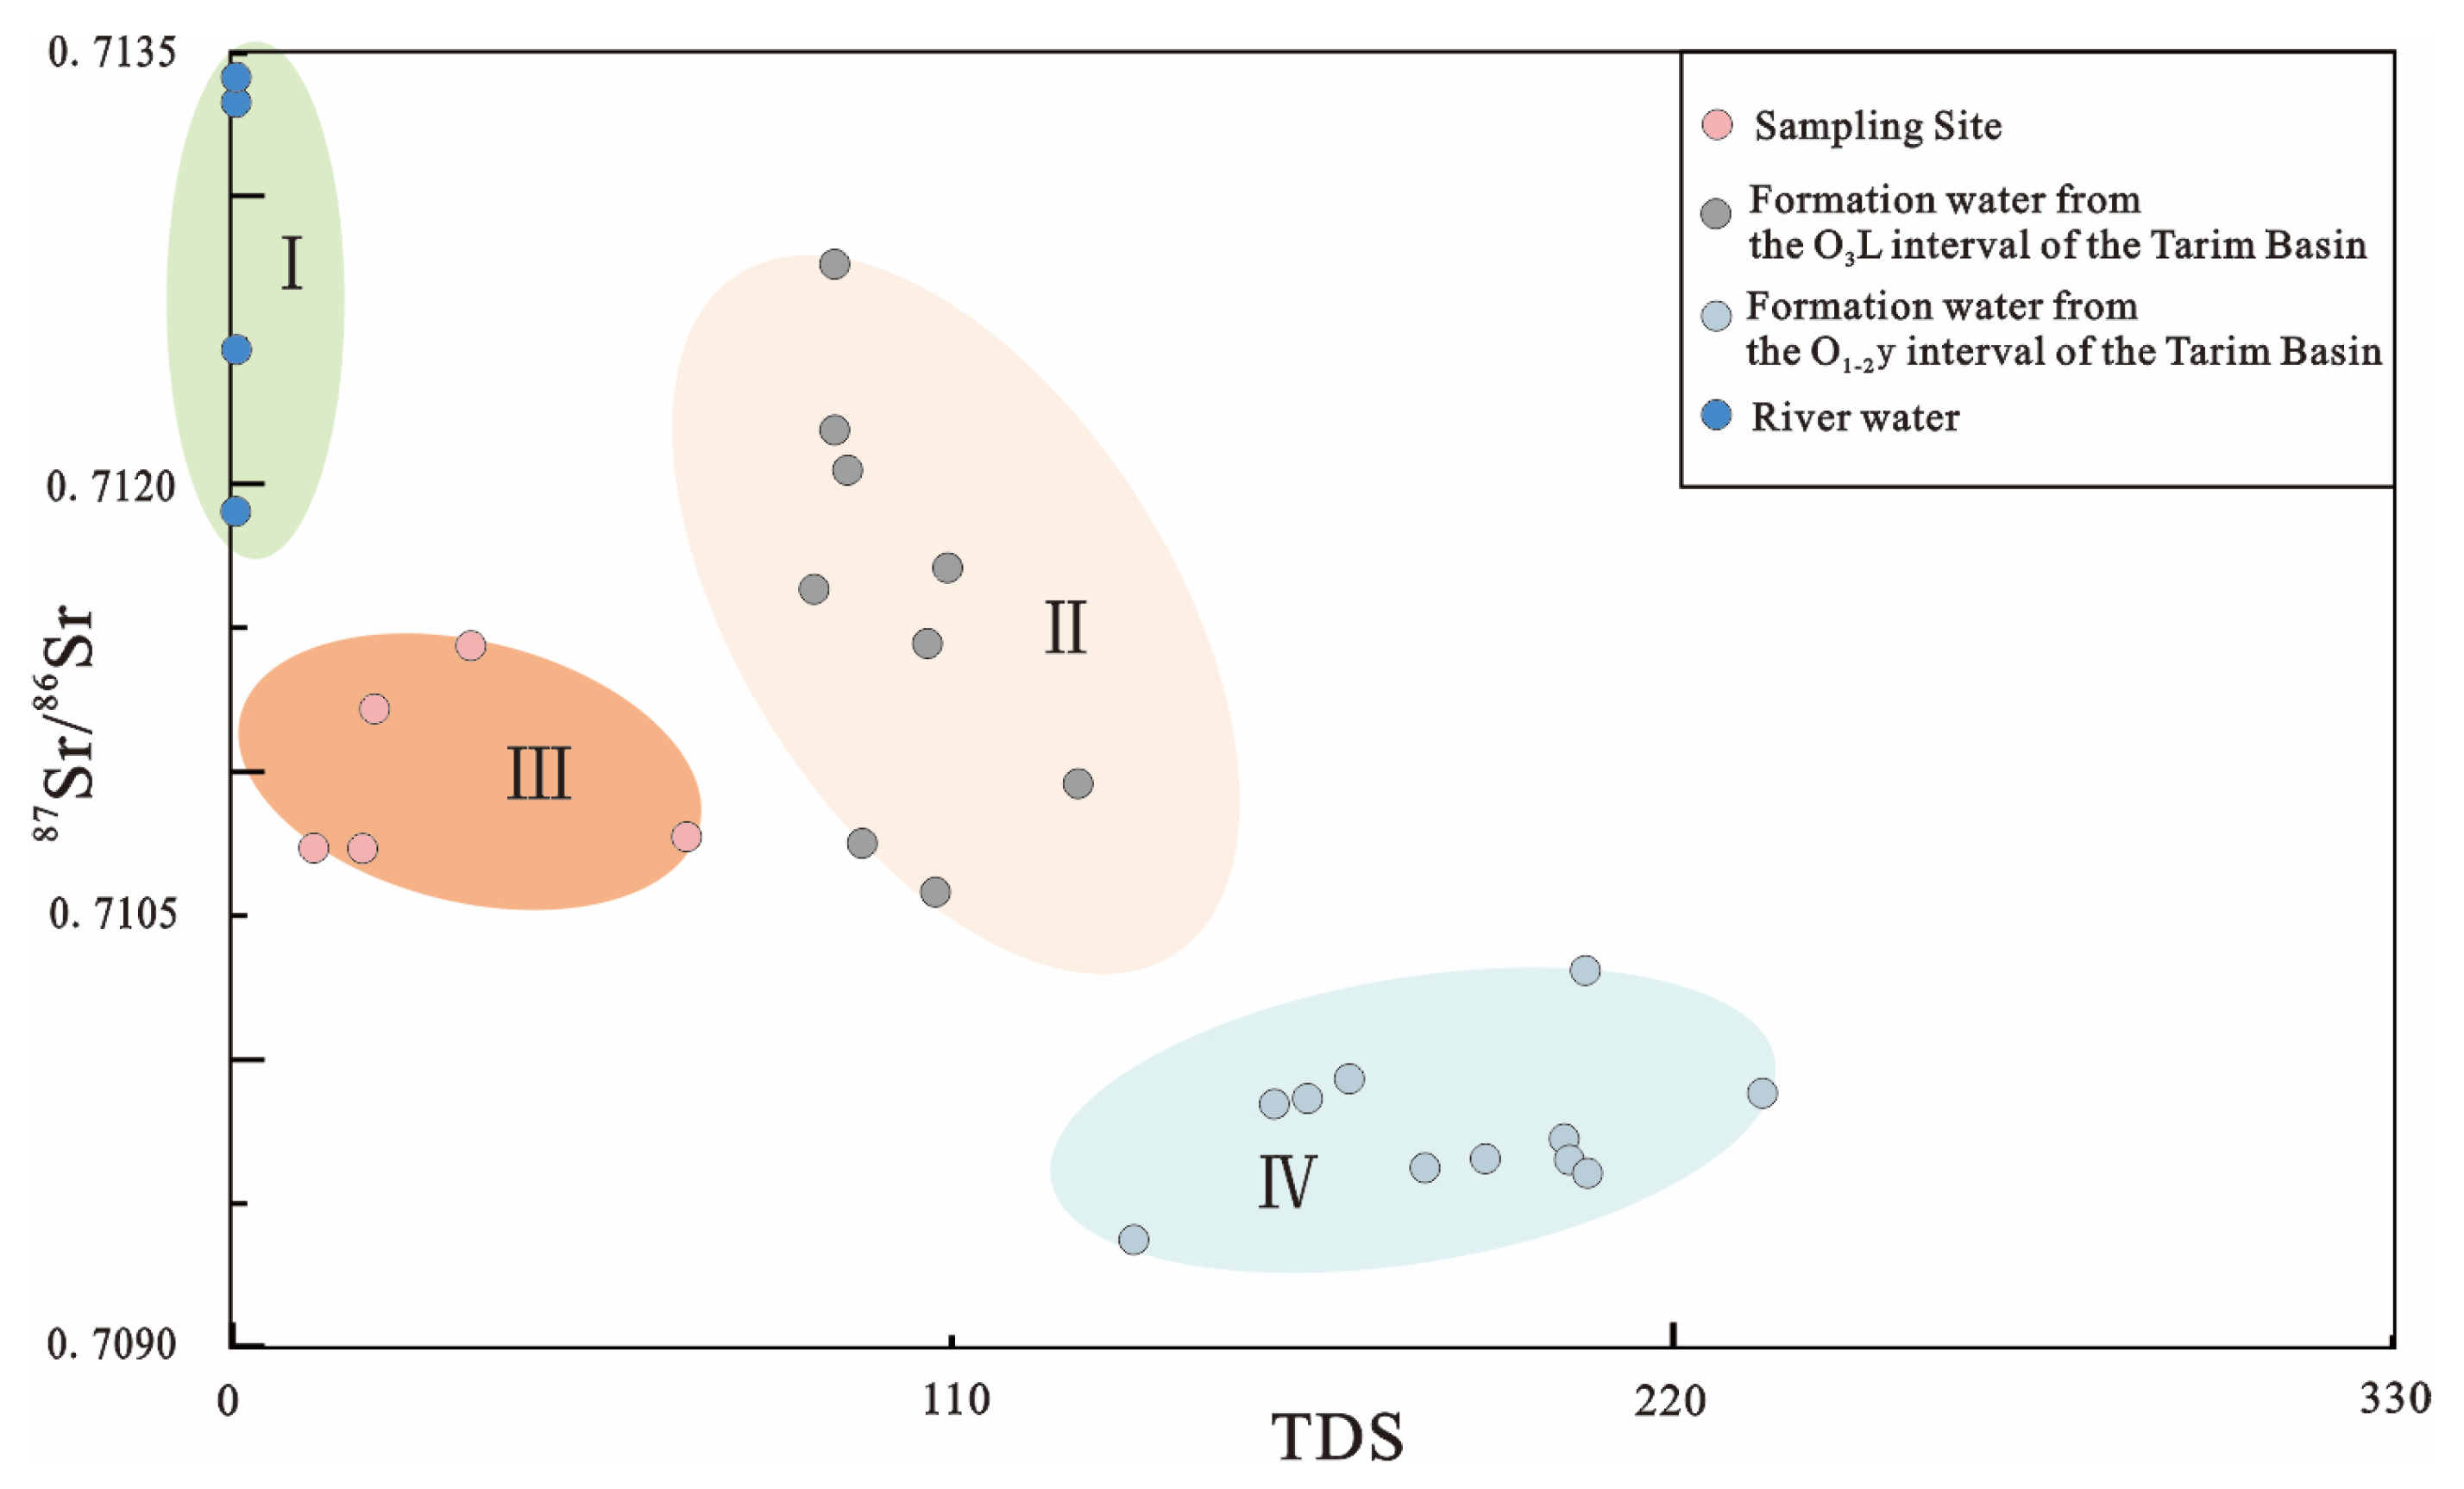
By comparing the strontium isotopic compositions of the Bachu Uplift samples with those from various sources (Figure 11 and Figure 12), it is generally observed that terrestrial fluids with higher 87Sr/86Sr values are influenced by crustal materials, while seawater with lower 87Sr/86Sr values is influenced by mantle-derived materials. The Paleocene seawater 87Sr/86Sr ratio ranges from 0.70772 to 0.70783; potash salt deposits in the Khorat Basin, Laos, range from 0.707542 to 0.709461; and Paleogene terrestrial salts in the western Qaidam Basin range from 0.711566 to 0.711607. Data show that the 87Sr/86Sr values of the Bachu Uplift brines fall between those of marine and typical terrestrial halite, suggesting that the origin of the brine may be a mixture of marine and terrestrial sources [42].
The strontium isotope data for Ordovician O3l formation water and Ordovician O1-2y formation water in the Tazhong area of the Tarim Basin, Xinjiang, shown in Figure 12, are sourced from Li and Cai (2017) [30].
Region I represents meteoric water sources;
Region II represents a mixture of O3l formation water and meteoric water;
Region III represents the underground brine in the study area;
Region IV represents a mixture of O1-2y formation water and hydrothermal fluids.
In the natural environment, sulfur isotope fractionation is influenced by a variety of factors, including bacterial sulfate reduction, thermochemical reduction, evaporative concentration and mineral precipitation, as well as whether the system is open or closed [43,44,45]. The sulfur isotopic composition of different geological bodies and sulfur sources varies greatly (from −65‰ to +120‰), with a total range of up to 180‰. Therefore, sulfur isotopes are sensitive tracers for material sources and geochemical processes.
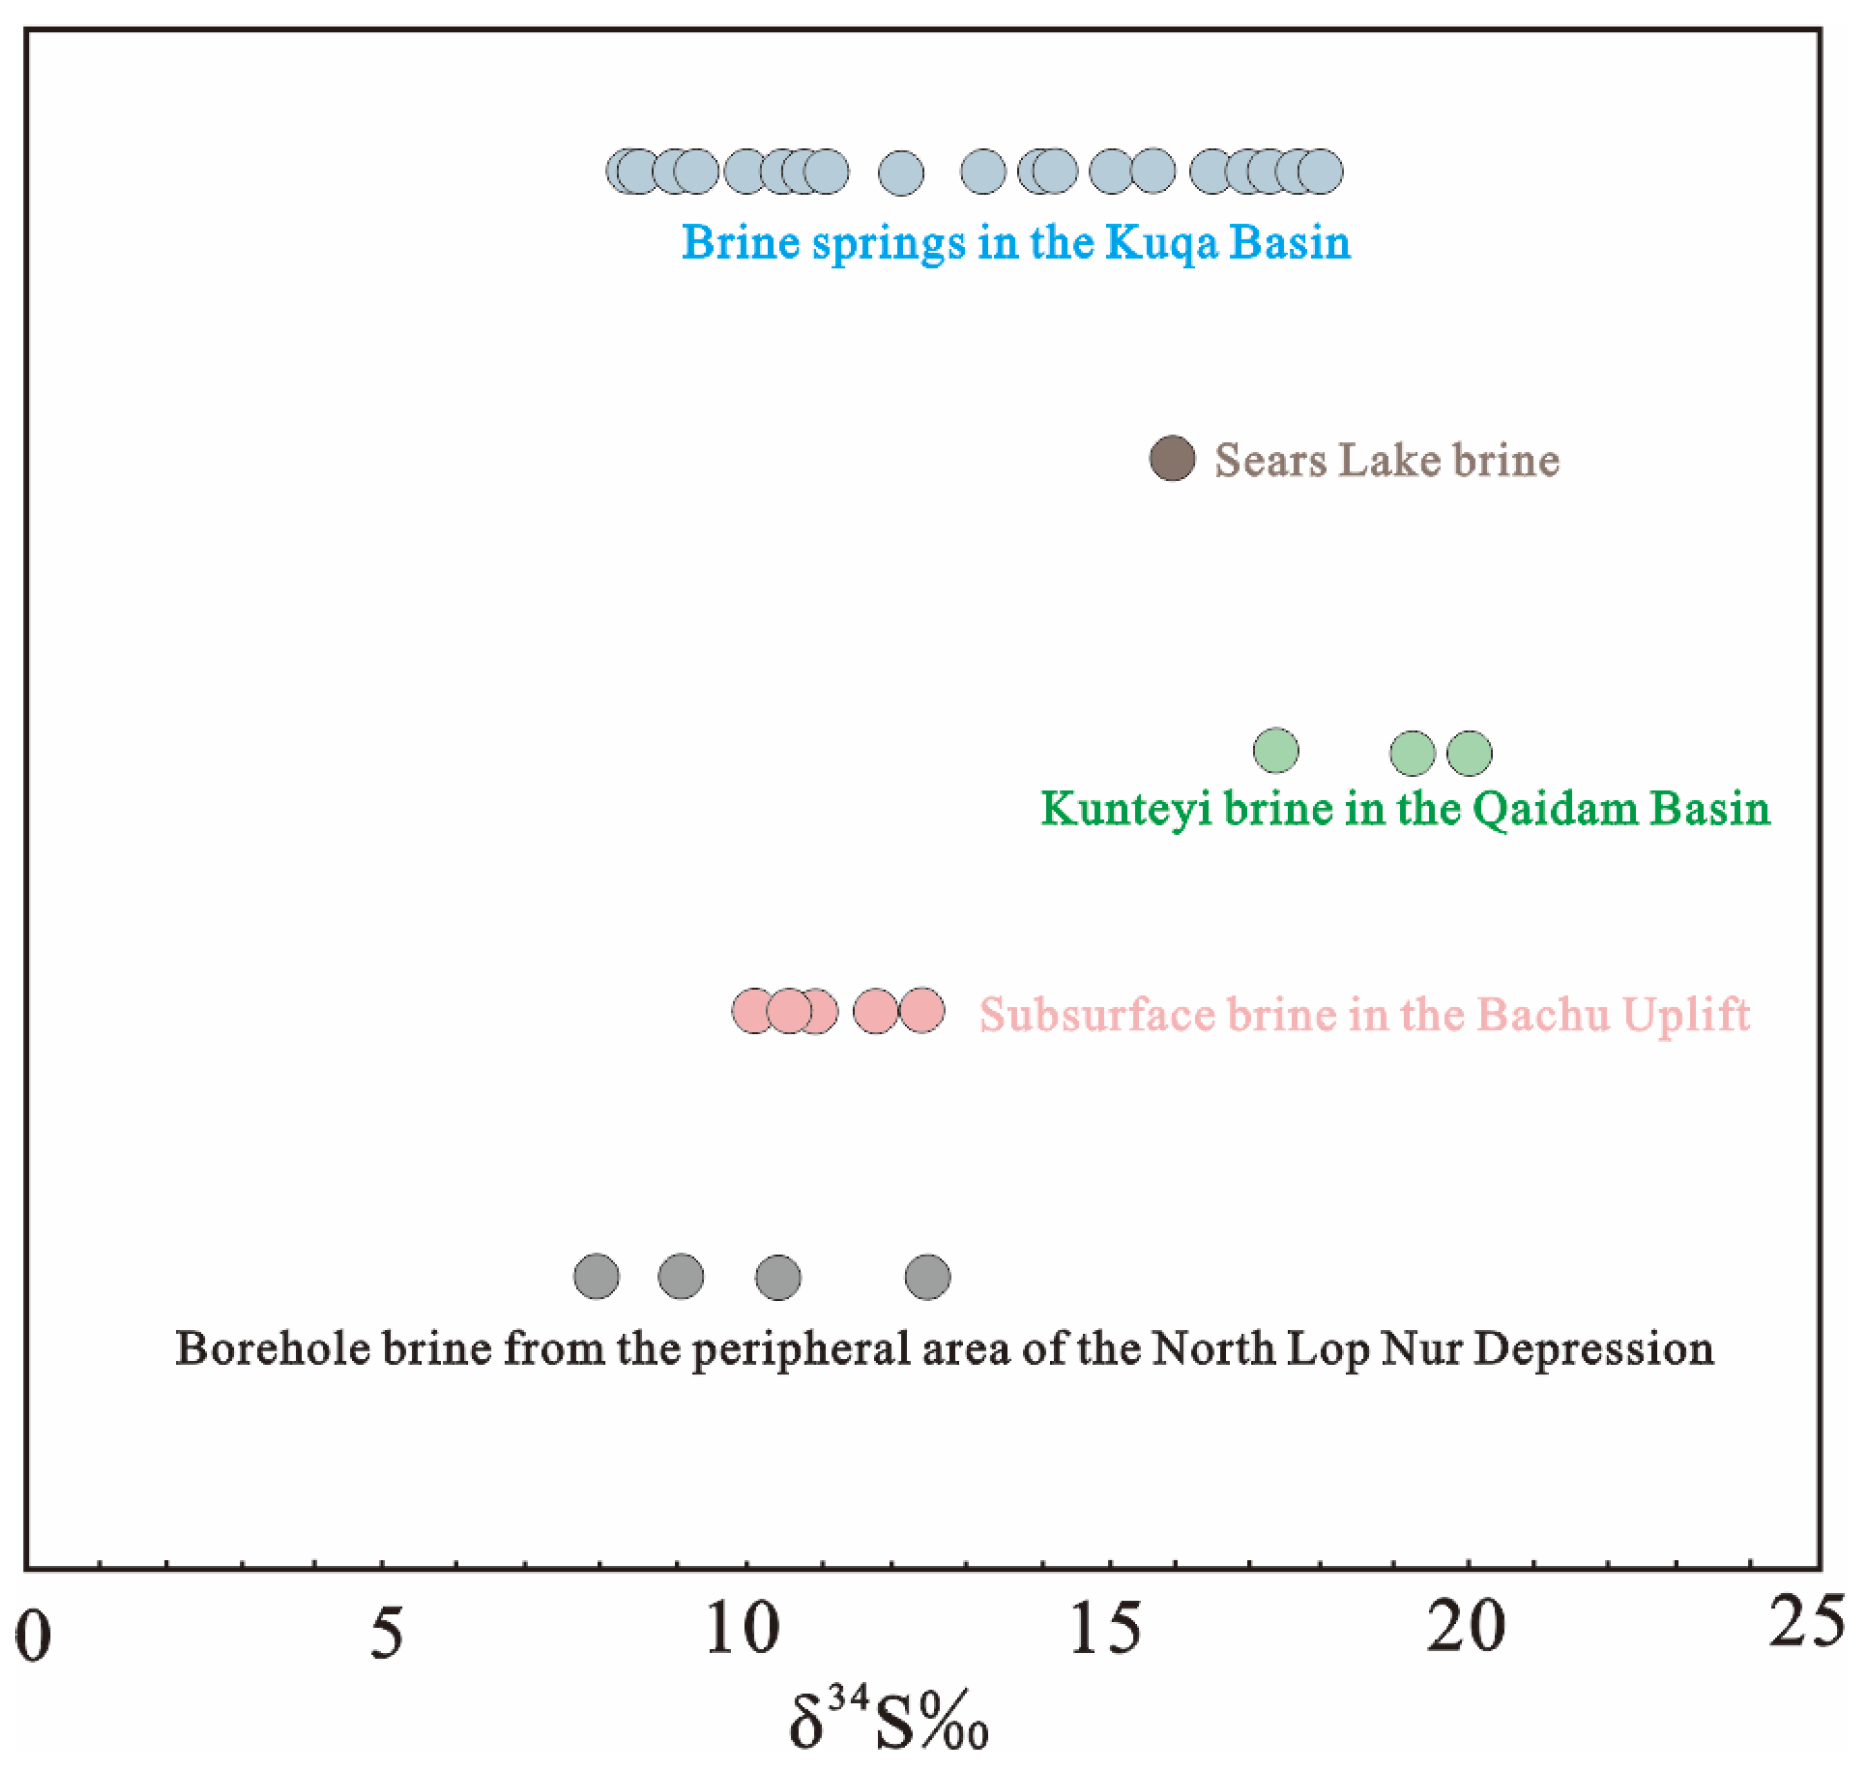
When the sulfur isotope ratios of underground brine in the Bachu Uplift are plotted on Figure 13, it can be seen that the values range from 10.5‰ to 12.6‰. This, combined with the consistency between the sulfur isotopic composition of solid sulfate minerals and that of the brine, indicates that they likely share a common sulfur source or have undergone similar geochemical processes [46,47]. It is generally believed that the main factors influencing sulfur isotope variations are material sources and bacterial reduction. However, no sulfide deposits have been found in the Quaternary sediments of the Bachu Uplift. Therefore, the variation in sulfur isotopes in the study area is considered to be affected only by the source of the material. Previous studies have reported that the δ34S values of Carboniferous marine gypsum in the Xiaohaizi area of Bachu range from 17.3‰ to 19.9‰, with an average of 19.1‰. In the E2+3 strata of the Kuqa Basin, Tarim Basin, the δ34S values decrease upward from 13.5‰ to 7.7‰ [48]. It can be seen that the δ34S values of Carboniferous marine gypsum are significantly higher than those of the Bachu Uplift brine, while the δ34S values of the Tertiary strata are similar to those in the study area. Since Tertiary gypsum layers are widely distributed in the central and western parts of the Tarim Basin, and previous studies have shown that the dissolution of sulfate by surface water does not significantly affect sulfur isotope composition, it is likely that the sulfur in the Bachu Uplift brine mainly originates from the Tertiary gypsum layers [49]. Therefore, it is inferred that the sulfate in the underground brine of the Bachu Uplift mainly originates from the weathering products of Cenozoic and Mesozoic gypsum in the western Tarim Basin.

4.3. Genetic Model

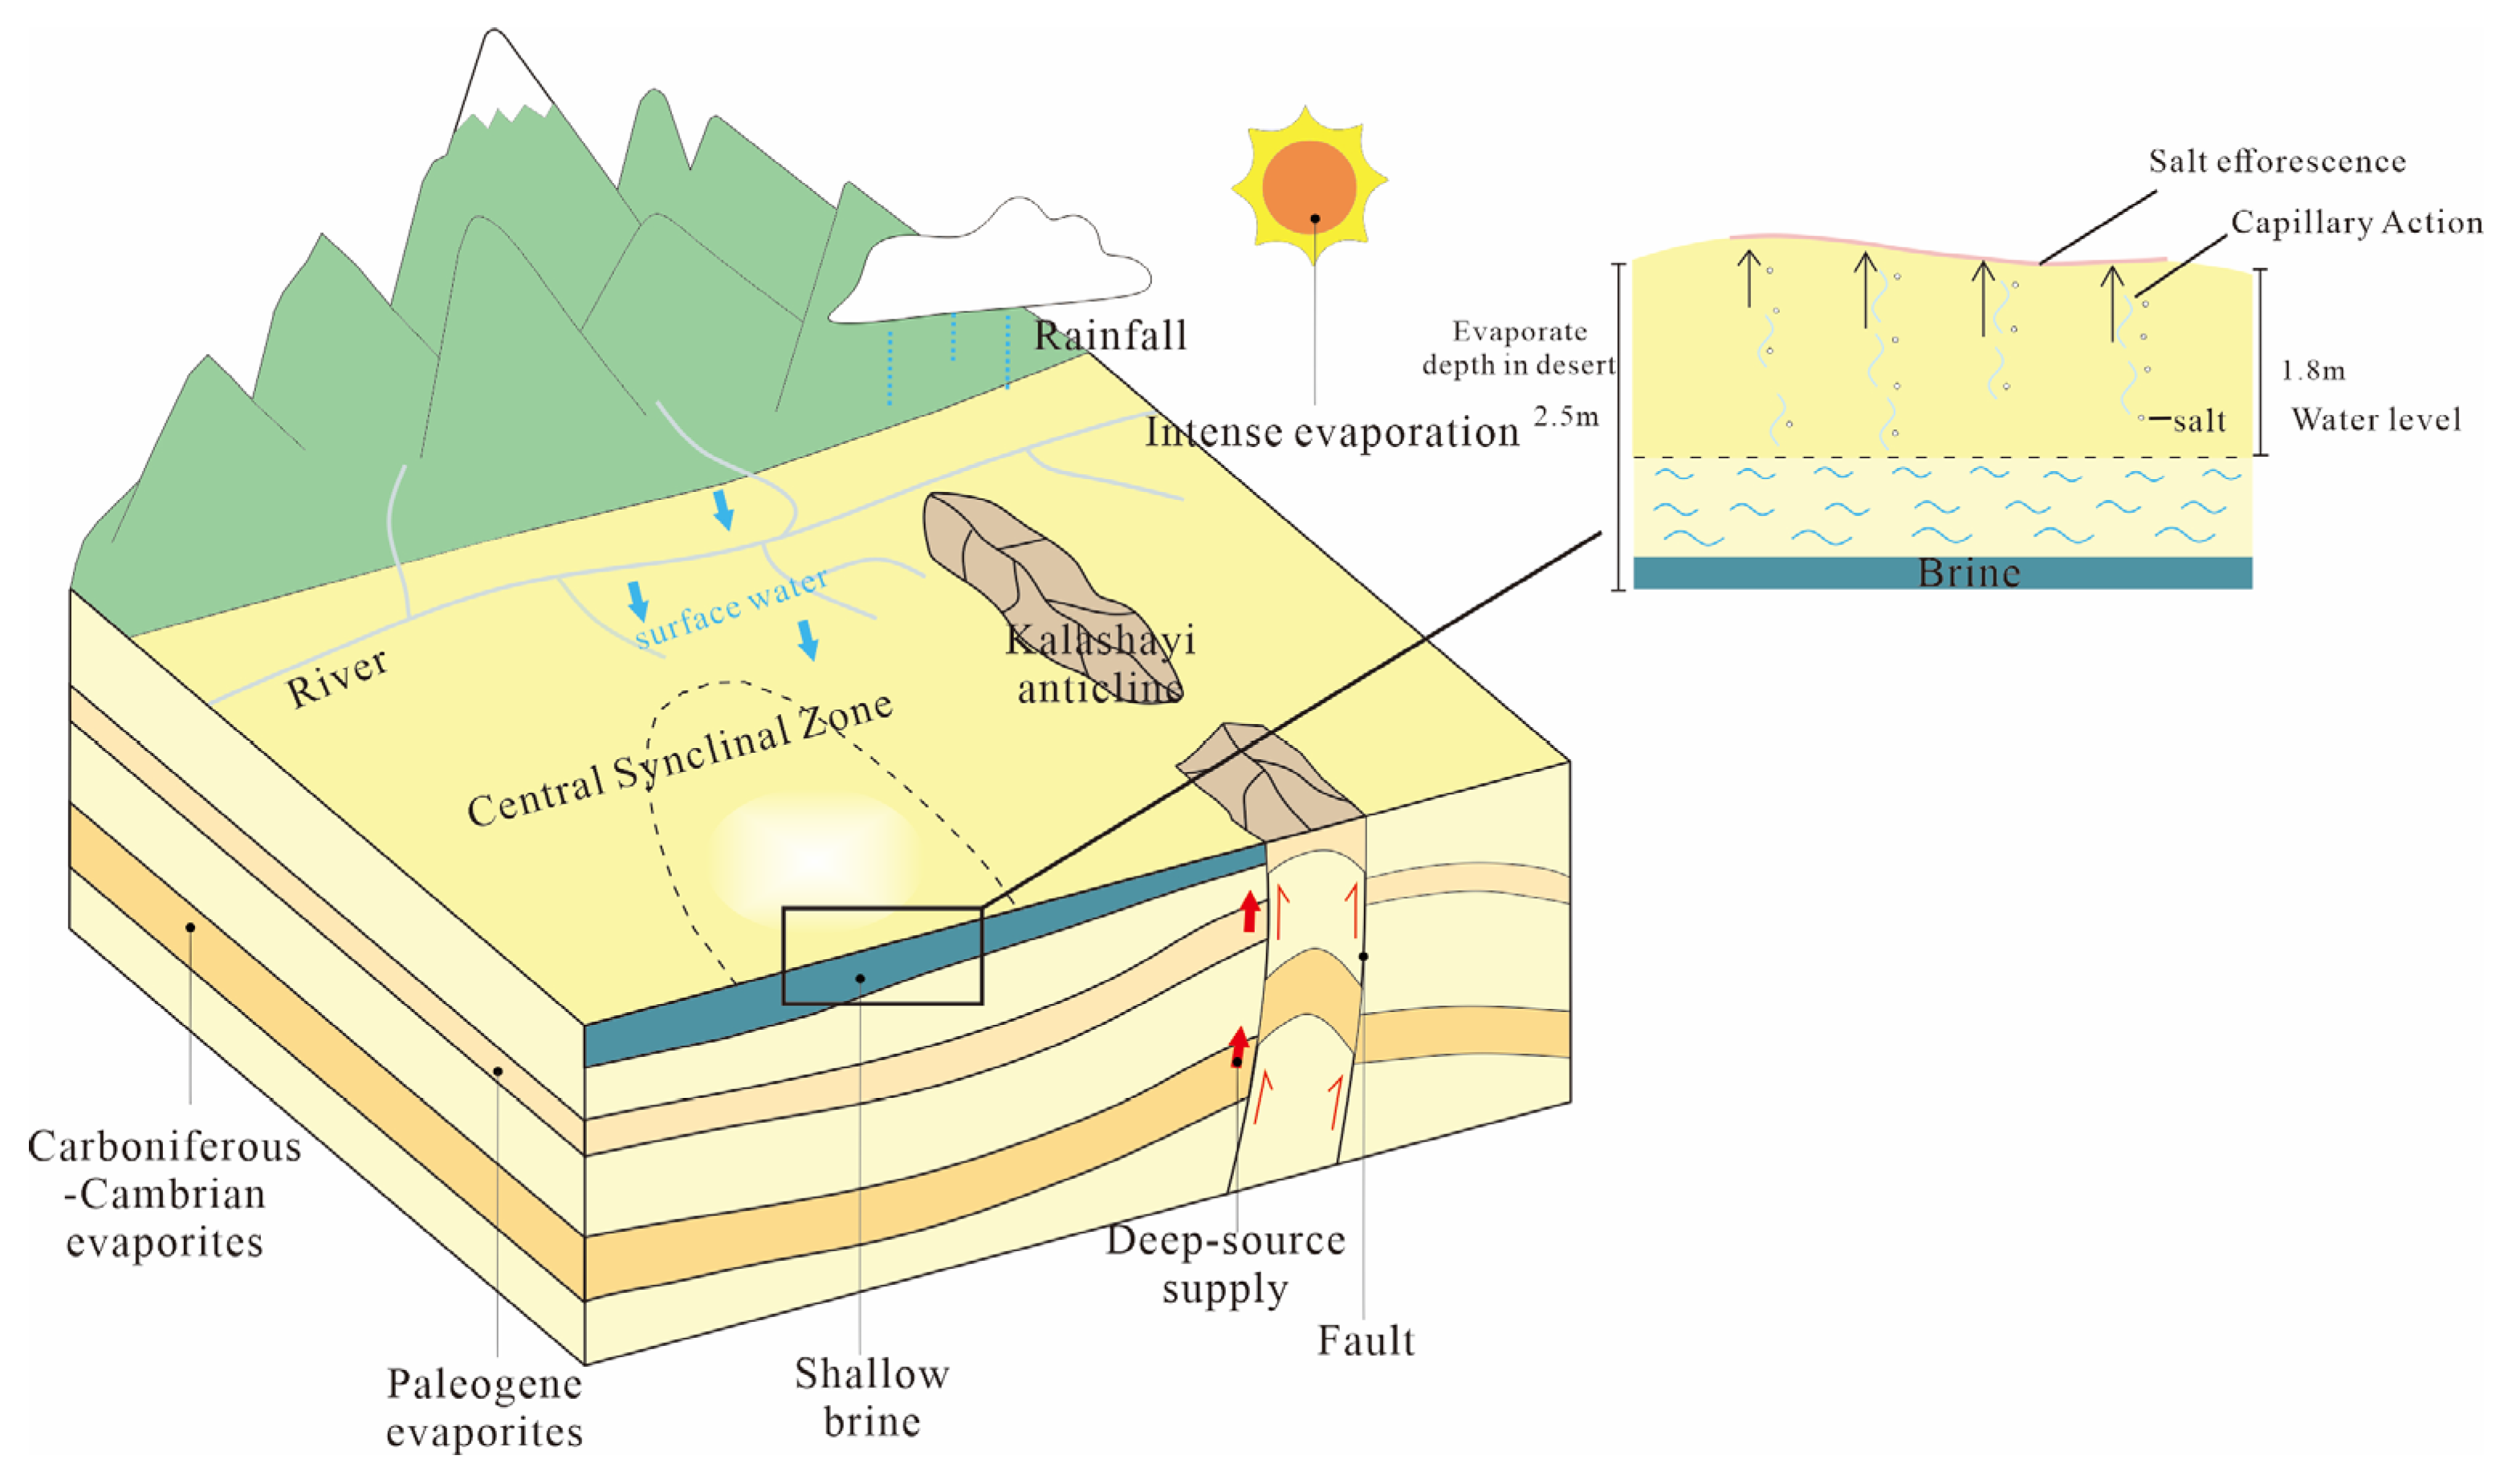
As part of the central uplift zone within the Tarim Basin, the Bachu Uplift is located in the stable interior of the craton. Its main structural framework was largely established by the Permian period. The northern Kalashayi fault zone, characterized by imbricated thrust faults, and the southern Gudongshan fault zone, characterized by thrust faults, were both developed during the Middle to Late Ordovician. The research area thus exhibits a distinctive “two uplifts enclosing one depression” structural pattern due to the confinement of these two thrust fault zones, which provides favorable conditions for potash salt accumulation in the Bachu depression. Additionally, the absence of major deep faults within the depression ensures the preservation of salt resources.
During the multiple transgression–regression events of the Paratethys, the Bachu Uplift preserved a large amount of salt resources. Combined with the continuous supply of deep-sourced potassium through fault zones, and under the arid and hot climate conditions that began in the Holocene in the Tarim Basin, these salts underwent intensive evaporation and concentration to form potash-bearing evaporites. The underground brine in the study area has leached these potash-bearing evaporites and received deep-sourced potassium anomalies brought up by the fault zones, resulting in high salinity and significant potassium enrichment in the brine, even though atmospheric precipitation remains the primary recharge source (Figure 14).

5. Conclusions

(1)
The deep-penetrating geochemical method applied to fault zones is highly effective for identifying signals derived from deep-seated potash mineralization, with deep-sourced chloride water indicating that faults have brought up deep material sources. Both survey lines show that potassium and other salt components are markedly higher near the eastern side of the Bachu depression, suggesting the presence of deep potassium-rich brine ascending along major faults. This provides direct guidance for the placement of potash exploration wells.
(2)
The high correlation between K+ and Cl concentrations and salinity, as well as the cNa/cCl and Br × 103/C1 ratios, are typical of halite-dissolution type brine. Combined with the Na+, K+, Mg2+//Cl–H2O Quaternary metastable phase diagram, all samples plot in the halite phase field, indicating dissolution of potash-bearing halite layers. In the Na+, K+, Mg2+//Cl, SO42−–H2O Quinary phase diagram, samples are mainly in the thenardite phase field, with some transitioning towards picromerite and schoenite fields, suggesting that the underground brine is in the early to middle stages of potash salt deposition. This also indicates the presence of concealed potash deposits at depth within the study area.
(3)
The positive shift in oxygen isotopes further indicates evident water–rock interaction in the underground brine, supporting the conclusion of deep potash-bearing halite dissolution. Strontium isotopes reveal a mixture of marine and terrestrial characteristics in the brine, and comparison with Ordovician O3l and O1-2y formation waters suggests mixing of formation water migrated by faults with surface water. Sulfur isotopes also point to a source derived from weathering of Cenozoic and Mesozoic gypsum.

Author Contributions

Conceptualization, methodology, data analysis, data collection, and writing—original draft preparation, W.H. and X.Z.; conceptualization, Y.Z. and C.L.; software, J.L. and H.L.; formal analysis, F.Y.; investigation, S.Z. All authors have read and agreed to the published version of the manuscript.

Funding

This research was funded by the Key Science and Technology Project of the Xinjiang Uyghur Autonomous Region (2022A03009) and the Tianchi Talent Plan of the Xinjiang Uygur Autonomous Region.

Data Availability Statement

The original contributions presented in this study are included in the article. Further inquiries can be directed to the corresponding author.

Acknowledgments

Throughout the research process, we received support and assistance from many leaders and colleagues. We would also like to express our gratitude to the anonymous reviewers for their valuable suggestions for improving the article.

Conflicts of Interest

The authors declare no conflicts of interest.

References

  1. Luo, T.; Zhang, Y.Q.; Zheng, M.G.; Dong, J. Security assessment and early warning of potash resources in China. Adv. Earth Sci. 2022, 37, 575–587. [Google Scholar]
  2. Wang, S.L.; Qi, C.J.; Cui, B.J.; Li, X.; Li, D.X.; Zhang, B.X.; Zhou, Y.; Liu, W.P.; Sun, X.H.; Ding, X.J.; et al. Analysis and prospect of exploration trends of potassium salt resources in China. Acta Geol. Sin. 2024, 98, 2978–2988. [Google Scholar]
  3. Yi, Y.J.; Zhang, X.F.; Zhang, L.Z.; Ma, Y.M.; Tan, X.M. Present situation and suggestions on exploitation and utilization of potassium salt resources in China. Inorg. Chem. Ind. 2024, 56, 12–19. [Google Scholar]
  4. Cao, Y.T.; Liu, C.L.; Jiao, P.C.; Bo, Y.; Zhang, H.; Yao, F.J. Discovery of abnormal value of potassium enrichment and prediction of favorable areas for potassium exploration in the Yarkand basin, Xinjiang. Acta Geol. Sin. 2021, 95, 2099–2108. [Google Scholar]
  5. Liu, C.L.; Wu, C.H.; Wang, L.C.; Fang, X.M.; Zhao, Y.J.; Yan, M.D.; Zhang, Y.S.; Cao, Y.T.; Zhang, H.; Lyu, F.L. Advance in the Study of Forming Condition and Prediction of Potash Deposits of Marine Basins in China’s Small Blocks: Review. Acta Geol. Sin. 2016, 37, 581–606. [Google Scholar]
  6. Liu, C.L.; Jiao, P.C.; Sun, X.H.; Lyu, F.L.; Zhang, H. Research on Potash Forming and Exploration Progress in Potash Deposits in the Lop Nur Salt Lake. Acta Geol. Sin. 2018, 92, 1551–1570. [Google Scholar]
  7. Shan, J.J.; Wang, J.P.; Shan, F.S. Origin and circulation of saline springs in the Kuqa Basin of the Tarim Basin, Northwest China. J. Arid Land 2020, 12, 331–348. [Google Scholar] [CrossRef]
  8. Cao, Y.T.; Liu, C.L.; Yan, H.; Jiao, P.C.; Zhang, H.; Lyu, F.L.; Ding, T. Research on evaporite deposit and its controlling factors for saline lake chain of Tarim Basin and Central Asia Basin during MesozoicCenozoic period. Miner. Depos. 2016, 35, 591–604. [Google Scholar]
  9. Bazhenov, M.L.; Abrajevitch, A.V.; McCausland, P.J.A.; Degtyarev, K.E.; Van der Voo, R.; Levashova, N.M. Unraveling the early-middle Paleozoic paleogeography of Kazakhstan on the basis of Ordovician and Devonian paleomagnetic results. Gondwana Res. 2012, 22, 974–991. [Google Scholar] [CrossRef]
  10. Zhu, R.X.; Zhao, P.; Zhao, L. Tectonic evolution and geodynamics of the Neo-Tethys Ocean. Sci. China Earth Sci. 2022, 65, 1–25. [Google Scholar] [CrossRef]
  11. Vakhrameev, V.A. Jurassic and Cretaceous Floras and Climates of the Earth; Cambridge University Press: Cambridge, UK, 2010. [Google Scholar]
  12. He, Z.L.; Yang, X.; Gao, J.; Yun, L.; Cao, Z.C.; Li, H.L.; Yang, J.Q. Hydrocarbon enrichment effects in the non-foreland area of the Tarim Basin under the coevolution control of the Tethys and Paleo-Asian oceans. J. Oil Gas Geol. 2024, 45, 637–657. [Google Scholar]
  13. Yang, X.; Xu, X.H.; Deng, S.; Zhai, C.B.; Kong, Q.F.; Wang, S. Proto-Tethys Tectonic Evolution from Ordovician to Devonian in Southwestern Margin of Tarim Block, NW China. J. Earth Sci. 2020, 45, 4153–4175. [Google Scholar]
  14. Yu, X.; Xu, X.C.; Han, X.Q.; Ding, W.W.; Hu, H.; He, H.; Yu, Y.N. The proposition of Holo-Tethys Ocean and the generalized Tethyan tectonic domain. Acta Geol. Sin. 2022, 96, 4131–4139. [Google Scholar]
  15. He, G.Q.; Lu, S.N.; Li, M.S. Tectonic significance of large fault systems to the study of Paleo-Plates. Geol. J. Univ. 1995, 1, 1–10. [Google Scholar]
  16. Wang, B.W.; Aini, M.M.T.; Lu, Z.M.; Ma, C.Y.; Cheng, K.G. Logging response characteristics and distribution of potash salt in Aryskum Depression, South Turgay Basin. Earth Sci. Front. 2021, 28, 162–170. [Google Scholar]
  17. Yin, H.J.; Zhang, H.; Liu, C.L.; Yan, H.; Jiao, P.C.; Ma, B.C.; Yuan, M.; Zhao, L.L. Sedimentary characteristics, distribution and genetic mechanism of solid potash deposits in salt lake of Lop Nur. Miner. Depos. 2024, 43, 60–70. [Google Scholar]
  18. Yan, F.; Ye, Y.; Mai, X. The sporo-pollenassemblage in the Luo 4 drilling of Lop lake in Uygur autonomous region of Xinjiang and its significance. Seismol. Geol. 1983, 5, 75–80. [Google Scholar]
  19. Bo, Y.; Liu, C.L.; Cao, Y.T. Fault belt geochemical deep_penetration theories and techniques for potassium prospecting. Miner. Depos. 2016, 35, 1281–1292. [Google Scholar]
  20. Yang, Y.; Tang, L.J.; Yue, S.; Huang, T.; Yun, L.; Xie, D. Structural characteristics and active ages of the Gudongshan fault belt in Bachu uplift, Tarim Basin. J. Oil Gas Geol. 2014, 1, 116–123. [Google Scholar]
  21. Wang, Y.Y.; Ding, W.L. Analyses on the Fault System of Bachu Uplift in Tarim Basin. West-China Explor. Eng. 2015, 27, 94–97. [Google Scholar]
  22. Ding, W.L.; Lin, C.S.; Qi, L.X.; Huang, T.Z.; Yu, T.X. Structural framework and evolution of Bachu uplift in Tarim basin. Earth Sci. Front. 2008, 2, 242–252. [Google Scholar]
  23. Shi, J.; Li, R.J.; Sang, H.; Zeng, C.M.; Wen, L.; Zhang, Q.; Feng, X.J.; Jiang, H.; Lian, H.; Jia, T.G. Structural analyses of the Gudongshan fault belt in the Bachu rise, Tarim Basin. Sci. Geol. Sin. 2014, 49, 935–946. [Google Scholar]
  24. Shan, J.J.; Wang, M.X.; Li, J.S.; Shan, S.F.; Fang, Q.S.; Wei, H.C.; Qin, Z.J.; Yuan, Q.; Zhang, X.R. Hydrochemical characteristics of potassium-rich saline spring and itsimplications for sylvine deposits in the Kuqa basin, Xinjiang. Acta Geol. Sin. 2019, 93, 1180–1188. [Google Scholar]
  25. Tan, H.B.; Kong, N.; Zhang, W.J.; Su, Z.G. Scientific significance of study of hydrogen and oxygen isotopes in hydration water of salt minerals and determination methods. J. Hohai Univ. (Nat. Sci.) 2013, 41, 307–314. [Google Scholar]
  26. Li, J.Y.; Zhou, Y.; Liu, C.L.; Zhang, S.Y.; Yao, F.J.; Yang, G.L.; Hou, W.B. Geochemical Exploration Techniques with Deep Penetration: Implications for the Exploration of Concealed Potash Deposits in the Covered Area on the Southern Margin of the Kuqa Basin. Water 2025, 17, 298. [Google Scholar] [CrossRef]
  27. Bo, Y.; Liu, C.L.; Jiao, P.C.; Chen, Y.Z.; Cao, Y.T. Hydrochemical characteristics and controlling factors for waters’ chemical composition in the Tarim Basin, Western China. Chem. Der Erde-Geochem. 2013, 73, 343–356. [Google Scholar] [CrossRef]
  28. Bo, Y.; Liu, C.L.; Jiao, P.C.; Chen, Y.Z.; Cao, Y.T. Saline Spring Hydrochemical Characteristics and Indicators for Potassium Exploration in Southwestern and Northern Tarim Basin, Xinjiang. Acta Geosci. Sin. 2013, 34, 594–602. [Google Scholar]
  29. Tan, H.B.; Ma, H.Z.; Ma, W.D.; Don, Y.P.; Zhang, X.Y.; Xu, J.X. Research on Geological and Geochemical Characteristics of Paleo-Salt Rock and its Potash ore Formation in Western Tarim Basin. Bull. Mineral. Petrol. Geochem. 2004, 23, 194–199. [Google Scholar]
  30. Li, H.X.; Cai, C.F. Origin and evolution of formation water from the Ordovician carbonate reservoir in the Tazhong area, Tarim Basin, NW China. J. Pet. Sci. Eng. 2017, 148, 103–114. [Google Scholar] [CrossRef]
  31. Lin, Y.T.; He, J.Q.; Ye, M.C. Distribution Types and Quality of Brine Potash Resources in Sichuan Basin. Geol. Chem. Miner. 2002, 24, 215–221. [Google Scholar]
  32. Qin, X.W.; Ma, H.Z.; Zhang, X.Y.; Fang, Q.S.; Cheng, H.D.; Li, Y.S.; Miao, W.L.; Hai, Q.Y.; Shi, H.Y. Hydrochemical Characteristics of Salt Spring and Potassium-prospecting in Changdu Basin. J. Salt Lake Res. 2017, 25, 28–39. [Google Scholar]
  33. Gong, X.M.; Wang, L.; Wang, B.J.; Cao, J.L.; Yang, J.Y. Phase equilibria of the Na+, Mg2+//Cl, SO42−-H2O system. J. Chem. Eng. Chin. Univ. 2022, 36, 481–487. [Google Scholar]
  34. Feng, S. Metastable Phase Equilibria for Quinary System Contained with Lithium and Isothermal Evaporation of the Zabuye Old Brine. Ph.D. Thesis, Chengdu University of Technology, Chengdu, China, 2015. [Google Scholar]
  35. Su, Y.G.; Li, J.; Jiang, C.F. Study on the Metastable Phase Equilibrium of the Quinary System K+, Na+, Mg2+ // Cl, SO42−–H2O at 15 °C. J. Chem. Ind. Eng. 1992, 43, 549–555. [Google Scholar]
  36. Anderson, L.; Finney, B.P.; Shapley, M.D. Lake carbonate-delta 18O records from the Yukon Territory, Canada: Little Ice Age moisture variability and patterns. Quat. Sci. Rev. 2011, 30, 887–898. [Google Scholar] [CrossRef]
  37. Xiao, Y.; Shan, J.L.; Frape, S.K.; Cui, Y.L.; Dang, X.Y.; Wang, S.B.; Ji, Y.H. Groundwater origin, flow regime and geochemical evolution in arid endorheic watersheds: A case study from the Qaidam Basin, northwestern China. Hydrol. Earth Syst. Sci. 2018, 22, 4381–4400. [Google Scholar] [CrossRef]
  38. Zheng, Y.F.; Chen, J.F. Stable Isotope Geochemistry; Science Press: Beijing, China, 2000. [Google Scholar]
  39. Zuo, H.; Li, B.; Wang, Y.C. Characteristics of Streamflow Components in the Tarim River Basin Based on Hydrogen and Oxygen Isotopes. Acta Sci. Nat. Univ. Pekin. 2025, 61, 358–368. [Google Scholar]
  40. Fan, Q.S.; Ma, H.Z.; Tan, H.B.; Xu, J.X.; Li, T.W. Sr isotope and major ion compositional evidence for formation of Qarhan Salt Lake, western China. Chem. Geol. 2018, 497, 128–145. [Google Scholar] [CrossRef]
  41. Rao, W.B.; Jin, K.; Jiang, S.Y.; Tan, H.B.; Han, L.F.; Tang, Q.Y. Chemical and strontium isotopic characteristics of shallow groundwater in the Ordos Desert Plateau, North China: Implications for the dissolved Sr source and water-rock interactions. Chem. Der Erde-Geochem. 2015, 75, 365–374. [Google Scholar] [CrossRef]
  42. Zeng, X.Z.; Xu, Y.; Zhang, H.; Huang, Z.N. The evolution history of the early Eocene transient transgression in the Kuqa Depression:Evidence from strontium isotopes. Acta Mineral. Sin. 2024, 44, 889–897. [Google Scholar]
  43. Thode, H.G.; Monster, J. Sulphur Isotope Geochemistry of Petroleum, Evaporites, and Ancient Seas: ABSTRACT. AAPG Bull. 1963, 47, 2076. [Google Scholar]
  44. Holser, W.T.; Kaplan, I.R. Isotope geochemistry of sedimentary sulfates. Chem. Geol. 1966, 1, 93–135. [Google Scholar] [CrossRef]
  45. Raab, M.; Spiro, B. Sulfur isotopic variations during seawater evaporation with fractional crystallization. Chem. Geol. Isot. Geosci. Sect. 1991, 86, 323–333. [Google Scholar] [CrossRef]
  46. Yan, J.Z.; Nan, W.C.; Li, J.S.; Li, R.Q.; Liu, C.L.; Jiao, P.C.; Hu, Y.F.; Zhao, X.F. Contribution of deep material sources to shallow potash formation of the Quaternary Mahai Salt Lake in the Qaidam Basin: Evidence from isotopes and trace elements. Ore Geol. Rev. 2024, 171, 106–166. [Google Scholar] [CrossRef]
  47. Xu, Q.H.; Miao, Z.Y.; Lou, P.C.; Zheng, M.P.; Chen, W.X. Sulfur isotope characteristics of evaporite and its metallogenic significance of potassium salts from Middle Jurassic Xiali Formation in North Qiangtang depression. Miner. Depos. 2023, 42, 366–380. [Google Scholar]
  48. Liu, Q.; Li, Y.C.; Yan, D.L. Clastic-Chemical Type Salt Deposits of the Mesozoic and Cenozoic in China; Beijing Science and Technology Press: Beijing, China, 1987. [Google Scholar]
  49. Miao, Z.Y.; Zheng, M.P.; Zhang, X.F.; Zhang, Z.; Gao, Y.Z. Geochemistry of sulfur isotope in evaporite and its sedimentology significance: A case study from the well MZK-3 in the Simao basin, southwestern China. Acta Geol. Sin. 2019, 93, 1166–1179. [Google Scholar]
Figure 1. Distribution of evaporite basins. Adapted from Bazhenov et al. (2012) [9].
Water 18 01284 g001
Figure 2. Structural distribution map of the Bachu Uplift. (a) Map of china, (b) Distribution map of secondary structures in the Tarim Basin, (c) Structural distribution map of the Bachu Uplift.
Water 18 01284 g002
Figure 3. Sampling location map of the study area.
Water 18 01284 g003
Figure 4. Sampling tools (a) and field sampling operation (b,c).
Water 18 01284 g004
Figure 5. Variations in K/Cl, Mg/Cl, and Ca/Mg ratios in underground brine.
Water 18 01284 g005
Figure 6. Relationships between K (A),Ca (B), Na (C), Mg (D), Cl (E), HCO3 (F), Br (G), SO4 (H) and TDS in underground brine from the Bachu Uplift. Except for Br, which is expressed in mg/L, all other ions are expressed in g/L.
Water 18 01284 g006
Figure 7. Comparison of the hydrochemical characteristics of underground brine with the evaporation concentration curves of Qinghai Lake and Yellow Sea water.
Water 18 01284 g007
Figure 8. (a) Metastable phase diagram of the Na+,K+,Mg2+//C1-H2O Quaternary system at 25 °C for underground brine in the Bachu Uplift. (b) Metastable phase diagram of the Na+,K+,Mg2+//C1,SO42−-H2O Quinary system at 25 °C.
Water 18 01284 g008
Figure 9. Hydrochemical Gibbs diagram of underground brine.
Water 18 01284 g009
Figure 10. Plot of hydrogen and oxygen isotope data for underground brine and other regions in the Bachu Uplift.
Water 18 01284 g010
Figure 11. Comparison of strontium isotopes in underground brine with mantle, crust, seawater, Khorat Basin, and Qaidam Basin strontium isotopes.
Water 18 01284 g011
Figure 12. Comparison of 87Sr/86Sr and TDS in underground brine and river water from the Bachu Uplift.
Water 18 01284 g012
Figure 13. Comparison of sulfur isotopes in underground brine from the Bachu Uplift.
Water 18 01284 g013
Figure 14. Genetic model of potash salt formation in the Bachu Uplift.
Water 18 01284 g014
Table 1. Chemical composition of underground brine along Profile 1 in the Bachu Uplift (unit: g/L).
Sample IDBr (mg/L)Ca2+ClCO32− (mg/L)HCO3K+Mg2+Na+SO42−TDS
10.540.7344.882.310.170.650.8735.365.888.46
20.940.9235.122.310.150.581.1926.764.8569.56
30.530.957.0300.170.110.495.483.3617.59
40.340.84.62.310.180.070.323.832.8912.69
Table 2. Chemical composition of underground brine along Profile 2 in the Bachu Uplift (unit: g/L).
Sample IDBr (mg/L)Ca2+ClCO32− (mg/L)HCO3K+Mg2+Na+SO42−TDS
10.3574817.44.620.160.230.8113.763.5536.67
20.320.6915.334.620.150.220.712.633.4433.16
30.230.6719.200.190.290.7815.53.2639.88
40.260.4611.634.620.160.180.519.892.6125.43
50.260.4810.6200.170.160.468.692.4723.06
60.310.5510.3600.210.150.458.652.5122.87
70.260.7111.8600.150.180.59.162.6225.18
80.390.8115.032.310.160.230.6211.982.8931.72
90.380.98.3500.140.150.536.523.4220
100.390.969.7600.130.130.617.623.4122.62
110.340.858.552.310.150.130.536.793.1520.14
Table 3. Hydrogen, oxygen, sulfur, and strontium isotope analysis results of underground brine in the Bachu Uplift.
Sample IDδ2Hδ18Oδ34S87sr/86sr
BC-08−47−6.710.50.711437
BC-13−53−7.4110.711213
BC-18−51−7.411.30.710733
BC-20−43−4.711.90.710774
BC-22−54−8.512.60.710735
Table 4. Shukarev hydrochemical classification calculation table.
Sample IDTotal Cations meq/LNa + K%Cations TypeTotal AnionsCl (%)Anions TypeShukarev No.TDS g/LGroupFinal Type
BC-08708.7985.29Na567.6886.48Cl4936.68C49-C
BC-09647.1885.77Na506.6585.34Cl4933.17C49-C
BC-10779.0687.51Na612.3788.43Cl4939.88C49-C
BC-11499.487.07Na385.0785.17Cl4925.43C49-C
BC-12444.2486.01Na353.8284.66Cl4923.06C49-C
BC-13444.6185.44Na347.8284Cl4922.87C49-C
BC-14479.4684.01Na391.6485.45Cl4925.18C49-C
BC-15618.685.18Na486.7687.08Cl4931.72C49-C
BC-16375.6876.52Na308.9276.23Cl4920C49-C
BC-17432.8777.33Na348.4879.02Cl4922.62C49-C
BC-18384.6777.65Na309.1678.02Cl4920.14C49-C
BC-191662.8593.49Na1389.591.11Cl4988.46D49-D
BC-201322.9389.1Na1093.9190.55Cl4969.56D49-D
BC-21328.673.38Na271.1573.16SO4 + Cl4817.59C48-C
BC-22234.571.8Na193.1267.23SO4 + Cl4812.7C48-C
Disclaimer/Publisher’s Note: The statements, opinions and data contained in all publications are solely those of the individual author(s) and contributor(s) and not of MDPI and/or the editor(s). MDPI and/or the editor(s) disclaim responsibility for any injury to people or property resulting from any ideas, methods, instructions or products referred to in the content.