1. Introduction
Floods (F) and landslides (L) are among the most damaging natural phenomena, with significant impacts on society, property, and the human environment, causing harm to people, economic losses in the agricultural sector, and damage to transport infrastructure [
1,
2,
3,
4]. Climate changes over the past few decades have led to increasing variability in the intensity, frequency, and spatial distribution of extreme weather events, generally causing an increase in the damage caused by such phenomena [
5,
6].
Although extreme rainfall is increasing on a global scale, trends in flood frequency do not show a consistent global signal. Some studies have shown that the number of stations with decreasing flood frequency exceeds those with increasing trends [
7,
8]. This reflects the non-linear relationship between rainfall extremes and flood occurrence, which is also influenced by multiple interacting factors such as catchment characteristics, human interventions, and land use [
5,
9,
10]. Similarly, the occurrence and spatial distribution of rainfall-induced landslides are strongly influenced by local and anthropogenic factors, such as urban expansion into hazard-prone areas, deforestation, and land-use changes, which contribute to amplifying exposure and vulnerability [
11,
12].
The simultaneous occurrence of floods, landslides, and also urban flooding (U), triggered by rainfall, can be defined as damaging hydrogeological events (DHEs), causing significant damage to people, economic activities, and the built environment [
13].
Historical reconstruction of DHEs is influenced by uncertainties in reporting, since documentary sources and historical databases tend to report the most severe events or those involving casualties, while less conspicuous or spatially limited events may remain undocumented [
14,
15,
16]. Documentary and newspaper archives have also been successfully applied in Mediterranean regions for the reconstruction of flood databases [
17,
18]. Historical flood datasets are widely used to support risk prevention [
19], to analyze flood patterns and frequencies [
20], and to expand the datasets available for statistical analyses [
21]. However, these analyses tend to focus on documented events, while localized or minor episodes are underrepresented, especially at the local scale.
Historical landslide inventories are widely used in landslide forecasting, and are mainly based on daily or sub-daily rainfall thresholds, widely adopted in early warning systems [
22,
23,
24]. Recent studies have also explored the application of machine learning and deep-learning techniques for rainfall forecasting, landslide monitoring, and early warning systems in support of hydrogeological hazard assessment [
25,
26]. However, their effectiveness mainly depends on the availability and quality of event catalogs, the definition of rainfall events, the temporal resolution of rainfall data, and the representation of preceding conditions [
27,
28].
Furthermore, despite the large number of studies that focus separately on floods and landslides, research focused on their combined occurrence during DHEs remains limited [
29]. These limitations highlight the need for approaches that integrate heterogeneous data sources and enable the reconstruction of more comprehensive and spatially detailed datasets related to DHEs.
Another important issue that needs to be highlighted is that many approaches rely on high-temporal-resolution precipitation data, which are not always available for long historical periods, thus limiting the ability to analyze long-term relationships between precipitation and DHE occurrence. In this context, rainfall indicators are useful tools for analyzing their relationship. Precipitation aggregates on longer time scales, such as monthly, allow for the analysis of long-term rainfall series, and ensure consistency with historical documentary sources, where the exact timing of damaging events is often uncertain. Recent studies have demonstrated the role of indicators that combine data on rainfall and damage, although their application remains limited [
29].
In view of these factors, this study proposes an integrated approach that combines damage data from the scientific literature and historical documentary sources with monthly rainfall data to improve understanding of DHEs. The objectives are twofold. First, to identify the spatial and temporal distribution of DHEs at the local scale, including events not recorded in official databases. Second, to apply a homogeneous monthly precipitation indicator to characterize the rainfall conditions associated with these events, potentially providing useful information for preliminary analyses in homogeneous climatic areas. The methodology is applied to a frequently affected area in southern Calabria (Italy), characterized by long-term availability of rainfall data and historical documentary sources, providing an opportunity to investigate the relationship between rainfall variability and DHEs.
The paper is structured as follows:
Section 2 presents the methodological approach;
Section 3 presents the study area;
Section 4 describes the application of the methodology to the study area and the results obtained;
Section 5 discusses the results, highlighting the critical points; and finally,
Section 6 presents the main conclusions.
2. Methodological Approach
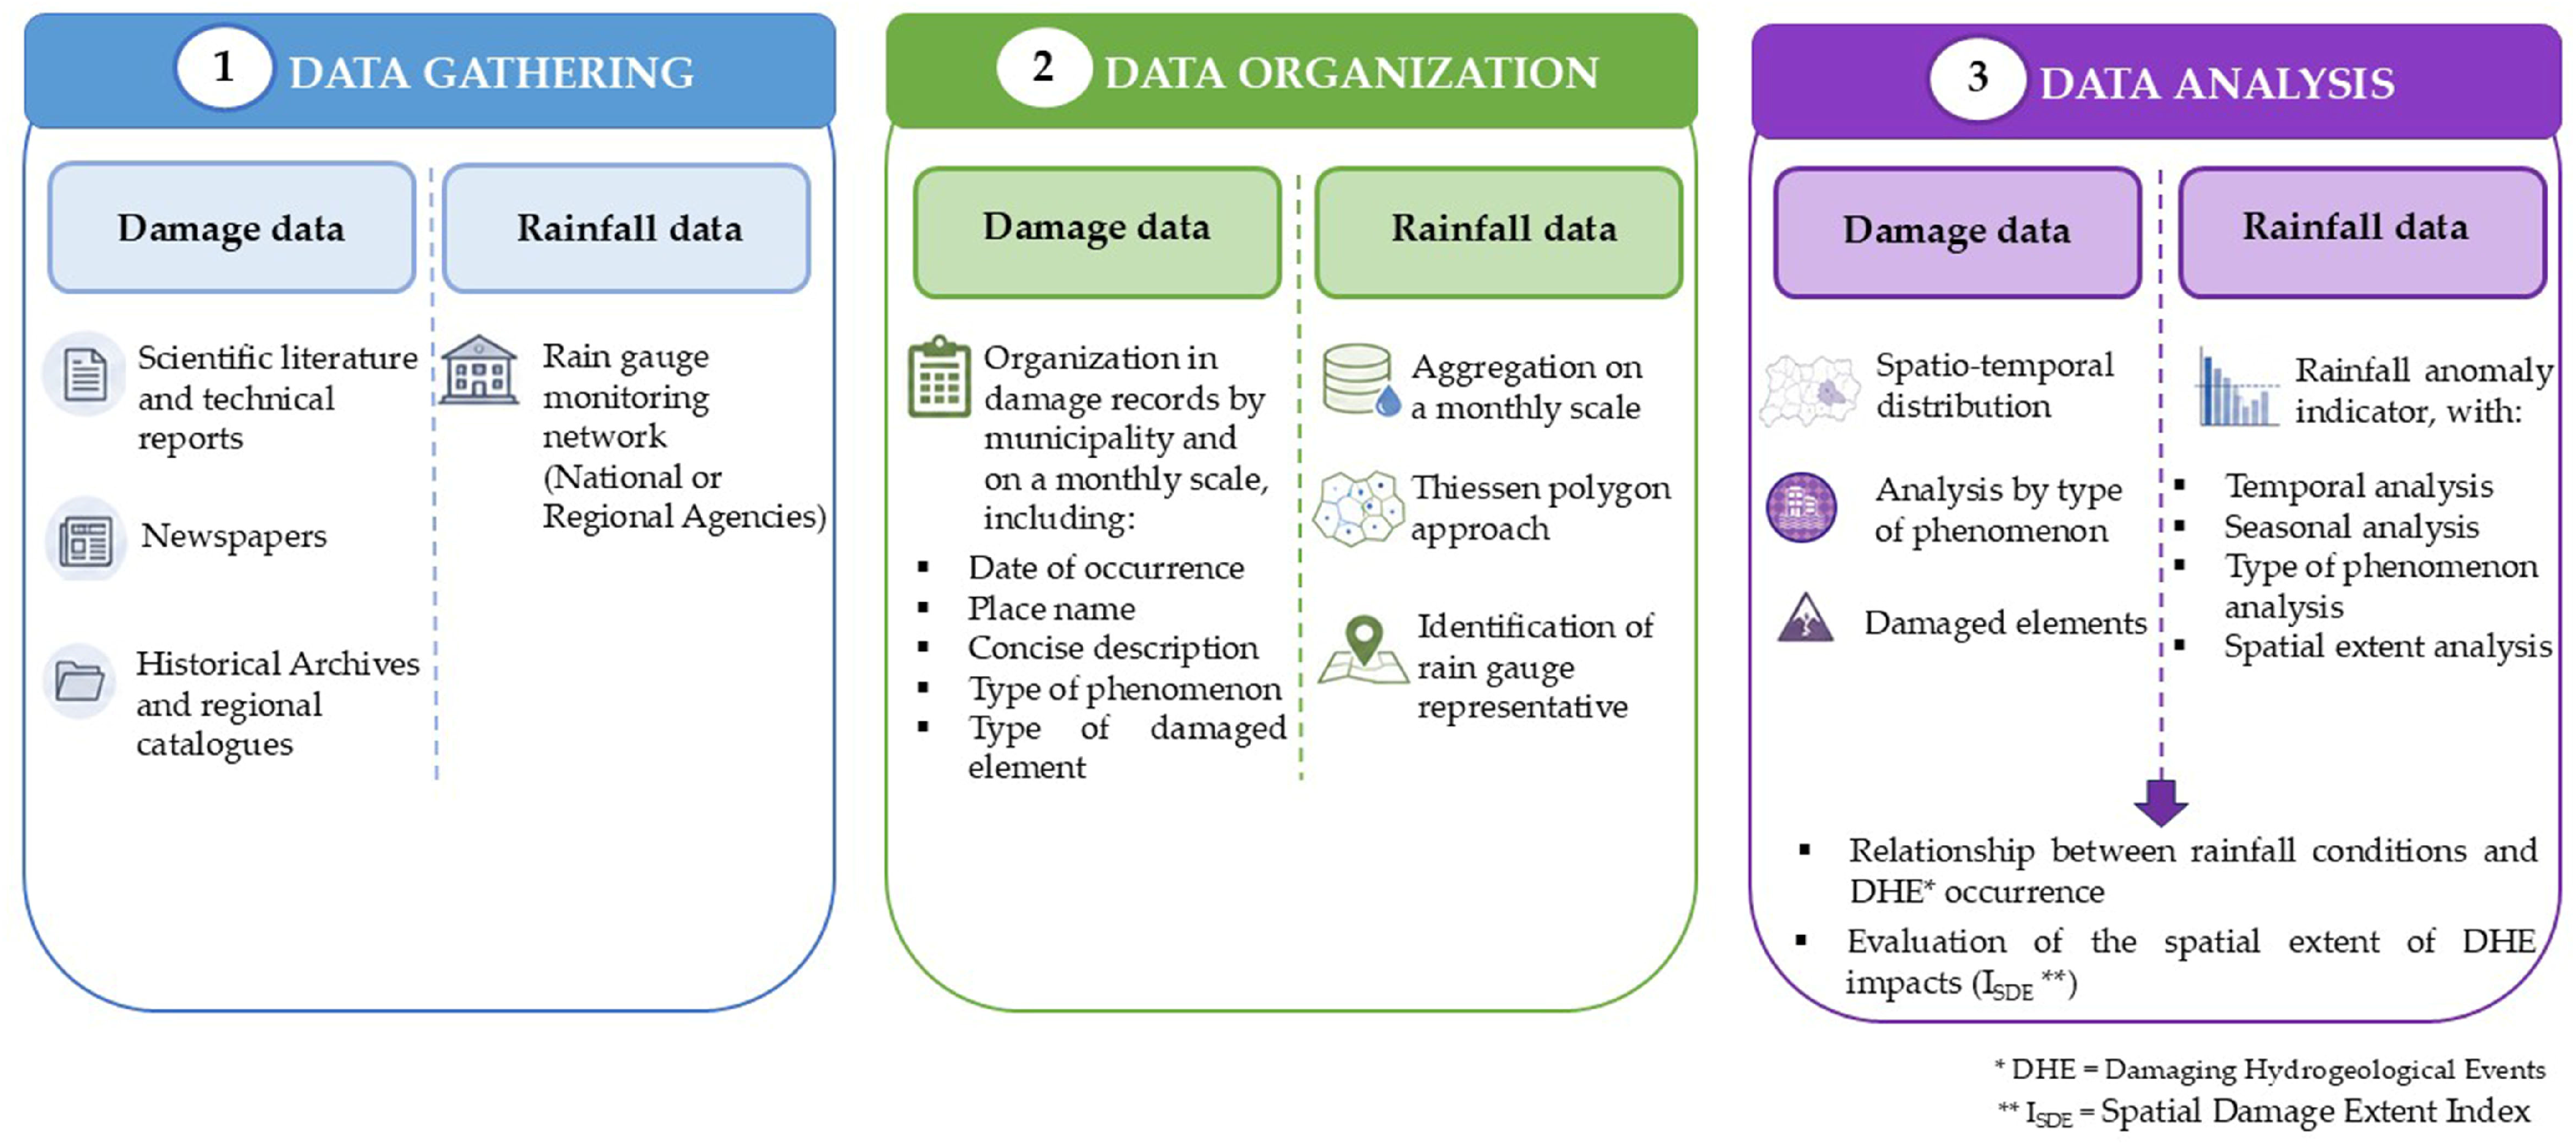
The methodological approach integrates damage data from the scientific literature and historical documentary sources, as well as rainfall data, to characterize the DHE distribution and associated rainfall conditions in the study area (SA). The methodological framework is divided into three phases: data gathering, data organization, and data analysis (
Figure 1).
2.1. Data Gathering
The methodology begins with the collection of the following: (i) data on damage caused by DHEs and (ii) rainfall data recorded by the monitoring network. Damage data are collected through documentary sources, such as historical books, scientific and technical reports, and local newspapers, widely used in the literature to identify historical series of past DHEs [
30]. These provide valuable information that can be analyzed and transformed into structured data. Newspapers are particularly important for the systematic analysis of daily editions over long periods [
18,
31].
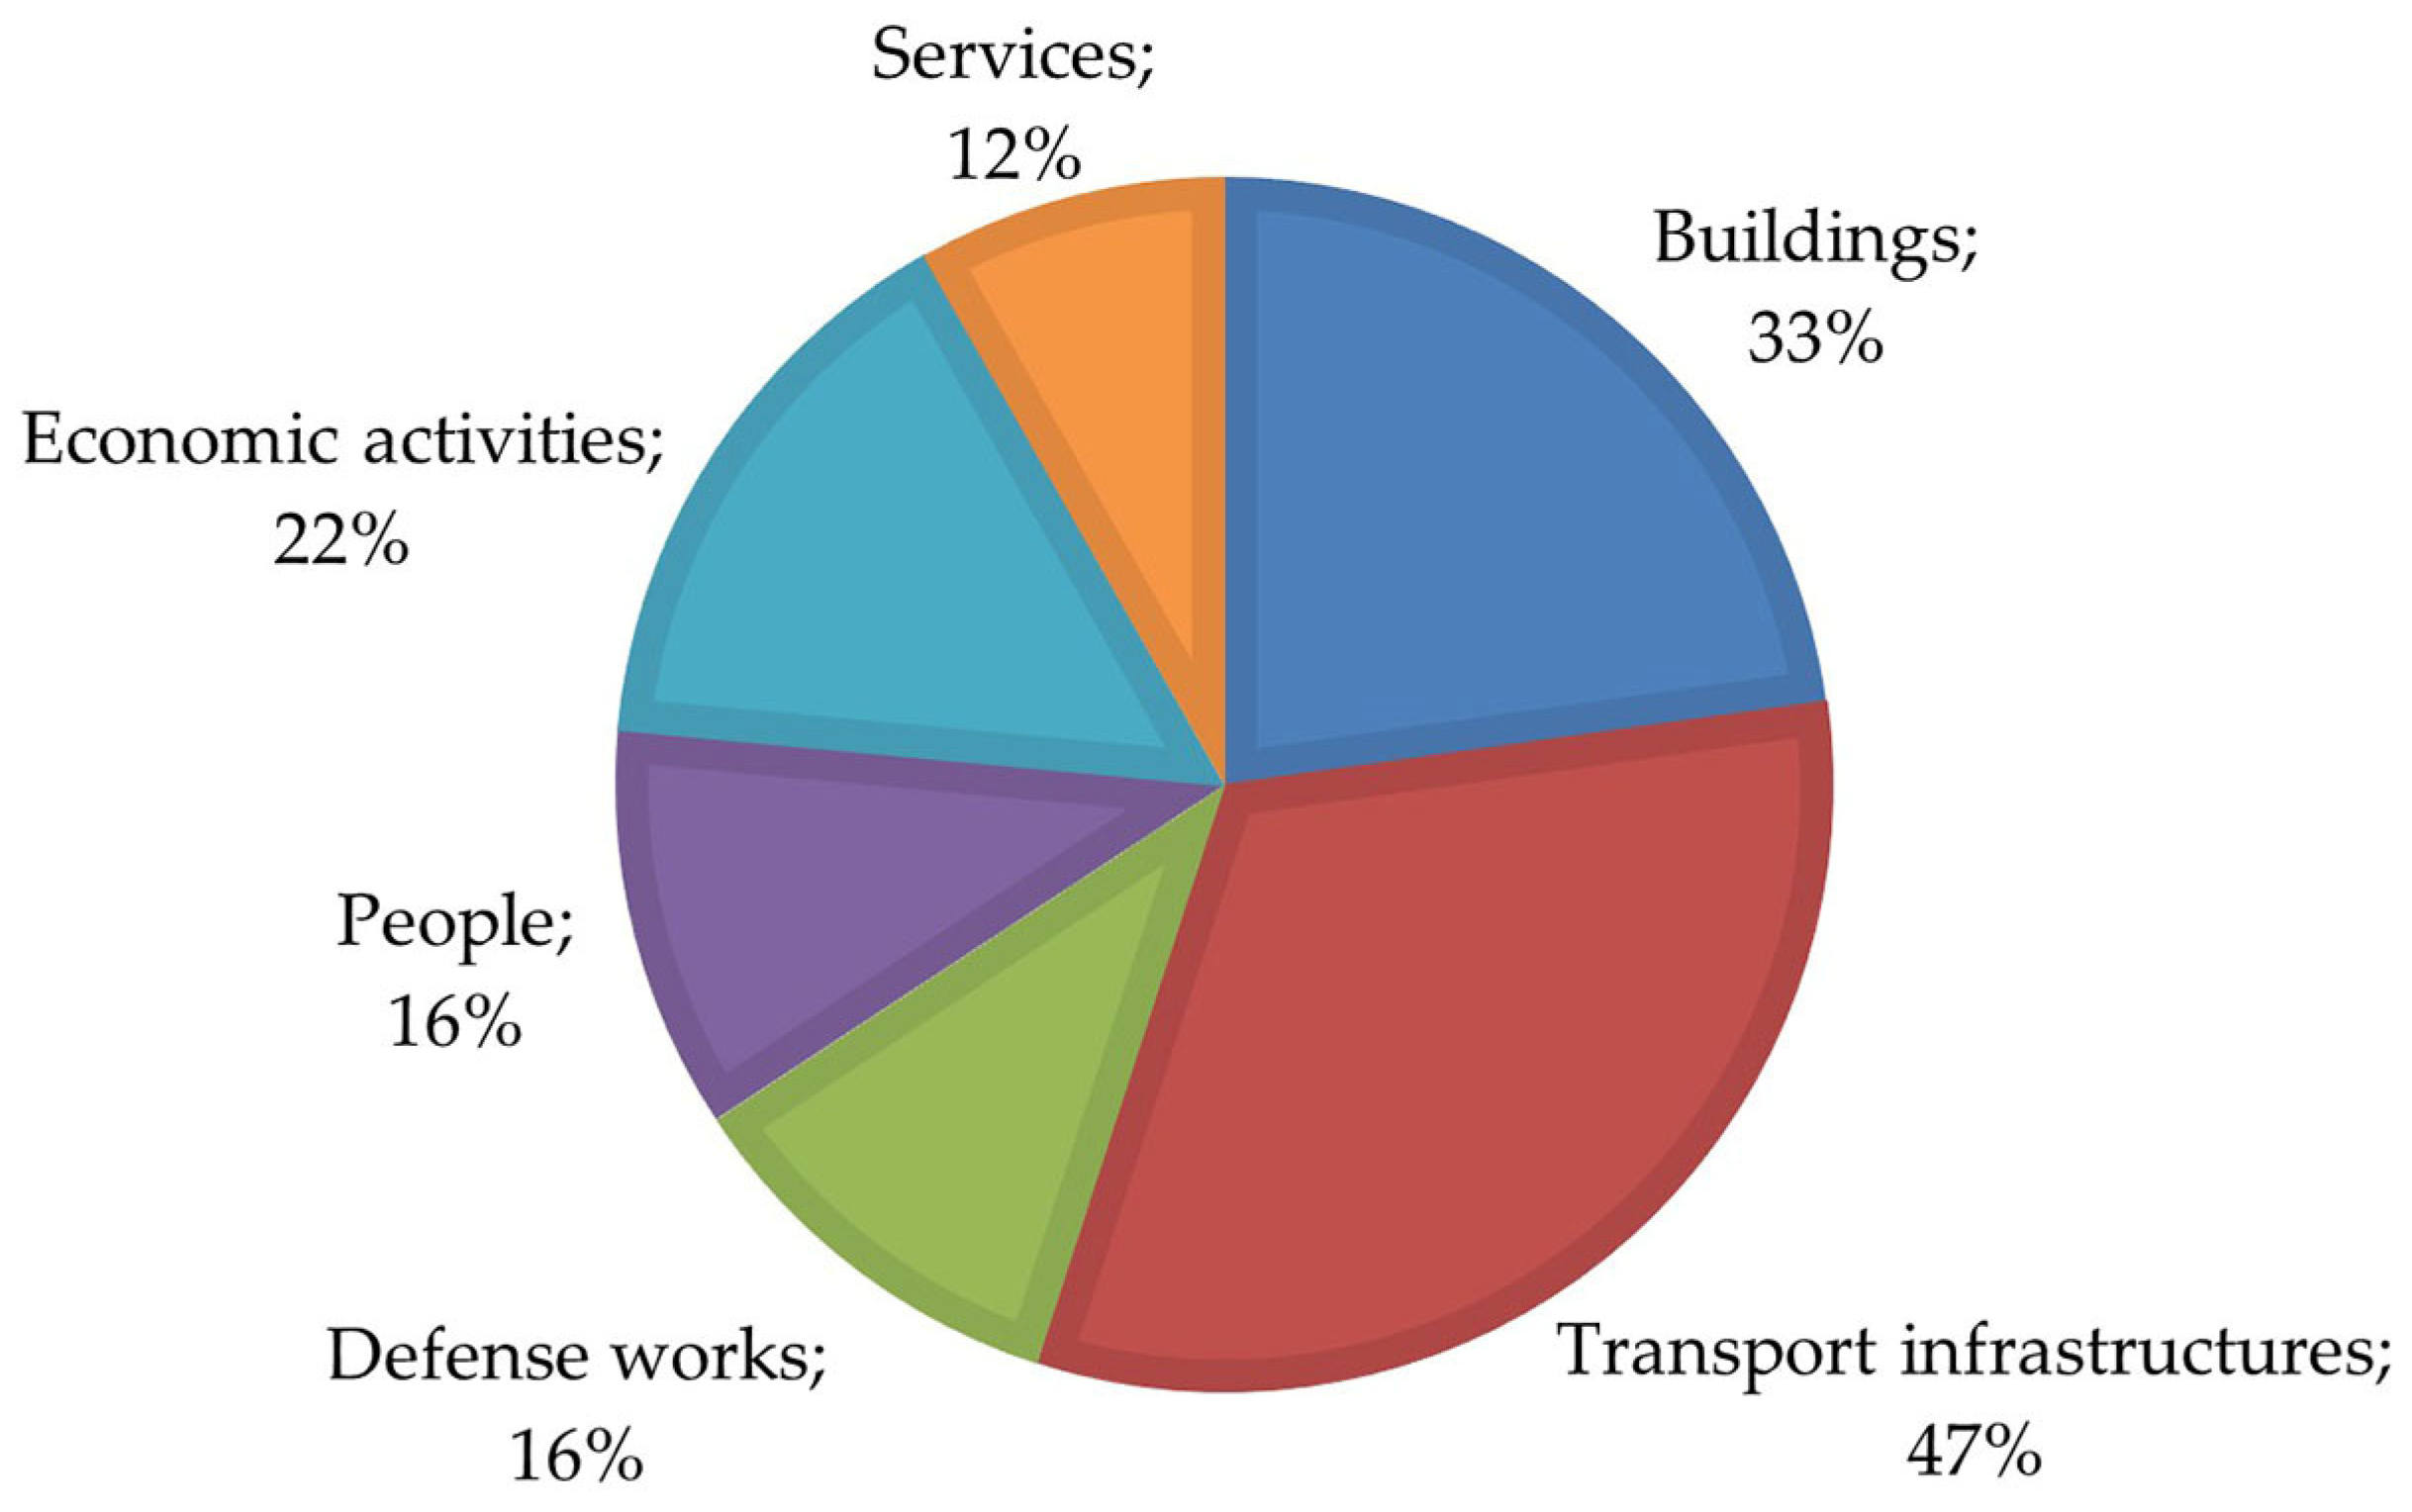
The data collected refer to direct damage caused by DHEs, such as the interruption or disruption of facilities, roads, and services, damage to people (deaths/injuries), buildings, and economic activities.
Rainfall data are obtained from rain gauges located within and around the SA. These data are generally available in the form of spreadsheets from the national or regional agencies officially in charge of rainfall data collection.
2.2. Data Organization
The gathered data related to damage caused by DHEs were organized in a spreadsheet, in which each damage record (DR) represented damage reports associated with the affected municipality based on a monthly time scale. Specifically, each DR contains the following: (1) the date of occurrence of the damage (year, month, and day), (2) the place name of where the damage occurred, (3) a concise description, (4) the type(s) of phenomenon (landslide, flood, urban flooding), and (5) the type of damaged element (building, road, activity, structure, service). Multiple damage reports occurring at different sites in the same municipality during the same month were aggregated into a single DR.
Rainfall data were also organized on a monthly scale to ensure consistency with the temporal aggregation adopted for the DRs. Using a Thiessen polygon approach, we correlated rainfall data with the SA, delineating the areas of influence of individual rain gauges. In cases with more than one reference rainfall station, the one with the largest area of influence is considered for the purpose of subsequent analyses.
2.3. Data Analysis
The data are analyzed based on two objectives. The first concerns the analysis of DHEs’ spatial–temporal distribution. The second aim is to analyze the distribution of monthly rainfall and to apply an indicator (the rainfall indicator (R), defined as the ratio between the monthly rainfall observed during a DHE and the corresponding long-term climatological average rainfall) to evaluate its relationship with DHEs.
where
represents the cumulative precipitation in the month in which the DHE occurred, while
represents the average monthly precipitation calculated in the study period. The average monthly precipitation is calculated using the entire available record for each station in order to maximize temporal coverage and maintain the representativeness of local rainfall conditions over the study period. In cases where more than one rainfall station is associated with the same municipality,
is calculated as the mean of the corresponding monthly rainfall values. Furthermore, since the analysis is performed on a monthly scale, damaging hydrogeological events occurring at the beginning of a month are assocciated with the previous month in order to maintain consistency between DHE occurrence and the corresponding rainfall conditions.
Furthermore, a Spatial Damage Extent Index (I
SDE) is introduced to provide a preliminary evaluation of the spatial extent of DHE impacts under different rainfall conditions. The index is defined as the ratio between the cumulative area of municipalities affected by a DHE and the total area of the study area.
where
represents the area of the
-th municipality within the SA affected by a DHE and
is the total area of the SA. This index provides a normalized measure of the spatial extent of DHE impacts within the study area. Since the analysis is performed on a monthly scale, the I
SDE is calculated for each monthly DHE under different rainfall conditions.
3. Study Area
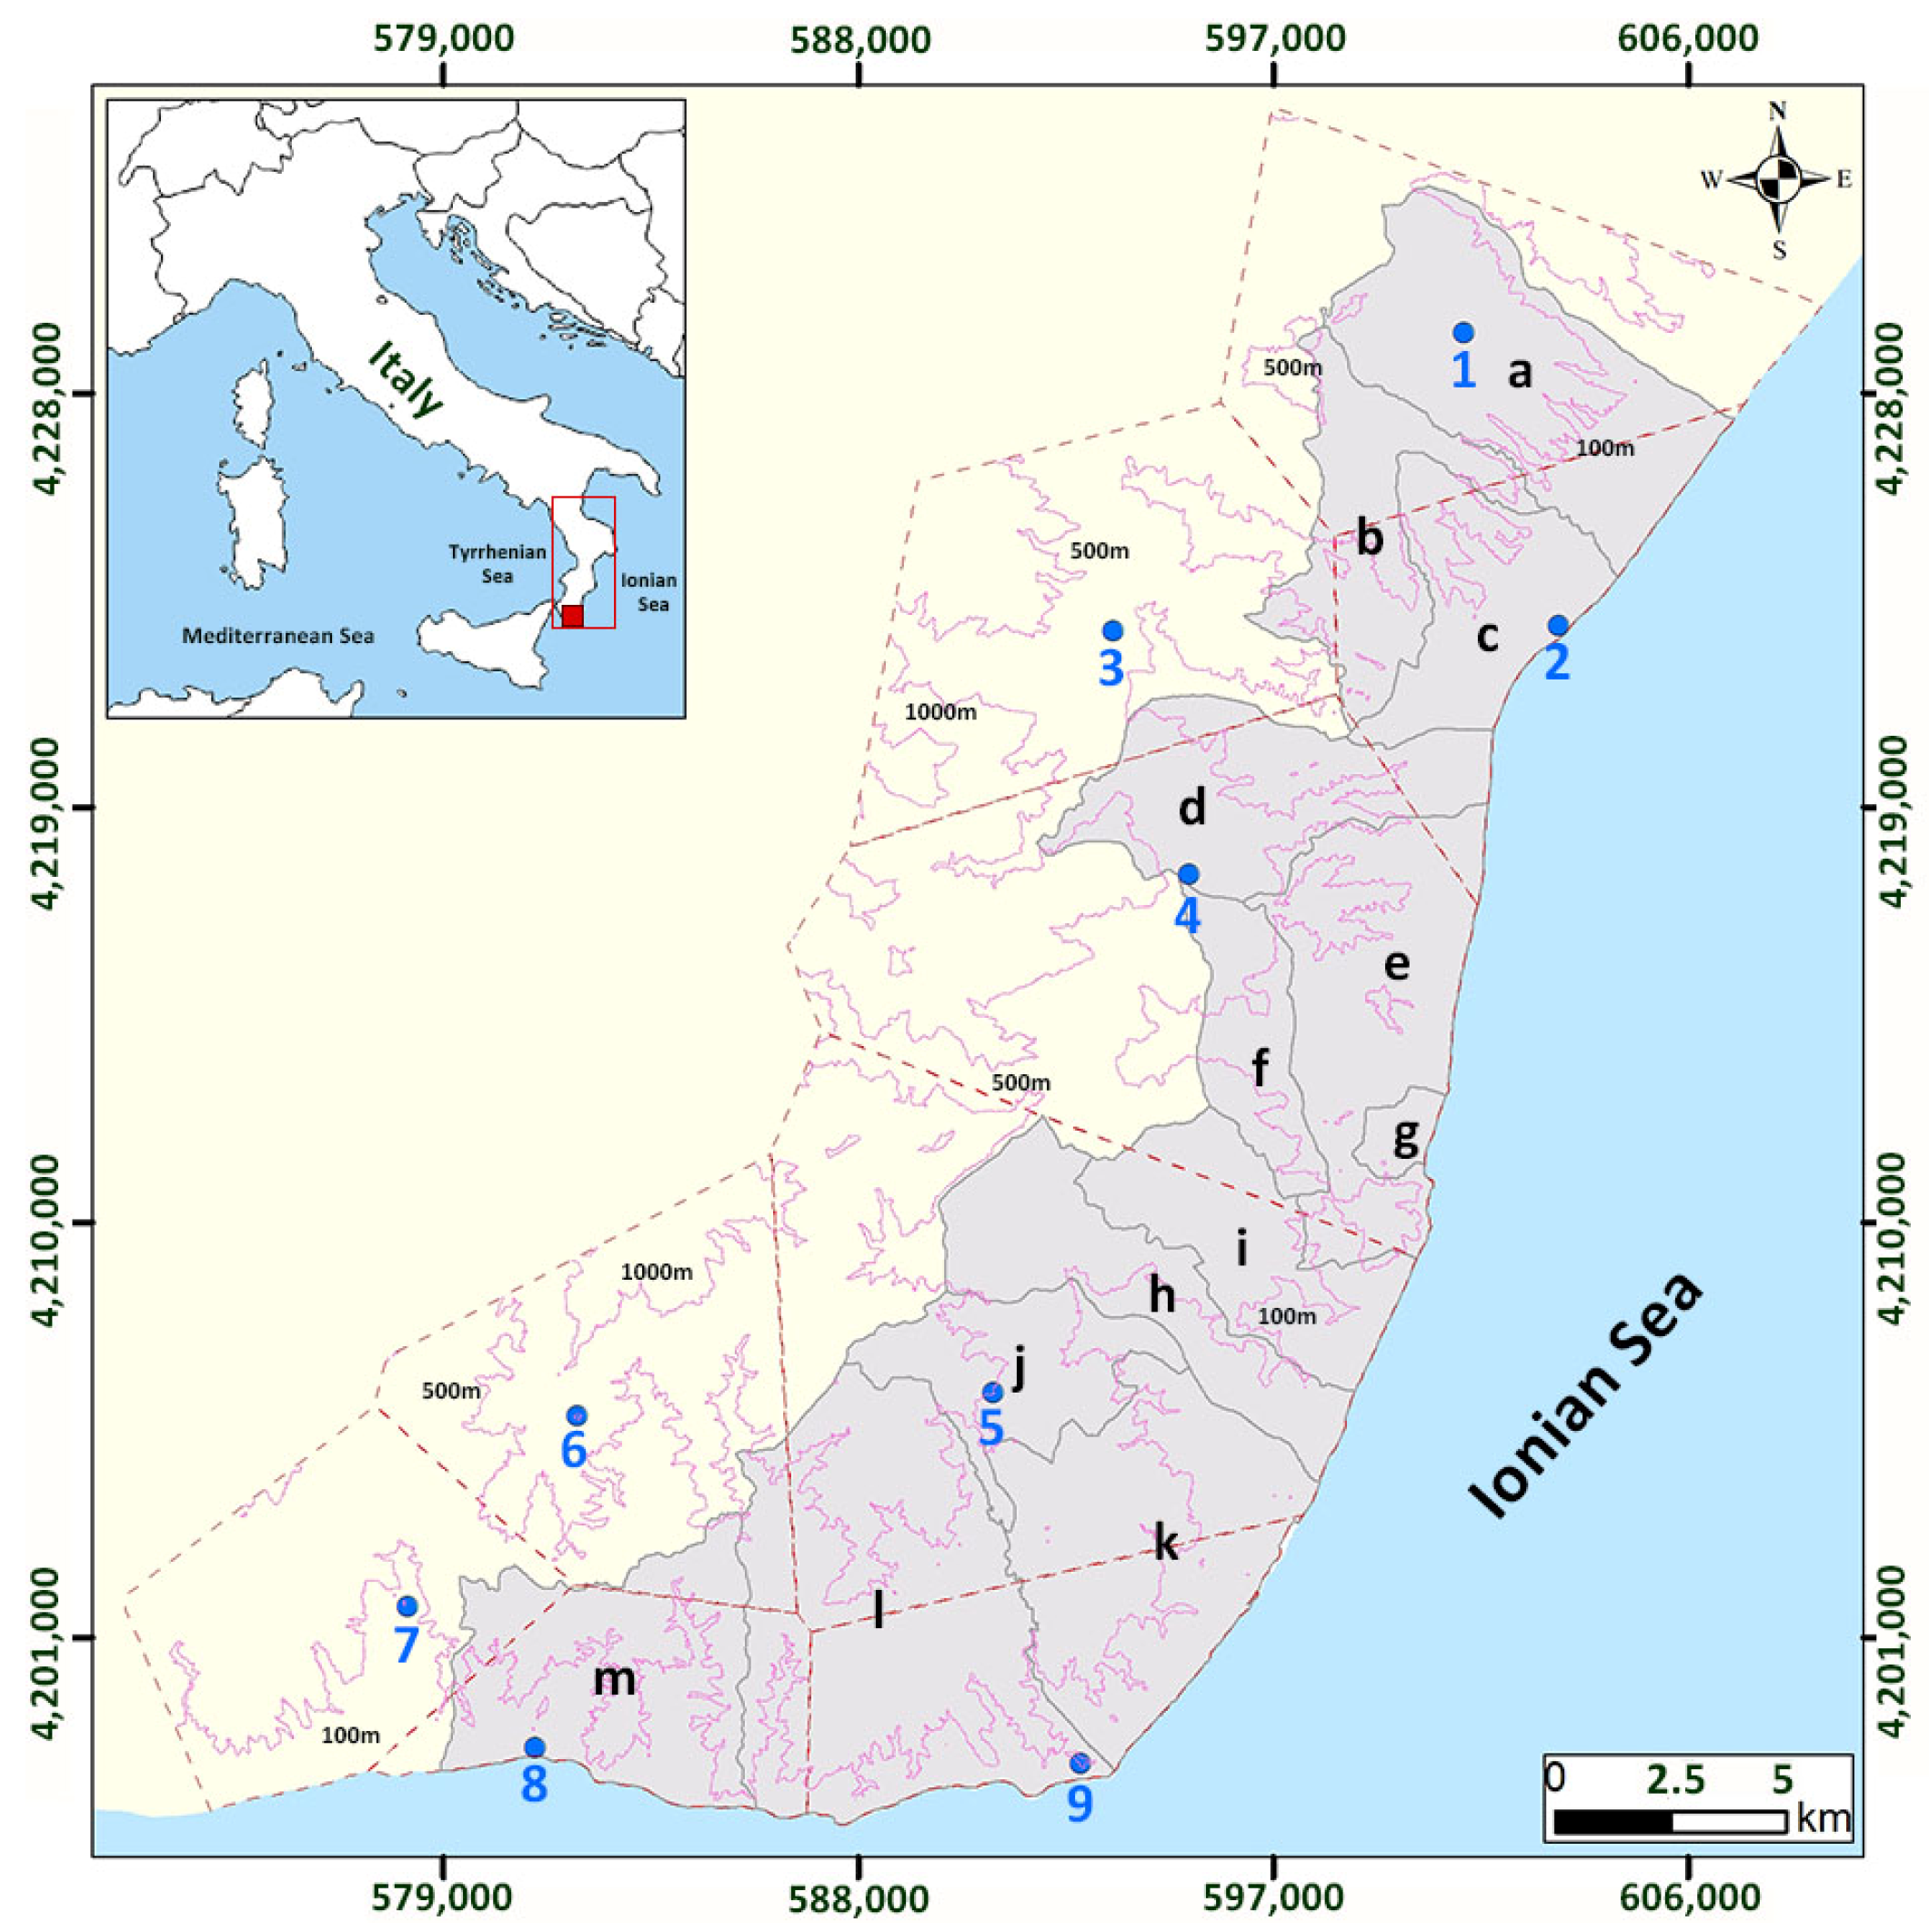
The study area is located in the south-eastern part of Calabria, along the Ionian coast, within the province of Reggio Calabria (
Figure 2).
Calabria, located in southern Italy, is a peninsular region covering an area of approximately 15,080 km
2, with a mean elevation of 597 m a.s.l. and a maximum elevation of 2267 m a.s.l. Positioned at the center of the Mediterranean Sea basin, the region has a coastline extending about 738 km, facing the Tyrrhenian Sea to the west and the Ionian Sea to the east. From a morphological perspective, Calabria is predominantly characterized by hilly and mountainous terrain, which together account for approximately 90% of the regional surface, while flat areas are limited (about 9%) and mainly concentrated along coastal plains. Mountain ranges, often located close to the coastline, generate steep altitudinal gradients over short distances and favor the development of small, torrential catchments characterized by very rapid hydrological response times to intense rainfall [
32].
In terms of climate, Calabria belongs to the mesothermal belt and is predominantly classified as Csa according to the Köppen–Geiger climate classification, with a Mediterranean climate characterized by hot, dry summers; at higher elevations, conditions locally corresponding to the Csb subtype, with milder summers, are also present [
33]. The region is frequently affected by Mediterranean cyclones able to generate intense and persistent rainfall, often associated with the triggering of landslides, flash floods, and other hydro-geomorphological processes [
29,
34,
35].
From a pluviometric perspective, Calabria is subdivided into three main homogeneous zones—Ionic (I), Tyrrhenian (T), and Central (C)—defined based on rainfall regionalization analyses [
36]. These zones exhibit distinct rainfall regimes and types of meteorological events, with particularly intense and concentrated precipitation along the Ionian side, where the study area is located.
Over several centuries, Calabria has been affected by numerous DHEs that have caused severe damage and loss of life, as documented by studies based on historical sources and technical archives [
37,
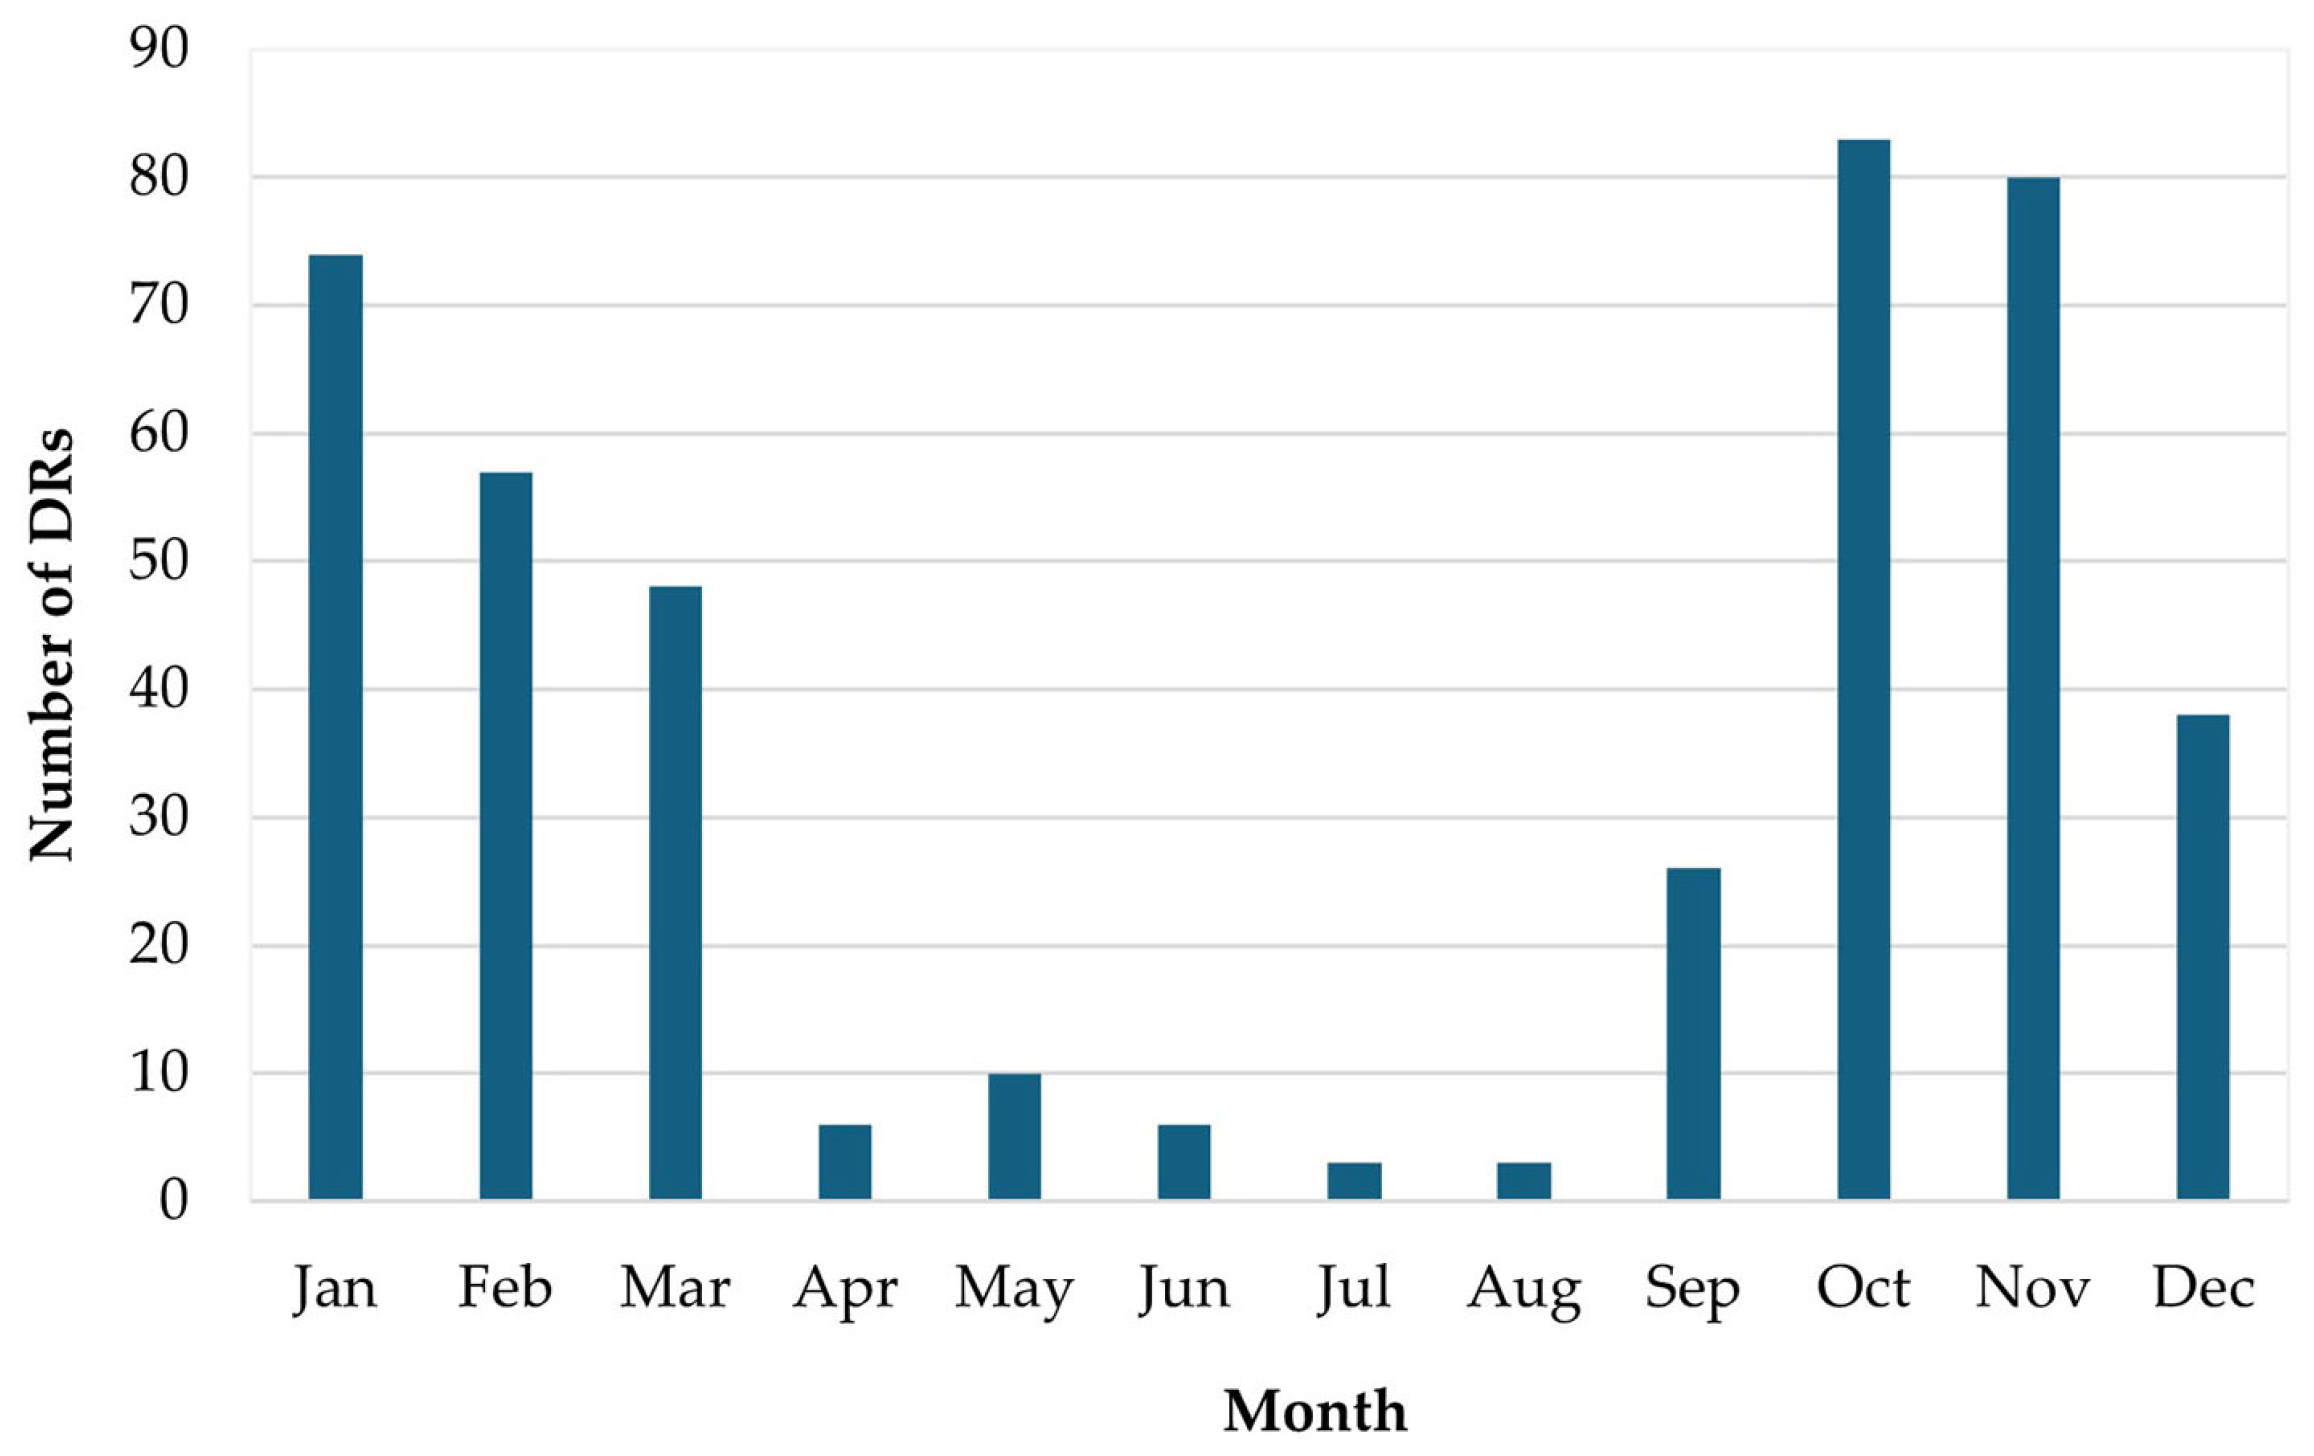
38]. In this context, the study area was selected as representative of a territory particularly exposed to DHEs, where the combination of characteristic pluviometric conditions and the availability of historical data allows for an integrated analysis of the relationship between rainfall and these events. The SA is mainly located within the Ionian subzones, which are characterized by marked spatial rainfall variability and significant accumulations during the autumn and winter months.
From an administrative point of view, the SA includes 13 municipalities within the province of Reggio Calabria (
Figure 2), with areas ranging from 11.5 to 54 km
2 and elevations spanning from sea level to approximately 1000 m a.s.l.
For the rainfall analysis, nine rain gauges were considered (
Table 1), currently managed by the ARPACAL Multi-risk Functional Center, the regional authority responsible for meteorological forecasting, hydro-meteorological monitoring, and real-time surveillance activities in Calabria (
https://www.cfd.calabria.it/, accessed on 6 October 2025). Six of these are located within the study area and three outside but immediately adjacent, and considered representative of rainfall conditions at the boundaries of the SA. The stations are located at elevations ranging from 8 m a.s.l. (Bova Marina) to 905 m a.s.l. (Bova Superiore) and are characterized by time series of variable lengths, ranging from 67 years (Bovalino Marina) to 101 years (Ardore Superiore). Despite differences in the lengths of the data series, the rainfall records provide extensive temporal coverage of the study period and ensure a high degree of spatial representativeness of rainfall conditions in the study area. Since the mid-20th century, most rain gauges have been in operation simultaneously, ensuring a high degree of temporal continuity in rainfall measurements.
The areas of influence of the rain gauges were defined using the Thiessen polygon method (
Figure 2), which represents a simplified spatial approach considered appropriate for the long-term and large-scale aims of this study. The association between rainfall gauges and municipalities is established based on the percentage of the municipal area falling within each Thiessen polygon, allowing for the identification of the rain gauges considered representative of each municipality (
Table 2).
Table 2 shows, for each municipality, its surface and the corresponding representative rain gauges identified through the Thiessen polygon approach. When multiple rainfall stations are associated with the same municipality, the rainfall value used in the analysis is calculated as the mean of the monthly precipitation recorded at the corresponding stations, providing a simplified estimate of local rainfall conditions.
5. Discussion
This study demonstrates the validity of an integrated methodological approach that combines damage data derived from the scientific literature and historical documentary sources and monthly rainfall data to analyze the spatio-temporal distribution of DHEs—such as landslides, floods and urban flooding—and their relationship in an Ionian area of Calabria.
Some similar approaches based on the integration of historical documentary sources and instrumental data have been used to reconstruct DHEs and to analyze rainfall impact relationships in Mediterranean regions [
13,
17,
18,
42,
43]. These studies emphasize the relevance of historical data for improving the understanding of past DHEs, particularly in areas where systematic monitoring networks were established only in recent decades.
This analysis shows the role of historical research in identifying both major and minor events that are not included in official databases. While the scientific literature primarily documents large-scale hydrogeological DHEs associated with intense and persistent rainfall, local documentary sources provide a much more detailed and spatially distributed picture of impacts at the municipal level. This highlights the added value of integrating multiple data sources to obtain a more comprehensive and spatially resolved catalog of DHEs.
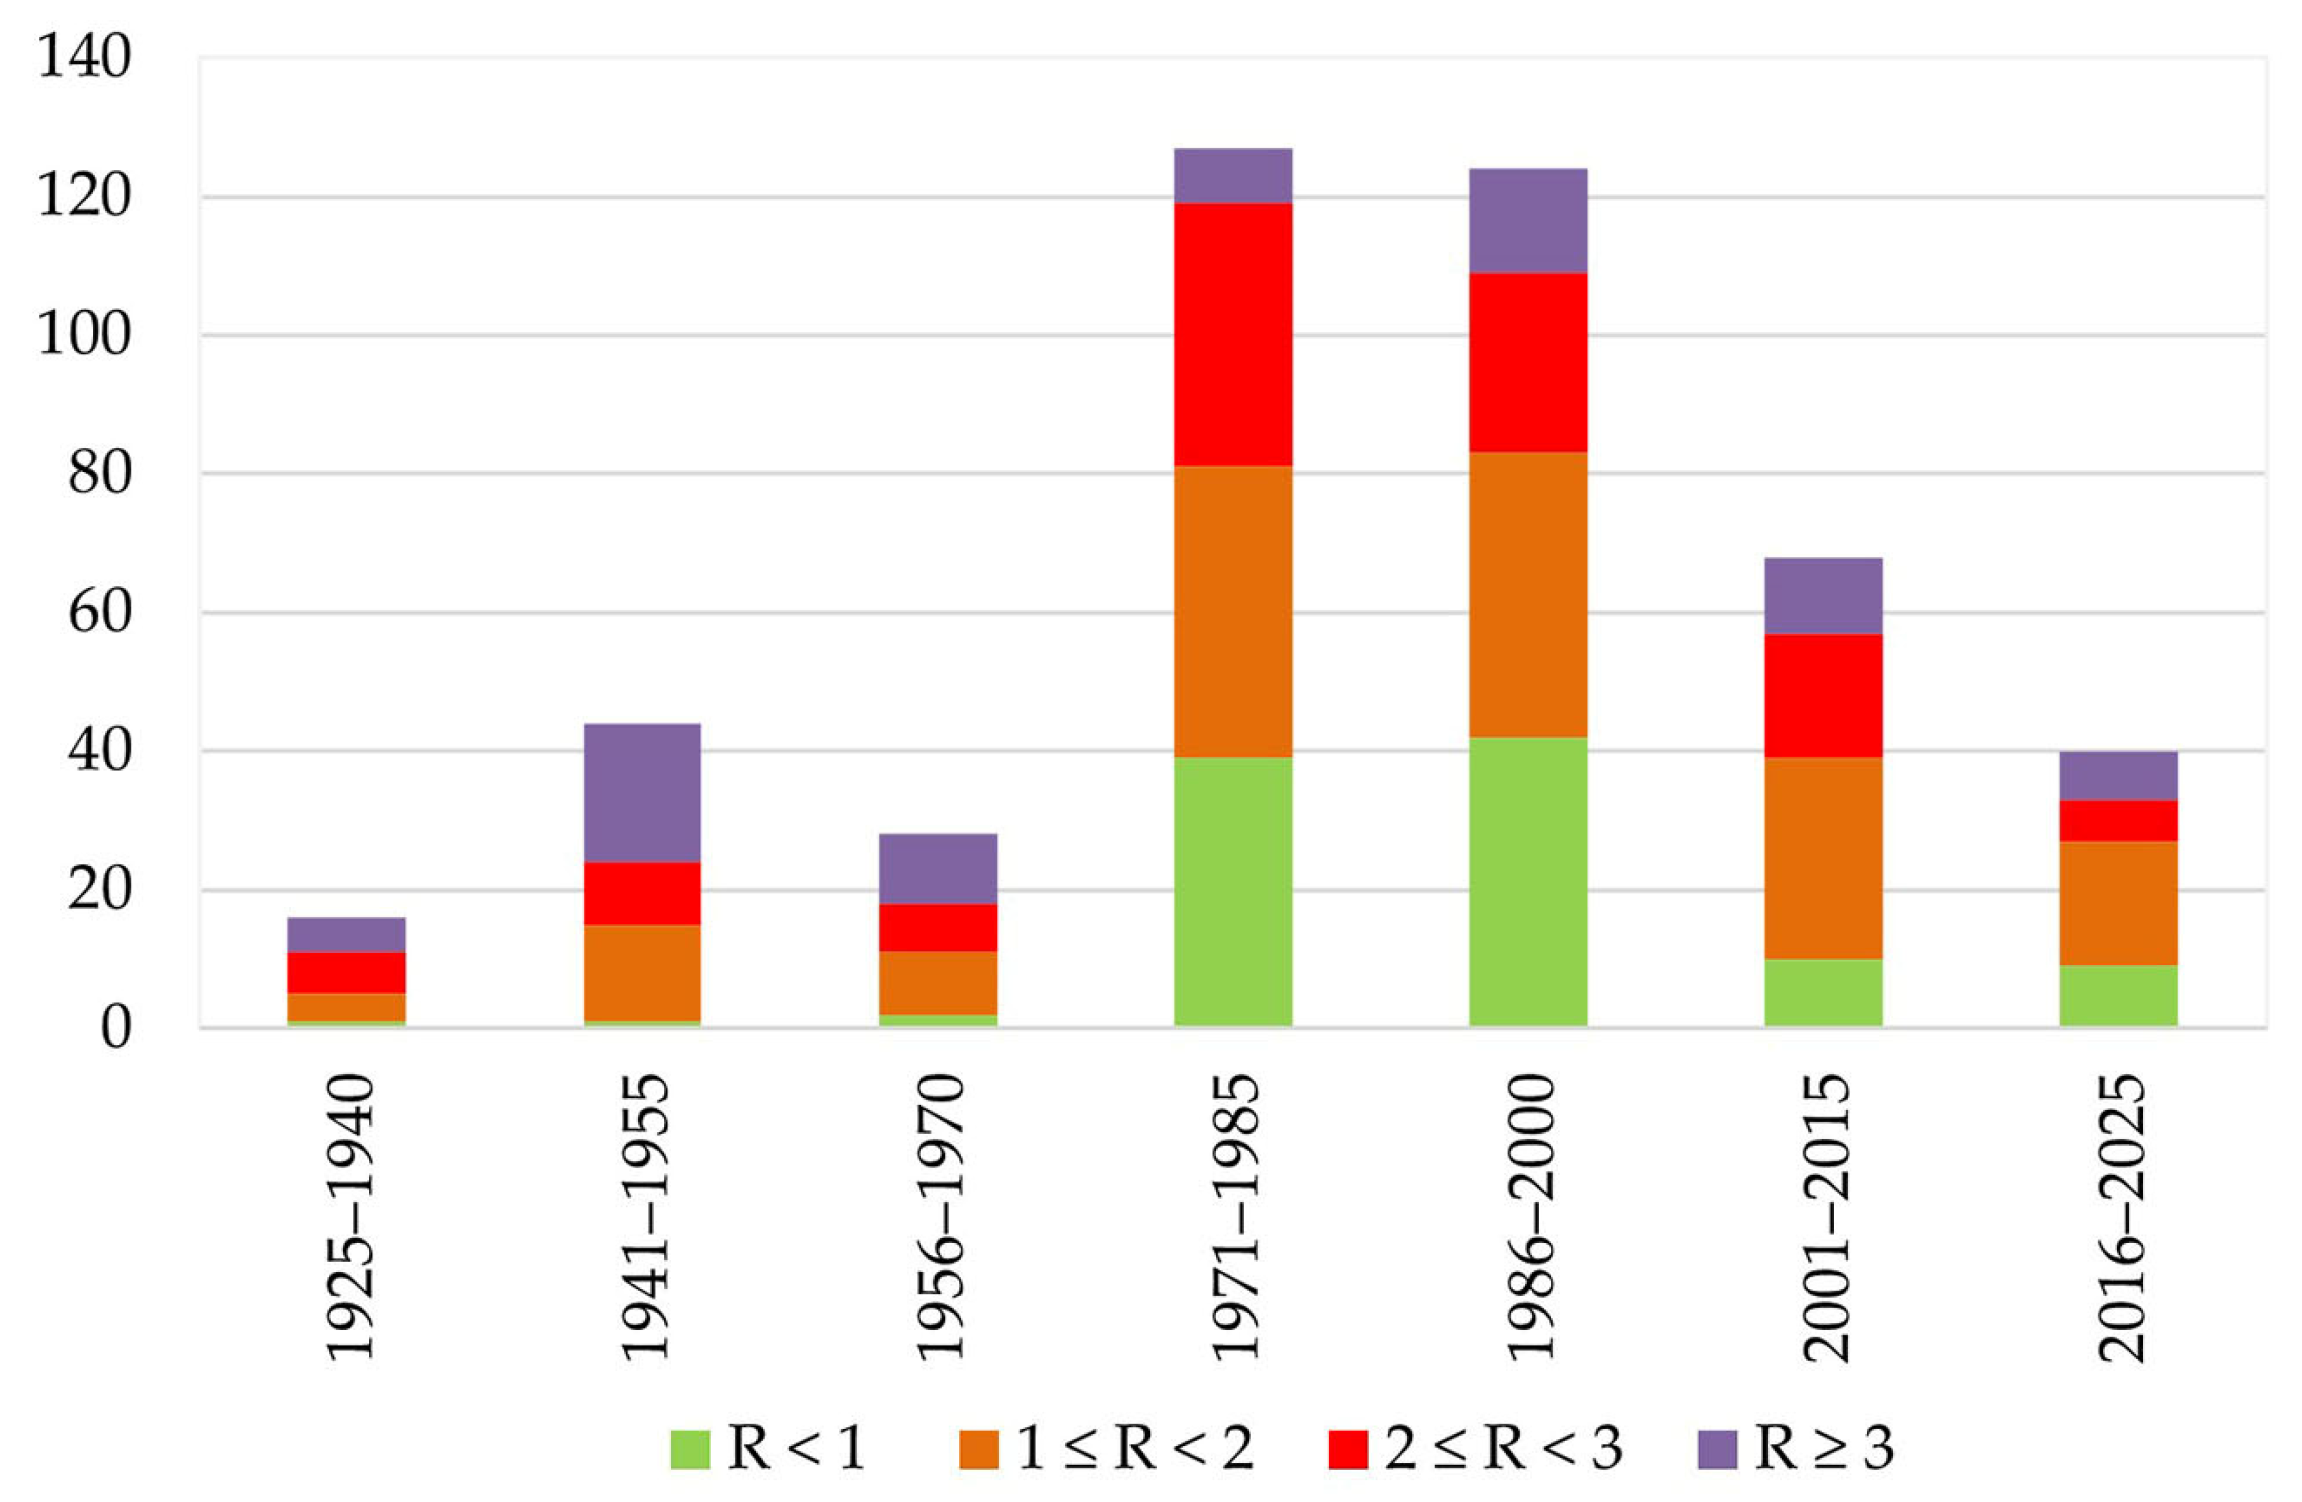
The temporal analysis highlights the temporal variability in the relationship between precipitation anomalies and DHEs. The earliest period (1925–1940) includes a limited number of cases (3.6%) and is therefore not considered fully representative. The periods between 1941 and 1970 are characterized by a higher proportion of cases associated with very strong precipitation anomalies, suggesting a greater dependence on heavy precipitation. The periods between 1971 and 2000 show a higher frequency of cases associated with weak and strong precipitation anomalies. In recent decades, most cases have been associated with moderate precipitation anomalies, although all classes are represented. These trends suggest that the occurrence of DHEs is influenced not only by precipitation variability, but also by changes in exposure, vulnerability, and data availability over time.
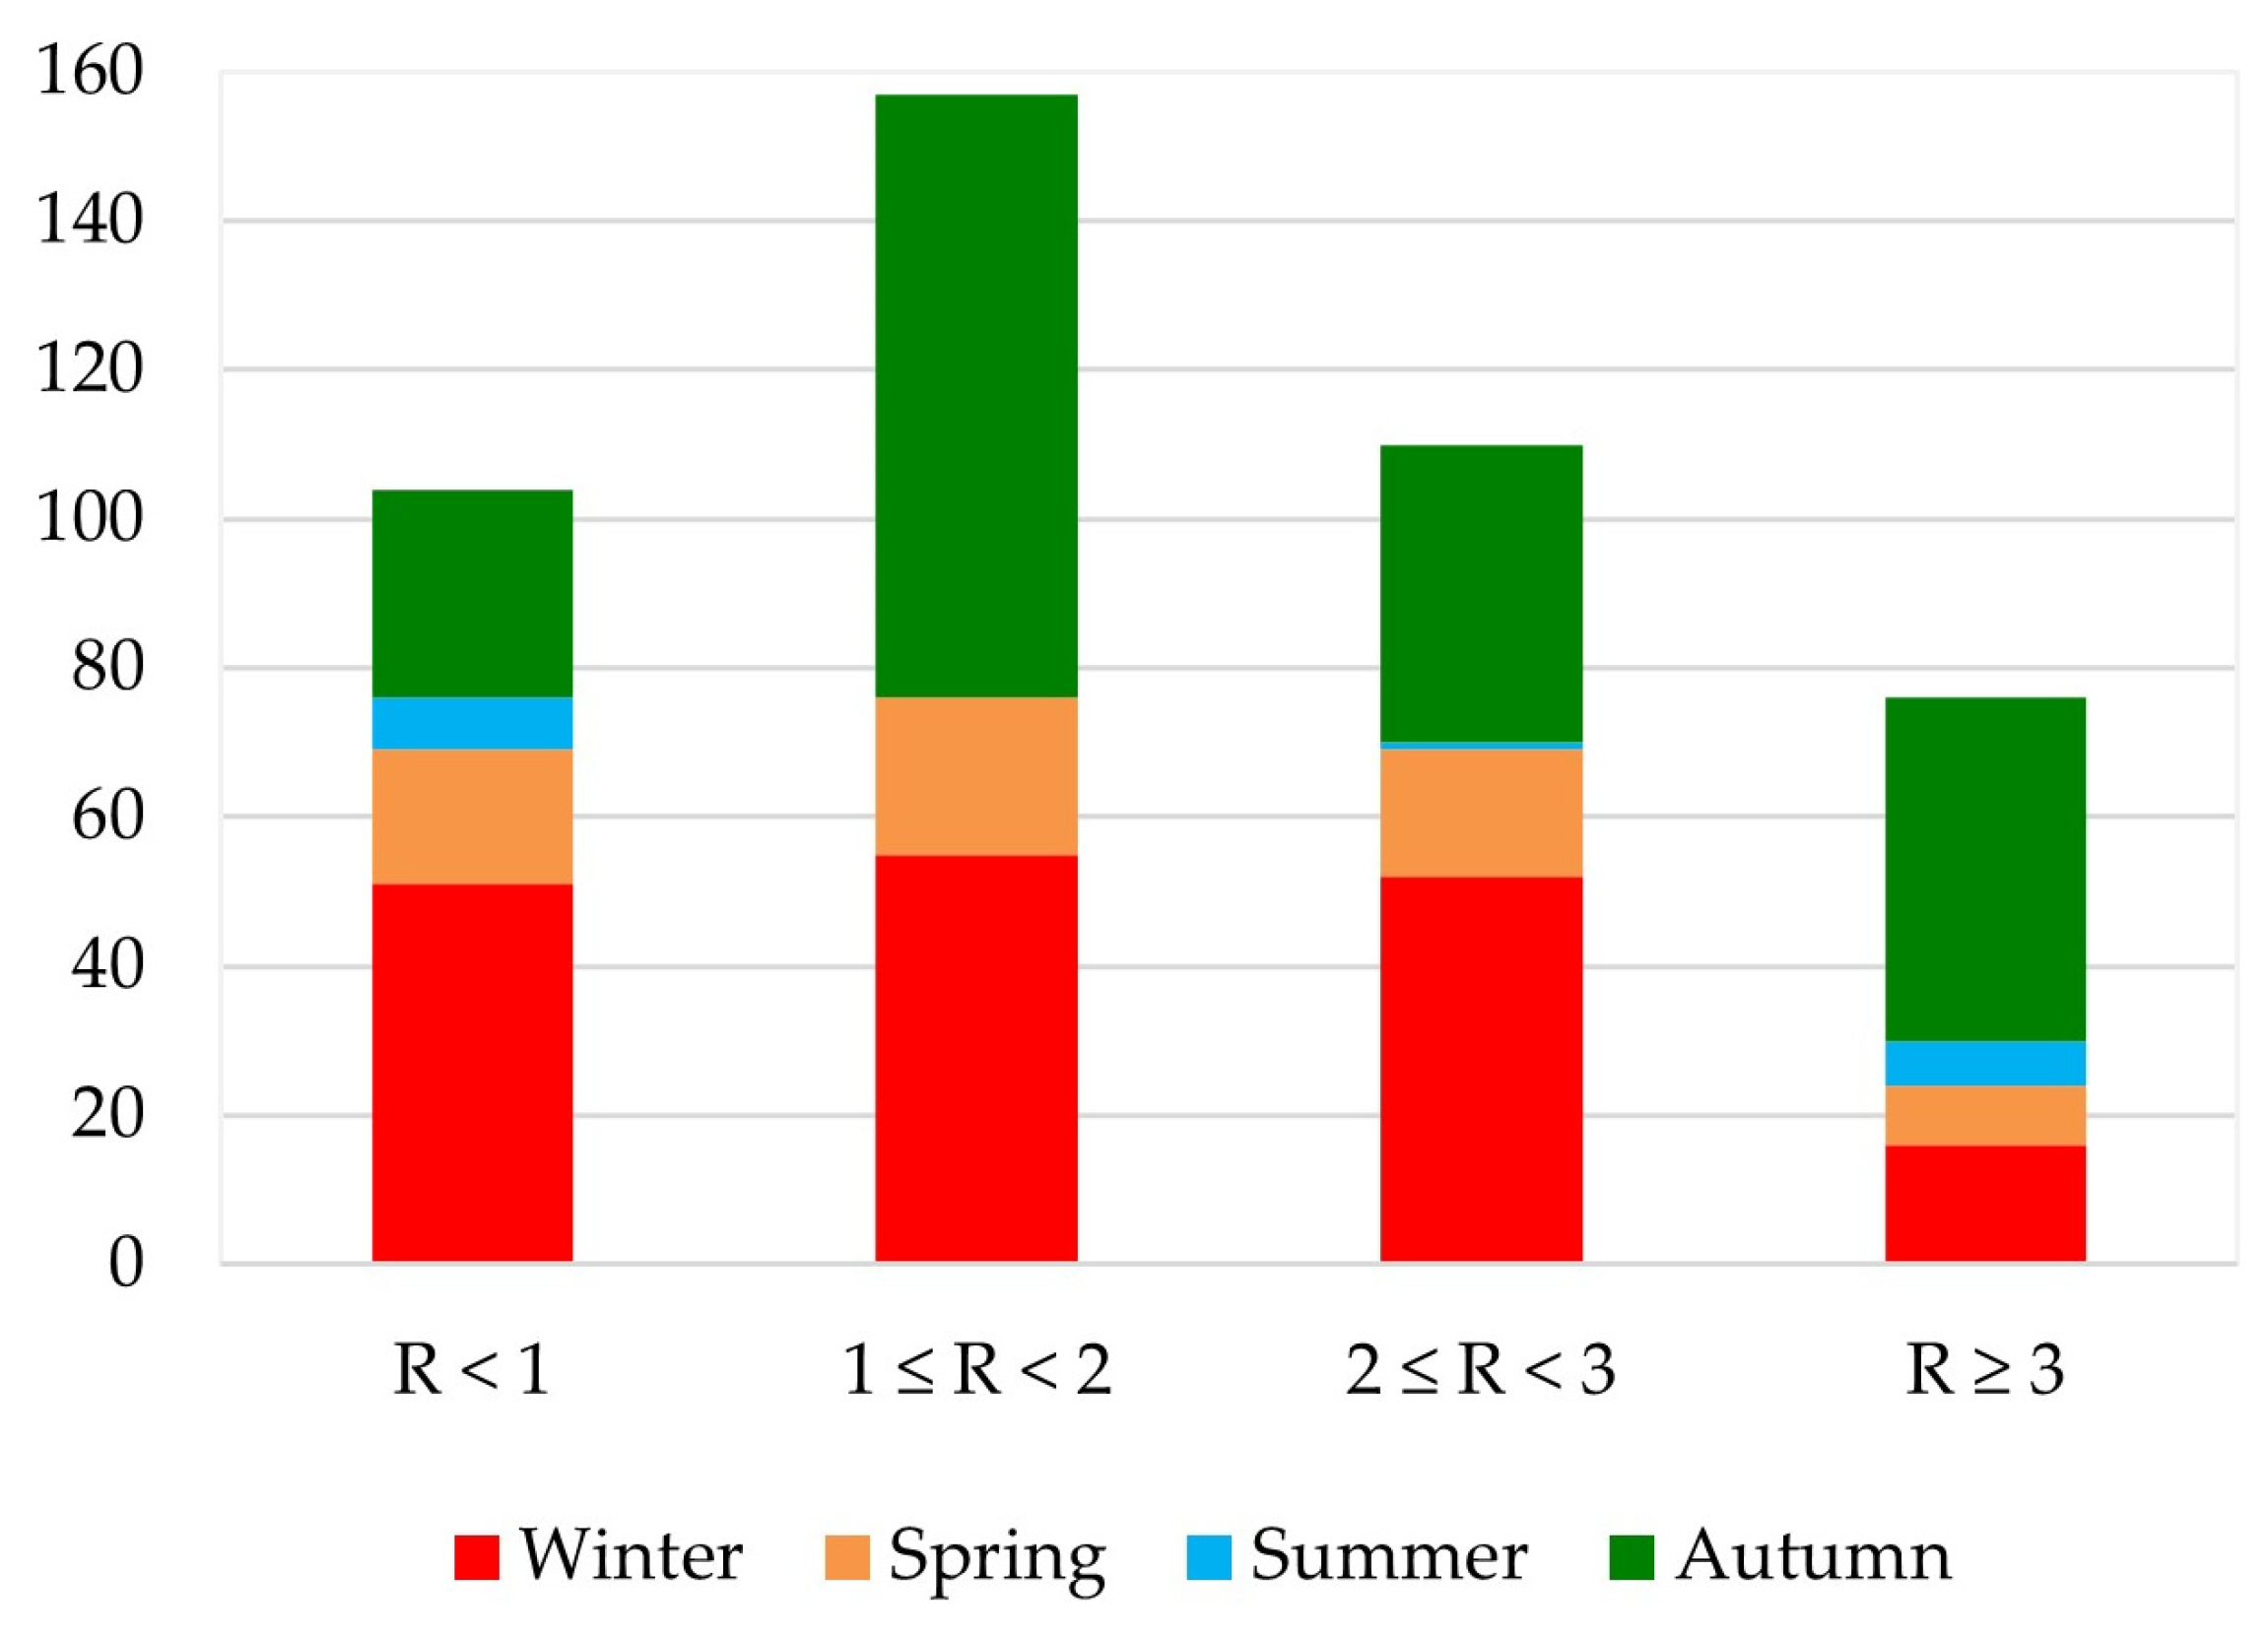
The seasonal distribution represents a key aspect of the analysis. According to the typical Mediterranean rainfall regime of the area, characterized by frequent and persistent rainfall during the cold season, most cases occur during the autumn and winter. Winter events are mainly associated with intermediate R values, with a relatively low percentage of strong rainfall anomalies, while autumn exhibits a wide distribution across all classes, including a major frequency of strong anomalies. In contrast, summer is characterized by few events, but a relatively high percentage of cases associated with heavy-precipitation anomalies. This indicates that, although rare, summer DHEs tend to be triggered by intense and localized rainfall.
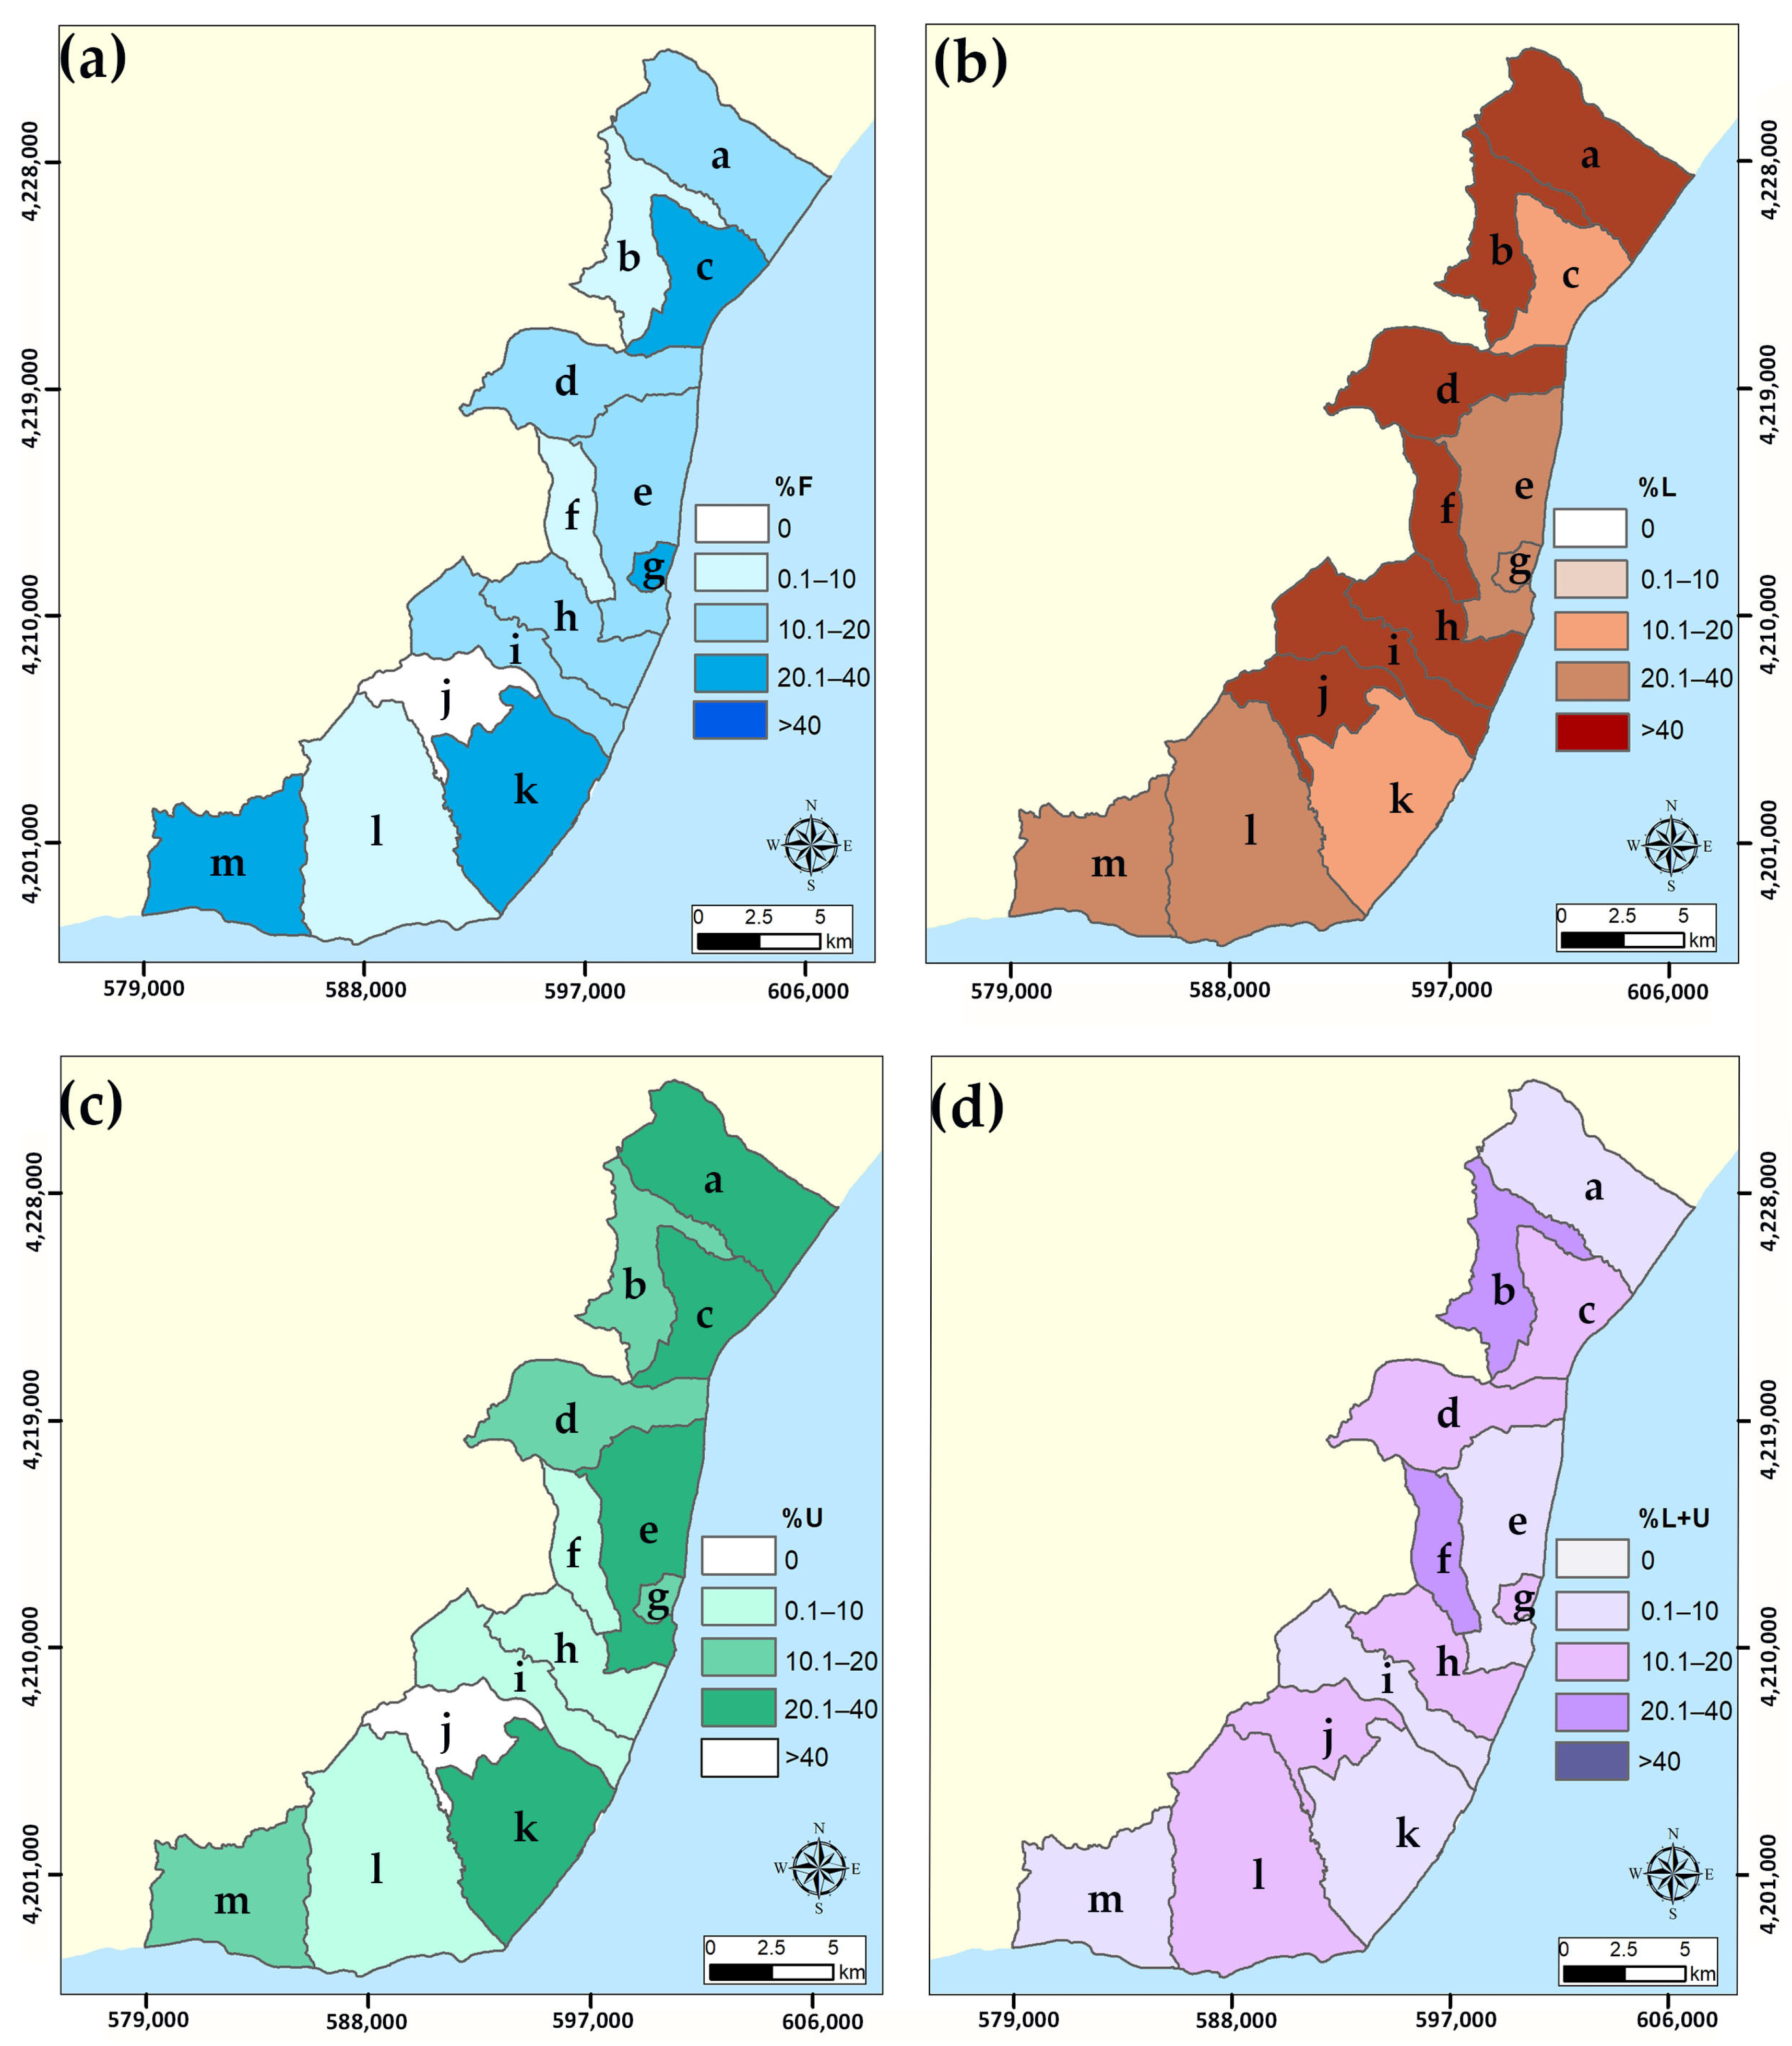
Spatial analysis shows the heterogeneous distribution of DHEs across municipalities, with some areas, such as Bovalino, Bianco, and Palizzi, exhibiting higher frequencies and a greater occurrence of multiple phenomena. Overall, the results indicate that the selected SA is particularly vulnerable to DHEs.
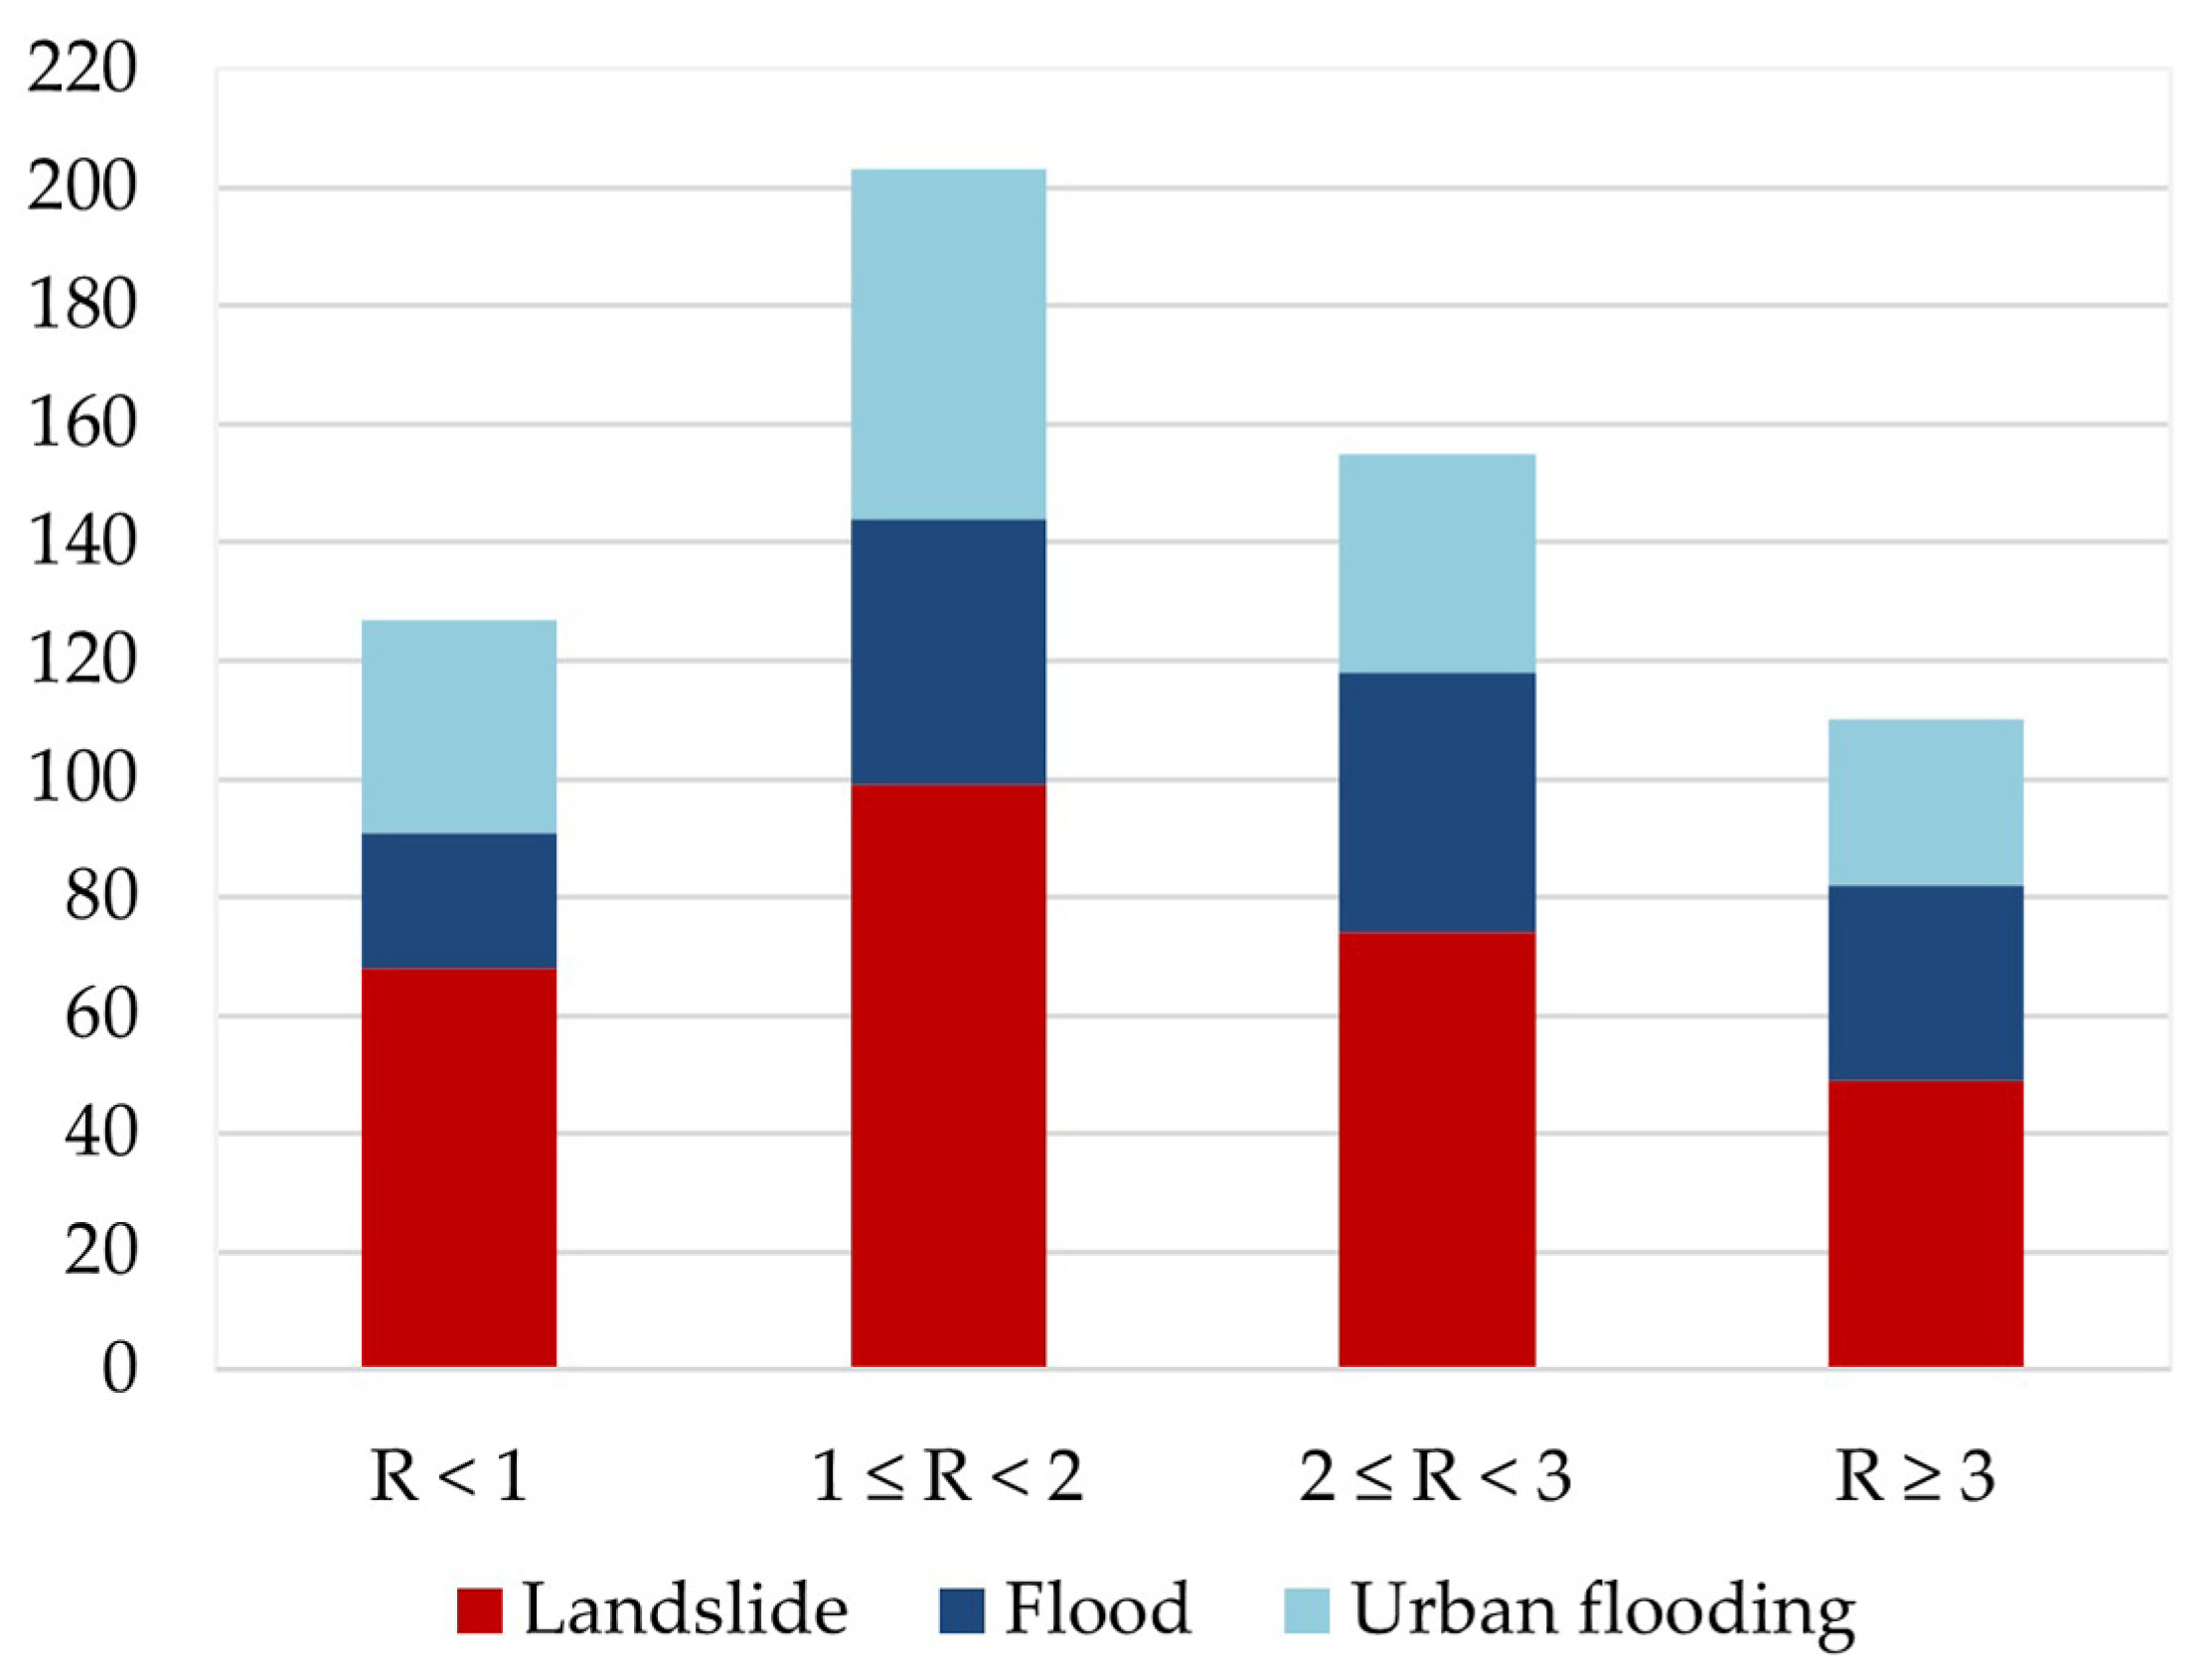
Analysis by type of phenomenon further highlights the complexity of DHEs. Landslides are the most frequent phenomenon in most municipalities and occur in 29% of cases in combination with other phenomena. They are distributed across all rainfall classes, with nearly 60% of cases occurring under conditions of moderate–strong rainfall, and a significant percentage (23.4%) occurring under weak rainfall conditions. This suggests that the occurrence of landslides is not only controlled by rainfall anomalies. Floods tend to occur more frequently under moderate–strong rainfall anomalies, with over 60% of events occurring under these conditions and 22.8% of cases associated with very strong anomalies. This tendency confirms the influence of cumulative precipitation on flood occurrence. Urban flooding exhibits intermediate behavior, with cases distributed across all precipitation classes but predominantly associated with moderate anomalies. This reflects the combined influence of precipitation intensity and urban factors, such as drainage system capacity. However, the chi-square test revealed no statistically significant differences between the types of phenomena in the distribution of R classes, suggesting that the observed differences should be interpreted with caution.
We introduced the ISDE to provide a synthetic assessment of the spatial extent of DHE impacts over the long historical period considered in this study. The analysis of ISDE values highlights that stronger rainfall anomalies are generally associated with more widely affected areas, while lower ISDE values are mainly observed under weak rainfall-anomaly conditions. However, the highest mean and median ISDE values were observed for class 2 ≤ R < 3, while no further increase was observed for the most extreme rainfall anomaly class. This result indicates that very strong precipitation anomalies are not necessarily associated with the most widely affected areas, suggesting that factors other than the magnitude of rainfall anomalies may influence the spatial extent of DHE impacts.
Some limitations should be acknowledged. Monthly rainfall data provide a useful description of the overall rainfall context, but they do not capture the intensity of short-duration precipitation, which is often responsible for triggering localized phenomena such as landslides and urban flooding. Furthermore, the availability and reliability of historical documentary sources can change over time, potentially causing inconsistencies in DHE reporting, especially for periods further in the past. Considering the long study period (1925–2025), the spatial extension of the analysis, and the heterogeneous nature of the available documentary sources and long-term rainfall series, the use of the monthly precipitation indicator represents a simplified and homogeneous approach to characterizing the rainfall conditions associated with DHE occurrence.
Due to the monthly temporal aggregation, this rainfall indicator incorporates the cumulative precipitation recorded throughout the entire month. Consequently, it may include rainfall that occurred after the documented DHE and therefore does not necessarily represent the exact rainfall conditions at the time of the event. At the same time, the use of monthly cumulative precipitation may partially reflect antecedent wet conditions associated with extended rainfall periods, which can contribute to the triggering of localized phenomena, such as landslides. Therefore, the indicator should be interpreted as a simplified proxy of the general monthly rainfall conditions associated with DHE occurrence, providing a first-order characterization of rainfall conditions rather than a direct triggering threshold.
The spatial representativeness of rainfall data can also be affected by the uneven distribution of monitoring stations within the study area. Despite these limitations, the proposed approach provides a framework for analyzing local-scale DHEs. Its effectiveness could be further improved by integrating precipitation indicators with data on exposure and vulnerability.
6. Conclusions
This study investigated the relationship between monthly rainfall conditions and DHEs affecting an area of the Ionian coast of Calabria, integrating damage data from the scientific literature and historical documentary sources and rainfall data recorded by the monitoring network.
We organized the identified DHEs into a database of 463 damage records in the SA for the period 1925–2025, organized at the municipal scale and monthly resolutions.
The results highlight the importance of integrating damage data from the literature with local documentary sources in order to obtain a more complete and spatially detailed catalogue of DHEs, including minor and localized cases that are often not recorded in official databases. Rainfall analysis showed that most DHEs were associated with moderate-rainfall-anomaly conditions and significant seasonal variability in the distribution of rainfall conditions associated with DHE occurrence. These results suggest that the proposed monthly rainfall indicator provides a useful first-order characterization of the rainfall conditions associated with DHE occurrence over long historical periods.
The introduction of the ISDE also provided a preliminary assessment of the relationship between rainfall conditions and the spatial extent of DHE impacts, highlighting that more widely affected areas are generally associated with moderate-to-strong-rainfall-anomaly conditions.
Although monthly precipitation indicators alone are insufficient to fully represent the triggering conditions for DHEs, they offer a complementary basis for large-scale historical screening and comparative analyses. Due to its simple and homogeneous formulation, the proposed approach may support the identification of critical periods and areas potentially prone to hydrogeological damage, contributing to risk assessment and mitigation strategies in contexts characterized by the limited availability of long-term data and in climatically similar areas.
Future developments could include comparisons with higher-temporal-resolution rainfall data and standardized precipitation indices in order to further evaluate the robustness and transferability of the proposed approach.