2.1. Study Area
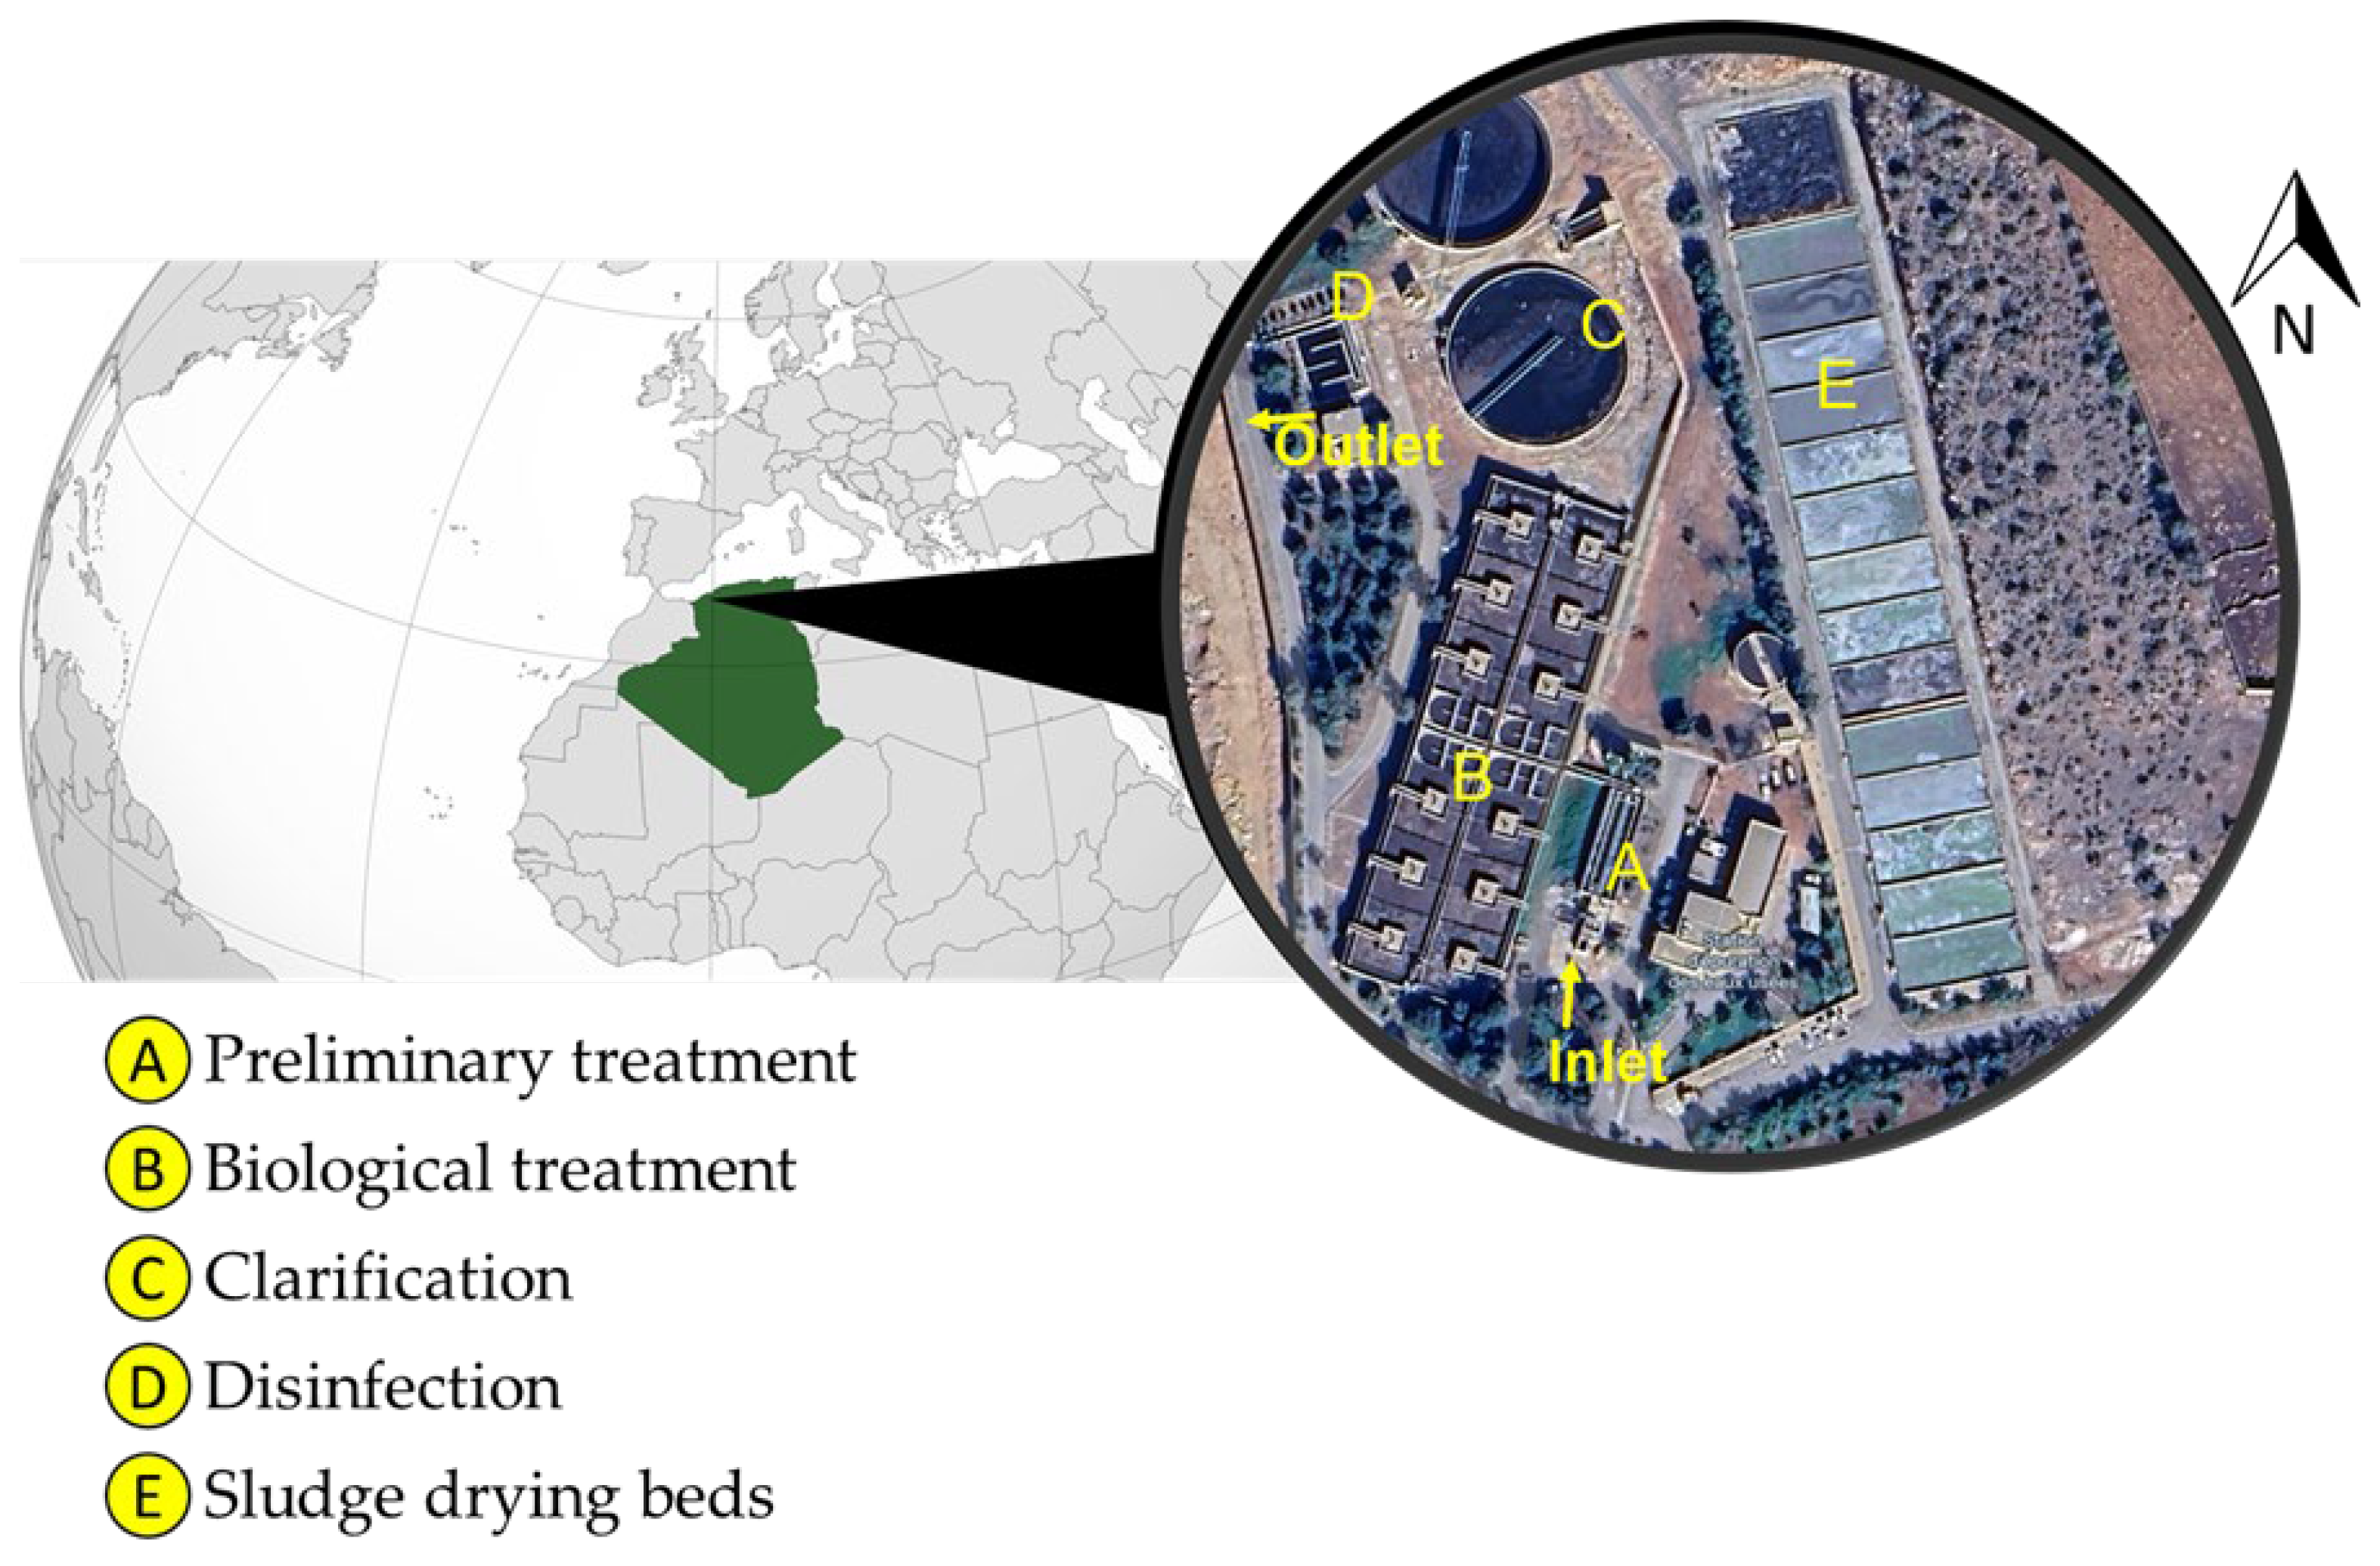
The subject of the study is the wastewater treatment plant (WWTP) of Ain El Houtz, which plays a crucial role in managing wastewater and domestic water for the Tlemcen region in Algeria. Operational since 2005, it is designed to treat up to 30,000 m
3 of wastewater per day, serving a population equivalent of 150,000 [
17]. This facility is a key component of the national sanitation system, contributing to the protection of water resources and the reduction in pollution in the area.
The WWTP is located approximately 6 km north of the city of Tlemcen, on the right bank of the watercourse Ain El Houtz, at the foot of the Jebel Touma (
Figure 1)
. It extends over an area of 13 hectares, in a peri-urban area subject to increasing pressures related to urbanization [
17].
The Ain El Houtz WWTP operates using a biologically activated sludge process with extended aeration. This system relies on the oxidation of organic matter by aerobic microorganisms, facilitated by low-speed surface aerators. Treatment begins with a mechanical stage comprising screening, grit removal, and oil extraction, aimed at eliminating coarse particles. The wastewater is then directed to aeration basins, where nitrification and denitrification phases take place. Secondary sedimentation ensures the separation of biological sludge, while final chlorination provides disinfection prior to discharge. The extracted sludge is thickened and subsequently dried on open-air beds. This process ensures high purification efficiency and compliance with regulatory discharge standards [
17].
2.2. Data Used
Seven physicochemical parameters were selected as input variables due to their essential role in evaluating the performance of the wastewater treatment plant. These parameters, including biological oxygen demand (BOD5) over five days, chemical oxygen demand (COD), dissolved oxygen concentration (O2), hydrogen potential (pH), nitrate (NO3−), phosphate (PO43−), and temperature, were measured from both influent and treated effluent samples. This dual sampling ensured a representative evaluation of the plant’s efficiency.
During each campaign, samples were collected simultaneously at the influent and effluent of the plant, with an average of 20 to 25 samples per campaign, depending on seasonal and operational conditions. Temperature, electrical conductivity, and pH were measured immediately after collection using HQ40D Portable Multi-Parameter Meters (Hach Company, Loveland, CO, USA), while other parameters, including BOD
5, COD, and nutrients, were analyzed according to the Standard Methods for the Examination of Water and Wastewater [
18]. Samples were preserved at 4 °C and transported to the laboratory within six hours to minimize degradation. Quality assurance procedures included duplicate samples, blanks, and regular calibration of instruments, ensuring rigorous and reliable evaluation of the WWTP’s performance.
To determine the relative importance of each parameter in assessing water quality, a structured questionnaire was submitted in March 2025 to a panel of 14 experts (university researchers, engineers from the National Sanitation Office, and water treatment specialists). Each expert assigned a percentage weight to the seven parameters, ensuring that the total sum equaled 100%. The values were aggregated and normalized to obtain final weights according to the formula:
where
2.3. Methodology
2.3.1. Fuzzy Logic Algorithm for Water Quality Evaluation
Assessing water quality is inherently complex due to the variability of physico-chemical parameters and the uncertainties associated with environmental data. Conventional indices often rely on fixed thresholds, which may oversimplify the gradual transitions observed in real systems. To overcome these limitations, a fuzzy logic–based algorithm was developed. This approach integrates expert knowledge with fuzzy set theory to provide a more flexible and nuanced evaluation of water quality. By considering parameters such as BOD
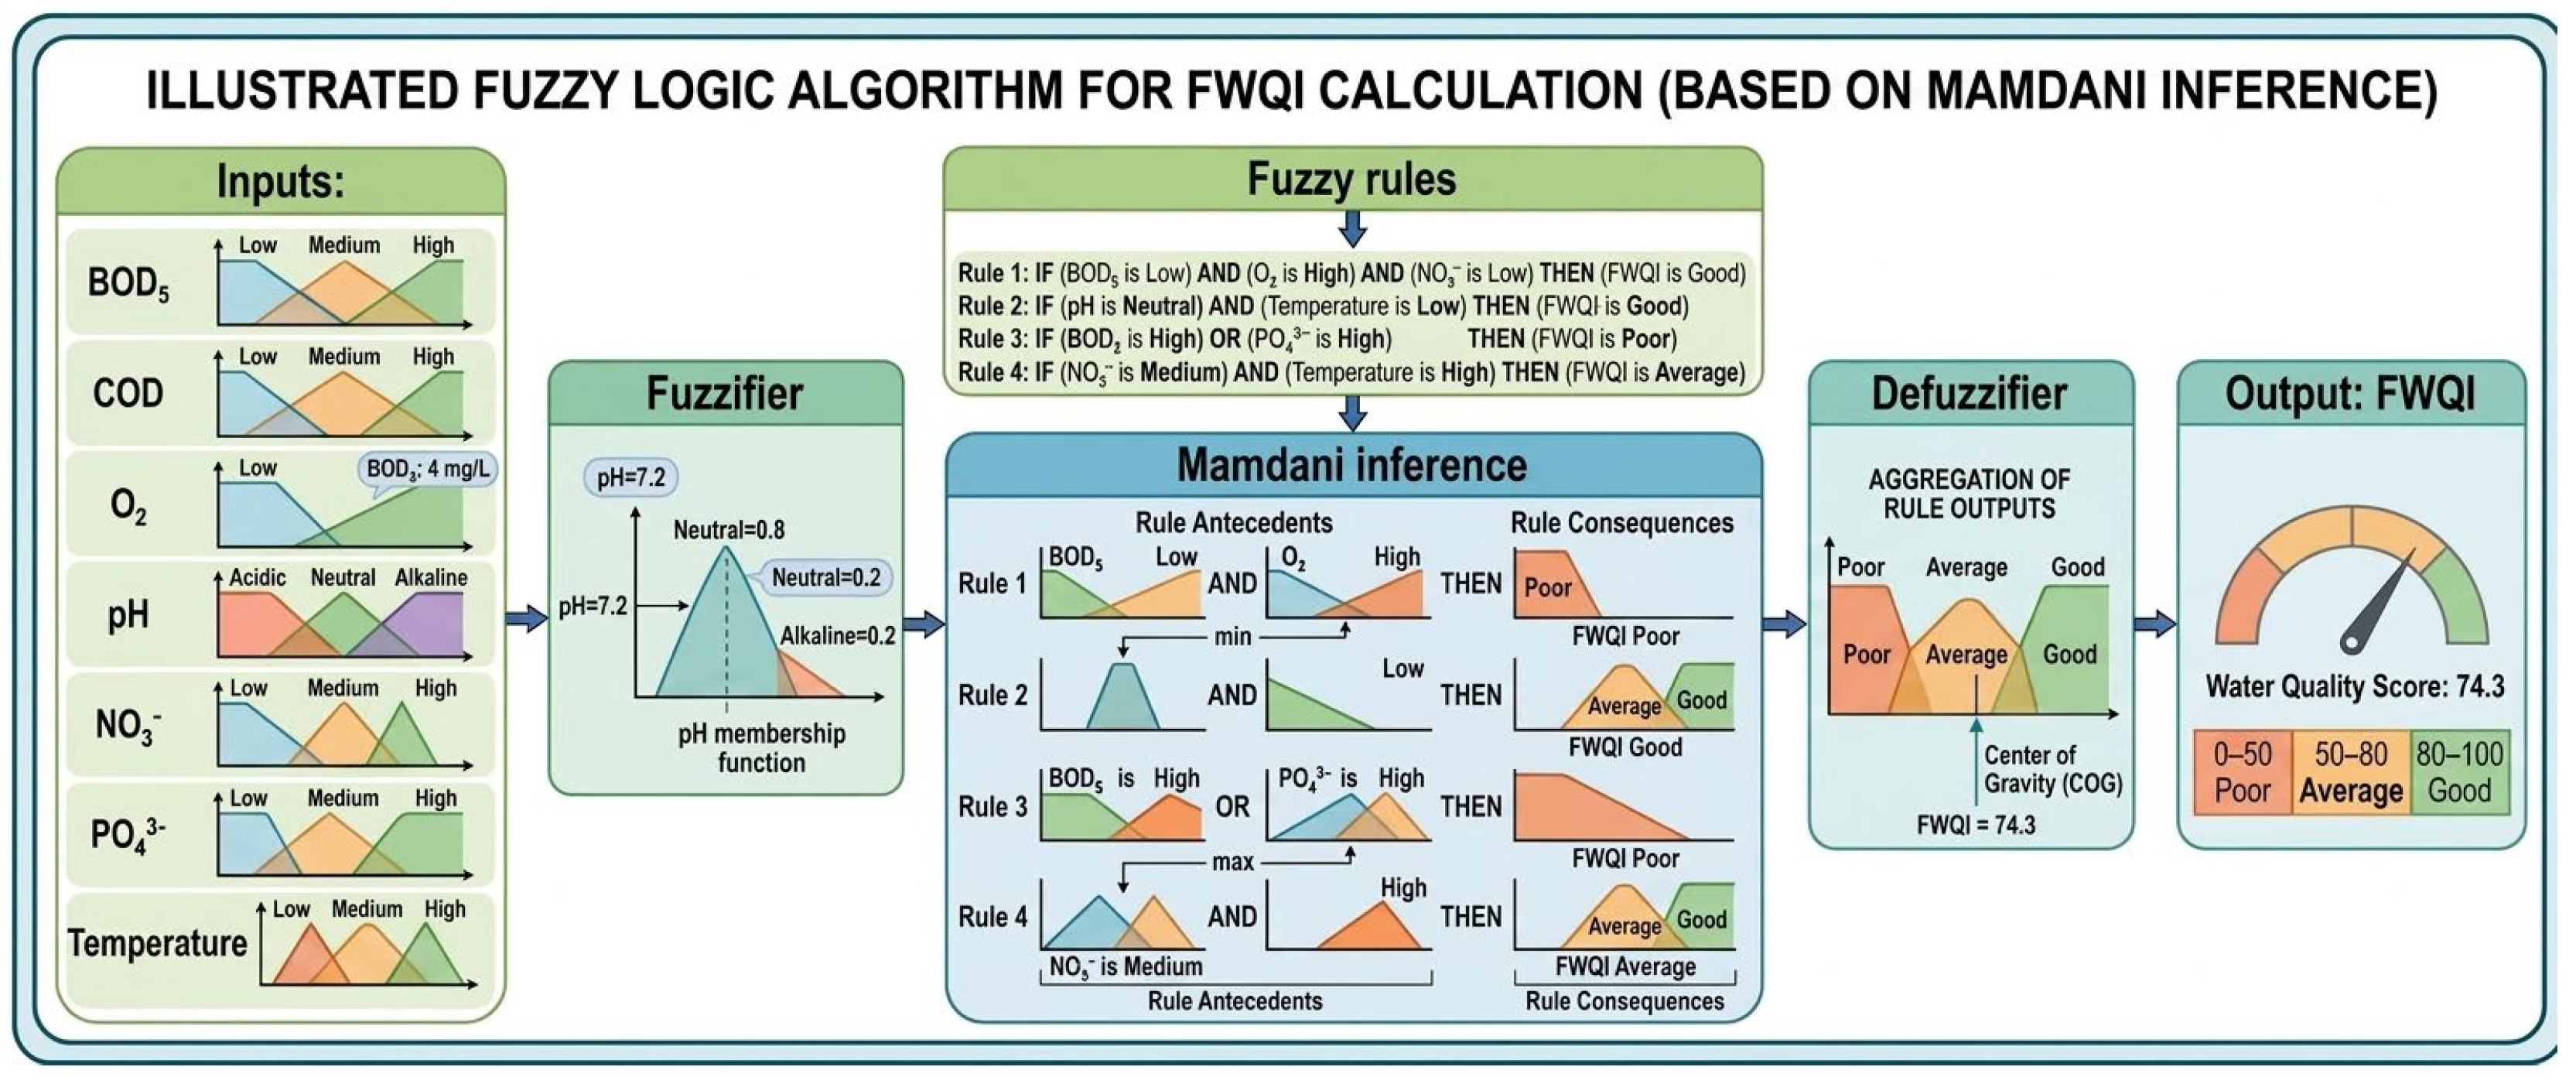
5, COD, pH, dissolved oxygen, and nutrients, the algorithm is capable of handling imprecision and variability, thereby producing a synthetic indicator that better reflects the actual state of the effluent. The overall structure of the fuzzy logic algorithm is illustrated in
Figure 2.
2.3.2. Selection of the Software Used
To evaluate the quality of treated wastewater using fuzzy logic, MATLAB (Matrix Laboratory) software (The MathWorks, Inc., Natick, MA, USA) version R2024a was selected. This choice is justified by its ability to process complex information, model non-linear systems, and integrate specialized tools for fuzzy-logic applications [
19].
MATLAB is widely recognized for its robustness and flexibility in engineering, environmental sciences, and applied research. Among its features, the Fuzzy Logic Toolbox
TM enables the design, simulation, and optimization of fuzzy systems based on linguistic rules, membership functions, and inference matrices [
20]. This toolbox provides both computational efficiency and visual tools that are essential for interpretation and decision-making.
Several studies have confirmed the relevance of MATLAB for wastewater treatment applications. For example, ref. [
19] developed a fuzzy logic controller in MATLAB to regulate a wastewater treatment plant, achieving improved purification performance and operational stability. Similarly, ref. [
8] applied fuzzy logic models to evaluate water quality, demonstrating the robustness of MATLAB in handling complex environmental data. Such evidence supports the suitability of MATLAB for implementing the fuzzy inference system in this study [
8,
19,
20]. All simulations in this study were performed using MATLAB R2024a with the Fuzzy Logic Toolbox.
2.3.3. Construction of the Fuzzy System
The evaluation of treated wastewater quality was carried out using a Mamdani-type fuzzy inference system, developed in MATLAB with the Fuzzy Logic ToolboxTM. This system is based on three fundamental steps:
Fuzzification of input parameters: transformation of numerical values (BOD5, COD, dissolved O2, pH, NO3−, PO43−, temperature) into degrees of membership to linguistic categories (“Good,” “Average,” “Bad”).
Application of linguistic rules: construction of a set of IF… THEN… rules that translate the interactions between parameters and overall water quality. Example: If BOD5 is bad AND O2 is low → Water quality is bad.
Defuzzification of the output: conversion of fuzzy results into a single numerical value of the FWQI, obtained using the centroid method, recognized for its robustness in environmental applications [
21,
22].
This approach effectively manages the uncertainties inherent in environmental data while producing a synthetic water quality index (FWQI) that is more flexible and interpretable than conventional methods [
23,
24]. Similar applications have demonstrated the relevance of fuzzy logic in complex and variable environments, notably in the field of industrial water treatment [
25].
2.3.4. Triangular Membership Functions
Traditional water quality indices, while useful, present limitations in terms of flexibility and uncertainty management [
5,
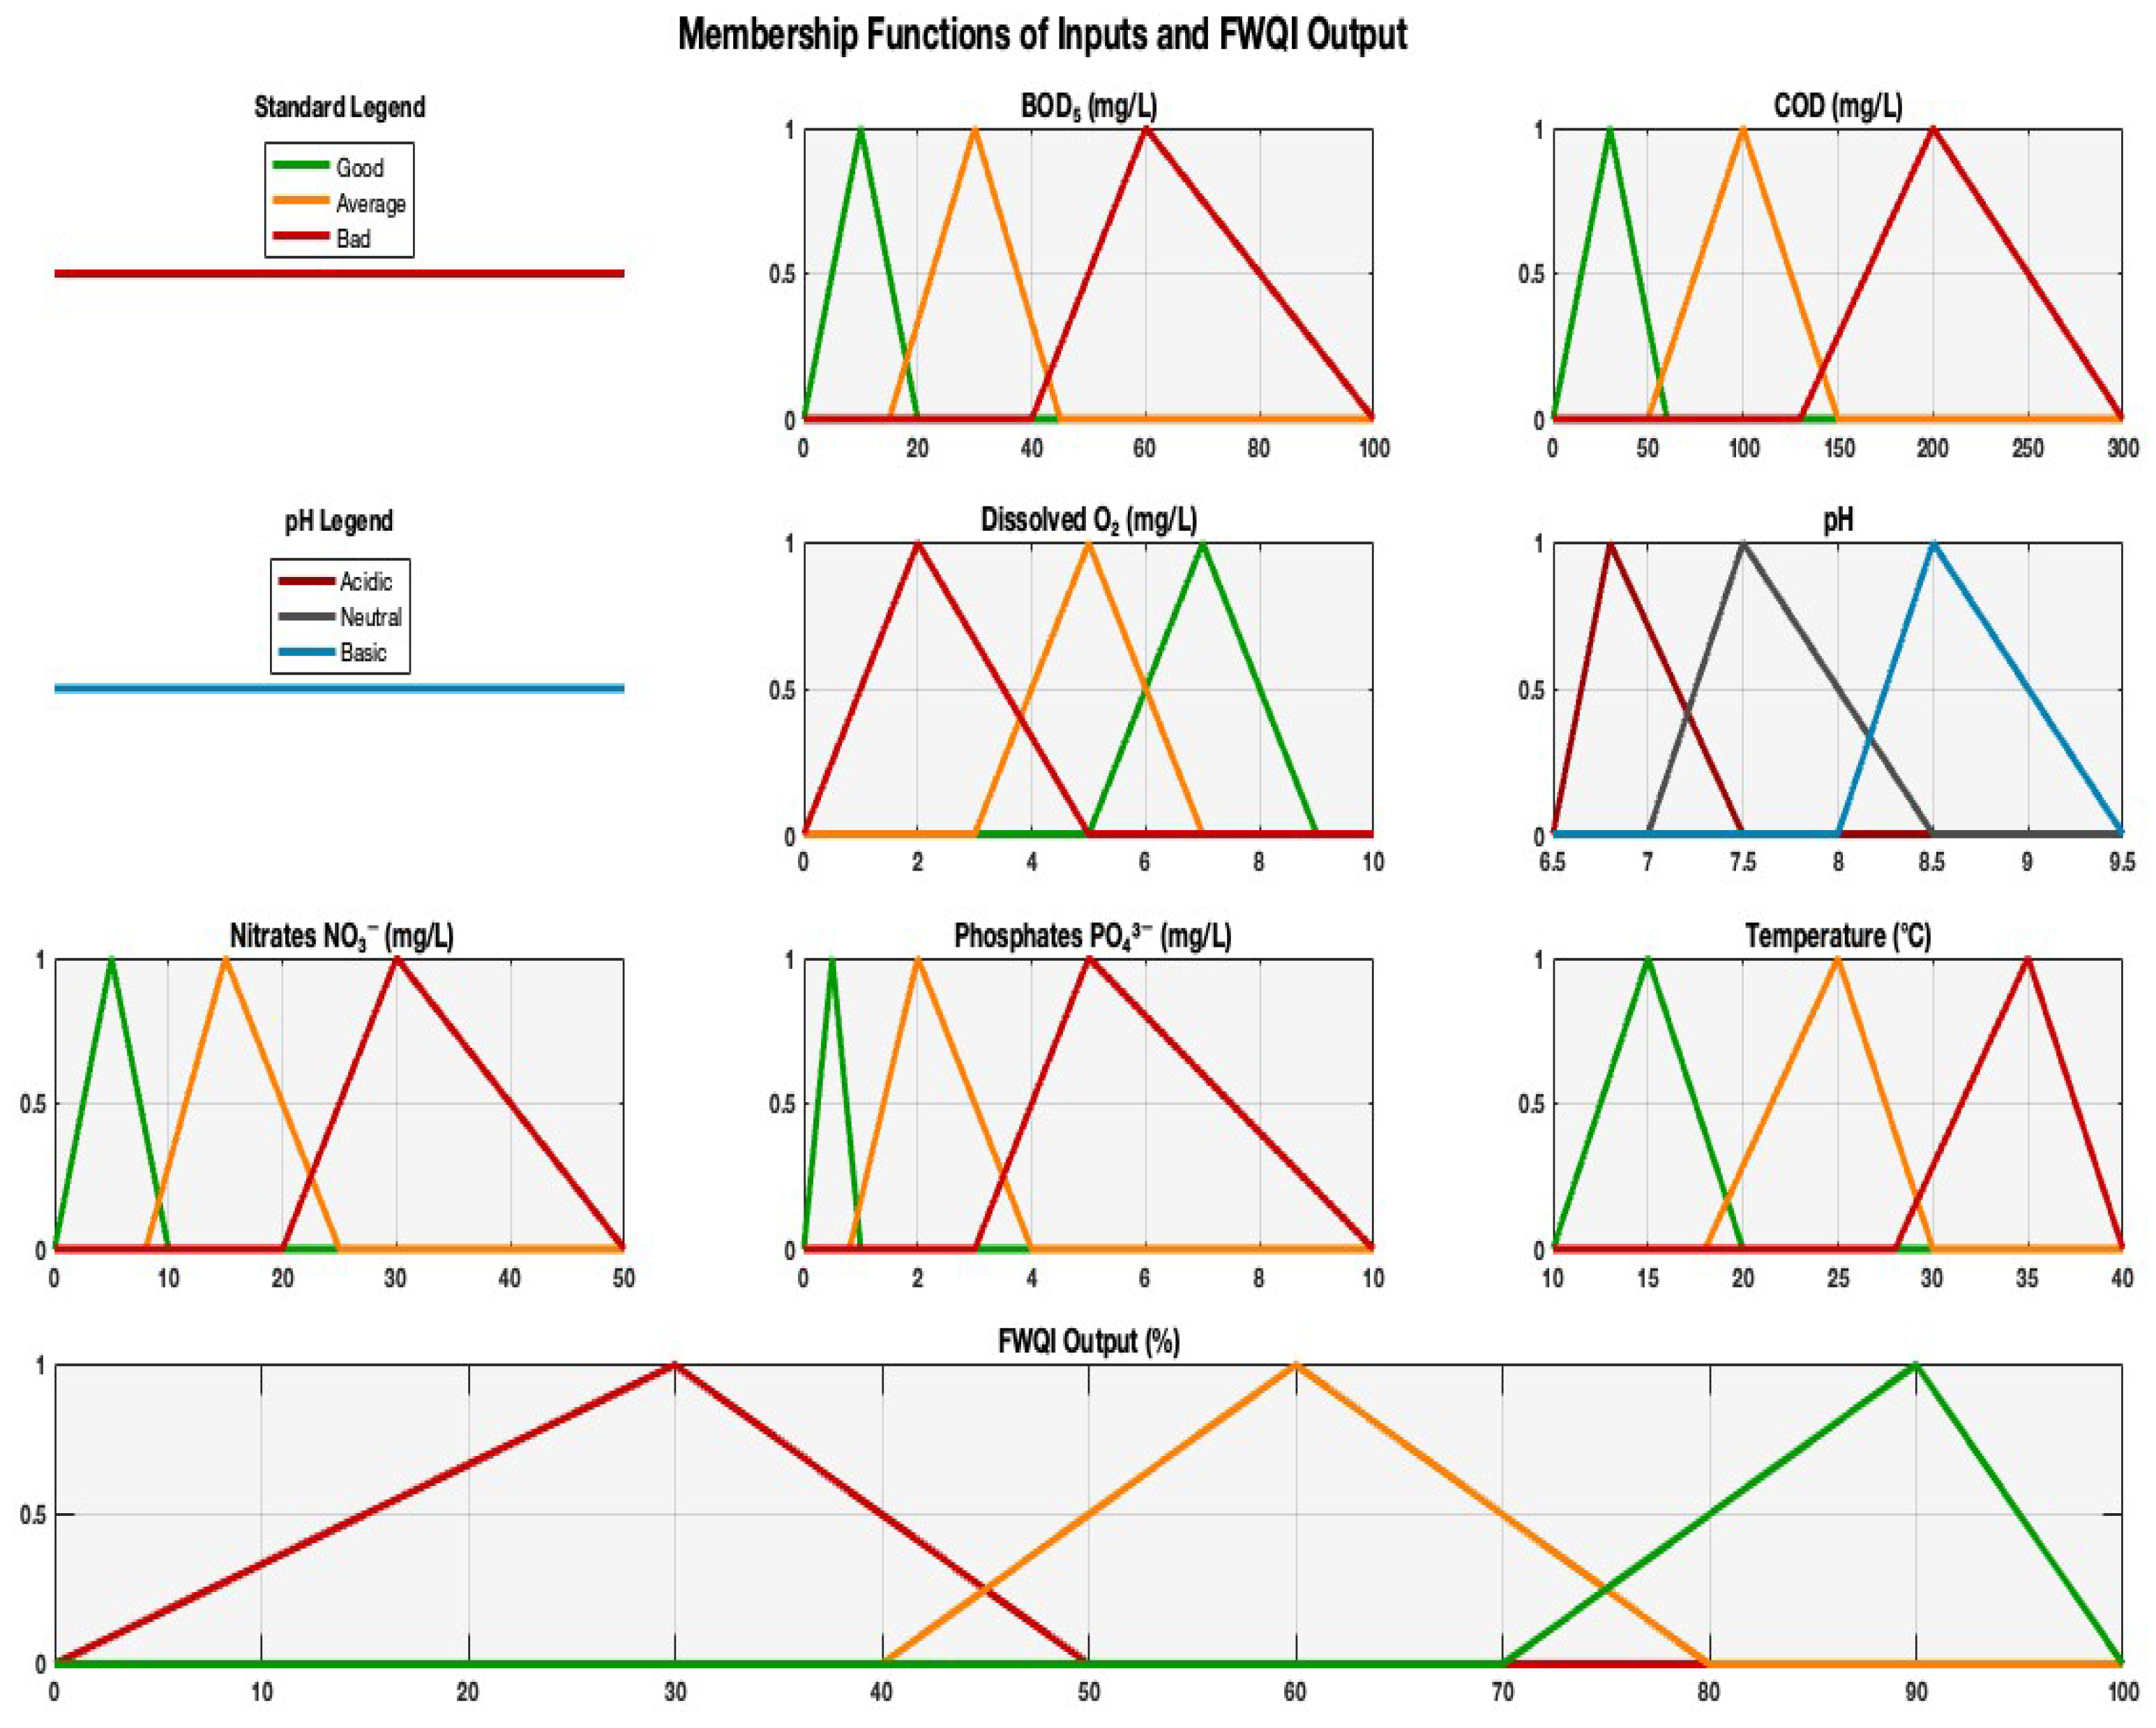
26]. To address this, the present model adopts triangular membership functions, which allow the gradual transitions between quality classes (“Good,” “Average,” “Bad”) to be represented [
7].
Each function is defined by three points:
a: minimum value (μ = 0),
b: central value (μ = 1),
c: maximum value (μ = 0).
This structure avoids abrupt breaks between classes and enables a more realistic assessment of environmental parameters. The thresholds were defined by combining Algerian and international standards for wastewater reuse with calibration based on the actual dataset distribution (mean, standard deviation, and range). This dual approach ensures that the fuzzy sets remain aligned with regulatory requirements while accurately reflecting the empirical variability observed at the Ain El Houtz WWTP.
The parameters a, b, and c of the triangular membership functions for the input variables are presented in
Table 1, while those for the output variable (FWQI) are shown in
Table 2 (values adapted from fuzzy logic conventions in water quality assessment [
21,
22,
27].
The corresponding curves have been generated in MATLAB for ease of interpretation. They express each measured value as a degree of membership in the relevant fuzzy set.
The data in
Table 1 and
Table 2 are operated according to the following formula to plot these functions:
where:
a, b, c = Category thresholds
μ(x) = Degree of membership in a category (0 to 1)
This step prepares the data for fuzzification by converting the measured digital values into fuzzy values that are usable by the inference system [
28,
29].
2.3.5. Sensitivity Analysis
The sensitivity analysis was carried out to test the robustness of the fuzzy model. Two aspects were evaluated:
The weights assigned to the parameters were modified by ±10% to account for expert uncertainty in parameter weighting, following common practice in fuzzy water quality index studies [
20]. This tolerance margin reflects the typical range of variability observed in expert-based assessments and ensures robustness of the FWQI model.
Baseline (BOD5 = 25%) → FWQI = 72.8
BOD5 increased (+10%, i.e., 27.5%) → FWQI = 72.1
BOD5 decreased (–10%, i.e., 22.5%) → FWQI = 73.4
The maximum deviation observed was ±0.7 points (≈±1%), confirming that the FWQI is stable with respect to weight variations.
Triangular membership functions were compared with trapezoidal and Gaussian forms. Example for COD = 64 mg/L and O2 = 4.78 mg/L:
The differences remained below 1%, with no change in the final classification of water quality.
2.3.6. Fuzzification of Data
Fuzzification is a key step in the system of fuzzy inference. It is to transform the numerical values measured for each parameter into degrees of belonging to linguistic categories that are predefined, such as “Good”, “Average”, or “Bad”. This operation enables the representation of the environmental data in a form that is fuzzy, more adapted to the natural variability and uncertainty of real-world systems.
The conversion is done with the help of the previously defined triangular membership functions. These functions are characterized by three points:
The degree of membership μ(x) of a value x in a category is calculated according to the following formulas:
If x ∈ [a, b] (a branch growing):
If x ∈ [b, c] (a branch descending):
This method is applied to each of the seven input parameters of the model (BOD5, COD, O2, pH, NO3−, PO43−, Temperature). It allows for converting each measured value representation, fuzzy, which will then be used in the inference engine to evaluate the overall quality of the water.
2.3.7. Inference Rules
The fuzzy system is based on a set of linguistic rules of the type “If... Then...”, constructed from the technical expertise and known interactions between the parameters of water quality. These rules are used to connect the input fuzzy output fuzzy representing the global state of the resource.
The following rules were used in the fuzzy inference system:
Rule 1—Health Hazard (Critical Organic Pollution)
Rule 2—Proper Operation of the Treatment Plant
Rule 3—Oxygenation Problem
If O2 is Very Low (bad)
Then WQ is Bad
Rule 4—Intermediate Situation
Rule 5—Good Organic Load but Average Oxygenation
Rule 6—Average Organic Load but Good Oxygen and Nitrates
Rule 7—Good Basic Conditions (other parameters ignored)
If BOD5, COD, O2, and NO3− are Good, Then WQ is Good (even if pH, PO43−, or Temperature are bad)
Rule 8—Acidic condition with oxygen deficiency
Rule 9—Alkaline imbalance with moderate organic load
Rule 10—Phosphate overload with bad organic removal
Rule 11—Moderate nitrate with average organic load
Rule 12—Temperature stress with oxygen deficiency
Rule 13—Balanced nutrients with average organic load
Rule 14—Acceptable phosphate with good organic removal
Rule 15—Combined stress condition
The activation of the rules is based on the logical operator of the minimum (min)
, consistent with the approach of Mamdani, widely used to model complex and uncertain systems [
30]. The aggregation of active rules is then given by the superposition of the outputs blurred, allowing a coherent synthesis of the results.
This method has been validated in several studies, including [
27], who proposed a model for evaluating fuzzy on the quality of surface waters, and [
23], who demonstrated the effectiveness of a system of fuzzy inference for the assessment of groundwater resources.
The fuzzy rule base incorporates uncertainty by allowing gradual transitions between classes rather than rigid thresholds. This design reduces the impact of measurement variability and parameter fluctuations, ensuring that borderline values are treated more consistently.
2.3.8. Defuzzification
Defuzzification is the last step in the fuzzy system. It allows for converting the output fuzzy aggregated into a single, easily interpretable numeric value. The method used is that of the center of gravity (centroid), recognized for its robustness in environmental applications [
21,
22].
The formula used is:
where:
yi: discrete value of the output variable
μ(yi): degree of membership of yi
n: number of points considered
This method allows for obtaining a final index (FWQI) between 0 and 100, reflecting the overall quality of the treated water.
For comparative validation purposes, the classical Water Quality Index (WQI) was calculated using the weighted arithmetic method. Each parameter
Pi (BOD
5, COD, O
2, pH, NO
3−, PO
43−, temperature) was normalized against its standard value
Si, then multiplied by a relative weight
Wi reflecting its environmental importance. The WQI was obtained by aggregation according to the formula:
where
Qi is the relative quality of parameter
i, calculated as:
WQI → Water Quality Index (final score, 0–100).
i → Index representing each parameter included in the calculation (e.g., BOD5, COD, O2, pH, NO3−, PO43−, temperature).
Wi → Weight assigned to parameter i (reflects its relative importance in water quality assessment).
Qi → Quality rating of parameter i, expressed as a percentage relative to its standard.
Ci → Measured concentration of parameter i in the effluent.
Si → Standard permissible value (regulatory or guideline threshold) for parameter i.
∑(Wi·Qi) → Weighted sum of all parameter quality ratings.
∑Wi → Sum of all weights (normally equal to 1 or 100%).
The conventional classification categories are: Excellent (90–100), Good (70–90), Fair (50–70), and Bad (<50). As an illustration, for the year 2021, the measured values yielded a WQI ≈ 55, classifying the effluent as ‘Fair.’ This result allows a direct comparison with the FWQI, which gave ≈ 50% (class ‘Average’), but with increased sensitivity to borderline conditions. The detailed comparative results are presented in
Section 3.5.
2.3.9. Temporal and Seasonal Assessment Methodology
In addition to the overall FWQI calculation, analyses were conducted at three time intervals: annual, seasonal, and monthly. For the seasonal evaluation, FWQI values were calculated separately for the dry season (May–October) and the wet season (November–April) in order to capture the influence of climatic variations, such as rainfall, dilution, and temperature, on the performance of the WWTP. This methodological distinction ensures coherence with the subsequent results in
Section 3.4, where annual, seasonal, and monthly FWQI values are analyzed.
Furthermore, the methodology explicitly considered the need to separate environmental variability from systemic malfunction. Climatic factors (temperature, rainfall, dilution) were assessed through seasonal FWQI comparisons, while persistent deviations across consecutive months, independent of seasonal trends, were interpreted as indicators of operational malfunction. Since the Ain El Houtz WWTP does not receive significant industrial discharges, influent variability is primarily linked to stormwater inflows, which dilute and alter wastewater composition during rainfall events. This framework ensures that, when performance degradation is observed, it can be attributed to either external environmental drivers or to internal technical failures of the WWTP, providing a coherent basis for interpretation in the results and discussion sections.





 ,
,