1. Introduction
Antimicrobial resistance (AMR) is increasingly recognized as one of the leading global health threats of the 21st century. A recent global burden analysis revealed 4.71 million deaths associated with bacterial AMR worldwide in 2021, with carbapenem-resistant and third-generation cephalosporin-resistant Gram-negative pathogens contributing disproportionately to mortality [
1]. The updated 2024 World Health Organization Bacterial Priority Pathogens List further highlights carbapenem-resistant
Acinetobacter baumannii,
Klebsiella pneumoniae, and third-generation cephalosporin-resistant
Enterobacteriaceae as critical priority targets that require coordinated surveillance and intervention [
2]. As clinical and community antibiotic consumption drives resistance gene flow into environmental matrices, environmental surveillance—particularly of high-risk wastewater nodes—has emerged as an indispensable complement to clinical surveillance for One Health–framed AMR control [
3].
Hospital wastewater receives patient excreta, residual antibiotics, disinfectants, and heavy metals derived from pharmaceutical products and is therefore recognized as a critical node for the environmental dissemination of antibiotic resistance genes (ARGs) and antibiotic-resistant bacteria [
4,
5]. A global meta-analysis integrating 338 hospital wastewater metagenomes from 13 countries revealed 2420 ARG subtypes and significant co-occurrences between ARGs and mobile genetic elements (MGEs), metal resistance genes (MRGs), and human pathogens [
4]. In Wales, the first national-scale metagenomic survey of hospital wastewater revealed the widespread occurrence of “big five” carbapenemases (KPC, IMP, VIM, NDM, and OXA-48-like) and mcr gene variants, with antibiotic concentrations in the effluent exceeding risk quotients for the emergence of antimicrobial resistance [
6]. Collectively, these studies establish hospital wastewater as a high-risk environmental matrix for resistance dissemination.
Despite this recognition, most existing studies have assessed the difference in resistance risk between hospital wastewater influent and effluent solely on the basis of changes in total ARG abundance. A metagenomic analysis of 12 international wastewater treatment plants revealed that although the relative abundance of ARGs decreased following treatment at 11 of the 12 facilities, approximately 40% of the ARG subtypes were enriched rather than removed at specific plants, demonstrating that the treatment response of ARGs is highly heterogeneous at the subtype level [
7]. A study of two large-scale wastewater treatment plants in Moscow similarly confirmed that the removal efficiency of individual ARG subtypes varied with treatment technology and that the chromosomally encoded ampC beta-lactamase became the most abundant ARG type in the treated effluent [
8]. Furthermore, metagenomic analysis of river sediments downstream of wastewater treatment plant outfalls revealed that 38.4% of metagenome-assembled genomes simultaneously harbored both ARGs and virulence factor genes (VFGs), indicating that monitoring ARG abundance alone fails to capture the true risk posed by the co-occurrence of resistance and virulence within the same organisms [
9].
With respect to the horizontal transfer of ARGs, an analysis of 165 wastewater metagenomes revealed that 10.26% of detected ARGs were located on MGEs and that a single
Escherichia coli metagenome-assembled genome simultaneously carried 159 virulence factor genes, of which 95 were located on chromosomes and 10 on plasmids [
10]. Laboratory-scale experiments have provided direct evidence that fluctuating antibiotic concentrations in wastewater can drive the horizontal gene transfer of ARGs [
11]. However, these studies have focused primarily on the horizontal transfer risk mediated by plasmids and MGEs, with limited attention given to the fate of genes encoding chromosomal resistance and virulence factors during the wastewater treatment process. Chromosomally encoded functional genes are stably inherited through vertical transmission during host cell replication, do not depend on active horizontal transfer mechanisms such as plasmid conjugation and are not subject to elimination through the loss of plasmid metabolic burden when selective pressure is relieved; consequently, they may represent a more persistent and difficult-to-eliminate resistance risk. In addition, the co-occurrence of antibiotics, heavy metals, and disinfectants in hospital wastewater can drive the coselection of ARGs, MRGs, and biocide resistance genes (BRGs) through three genetic mechanisms: coresistance, cross-resistance, and coregulation [
12]. The significant positive correlation between total ARG and MRG abundances observed in wastewater systems globally further supports the widespread occurrence of such coselection [
13]. However, whether this coselection leads to the simultaneous enrichment of multiple resistance and virulence gene categories within specific pathogenic species in the effluent has not been systematically investigated.
In summary, existing studies on hospital wastewater have primarily assessed ARG abundance changes between influent and effluent, with limited simultaneous consideration of MRGs, VFs, BRGs, MGEs, the chromosomal versus plasmid distribution of functional genes, and pathogen-level cocarriage patterns. To address these gaps, we conducted a one-year longitudinal metagenomic survey of a hospital wastewater treatment system (bimonthly sampling; six time points; n = 18 per group) and systematically compared the resistome, virulome, mobilome, genomic context, and pathogen-associated cocarriage profiles between the influent and effluent. The objective was to determine whether the resistance risk profile of hospital wastewater effluent differs from that of influent not only in terms of total abundance but also in terms of composition, genetic stability, and pathogen distribution.
2. Materials and Methods
2.1. Study Site and Sample Collection
Influent (INF) and effluent (EFF) samples were collected from a single hospital wastewater treatment system over a one-year monitoring period at six bimonthly time points (T1–T6), with three biological replicates per group per time point (n = 18 per group; 36 samples total). At each sampling event, one liter of wastewater was filtered through a 0.22 μm polycarbonate membrane to collect the microbial biomass. The filters were immediately frozen and stored at −80 °C until DNA extraction.
2.2. DNA Extraction and Metagenomic Sequencing
Total metagenomic DNA was extracted from the filters using the QIAamp PowerFecal Pro DNA Kit (Qiagen, Hilden, Germany) following the manufacturer’s protocol. DNA concentration and integrity were assessed by fluorometry (Qubit 4.0; Thermo Fisher Scientific, Waltham, MA, USA) and agarose gel electrophoresis. Paired-end sequencing libraries (2 × 150 bp) were prepared and sequenced on the Illumina NovaSeq platform. Raw sequencing reads were quality-filtered using Fastp (v0.23.2) with the following parameters: adapter trimming, removal of reads with a mean quality score below 20, and removal of reads shorter than 50 bp after trimming. Host contamination was removed by aligning quality-filtered reads to the human reference genome (GRCh38) using Bowtie2 (v2.4.5); unaligned reads were retained for downstream analysis.
2.3. Microbial Community Analysis
Read-based taxonomic classification was performed using Kraken2 (v2.1.2) against a database constructed from NCBI RefSeq complete bacterial, archaeal, and viral genomes. Species-level relative abundances were re-estimated using Bracken (v2.7), with a read length of 150 bp and a minimum read threshold of 10 reads per taxon. Alpha diversity indices, including observed species richness, the Shannon diversity index, the Chao1 richness estimator, and Pielou’s evenness, were calculated using the vegan package (v2.6) in R (v4.3). Beta diversity was assessed on the basis of Bray-Curtis dissimilarity and visualized by principal coordinate analysis (PCoA). Differences in community composition between INF and EFF were tested by PERMANOVA with 999 permutations using the adonis2 function in vegan. Pairwise alpha diversity comparisons were performed using the Wilcoxon rank-sum test.
2.4. Metagenomic Assembly and Gene Prediction
Quality-filtered, host-depleted reads were assembled de novo using MEGAHIT (v1.2.9) with default parameters. Contigs shorter than 1 kbp were discarded. Open reading frames (ORFs) on retained contigs were predicted using Prodigal (v2.6.3) in metagenomic mode (p meta). Across the 36 samples, sequencing yielded a mean of 76.76 ± 7.23 million clean paired-end reads per sample (range: 65.05–89.85 million), corresponding to a mean of 11.48 ± 1.08 Gb of high-quality bases per sample (range: 9.73–13.44 Gb) and a total of 413.2 Gb across the dataset. The mean Q20 and Q30 scores were 99.15 ± 0.07% and 98.34 ± 0.12%, respectively, with a mean sequencing error rate of 0.0195 ± 0.0003% and a mean GC content of 48.78 ± 2.00%, confirming high-quality sequencing p-value.
2.5. Functional Gene Annotation
The predicted protein sequences were aligned against four reference databases using DIAMOND BLASTP (v2.1.8; e-value ≤ 1 × 10⁻⁵, query coverage ≥ 40%, amino acid identity ≥ 70%): (i) SARG v3.2 for strict antibiotic resistance genes (SARGs), classified by antibiotic type and resistance mechanism; (ii) VFDB (2024 release) for virulence factor genes (VFs); (iii) BacMet v2.0 experimentally confirmed gene set for biocide resistance genes (BRGs); and (iv) BacMet v2.0 for metal resistance genes (MRGs), covering resistance to 23 metal compounds. Mobile genetic elements (MGEs) were annotated by BLASTn alignment (e-value ≤ 1 × 10⁻⁵, coverage ≥ 40%, identity ≥ 70%) against the MobileGeneticElements database, which comprises 278 gene families and more than 2000 reference sequences. MGEs are classified into five subtypes: transposases, integrases, insertion sequence (IS) elements, IST elements, and plasmid-associated elements. Each contig was assigned to a single best-hit annotation per database on the basis of the highest bit score.
2.6. Abundance Quantification
The functional gene abundance is expressed as the coverage normalized to the sequencing depth (copies per Gb, copies/Gb). This metric represents a sequencing-depth–normalized relative abundance, reflecting the proportional representation of a target gene within the sequenced metagenome rather than the absolute concentration in the original environmental sample. Quality-filtered reads were mapped back to annotated gene sequences using Bowtie2 in end-to-end alignment mode. Abundance was calculated as follows:
where
is the number of reads mapped to the target gene,
is the read length (150 bp),
is the reference gene length,
is the number of genes belonging to the same subtype, and
is the sequencing dataset size in Gb. Contig-level abundance was calculated using an analogous formula with contig length substituted for
.
2.7. Taxonomic Annotation of Resistance Gene-Carrying Contigs and Pathogen Identification
ORF protein sequences on each contig were searched against the NCBI RefSeq nonredundant protein database using BLASTP (e-value ≤ 1 × 10⁻⁵). Taxonomic assignment was performed using MEGAN v6 with the lowest common ancestor (LCA) algorithm: a contig was assigned to a taxon if more than 50% of its ORFs were annotated to the same taxonomic unit. Putative plasmid sequences were predicted using PlasFlow (v1.1) with default parameters. Notably, PlasFlow-based classification is a computational prediction method based on pentamer frequency signatures and may misassign (i) fragmented short-read contigs lacking sufficient contextual information, (ii) chromosomally integrated mobile elements that retain plasmid-like sequence features, and (iii) novel plasmid lineages underrepresented in the training data. The results derived from this classification should therefore be interpreted as prediction-based signals rather than experimentally confirmed assignments. Pathogenic species were identified by cross-referencing contig-level species annotations against a curated list of 1005 human bacterial pathogens compiled from published literature. The 15 most abundant pathogenic species according to total contig count were selected for downstream co-occurrence analysis. Notably, this matching was performed at the species level; because contig-level taxonomic assignment cannot distinguish pathogenic strains from commensal or environmental strains within the same species, the resulting taxa are best interpreted as “species containing pathogenic strains” rather than as confirmed clinical pathogens.
2.8. ARG Colocalization Analysis
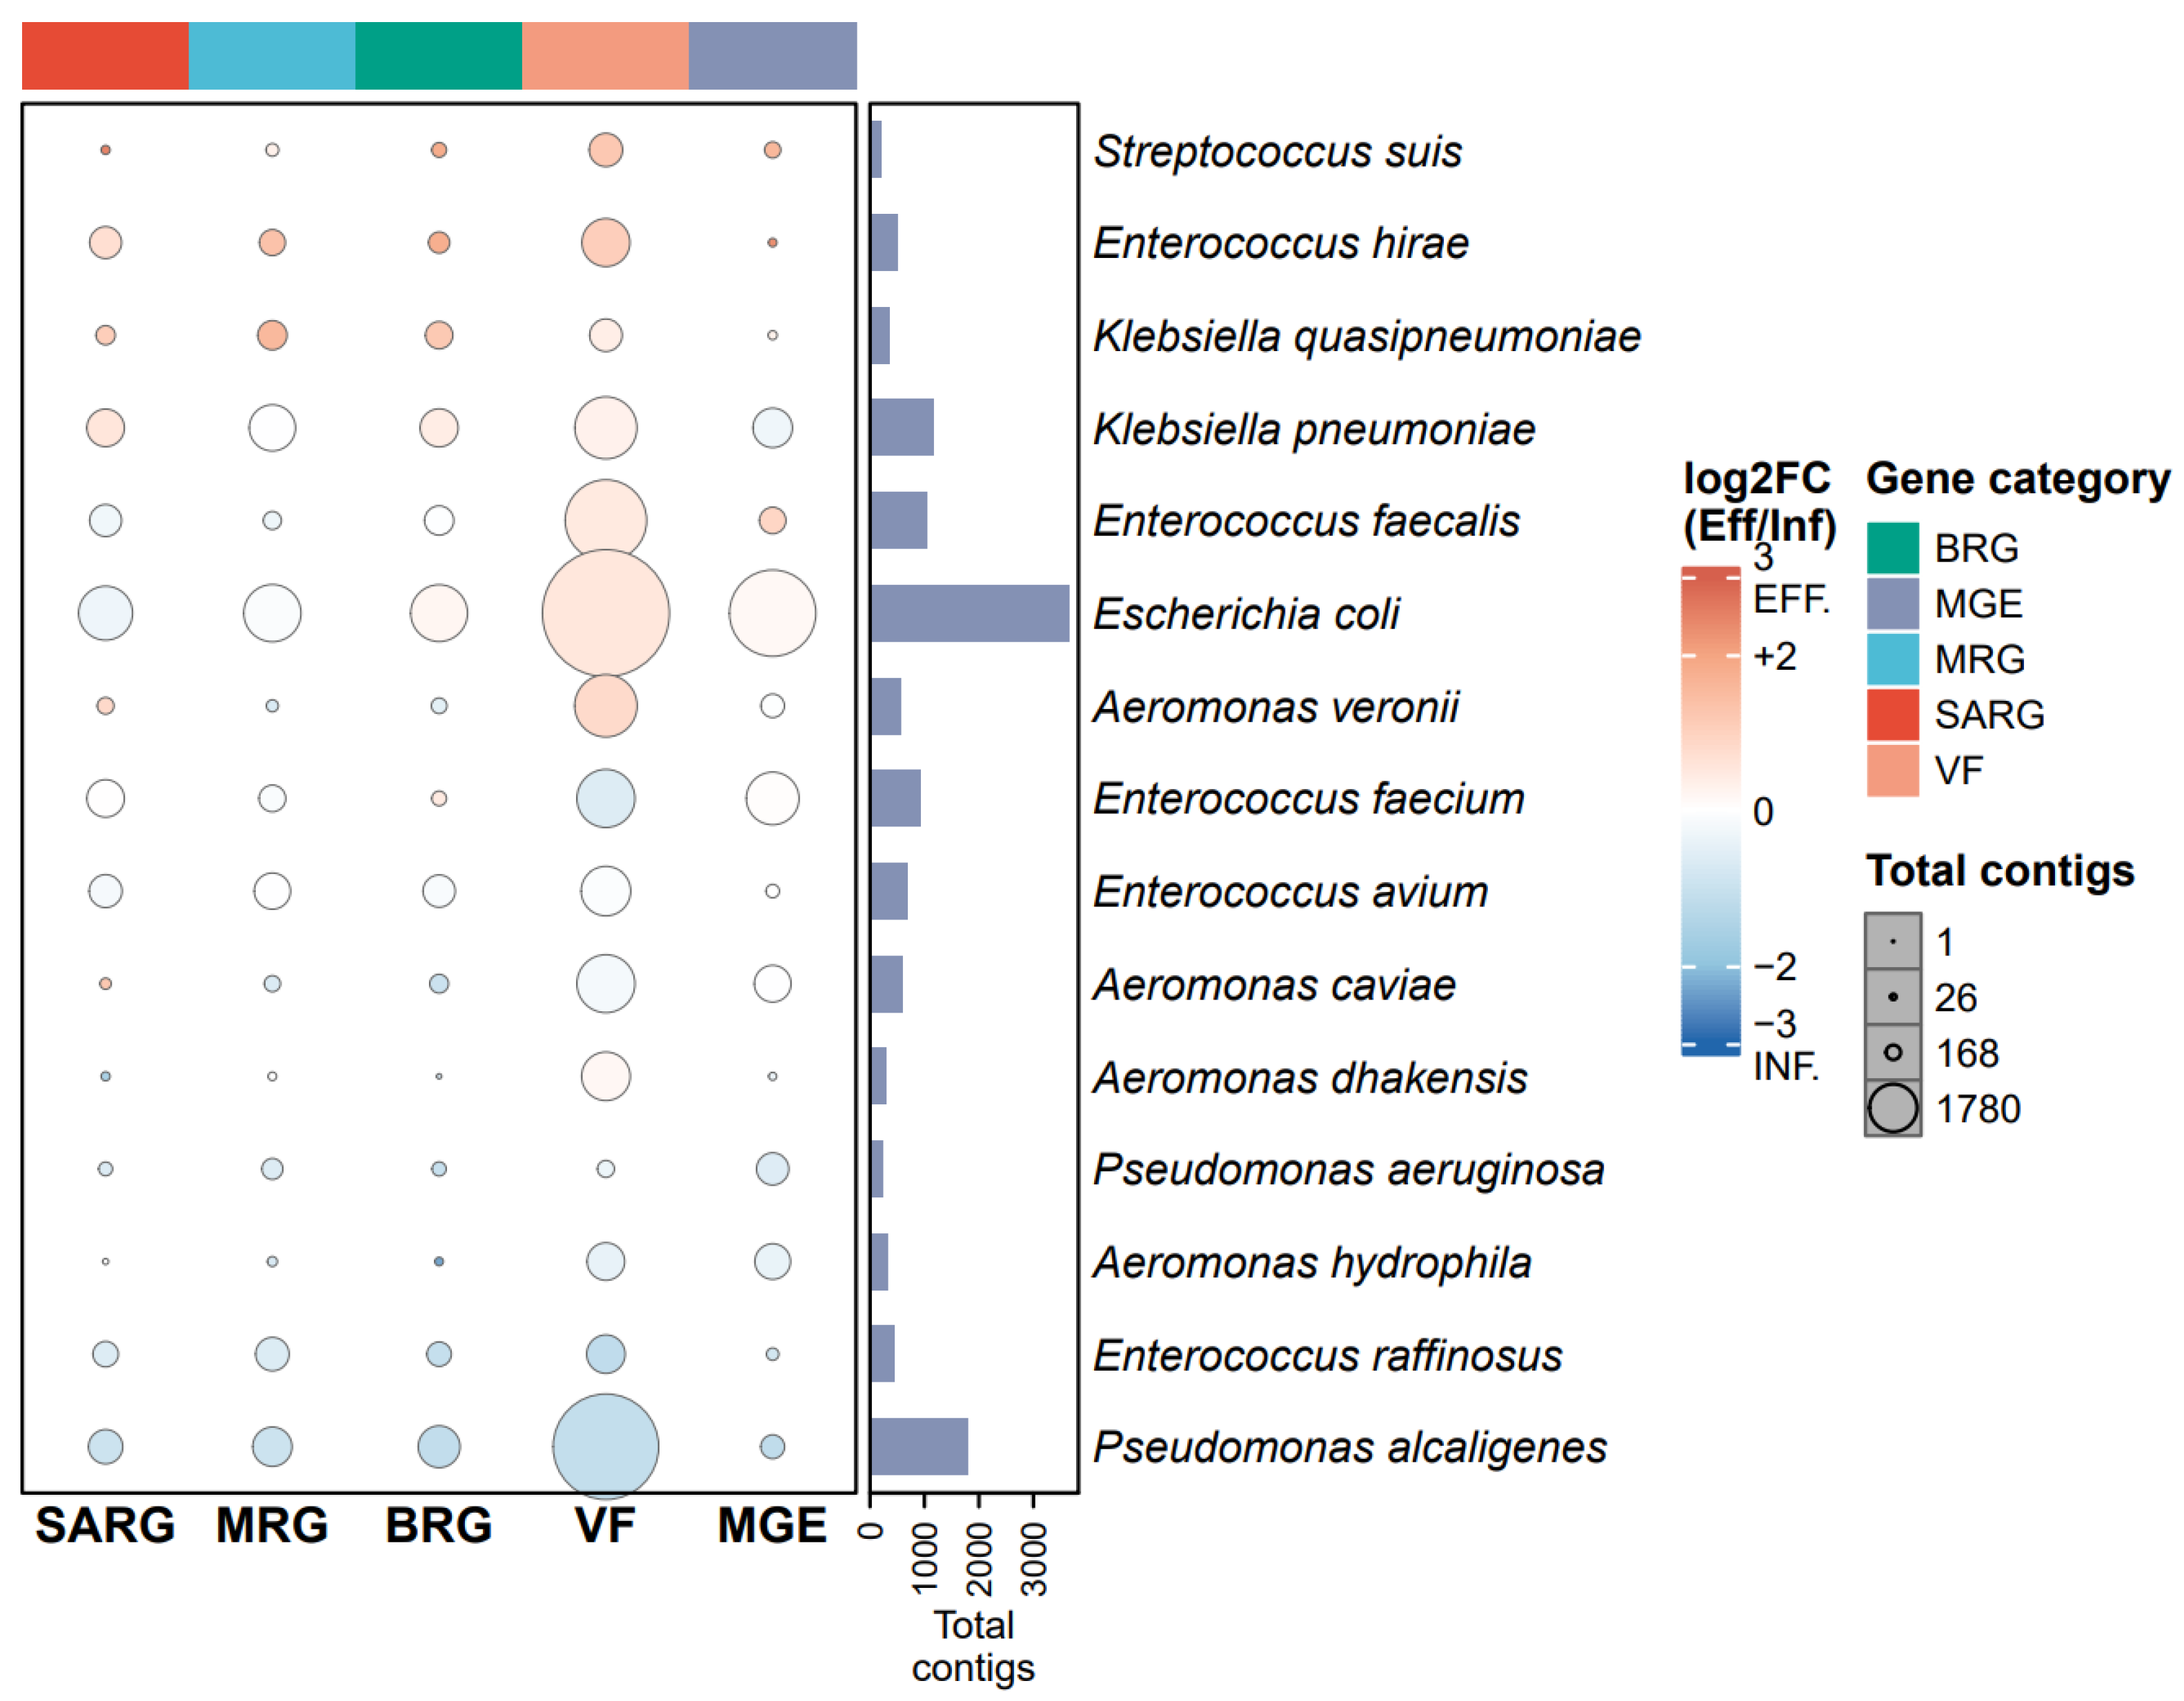
The colocalization of SARGs with MGEs, BRGs, and MRGs was defined as the simultaneous presence of at least two functional genes from different categories on the same contig (≥1 kbp). All colocalization events were identified using custom Perl scripts by cross-referencing per-contig annotation outputs. To correct for differences in SARG abundance between influent and effluent samples, the normalized ARG-MGE colocalization rate was expressed as the number of colocalization events per 1000 copies/Gb of total SARG abundance. Effluent-to-influent enrichment for each pathogen-gene category combination was quantified as a log2-fold change: log2FC = log2[(effluent contig count + 0.5)/(influent contig count + 0.5)], with a pseudocount of 0.5 added to avoid undefined values.
2.9. Statistical Analysis
Differences in gene abundance and colocalization rates between INF and EFF were assessed using the Wilcoxon rank-sum test (n = 18 per group). Temporal variation across T1–T6 was tested using the Kruskal-Wallis test. Subtype-level SARG removal rates were calculated as (1 − effluent mean/influent mean) × 100%. Spearman correlation was used to assess relationships between gene category abundances. All statistical analyses and visualizations were performed in R (v4.3). A two-sided significance threshold of p < 0.05 was applied throughout.
3. Results
3.1. Effluent Microbial Communities Are Less Rich but Enriched in Opportunistic Pathogens than Influent Microbial Communities Are
To assess how wastewater treatment restructures the microbial community, we compared α- and β-diversities, taxonomic compositions, and genus-level abundances between the influent (INF) and effluent (EFF) across six time points (T1–T6).
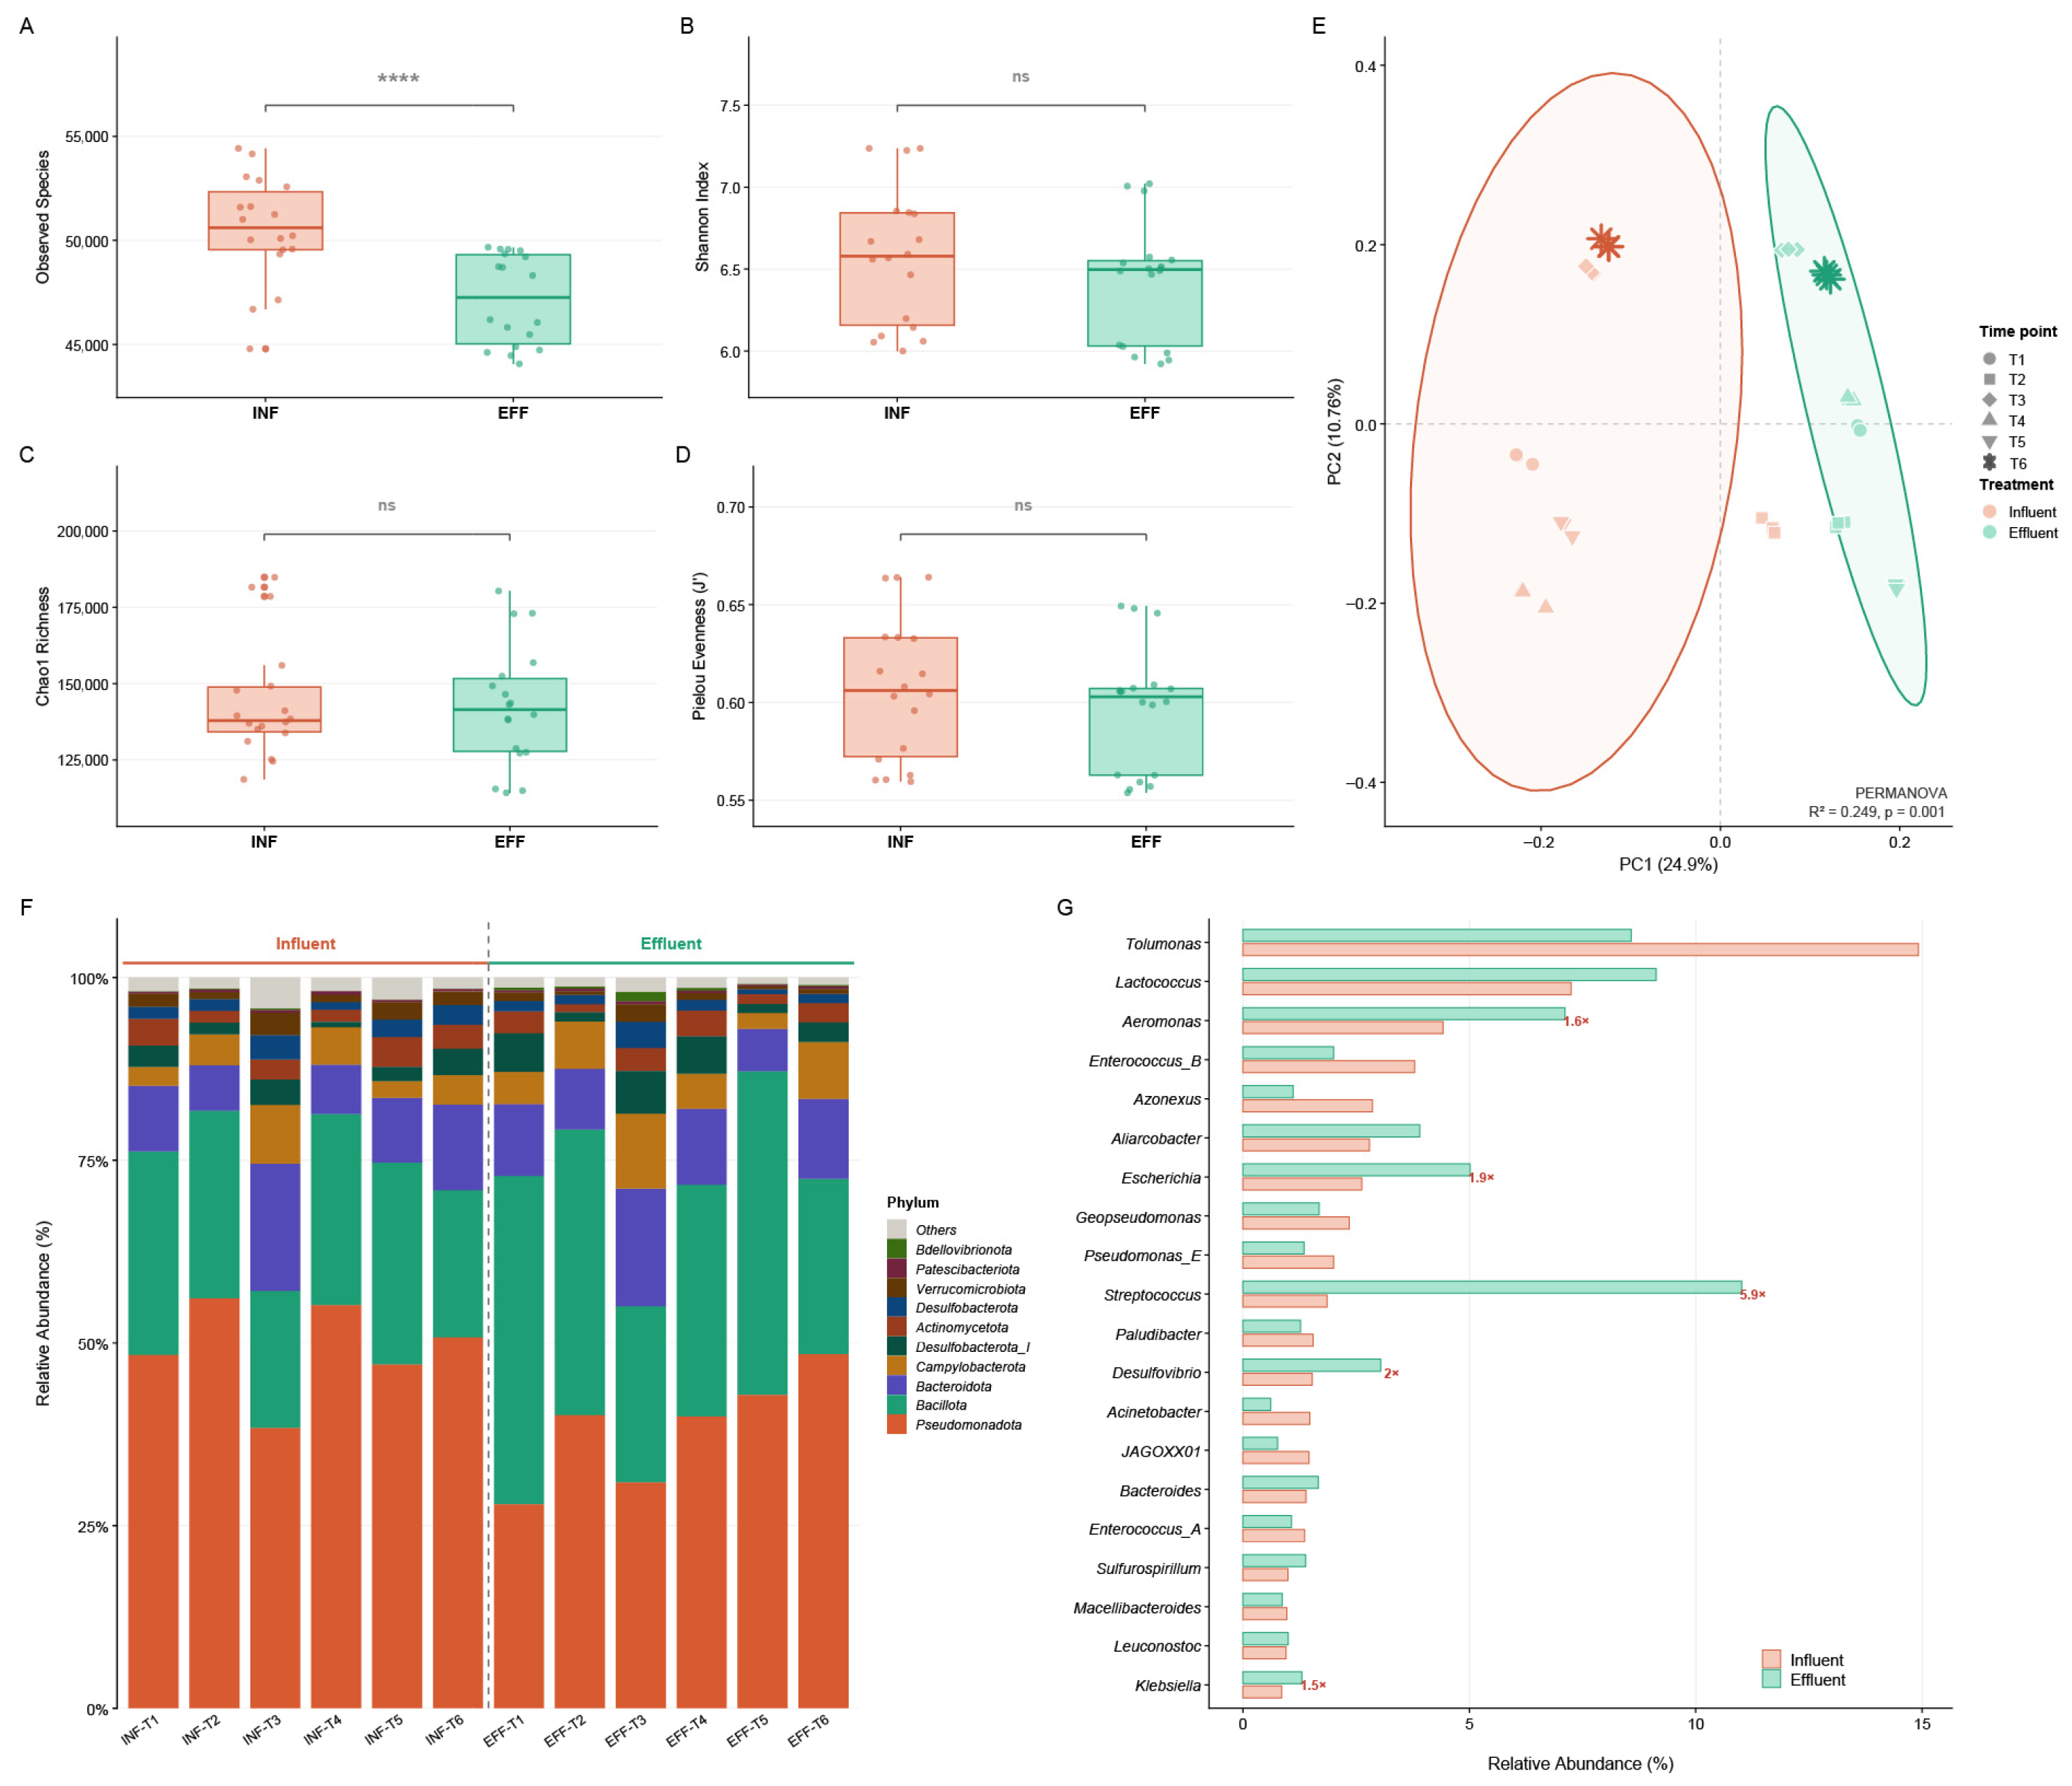
Alpha diversity analysis revealed significantly lower observed species richness in EFF than in INF (W = 282;
p < 0.0001;
Figure 1A), whereas Shannon diversity, Chao1 richness, and Pielou evenness remained comparable between groups (
p = 0.118, 0.988, and 0.293, respectively;
Figure 1B–D). Together, these results indicate that treatment reduced the breadth of detectable taxa without substantially altering the underlying diversity structure, suggesting community reorganization rather than uniform depletion. Beta diversity analysis consistently demonstrated significant and stable compositional separation between the influent and effluent throughout the monitoring period (PERMANOVA: R
2 = 0.249, F = 11.26,
p = 0.001;
Figure 1E).
Taxonomic profiling revealed that this community reorganization was not neutral with respect to clinically relevant taxa. At the phylum level, Pseudomonadota dominated both sample types, with a notable increase in Bacillota in the effluent (
Figure 1F). At the genus level, five taxa, namely, the WHO priority pathogens
Escherichia and
Klebsiella, as well as
Streptococcus, were selectively enriched in the effluent (
Figure 1G).
3.2. Antibiotic Resistance Gene Abundance Decreases from Influent to Effluent, but the Abundance of Metal Resistance Genes and Virulence Factors Increases
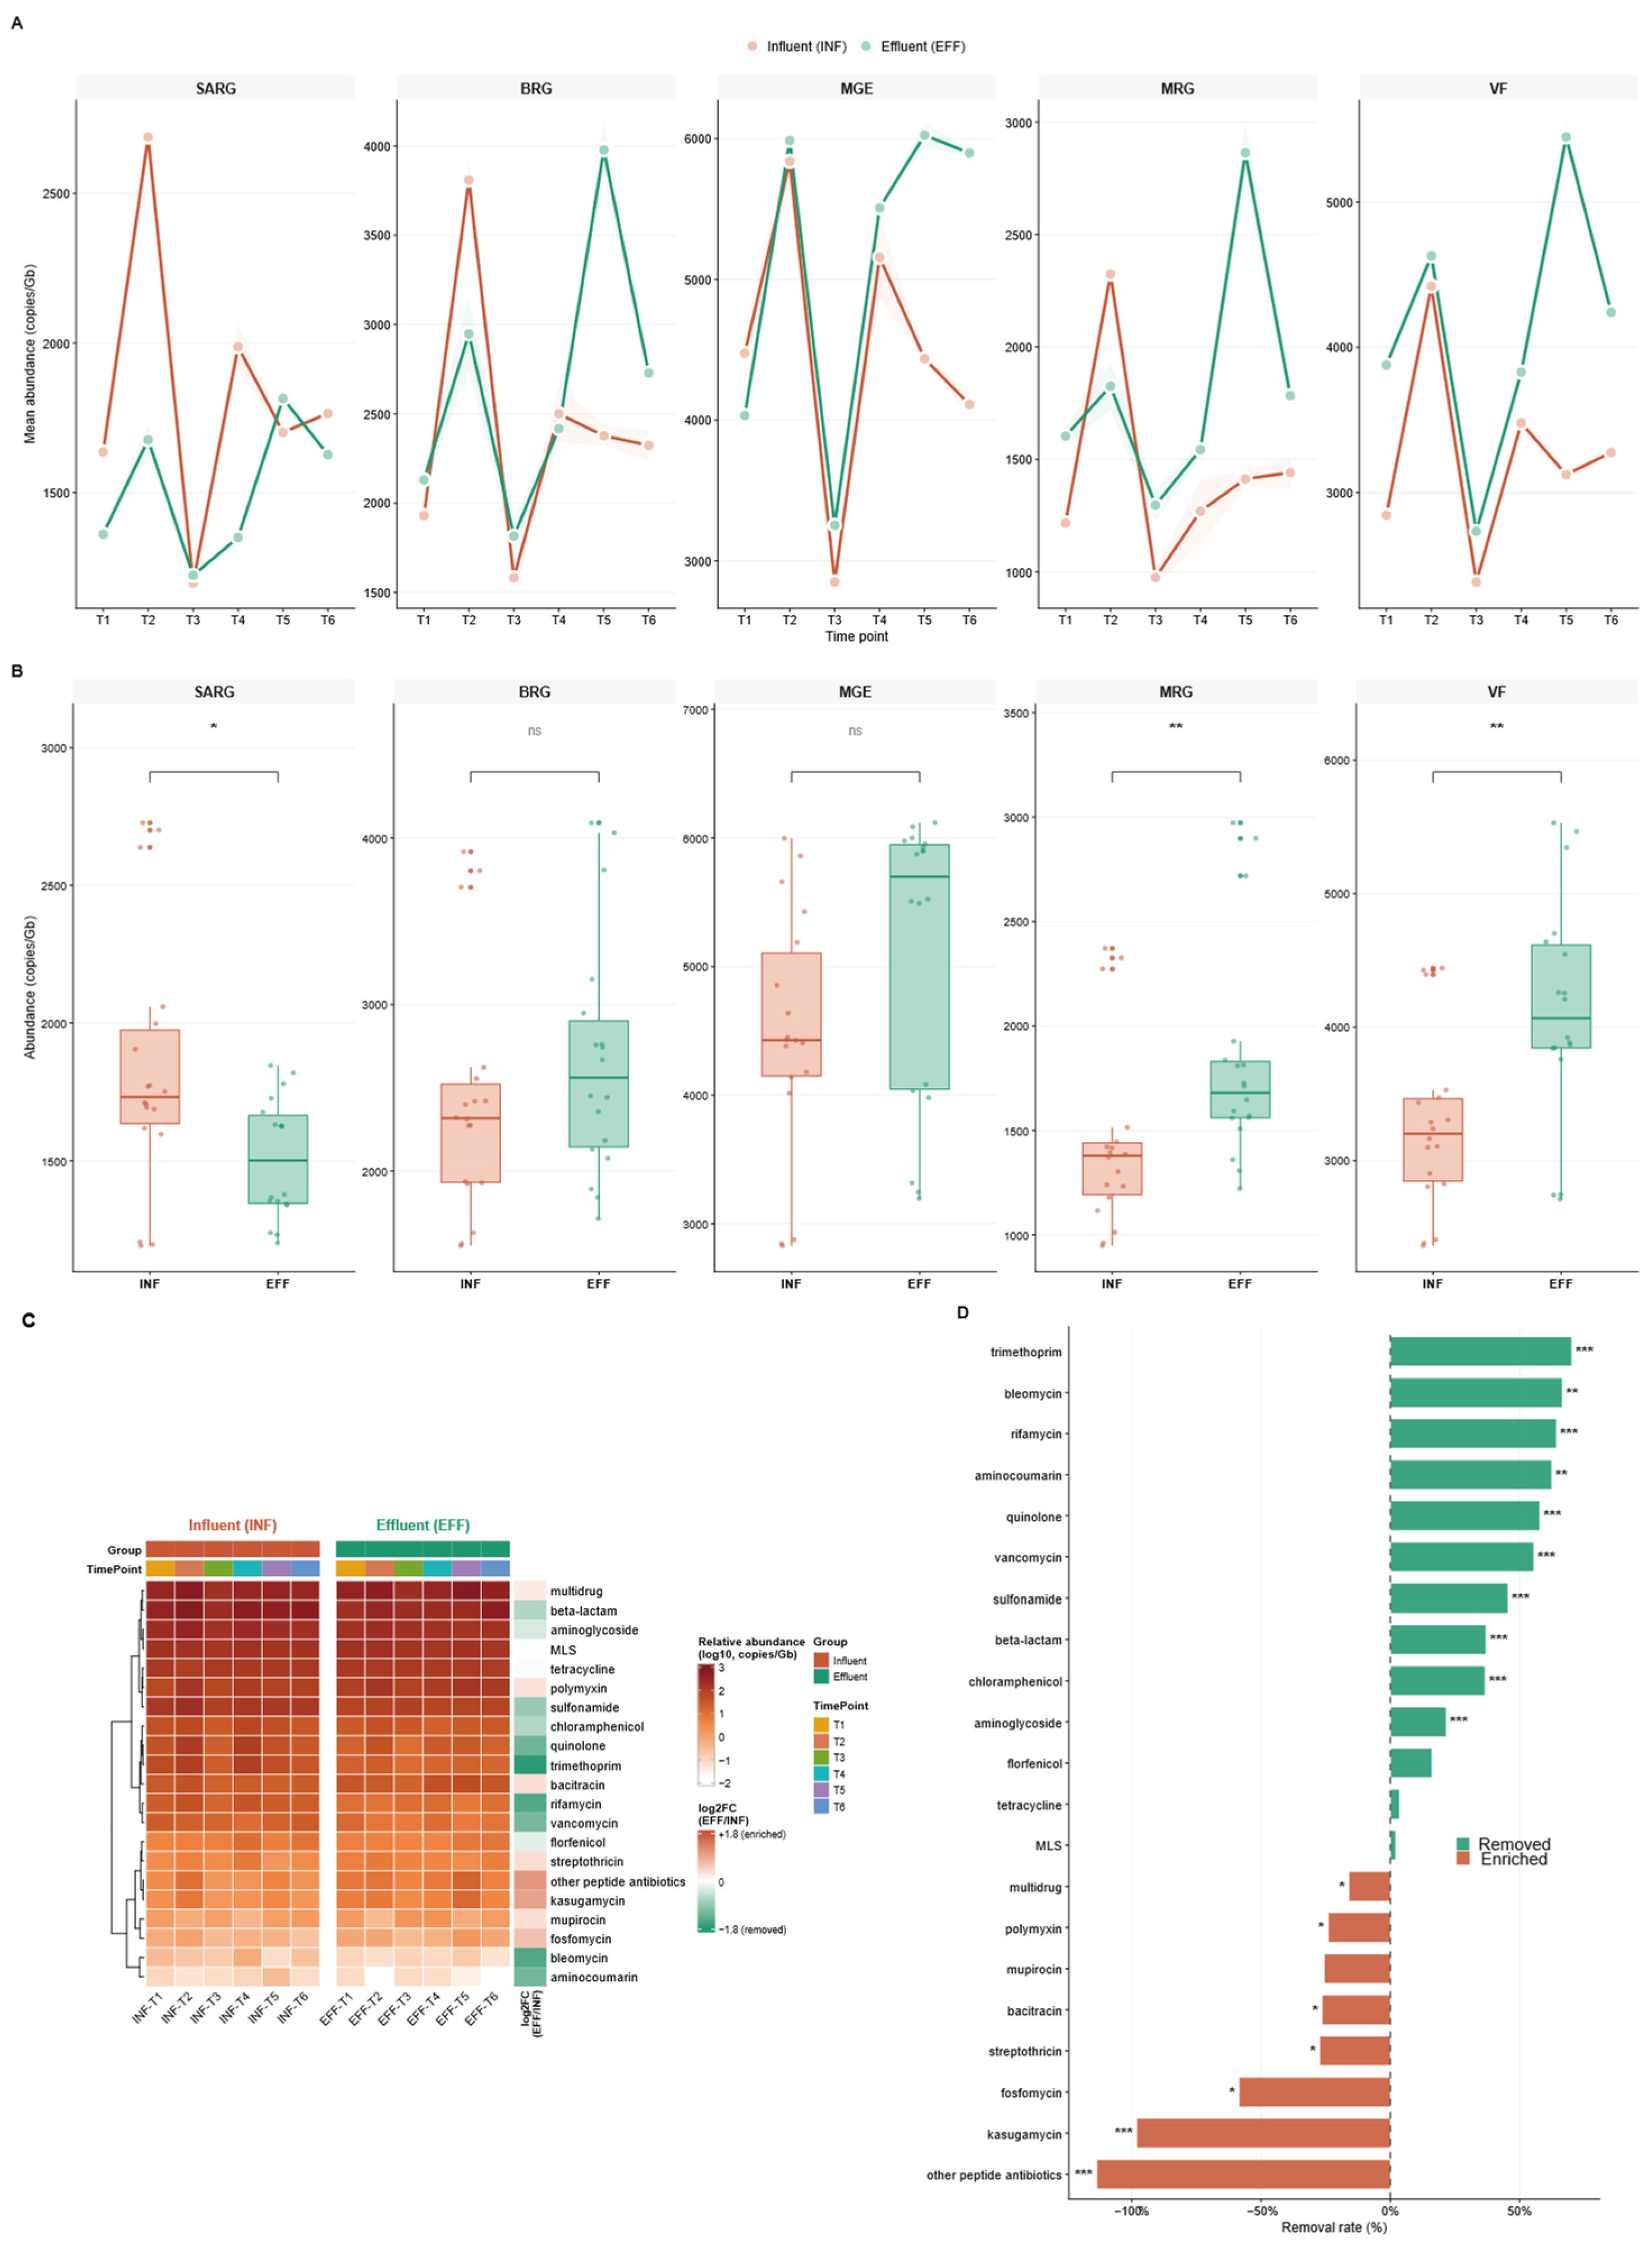
A comparison of five gene categories between influent (INF) and effluent (EFF) revealed that wastewater treatment significantly reduced total SARG abundance (INF: 1829.0 copies/Gb; EFF: 1508.6 copies/Gb; FC = 0.82,
p = 0.038), whereas MRG and VF were significantly greater in effluent (FC = 1.26 and 1.27, respectively; both
p < 0.01), and BRG and MGE showed nonsignificant increasing trends (
p > 0.05;
Figure 2A,B).
At the subtype level, 13 of the 20 SARG subtypes (65%) were reduced by treatment, with the highest removal rates observed for trimethoprim (70.2%), bleomycin (66.6%), rifamycin (64.2%), quinolone (57.8%), and vancomycin (55.5%; all
p < 0.001). However, 8 subtypes were more abundant in effluent than in influent, most notably other peptide antibiotic resistance genes (
p < 0.001), kasugamycin (
p < 0.001), fosfomycin (
p < 0.05), and polymyxin resistance genes (
p < 0.05), indicating resistance to removal by the treatment process (
Figure 2C,D).
Temporal analysis revealed significant variation in all five categories across T1–T6 (Kruskal-Wallis test, all
p < 0.01;
Figure 2A). Influent SARG peaked at T2 (2689.4 copies/Gb) and reached its minimum at T3 (1197.4 copies/Gb; 2.25-fold range). At T5, the effluent SARG (1814.8 copies/Gb) transiently exceeded the influent (1701.1 copies/Gb), with MRG, BRG, VF, and MGE showing similar patterns at certain time points.
Taken together, these data indicate that wastewater treatment reduces the total ARG load but simultaneously increases metal resistance and virulence functional capacity and that the response is highly heterogeneous at the ARG subtype level (
Figure 2C,D).
3.3. The Expression of Plasmid-Encoded Resistance Genes Decreases While the Expression of Chromosomally Encoded Virulence and Resistance Elements Increases in the Effluent
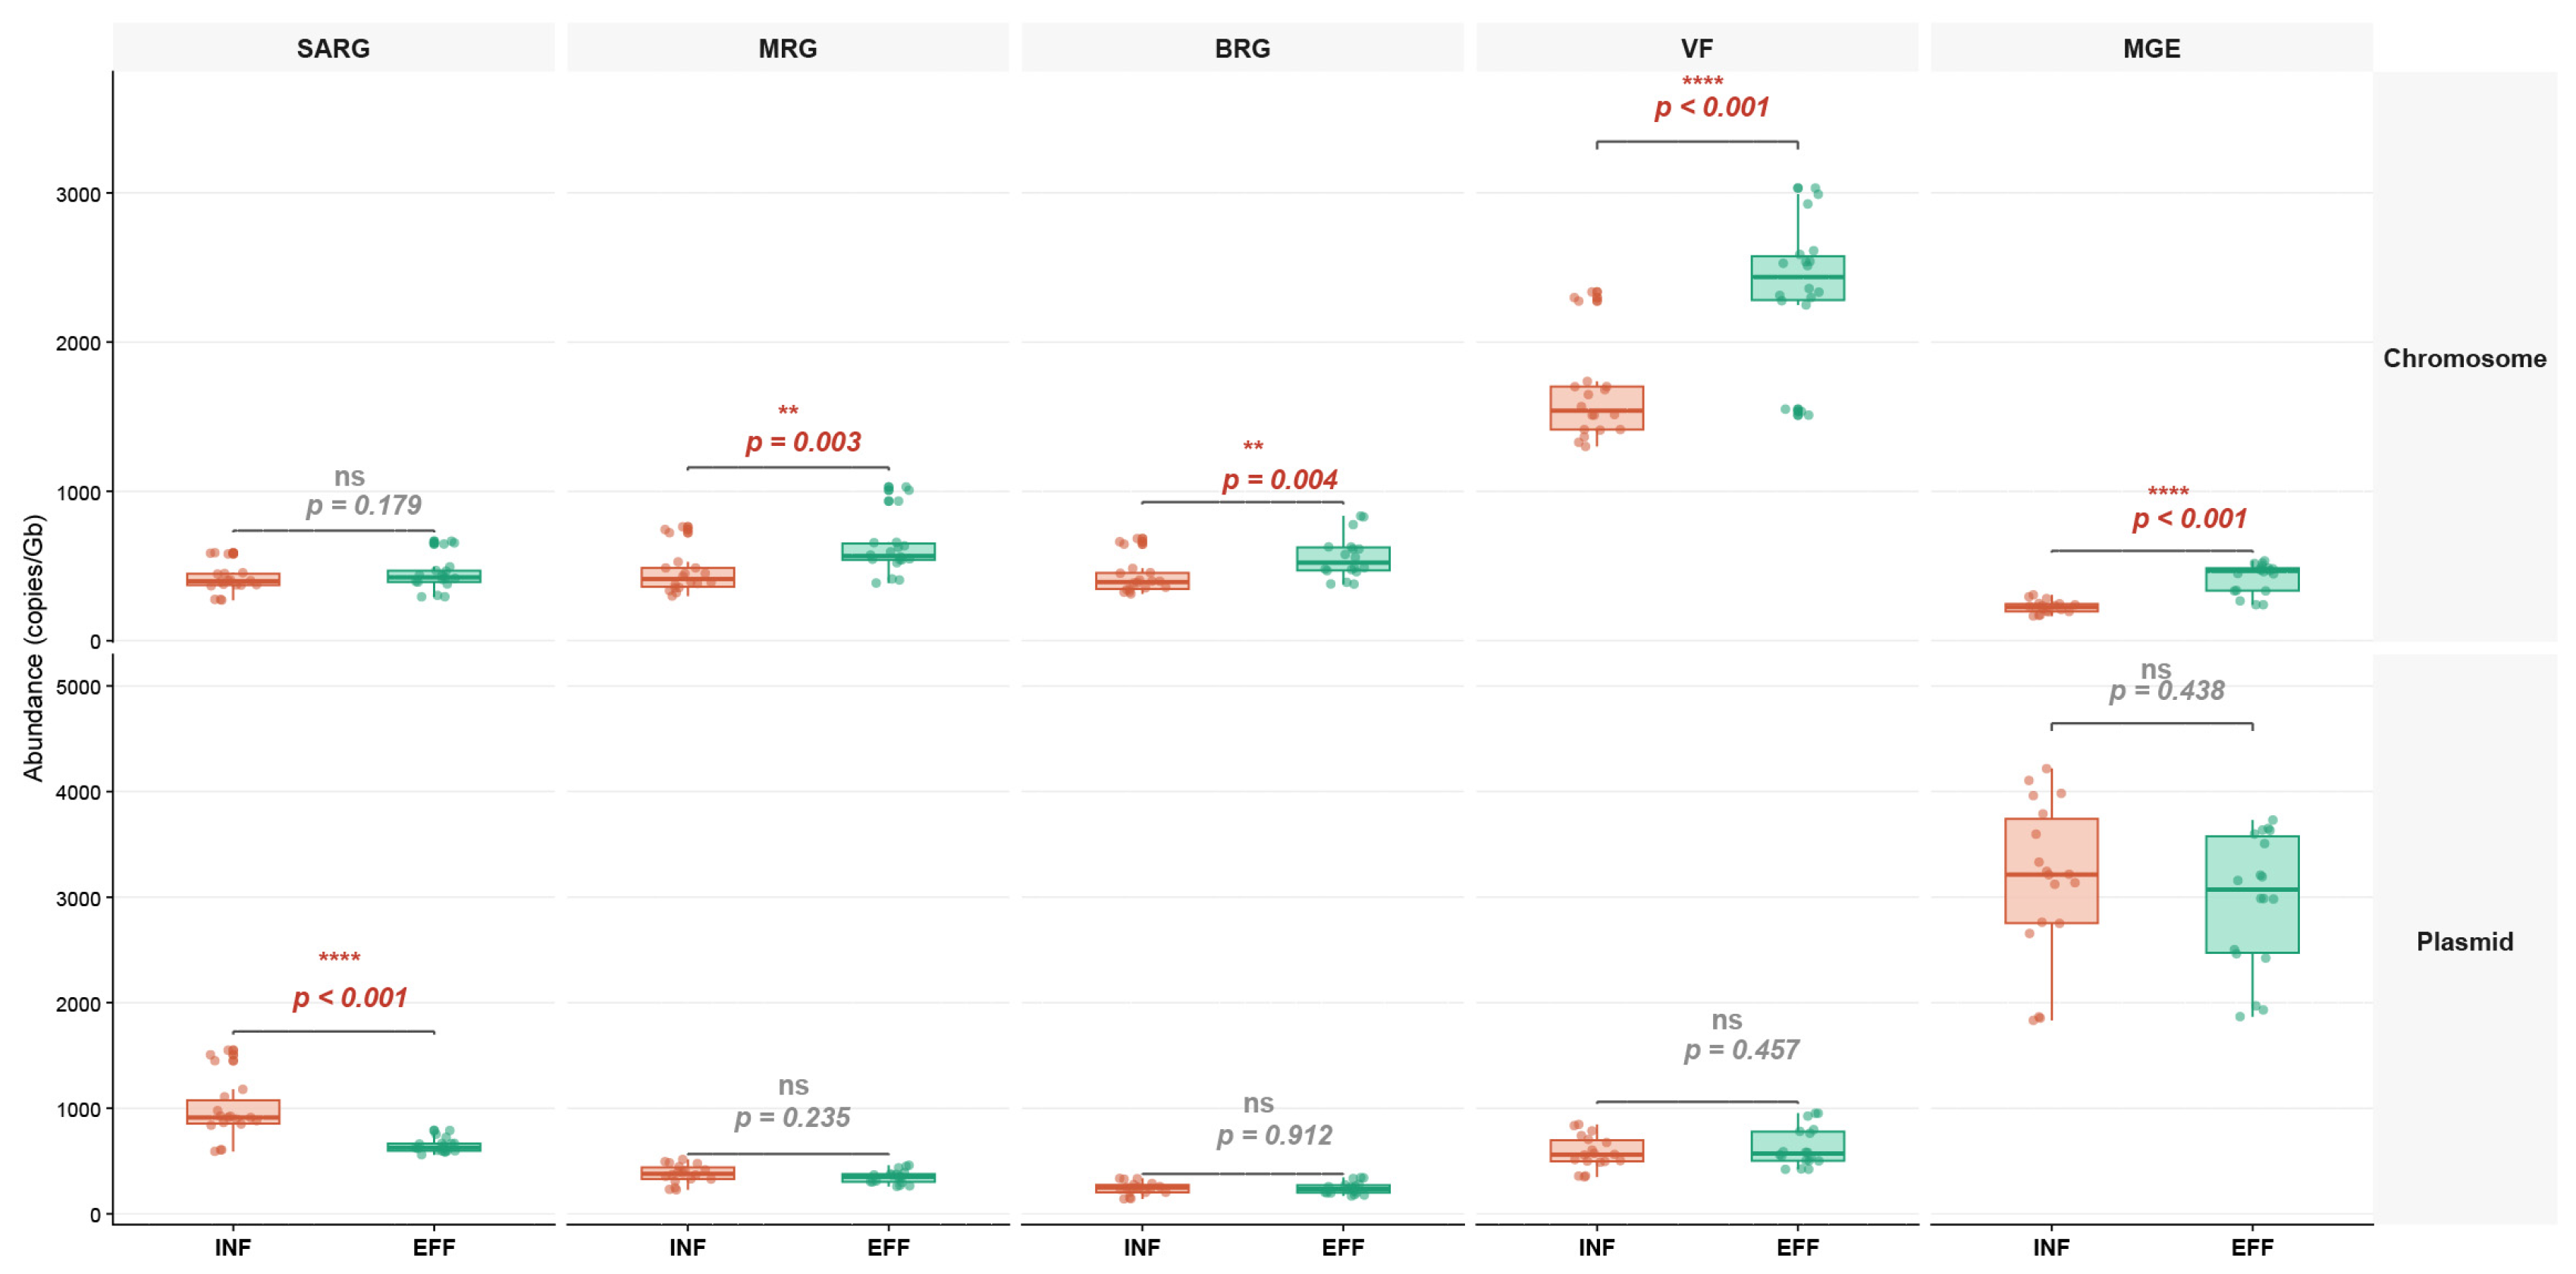
To characterize the genomic context underlying functional gene enrichment, the abundance of five functional gene categories—SARG, MRG, BRG, VF, and MGE—was quantified separately according to the genomic origin of each contig (chromosomal vs. plasmid-encoded) and compared between influent (INF) and effluent (EFF) samples (
Figure 3).
Among the chromosome-encoded contigs, four gene categories were significantly enriched in the effluent relative to the influent: VF (INF: 1651 copies/Gb; EFF: 2372 copies/Gb; log2FC = 0.52, p < 0.001), MGE (log2FC = 0.90, p < 0.001), MRG (log2FC = 0.44, p = 0.003), and BRG (log2FC = 0.38, p = 0.004). In contrast, the abundance of chromosomally encoded SARG did not differ significantly between INF and EFF (log2FC = 0.11, p = 0.179).
Among the plasmid-encoded contigs, only the abundance of SARG was significantly reduced in the effluent (INF: 977 copies/Gb; EFF: 643 copies/Gb; log2FC = −0.60, p < 0.001), whereas the abundance of plasmid-encoded MRG, BRG, VF, and MGE did not significantly differ between the groups (all p > 0.05).
Taken together, these findings indicate that the treatment process effectively reduced the number of plasmid-encoded SARGs but had a limited effect on the number of chromosomes encoding VFs, MRGs, BRGs, and MGEs, all four of which were preferentially enriched in chromosomal contigs in the effluent.
These results indicate that the reduction in total ARG abundance is driven exclusively by the plasmid-encoded fraction, whereas the chromosomally located VF, MRG, BRG, and MGE pools are concurrently enriched, suggesting that residual functional genes are preferentially retained on the stably inherited genetic backbone.
3.4. Normalized ARG–MGE Colocalization Rates Are Higher in Effluent than in Influent
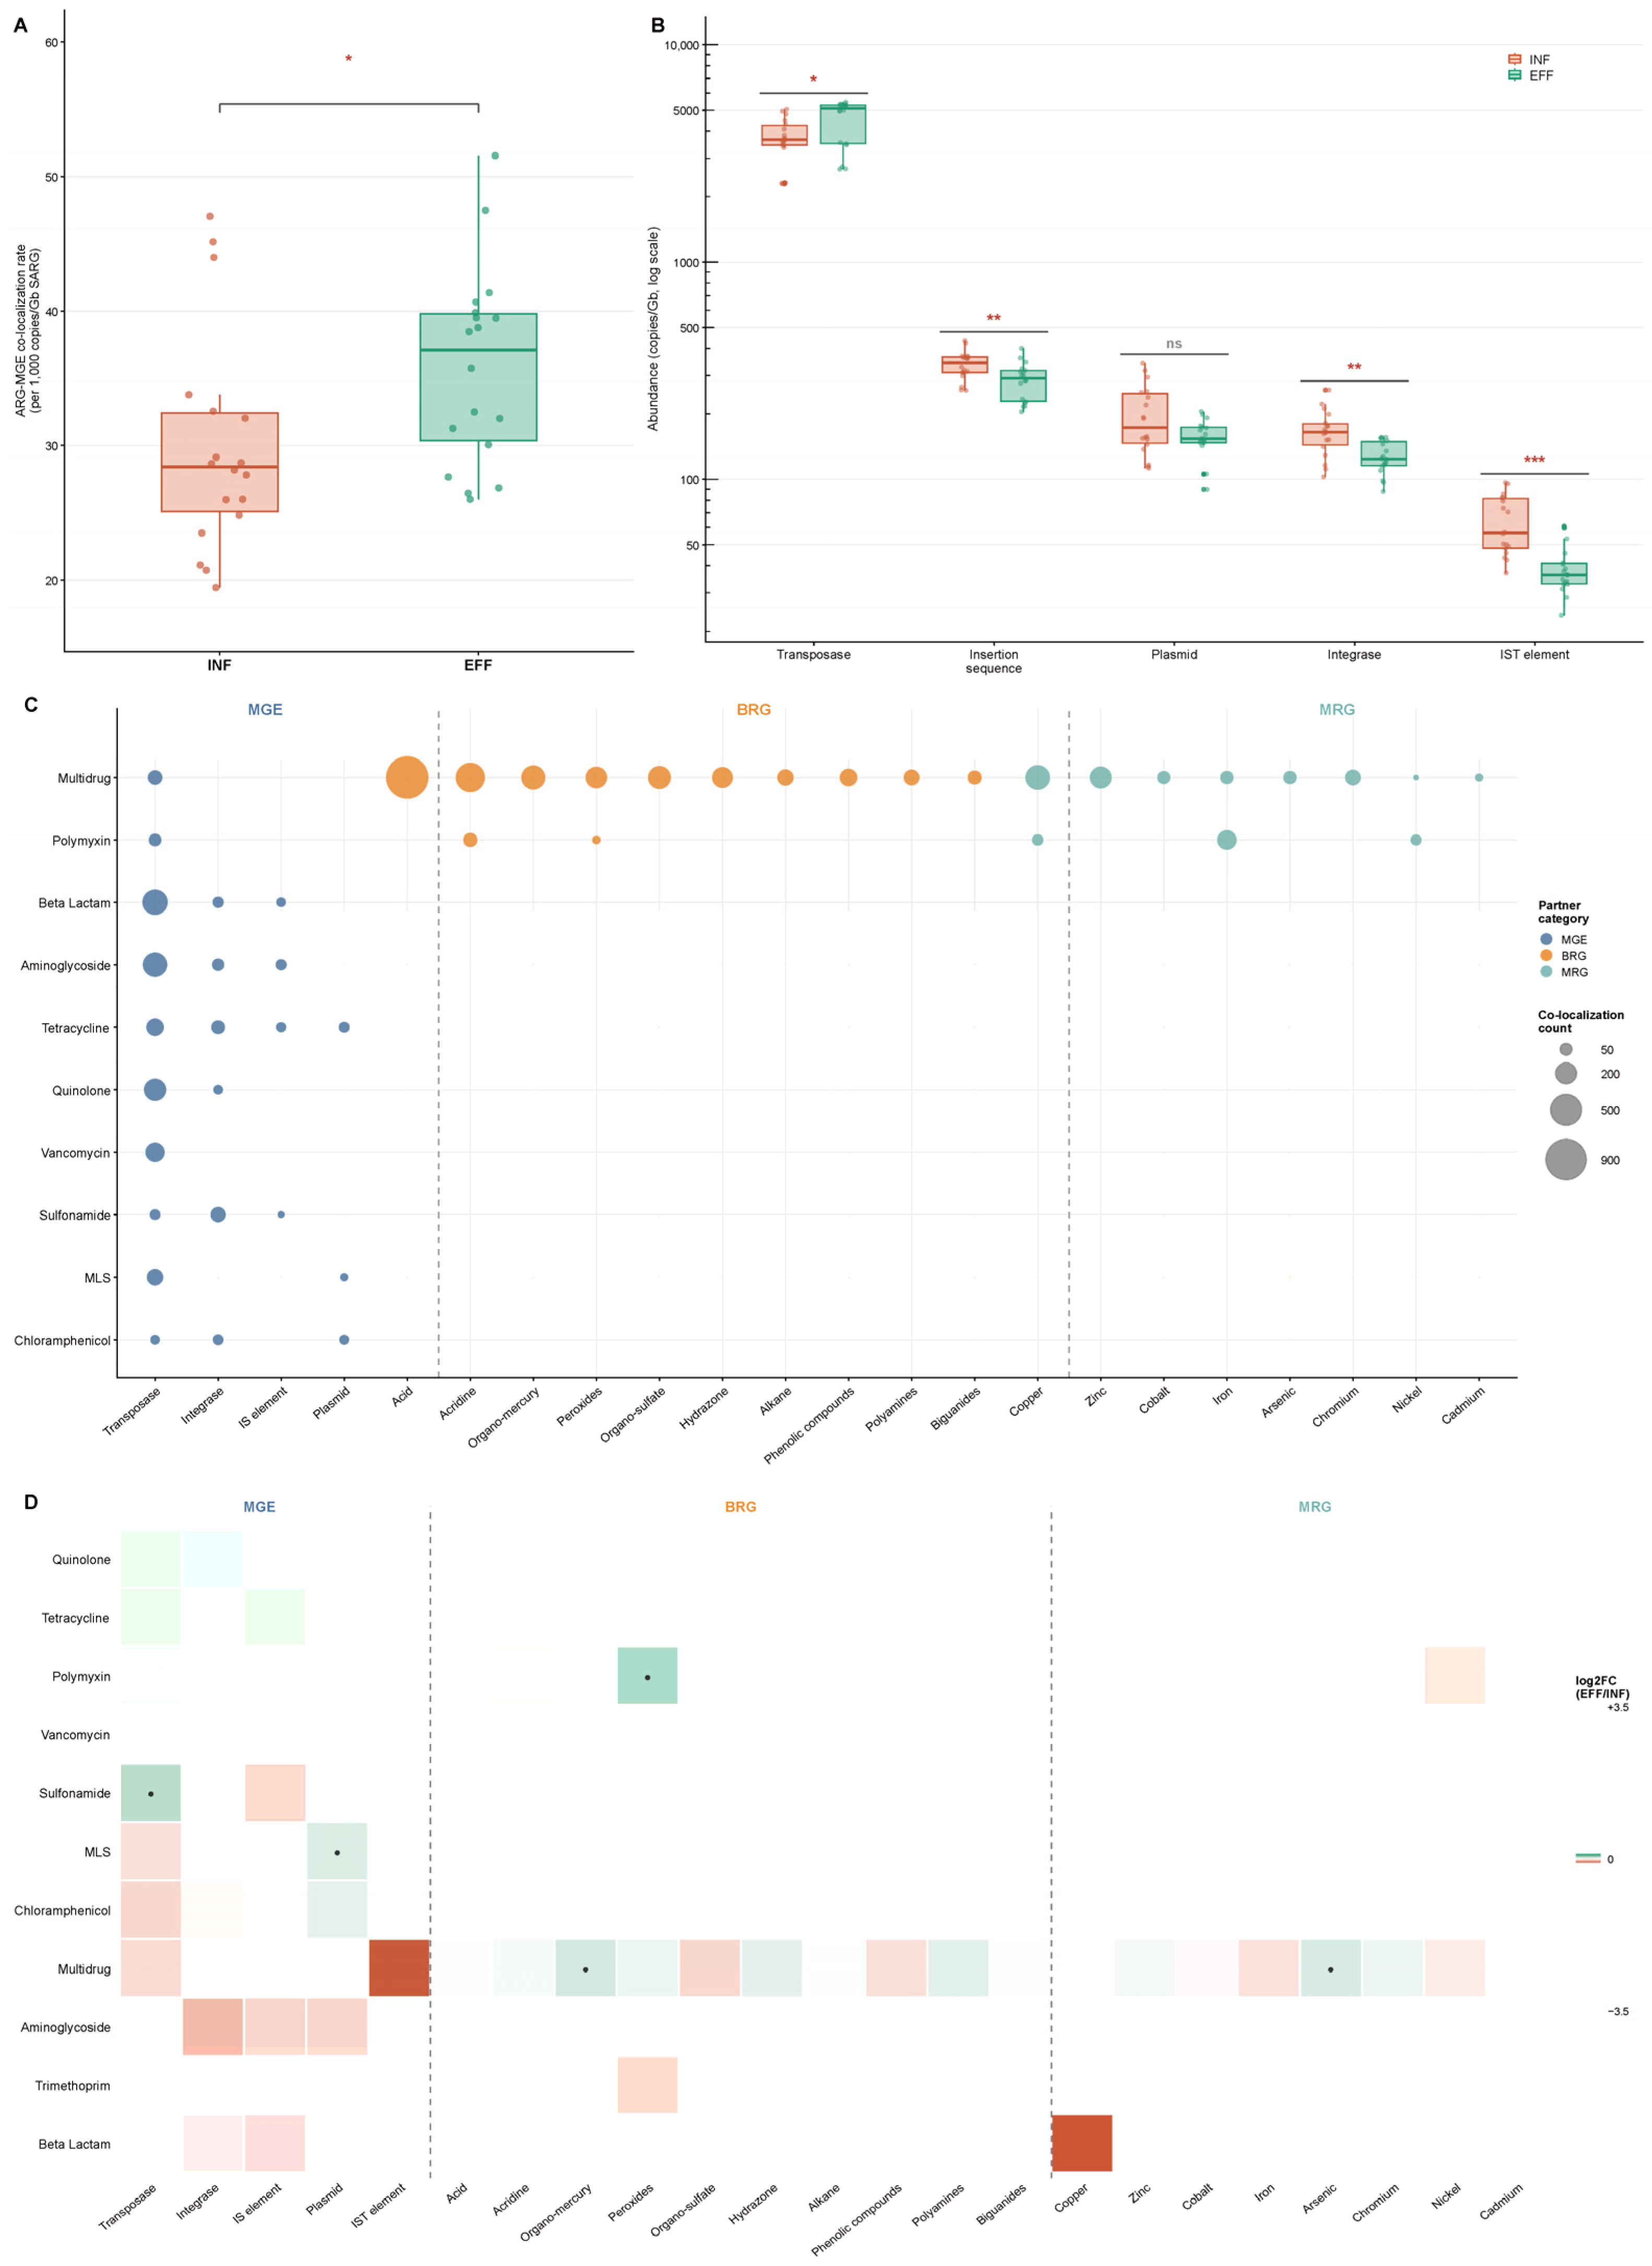
The normalized ARG–MGE colocalization rate was significantly higher in effluent (35.87 per 1000 copies/Gb SARG) than in influent (29.93 per 1000 copies/Gb SARG; Wilcoxon rank-sum test,
p = 0.028;
Figure 4A).
Among the five MGE types quantified, transposase was the most abundant (influent mean: 3715 copies/Gb) and was significantly less abundant in effluent (FC = 1.21,
p = 0.017;
Figure 4B), whereas integrase (FC = 0.63,
p < 0.001), IST elements (FC = 0.58,
p < 0.001), and insertion sequences (FC = 0.76,
p = 0.009) were significantly less abundant in effluent; plasmid-associated MGEs were not significantly different (FC = 0.79,
p = 0.125).
A total of 6301 same-contig colocalization events were identified between the SARGs and three partner gene categories: MGEs (1893 events), BRGs (3149 events), and MRGs (1259 events;
Figure 4C). Multidrug, beta-lactam, and aminoglycoside resistance genes showed the highest colocalization frequencies across all three categories, with transposase-associated pairs predominating among MGE colocalizations. The log
2-fold change heatmap (
Figure 4D) revealed that compared with the influent, the selected SARG-BRG and SARG-MRG pairs were proportionally more represented in the effluent, whereas certain SARG-MGE pairs, including those involving integrase, were proportionally more represented in the influent.
Together, these results indicate that residual ARGs in effluent possess a greater proportion of horizontal transfer potential per unit abundance, with a shift in mobilization mode from integrase/plasmid-mediated transfer toward transposase-mediated chromosomal integration, and provide contig-level patterns consistent with coselection between ARGs and biocide/metal resistance determinants.
3.5. Species-Specific Coenrichment of Resistance and Virulence Determinants in Effluent Populations of Species Containing Pathogenic Strains
Analysis at the contig level of antibiotic resistance genes (SARGs), metal resistance genes (MRGs), biocide resistance genes (BRGs), virulence factor genes (VFs), and mobile genetic elements (MGEs) carried by 15 dominant species containing pathogenic strains revealed that the co-carriage of multiple classes of resistance, virulence, and mobile elements is common among predominant putatively pathogenic taxa in hospital wastewater.
E. coli had the highest total contig count (3645), followed by
P. alcaligenes (1788) and
K. pneumoniae (1150), with VF-associated contigs being the most prevalent across species (
Figure 5).
In Enterococcus hirae, the abundance of mobile genetic elements (MGEs; log2FC = 2.32), biocide resistance genes (BRGs; log2FC = 1.78), and metal resistance genes (MRGs; log2FC = 1.34) increased synchronously. This pattern suggests coselection pressure in the effluent environment, potentially enhancing its horizontal gene transfer capability, biocide tolerance, and metal resistance via MGEs. Similarly, the abundance of both antibiotic resistance genes (SARGs; log2FC = 2.50) and BRGs (log2FC = 1.83) increased concurrently in Streptococcus, indicating that it is under dual selective pressure from antibiotics and biocides. Of particular significance, Klebsiella quasipneumonia was the only member of the Enterobacteriaceae family among the 15 dominant species to show enrichment across all three major resistance gene categories: MRGs (log2FC = 1.55), BRGs (log2FC = 1.20), and SARGs (log2FC = 1.08), highlighting its broad adaptive potential. In contrast, for Escherichia coli, the abundance of MGE- and virulence factor (VF)-associated contigs did not significantly differ between the influent and effluent (log2FC = 0.15 and 0.54, respectively), indicating that its horizontal gene transfer potential and virulence gene carriage persisted at levels comparable to those of the influent.
Conversely, a reduction in specific genetic determinants was observed for other species in the effluent. The abundance of Pseudomonas decreased for MGEs (log2FC = −1.19), BRGs (log2FC = −1.15), and VFs (log2FC = −1.13). The most pronounced reduction was observed for BRG-associated contigs in Aeromonas hydrophila (log2FC = −2.32), indicating that it was the species with the most significant relative depletion in the effluent. Collectively, these species-specific enrichment patterns suggest that treatment selectively favors pathogens capable of maintaining or amplifying multifunctional genetic repertoires, underscoring residual biosafety risks in discharged effluent. These species-specific patterns indicate that the compositional shifts observed at the community level converge within a small number of clinically and ecologically relevant species, with K. quasipneumoniae, E. hirae, and S. suis emerging as candidate sentinel taxa for integrated AMR surveillance.
4. Discussion
Hospital wastewater effluent is discharged directly into municipal sewer systems or receiving water bodies, representing an important pathway for the environmental dissemination of antibiotic resistance genes and opportunistic pathogens [
8,
14,
15,
16,
17]. In this study, species richness was significantly lower in the effluent (EFF) than in the influent (INF) (
p < 0.0001). In contrast, the diversity and evenness indices did not differ significantly between the two groups, indicating that certain low-abundance species were eliminated in the EFF. In contrast, the overall diversity structure of the bacterial community remained largely unchanged. Moreover, DNA sequences assigned to the opportunistic pathogen genera
Escherichia,
Klebsiella, and
Streptococcus were selectively enriched in EFF. Although shotgun metagenomics cannot, on its own, distinguish DNA from viable cells from that of inactivated or lysed cells, the persistence of pathogen-associated genetic material itself constitutes an environmental reservoir, since extracellular DNA carrying ARGs and VFs can be acquired by competent recipient bacteria through natural transformation. A national-scale metagenomic study of hospital wastewater in Wales detected ESKAPEE pathogens across all hospitals examined, demonstrating that the widespread presence of opportunistic pathogens in hospital wastewater is consistent across geographic regions [
6]. A study of an Irish teaching hospital further confirmed, through average nucleotide identity analysis, that multidrug-resistant bacterial genomes recovered from wastewater were highly similar to those of clinical isolates from contemporaneously infected patients [
18], suggesting that opportunistic pathogens enriched in EFF may be of clinical origin. The selective enrichment of opportunistic pathogens in EFF may be attributable to their competitive advantage under subinhibitory concentrations of antibiotics and disinfectants [
11], making them potentially high-risk vectors for resistance dissemination in receiving environments following effluent discharge.
The total abundance of SARGs was significantly lower in EFF than in INF (
p = 0.038); however, 8 of the 20 SARG subtypes were enriched in EFF. Similarly, a metagenomic analysis of 12 international wastewater treatment plants revealed that approximately 40% of ARGs increased in abundance in specific plants [
7], indicating that such subtype-level response differences represent a cross-geographic phenomenon. Of greater concern, MRG and VF abundances were significantly greater in EFF than in INF (
p < 0.01). A study of tertiary treatment processes at municipal wastewater treatment plants also reported a significant increase in the relative abundance of VFs following treatment, with ARG and VF co-occurrence relationships identified only after treatment [
19], which is consistent with the elevated VF levels observed in EFF in the present study. The enrichment of MRGs in EFF is consistent with previously reported coselection patterns under heavy metal exposure in hospital wastewater, whereby antibiotics and heavy metals can coselect for ARGs and MRGs through three genetic mechanisms—coresistance, cross-resistance, and coregulation [
9]. Given that we did not measure antibiotic, heavy metal, or disinfectant concentrations in the present study, the contribution of these agents to the observed enrichment patterns at this site is inferred from the genomic context rather than directly demonstrated [
12].
The decline in total SARG abundance was primarily attributable to the significant reduction in the abundance of plasmid-encoded SARGs in EFF (
p < 0.001), whereas the abundance of chromosomally encoded SARGs did not differ significantly between INF and EFF (
p = 0.179). Moreover, chromosomally encoded VFs, MRGs, and BRGs were significantly enriched in EFF. An analysis of 71 hospital wastewater metagenomes revealed that a large proportion of ARG-carrying contigs associated with
E. coli and
K. pneumoniae were plasmid-like sequences [
5], supporting the conclusion that plasmid-encoded ARGs represent the fraction amenable to removal. A study of Moscow wastewater treatment plants also revealed that the chromosomally encoded ampC beta-lactamase was the most abundant ARG type in the treated effluent. Chromosomally encoded resistance and virulence genes are stably inherited through host cell replication, do not depend on plasmid transfer and are not eliminated because of plasmid metabolic burden when selective pressure is relieved; therefore, these genes represent a more persistent form of resistance risk that is more difficult to eliminate through conventional treatment than plasmid-encoded genes.
The normalized SARG and MGE colocalization rate was significantly greater in EFF than in INF (
p = 0.028), indicating that residual SARGs in EFF possess a greater proportion of horizontal transfer potential. It should be noted, however, that contig-level colocalization reflects genetic linkage rather than horizontal transfer; functional confirmation requires complementary approaches such as long-read metagenomic sequencing, Hi-C proximity ligation, or conjugation assays in cultured isolates. A metagenomic analysis of 226 activated sludge samples from 142 wastewater treatment plants worldwide revealed that 57% of recovered metagenome-assembled genomes carried putatively mobile ARGs, with a significant positive correlation between ARG abundance and MGE presence [
20]. An analysis of MGEs flanking ARGs in hospital wastewater treatment processes revealed that transposases accounted for 74.1% of ARG-flanking MGEs [
21]. In the present study, transposase abundance was significantly greater in EFF (
p = 0.017), whereas integrase abundance was significantly lower in EFF, possibly reflecting a reduction in plasmid-mediated horizontal transfer potential coupled with an increase in transposase-mediated chromosomal mobilization capacity. With respect to SARG and BRG as well as SARG and MRG colocalization, certain gene pairs were proportionally more represented in EFF than in INF, providing contig-level patterns that are consistent with—although not, by themselves, demonstrating—coselection under disinfectant and metal exposure through genetic linkage. The increased ARG–MGE association in effluent has three implications for environmental dissemination risk. First, even when total ARG abundance declines, the residual pool poses a disproportionately higher dissemination potential if it is proportionally more colocalized with MGEs, indicating that
a smaller ARG pool can still pose a higher dissemination risk per unit abundance. Second, the shift from integrase/plasmid-mediated transfer toward transposase-mediated mobilization can drive stable chromosomal integration of resistance and virulence determinants in downstream microbial populations, which is more difficult to reverse than plasmid-mediated transfer (plasmids can be lost under relaxed selection; chromosomal insertions cannot) and contributes to long-term resistance stability in receiving water and sediment matrices. Third, these observations suggest that environmental dissemination risk should be assessed using a mobility-weighted metric rather than absolute ARG abundance alone and that normalized ARG–MGE colocalization rates should be integrated into future risk assessment frameworks alongside total abundance.
The preceding four levels of analysis revealed differences between EFF and INF in terms of gene abundance, genetic carrier distribution, and colocalization structure, and these differences were ultimately concentrated in specific pathogens.
S. suis showed concurrent enrichment of SARGs and BRGs in EFF;
E. hirae was simultaneously enriched for MGEs, BRGs, and MRGs; and
K. quasipneumoniae showed consistent enrichment across MRGs, BRGs, and SARGs in EFF. These findings indicate that the trends of elevated MRGs and VFs and enrichment of chromosomally encoded genes observed in EFF are not dispersed across the entire community but are concentrated in specific, identifiable, clinically relevant pathogens. A
K. quasipneumoniae strain isolated from Brazilian hospital wastewater was confirmed to simultaneously harbor multiple ARGs, metal tolerance genes, and virulence factors [
22], and a Dutch study also confirmed that the
K. pneumoniae species complex can survive wastewater treatment and be released into the environment [
23]. In
Enterococcus, the genetic linkage between the copper resistance gene tcrB and macrolide and glycopeptide resistance genes has been previously reported [
24], offering a plausible mechanistic precedent—rather than direct in situ evidence—for the concurrent enrichment of multiple resistance gene categories in
E. hirae observed in the present study.
In summary, this study is the first to simultaneously compare the abundance, genetic carrier distribution, colocalization characteristics, and pathogen-level enrichment patterns of antibiotic resistance genes, virulence factors, and mobile genetic elements between hospital wastewater influent and effluent within the same longitudinal cohort, revealing that the resistance risk profile of EFF differs significantly from that of INF in terms of composition, genetic background, and pathogen distribution. These findings suggest that future hospital wastewater discharge standards and resistance surveillance frameworks should move beyond total SARG abundance as the sole indicator, incorporate coordinated assessments of MRGs and VFs, consider the genetic persistence of chromosomally encoded genes, and prioritize S. suis, E. hirae, and K. quasipneumoniae as high-risk pathogen targets for monitoring.
From an ecological perspective, pathogen-associated DNA enriched in effluent—either as intracellular or as extracellular relic DNA—can persist in receiving water and sediment matrices for weeks to months and remain available for natural transformation by competent recipient bacteria. Hospital effluent is typically discharged into municipal sewers, downstream treatment plants, and ultimately surface waters that may intersect with agricultural irrigation, recreational use, and drinking-water source watersheds, creating a tractable environment-to-human transmission interface. Because hospital wastewater can recapitulate the resistance and virulence profiles of contemporaneous clinical isolates, effluent monitoring can, in principle, serve as a complementary, noninvasive sentinel for identifying clinically relevant resistance trends within the source hospital, supporting an integrated one-health AMR surveillance framework.
This study has several limitations. First, DNA-based shotgun metagenomics cannot distinguish nucleic acids originating from viable, metabolically active cells from those derived from membrane-compromised, inactivated, or lysed cells or from extracellular relic DNA that may persist after disinfection; consequently, the observed effluent enrichment of pathogen-associated sequences and chromosomally encoded determinants reflects the residual genomic signal rather than confirmed viable populations. Future studies should incorporate viability-resolved approaches, such as propidium monoazide (PMA) pretreatment, RNA-based metatranscriptomics, or selective culture-based confirmation, to disentangle the contributions of viable cells from those of extracellular DNA. Second, contig-based metagenomic analysis has inherent uncertainty in the classification of chromosomal versus plasmid origin, and long-read sequencing could provide more accurate verification. This study was conducted at a single hospital, and the generalizability of the results requires validation across hospitals of varying scales, treatment processes, and geographic regions. In addition, antibiotic, heavy metal, and disinfectant concentrations in the effluent were not simultaneously measured, limiting causal inference regarding the drivers of coselection.