Article

Flood Risk Assessment Using Coupled 1D–2D Hydrodynamic Models: A Case Study of the Qujiang River Basin

1
Longyou Forestry & Water Resources Bureau, Longyou, Quzhou 324400, China
2
Nanjing Hydraulic Research Institute, Nanjing 210029, China
3
College of Hydrology and Water Resources, Hohai University, Nanjing 210024, China
*
Author to whom correspondence should be addressed.
Water 2026, 18(10), 1198; https://doi.org/10.3390/w18101198
Submission received: 24 March 2026 / Revised: 12 May 2026 / Accepted: 13 May 2026 / Published: 15 May 2026
(This article belongs to the Special Issue Recent Advances in Flood Risk Assessment and Management)

Abstract

Frequent flooding and potential levee breaches pose severe threats to life safety and economic development in the Qujiang River Basin, highlighting the need for integrated risk assessments to improve flood management strategies. This study developed a flood risk assessment framework that combines hydrological design, 1D/2D hydrodynamic models and flood impact analysis. Design flood hydrographs for 10-, 20-, 50-, and 100-year return periods were generated using the instantaneous unit hydrograph method, and breach scenarios were incorporated to evaluate extreme failure conditions. The results indicate that inundation extent, depth, and duration increase significantly with return period, with the 100-year flood producing a maximum depth of 10.04 m and an inundation duration of up to 70 h. Levee breach simulations reveal that the Lingshangang breach results in rapid but short inundation, whereas the Qujiang breach results in prolonged deep flooding depths, posing severe risks to critical infrastructure and densely populated areas. Socio-economic impact assessments demonstrate substantial losses under extreme flood scenarios. These findings provide valuable insights for targeted flood risk mitigation, emergency evacuation planning, and resilient land use management in vulnerable river basins.

1. Introduction

Global climate change has triggered a range of cascading challenges, notably the increasing complexity of flood risk due to the growing frequency and intensity of extreme weather events [1,2]. Existing flood defense systems are often inadequate to cope with the increasing hydrological uncertainties. Furthermore, anthropogenic land-use changes have significantly increased the vulnerability of densely populated areas to flood hazards [3,4]. Recent research has highlighted the growing complexity of flood dynamics under the combined influence of climate change and human activities [5,6,7]. China is among the countries most severely affected by climate-induced flood risks, particularly in its southeastern region, where both population density and hydrometeorological exposure are high. This region, which includes provinces such as Guangdong, Fujian, Jiangxi, and Zhejiang, accounts for over 40% of the national population and contributes significantly to the national Gross Domestic Product (GDP). The region is also characterized by a dense river network and abundant precipitation, with annual precipitation often exceeding 1600 mm [8,9]. However, this abundance also contributes to heightened vulnerability: according to the Ministry of Emergency Management of China, over 70% of the country’s flood-related economic losses between 2010 and 2020 occurred in southeastern China [10]. These statistics underscore the growing challenges of flood management in densely populated areas under changing climatic conditions.
Flood risk is commonly conceptualized as the interaction of hazard, exposure, and vulnerability. Flood hazard refers to the physical characteristics of flooding, such as extent, depth, and duration, while exposure and vulnerability describe the presence and susceptibility of people and assets in flood-prone areas [11,12]. Effective flood risk assessment therefore requires integrating hydrodynamic modeling of flood hazards with socio-economic analysis to capture exposure and vulnerability. To better understand and mitigate the growing complexity of flood risks under climate change, researchers have increasingly focused on scenario-based approaches [13,14]. As multiple factors influence flood occurrence, scenario simulations are typically classified into rainfall scenarios, flood scenarios, reservoir operation scenarios, and land-use change scenarios [15,16,17]. These scenarios are often integrated into hydrodynamic models, including HEC-RAS, MIKE, and so on, which simulate the spatial and temporal dynamics of runoff, streamflow, and inundation [18,19,20]. These model-based scenario simulations provide useful tools for assessing flood risk, providing designs of flood scenarios as well as the consequences of flood inundation, and offer a scientific foundation for adaptive flood risk management and infrastructure planning under conditions of deep uncertainty. Flood loss assessment is an important component of flood risk analysis, particularly in densely populated areas where high concentrations of population and assets significantly amplify potential impacts [21]. In such contexts, flood scenario simulation plays a critical role in anticipating spatial patterns of inundation and evaluating potential consequences under different flood conditions.
Despite these advances, several limitations remain in current flood risk studies. Most existing research focuses on single-process flood mechanisms and assumes relatively homogeneous hydrological conditions within a basin, which limits their applicability in complex confluence systems. Moreover, although coupled 1D–2D hydrodynamic models have been increasingly applied, their integration with levee overtopping and breach scenarios, together with socio-economic impact assessment, remains limited. Most studies either emphasize hydraulic simulation or flood loss estimation independently, rather than combining these components within a unified analytical framework. This gap is particularly significant in basins where heterogeneous hydrological processes interact to generate compound flood dynamics and associated socio-economic impacts.
The Qujiang River Basin is characterized by prolonged deep flooding, where the flash flood-prone Lingshangang River intersects with the Qujiang River. This interaction produces compound flood dynamics, which necessitates a coupled 1D–2D modeling approach to capture both rapid upstream inflows and downstream floodplain inundation. To address this complexity, this study applies a coupled 1D–2D hydrodynamic modeling framework to simulate designed flood scenarios in the Qujiang River Basin, Zhejiang Province, China. The model is further integrated with socio-economic data to assess flood inundation extent, affected population, and economic losses under both standard and levee breach conditions. By linking hydrodynamic processes with impact assessment, this study provides a comprehensive framework to support flood risk management, evacuation planning, and decision-making in complex river systems.

2. Materials and Methods

2.1. Study Area

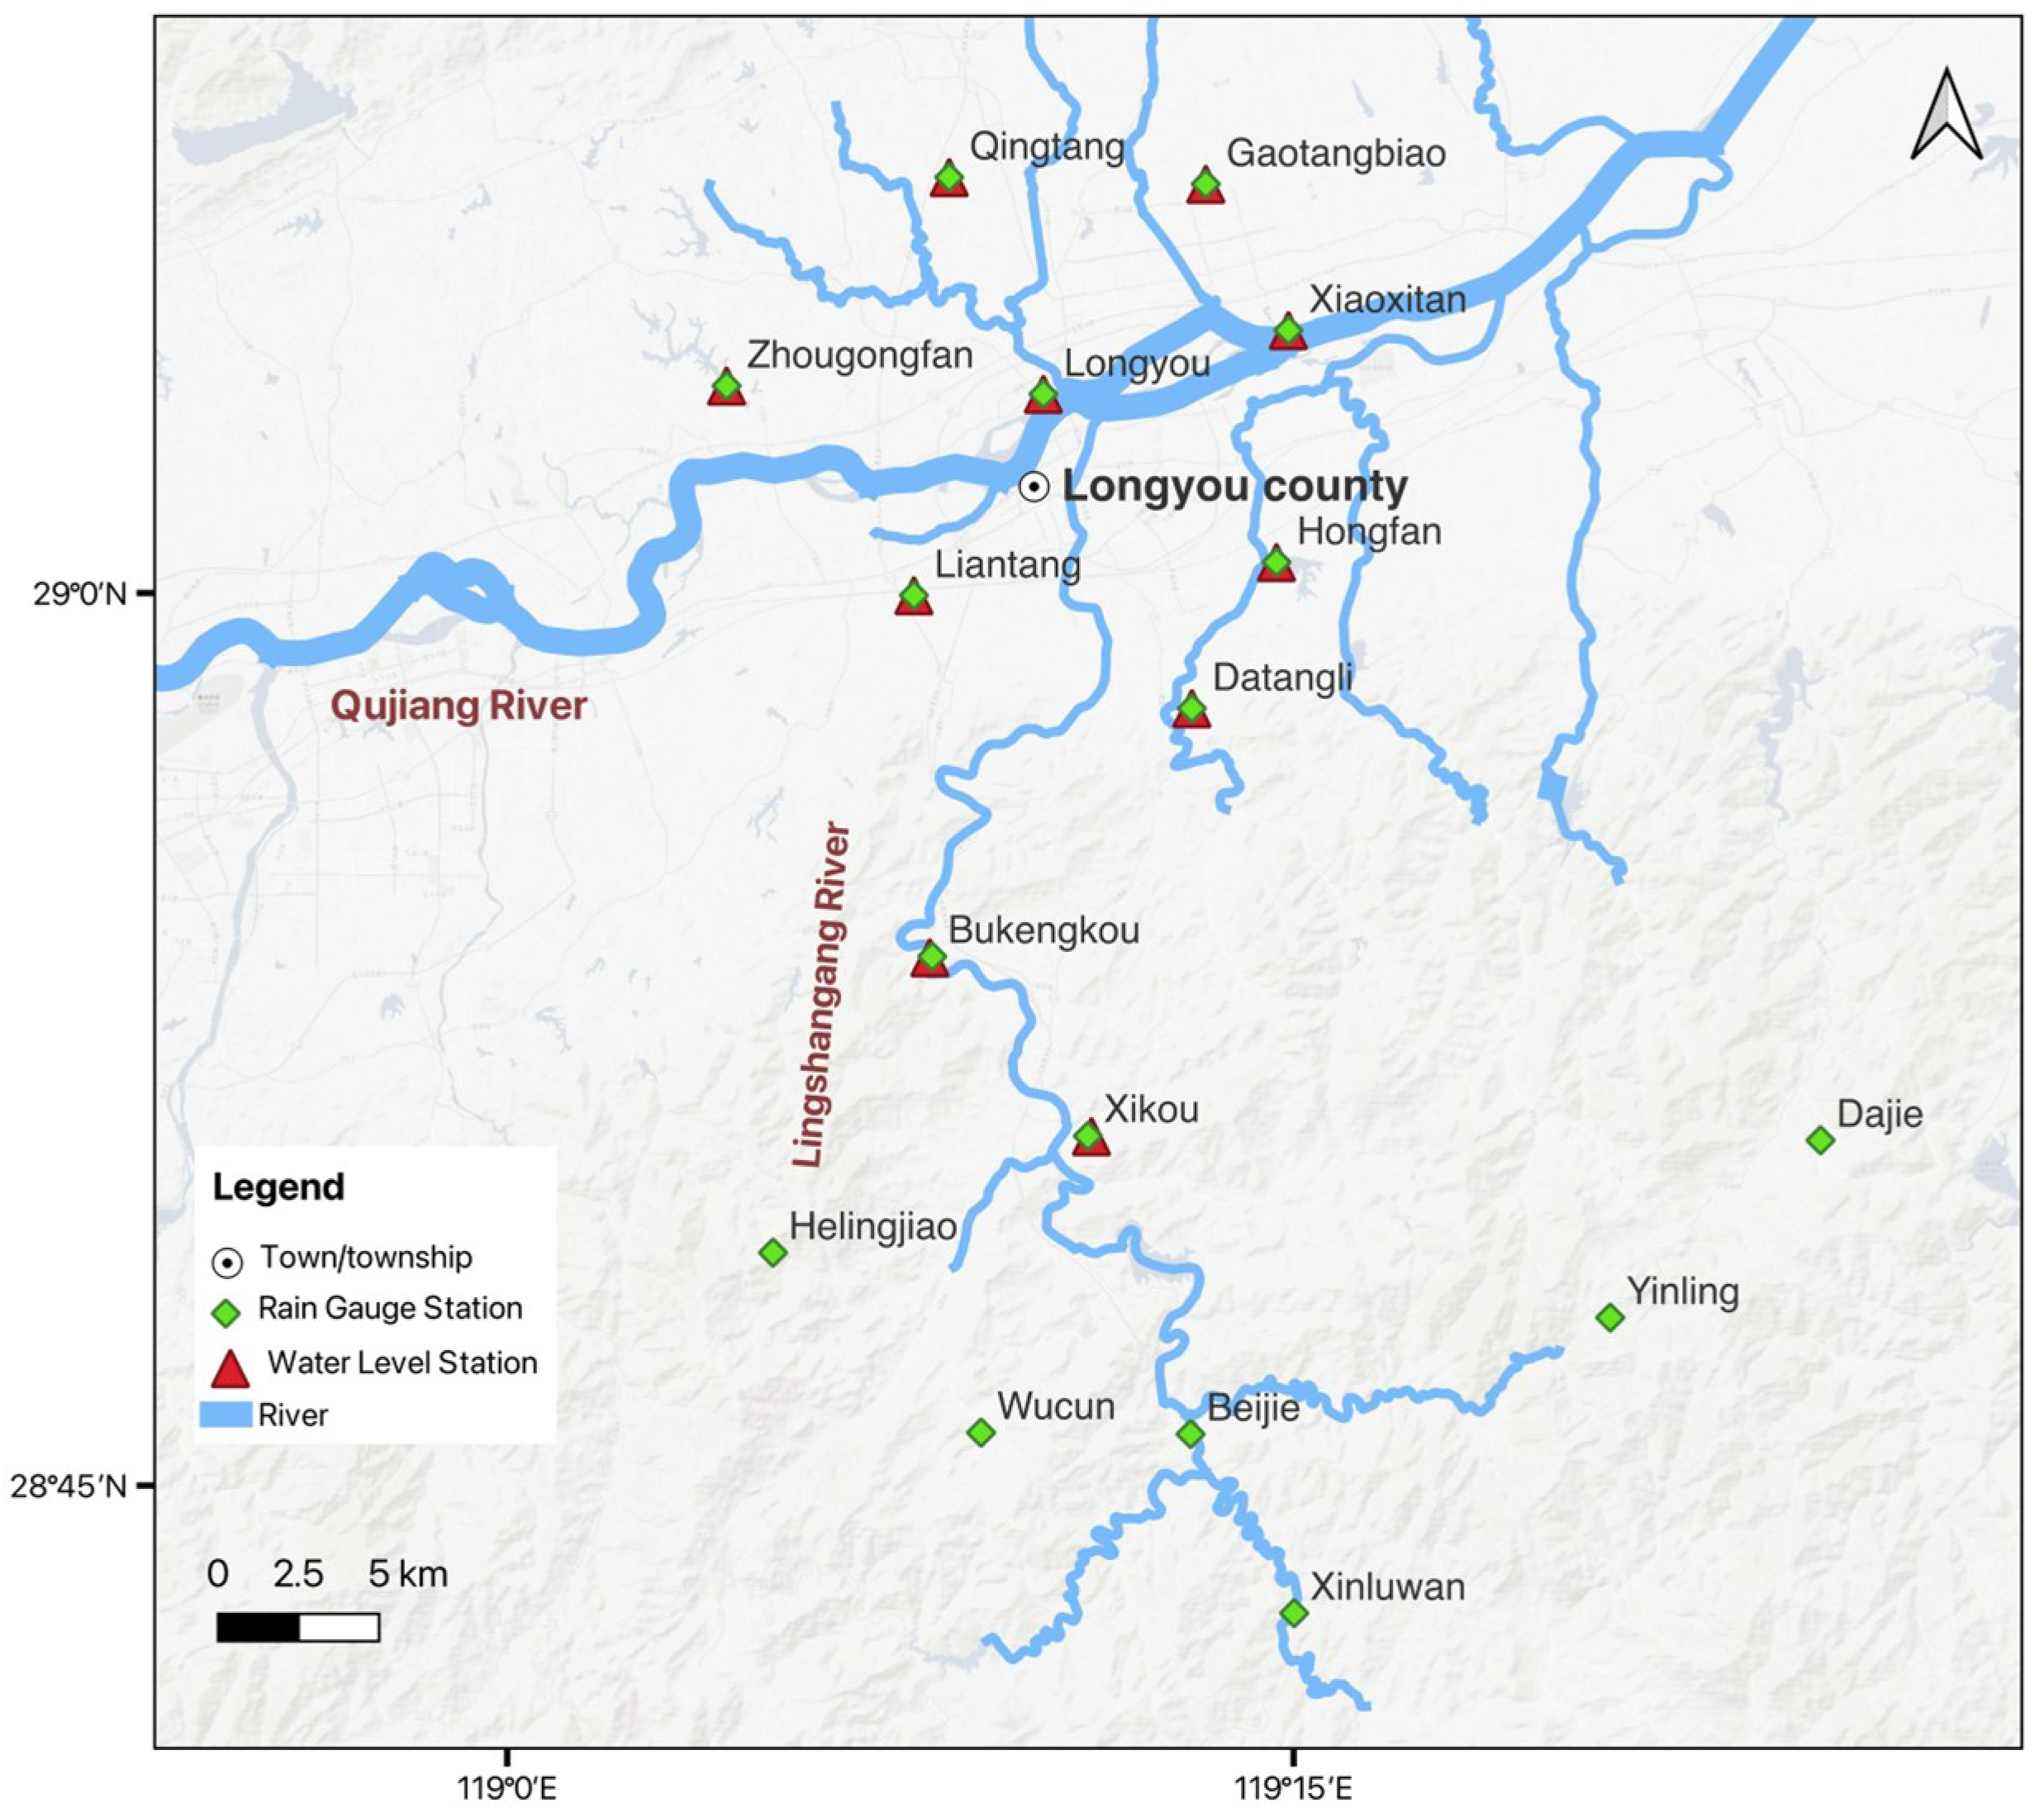
The Qujiang River, located in western Zhejiang Province, is a major tributary of the Qiantang River basin. It originates in Xiuning County, Anhui Province, and flows through Kaihua County, Jiangshan City, Quzhou City, and Longyou County in Zhejiang Province, eventually merging into the Lanjiang River. As shown in Figure 1, the river spans 140 km, with a total drainage area of 11,138 km2 and an average annual discharge of 386 m3/s [22]. The basin experiences a subtropical monsoon climate, with an average annual precipitation of 1843 mm. However, precipitation is unevenly distributed throughout the year, with higher precipitation occurring in spring and summer (May to September), and lower precipitation in autumn and winter (October to February). The basin is predominantly hilly and mountainous, with such terrain accounting for 83% of its total area. Due to the region’s complex topography, typhoons rarely penetrate the basin in summer, resulting in limited typhoon-induced rainfall [23].
The Lingshangang River is a tributary on the right bank of the Qujiang River. It is a typical mountainous stream with a steep gradient and rapid flow. During heavy rainfall events, the river’s discharge rises rapidly, resulting in highly destructive floods. Downstream from Xikou Town, the river channel becomes increasingly winding, forming numerous sediment deposition zones [24].

2.2. Data

The data employed in this study are comprehensive, aimed at fully representing the underlying surface conditions of the study area (see Table 1). These include fundamental geographic data (such as digital elevation model, land use, administrative divisions, residential areas, transportation networks, and river systems), hydrological data (including hourly rainfall, water level, and discharge records), and hydraulic engineering data (including the locations and attributes of levees, sluice gates, river longitudinal and cross-sections, bridges, roads, culverts, and pump stations). In addition, historical flood disaster data (such as inundation extent and water depth), socio-economic data and evacuation information were also collected. Datasets were obtained from Natural Resources Bureau of Longyou and Municipal Water Resources Bureau of Quzhou.

2.3. Methodology

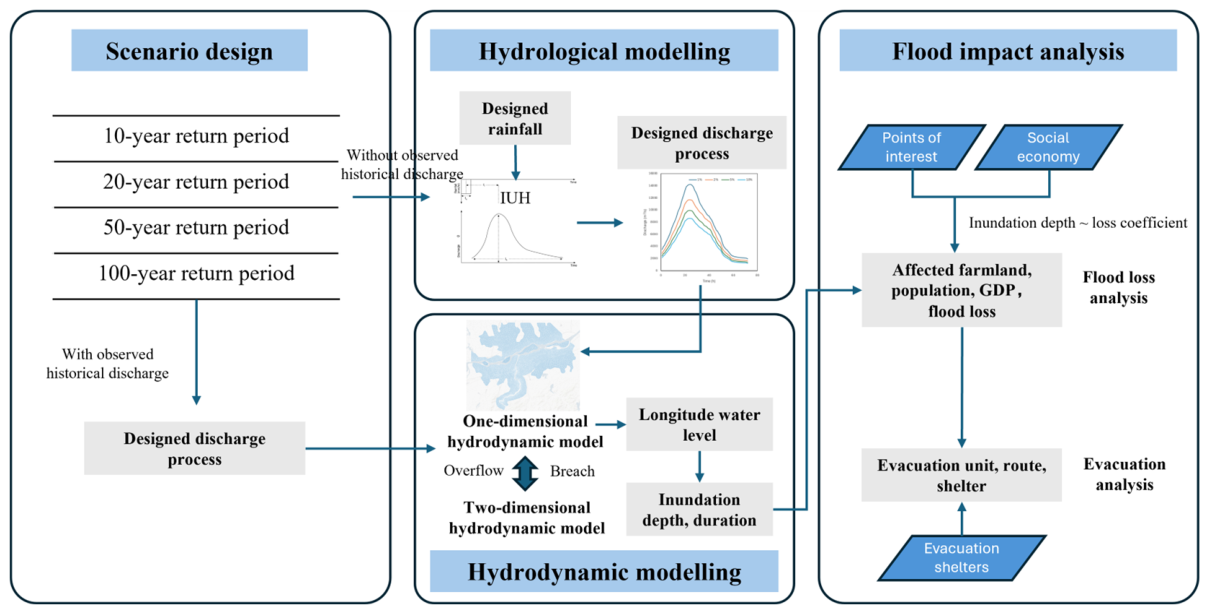
The overall methodology is shown in Figure 2, which systematically integrates scenario design, hydrodynamic modelling, and flood impact analysis to support flood risk management and emergency planning.
First, the designed flood scenarios were developed by conducting frequency analysis corresponding to different return periods, ensuring a comprehensive representation of potential flood hazards under various design standards. These designed floods served as key inputs for the subsequent hydrodynamic modelling. Secondly, the hydrodynamic modelling module employed a coupled 1D–2D modeling approach. The 1D model simulated the temporal and spatial variations of water levels and discharges along river channels. This model was further linked to a 2D floodplain model via weir overflow and breach mechanisms, enabling the simulation of inundation processes across the floodplain surface. The outputs include detailed information on inundation extent, depth, and duration. Finally, the flood impact analysis module overlaid the inundation simulation results with socio-economic data such as farmland distribution, population density, and GDP to quantify flood impacts. Additionally, it incorporated points of interest and evacuation shelter data to identify affected populations, determine evacuation routes, and recommend shelter allocation strategies. This integrated analysis supported decision-making for targeted risk mitigation, emergency response planning and the prioritization of vulnerable areas.

2.3.1. Scenario Design

The designed scenarios are presented in Table 2. The current flood protection standards for the Qujiang River include 10-year, 20-year, and 50-year return periods. To account for higher flood risk, this study analyzed design floods with return periods of 10, 20, 50, and 100 years. Since the Lingshangang River is the branch of the Qujiang River, flood scenarios assumed concurrent flooding in both rivers at corresponding magnitudes.
For the Qujiang River, long-term observed discharge data from the Longyou hydrological station allowed the design discharges to be directly adopted based on previous design reports. Due to the lack of discharge observations for Lingshangang River, the designed rainfall was estimated based on long-term observed precipitation data, and then transformed into runoff hydrographs using the Nash Instantaneous Unit Hydrograph (IUH) method.
Nine rain gauge stations were selected, including Xinluwan, Beijie, Yinling, Wucun, Dajie, Xikou, Bukengkou, Helingjia, and Longyou. Annual maximum rainfall series from 1957 to 2012 were used as historical observations. Rainfall scenarios were generated by fitting the long-term rainfall data to a Log-Pearson Type III distribution, from which design rainfall values were derived. Hourly rainfall was allocated using an attenuation index N p = 0.57 . The hourly rainfall F i was calculated as
F i = 24 N p 1 × ( i 1 N p i 1 1 N p )
where i is the hourly time step from 1 to 24.
The study area is located in a humid southern region of China, where saturation-excess runoff is the dominant runoff mechanism. This process assumes that surface runoff does not occur until the soil moisture reaches field capacity. In this study, runoff was estimated using a simplified loss method. The field capacity I m a x was set to 100 mm, with an initial soil moisture of 75 mm. When the runoff started, a constant loss rate of 1 mm/h was applied. The parameter values were selected based on regional soil characteristics and established ranges reported for humid catchments in southern China. In terms of runoff concentration calculation, the Nash instantaneous unit hydrograph (IUH) method was used [25].
Additionally, levee breach scenarios were considered. From the historical flooding events, two breaches were selected: the right bank levee at Duxiantou on the Lingshangang River and the right bank levee at Zhanjia Levee on the Qujiang River. In this study, the levee breaches as well as a 20-year return period flood were examined based on the current levee system.

2.3.2. Coupled 1D–2D Hydrodynamic Modelling

The coupled 1D–2D hydrodynamic simulations were conducted using the Integrated Flood Modeling System (IFMS), developed by the China Institute of Water Resources and Hydropower Research, which supports dynamic coupling between river channel flow and floodplain inundation [26].
The 1D hydrodynamic simulation of unsteady open channel flow was based on the Saint-Venant equations [27].
A t + Q x = q
t Q A + x Q 2 2 A 2 + g h x + g S f = 0
where A is cross-sectional flow area, m3; Q is discharge, m3/s; t is time, s; x is horizontal coordinate along the flow direction, m; q is lateral inflow per unit length, m2/s; α is momentum correction coefficient; g is gravitational acceleration, m/s2; h is water stage, m; and S f is friction slope.
The equations for the 2D hydrodynamic model were the shallow water equations [28], expressed as follows:
h t + h u x + h v y = 0
h u t + x h u 2 + 1 2 g h 2 + h u v y = S x
h u t + h u v x + y h v 2 + 1 2 g h 2 = S y
where u and v are velocity components in the x and y directions, m/s; and S x and S y are the source terms.
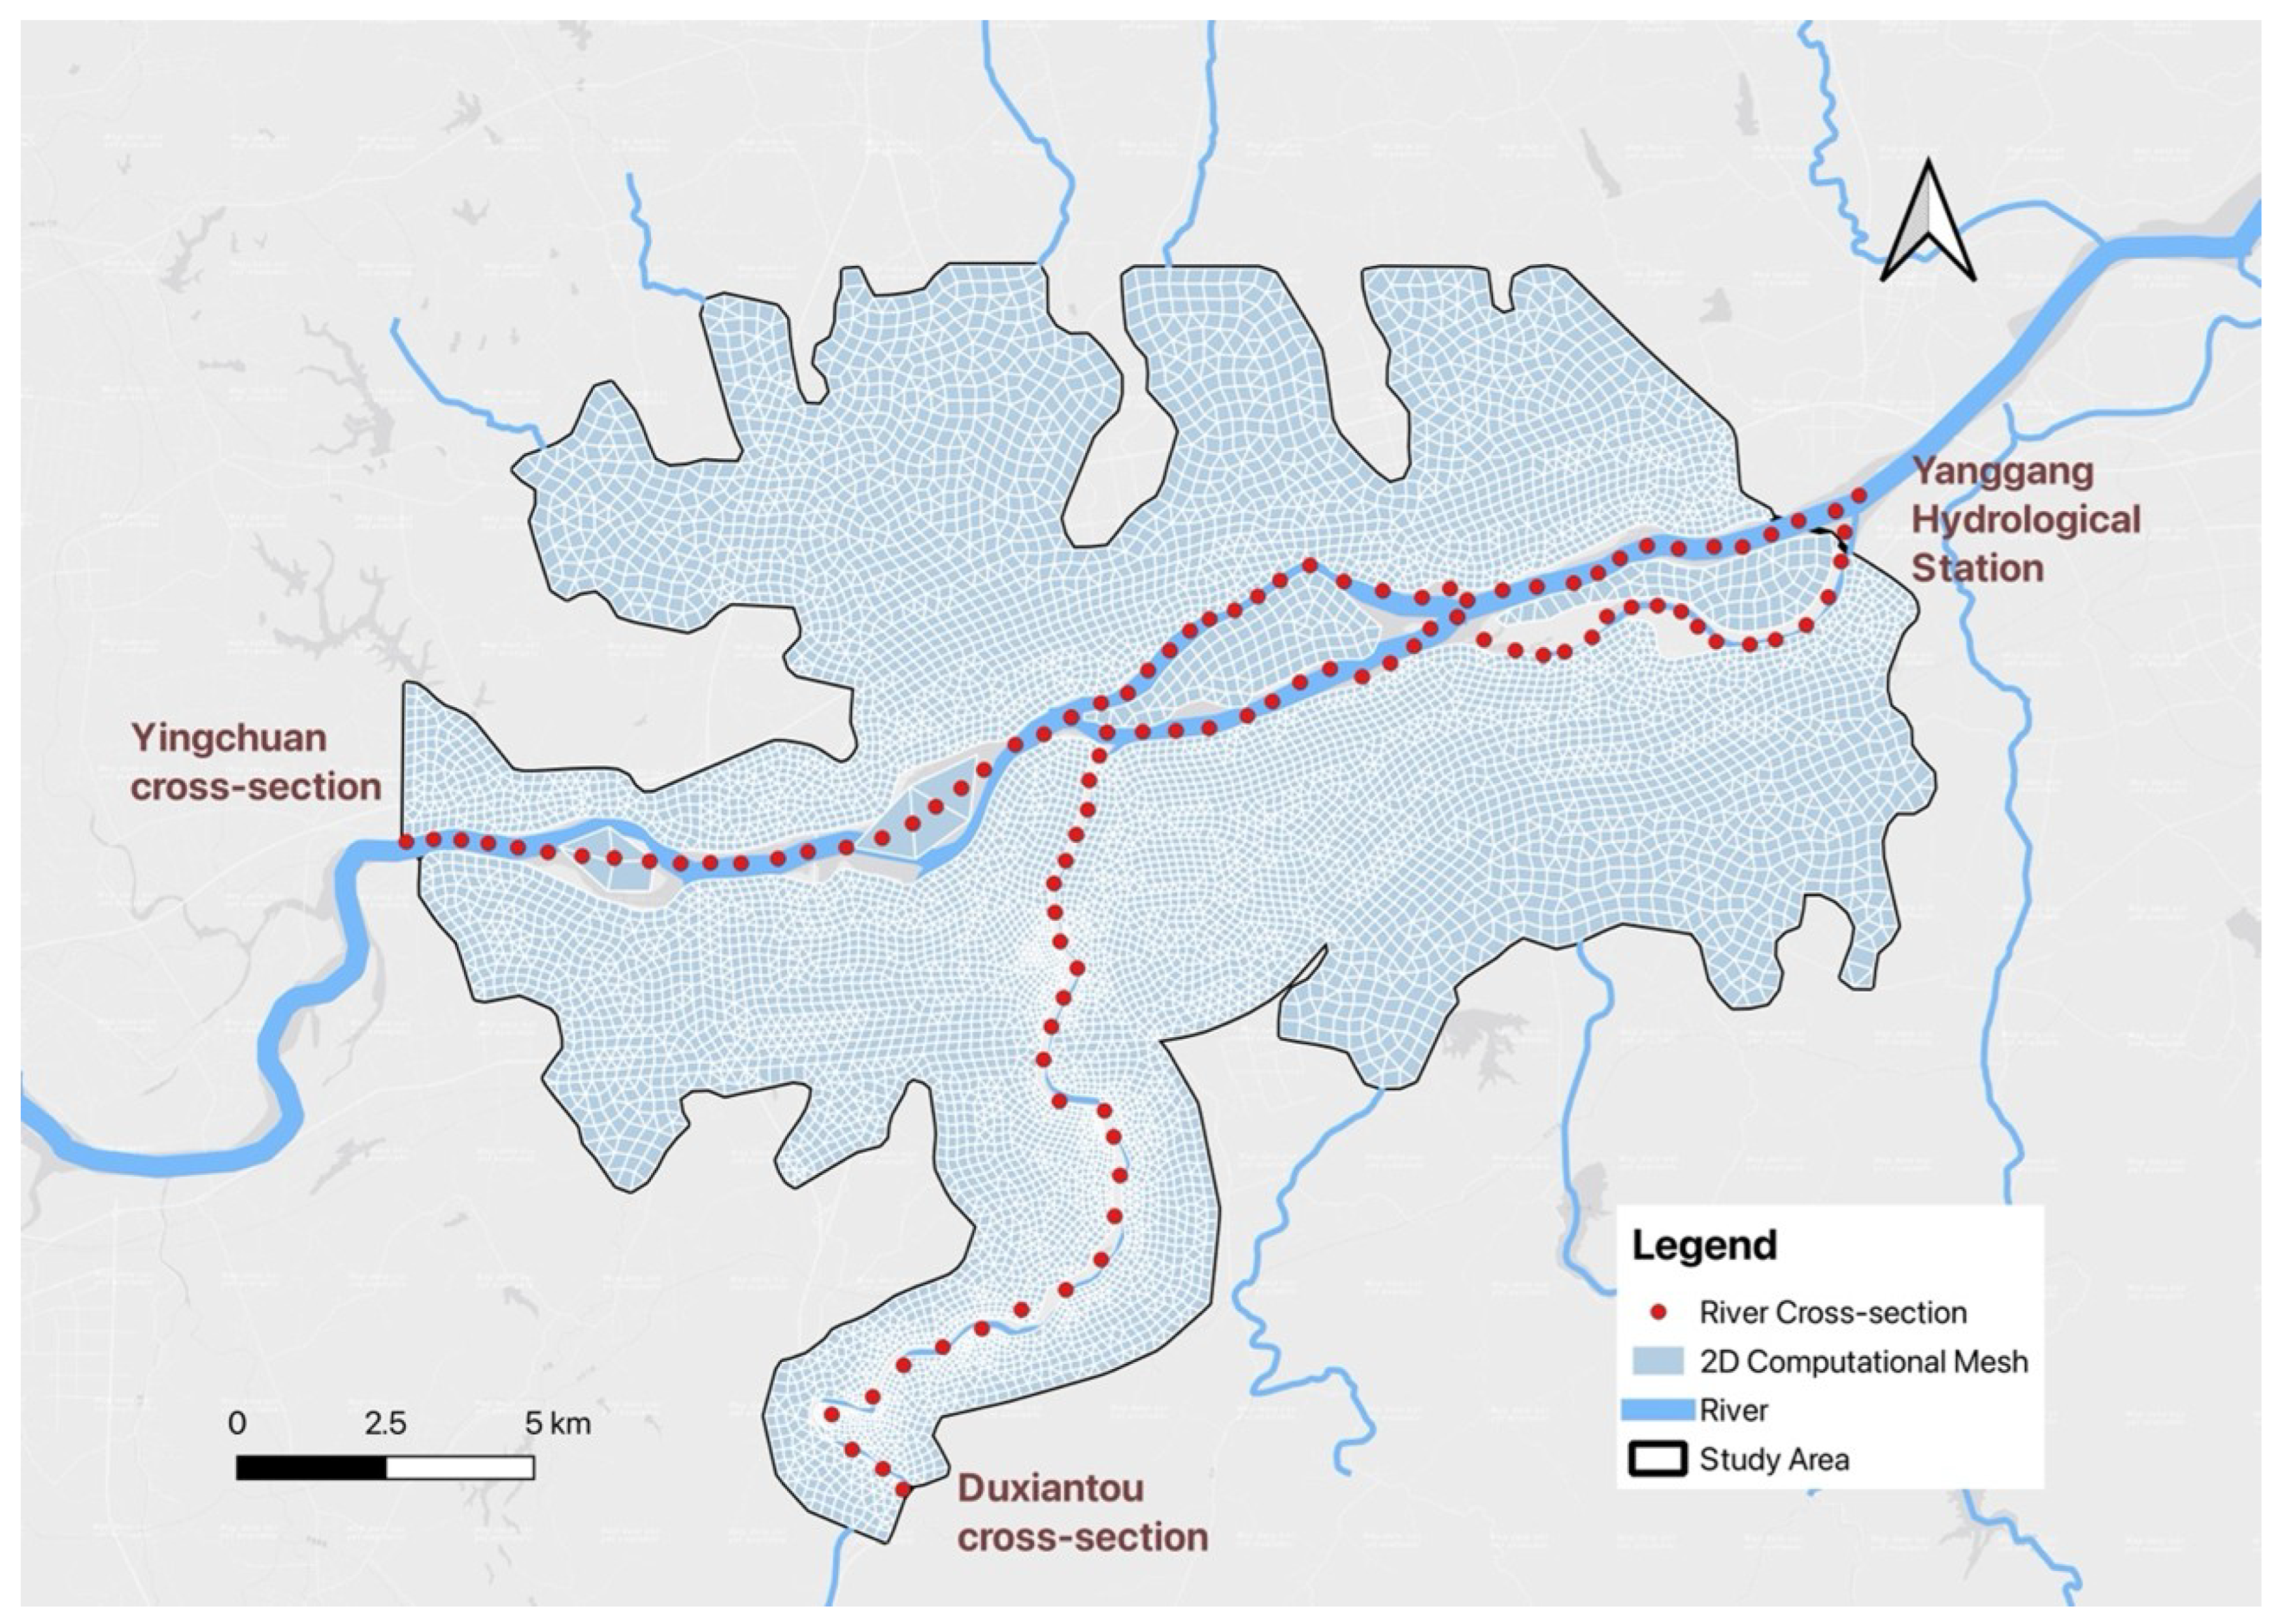
The one-dimensional (1D) river hydrodynamic model covered two main sections: the Qujiang River, spanning approximately 29 km from Yingchuan cross-section to Yanggang Hydrological Station, and the Lingshangang river from Duxiantou cross-section to its confluence with the Qujiang River, with a length of approximately 20 km (see Figure 3). Given that the main course of the Qujiang River was characterized by high flood peaks, a composite channel roughness coefficient ranging from 0.025 to 0.035 was adopted. The upstream boundary of the Qujiang Longyou reach was defined at the Yingchuan cross-section of the main channel. The downstream boundary was set at the Yanggang Hydrological Station. For the Lingshangang River, the upstream boundary was defined at the Duxiantou cross-section.
Based on the extent of the 1D hydrodynamic model, areas with elevations below 360 m were delineated as the computational domain for the two-dimensional (2D) model, as illustrated in Figure 3. The 2D mesh was generated using irregular polygonal discretization, consisting of 10,858 elements with an average cell area of 0.002 km2. Manning’s roughness coefficients were assigned to the 2D computational mesh based on land use conditions within the study area. The values are shown in Table 3.
The 1D river hydrodynamic model and the 2D overland hydrodynamic model were coupled through the lateral connection. The cross-sectional identifiers of the 1D hydrodynamic model were mapped in a one-to-one correspondence with the grid cell identifiers along the river within the 2D model, thereby defining the coupled zone. If an overflow occurred at the coupling zone, the channel discharge Q derived from the weir flow equation (see Equation (7)) served as the boundary condition for initiating computations in the 2D model. Subsequently, the grid-averaged water level simulated by the 2D model was transferred back to the 1D model, where it was incorporated as the input for the subsequent computational time step [30,31].
Levee breach flow was represented also using weir-type overflow formulation (see Equation (7)). The breach was assumed to occur instantaneously with a width of 100 m. The crest elevation of the breach was set equal to the local ground elevation, allowing floodwater to freely spill onto the floodplain once overtopping occurs.
Q w = C d L 2 g h 1.5
where Q w is the discharge of overflow calculated by weir flow equation, m3/s; C d is the weir discharge coefficient (0.4–0.6), accounting for surface roughness and downstream submergence during levee overtopping; L is the width of the overflow, m; g is the gravitational acceleration (9.81 m/s2); h is the water head of river channel, m.

2.3.3. Flood Impact Analysis

Using socio-economic statistics and land use data, a statistical analysis of flood-affected socio-economic indicators was conducted. By performing spatial overlay analysis of land use vector data and flood inundation vector data, different land use types within the flooded areas were identified and classified. Subsequently, for each administrative township, the impacts of flooding on population, agricultural land, and GDP were estimated proportionally based on the ratio of inundated area to the total area. Specifically, the number of affected residents, flooded farmland, and GDP were calculated by assuming that each element is uniformly distributed across the township, so that the fraction of the area submerged corresponded to the same fraction of population, farmland, and GDP impacted.
Economic losses were estimated based on the relationship between inundation depth and flood loss rate [32,33]. The simulated inundation depths were first classified into predefined depth intervals corresponding to those in Table 4. For each flooded spatial unit, a loss rate was assigned according to its inundation depth and land use type. The economic loss was then calculated as the product of inundated area, asset value, and the corresponding loss rate, and aggregated over all flooded units. In this way, the contribution of each depth interval was weighted by its spatial extent within the flooded area. The relationship between flood loss rate and inundation depth was derived from the Quzhou Municipal Water Resources Bureau, as shown in Table 4.
Furthermore, based on the inundation extents and impacts under different scenarios, evacuation routes were planned by integrating the locations of evacuation shelters and administrative village data. Following the principle of allocating evacuees to the nearest shelter, optimal evacuation routes were determined, and evacuation maps were subsequently generated using the QGIS platform. This approach provides practical guidance for emergency management and facilitates rapid evacuation planning to minimize flood risks and ensure the safety of affected populations.

3. Results

3.1. Flood Simulation

The designed discharge processes at the upstream boundaries of the Qujiang River (Yingchuan cross-section) and the Lingshangang River (Duxiantou cross-section), as well as the corresponding downstream boundary conditions at the Yanggang hydrological station, are presented in Table 5. These values represent the peak discharges and water levels under different return period scenarios and serve as key inputs for the hydrodynamic simulations. The results were derived based on the scenario design and rainfall-runoff transformation methodology described in Section 2.3.1.
The hydrodynamic model was calibrated using four historical flood events, namely 20170625, 20200709, 20210702, and 20220620. The selected calibration events represent typical flood conditions in the study area, with peak water levels ranging from 43.02 m to 43.96 m. The flood event of 20150618 was selected as the validation case due to its representativeness of typical flood behavior.
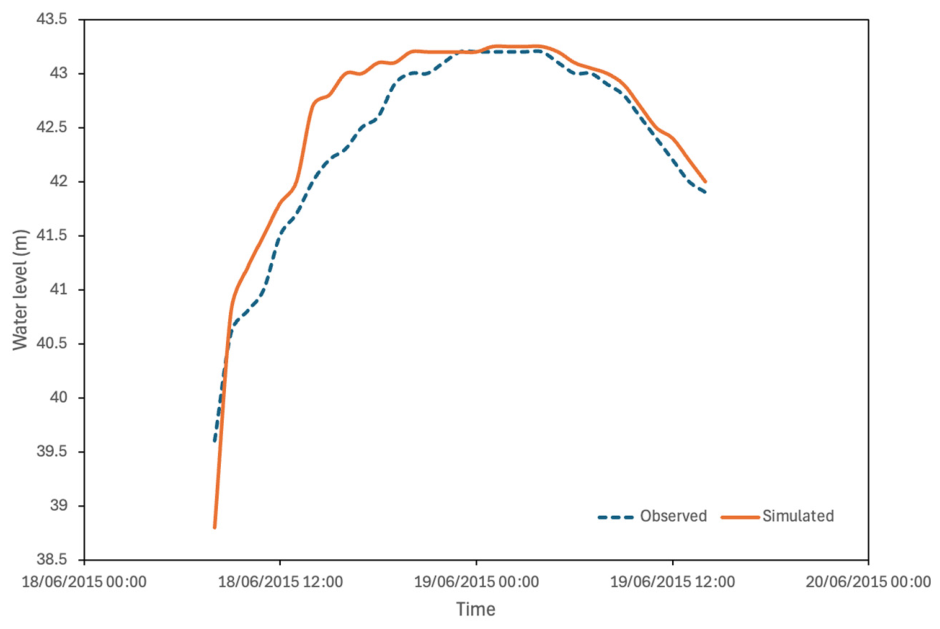
Simulated water levels at the Longyou hydrological station were compared with observed data, as shown in Table 6. The calibration results show good agreement between simulated and observed peak water levels, with errors ranging from −0.27 m to 0.18 m. For the validation event, the peak water level error is 0.05 m. Figure 4 presents the comparison between simulated and observed water levels for the validation event at the Longyou hydrological station, showing good agreement in both peak value and overall hydrograph trend. These results indicate that the model can reliably reproduce flood processes under typical hydrological conditions and is suitable for subsequent flood simulation and analysis.
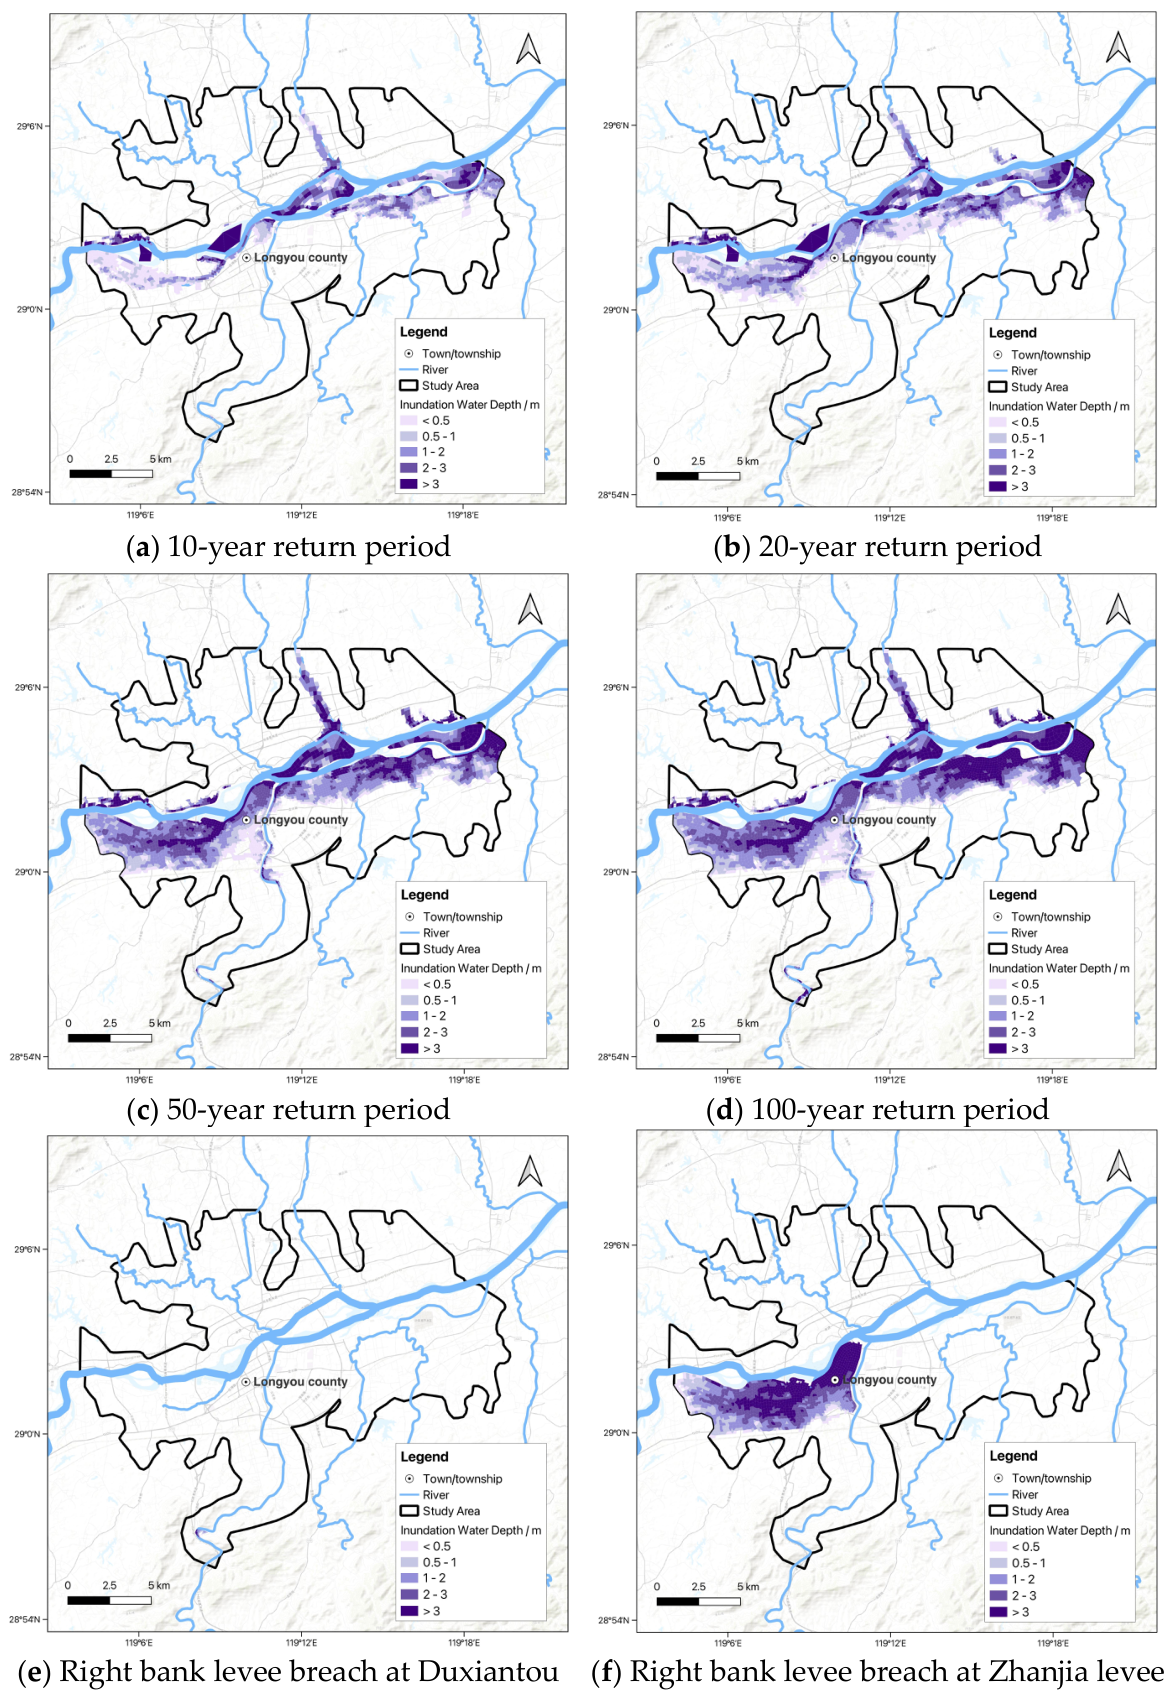
The simulation results of flood design scenarios are presented in Figure 5. Figure 5 indicates that flooding originates near the Zhanjia Levee and expands across low-lying areas toward Longyou County, intensifying with increasing return periods, while breaches along the Qujiang River produce significantly more extensive and persistent inundation than that along the Lingshangang River.
For a 10-year return period flood, levee overtopping results in a maximum inundation depth of 8.08 m, a maximum velocity of 1.6 m/s, and a maximum duration of 69 h. The results reveal that overtopping initially occurs near the Zhanjia levee, where water rapidly spreads along low-lying areas, eventually inundating Longyou County. For a 20-year return period flood, the maximum inundation depth increases to 8.36 m, with a velocity of 2 m/s, and a duration of 69 h. For a 50-year return period flood, the maximum depth reaches 9.07 m, with a velocity of 4.3 m/s and an inundation duration of 70 h. In the case of a 100-year return period flood, the maximum inundation depth reaches 10.04 m, with a velocity of 4.6 m/s and a duration of 70 h.
In the scenario of levee breach at Duxiantou along the Lingshangang River, the resulting inundation is relatively limited, covering only 0.17 km2, with a maximum water depth of 4.84 m, a peak velocity of 0.29 m/s, and a peak inundation duration of approximately 5 h. The inundation in Scenario 5 is confined to the right bank of Duxiantou and affects only a limited portion of the Guantang Town. This area is located in a mountainous region with relatively steep terrain, which restricts lateral floodwater spreading. In contrast, a breach at the Zhanjia Levee along the Qujiang River results in a substantially larger inundated area of 29.98 km2, characterized by a maximum inundation depth of 9.44 m, a peak velocity of 1.9 m/s, and an extended duration of up to 56 h, indicating a significantly greater flood hazard in terms of magnitude and persistent inundation. The affected area extends across the right bank of the Qujiang River and inundates the urban center of Longyou County, where population density and economic assets are highly concentrated.

3.2. Flood Impact Results

Flood impact assessment results are summarized in Table 7. Scenarios 1 to 4 correspond to design floods with return periods of 10, 20, 50, and 100 years, respectively. The results show a progressive increase in impacts, with inundated areas expanding from 35.69 km2 to 80.78 km2, affecting populations increasing from 173,000 to 387,000. Inundated farmland also increases steadily from 9.31 km2 to 18.98 km2. Correspondingly, estimated flood losses rise significantly from 404.59 million to 1186.34 million CNY, indicating the growing socio-economic vulnerability.
Scenarios 5 and 6 represent levee breach scenarios under a 20-year return period flood. In Scenario 5, the inundated area is limited to only 0.17 km2, which contains comparatively low concentrations of population and economic assets, resulting in a minimal affected population of 400, and the flood losses are 4.38 million CNY. In contrast, Scenario 6 presents a significantly higher flood risk, with an inundated area of 29.98 km2 and total flood losses reaching 426.73 million CNY, highlighting the severe socio-economic consequences of levee breaches in densely developed areas.
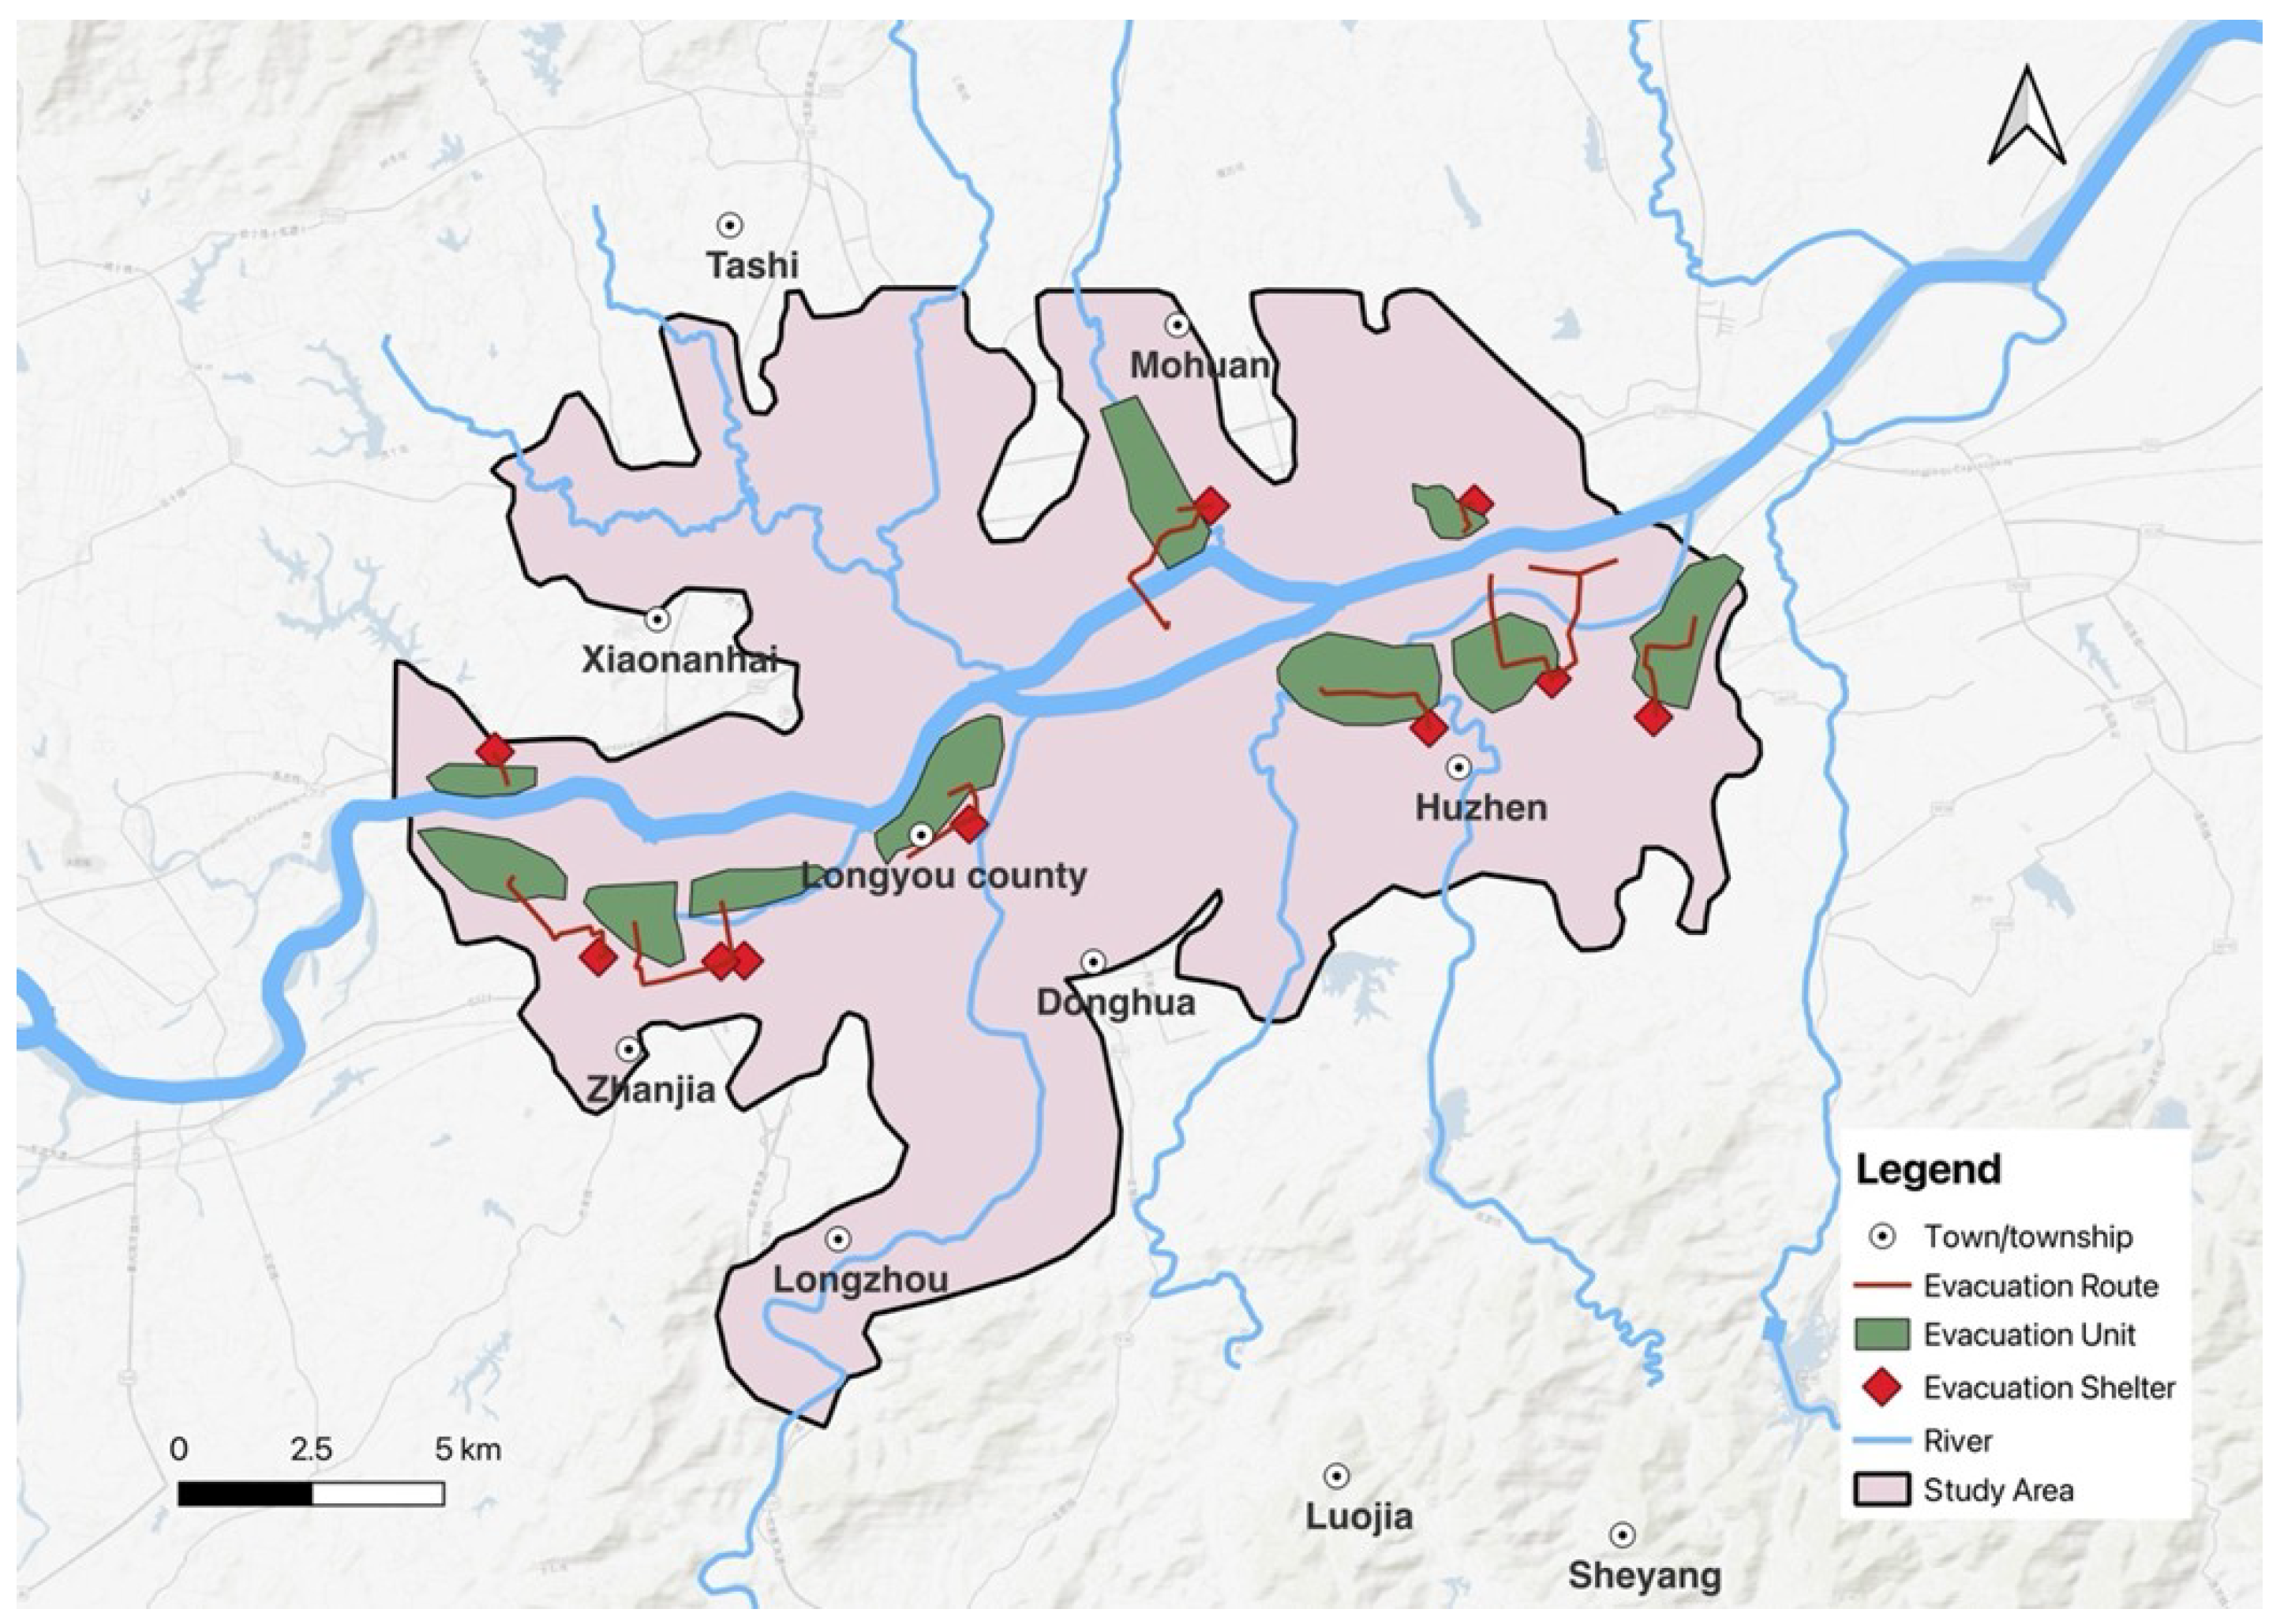
For this study, the 20-year return period event was adopted as the threshold, consistent with regional flood control standards and commonly used in emergency planning as a moderate-to-high risk scenario that balances event probability and potential impact. Ten sites not affected by flooding are selected as evacuation and resettlement areas (shown as red shaded areas in Figure 6), based on municipal flood control and emergency plans and their elevation and safety from inundation. Evacuation units (shown as green shaded areas in Figure 6) are defined at the administrative village level, following the principle of nearest resettlement, with a maximum evacuation distance not exceeding 15 km.
Evacuation routes (shown as red lines in Figure 6) are determined using a shortest-path approach within the road network in QGIS, ensuring that each village is connected to its nearest available safe shelter while avoiding flooded areas. This approach minimizes travel distance while ensuring complete coverage of affected populations. Figure 6 illustrates that most villages are assigned to nearby safe zones with relatively direct routing.

4. Discussion

4.1. Implications

This study applies a 1D–2D hydrodynamic modeling approach to simulate designed flood scenarios in the Qujiang River and conduct socio-economic flood impact assessment. The analysis provides a deep understanding of potential flood behavior and associated risks under various design conditions, offering valuable insights for flood management and evacuation planning.
Simulation results for return periods of 10-, 20-, 50-, and 100-year design floods reveal a clear increase in flood extent, inundation depth, and duration with increasing return periods. The inundation maps for the four return periods are consistent with the existing flood defense standards, which are designed for a 10–20-year return period, thereby supporting the validity of the model simulations. Under the 100-year flood scenario, the maximum inundation depth reaches 10.04 m, with a maximum inundation duration of 69–70 h. Notably, the difference between Scenarios 5 and 6 shown in Table 7 is primarily attributed to the lower elevation at the Zhanjia Levee breach location, which facilitates more extensive floodwater spreading and results in larger inundation areas and greater flood losses. These findings regarding levee breach scenarios highlight the need for tailored emergency response strategies. For instance, the Qujiang breach scenario demands preparedness for prolonged flooding, extensive evacuation planning, and sustained relief efforts. Furthermore, this suggests potential structural risks to buildings and infrastructure, emphasizing the necessity of integrating levee breach risks into resilient infrastructure design [34]. Beyond simply increasing levee height or strength, resilience in this context requires a comprehensive approach: incorporating nature-based solutions to reduce hydraulic pressure [35], applying advanced materials and erosion-resistant revetments [36], and designing redundancy through compartmentalization and controlled retention zones [37].
Flood loss assessments show a direct correlation between flood magnitude and damage scale. As the return period increases, so do the affected population, flooded farmland area, and economic losses. Under the 100-year scenario, the affected GDP is projected to approach 3 billion CNY, with over 3.8 million people impacted. These results highlight the considerable economic vulnerability of Longyou County and the importance of integrated flood risk management that considers land use planning, early warning systems, and infrastructure improvement [38,39].

4.2. Limitations and Future Work

While the models demonstrate satisfactory performance under current assumptions, uncertainties remain due to simplified assumptions of the design scenarios, static land use classification, and lack of real-time dynamic socio-economic behavior. Future improvements could include: (1) incorporating rainfall-runoff models [40], (2) expanding model validation with more flood events, and (3) conducting a more comprehensive analysis of model uncertainty [41]. Moreover, future work could integrate climate change scenarios and stakeholder-based vulnerability mapping to enhance adaptive flood management strategies.

5. Conclusions

This study presents an integrated flood risk assessment framework combining coupled 1D–2D hydrodynamic modeling with socio-economic impact analysis for the Qujiang River Basin. The results demonstrate that flood extent, depth, and duration increase significantly with return period, while levee breach scenarios introduce substantially higher and more complex risks than design flood conditions alone.
The findings highlight the critical role of the dual-river confluence system, where interactions between the flash flood-prone Lingshangang River and the Qujiang River generate compound flood dynamics that amplify inundation extent and duration. In particular, terrain conditions and breach location strongly influence flood propagation and associated damages.
This research demonstrates the importance of integrated hydrodynamic modeling for flood risk assessment and disaster mitigation planning. The results offer scientific support for the design of the flood defense system, local land use planning and emergency response strategies. Future work should incorporate climate change projections, dynamic land use patterns, and participatory decision-making to support holistic, resilient, and adaptive flood risk management in the Longyou region.


Author Contributions

Conceptualization, Q.H. and H.Z.; methodology, Q.H. and X.D.; software, H.S.; validation, Q.H. and A.X.; formal analysis, X.D.; investigation, A.X.; resources, Q.H.; data curation, H.S.; writing—original draft preparation, Q.H., X.D. and H.S.; writing—review and editing, A.X. and H.Z.; visualization, H.Z.; supervision, H.Z. All authors have read and agreed to the published version of the manuscript.

Funding

This research was supported by the National Key Research and Development Program of China (Grant No. 2024YFC3211400).

Data Availability Statement

The original contributions presented in this study are included in the article. Further inquiries can be directed to the corresponding author.

Conflicts of Interest

The authors declare no conflicts of interest.

References

  1. Duan, Y.; Xiong, J.; Cheng, W.; Li, Y.; Wang, N.; Shen, G.; Yang, J. Increasing global flood risk in 2005–2020 from a multi-scale perspective. Remote. Sens. 2022, 14, 5551. [Google Scholar] [CrossRef]
  2. Hirabayashi, Y.; Mahendran, R.; Koirala, S.; Konoshima, L.; Yamazaki, D.; Watanabe, S.; Kanae, S. Global flood risk under climate change. Nat. Clim. Change 2013, 3, 816–821. [Google Scholar] [CrossRef]
  3. Gu, X.; Zhang, Q.; Li, J.; Chen, D.; Singh, V.P.; Zhang, Y.; Yu, H. Impacts of anthropogenic warming and uneven regional socio-economic development on global river flood risk. J. Hydrol. 2020, 590, 125262. [Google Scholar] [CrossRef]
  4. Hirabayashi, Y.; Alifu, H.; Yamazaki, D.; Imada, Y.; Shiogama, H.; Kimura, Y. Anthropogenic climate change has changed frequency of past flood during 2010–2013. J. Hydrol. Reg. Stud. 2021, 8, 36. [Google Scholar]
  5. Keller, L.; Zischg, A.P.; Mosimann, M.; Rössler, O.; Weingartner, R.; Martius, O. Large ensemble flood loss modelling and uncertainty assessment for future climate conditions for a Swiss pre-alpine catchment. Sci. Total Environ. 2019, 693, 133400. [Google Scholar] [PubMed]
  6. Vojtek, M.; Petroselli, A.; Vojteková, J.; Asgharinia, S. Flood inundation mapping in small and ungauged basins: Sensitivity analysis using the EBA4SUB and HEC-RAS modeling approach. Hydrol. Res. 2019, 50, 1002–1019. [Google Scholar] [CrossRef]
  7. Xing, Y.; Shao, D.; Yang, Y.; Ma, X.; Zhang, S. Influence and interactions of input factors in urban flood inundation modeling: An examination with variance-based global sensitivity analysis. J. Hydrol. 2021, 600, 126524. [Google Scholar] [CrossRef]
  8. Xu, S.; Qin, T.; Lv, X.; Lu, J.; Feng, J.; Gao, H.; Yang, Y. Analysis of runoff and sediment evolution and attribution in the source regions of the Yangtze and Yellow Rivers. J. Hydrol. Reg. Stud. 2025, 57, 102110. [Google Scholar] [CrossRef]
  9. Zeng, F.; He, Q.; Li, Y.; Shi, W.; Yang, R.; Ma, M.; Di, D. Reduced runoff in the upper Yangtze River due to comparable contribution of anthropogenic and climate changes. Earth’s Future 2024, 12, e2023EF004028. [Google Scholar] [CrossRef]
  10. Zhang, Z.; Li, Q.; Liu, C.; Ding, L.; Ma, Q.; Chen, Y. Driving Effects and Spatial-Temporal Variations in Economic Losses Due to Flood Disasters in China. Water 2022, 14, 2266. [Google Scholar] [CrossRef]
  11. Apel, H.; Thieken, A.H.; Merz, B.; Blöschl, G. Flood risk assessment and associated uncertainty. Nat. Hazards Earth Syst. Sci. 2004, 4, 295–308. [Google Scholar] [CrossRef]
  12. Merz, B.; Aerts, J.; Arnbjerg-Nielsen, K.; Baldi, M.; Becker, A.; Bichet, A.; Blöschl, G.; Bouwer, L.M.; Brauer, A.; Cioffi, F.; et al. Floods and climate: Emerging perspectives for flood risk assessment and management. Nat. Hazards Earth Syst. Sci. 2014, 14, 1921–1942. [Google Scholar] [CrossRef]
  13. Lin, W.; Sun, Y.; Nijhuis, S.; Wang, Z. Scenario-based flood risk assessment for urbanizing deltas using future land-use simulation (FLUS): Guangzhou Metropolitan Area as a case study. Sci. Total Environ. 2020, 739, 139899. [Google Scholar] [CrossRef] [PubMed]
  14. Rodríguez-Espíndola, O.; Gaytán, J. Scenario-based preparedness plan for floods. Nat. Hazards 2015, 76, 1241–1262. [Google Scholar] [CrossRef]
  15. D’Oria, M.; Maranzoni, A.; Mazzoleni, M. Probabilistic assessment of flood hazard due to levee breaches using fragility functions. Water Resour. Res. 2019, 55, 8740–8764. [Google Scholar] [CrossRef]
  16. Kachholz, F.; Tränckner, J. A model-based tool for assessing the impact of land use change scenarios on flood risk in small-scale river systems—Part 1: Pre-processing of scenario-based flood characteristics for the current state of land use. Hydrology 2021, 8, 102. [Google Scholar] [CrossRef]
  17. Scopetani, L.; Francalanci, S.; Paris, E.; Faggioli, L.; Guerrini, J. Decision support system for managing flooding risk induced by levee breaches. Int. J. River Basin Manag. 2024, 22, 109–120. [Google Scholar] [CrossRef]
  18. Peker, İ.B.; Gülbaz, S.; Demir, V.; Orhan, O.; Beden, N. Integration of HEC-RAS and HEC-HMS with GIS in flood modeling and flood hazard mapping. Sustainability 2024, 16, 1226. [Google Scholar] [CrossRef]
  19. Nigussie, T.A.; Altunkaynak, A. Modeling the effect of urbanization on flood risk in Ayamama Watershed, Istanbul, Turkey, using the MIKE 21 FM model. Nat. Hazards 2019, 99, 1031–1047. [Google Scholar] [CrossRef]
  20. Zhong, H.; Zhang, B.; Ma, T.; Qi, X.; Wang, X.; Shang, H.; Fang, W. Flood scenario simulation, based on the hydrological and hydrodynamic model in the Puyang River Catchment. Water 2022, 14, 3873. [Google Scholar] [CrossRef]
  21. Shan, X.; Wen, J.; Zhang, M.; Wang, L.; Ke, Q.; Li, W.; Xu, H. Scenario-based extreme flood risk of residential buildings and household properties in Shanghai. Sustainability 2019, 11, 3202. [Google Scholar] [CrossRef]
  22. Li, X.; Zhang, Y.; Xu, L.; Jiang, J.; Zhang, C.; Wang, G.; Tian, D. Hydrochemical Characteristics and Dominant Controlling Factors of the Qujiang River Under Dual Natural-Anthropogenic Influences. Water 2025, 17, 1581. [Google Scholar] [CrossRef]
  23. Liu, Y.; Zhang, C.; Jiang, J.; Zhang, Y.; Wang, G.; Xu, L.; Qu, Z. Interaction between groundwater and surface water in the Qujiang River basin in China: Evidence from chemical isotope measurements. Water 2023, 15, 3932. [Google Scholar] [CrossRef]
  24. Zhang, S.L.; Xia, J.H.; Wang, Y.J.; Wang, Y.; Cheng, Y.Z.; Wang, Q.H.; Liu, Z.W.; Xu, K.J. Calculation and Analysis of Hydrodynamic Characteristics of Jiangxiyan Reach of Lingshan Port, Longyou. Water Resour. Power 2024, 2, 34–37+170. [Google Scholar]
  25. Nash, J.E. The form of the instantaneous unit hydrograph. Comptes Rendus Rapp. Assem. Gen. Tor. 1957, 3, 114–121. [Google Scholar]
  26. Yang, N.; Zhang, T.; Li, J.; Feng, P. Improved comprehensive flood risk index method and multi-scenario flood simulation for downstream area of the reservoir. Water Resour. Manag. 2026, 40, 48. [Google Scholar] [CrossRef]
  27. Strelkoff, T. Numerical solution of Saint-Venant equations. J. Hydraul. Div. 1970, 96, 223–252. [Google Scholar] [CrossRef]
  28. Defina, A. Two-dimensional shallow flow equations for partially dry areas. Water Resour. Res. 2000, 11, 3251–3264. [Google Scholar] [CrossRef]
  29. Engman, E.T. Roughness coefficients for routing surface runoff. J. Irrig. Drain. Eng. 1986, 112, 39–53. [Google Scholar] [CrossRef]
  30. Bladé, E.; Gómez-Valentín, M.; Dolz, J.; Aragón-Hernández, J.L.; Corestein, G.; Sánchez-Juny, M. Integration of 1D and 2D finite volume schemes for computations of water flow in natural channels. Adv. Water Resour. 2012, 42, 17–29. [Google Scholar] [CrossRef]
  31. Mazzoleni, M.; Dottori, F.; Brandimarte, L.; Tekle, S.; Martina, M.L. Effects of levee cover strength on flood mapping in the case of levee breach due to overtopping. Hydrol. Sci. J. 2017, 62, 892–910. [Google Scholar] [CrossRef]
  32. de Moel, H.; Aerts, J.C.J.H. Effect of uncertainty in land use, damage models and inundation depth on flood damage estimates. Nat. Hazards 2011, 58, 407–425. [Google Scholar] [CrossRef]
  33. Wu, X.; Zhou, L.; Gao, G.; Guo, J.; Ji, Z. Urban flood depth-economic loss curves and their amendment based on resilience: Evidence from Lizhong Town in Lixia River and Houbai Town in Jurong River of China. Nat. Hazards 2016, 82, 1981–2000. [Google Scholar] [CrossRef]
  34. Ferrari, A.; Dazzi, S.; Vacondio, R.; Mignosa, P. Enhancing the resilience to flooding induced by levee breaches in lowland areas: A methodology based on numerical modelling. Nat. Hazards Earth Syst. Sci. 2022, 20, 59–72. [Google Scholar] [CrossRef]
  35. Taylor-Burns, R.; Reguero, B.G.; Barnard, P.L.; Beck, M.W. Nature-based solutions extend the lifespan of a regional levee system under climate change. Sci. Rep. 2025, 15, 16218. [Google Scholar] [CrossRef]
  36. Ali, L.; Tanaka, N. Enhancing Levee Resilience Through Material Compatibility: A Comprehensive Study on Erosion Dynamics. Iran. J. Sci. Technol. Trans. Civ. Eng. 2025, 49, 2329–2343. [Google Scholar] [CrossRef]
  37. Collentine, D.; Futter, M.N. Realising the potential of natural water retention measures in catchment flood management: Trade-offs and matching interests. J. Flood Risk Manag. 2018, 11, 76–84. [Google Scholar] [CrossRef]
  38. Brody, S.; Blessing, R.; Sebastian, A.; Bedient, P. Examining the impact of land use/land cover characteristics on flood losses. J. Environ. Plan. Manag. 2014, 57, 1252–1265. [Google Scholar] [CrossRef]
  39. Der Sarkissian, R.; Al Sayah, M.J.; Abdallah, C.; Zaninetti, J.M.; Nedjai, R. Land use planning to reduce flood risk: Opportunities, challenges and uncertainties in developing countries. Sensors 2022, 22, 6957. [Google Scholar] [CrossRef] [PubMed]
  40. Shi, P.; Lyu, K.; Li, Z.; Yang, T.; Xu, C.Y.; Hao, X.; Xiao, J. A novel topography-based approach for real-time flood inundation mapping. Water Resour. Res. 2025, 61, e2024WR037851. [Google Scholar] [CrossRef]
  41. Westerhof, S.G.; Booij, M.J.; Van den Berg, M.C.; Huting, R.J.; Warmink, J.J. Uncertainty analysis of risk-based flood safety standards in the Netherlands through a scenario-based approach. Int. J. River Basin Manag. 2023, 21, 559–574. [Google Scholar] [CrossRef]
Figure 1. Study area of the Qujiang River.
Water 18 01198 g001
Figure 2. The methodology framework for flood simulation and impact assessment.
Water 18 01198 g002
Figure 3. Modeling Scope of 1D and 2D Hydrodynamic Model.
Water 18 01198 g003
Figure 4. Comparison of simulated and observed water levels for the validation flood event (20150618) at the Longyou hydrological station.
Water 18 01198 g004
Figure 5. Inundation water depth under 6 designed scenarios.
Water 18 01198 g005
Figure 6. Evacuation route under 20-year return period flood.
Water 18 01198 g006
Table 1. Data used and sources.
No.Data TypeSourceTimeDescription
1Geographic dataNatural Resources Bureau of Longyou County2025DEM (5 × 5 m), land use, administrative divisions, river systems, and roads, points of interest
2HydrologyQuzhou Municipal Water Resources Bureau2000~2025Observed hourly rainfall, water level, and discharge data; rainstorm atlas; hydrological manual
3Hydraulic engineeringQuzhou Municipal Water Resources Bureau2025Levees, reservoirs, river cross-sections, bridges, culverts, sluice gates, and pump stations
4Historical floodQuzhou Municipal Water Resources Bureau2020~2025Historical flood inundation, breach, and damage data, records of flood control operation and scheduling during historical flood events
5EvacuationQuzhou Municipal Water Resources Bureau2025Evaluation shelters information
6Social economyYearbook of Longyou County2025GDP and population data
Table 2. Designed scenarios.
No.Scenario NameDescription
110-year return periodDesigned flood with 10-year return period in the Qujiang River and the Lingshangang River
220-year return periodDesigned flood with 20-year return period in the Qujiang River and the Lingshangang River
350-year return periodDesigned flood with 50-year return period in the Qujiang River and the Lingshangang River
4100-year return periodDesigned flood with 100-year return period in the Qujiang River and the Lingshangang River
5Right bank levee breach at DuxiantouLevee breaches at Duxiantou, with a 20-year return period flood in the Qujiang River and he Lingshangang River
6Right bank levee breach at Zhanjia LeveeLevee breaches at Zhanjia Levee, with a 20-year return period flood in the Qujiang River and the Lingshangang River
Table 3. Manning’s roughness coefficients of 2D hydrodynamic model for different land cover types [29].
Land Cover TypeManning’s Roughness Coefficients
Village Area0.070
Shrubland0.065
Dry Farmland0.060
Paddy Field0.050
Roads0.035
River Channel0.025–0.035
Table 4. Relationship between flood loss rate and inundation depth (unit: %).
Inundation Depth (m)Household PropertyResidenceAgricultureIndustryCommerce
0.05–0.5421347
0.5–1.0127241016
1.0–2.03020552625
2.0–3.03825693330
≥3.04529813733
Table 5. Boundary input under the return period scenarios.
BoundaryIndicatorReturn Period
100-Year50-Year20-Year10-Year
Yingchuan cross-sectionPeak discharge (m3/s)14,22711,67599208632
Duxiantou cross-sectionPeak discharge (m3/s)3350252819171485
Yanggang hydrological stationPeak water level (m) *40.0438.9538.1237.67
Notes: * Elevation reference: the 1985 National Elevation Datum.
Table 6. Calibration and validation results of the 1D hydrodynamic model based on historical flood events at the Longyou hydrological station.
Historical FloodObserved Peak Water Level (m) *Simulated Peak Water Level (m) *Error (m)
Calibration2017062543.9643.8−0.16
2020070943.0642.79−0.27
2021070243.0243.150.13
2022062043.3243.50.18
Validation2015061843.243.250.05
Notes: * Elevation reference: the 1985 National Elevation Datum.
Table 7. Flood impact assessment results under different scenarios.
Scenario IDInundated Area (km2)Inundated Farmland (km2)Affected Population (10,000 Persons)Affected GDP (Million CNY)Flood Losses (Million CNY)
135.699.311.731011.48404.59
255.2313.642.641739.62695.85
374.6017.63.542620.901048.36
480.7818.983.872965.841186.34
50.170.030.0410.944.38
629.983.861.301066.85426.73
Disclaimer/Publisher’s Note: The statements, opinions and data contained in all publications are solely those of the individual author(s) and contributor(s) and not of MDPI and/or the editor(s). MDPI and/or the editor(s) disclaim responsibility for any injury to people or property resulting from any ideas, methods, instructions or products referred to in the content.