1. Introduction
Food security is a key component of national strategic stability, and water and land resources form the basic support for food production. Globally, and especially in rapidly developing countries such as China, dietary patterns are shifting from staple grains and vegetables toward high-protein animal products such as meat and eggs [
1,
2]. Consumers now demand higher quality and greater variety in their diets. As a result, the focus of food security has moved from ensuring quantity to achieving nutrition-driven, high-quality development [
3,
4,
5]. This dietary upgrade has changed agricultural demand and created new challenges for water and land resources. China faces limitations in both water and land, and the conflict between population, land, and water is becoming increasingly acute [
6]. In this context, the critical question is how to allocate limited water and land resources in a scientific and rational way to meet the changing dietary needs of residents. Addressing this issue has become an urgent research priority.
The complex relationship between dietary structure and the consumption of water and land resources presents a serious challenge [
7]. The amount of water and soil required for producing different types of food varies greatly [
8,
9]. Compared with plant-based foods, animal-based foods demand much higher resource inputs. To produce the same amount of energy and protein, the cropland required for animal-based foods is about four times greater than that for plant-based foods. The water consumption for producing animal-based foods is also far higher than that for producing the same amount of plant-based foods [
10,
11]. Studies have shown that the growing consumption of high-protein foods such as meat is a major driver of increased demand for water and land resources [
8,
12]. Therefore, adjusting dietary patterns in a rational way is not only an important approach to improving public nutrition and health but also a key step toward easing pressure on water and land resources and promoting sustainable development. If global diets shift toward more plant-based patterns, agricultural water use and cropland demand could be reduced by about 10% to 15% by 2050 [
13]. Compared with the current dietary structure, adopting the dietary consumption pattern recommended by dietary guidelines would require more cropland and irrigation water to meet China’s demand by the population peak year (2032) [
14]. Falchetta et al. found that partially replacing meat consumption with plant-based foods to meet the expected rise in protein intake holds great potential for reducing resource pressure [
15]. Vanham et al. analyzed the water footprint of food consumption under current and recommended dietary structures (healthy diet with meat, healthy pescetarian diet and healthy vegetarian diet) in the United Kingdom, France, and Germany, and concluded that recommended dietary structures can substantially reduce water use [
16].
Current research on optimizing agricultural water and land resources still focuses mainly on the production side [
17,
18], such as promoting water-saving irrigation and improving cropping patterns. Yikuan et al. developed a water resource optimization model for arid regions in China, and the results showed that the optimal scheme supports more efficient use of irrigation water [
19]. Galán-Martín et al. optimized the distribution between rainfed and irrigated cropland to minimize water consumption during food production [
20]. However, production-oriented studies often overlook the dynamic nature of food consumption and the central role of the demand side as a fundamental driver of resource flows. Incorporating dietary structures on the consumption side as a core variable in the optimization framework of water and land resources allocation can better capture the impact of residents’ demand on resource use and enable a shift from supply-side optimization to an integrated approach that considers both supply and demand [
21]. This supply–demand coupled optimization problem is characterized by multiple objectives, nonlinearity, and multiple constraints, making it difficult to solve effectively using traditional methods such as linear programming or gradient-based approaches. As a heuristic global optimization method, the genetic algorithm does not rely on the differentiability or continuity of the objective functions and is capable of efficiently handling complex nonlinear constraints and multi-objective optimization problems [
22].
In this study, we examine the future supply-demand gaps in land and water resources under four dietary consumption patterns, namely the Baseline (S1), Dietary guideline (S2), Policy-oriented (S3), and Projection (S4). We further propose a new framework for optimizing land and water resource allocation based on residents’ dietary patterns. Using a genetic algorithm, the optimization aims to minimize the blue water footprint while maximizing crop yields. The model takes into account both the dietary needs of residents and other food uses and applies this framework to optimize the allocation of land and water resources across the nine Yellow River provinces.
2. Study Area and Datasets
2.1. Study Area
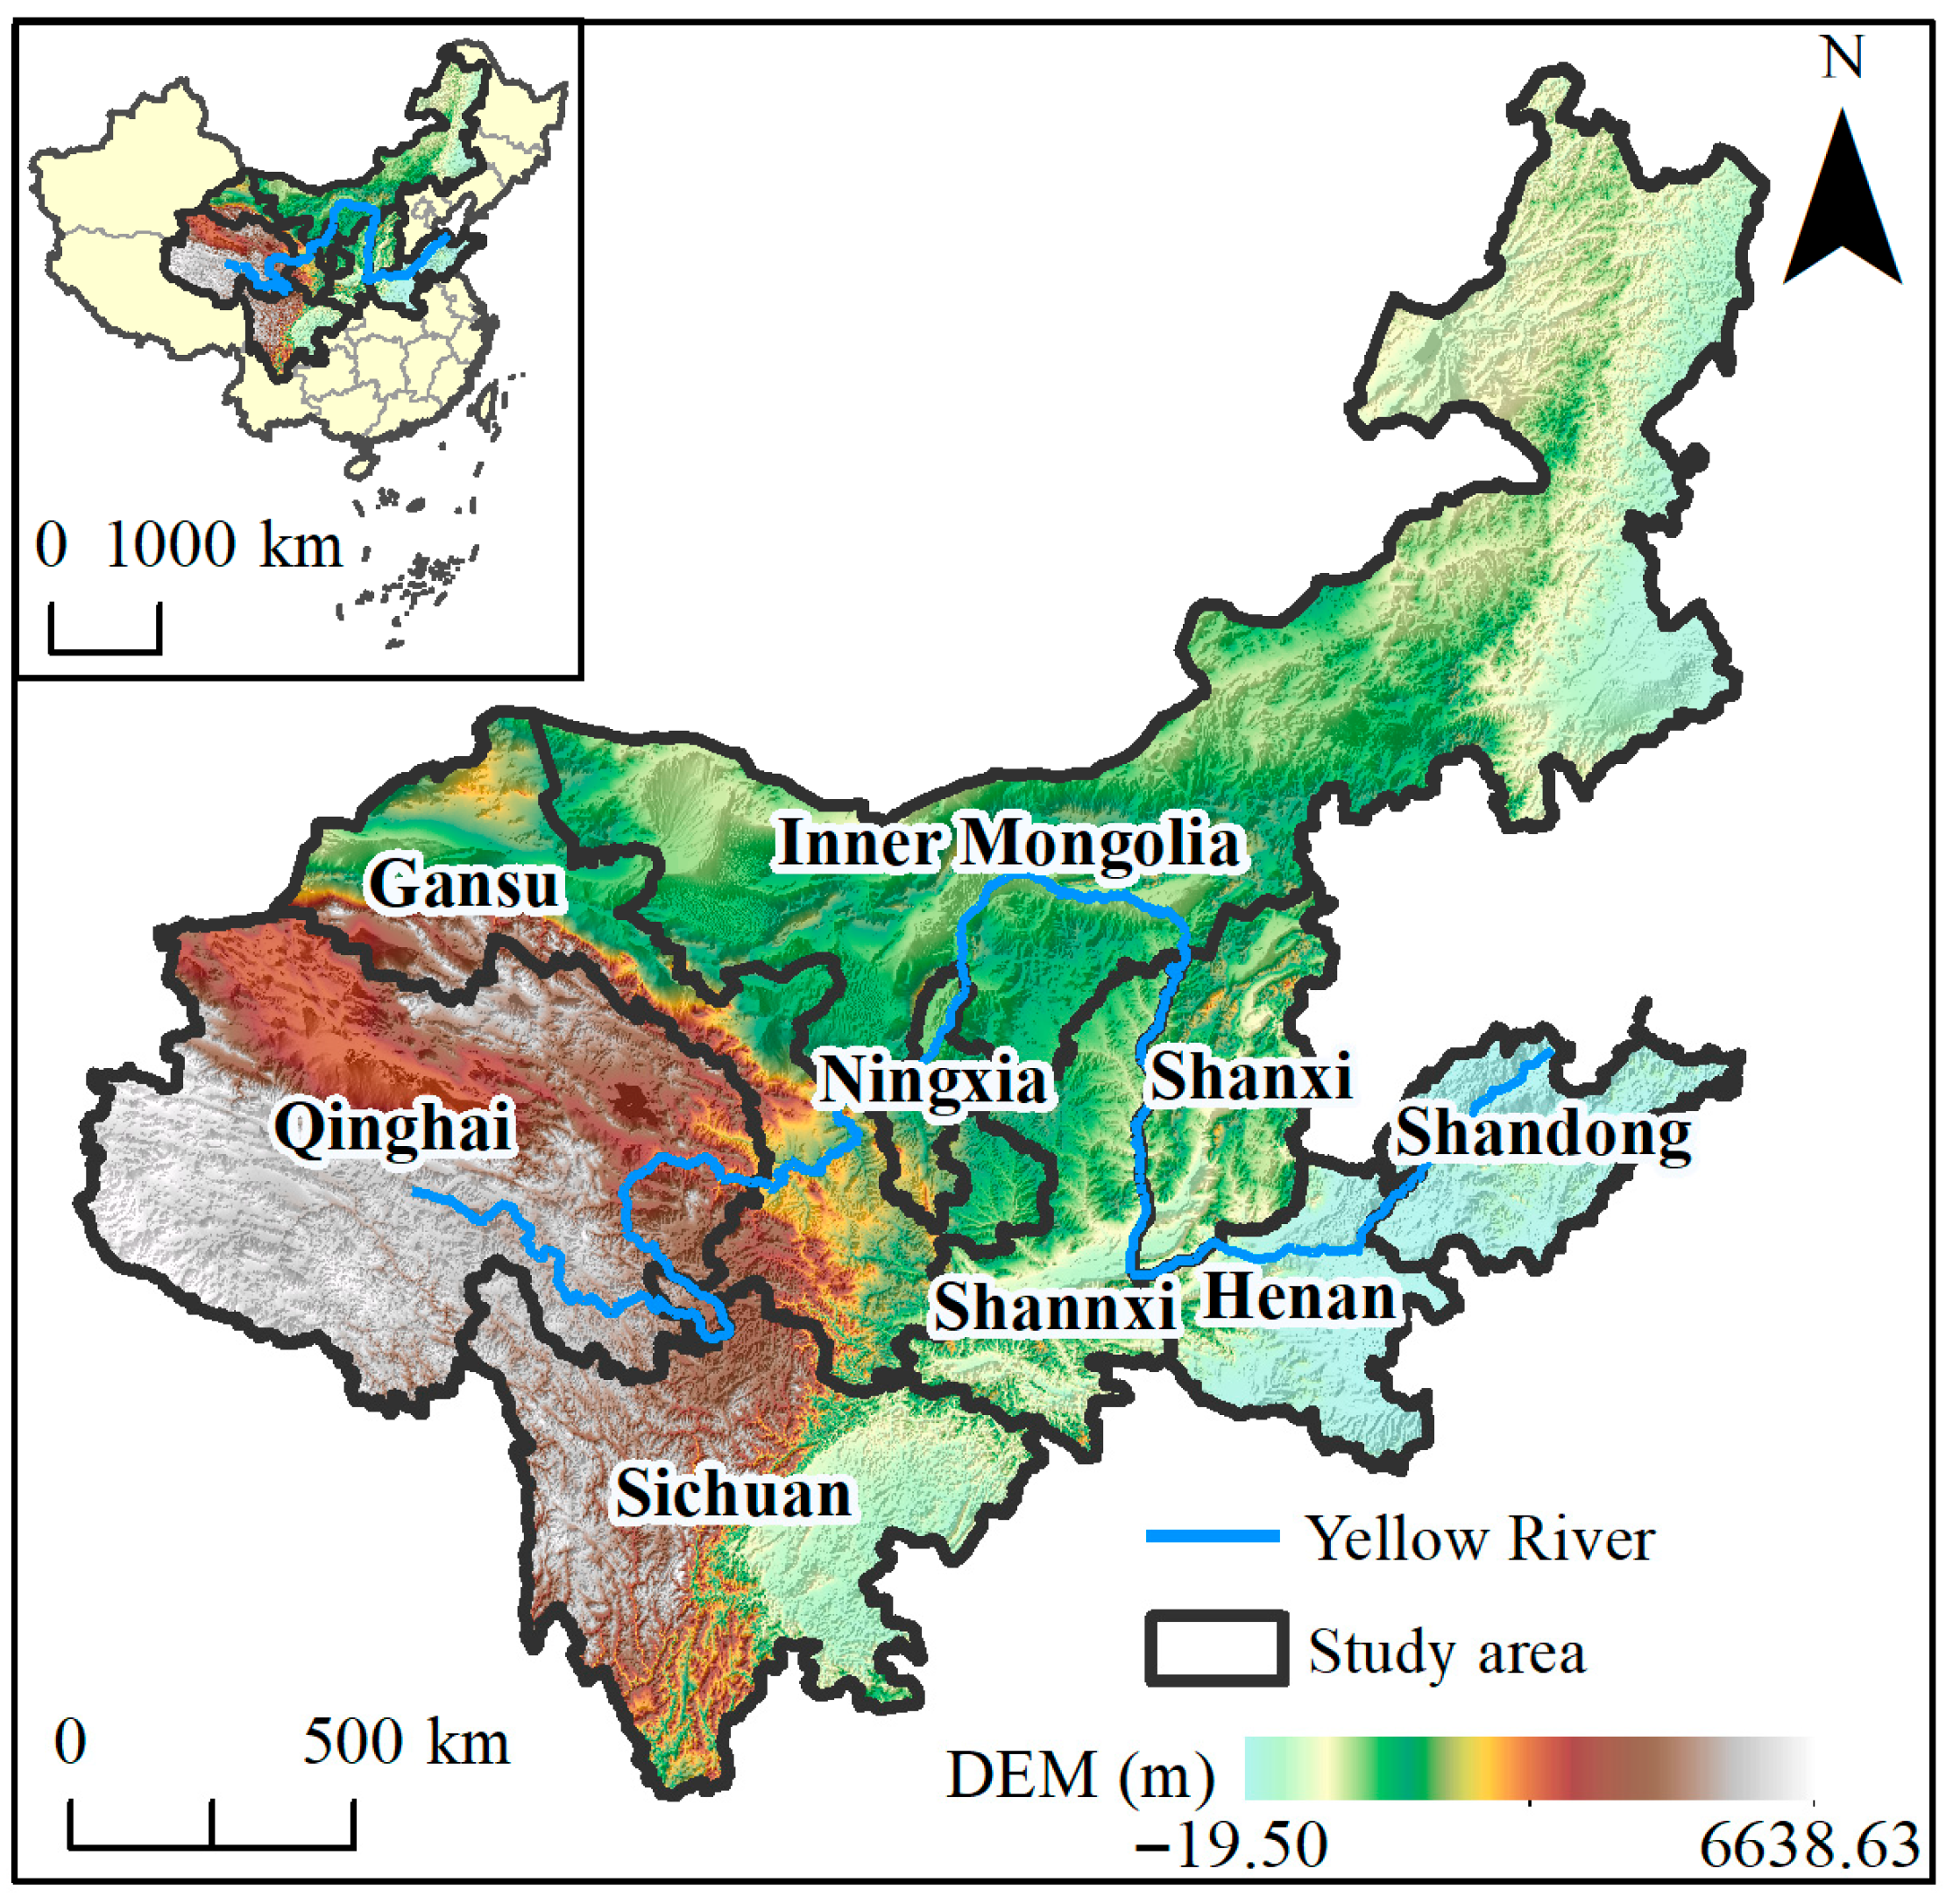
The nine Yellow River provinces include Qinghai, Sichuan, Gansu, Ningxia, Inner Mongolia, Shaanxi, Shanxi, Henan, and Shandong, through which the main and tributary streams of the river flow [
23] (
Figure 1). This region is an important agricultural production base in China and contains four of the country’s major grain-producing areas: Shandong, Henan, Sichuan, and Inner Mongolia. In 2023, these four provinces accounted for 28.52% of national grain production. However, due to natural geographic conditions, water resources are unevenly distributed across the nine provinces. Sichuan and Qinghai are relatively rich in water, while parts of Gansu, Inner Mongolia, and Shaanxi face moderate water scarcity. Shandong, Shanxi, Henan, and Ningxia have per capita water resources below the international extreme scarcity threshold of 500 m
3, placing them in extremely water-scarce conditions. With rapid urbanization, the demand for water in both production and daily life continues to grow, putting increasing pressure on agricultural water use. Competition for water reduces the reliability of irrigation, and the risk of crop loss rises significantly during droughts. Considering the existing gaps in water and land resources for food consumption and the changes in residents’ dietary patterns, the pressure on agricultural water and land use in the nine Yellow River provinces is expected to increase further.
2.2. Datasets
This study is based on food consumption and water and land resources in the nine Yellow River provinces. The main datasets include food consumption data, population data, water resource panel data, land resource panel data, unused land development potential data, and meteorological station data. The spatial and temporal resolutions and sources of these datasets are shown in
Table 1. Food consumption is categorized into grains, vegetables, vegetable oil, livestock, poultry, aquatic products, eggs, milk, and fresh and dried fruits. For some missing food consumption data, the consumption amounts were estimated using the local expenditure on food in that year divided by the unit expenditure per unit of consumption (calculated as the ratio of national consumption expenditure to national consumption quantity for that food). In addition, the consumption data in the yearbooks includes only food consumed at home and does not account for dining out. As residents increasingly eat outside the home, both at-home and out-of-home consumption are considered in this study. Out-of-home food consumption for rural households is estimated at 4% of at-home consumption. For urban households, it is estimated as 12% of at-home consumption for 2005 and earlier, and 20% for subsequent years [
24,
25]. When calculating the development potential of unused land in the study area, the relevant raster data were resampled to a uniform spatial resolution of 100 m.
3. Theory
3.1. Development of an Indicator System for Unused Land Potential
3.1.1. Weight Determination
Considering the scientific validity, regional relevance, and data availability, this study constructs an evaluation indicator system for the development potential of unused land in the nine Yellow River provinces using a total of 10 indicators across three aspects: site conditions, hydrothermal conditions, and soil conditions. Site and soil conditions exhibit strong temporal stability, while hydrothermal conditions are uniformly represented using data from 2023 to ensure consistency. Differences in temporal scales among the indicators have a limited impact on their relative characteristics.
To avoid the unreasonable influence of inconsistent units in the original data on the evaluation results, the data were first standardized. Indicators extracted from remote sensing and Digital Elevation Model (DEM) data were standardized using the range method, while soil texture, effective soil depth, and similar data were standardized using the expert scoring method. The weights of the indicators were then calculated using the entropy method.
3.1.2. Fuzzy Comprehensive Evaluation Method
This study is based on the Fuzzy Comprehensive Evaluation (FCE) method [
31] and uses raster cells as the minimum evaluation units. By constructing membership functions for single-factor indicators in each grid cell, the membership degree of each cell is calculated. Based on these values, a grid-by-grid fuzzy comprehensive evaluation of the development potential of unused land in the Nine Yellow River Provinces is conducted. The specific steps are as follows:
Based on the constructed evaluation indicator system, the set of evaluation factors is determined.
- 2.
Establish the set of evaluation grades V
Based on the requirements, j evaluation levels are set, V = [v1, v2, …, vj]. In this study, four evaluation levels were defined.
- 3.
Membership degree R
In the formula, rij represents the membership degree of the i-th element in the set of factors to the j-th element in the set of evaluation grades.
- 4.
Establish the evaluation weight vector A
Based on the weights of the evaluation indicators calculated using the entropy method, a weight set is established for each factor,
A = (
a1,
a2, …,
ai). Following the Standards for Grading Agricultural Land and the Technical Scheme for the Survey and Evaluation of National Reserve Farmland [
32], and referring to previous studies [
33,
34,
35], grading and quantification standards as well as constraints for each indicator were set. The weights and thresholds of the indicators are listed in
Table 2.
- 5.
Membership function B
In the formula, B represents the development potential grade corresponding to the maximum membership degree. This study includes three individual factors; therefore, when evaluating the grade of each factor, the fuzzy relation matrix R represents the relationships among the secondary indicators within each factor.
3.2. Future Dietary Structure Scenarios
To explore food demand under different dietary structure scenarios in 2030, this study defines four scenarios for analysis (
Table 3). Baseline scenario (S1), which represents the current dietary structure and is calculated based on the urban and rural populations and dietary structure of the Nine Yellow River Provinces in 2023. Dietary guideline scenario (S2) represents the food consumption structure recommended by the Chinese Dietary Guidelines (2022) [
36], which reflects a nutritionally ideal basic food composition. Compared with the current diet, this scenario emphasizes milk and aquatic products, while traditional staples and meat consumption decrease. Policy-oriented scenario (S3) follows the dietary structure recommended in the Outline of Food and Nutrition Development in China (2014–2020) [
37], which considers food production conditions and promotes a diversified, healthy dietary pattern. Compared with the current diet, this scenario increases consumption of vegetables, milk, and aquatic products, but decreases consumption of melons and fruits and eggs. Projection scenario (S4) adopts the dietary structure proposed in the China Agricultural Outlook Report (2021–2030) [
38], which estimates 2030 food consumption based on 2020 levels, considering population growth, rigid demand for major agricultural products, and accelerated dietary upgrades. Compared with the current diet, this scenario exhibits a trend toward high-fat and high-protein consumption, with increased demand for vegetable oil, meat, and aquatic products, and decreased demand for grains and melons and fruits.
3.3. Calculating the Cropland Required by Food Consumption
When calculating the cropland area required for residents’ food consumption in each year, food was divided into two main categories: plant-based and animal-based foods. Plant-based foods were further divided into two types: (1) directly consumed products, including grains, vegetables, and melons and fruits, and (2) indirectly consumed products, mainly vegetable oil. Animal-based foods include livestock, poultry, eggs, milk, and aquatic products. The cropland required for animal-based food consumption primarily comes from the cropland needed to produce feed for livestock and poultry. Therefore, animal-based food consumption must first be converted into equivalent plant-based food consumption, and then the cropland is calculated following the method for plant-based food.
The calculation method for cropland required by directly consumed products is as follows:
In the formula, Lvd-dir-i represents the cropland area required for the i-th directly consumed product (m2); Cv-dir-i is the per capita consumption of the i-th directly consumed product (kg/person); P is the total population (persons); Yi is the yield per unit area of the i-th product (kg/m2); I is the multiple cropping index; S is the total sown area of crops (m2); and Ltotal is the actual cropland area occupied (m2).
The cropland required for indirectly consumed products is calculated as follows:
In the formula,
Lvd-indir represents the cropland area required for vegetable oil (m
2);
Cv-indir is the per capita consumption of vegetable oil (kg/person); and
A is the production conversion rate, which is set to 0.17 in this study [
39].
The per capita consumption of plant-based food required for animal feed during livestock and poultry rearing is calculated as follows:
In the formula,
Ca–v–j represents the per capita consumption of the
j-th plant-based food corresponding to feed for animal consumption;
Ca-i is the per capita consumption of the
i-th animal-based food (kg/person);
Ri is the feed-to-meat ratio in the production of the
i-th animal-based food; and
Mj is the proportion of the
j-th crop in animal feed. Based on previous studies, the feed-to-meat ratios for animal-based foods are shown in
Table 4. In China, feed grains account for 74% of total animal feed, with rice, wheat, corn, and soybean comprising 7.7%, 10.3%, 59%, and 23%, respectively [
39,
40].
When calculating the cropland demand gap, the maximum available cropland is defined as the sum of the cropland required for actual food consumption in 2023 and the potential cropland area. The actual consumption in 2023 implicitly includes virtual land transferred from outside the region, which makes the estimation of the cropland gap closer to real conditions.
3.4. Calculating the Food Water Footprint
The water footprint of food refers to the total freshwater consumed throughout the entire production process of a given food, including crop cultivation, animal husbandry, and food consumption. It covers both direct and indirect use of blue water (surface and groundwater) and green water (rainwater), as well as grey water, which is the volume required to dilute pollutants. The water footprint is thus the “invisible” water embedded in products [
44]. Since this study aims to assess the impact of the food system on regional water resource use and quantitative pressure, grey water was not included. The accounting boundary of the food water footprint is limited to primary agricultural products and does not include the production and manufacturing of processed foods.
In this study, the calculation of the food water footprint was divided into two parts: plant-based food water footprint and animal-based food water footprint. Plant-based foods include grains, vegetables, vegetable oil, and melons and fruits, while animal-based foods include livestock, poultry, eggs, milk, and aquatic products.
3.4.1. Green Water Footprint
The green water footprint of each type of food production or consumption was calculated using the following formula:
where
WFg is the green water footprint of food production or consumption (m
3);
ETg is the portion of crop evapotranspiration derived from rainfall;
L is the cropland area required for food production or consumption (m
2).
In the formula, ETc is the crop evapotranspiration (mm); K is the crop coefficient; ET0 is the potential reference evapotranspiration (mm); Pe is the effective precipitation during the crop growth period (mm); and P is the daily precipitation (mm).
The crop coefficient at different growth stages was determined with reference to the coefficients recommended by the Food and Agriculture Organization (FAO) and previous studies. To account for local conditions, the single crop coefficient method was employed to adjust the coefficient accordingly:
In the formula, Kc refers to the crop coefficient values recommended by FAO and reported in the literature; u2 is the wind speed at a height of 2 m above the ground (m/s); RHmin is the minimum daily relative humidity (%); and h is the average maximum crop height (m) during each growth stage.
The potential crop evapotranspiration was calculated using the FAO recommended Penman–Monteith equation [
45]:
In the equation, Δ represents the slope of the saturation vapor pressure–temperature curve (kPa/°C); Rn denotes the net radiation at the crop surface (MJ/m2); G is the soil heat flux (MJ·m−2·d−1); γ refers to the psychrometric constant (kPa/°C); T is the mean daily air temperature (°C); u2 indicates the wind speed measured at a height of 2 m (m/s); es is the saturation vapor pressure of the air (kPa); ea denotes the actual vapor pressure (kPa/°C).
3.4.2. Blue Water Footprint
The blue water footprint of each type of food production or consumption was calculated using the following formula:
In the equation, denotes the blue water footprint of plant-based food production or consumption, while ETb represents the portion of crop evapotranspiration derived from irrigation water (mm).
For animal products, the blue water footprint is calculated by multiplying the blue water content per unit mass by the total amount of production or consumption.
In the equation,
denotes the blue water footprint of animal-based food production or consumption;
Ca refers to the production or consumption quantity of animal-based food (kg); and
Wa represents the blue water content per unit mass of animal products (
Table 5).
It should be noted that, in this study, food consumption and production are not exactly equal. We used the actual production and consumption data of various food types in the study area in 2023 to calculate the difference between production and consumption, which represents a surplus or a deficit. In the calculation of water footprint gaps and in the optimization model, we took consumption as the reference. At the same time, we retained the differences between production and consumption. This approach implicitly considers interregional food trade flows. When local production cannot meet local consumption, the deficit is treated as imports from other regions. When there is a production surplus, it is treated as exports to other regions. Therefore, this study does not assume strict self-sufficiency. Instead, it incorporates the trade-related resource flows reflected by the actual supply–demand differences into the accounting.
3.5. Population Projection and Uncertainty Analysis Methods
The Autoregressive Integrated Moving Average (ARIMA) Model was employed to project the population of the nine provinces along the Yellow River in 2030 using population data from 1978 to 2023. The model is expressed as ARIMA (
p,
d,
q), where p represents the order of the autoregressive term, d represents the order of differencing, and q represents the order of the moving average term [
48]. Population data are typically characterized by long-term growth or decline trends as well as periodic fluctuations, and the autoregressive and moving average components of the ARIMA model can effectively capture these trends and cyclical variations. By selecting appropriate values of
p and
q, the model can flexibly fit different fluctuation patterns in population data. The core formula of the model can be expressed as follows.
where
Yt is the observed value of the time series at time (
t);
μ is the constant term;
m1,
m2, …,
mp are the coefficients of the autoregressive terms;
εt is the white noise error term representing the residual of the model; and
n1,
n2, …,
nq are the coefficients of the moving average terms.
Population change is one of the important factors affecting total food consumption and resource demand, while population projection results themselves contain certain uncertainties. Therefore, the Monte Carlo method was applied to randomly perturb population variables in order to evaluate the influence of population projection uncertainty on cropland demand results. During the simulation process, urban and rural population variables were assumed to follow a normal distribution, and random sampling was conducted using the projected population values as the mean. The standard deviation of the perturbation was set to 3% of the projected values to reflect potential small deviations in the population projection process. To reflect the influence of overall population projection errors on regional total cropland demand, a unified random perturbation coefficient was synchronously applied to the population projections of all provinces during the simulation.
In each simulation, new population data were randomly generated, and food consumption and cropland demand were recalculated accordingly. A total of 1000 repeated simulations were conducted to obtain the probability distribution characteristics of the results. Finally, the mean (
Mean), 5th percentile (
P5), and 95th percentile (
P95) are used to describe the range of the results, and the uncertainty level was quantified using the following equation.
Since cropland demand is an important intermediate variable linking food consumption and agricultural resource use, its uncertainty analysis can, to a certain extent, reflect the potential impacts of population projection errors on water and land resources demand.
3.6. Construction and Optimization of a Dietary-Oriented Water and Land Resources Allocation Model
3.6.1. Objective Function
This study allocates water and land resources by first prioritizing the food consumption under four dietary patterns, and then meeting other food uses in the current year. Given that farmland irrigation accounts for approximately 86% of agricultural water consumption, the objective function is formulated from the perspective of regional blue water footprints and crop yields.
In the equation, m is the number of provinces, which is 9 in this study; n is the number of crop types j, set to 8 in this study; is the total blue water footprint of crop production across all provinces and crop types.
- 2.
Crop Yield Maximization
In the equation, Sij is the planting area of crop j in province i (hm2), Yij is the yield per unit area of crop j (kg/hm2).
3.6.2. Constraints
The total blue water footprint of crop production in each province cannot exceed the current regional blue water footprint for crop production (as of 2023).
In the equation, Wi is the blue water footprint of crop production in region i in 2023.
- 2.
Arable Land Area Constraint
The area allocated to each crop should not exceed the sum of the arable land area in the region in 2023 and the land with development potential.
In the equation, Lc is the optimized area occupied by the crop, and Lq represents the area of land with development potential.
- 3.
Crop Planting Area Constraint
To prevent the planting area of any single crop from becoming excessively large or small, boundary constraints are imposed on the planting areas of all crops within each region.
In the equation, xmin,j and xmax,j denotes the minimum and maximum planting areas of crop j (hm2), respectively.
The minimum and maximum planting areas are not fixed values but are determined based on the initial cropping structure derived from different dietary consumption scenarios. Specifically, cropland demand for each crop is estimated according to food consumption under different dietary scenarios in 2030, combined with crop production and consumption data for 2023 (Calculation method is in
Section 3.3). The proportion of cropland demand for each crop relative to the total cropland demand is defined as the initial planting ratio under each scenario. To avoid unrealistic extreme planting configurations during the optimization process while ensuring the practical feasibility of structural adjustments, the planting ratio of each crop is allowed to vary only within ±5% of its initial value. By further combining these ratios with regional cropland area, the planting ratios are converted into actual planting areas, thereby determining the minimum and maximum planting areas for each crop.
- 4.
Non-negativity Constraint
All decision variables are required to be greater than or equal to zero.
3.6.3. Solution Using Non-Dominated Sorting Genetic Algorithm
The Non-dominated Sorting Genetic Algorithm II (NSGA-II) integrates key techniques such as non-dominated sorting, crowding distance, and elitist strategy to efficiently explore the Pareto front in multi-objective optimization problems [
49]. Its main steps include population initialization, non-dominated sorting, crowding distance calculation, selection, crossover, and mutation, which are iteratively repeated until the maximum number of generations is reached. The optimization algorithm was implemented in Python 3.9 and executed in the PyCharm 2022.2.3 integrated development environment (IDE). Through parameter tuning and testing, the algorithm parameters were set as follows: population size of 100, maximum generations of 100, crossover probability of 0.8, and mutation probability of 0.2. Based on the solution logic and procedure of NSGA-II, the model for optimizing water and land resources allocation guided by residents’ dietary patterns was implemented, aiming to identify optimal resource allocation strategies.
4. Results
4.1. Evolution of Dietary Patterns in the Nine Yellow River Provinces
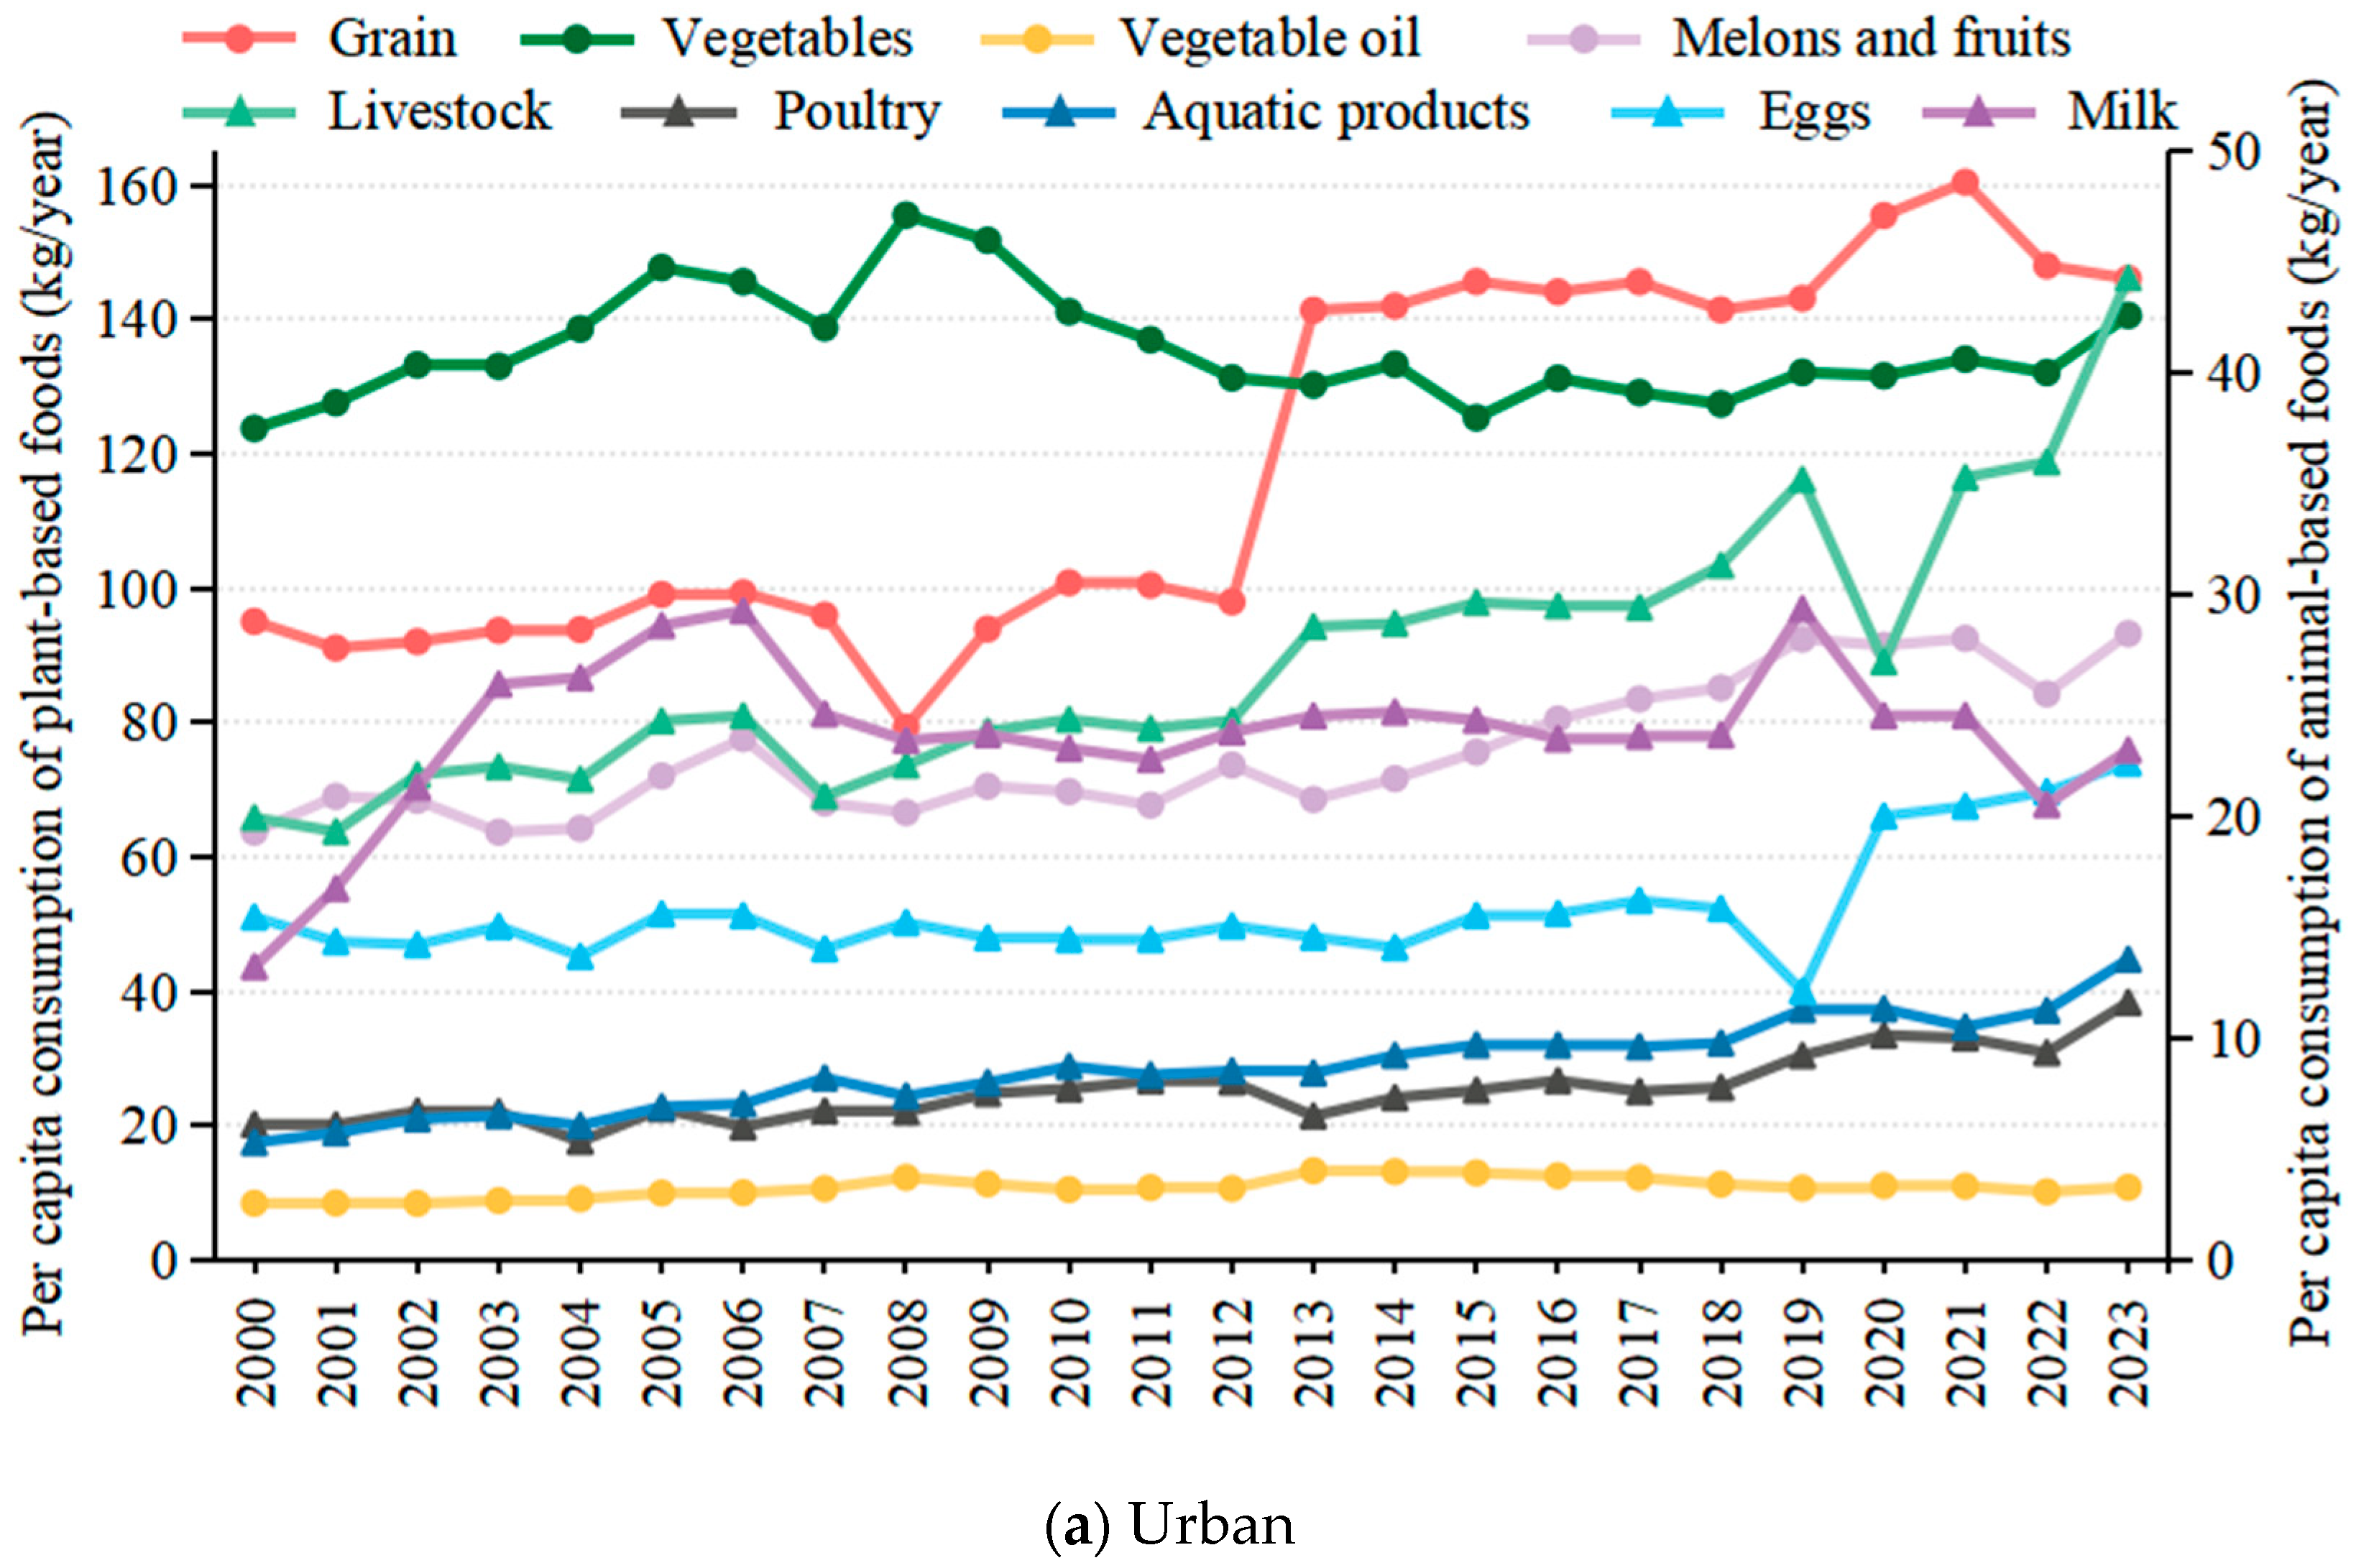
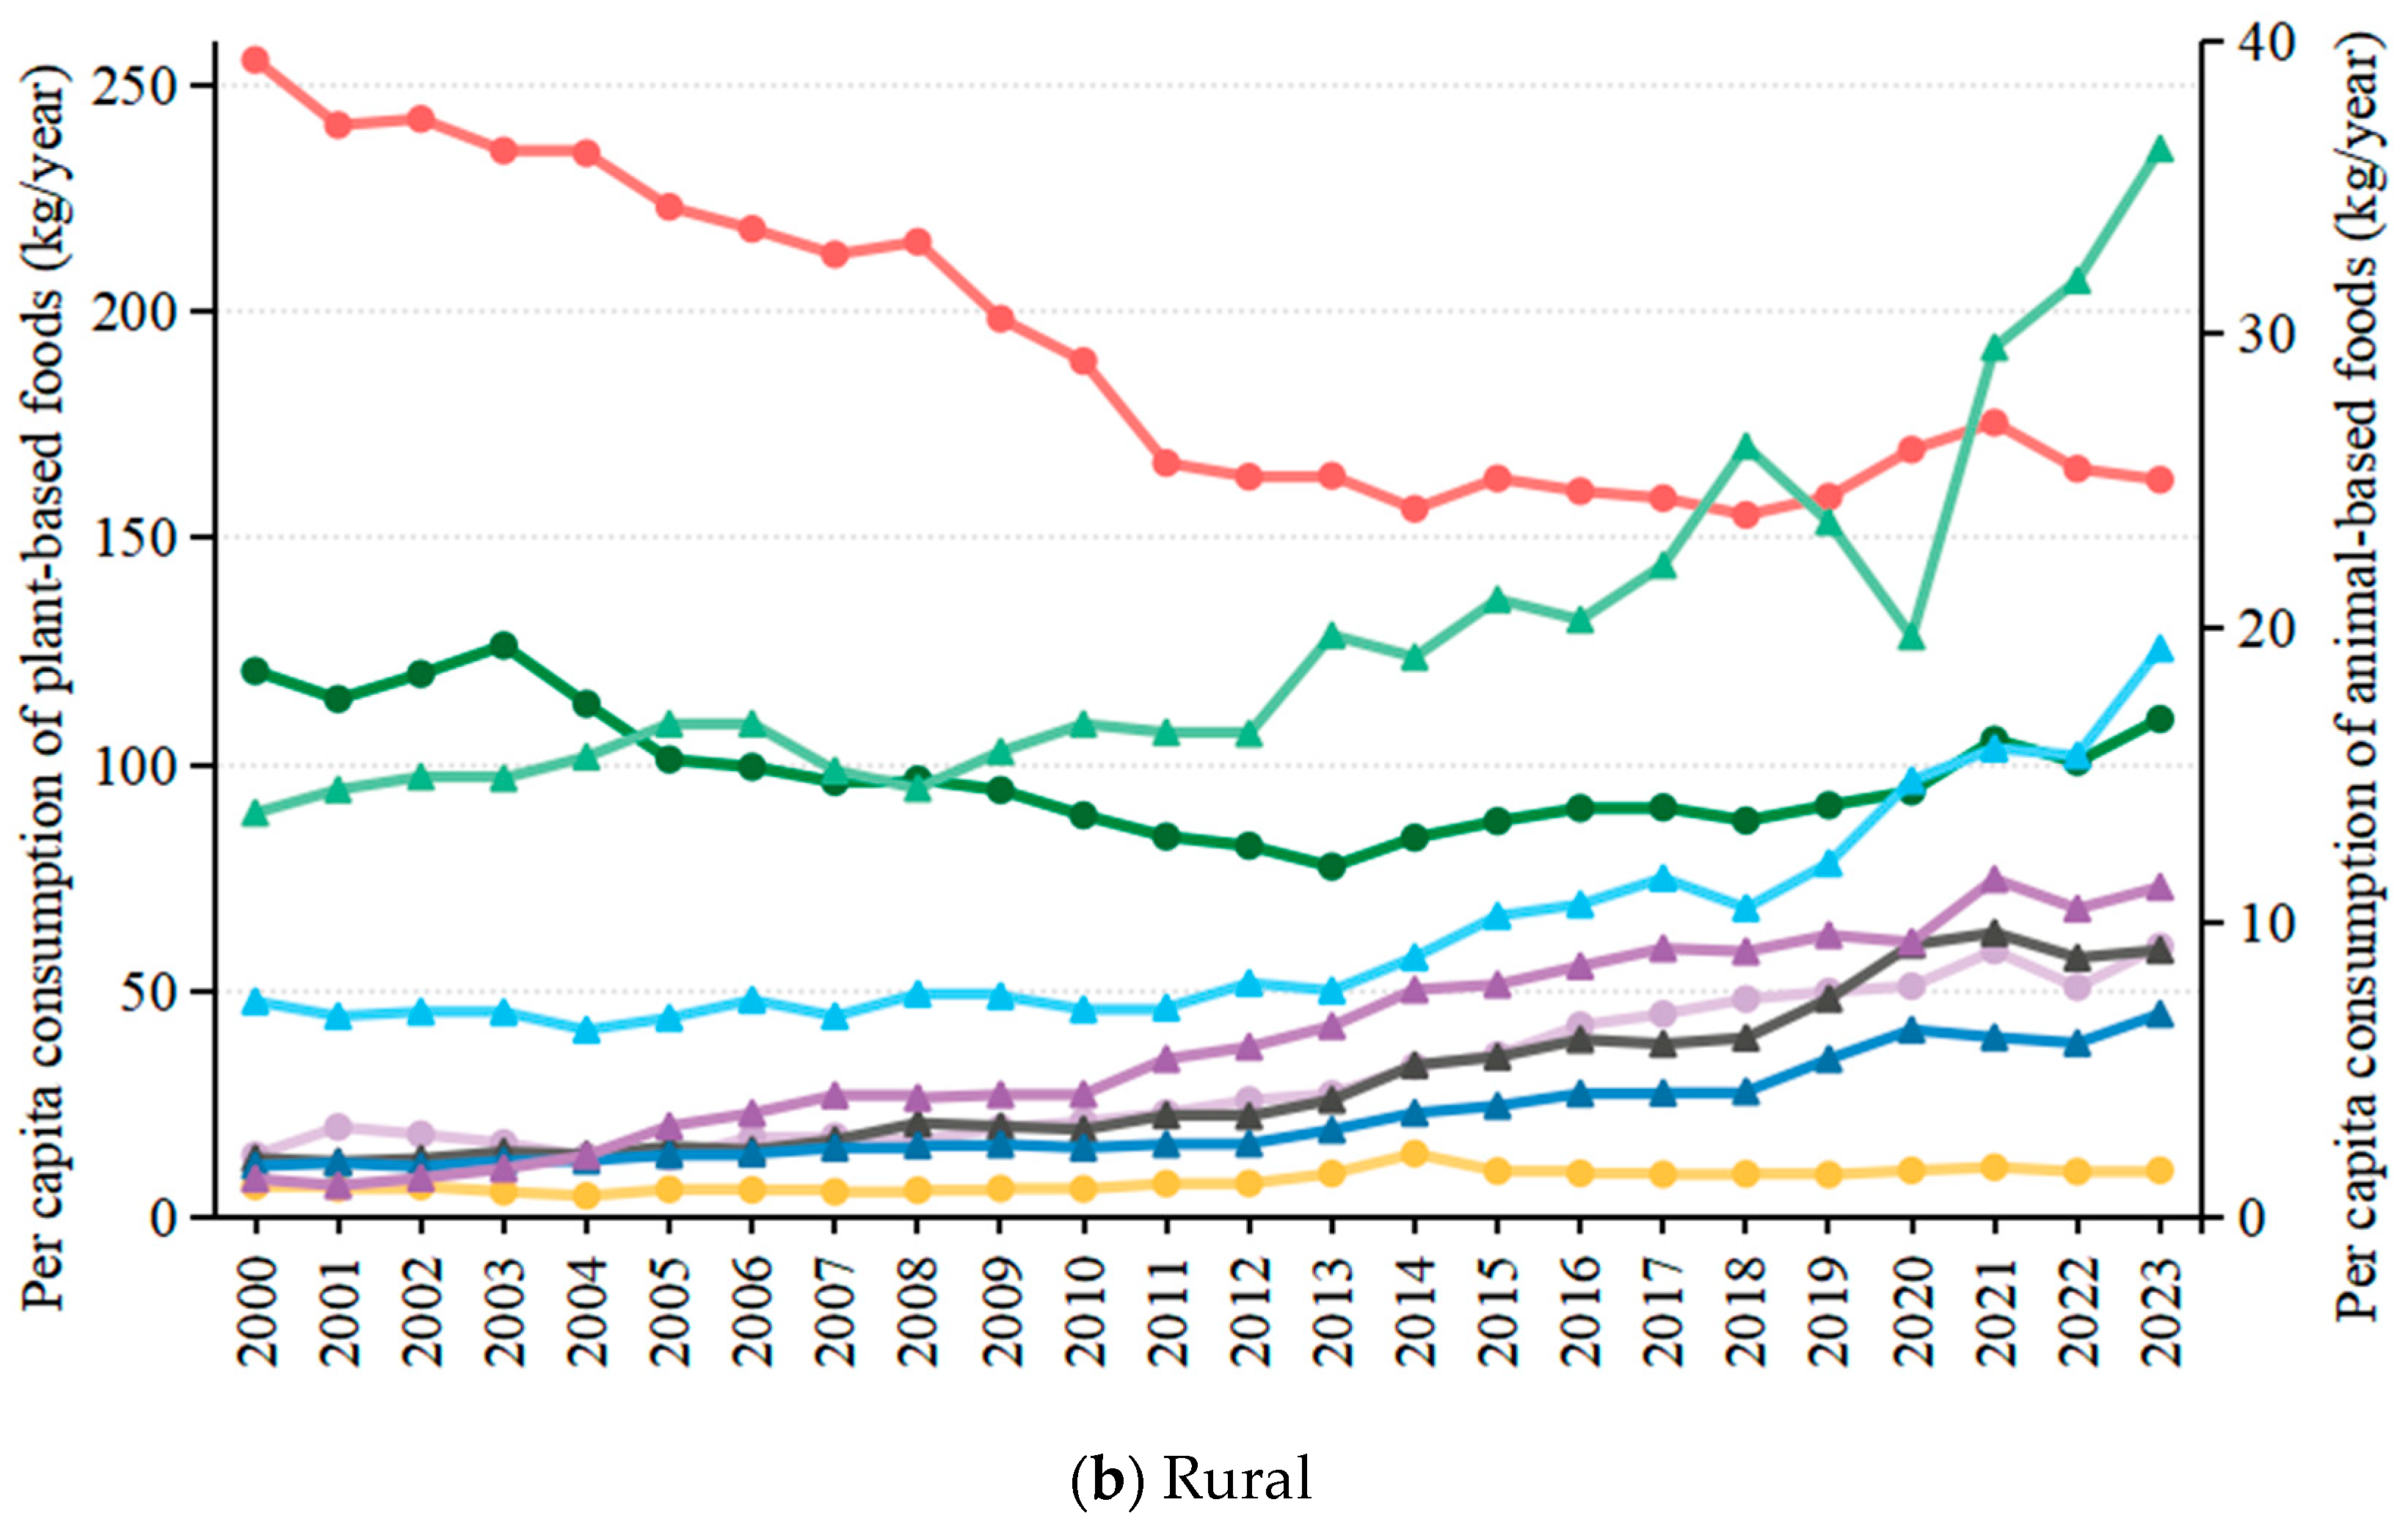
The dietary patterns of residents in the nine Yellow River provinces have undergone significant changes (
Figure 2), with notable differences between urban and rural populations. From 2000 to 2023, the long-term average per capita grain consumption of urban residents was only 62.04% of that of rural residents, whereas urban residents’ average consumption of other food categories exceeded that of rural residents. Specifically, per capita consumption of milk, aquatic products, and melons and fruits in urban areas was 3.98, 2.54, and 2.46 times higher than in rural areas, respectively. Overall, urban residents’ per capita consumption of animal-based foods increased (
Figure 2a), with aquatic products showing the largest growth at 156.53%, followed by livestock at 122.19%. Among plant-based foods, per capita grain consumption showed an upward trend, increasing by 51.06 kg. Per capita consumption of melons and fruits also rose steadily, with an average annual growth rate of 1.67%. The consumption of vegetable oil increased significantly between 2000 and 2008, by 45.94%, but showed a notable decline of 18.70% from 2013 to 2023. For rural residents, per capita grain consumption decreased by 36.29% over 2000–2023 (
Figure 2b), whereas per capita melon and fruit consumption increased markedly by 337.75%, and vegetable oil rose modestly by 52.47%. Among animal-based foods, milk consumption exhibited the most pronounced increase at 764.29%, followed by poultry and aquatic products, which increased by 355.05% and 296.40%, respectively. Per capita livestock consumption remained the highest, followed by eggs, although their growth rates were lower than those of other animal-based foods, at 164.36% and 163.68%, respectively.
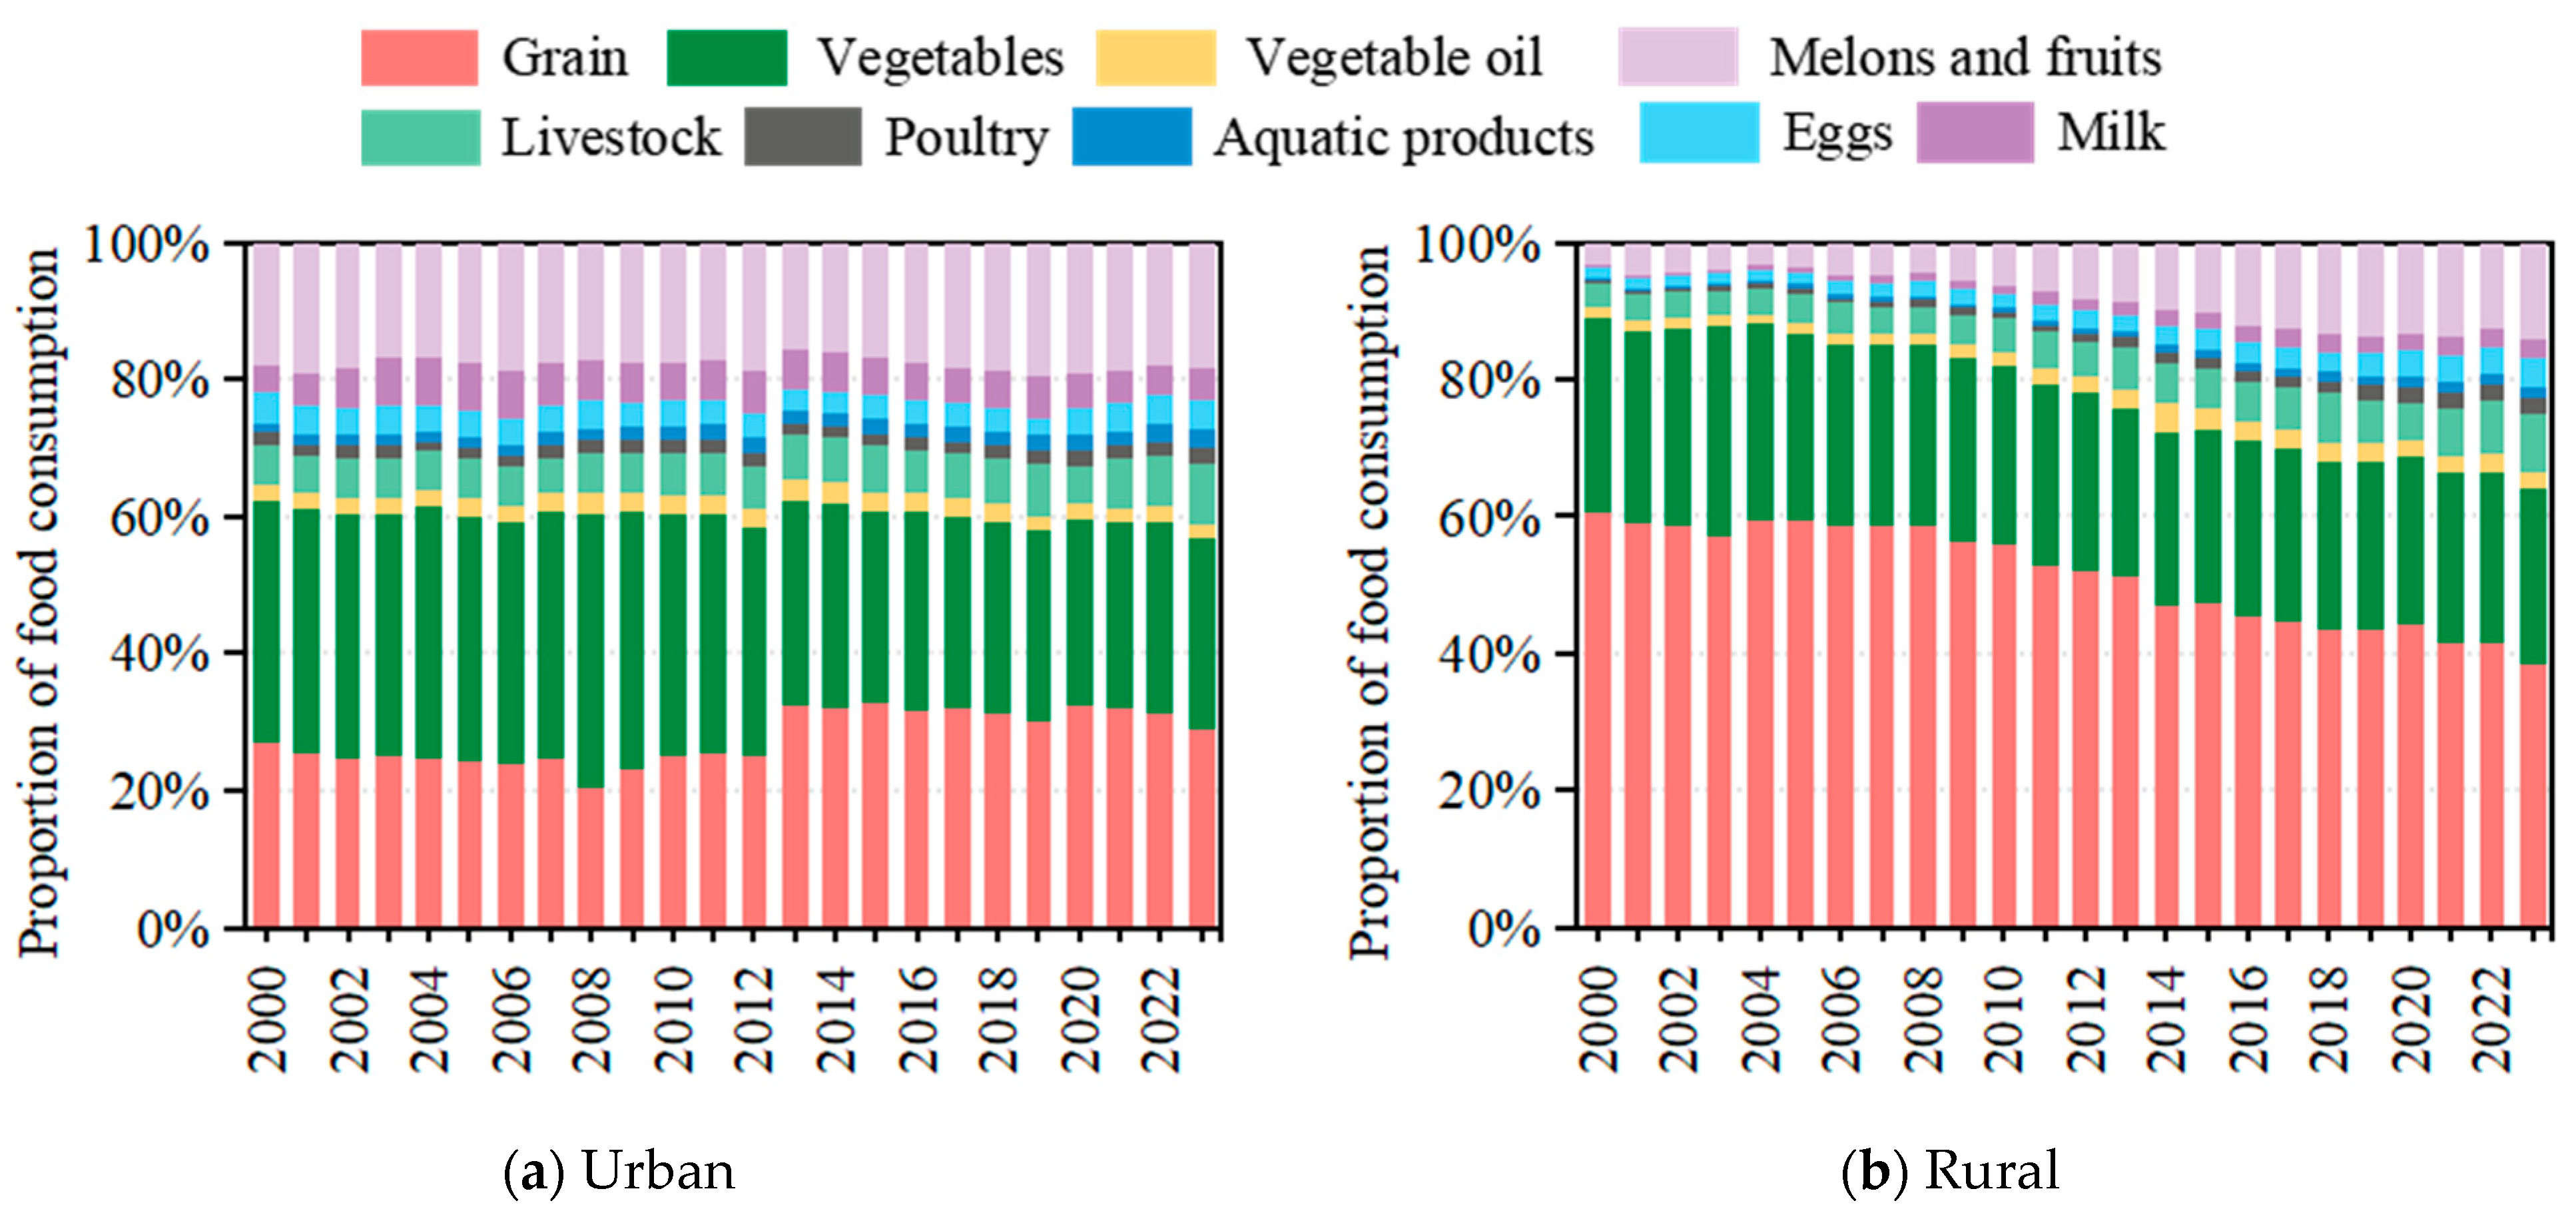
From 2000 to 2023, residents in the nine Yellow River provinces predominantly consumed plant-based foods, with the share of plant-based consumption exceeding 77% for urban residents and 80% for rural residents (
Figure 3). Compared with urban residents, rural residents had a higher proportion of per capita plant-based food consumption, but their proportion declined more rapidly over time. Among plant-based foods, the largest urban–rural difference in per capita consumption share was observed for grain (ranging from 9.27% to 38.34%), followed by melons and fruits (4.40–14.91%) and vegetables (1.98–13.67%). For animal-based foods, livestock consumption dominated in both urban and rural areas and showed an increasing trend, with rural residents’ share rising faster. The share of aquatic products consumption also increased for both groups, although urban residents exhibited higher per capita consumption shares with greater fluctuation compared to rural residents.
According to the Dietary Guidelines for Chinese Residents (2022) [
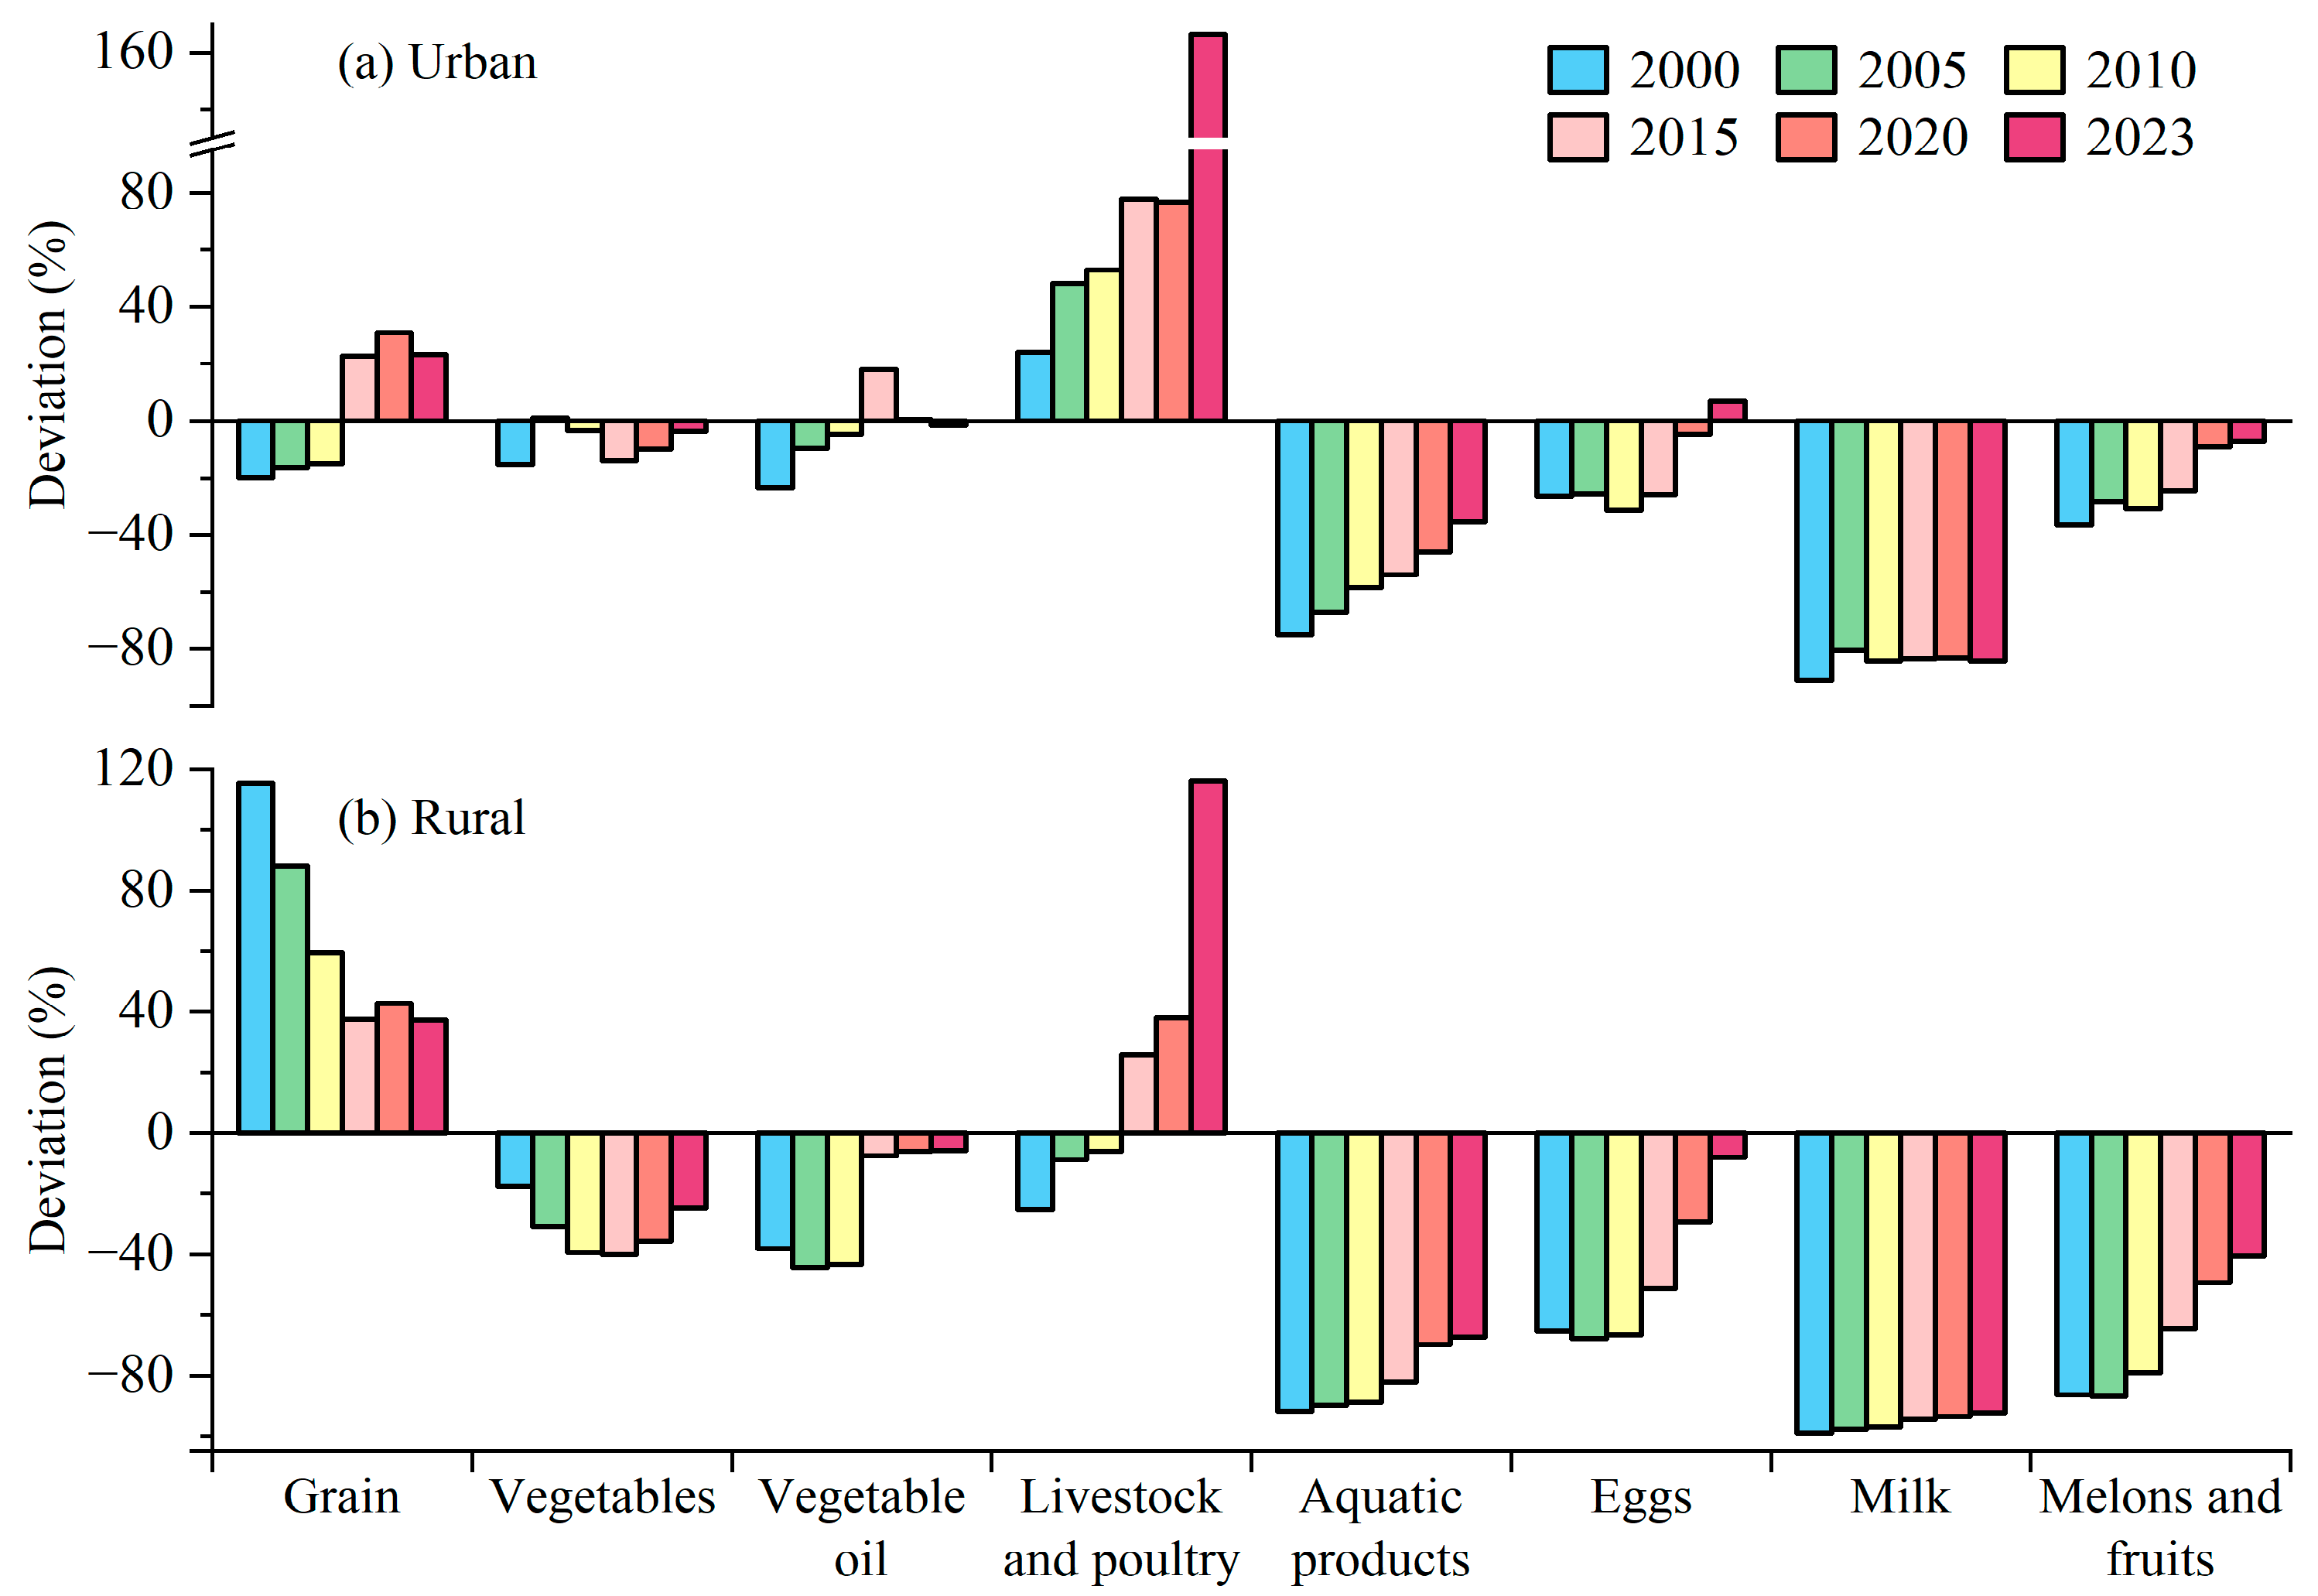
36], the current dietary patterns in the nine Yellow River provinces deviate from a balanced diet (
Figure 4). For urban residents, livestock and poultry were overconsumed, with a deviation of 166.41% in 2023. Per capita consumption of aquatic products, milk, and melons and fruits was below the recommended levels, although the gaps for aquatic products and melons and fruits decreased. Deviations for vegetables and vegetable oil were small, while egg consumption changed from insufficient to excessive. For rural residents, grain and livestock and poultry were overconsumed, with 2023 deviations of 37.30% and 116.24%, respectively. Consumption of vegetables, vegetable oil, aquatic products, eggs, milk, and melons and fruits remained below recommendations, but the gaps gradually decreased.
4.2. Water and Land Resources Requirements of Food Consumption
4.2.1. Arable Land Requirement
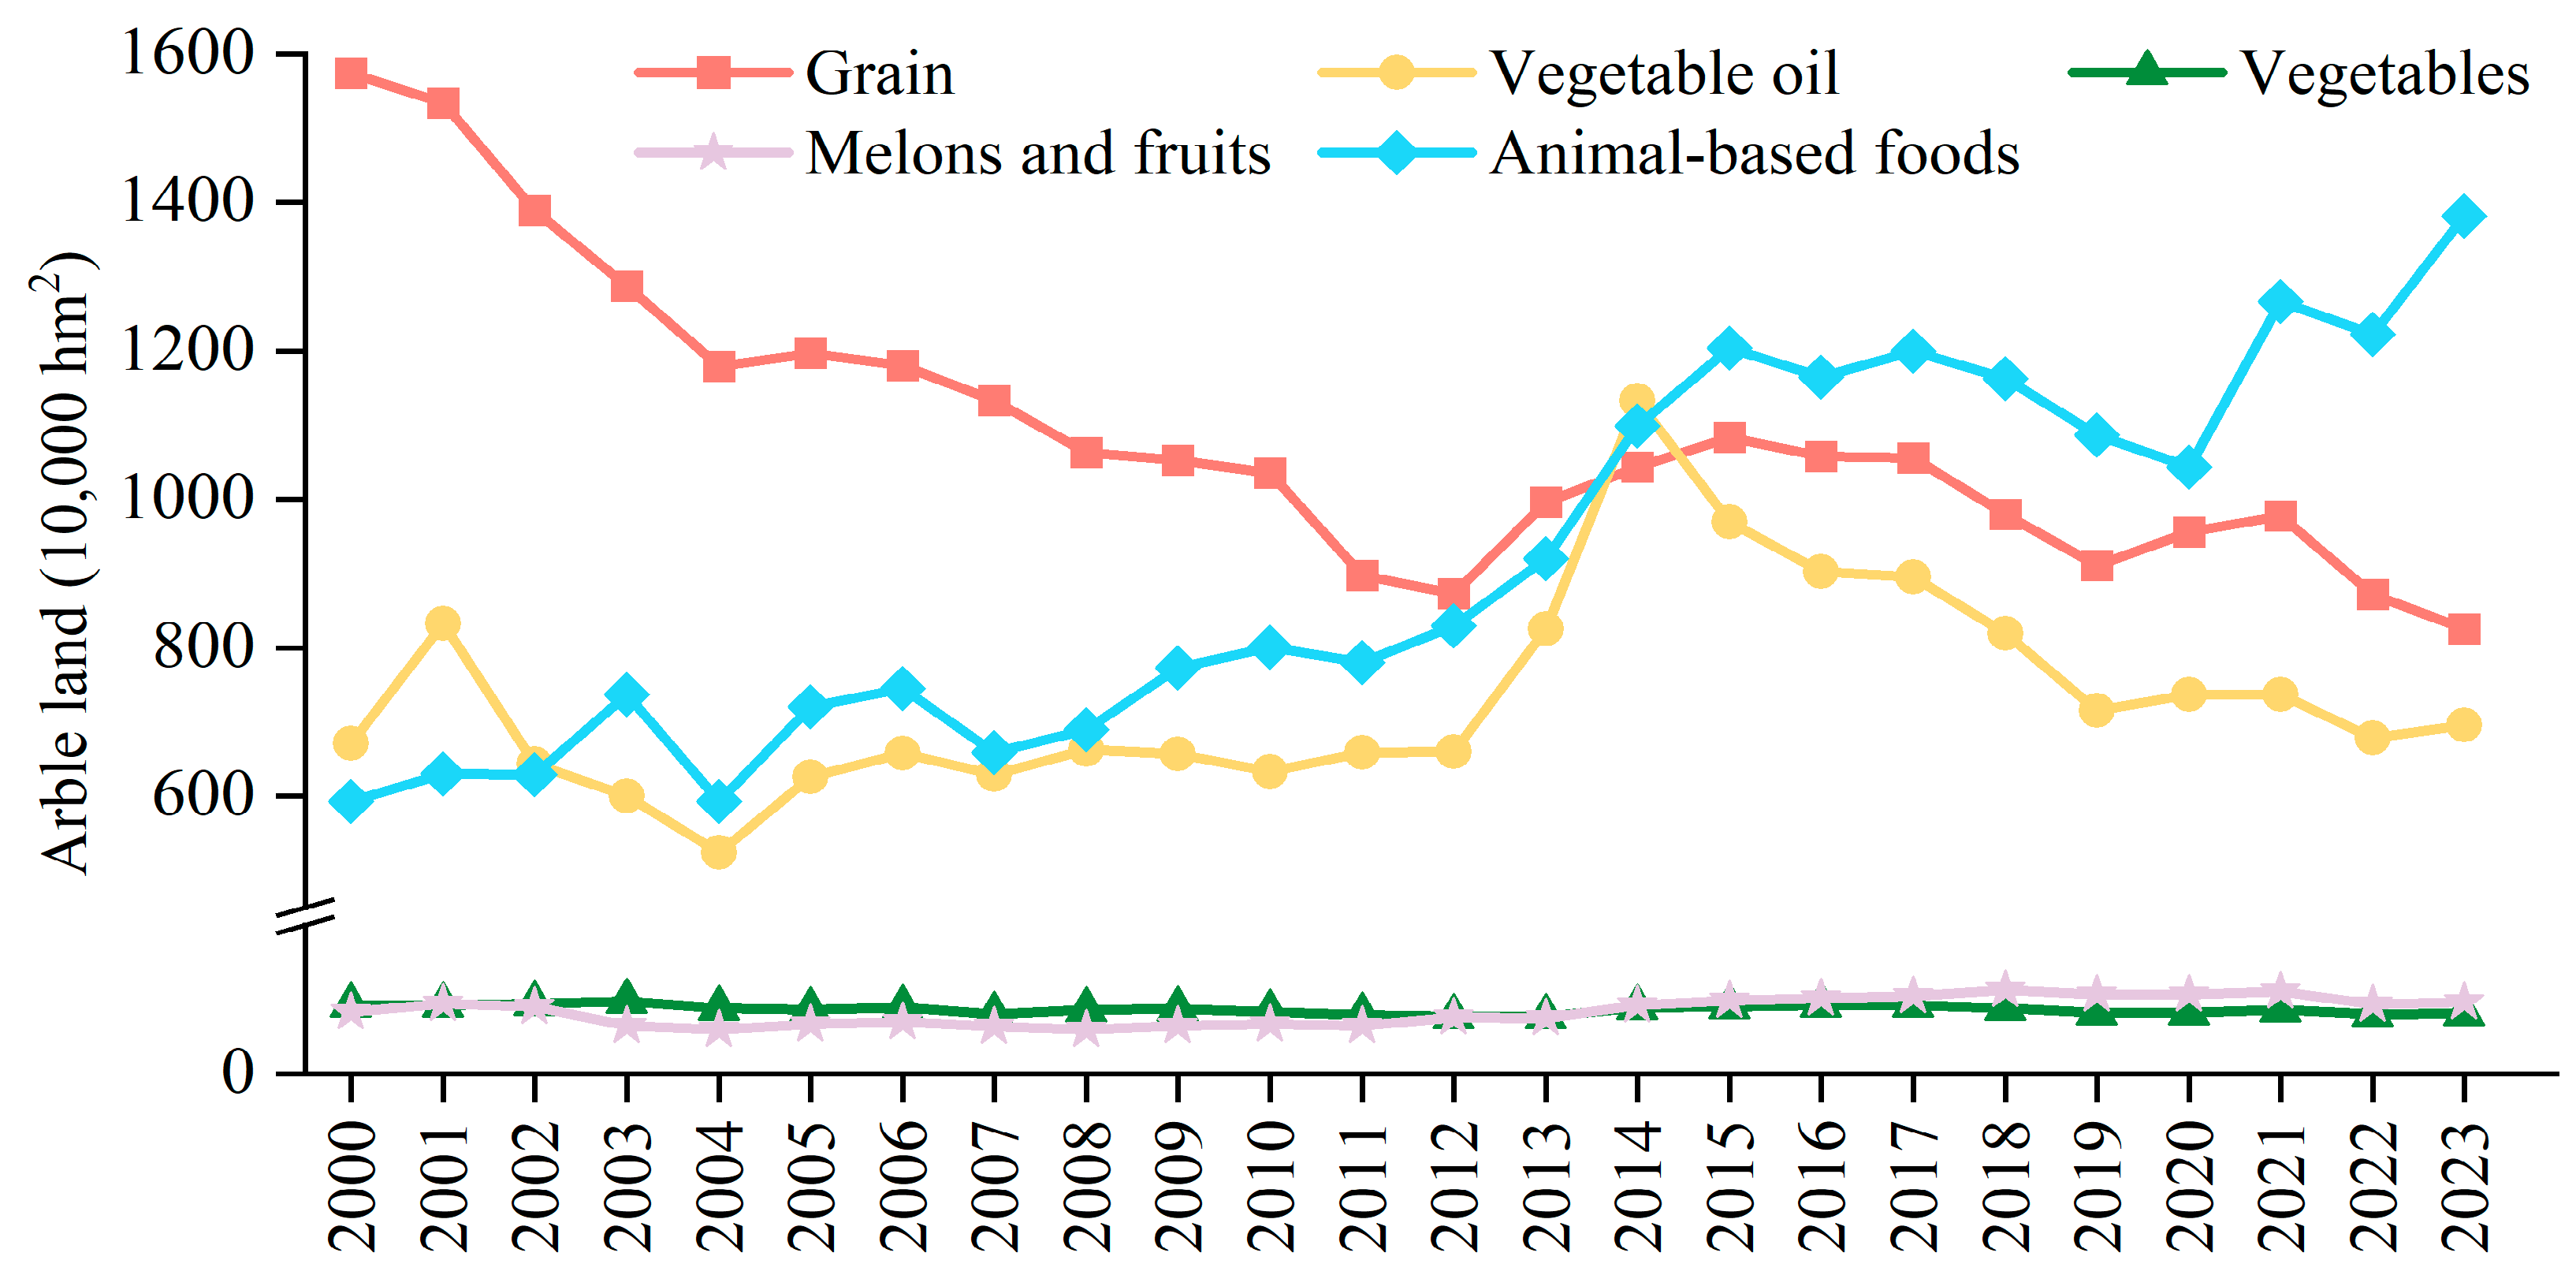
The arable land required for different food categories shows significant differences (
Figure 5). Before 2014, grain consumption required the largest arable land area, followed by animal-based foods, vegetable oil, vegetables, and melons and fruits. In 2014, the land demand for vegetable oil and animal-based foods first exceeded that of grain; however, the land requirement for vegetable oil remained lower than that for grain, while animal-based foods became the category requiring the largest arable land area. The increase in animal-based food consumption has led to a significant rise in demand for feed grains, requiring more land to meet this demand. By 2023, the arable land required for plant-based foods was 1.23 times that of animal-based foods. Within plant-based foods in 2023, the land demand for grain was 1.19, 10.12, and 8.58 times higher than that for vegetable oil, vegetables, and melons and fruits, respectively. During the study period, the arable land needed for grain consumption decreased by 47.58%, mainly due to a reduction in per capita grain consumption and increased grain yield. The land demand for vegetables changed little, decreasing by 11.92%, whereas that for vegetable oil, melons and fruits, and animal-based foods increased by 3.57%, 15.21%, and 132.84%, respectively.
4.2.2. Green Water Footprint of Food Consumption
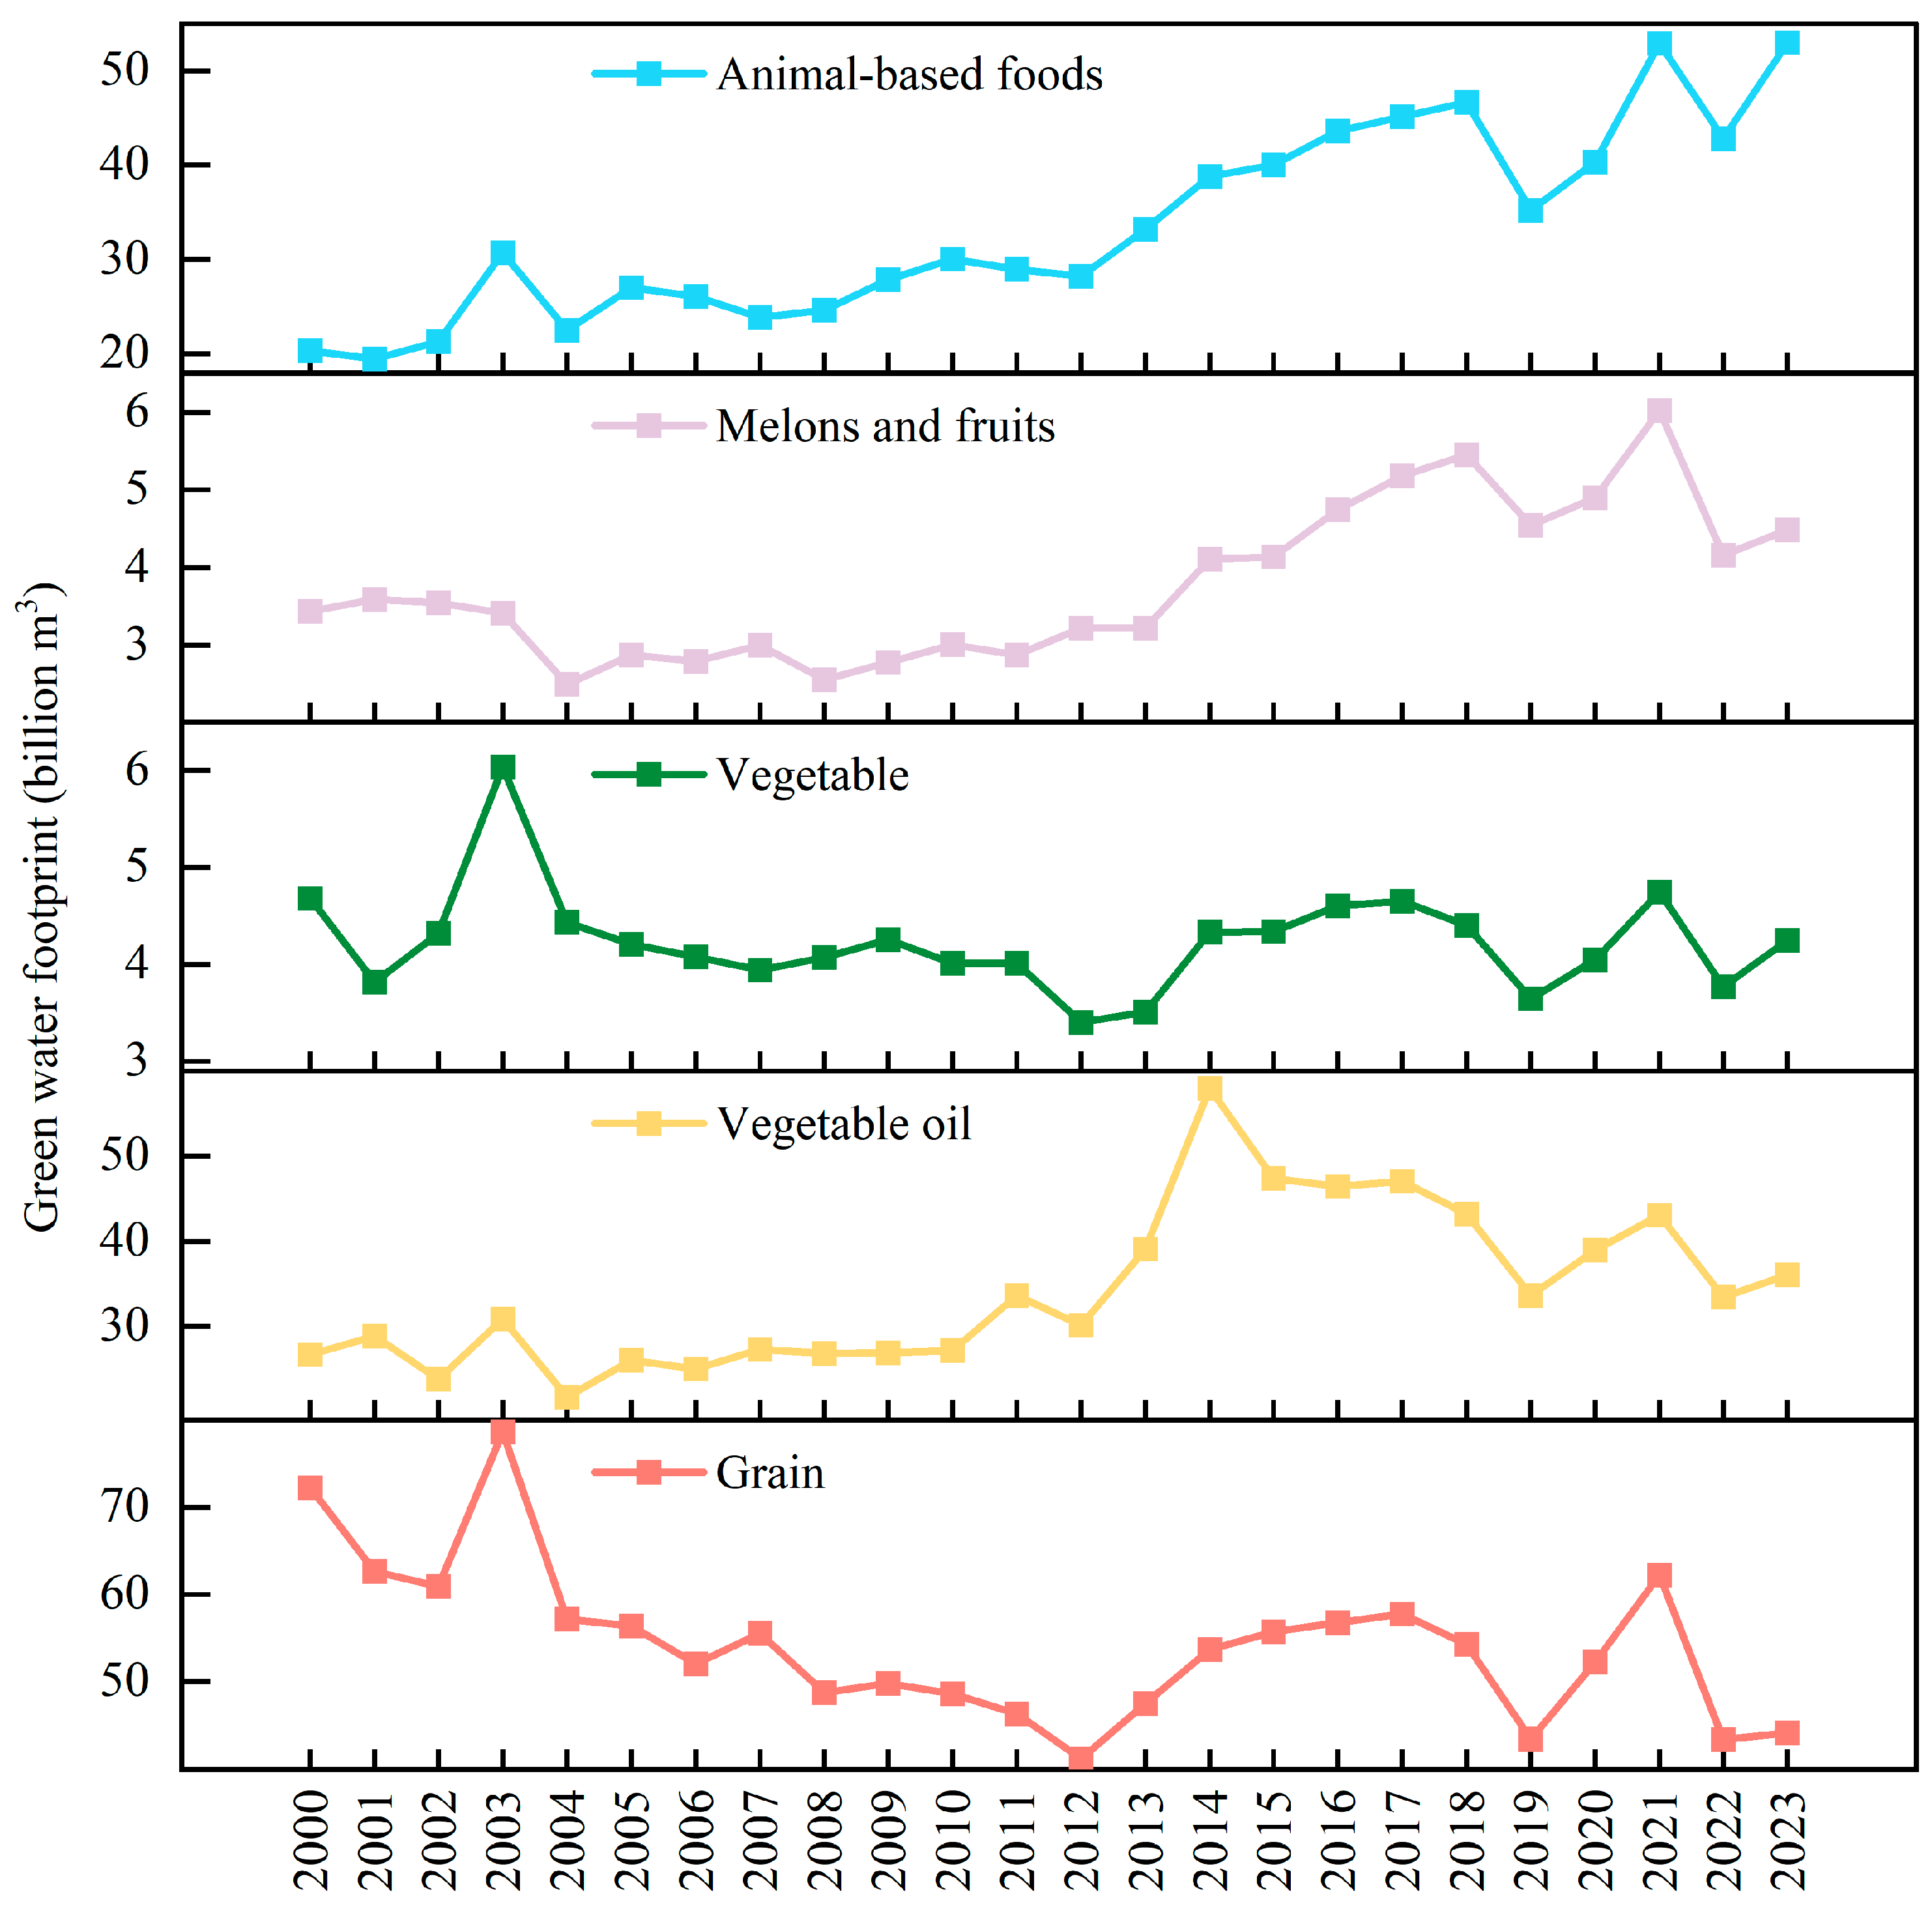
The green water footprint associated with different food categories varies significantly (
Figure 6). Between 2000 and 2022, grain consumption had the highest green water footprint. In 2022, the green water footprint of grain (representing only direct consumption by residents, excluding feed grains) was 1.30, 11.50, 10.43, and 1.01 times that of vegetable oil, vegetables, melons and fruits, and animal-based foods, respectively. In 2023, animal-based foods surpassed grain to become the category with the highest green water footprint, exceeding grain by 1.20 times. From 2000 to 2023, the green water footprints of these five food categories increased at an average annual rate of 0.47%. The mean green water footprints of grain, vegetable oil, vegetables, melons and fruits, and animal-based foods were 54.22, 34.22, 4.23, 3.77, and 33.45 billion m
3, respectively.
The green water footprint of grain consumption showed a clear decreasing trend from 2000 to 2012, but peaked in 2003 at 78.65 billion m3. This peak was due to increased precipitation in major grain-consuming provinces such as Shanxi, Shandong, Henan, and Shaanxi, which raised green water use during grain production. The green water footprint of vegetable oil consumption increased from 2000 to 2014, reaching a peak of 58 billion m3 in 2014, followed by a declining trend. The green water footprint of vegetables remained relatively stable overall, with a notable increase from 2000 to 2003, peaking at 6.04 billion m3 in 2003, before declining slightly thereafter. For melons and fruits, the green water footprint decreased before 2004, then fluctuated upward from 2004 to 2013 at a slow rate, with an average annual growth of 3.05%. Between 2013 and 2018, the growth accelerated, with an average annual increase of 12.96%, and from 2018 to 2023, fluctuations became more pronounced. The green water footprint of animal-based foods grew slowly from 2000 to 2012, with an average annual growth rate of 2.47%. Growth accelerated from 2012 onward, reaching an average annual rate of 7.70%. After 2018, fluctuations increased, but the overall trend remained upward, closely linked to the rising proportion of meat in residents’ diets.
4.2.3. Blue Water Footprint of Food Consumption
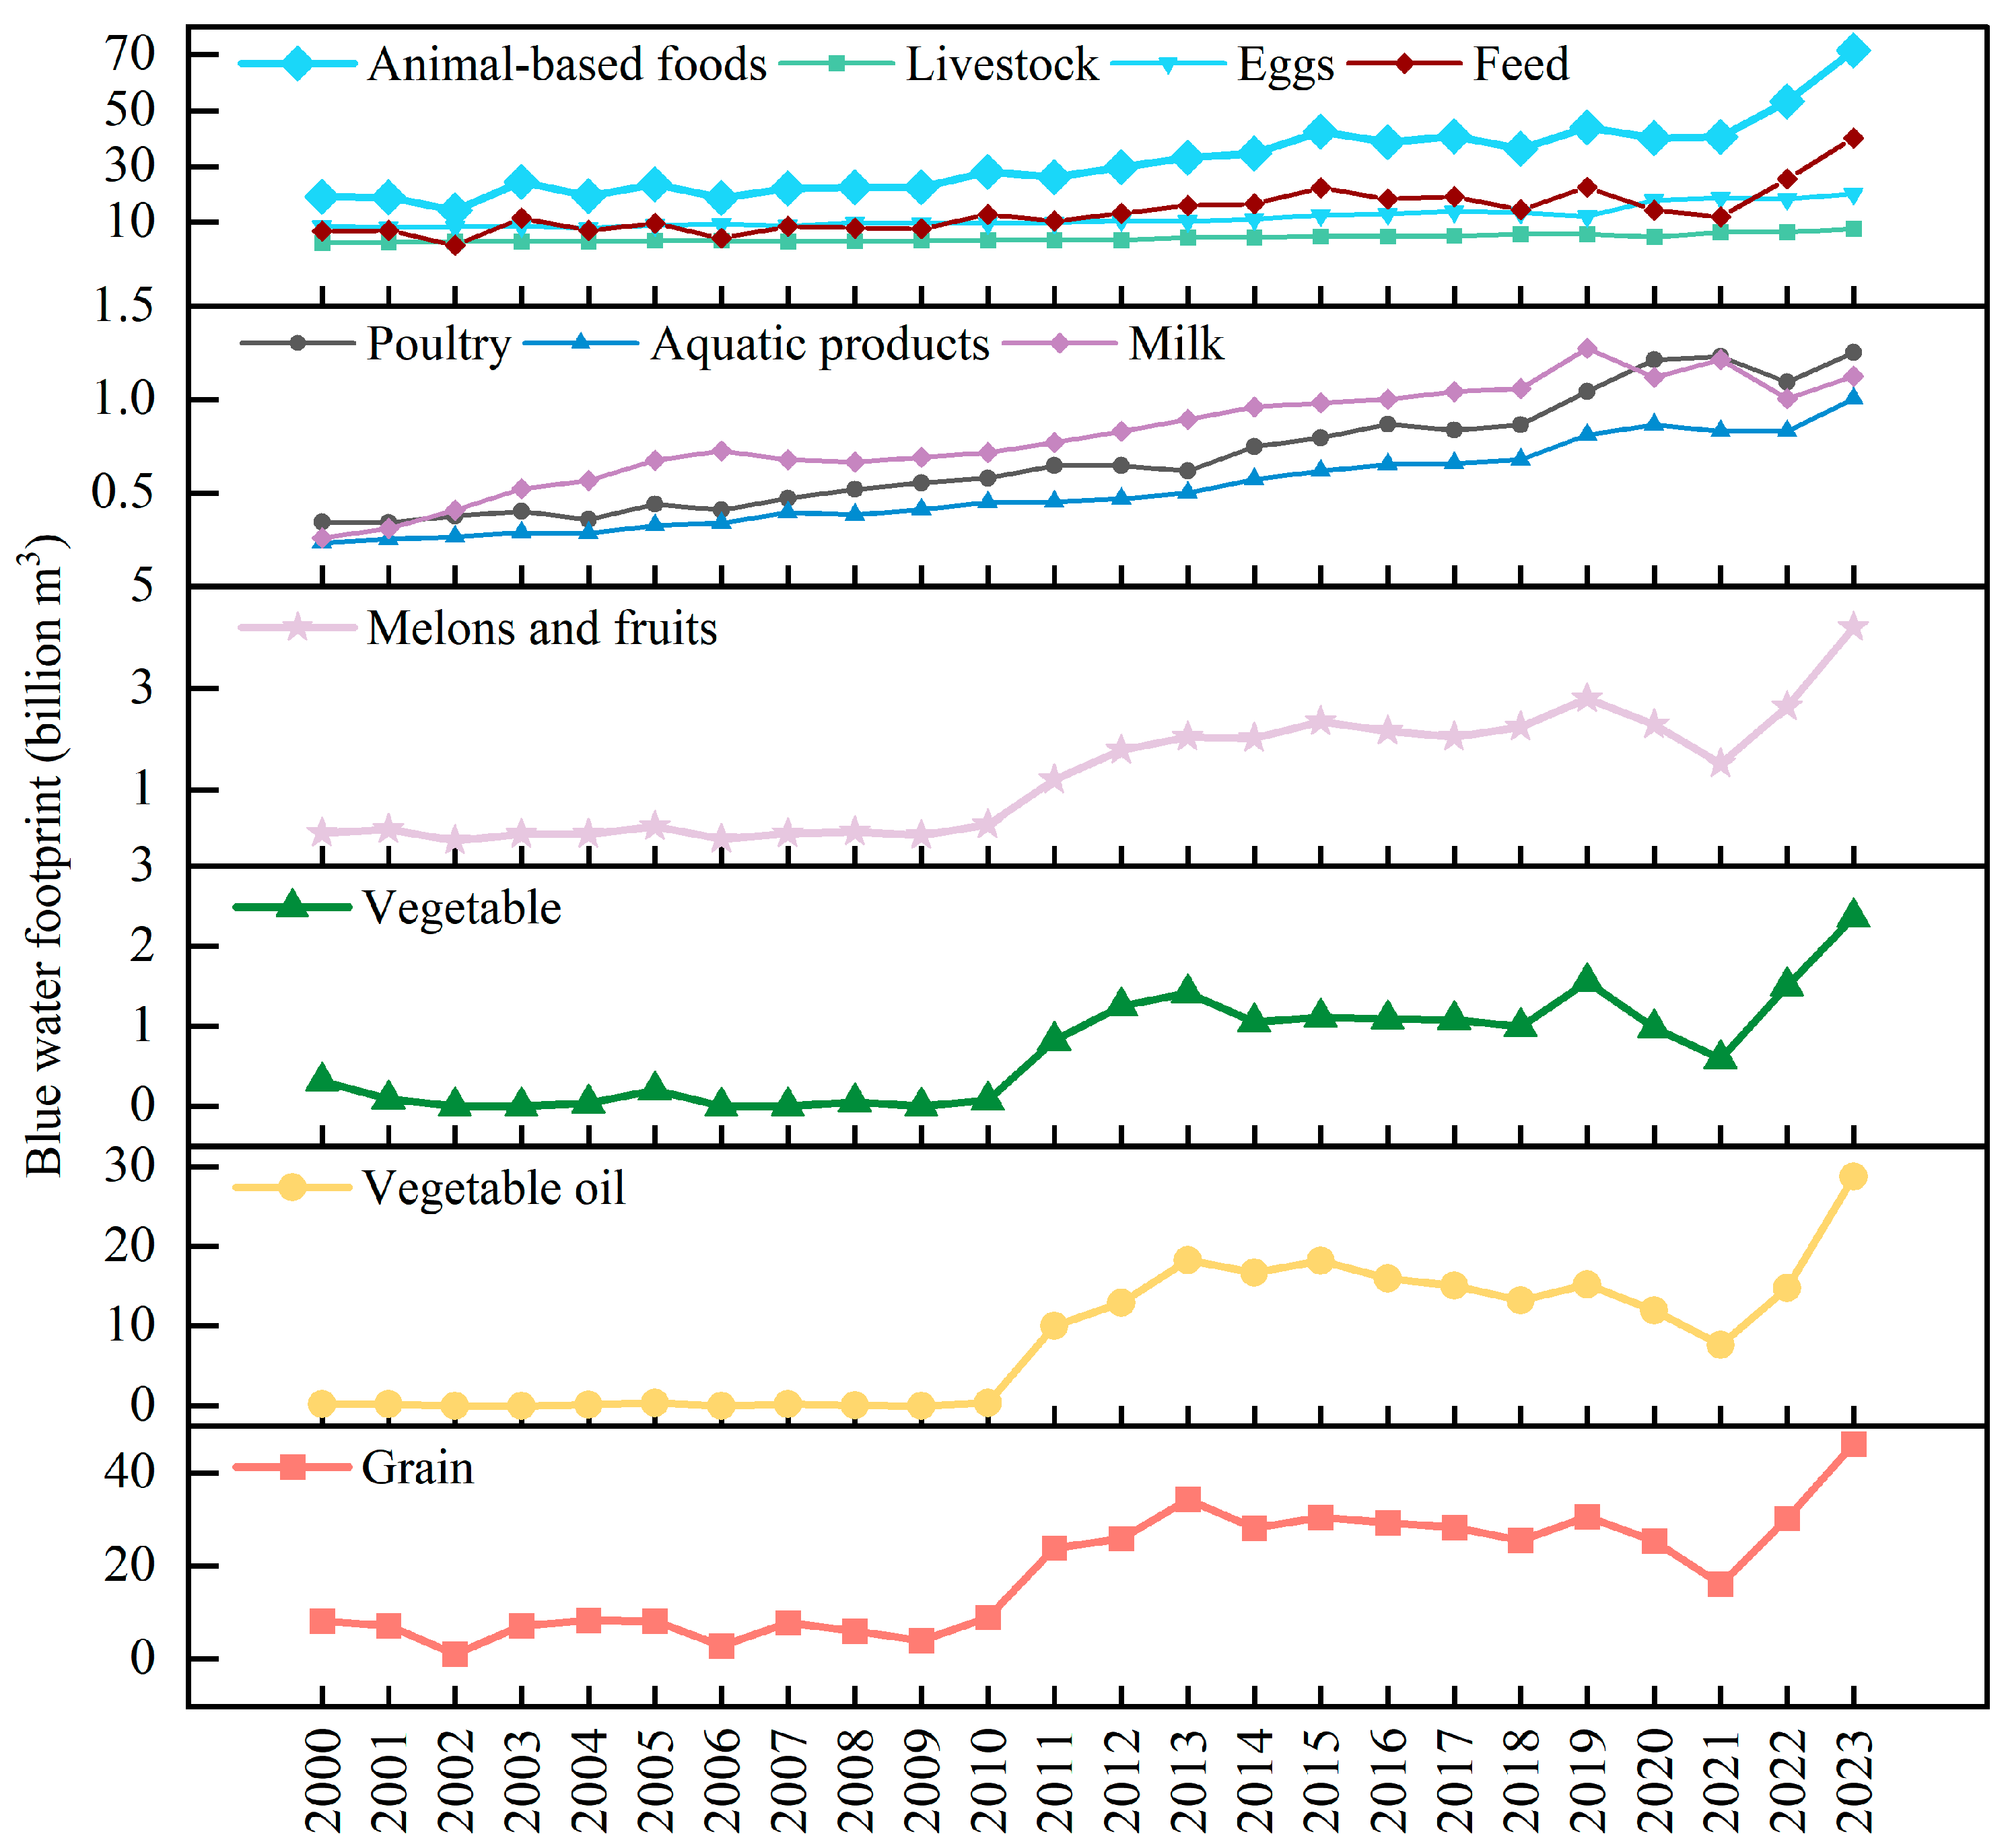
Among the five food categories, animal-based foods had the highest blue water footprint (
Figure 7). In 2023, the blue water footprint of animal-based food consumption was 1.55, 2.49, 30.29, and 17.05 times that of grain, vegetable oil, vegetables, and melons and fruits, respectively. Within animal-based foods, feed consumption accounted for the largest share of blue water use, representing 43.28% of the total annual animal blue water footprint. This was followed by eggs and livestock meat, contributing 36.68% and 13.69%, respectively. The blue water footprints of poultry, milk, and aquatic products were relatively low, averaging 2.17%, 2.54%, and 1.64% of the total animal-based blue water footprint, respectively.
The blue water footprint associated with different food categories exhibited distinct trends (
Figure 7). For grain, the blue water footprint fluctuated between −0.84% and 5.44% annually from 2000 to 2010, then increased at an average annual rate of 8.63%. Between 2013 and 2019, it remained relatively stable with minor fluctuations, followed by pronounced variability thereafter. For vegetable oil, vegetables, and melons and fruits, blue water footprints remained low and stable from 2000 to 2010. After 2010, vegetable oil followed a rise–fall–rise pattern, while vegetables increased slightly at an average annual rate of 171.64% from 2010 to 2013 before stabilizing, and showed strong fluctuations after 2019. The blue water footprint of melon and fruit consumption rose significantly from 2010 to 2019, with an average annual growth rate of 32.03%, and then first declined and subsequently increased. From 2000 to 2023, the blue water footprint of feed for indirect animal-based food consumption increased most markedly. All five animal-based food categories exhibited upward trends, with milk showing the highest growth at an average annual rate of 7.25%, followed by aquatic products (6.81%), poultry (6.25%), livestock meat (5.19%), and eggs (4.32%).
4.3. Water and Land Resources Requirements for Food Consumption in 2030
4.3.1. Population Forecast
According to the National Population Development Plan (2016–2030) [
50], China’s population is expected to peak around 2030, making this year a suitable reference point for projection. Due to regional differences in social and economic development, this study used historical data from 1978 to 2023 to forecast the population of each province in the nine Yellow River provinces separately. The sum of the provincial forecasts represents the overall projection for the region. The results (
Table 6) indicate that by 2030, the nine Yellow River provinces will have a relatively high urbanization rate. The total regional population is projected to reach 41.95 million, of which 26.67 million will reside in urban areas, accounting for approximately 63.58% of the total. According to the United Nations, China’s total population in 2030 is projected to be 1.398 billion. The populations of the nine Yellow River provinces in 2023 and 2030 will account for 29.73% and 30.01% of the national total, respectively, showing only minor changes. Therefore, these projections can serve as a reference for forecasting residents’ food consumption.
4.3.2. Comprehensive Assessment of the Development Potential of Unused Land
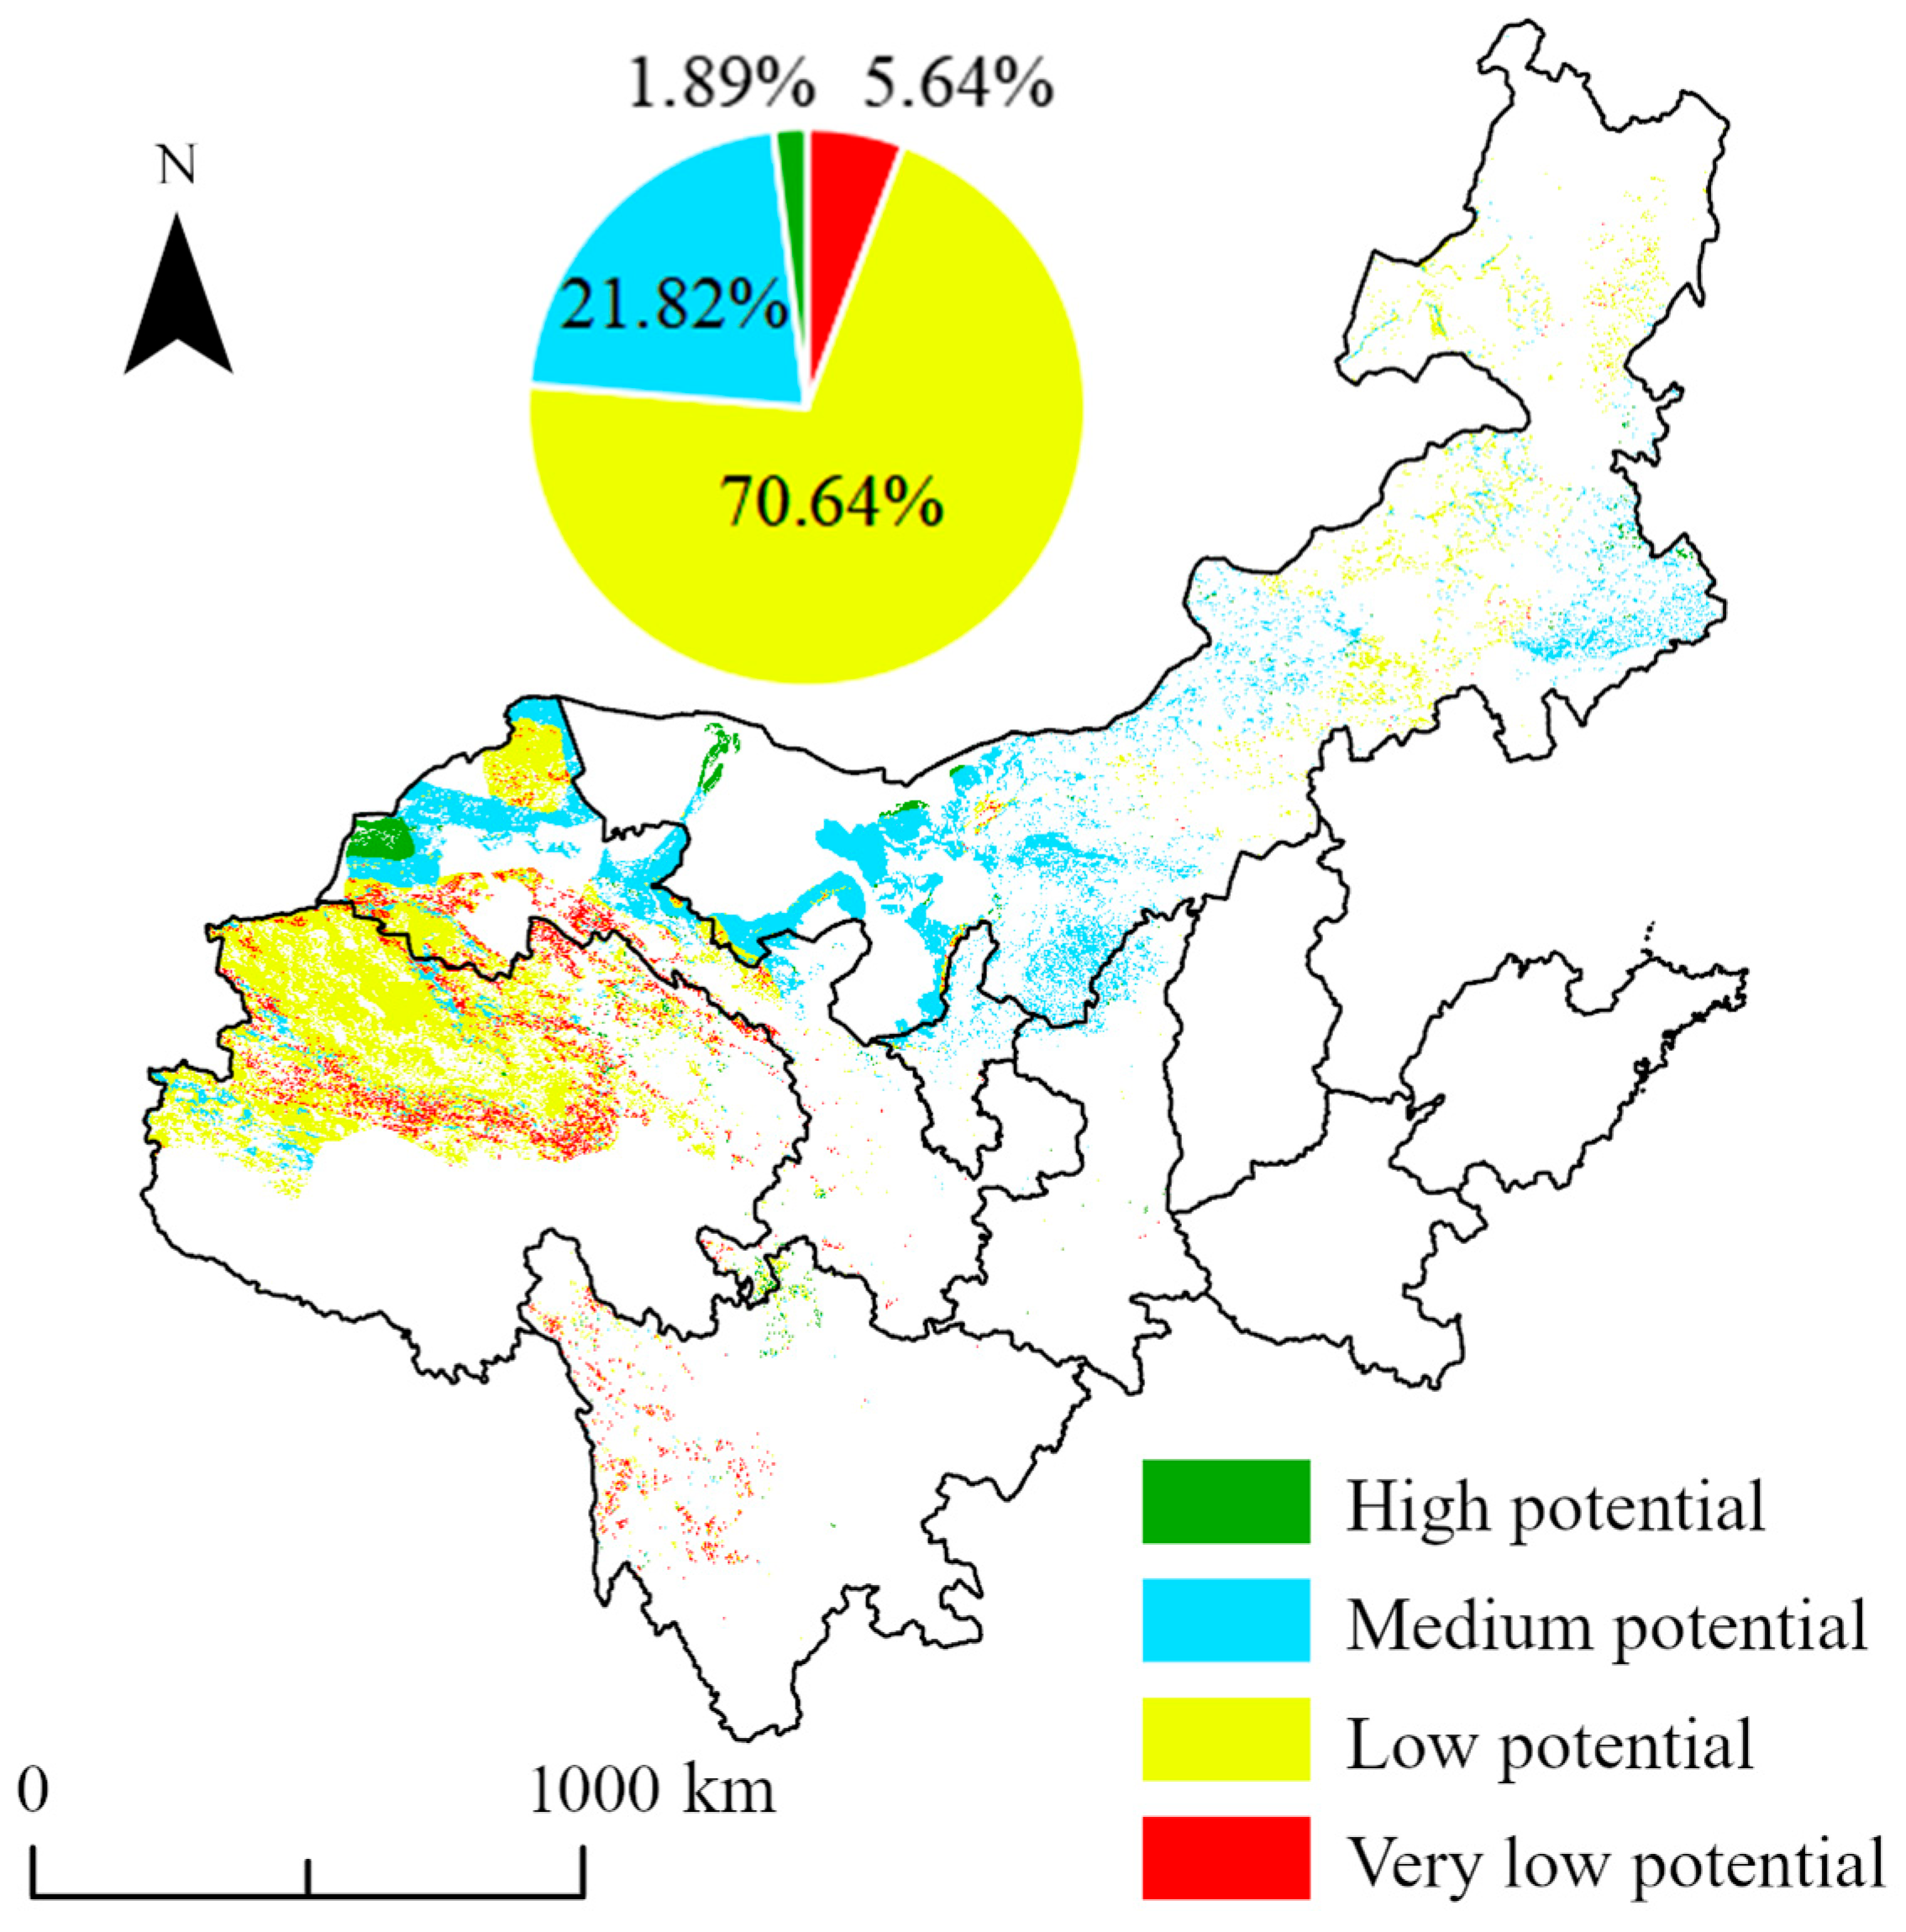
In the nine Yellow River provinces, the proportion of unused land with high development potential is relatively low, accounting for only 1.89% (
Figure 8). Land with medium development potential represents a larger share (21.82%), while land with very low and low potential together accounts for 76.28%. The provinces of Shanxi, Shandong, and Henan have extremely limited unused land resources; therefore, they are excluded from this study. In Sichuan, the total area of unused land is small, with limited overall development potential, where high and medium potential land covers 1.17 × 10
5 hm
2 and 0.73 × 10
5 hm
2. Inner Mongolia, Gansu, and Qinghai possess substantial potential for land development. Gansu has the largest area of high-potential land (8.21 × 10
5 hm
2), followed by Inner Mongolia (5.18 × 10
5 hm
2) and Qinghai (1.09 × 10
5 hm
2). The relatively low area of high-development-potential land in Ningxia and Shaanxi is attributed to the limited availability of suitable unused land resources in these regions. In Qinghai, 92.08% of the unused land falls into the low-potential category, indicating that although the province has a large reserve of unused land, the proportion directly suitable for development is relatively small, and large-scale improvement measures would be required.
4.3.3. Cropland Demand and Deficit
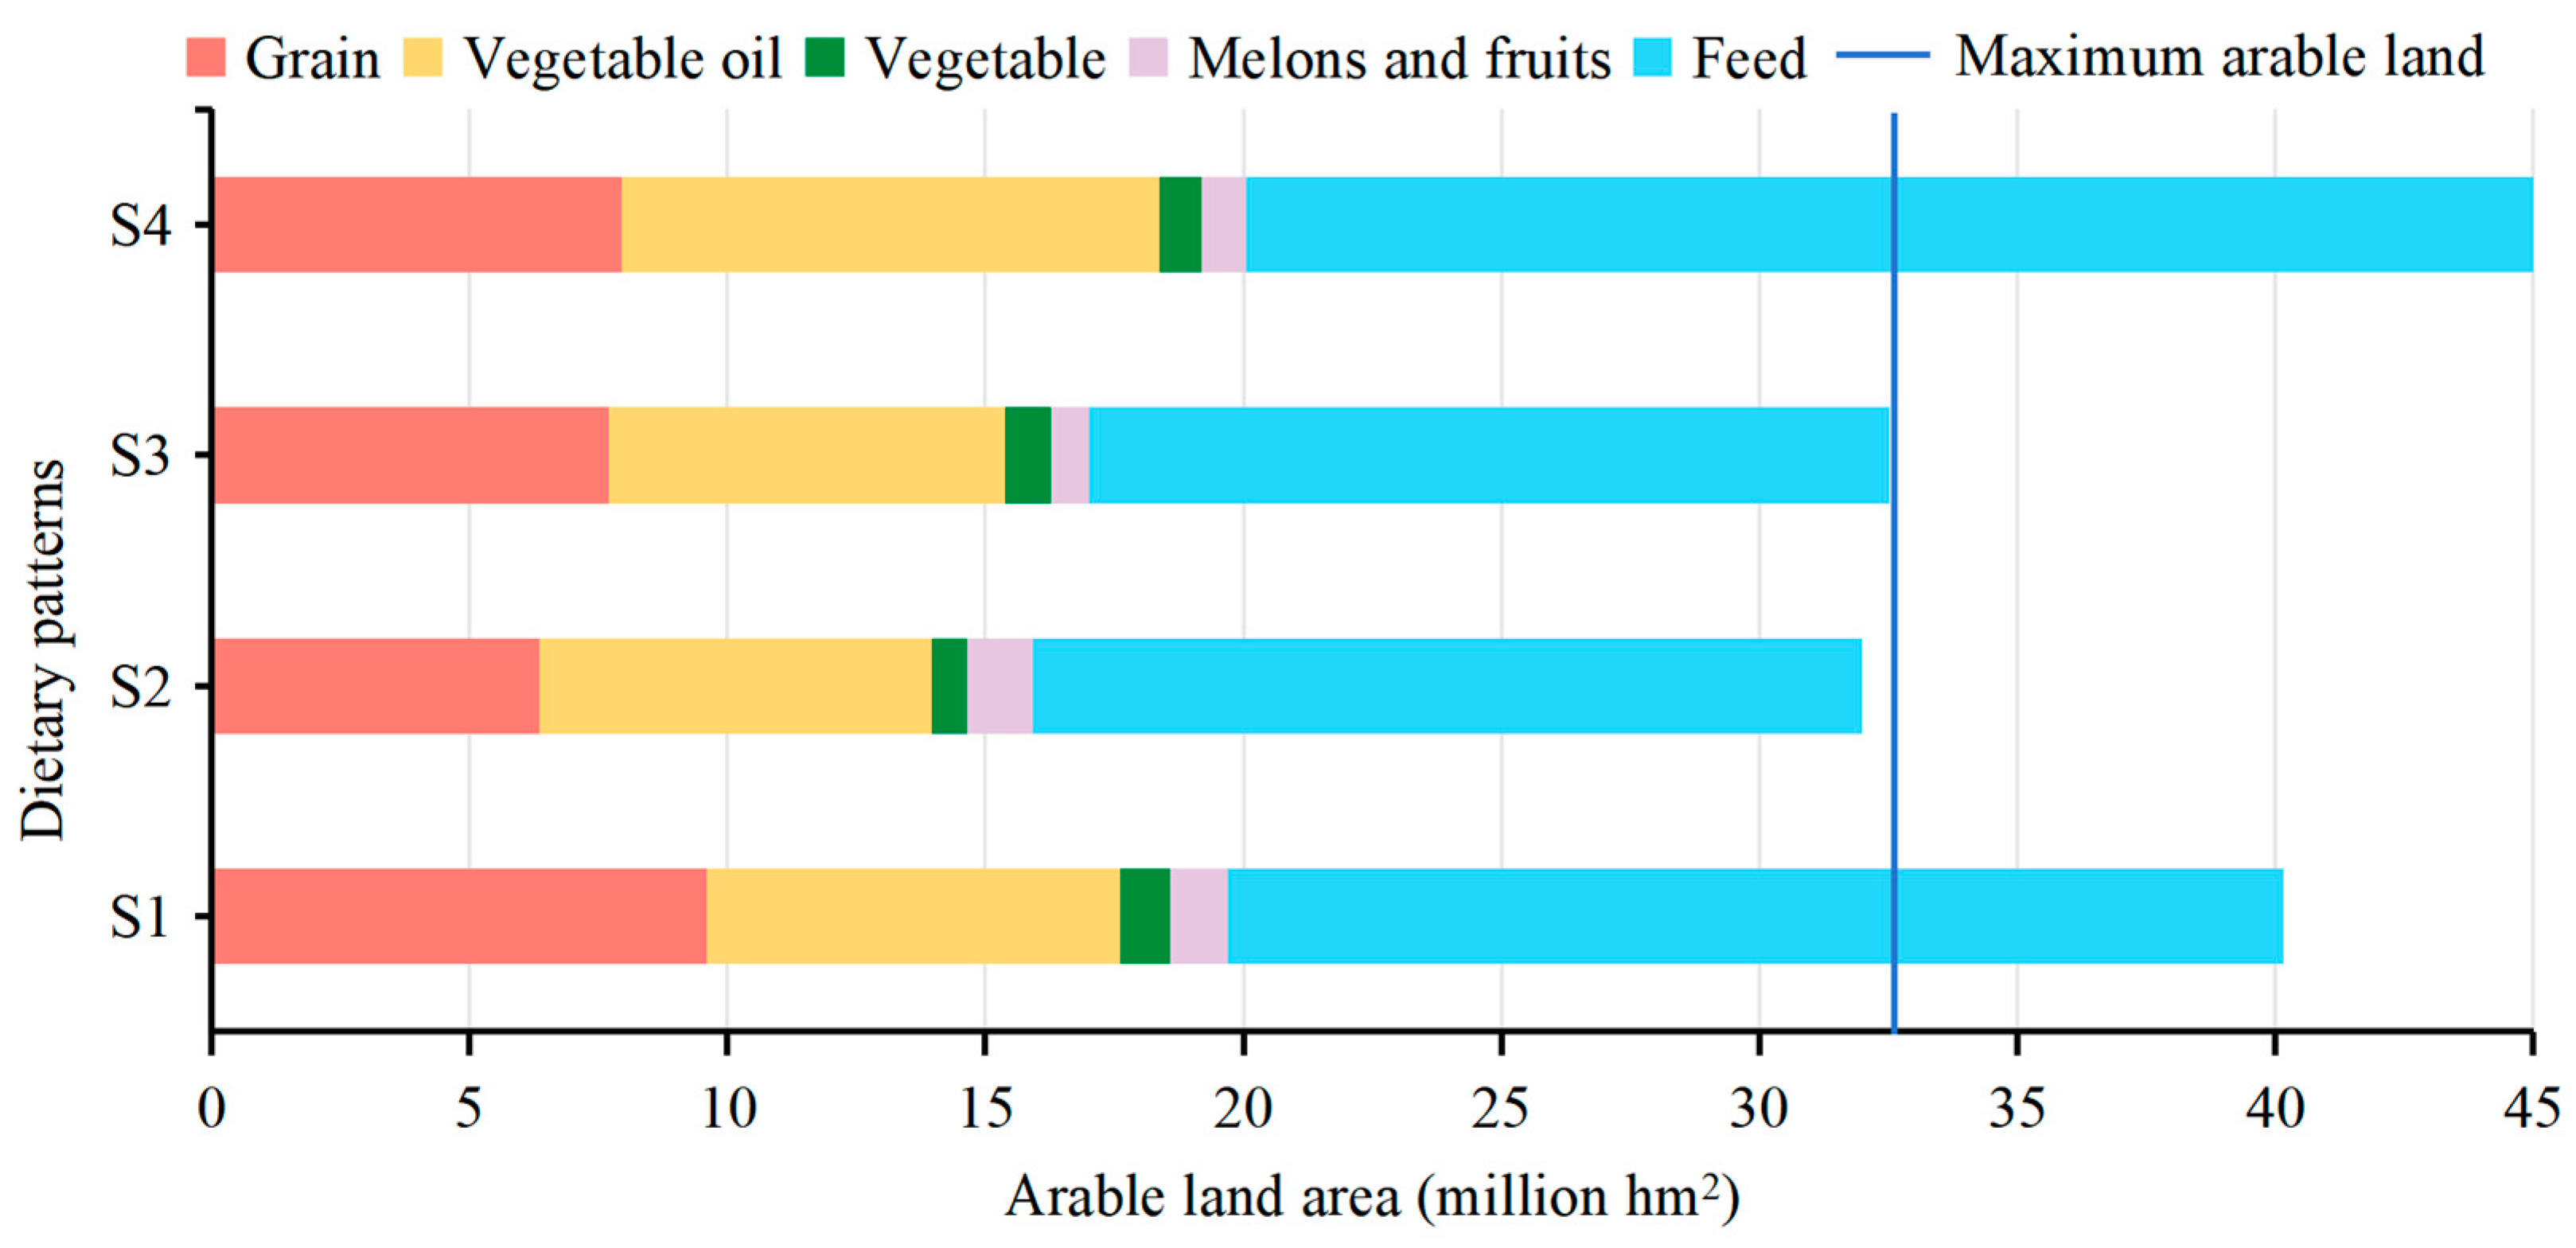
By 2030, the dietary patterns of residents in the nine Yellow River provinces will undergo further changes, leading to shifts in cropland demand. The cropland area required for food consumption under different dietary scenarios is shown in
Figure 9. S1 represents the baseline scenario (current dietary structure), while S2–S4 represent the dietary guideline scenario, policy-oriented scenario, and projection scenario, respectively. Scenario S4 demands the largest cropland area, mainly due to the sharp increase in vegetable oil and feed. Grain consumption under S4 requires the largest cropland area, reaching 7.95 million hm
2. Feed becomes the dominant contributor to cropland demand in S4, far exceeding that in other scenarios. The cropland required for vegetable oil is lowest in S1 and increases steadily from S2 to S4. Vegetable demand remains relatively stable, with only minor differences among the four scenarios. The highest demand occurs under S3, at 0.87 million hm
2. The demand for melons and fruits is highest under S2, but lowest under S3, reflecting the relatively higher consumption level of these products in S2.
The maximum arable land for dietary consumption in the nine Yellow River provinces is 32.40 million hm2, including both the cropland required for food consumption in 2023 and potential land resources. Under the four dietary patterns, the cropland demand for S1 and S4 exceeds the available cropland by 7.76 million hm2 and 13.54 million hm2, respectively. This indicates that if follow the S1 or S4 in 2030, they will need to import additional virtual land, beyond the current level of food trade, to meet local food consumption. Under the S3 dietary pattern, cropland supply and demand are barely balanced, while the cropland demand under S2 is lower than the available cropland. Thus, under S2 and S3, the available cropland can basically satisfy local food consumption.
4.3.4. Water Footprint and Deficit
(1) Green Water Footprint
Based on maintaining the current food supply for non-Yellow River residents (i.e., focusing on the effects of dietary changes on production green water footprint), the green water footprint of each product under the four dietary scenarios was calculated (
Table 7). In 2030, the production green water footprints of S1, S2, S3, and S4 all exceed that of 2023 (334.35 billion m
3), with total deficits of 55.58, 16.05, 20.25, and 75.29 billion m
3, respectively. This indicates increasing pressure from green water scarcity in food production. For grain and vegetables, the green water footprints under S2, S3, and S4 are smaller than those under the baseline diet (S1) and lower than in 2023, suggesting that current water allocation can secure their production. However, feed shows a large deficit in all scenarios, at 39.41, 20.92, 18.76, and 58.24 billion m
3, respectively. Among feed crops, maize accounts for the largest deficit, at 24.16, 15.68, 14.76, and 31.68 billion m
3; followed by soybean, with deficits of 12.83, 4.48, 3.44, and 22.35 billion m
3 under the four diets. In S4, the increase in vegetable oil and animal-based food consumption is the main driver of the green water deficit, with vegetable oil and feed contributing most significantly.
(2) Blue Water Footprint
Based on maintaining the current food supply for non-Yellow River residents (focusing on the effects of dietary changes on production blue water footprint), the blue water footprint of each product under the four dietary scenarios was calculated (
Table 8). In all scenarios, the future production blue water footprints exceed that of 2023 (379.98 billion m
3), with deficits of 50.72, 13.68, 12.35, and 65.57 billion m
3, posing significant challenges to regional food security. Compared with the current dietary pattern (S1), grain consumption decreases under the recommended diets S2, S3, and S4, leading to reduced corresponding blue water footprints. However, S4 shows the highest production blue water footprint due to increased consumption of animal-based foods, even exceeding that under the current development pattern. S2 and S3 both reduce blue water use relative to S1, mainly because of lower intake of grain and animal-based foods. Reduced consumption of livestock and poultry meat under these scenarios also lowers associated feed demand. Feed remains the largest consumer of total grain production under all dietary patterns. The blue water footprint deficits of feed under S1, S2, S3, and S4 are 19.45, 9.53, 7.78, and 39.80 billion m
3, respectively, indicating that feed water demand will face the greatest pressure under the S4 scenario.
4.4. Optimized Allocation of Water and Land Resources Oriented by Residents’ Dietary Patterns
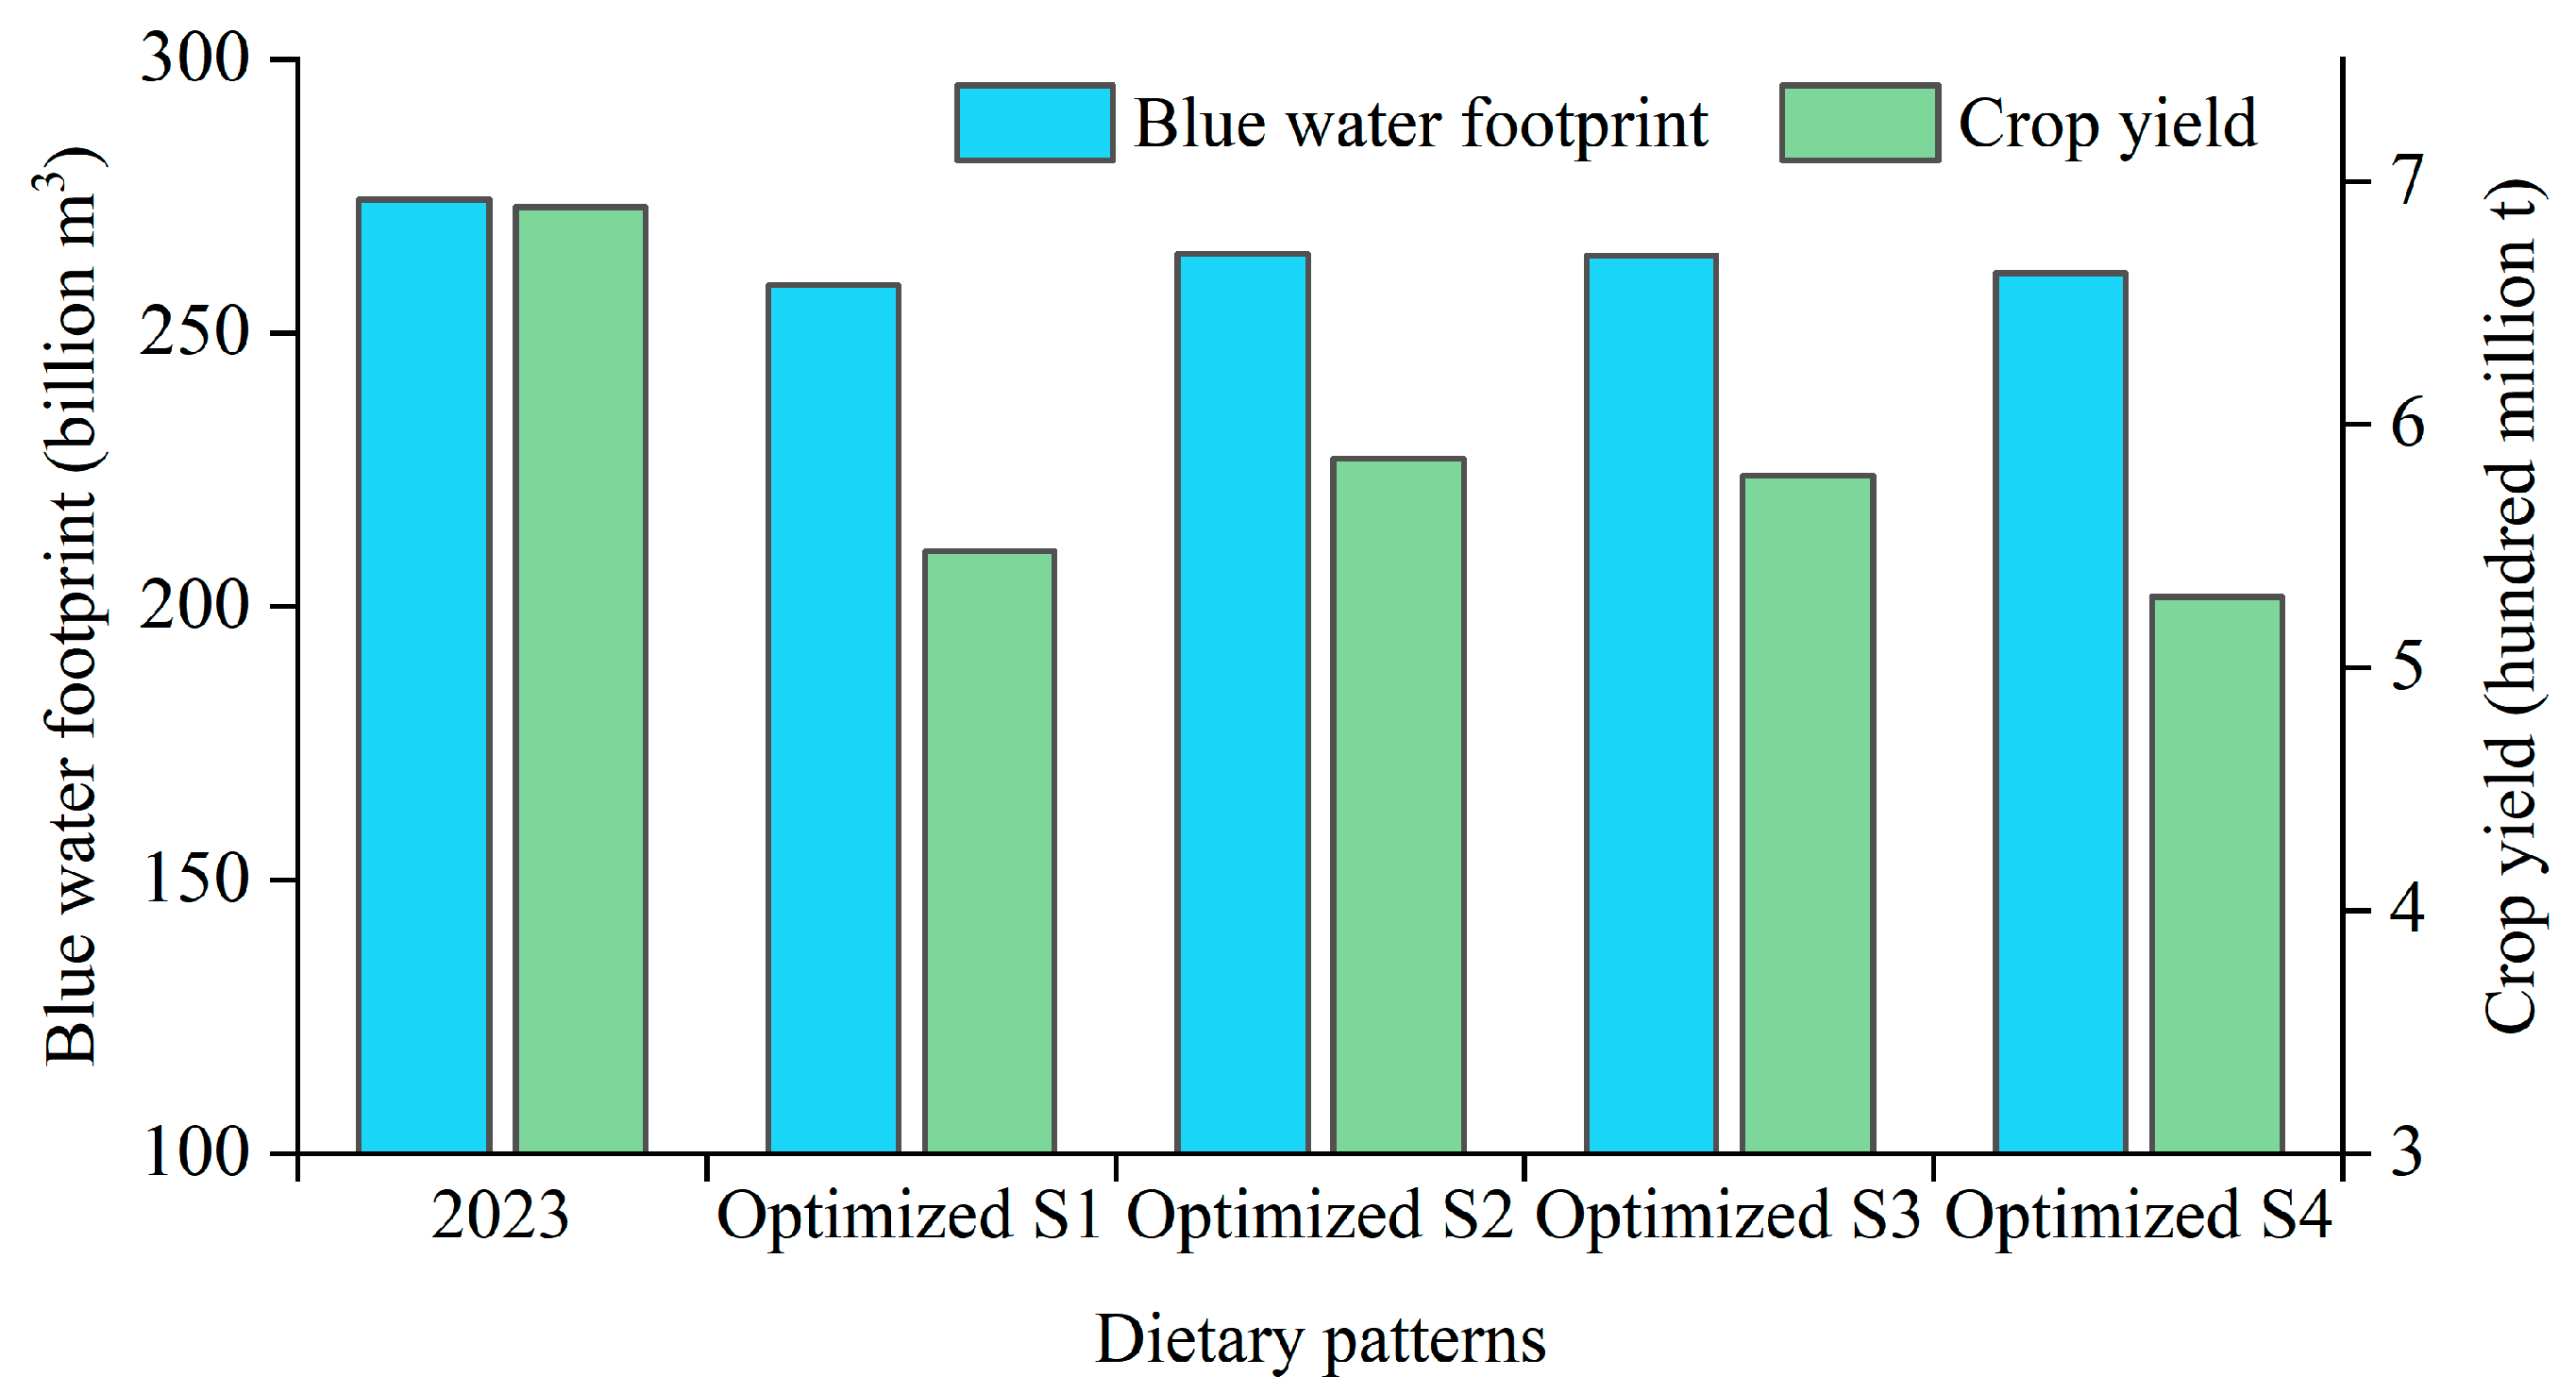
The optimal targets for blue water footprint and crop yield under different dietary-structure-oriented optimization schemes in the nine Yellow River provinces are shown in
Figure 10, with the optimized crop planting areas presented in
Table 9. In 2023, the regional crop production blue water footprint was 274.48 billion m
3, with a yield of 689 million tons. By 2030, under the S1 dietary-oriented optimization, the blue water footprint decreased to 258.75 billion m
3 and yield to 548 million tons. Under S2, the footprint was 264.51 billion m
3 and yield 586 million tons; under S3, 264.23 billion m
3 and 579 million tons; and under S4, 260.96 billion m
3 and 529 million tons. These changes are driven by shifts in crop planting structure induced by dietary adjustments. The planting areas of vegetable oil crops, maize, and soybean increased significantly, while those of other crops declined to varying degrees, with vegetables and melons and fruits showing the sharpest reduction. Wheat, rice, vegetables, and melons and fruits have relatively high yields, whereas maize and soybean yields are lower. Thus, the overall decline in crop yield after optimization is reasonable.
S4 places greater emphasis on meeting the future demand for animal-based products, resulting in the lowest overall yield. Furthermore, soybeans have a high unit blue water footprint, meaning that even with reduced total yield, the expansion of high water-demanding crops keeps the footprint relatively high. Among the four dietary scenarios, S2 and S3 result in higher yields, making them suitable options when balancing dietary patterns with water resources. In contrast, if rising demand for animal products must be prioritized, S4 becomes the preferable choice.
5. Discussion
The realization of food security relies on the effective safeguarding of water and land resources. China is currently facing a major contradiction between the rigid demand for food and the limited availability of these resources. On the one hand, population growth and dietary upgrading have driven both quantitative and structural changes in food demand. On the other hand, the uneven spatial–temporal distribution of water resources and the heterogeneity of cultivated land quality impose significant constraints on food production. How to optimize the allocation of water and land resources while ensuring a balanced and healthy diet for residents has become a core issue for sustainable agricultural development.
5.1. Food Security Challenges Under the Dual Constraints of Cropland and Water Resources
The projection results show that by 2030, under the food consumption structure recommended by the Chinese Dietary Guidelines (2022) [
36], the currently available cropland resources in the nine Yellow River provinces can meet the cropland demand for food consumption of local residents, and the deficits in blue and green water footprints are relatively small. However, studies have shown that even if current food supply can meet demand, future food production gaps may still emerge due to demographic, policy, and environmental factors, resulting in greater cropland pressure [
51,
52]. At the same time, China’s irrigation water can only sustain the current dietary pattern and is insufficient to support the additional water demand required for a healthy and balanced diet [
53], further intensifying the conflict between agricultural and ecological water use. The shift in food consumption has altered the demand for land and water resources. Combined with China’s long-standing agricultural production model of “high input, high output, and low efficiency,” this has led to cropland degradation, water pollution, and low efficiency of agricultural water use despite high yields. Statistics show that only 31.24% of China’s cropland is classified as high-quality, high-yield, and stable farmland [
54], while the efficiency of farmland irrigation still has considerable room for improvement [
55]. Excessive fertilizer use further threatens soil quality and, through runoff, contaminates water bodies, posing dual risks to water security and sustainable agricultural production [
56]. In eastern China, higher levels of economic development and population density lead to greater demand for land and water resources. Some western regions have certain potential for unused land development, but their natural resource endowment is relatively poor. The sharp contradiction between urbanization and land and water resource use in the east further increases regional food security risks. Therefore, it is necessary to promote conservation and protection of land and water resources from both the consumption and production sides, so as to safeguard the bottom line of food security.
5.2. Comparison with Previous Studies
This study analyzed the cropland area and water footprint required for food consumption in the nine Yellow River provinces from 2000 to 2023. It also projected cropland demand and water footprint in 2030 under different dietary scenarios. Our estimates are highly consistent with some previous studies. For the cropland area required to produce 1 kg of Rice, Wheat, Maize, Soybean, and Fruits, our results are similar to those of Li and Yan (
Table 10) [
57,
58]. The result for Vegetable oil is consistent with Yan, but lower than those of Zhen and Li [
57,
58,
59]. This is because we allocated the cropland required for oil crops to vegetable oil and to by-products used as animal feed based on consumption. This approach avoids double counting caused by not considering the use of by-products as feed. For animal-based foods, our results are similar to those of Li and Yan, but significantly lower than those of Zhen [
57,
58,
59]. In this study, we focused on the cropland demand for grain feed used in animal production. In contrast, Zhen included grassland demand for feed such as grass and silage. Regarding the water footprint of food consumption, the results for grains, vegetables, and fruits are consistent with existing studies (
Table 11) [
58,
60,
61]. The water footprint of animal-based foods is lower than in other studies, and the reason is similar to that for cropland demand. Zhuo considered the water footprint of grass consumed by animals [
61], and Mekonnen used multi-year average agricultural production levels to calculate water footprints [
60]. In contrast, this study used annual data to calculate water footprints year by year. As production levels improve, the water footprint of all types of food decreases over time.
5.3. Uncertainty Analysis
Population change is one of the factors that drive changes in total food consumption, and its projected values contain certain uncertainties. To quantify the impact of this uncertainty on the estimation of cropland demand, this study applied the Monte Carlo method to introduce random perturbations to the population variable. Since cropland demand is an important intermediate variable that links food consumption and agricultural water resource use, its uncertainty analysis can, to some extent, reflect the impact of population projection errors on the demand for land and water resources.
The Monte Carlo simulation results show that, when considering population uncertainty, cropland demand in all scenarios fluctuates within a certain range. In 2030, the cropland demand under scenarios S1, S2, S3, and S4 is 3.68 × 10
7~4.06 × 10
7, 3.36 × 10
7~3.71 × 10
7, 3.35 × 10
7~3.71 × 10
7, and 4.59 × 10
7~5.07 × 10
7 hm
2. The corresponding mean values are 3.87 × 10
7, 3.52 × 10
7, 3.53 × 10
7, and 4.83 × 10
7 hm
2. The uncertainty ranges are similar across scenarios and fall between 9.7% and 10.2%. The fluctuation range relative to the mean is approximately ±5%, indicating that cropland demand results exhibit only relatively small variations under population projection uncertainty. The results of S2 and S3 are close, and their intervals largely overlap, so the difference is not significant. S1 is slightly higher than S2 and S3, and there is some overlap. S4 is significantly higher than the other scenarios, and its interval does not overlap with them. Further analysis shows that the differences among scenarios are much larger than the uncertainty ranges. This indicates that scenario settings such as dietary structure have a much greater impact on cropland demand than population uncertainty. This result is consistent with previous studies, which show that dietary structure transition is a key factor driving changes in agricultural resource demand [
60]. The relative ranking among scenarios remains consistent under uncertainty, which indicates that the conclusions of this study are robust.
5.4. Limitations and Future Research
This study focuses on the gaps in water footprint and cropland between food production and consumption. It explores the supply–demand contradictions of water and land resources from a food supply–demand perspective and provides a basis for improving the matching of these resources. However, further work is still needed. In the gap calculation and the water–land resource optimization model, we have considered the actual differences between food production and consumption. The purpose is to include the implicit water and land resources demand embodied in food inflows or outflows. However, we did not further trace the specific origins of these food products. Agricultural trade plays an important role in optimizing resource allocation and alleviating regional resource constraints [
62]. Future studies can combine multi-regional input–output models to more accurately describe the data and pathways of cross-regional flows of virtual water and virtual land. In addition, we assumed that production conditions, such as yield levels, remain the same as in 2023. This assumption may overestimate the cropland and water resources required for crop production. Climate change may affect crop yields and planting structures, and thus change cropland demand and water resource use patterns. The impacts of climate change have strong uncertainty, and their effects depend on specific climate scenarios and model assumptions [
63,
64]. Although uncertainty analysis was conducted for population projections, the impacts of temperature and precipitation changes under climate change scenarios on evapotranspiration (ET) and crop yields were not further considered. Variations in ET can significantly affect agricultural water footprint results in the Yellow River Basin [
65]. Future studies can further incorporate climate change scenarios and build a coupled analysis framework of dietary structure and climate change, so as to comprehensively assess changes in resource demand.
6. Conclusions
This study focuses on the complex relationship between food consumption patterns and land and water resources demand in the nine Yellow River provinces. Using water footprint theory and cropland required calculation methods, the study comprehensively assesses cropland and water resource demands from 2000 to 2023. It also analyzes the supply and demand issues of land and water resources under different dietary structures and explores their optimal allocation. The analysis reveals that despite the relatively abundant cropland resources in the region, the ongoing dietary transition and pressure from water scarcity pose significant challenges to food security.
The results show that from 2000 to 2023, residents in the nine Yellow River provinces primarily consumed plant-based foods, with rural residents having a higher proportion of plant-based food consumption, which declined more rapidly. The land required for grain consumption decreased by 47.58%, while the increase in animal-based food consumption added pressure to cropland resources. The green water footprint of animal-based food consumption rose significantly, while that of grain and vegetables showed a fluctuating downward trend. The blue water footprint of animal-based food consumption exhibited an upward trend, with an average annual growth rate of 6.19%. Among these, animal feed accounted for the highest blue water footprint, contributing 43.28% of the total blue water footprint of animal products. Under the S4 scenario, cropland demand was the highest, while the demands under S2 and S3 were lower, with S2 being below the available cropland and S3 almost balanced. By 2030, the green water footprint gaps under S1, S2, S3, and S4 were 55.58, 16.05, 20.25, and 75.29 billion m3, respectively; blue water footprint gaps were 50.72, 13.68, 12.35, and 65.57 billion m3. Compared to 2023, the production blue water footprints in 2030 under S1, S2, S3, and S4 would be reduced by 15.73, 9.97, 10.25, and 13.52 billion m3, respectively. The production yields under these four scenarios would be reduced by 0.14, 0.10, 0.11, and 0.16 billion tons, respectively, due to the increased planting areas of soybeans, maize, and vegetable oil crops, which have relatively low yields. Among the four dietary patterns, S2 and S3 better support the coordinated development of diets and land and water resources, while S4 better meets the rising demand for animal-based products.
The core strength of this study lies in incorporating dietary structure changes at the consumption end into the water and land resources optimization framework, thereby addressing the limitations of previous production-oriented studies. To alleviate the conflict between food demand and water and land resources under dietary transitions, our results propose four strategies: (1) optimize dietary structure by guiding residents to reduce the consumption of water-intensive animal-based foods and increase the intake of plant-based foods; (2) adjust agricultural planting patterns by moderately expanding the cultivation of key crops such as soybeans and oilseeds to improve resource use efficiency; (3) strengthen inter-regional resource allocation through coordinated trade and policy measures to relieve resource constraints; and (4) rationally develop potential arable land under the premise of ensuring ecological security to achieve sustainable use of water and land resources.
Author Contributions
Conceptualization, investigation and resources M.C.; methodology, M.C. and X.J.; software, validation, data curation and formal analysis X.J.; writing—original draft preparation, M.C. and X.J.; writing—review and editing, visualization, M.C.; supervision, Y.P. and Y.C. All authors have read and agreed to the published version of the manuscript.
Funding
This research was supported by the National Natural Science Foundation of China, grant number 52209029; the Research Fund of Key Laboratory of Water Management and Water Security for Yellow River Basin, Ministry of Water Resources (under construction), grant number 2022-SYSJJ-04; the Open Research Fund Program of Laboratory for Ecological Protection and High-quality Development of the Upstream of Yellow River, grant number 2025hhsy02; and the Open Research Fund Program of the State Key Laboratory of Hydroscience and Engineering, grant number sklhse-KF-2026-A-09.
Data Availability Statement
The original contributions presented in this study are included in the article. Further inquiries can be directed to the corresponding author.
Conflicts of Interest
The authors declare no conflicts of interest.
References
- Cheng, S.; Dong, J.; Xiuli, L.; Liu, X.; Zong, G.; Li, X.; Deng, X. Key Scientific Issues on National Nutrition and Food Security in China in the New Era: Summary of the 249th NSFC Shuangqing Forum. Bull. Natl. Nat. Sci. Found. China 2021, 35, 426–434. [Google Scholar]
- Godfray, H.C.J.; Aveyard, P.; Garnett, T.; Hall, J.W.; Key, T.J.; Lorimer, J.; Pierrehumbert, R.T.; Scarborough, P.; Springmann, M.; Jebb, S.A. Meat consumption, health, and the environment. Science 2018, 361, Eaam5324. [Google Scholar] [CrossRef]
- World Health Organization. The State of Food Security and Nutrition in the World 2023: Urbanization, Agrifood Systems Transformation and Healthy Diets Across the Rural–Urban Continuum; Food & Agriculture Organization: Rome, Italy, 2023. [Google Scholar]
- Chou, H.; Lei, X.; Leng, G.; Liu, M. A Comprehensive TheoreticalAnalysis of Grain Security in the New Era. Chin. Rural Econ. 2022, 2–17. [Google Scholar]
- Du, Z.; Han, L. The Impact of Production-side Changes in Grain Supply on China’s Food Security. Chin. Rural Econ. 2020, 2–14. [Google Scholar]
- Zheng, Q.-W.; Su, W.-C.; Zhang, F.-T.; Zhou, Z.-Q. Evaluation of water resources security in the karst region from the “man-land-water” perspective: A case study of Guizhou Province. Water Resour. Manag. 2019, 11, 224. [Google Scholar] [CrossRef]
- Ibarrola-Rivas, M.; Granados-Ramírez, R.; Nonhebel, S. Is the available cropland and water enough for food demand? A global perspective of the Land-Water-Food nexus. Adv. Water Resour. 2017, 110, 476–483. [Google Scholar] [CrossRef]
- Beylot, A.; Secchi, M.; Cerutti, A.; Merciai, S.; Schmidt, J.; Sala, S. Assessing the environmental impacts of EU consumption at macro-scale. J. Clean. Prod. 2019, 216, 382–393. [Google Scholar] [CrossRef]
- Luo, L.; Xing, Z.; Chu, B.; Zhang, H.; Wang, H. Virtual land trade and associated risks to food security in China. Environ. Impact Assess. Rev. 2024, 106, 107461. [Google Scholar] [CrossRef]
- Li, Y.; Zhang, W.; Ma, L.; Wu, L.; Shen, J.; Davies, W.J.; Oenema, O.; Zhang, F.; Dou, Z. An analysis of C hina’s grain production: Looking back and looking forward. Food Energy Secur. 2014, 3, 19–32. [Google Scholar] [CrossRef]
- Vanham, D.; Alfieri, L.; Feyen, L. National water shortage for low to high environmental flow protection. Sci. Rep. 2022, 12, 3037. [Google Scholar] [CrossRef]
- Wang, Y. The challenges and strategies of food security under rapid urbanization in China. Sustainability 2019, 11, 542. [Google Scholar] [CrossRef]
- Xu, X.; Sharma, P.; Shu, S.; Lin, T.-S.; Ciais, P.; Tubiello, F.N.; Smith, P.; Campbell, N.; Jain, A.K. Global greenhouse gas emissions from animal-based foods are twice those of plant-based foods. Nat. Food 2021, 2, 724–732. [Google Scholar] [CrossRef]
- He, G.; Zhao, Y.; Wang, L.; Jiang, S.; Zhu, Y. China’s food security challenge: Effects of food habit changes on requirements for arable land and water. J. Clean. Prod. 2019, 229, 739–750. [Google Scholar] [CrossRef]
- Falchetta, G.; Golinucci, N.; Rocco, M.V. Environmental and energy implications of meat consumption pathways in sub-Saharan Africa. Sustainability 2021, 13, 7075. [Google Scholar] [CrossRef]
- Vanham, D.; Comero, S.; Gawlik, B.M.; Bidoglio, G. The water footprint of different diets within European sub-national geographical entities. Nat. Sustain. 2018, 1, 518–525. [Google Scholar] [CrossRef]
- Liu, B.; Liu, R.; Yan, Z.; Ren, S.; Zhao, X.; Liu, G. Optimal allocation of soil and water resources in agriculture under the total regional evapotranspiration indicator: A case study in Guangping, China. Ecol. Indic. 2024, 160, 111855. [Google Scholar] [CrossRef]
- Luo, J.; Zhang, H.; Qi, Y.; Pei, H.; Shen, Y. Balancing water and food by optimizing the planting structure in the Beijing–Tianjin–Hebei region, China. Agric. Water Manag. 2022, 262, 107326. [Google Scholar] [CrossRef]
- Tang, Y.; Zhang, F.; Wang, S.; Zhang, X.; Guo, S.; Guo, P. A distributed interval nonlinear multiobjective programming approach for optimal irrigation water management in an arid area. Agric. Water Manag. 2019, 220, 13–26. [Google Scholar] [CrossRef]
- Galán-Martín, Á.; Vaskan, P.; Antón, A.; Esteller, L.J.; Guillén-Gosálbez, G. Multi-objective optimization of rainfed and irrigated agricultural areas considering production and environmental criteria: A case study of wheat production in Spain. J. Clean. Prod. 2017, 140, 816–830. [Google Scholar] [CrossRef]
- Yan, C.; Li, M.; Zhuo, L.; Han, Y.; Ji, X.; Wu, P. Diversities and sustainability of dietary water footprint and virtual water flows in China. J. Clean. Prod. 2024, 444, 141204. [Google Scholar] [CrossRef]
- Wang, Y.; Wang, H.; Sun, J.; Qi, P.; Zhang, W.; Zhang, G. Spatially optimized allocation of water and land resources based on multi-dimensional coupling of water quantity, quality, efficiency, carbon, food, and ecology. Agric. Water Manag. 2025, 309, 109340. [Google Scholar] [CrossRef]
- Zhang, J. Nine Provinces along Yellow River Unite for Basin Management. Xinhua Daily Telegraph, 27 November 2000.
- Lu, J.; Yu, Z.; Zhao, Y. A Review on Structural Changes of China’s Food Demand. Issues Agric. Econ. 2013, 34, 15–19+110. [Google Scholar]
- Zhang, Z.; Wang, D.; Tang, H. China’s Grain Security Guarantee: An Analysis Based on the Change of Grain Consumption Structure. Consum. Econ. 2022, 38, 38–49. [Google Scholar]
- Xu, X.; Liu, J.; Zhang, S.; Li, R.; Yan, C.; Wu, S. China’s Multi-Period Land Use Land Cover Remote Sensing Monitoring Dataset. Resource and Environmental Science Data Registration and Publishing System, 2018. Available online: https://www.resdc.cn/DOI/doi.aspx?DOIid=54 (accessed on 8 May 2026).
- European Space Agency. Copernicus Global Digital Elevation Model. Open Topography. 2021. Available online: https://portal.opentopography.org/datasetMetadata?otCollectionID=OT.032021.4326.1 (accessed on 8 May 2026).
- FAO; IIASA. Harmonized World Soil Database Version 2.0; Food & Agriculture Organization: Rome, Italy; International Institute for Applied Systems Analysis (IIASA): Laxenburg, Austria, 2023. [Google Scholar]
- Institute of Geographic Sciences and Natural Resources Research, Chinese Academy of Sciences. China Meteorological Background Dataset. Resource and Environmental Science Data Registration and Publishing System. 2025. Available online: https://www.resdc.cn/data.aspx?DATAID=376 (accessed on 8 May 2026).
- Institute of Geographic Sciences and Natural Resources Research, Chinese Academy of Sciences. China Annual Average Meteorological Elements Dataset. Resource and Environmental Science Data Registration and Publishing System. 2025. Available online: https://www.resdc.cn/data.aspx?DATAID=378 (accessed on 8 May 2026).
- Cai, T.; Li, X.; Ding, X.; Wang, J.; Zhan, J. Flood risk assessment based on hydrodynamic model and fuzzy comprehensive evaluation with GIS technique. Int. J. Disaster Risk Reduct. 2019, 35, 101077. [Google Scholar] [CrossRef]
- GB/T 28407-2012; Regulation for Gradation on Agriculture Land Quality. Standards Press of China: Beijing, China, 2012.
- Bi, W.; Dang, X.; Ma, H.; Deng, M.; Li, P.; Cao, X.; Shi, P. Evaluation of arable land suitability and potential from the perspective of “Food Crop Production Strategy based on Farmland Management” in northwest China. Trans. Chin. Soc. Agric. Eng. 2021, 37, 235–243. [Google Scholar]
- Chen, X.; Yang, J.; Tang, C.; Zheng, T.; Li, L. Effects of rainfall intensity and slope on surface and subsurface runoff in red soil slope farmland. Trans. Chin. Soc. Agric. Eng. 2017, 33, 141–146. [Google Scholar]
- Li, W.; He, G.; Zhao, Y.; Yao, Y.; He, F.; Li, H.; Wang, H. Potential for exploring cultivated land reserve resources under the influence of water supply project in Northern China. Trans. Chin. Soc. Agric. Eng. 2024, 40, 264–274. [Google Scholar]
- The Chinese Dietary Guidelines. Revision and Interpretation of the Chinese Food Pagoda (2022). 2022. Available online: http://dg.cnsoc.org/article/04/RMAbPdrjQ6CGWTwmo62hQg.html (accessed on 8 May 2026).
- General Office of the State Council. Notice of the General Office of the State Council on Issuing the “China Food and Nutrition Development Outline (2014–2020)”. 2014. Available online: https://www.gov.cn/zhengce/content/2014-02/10/content_8638.htm?trs=1 (accessed on 8 May 2026).
- China Agricultural Outlook. China Agricultural Outlook Report (2021–2030) Summary. 2021. Available online: https://www.agri-outlook.cn/index/index/article.html?id=1768 (accessed on 8 May 2026).
- He, G. Evaluation of Spatial Optimization of Land and Water Resources in Northern China and Its Ecological Effects; China Institute of Water Resources and Hydropower Research: Beijing, China, 2019. [Google Scholar]
- Wang, T.; Lu, C. Estimation of food grain demand per capita based on rational dietary pattern. Trans. Chin. Soc. Agric. Eng. 2012, 28, 273–277. [Google Scholar]
- Hu, W. Research on Chinese Residents’ Grain Consumption in the Context of New Policies. Master’s Thesis, Chinese Academy of Agricultural Sciences, Beijing, China, 2016. [Google Scholar]
- Li, X.; Li, G. Re-estimate feed grain consumption in China. J. China Agric. Univ. 2023, 28, 206–215. [Google Scholar]
- Meng, Z.; Li, G. An Empirical Analysis of the Fluctuations in Grain Demand Trends and Structural Changes in China. Stat. Decis. 2021, 37, 69–72. [Google Scholar]
- Hoekstra, A.Y.; Mekonnen, M.M. The water footprint of humanity. Proc. Natl. Acad. Sci. USA 2012, 109, 3232–3237. [Google Scholar] [CrossRef]
- Allen, R.G.; Pereira, L.S.; Raes, D.; Smith, M. Crop Evapotranspiration-Guidelines for Computing Crop Water Requirements-FAO Irrigation and Drainage Paper 56. 1998. Available online: https://www.fao.org/4/X0490E/x0490e00.htm#Contents (accessed on 8 May 2026).
- Hoekstra, A.Y.; Chapagain, A.K. Globalization of Water: Sharing the Planet’s Freshwater Resources; John Wiley & Sons: Hoboken, NJ, USA, 2011. [Google Scholar]
- Mekonnen, M.M.; Hoekstra, A.Y. A global assessment of the water footprint of farm animal products. Ecosystems 2012, 15, 401–415. [Google Scholar] [CrossRef]
- Shumway, R.H.; Stoffer, D.S.; Shumway, R.H.; Stoffer, D.S. ARIMA models. In Time Series Analysis Its Applications: With R Examples; Springer: Berlin/Heidelberg, Germany, 2017; pp. 75–163. [Google Scholar]
- Deb, K.; Pratap, A.; Agarwal, S.; Meyarivan, T. A fast and elitist multiobjective genetic algorithm: NSGA-II. IEEE Trans. Evol. Comput. 2002, 6, 182–197. [Google Scholar] [CrossRef]
- State Council of the People’s Republic of China. National Population Development Plan (2016–2030). 2017. Available online: https://www.gov.cn/zhengce/content/2017-01/25/content_5163309.htm (accessed on 8 May 2026).
- Chen, A.; He, H.; Wang, J.; Li, M.; Guan, Q.; Hao, J. A study on the arable land demand for food security in China. Sustainability 2019, 11, 4769. [Google Scholar] [CrossRef]
- Yang, S.; Li, D.; Liao, H.; Zhu, L.; Zhou, M.; Cai, Z. Analysis of the balance between supply and demand of arable land in China based on food security. Sustainability 2023, 15, 5706. [Google Scholar] [CrossRef]
- He, G.; Geng, C.; Zhai, J.; Zhao, Y.; Wang, Q.; Jiang, S.; Zhu, Y.; Wang, L. Impact of food consumption patterns change on agricultural water requirements: An urban-rural comparison in China. Agric. Water Manag. 2021, 243, 106504. [Google Scholar] [CrossRef]
- Ministry of Agriculture and Rural Affairs of the People’s Republic of China. 2019 National Cultivated Land Quality Grade Report. 6 May 2020. Available online: https://www.moa.gov.cn/nybgb/2020/202004/202005/t20200506_6343095.htm (accessed on 8 May 2026).
- Kang, S. Ten years of agricultural water-saving in China: Achievements, challenges and measures. China Water Resour. 2024, 10, 1–9. [Google Scholar]
- Van Wesenbeeck, C.; Keyzer, M.; Van Veen, W.; Qiu, H. Can China’s overuse of fertilizer be reduced without threatening food security and farm incomes? Agric. Syst. 2021, 190, 103093. [Google Scholar] [CrossRef]
- Li, G.; Zhao, Y.; Cui, S. Effects of urbanization on arable land requirements in China, based on food consumption patterns. Food Secur. 2013, 5, 439–449. [Google Scholar] [CrossRef]
- Yan, D.; Wu, S.; Tang, Y.; Zhu, J.; Zhou, S.; Xu, Z. Arable land and water footprints for food consumption in China: From the perspective of urban and rural dietary change. Sci. Total Environ. 2022, 838, 155749. [Google Scholar] [CrossRef]
- Zhen, L.; Cao, S.; Cheng, S.; Xie, G.; Wei, Y.; Liu, X.; Li, F. Arable land requirements based on food consumption patterns: Case study in rural Guyuan District, Western China. Ecol. Econ. 2010, 69, 1443–1453. [Google Scholar] [CrossRef]
- Mekonnen, M.; Hoekstra, A.Y. The Green, Blue and Grey Water Footprint of Farm Animals and Animal Products. Volume 2: Appendices; UNESCO-IHE Institute for Water Education: Delft, The Netherlands, 2010. [Google Scholar]
- Zhuo, L.; Mekonnen, M.; Hoekstra, A. Water Footprint and Virtual Water Trade of China: Past and Future; UNESCO-IHE Institute for Water Education: Delft, The Netherlands, 2016. [Google Scholar]
- D’odorico, P.; Carr, J.A.; Laio, F.; Ridolfi, L.; Vandoni, S. Feeding humanity through global food trade. Earth’s Future 2014, 2, 458–469. [Google Scholar] [CrossRef]
- Lobell, D.B.; Schlenker, W.; Costa-Roberts, J. Climate trends and global crop production since 1980. Science 2011, 333, 616–620. [Google Scholar] [CrossRef] [PubMed]
- Zhao, C.; Liu, B.; Piao, S.; Wang, X.; Lobell, D.B.; Huang, Y.; Huang, M.; Yao, Y.; Bassu, S.; Ciais, P. Temperature increase reduces global yields of major crops in four independent estimates. Proc. Natl. Acad. Sci. USA 2017, 114, 9326–9331. [Google Scholar] [CrossRef]
- Zhuo, L.; Mekonnen, M.; Hoekstra, A.Y. Sensitivity and uncertainty in crop water footprint accounting: A case study for the Yellow River basin. Hydrol. Earth Syst. Sci. 2014, 18, 2219–2234. [Google Scholar] [CrossRef]
Figure 2.
Per capita food consumption of rural and urban residents from 2000 to 2023.
Figure 2.
Per capita food consumption of rural and urban residents from 2000 to 2023.
Figure 3.
Proportion of food consumption between urban and rural residents from 2000 to 2023.
Figure 3.
Proportion of food consumption between urban and rural residents from 2000 to 2023.
Figure 4.
Deviation between urban and rural residents’ food consumption and the balanced model.
Figure 4.
Deviation between urban and rural residents’ food consumption and the balanced model.
Figure 5.
Changes in arable land area required for food consumption.
Figure 5.
Changes in arable land area required for food consumption.
Figure 6.
Green water footprint of food consumption in the nine Yellow River provinces from 2000 to 2023.
Figure 6.
Green water footprint of food consumption in the nine Yellow River provinces from 2000 to 2023.
Figure 7.
Blue water footprint of food consumption in the nine Yellow River provinces from 2000 to 2023.
Figure 7.
Blue water footprint of food consumption in the nine Yellow River provinces from 2000 to 2023.
Figure 8.
Development potential of unused land in the nine Yellow River provinces.
Figure 8.
Development potential of unused land in the nine Yellow River provinces.
Figure 9.
Arable land area required for food consumption under different dietary patterns in 2030. S1 denotes the baseline (current dietary) scenario, while S2–S4 denote alternative dietary scenarios.
Figure 9.
Arable land area required for food consumption under different dietary patterns in 2030. S1 denotes the baseline (current dietary) scenario, while S2–S4 denote alternative dietary scenarios.
Figure 10.
Comparison of optimized objective results.
Figure 10.
Comparison of optimized objective results.
Table 1.
Data and sources.
Table 1.
Data and sources.
| Data Types | Data | Times | Spatial Resolution | Sources |
|---|
| Food consumption data | Food consumption data of urban and rural residents | 2000–2023 | Provincial | China Statistical Yearbook, China Household Survey Yearbook, China Urban (Town) Life and Price Yearbook, China Dairy Yearbook, Statistical Yearbooks of the Nine Yellow River Provinces |
| Population | Urban and rural population | 1978–2023 | Provincial |
| Water resource panel data | Precipitation, Surface water resources, Groundwater resources, Total water resources, and Water supply and use | 2000–2023 | Provincial | China Statistical Yearbook, Statistical Yearbooks of the nine Yellow River provinces, and Water Resource Bulletins of each province |
| Soil resource panel data | Sown area and Cropland area | 2000–2023 | Provincial | China Statistical Yearbook, and Statistical Yearbooks of the nine Yellow River provinces |
| Unused land development potential data | China’s Multi-Period Land Use Land Cover Remote Sensing Monitoring Dataset | 2020 | 30 m | Resource and Environmental Science Data Platform [26] |
| Digital Elevation Model | - | 30 m | Copernicus Digital Elevation Model [27] |
| Soil pH, Soil organic matter content, and Effective soil depth | 2023 | 1 km | Harmonized World Soil Database [28] |
| Annual mean precipitation, and Growing degree days ≥ 10 °C | - | 500 m | China Meteorological Background Dataset [29] |
| Sunshine duration | - | 1 km | China Spatially Interpolated Dataset of Average Meteorological Elements [30] |
| Meteorological station data | Monthly precipitation, Monthly mean minimum and maximum temperature, Monthly mean relative humidity, Monthly mean wind speed, and Monthly sunshine duration | 2000–2023 | - | National Meteorological Information Centre |
Table 2.
Evaluation index system for the development potential of unused land.
Table 2.
Evaluation index system for the development potential of unused land.
| Goal Layer | Factor Layer
(Weight) | Indicator Layer | Weight | Level 1 | Level 2 | Level 3 | Level 4 |
|---|
| Evaluation of the Development Potential of Unused Land | site conditions (0.35) | DEM/m | 0.35 | ≤1200 | 1200~2000 | 2000~3000 | ≥3000 |
| Slope/° | 0.25 | ≤2 | 2~6 | 6~10 | 10~15 |
| Surface relief/m | 0.40 | ≤30 | 30~70 | 70~200 | 200~500 |
| hydrothermal conditions (0.3) | Precipitation/mm | 0.50 | ≥600 | 500~600 | 400~500 | 350~400 |
| Growing degree days ≥ 10 °C/°C | 0.30 | ≥4500 | 3500~4500 | 2500~3500 | 1800~2500 |
| Sunshine duration/h | 0.20 | ≥3000 | 2000~3000 | 1000~2000 | 500~1000 |
| soil conditions (0.35) | Soil depth/mm | 0.33 | ≥150 | 100~150 | 60~100 | 30~60 |
| Soil texture | 0.43 | Loam | Clay | Sandy | - |
| Soil pH | 0.10 | 6.0~7.9 | 7.9~8.5; 6.0~5.5 | 8.5~9.0; 4.5~5.5 | <4.5 |
| Soil organic matter/% | 0.14 | ≥4 | 3~4 | 2~3 | <2 |
Table 3.
Per capita food consumption under different dietary patterns (kg/person·year).
Table 3.
Per capita food consumption under different dietary patterns (kg/person·year).
| | S1 | S2 | S3 | S4 |
|---|
| Grain | 153.31 | 118.63 | 148.00 | 148.96 |
| Vegetable | 81.88 | 109.50 | 140.00 | 130.10 |
| Vegetable oil | 6.61 | 11.86 | 12.00 | 17.05 |
| Livestock and poultry | 32.48 | 20.98 | 29.00 | 59.77 |
| Aquatic products | 7.13 | 20.98 | 18.00 | 21.80 |
| Eggs | 13.96 | 18.25 | 16.00 | 18.80 |
| Milk | 11.94 | 109.50 | 36.00 | 21.40 |
| Melons and fruits | 52.42 | 99.88 | 60.00 | 67.50 |
Table 4.
Feed conversion ratio for animal-based food [
41,
42,
43].
Table 4.
Feed conversion ratio for animal-based food [
41,
42,
43].
| | Pork | Beef | Mutton | Poultry | Eggs | Milk | Aquatic Products |
|---|
| Feed conversion ratio | 3.3 | 2.6 | 2.6 | 2.5 | 1.7 | 0.4 | 2.0 |
Table 5.
Feed conversion ratio for animal-based food [
46,
47].
Table 5.
Feed conversion ratio for animal-based food [
46,
47].
| | Pork | Beef | Mutton | Poultry | Eggs | Milk | Aquatic Products |
|---|
| Blue water | 0.405 | 0.495 | 0.452 | 0.281 | 0.217 | 0.145 | 2.284 |
Table 6.
Population status and forecast results in the nine the Yellow River provinces (million people).
Table 6.
Population status and forecast results in the nine the Yellow River provinces (million people).
| | 2023 | 2030 |
|---|
| Total Population | Urban Population | Rural Population | Total Population | Urban Population | Rural Population |
|---|
| Total | 419.08 | 260.39 | 158.69 | 419.54 | 266.73 | 152.82 |
| Shanxi | 34.66 | 22.52 | 12.14 | 31.44 | 22.36 | 9.09 |
| Inner Mongolia | 23.96 | 16.67 | 7.29 | 23.47 | 17.08 | 6.39 |
| Shandong | 101.23 | 66.34 | 34.89 | 105.84 | 73.10 | 32.74 |
| Henan | 98.15 | 57.01 | 41.14 | 97.27 | 64.39 | 32.88 |
| Sichuan | 83.68 | 49.78 | 33.90 | 85.60 | 40.70 | 44.90 |
| Shannxi | 39.52 | 25.75 | 13.77 | 39.45 | 26.16 | 13.29 |
| Gansu | 24.65 | 13.68 | 10.97 | 23.15 | 14.04 | 9.10 |
| Qinghai | 5.94 | 3.73 | 2.21 | 5.93 | 3.87 | 2.06 |
| Ningxia | 7.29 | 4.91 | 2.38 | 7.39 | 5.02 | 2.37 |
Table 7.
Green water footprint gap in production under different dietary patterns in 2030 (billion m3).
Table 7.
Green water footprint gap in production under different dietary patterns in 2030 (billion m3).
| | Grain | Vegetable Oil | Vegetable | Melons and Fruits | Feed |
|---|
| Wheat | Rice | Corn | Soybean |
|---|
| S1 | 7.35 | 8.17 | 0.33 | 0.33 | 1.21 | 1.20 | 24.16 | 12.83 |
| S2 | −10.07 | 5.14 | −1.05 | 1.11 | 0.41 | 0.35 | 15.68 | 4.48 |
| S3 | −2.60 | 5.53 | −0.14 | −1.30 | 0.30 | 0.26 | 14.76 | 3.44 |
| S4 | −1.39 | 19.64 | −0.34 | −0.85 | 2.19 | 2.02 | 31.68 | 22.35 |
Table 8.
Blue water footprint gap in production under different dietary patterns in 2030 (billion m3).
Table 8.
Blue water footprint gap in production under different dietary patterns in 2030 (billion m3).
| | Grain | Vegetable Oil | Vegetable | Melons and Fruits | Feed | Livestock and Poultry | Aquatic Products | Eggs | Milk |
|---|
| Wheat | Rice | Corn | Soybean |
|---|
| S1 | 7.19 | 15.38 | 0.84 | 1.19 | 1.97 | 1.63 | 8.18 | 7.66 | 2.52 | 0.20 | 3.76 | 0.20 |
| S2 | −11.13 | 15.48 | 0.03 | 1.25 | 0.57 | 0.70 | 3.72 | 4.54 | −5.08 | 0.91 | −2.84 | 5.54 |
| S3 | −4.00 | 15.79 | 0.58 | −0.92 | 0.41 | 0.56 | 2.97 | 3.84 | −3.56 | 0.64 | −5.00 | 1.06 |
| S4 | −2.23 | 26.91 | 0.51 | −0.51 | 3.41 | 3.15 | 16.64 | 16.60 | 2.25 | 0.98 | −2.32 | 0.18 |
Table 9.
Planting area of each crop after optimization (million hm2).
Table 9.
Planting area of each crop after optimization (million hm2).
| | 2023 | Optimized S1 | Optimized S2 | Optimized S3 | Optimized S4 |
|---|
| Wheat | 13.08 | 12.22 | 11.04 | 12.11 | 11.00 |
| Rice | 2.77 | 2.37 | 2.32 | 2.37 | 2.31 |
| Corn | 18.46 | 20.08 | 20.37 | 19.86 | 20.06 |
| Soybean | 2.79 | 9.93 | 8.45 | 8.09 | 10.17 |
| Other grains | 5.36 | 4.97 | 4.92 | 5.24 | 4.45 |
| Vegetable oil | 5.62 | 9.67 | 10.91 | 10.82 | 11.80 |
| Vegetable | 6.63 | 4.09 | 4.61 | 4.71 | 3.91 |
| Melons and fruits | 4.76 | 2.97 | 3.67 | 3.07 | 2.63 |
Table 10.
Comparison of cropland requirements for food across different studies (m2∙kg−1∙year−1).
Table 10.
Comparison of cropland requirements for food across different studies (m2∙kg−1∙year−1).
| | Zhen et al. (2010) [59] | Li et al. (2013) [57] | Yan et al. (2022) [58] | This Study |
|---|
| Case year | 2004 | 2002 | 2002 | 2002 |
| Rice | 4.6 | 1.6 | 1.3 | 1.3 |
| Wheat | 1.6 | 2.6 | 2.2 | 2.8 |
| Maize | 2.1 | 2 | 1.7 | 1.8 |
| Soybean | 9.5 | 5.3 | 4.4 | 5.9 |
| Vegetable | 0.4 | 0.5 | 0.3 | 0.3 |
| Melons and fruits | 4 | 1.3 | 1.1 | 1.0 |
| Vegetable oil | 31.6 | 13.6 | 6.6 | 6.1 |
| Animal production | 7.3 | 4.0 | 3.7 | 3.0 |
Table 11.
Comparison of water footprint for food across different studies (m3∙kg−1∙year−1).
Table 11.
Comparison of water footprint for food across different studies (m3∙kg−1∙year−1).
| | Mekonnen and Hoekstra (2010) [60] | Zhuo et al. (2016) [61] | Yan et al. (2022) [58] | This Study |
|---|
| Case year | 1996–2005 | 2008 | 2000 | 2000 | 2008 |
| Vegetable | 0.22 | 0.10 | 0.13 | 0.11 | 0.09 |
| Melons and fruits | 0.8 | 0.39 | 0.84 | 0.36 | 0.22 |
| Vegetable oil | - | - | 2.41 | 9.44 | 7.91 |
| Grain | 1.114 | 1.13 | 1.10 | 0.95 | 0.89 |
| Animal production | 5.77 | - | 4.77 | 2.84 | 2.41 |
| Disclaimer/Publisher’s Note: The statements, opinions and data contained in all publications are solely those of the individual author(s) and contributor(s) and not of MDPI and/or the editor(s). MDPI and/or the editor(s) disclaim responsibility for any injury to people or property resulting from any ideas, methods, instructions or products referred to in the content. |