Article

Spatiotemporal Distribution of Chlorophyll-a and Dissolved Organic Matter in Ganjiang River Estuary of Lake Poyang

1
State Key Laboratory of Environmental Criteria and Risk Assessment, Chinese Research Academy of Environmental Sciences, Beijing 100012, China
2
Institute for Atmospheric and Earth System Research, University of Helsinki, 00014 Helsinki, Finland
*
Author to whom correspondence should be addressed.
Water 2026, 18(10), 1160; https://doi.org/10.3390/w18101160
Submission received: 14 April 2026 / Revised: 4 May 2026 / Accepted: 9 May 2026 / Published: 12 May 2026

Abstract

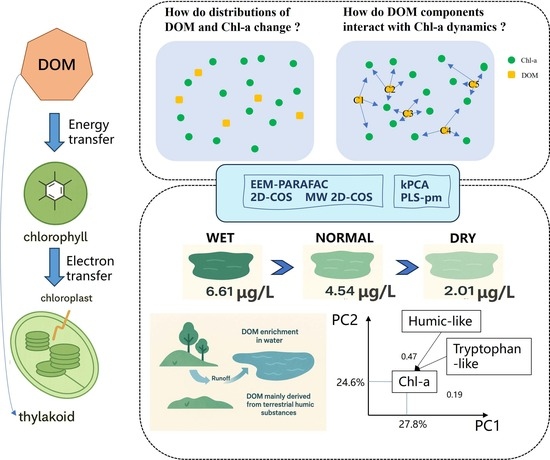
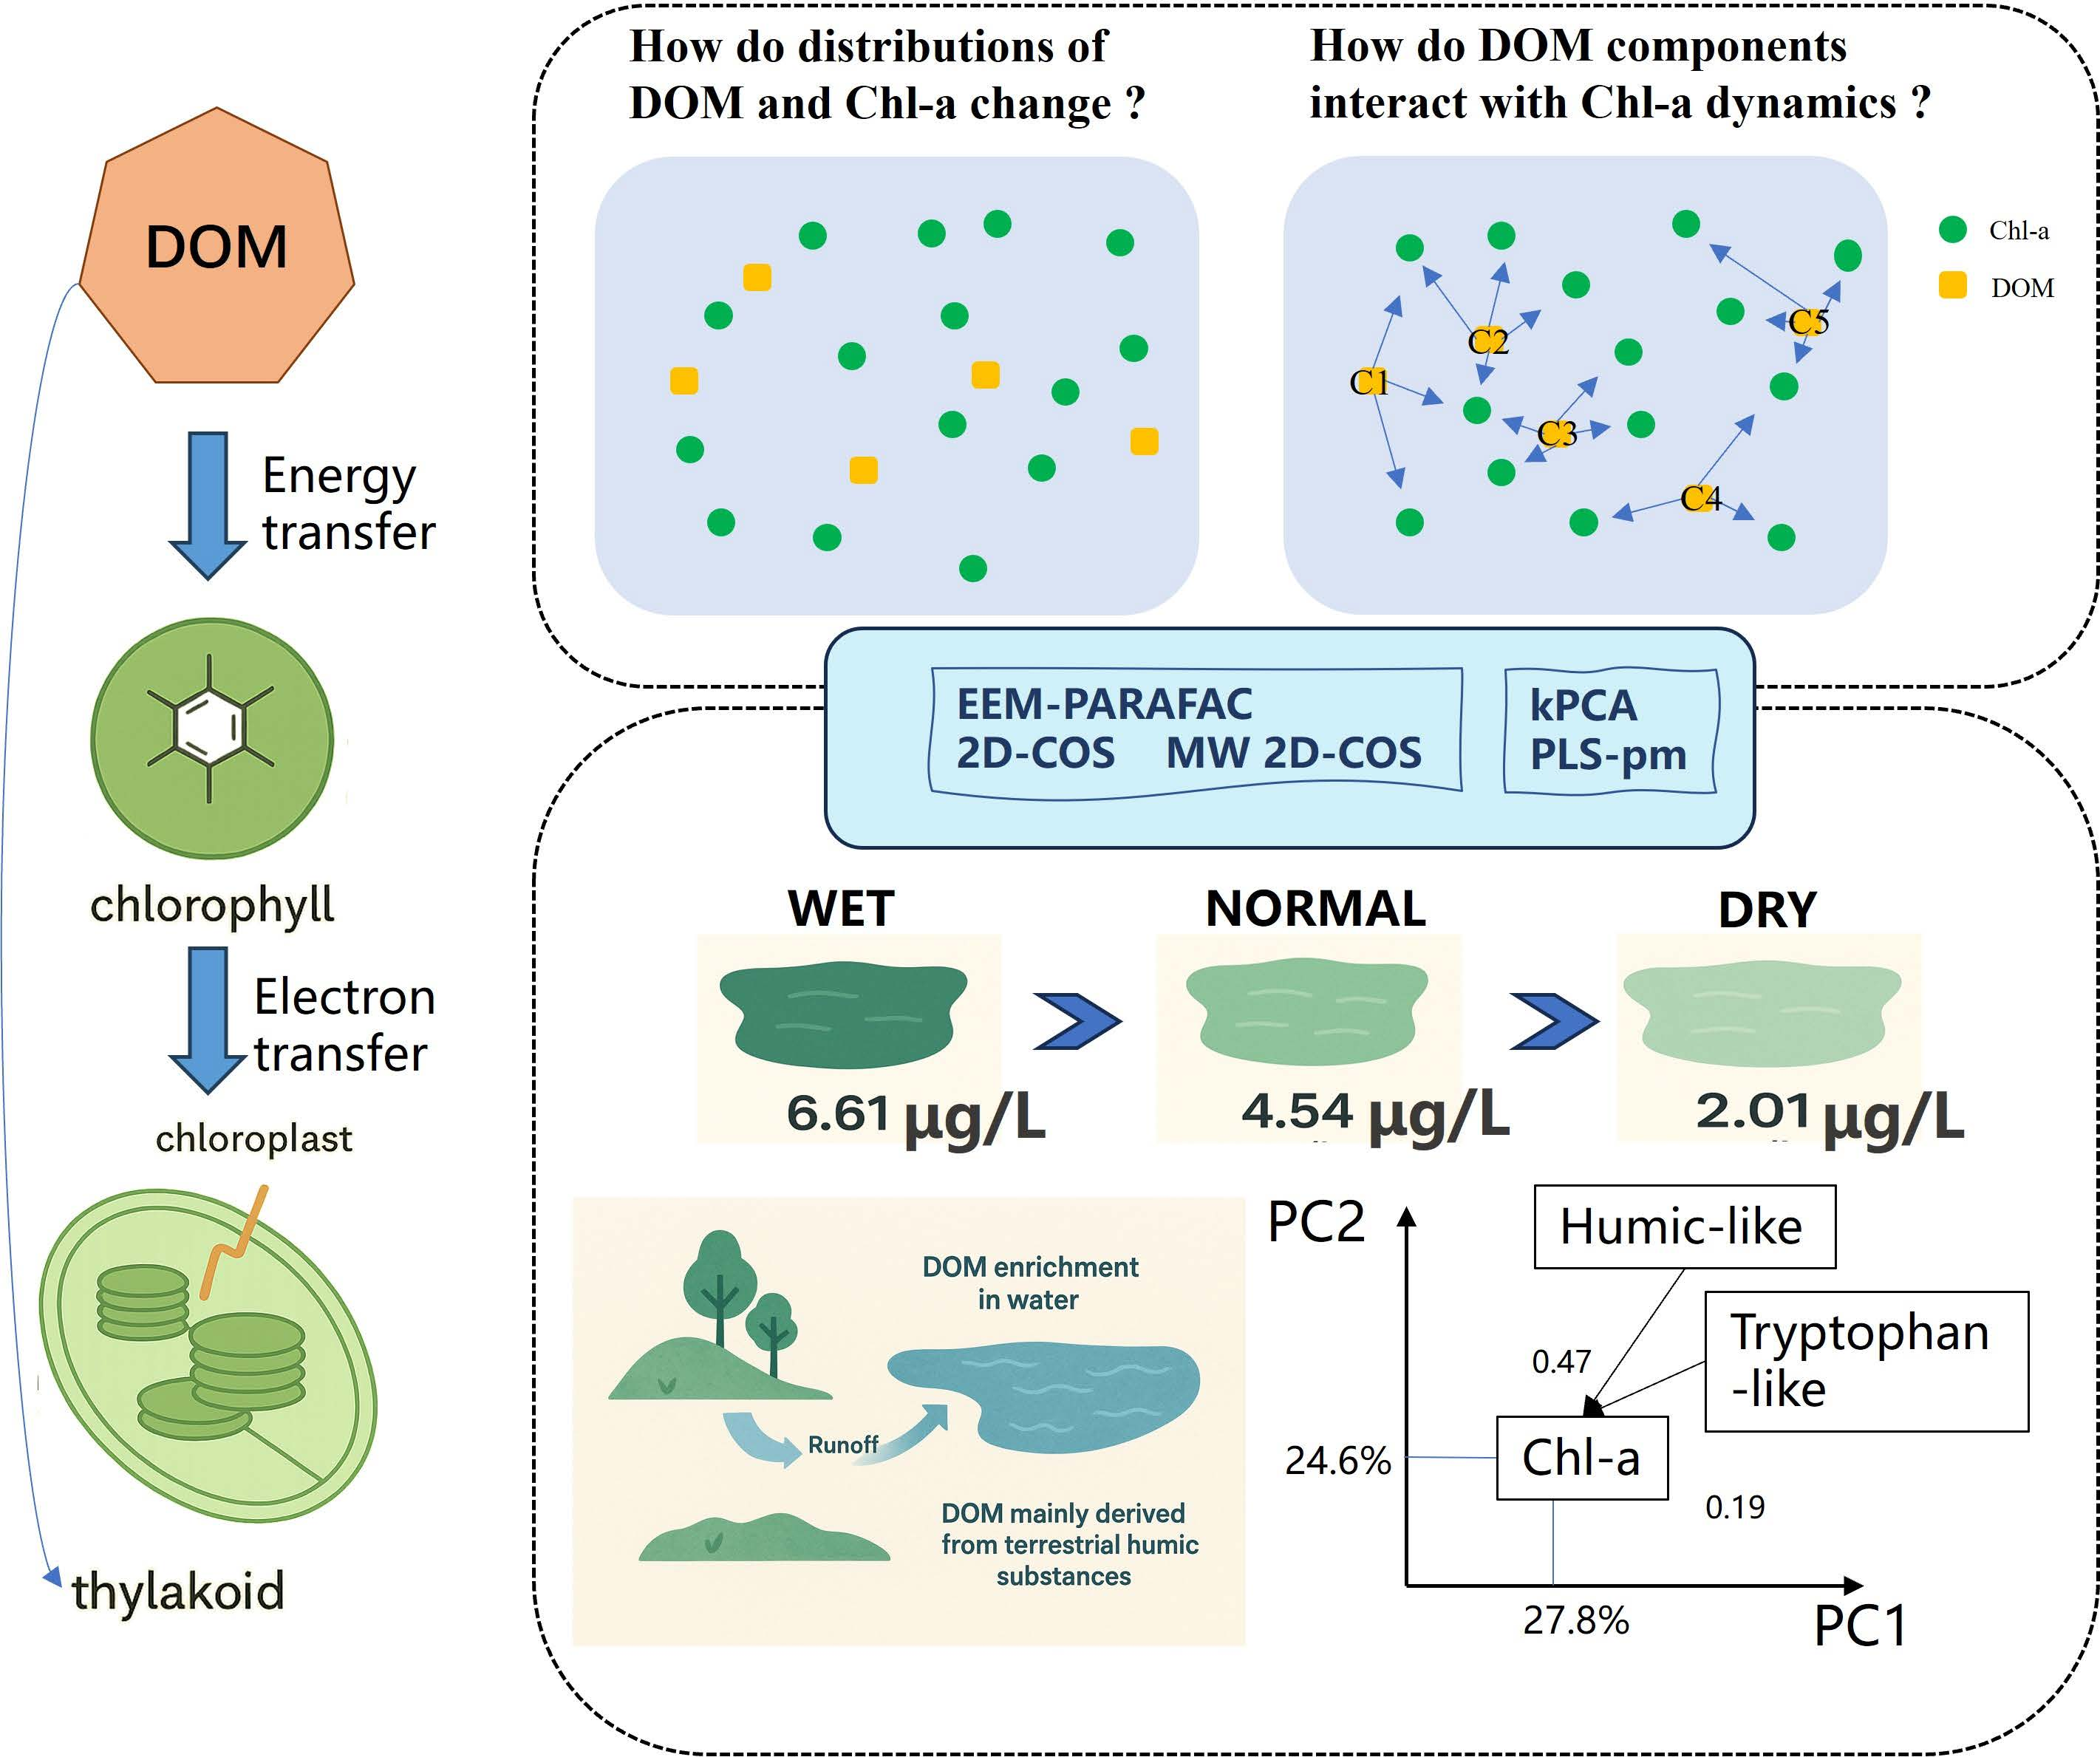
Dissolved organic matter (DOM) plays a central role in estuarine carbon cycling and exhibits dynamically coupled interactions with chlorophyll-a (Chl-a). Under increasing nutrient loads, elevated Chl-a concentrations and shifts in DOM composition serve as key indicators of eutrophication in estuarine aquatic ecosystems. Previous studies have mainly focused on the composition and fluorescence properties of DOM in rivers and lakes. Here, 84 water samples were collected from the Ganjiang River Estuary of Lake Poyang during wet, normal, and dry seasons across the mainstream, middle, and south branches. The average Chl-a concentration showed wet season (6.61 μg·L−1) > normal season (4.54 μg·L−1) > dry season (2.01 μg·L−1). By employing EEM-PARAFAC, five fluorescent components were identified, including C1, C2, C3, C4, and C5. Notably, microbial humic-like substances remained consistently high during the wet season. Two-dimensional correlation spectroscopy was further employed to evaluate sequential changes in DOM components, while a moving window was used to identify temporal variation characteristics. Based on Noda’s rules, the DOM response sequence was identified as C3→C2→C1→C4→C5. Kernel PCA showed that the variable cluster represented by PC1, which consisted of organic pollutants and nutrients, co-varied negatively with Chl-a, whereas the PC2 cluster, representing biogenic organic matter, co-varied positively with Chl-a. Moreover, partial least squares path modeling showed that humic-like and tryptophan-like substances were positively correlated with Chl-a, with the path coefficients of 0.47 and 0.19, respectively. These findings revealed the interaction patterns between DOM components and Chl-a at the river-lake confluence zone, thereby enhancing our understanding of the factors influencing the spatio-temporal variations in Chl-a concentration, and further providing a guide for the control of algal blooms.

Graphical Abstract

1. Introduction

Dissolved organic matter (DOM) is a dynamic and crucial component of natural organic matter in aquatic ecosystems, functioning as a significant carbon reservoir, influencing ecological processes, driving carbon “source-sink” dynamics, and directly affecting Chl-a concentrations and eutrophication via multiple mechanisms [1,2,3]. DOM serves as a fundamental link between the terrestrial, freshwater, and marine carbon cycles and plays a key role in the global carbon cycle [4]. Aquatic DOM includes autochthonous and allochthonous sources. The former mainly originates from phytoplankton, macrophytes or microbes due to either extracellular metabolic excretion or intracellular autolysis of cells upon death [5]. The latter might be primarily impacted by anthropogenic activities, especially land use within the river drainage basin, which can be attributed to the obvious discrepancy in chemical composition and structural properties [6]. Inland lakes, rivers, and reservoirs, by receiving, storing, and processing significant amounts of DOM, have become pivotal natural laboratories for advancing our understanding of their responses to environmental changes [7,8].
Numerous previous studies have underscored the role of nutrients and temperature in modulating DOM chemical compositions. In eutrophic lakes, elevated nutrient levels tend to promote phytoplankton biomass, consequently increasing the contribution of autochthonous DOM to aquatic systems. In fact, nitrogen, phosphorus, and DOM together promote increases in Chl-a concentration and the progression of eutrophication in the lake. However, understanding the interaction between DOM and Chl-a remains a major scientific challenge. Xu et al. used spectral technology to analyze the temporal, spatial, and seasonal characteristics and influencing factors of soluble organic carbon and chromogenic soluble organic matter in Poyang Lake, revealing that water level, precipitation, and vegetation cover patterns significantly affect the spatial heterogeneity of DOC and CDOM [9]. Liu et al. indicated that nutrient salt concentrations in the Ganjiang River show notable seasonal variation, with higher levels during the dry season compared to the wet season [4]. Zhang and Li found that nutrients and phytoplankton significantly impact DOM abundance, especially in highly eutrophic lakes [10]. Xi et al. observed significant correlations between DOM fluorescence properties and various riverine environmental indicators [11]. Some DOM components (e.g., humus) can absorb light energy, affecting the water’s light environment and thus the photosynthetic efficiency of algae [12]. In reservoirs like Qiandao Lake, increases in Chl-a concentration are negatively correlated with specific DOM components, such as terrestrial humic-like C2. This negative relationship may result from the depletion of dissolved oxygen caused by terrestrial DOM influx [13]. Ma et al. used principal component analysis (PCA) to show that in the Three Gorges Reservoir area, DOM sources were mainly driven by biogenic and biological activities during the dry season, while terrestrial inputs played a major role in the wet season [14]. Partial Least Squares Structural Equation Modeling (PLS-SEM) was employed to quantify the direct and indirect effects of nutrients and other environmental factors, effectively separating and measuring the complex, simultaneous interactions among these latent variables [15]. Accurately understanding the relationship between Chl-a concentrations and different components of DOM is crucial within aquatic ecosystems.
Poyang Lake is the largest freshwater lake in China. It has been increasingly affected by eutrophication despite its ecological importance [16]. The Ganjiang River is the largest tributary of the Lake Poyang water system and a major branch of the Yangtze River. Flowing through multiple significant cities from south to north, it simultaneously provides crucial safeguards for intercity water transportation, farmland irrigation, and urban residential water supply [17]. However, relevant surveys have shown that the water body of the Ganjiang River Estuary has exhibited a trend of increasing eutrophication [18]. Thus, it is essential to investigate the temporal and spatial distribution of DOM in the Ganjiang River Estuary.
This study aims to reveal the spatial-temporal distribution of Chl-a concentration and provide a comprehensive understanding of the relationship between Chl-a concentration and different components of DOM in the tailrace of the Ganjiang River. Accordingly, we used the three-dimensional excitation-emission matrix (3D-EEM) fluorescence spectroscopy, kernel principal component analysis (kPCA), and the partial least squares path model (PLS-pm) to achieve the following goals: (1) Characterize the spatiotemporal dynamics of Chl-a and DOM within the Ganjiang River estuary system; (2) Quantify the relative contributions of different DOM fractions and key environmental factors to variations in Chl-a concentration. These results could facilitate the understanding of the impacts of DOM components on Chl-a concentration, predicting the risk of lake algal bloom outbreaks, and further provide a basis for the management and control of pollution sources of the Ganjiang River.

2. Materials and Methods

2.1. Study Area and Sample Collection

The Ganjiang River is located in the central-southern part of Jiangxi Province, China (113°30′~116°40′ E, 24°29′~29°11′ N) (Figure 1). The river basin covers an area of 83,500 km2, the main tributary extends 820 km and passes through Ganzhou, Ji’an, Yichun, and Nanchang sequentially before splitting into three branches that flow into the Poyang Lake [19]. The Ganjiang River Estuary is the most extensive and active area for “river-lake” interaction between Poyang Lake’s wetland and the Ganjiang River, which creates a unique freshwater littoral zone ecosystem rich in biodiversity. Consequently, for our study, we selected 28 sampling sites along the mainstream, middle branch, and south branch of the Ganjiang River in the Ganjiang River Estuary. Sampling points G1–G12, GZ1–GZ7, and GN1–GN9 were located along the mainstream, middle branch, and south branch, respectively. G12, GZ7, and GN9 mark where each stream flows into Poyang Lake. Field investigations and sample collection were conducted in August (wet season, with an average water temperature of 33.5 ± 1.2 °C), October (normal season, 21.4 ± 0.8 °C), and December (dry season, 11.5 ± 0.7 °C) in 2024. At each sampling site, triplicate water samples were collected, and all measurements were taken between 08:00 and 14:00 local time to minimize diurnal variability.
At each sampling site, dissolved oxygen (DO), water temperature (WT), pH, oxidation-reduction potential (ORP), electrical conductivity (EC), and total dissolved solids (TDS) were directly measured using a multi-parameter water quality analyzer EXO1 (YSI, Yellow Springs, OH, USA) [20]. The EXO1 was calibrated daily before sampling, following the manufacturer’s guidelines. Sensor accuracies (stated by the manufacturer) for key parameters were: DO, ±0.1 mg⋅L−1 (0–8 mg⋅L−1); pH, ±0.1 unit; EC, ±0.5% of reading or ±1 μS⋅cm−1; ORP, ±20 mV; water temperature, ±0.01 °C. The EXO1 multiparameter sonde was calibrated daily before each sampling campaign. DO was calibrated using water-saturated air; pH was calibrated with standard buffer solutions (pH 4.0, 7.0, and 10.0); EC was calibrated with a KCl standard solution (1413 μS⋅cm−1 at 25 °C); and ORP was verified using ZoBell’s solution. Post-deployment checks were performed at the end of each sampling day to ensure sensor drift did not exceed 5%. Transparency was measured by the same operator on the shaded side of the boat with a 30 cm Secchi disk; three independent readings were taken and averaged. Using a 1 L sampler [21], water was collected at a depth of 5 cm and subsequently divided into two 500 mL PET bottles. The samples were refrigerated at 4 °C until.

2.2. Physicochemical Analysis

A set of water samples (500 mL) intended for Chl-a analysis was passed through 0.45 μm glass fiber filters. Dissolved organic carbon (DOC) in the resulting filtrate was determined with a Shimadzu TOC-VCSH total organic carbon analyzer, while the filter-retained material was subjected to 90% acetone extraction for Chl-a quantification. The other set of 500 mL water samples was used to determine the total nitrogen (TN), nitrate nitrogen (NO3-N), nitrite nitrogen (NO2-N) ammonium nitrogen (NH4+-N), total phosphorus (TP), soluble reactive phosphorus (SRP), dissolved total nitrogen (TDN), dissolved total phosphorus (TDP) and Chemical Oxygen Demand (COD) concentrations according to the Methods for the Examination of Water and Wastewater (Chinese EPA 2002). Quality assurance/quality control (QA/QC) procedures were applied to all laboratory analyses. For Chl-a, a calibration curve was constructed with commercial standards, and extraction blanks were analysed in parallel. The method detection limit (MDL) for Chl-a was 0.02 μg⋅L−1, and the relative standard deviation (RSD) of replicate samples was <10%. The TOC-VCSH analyser was calibrated with potassium hydrogen phthalate and checked every 15 samples against a known standard; the MDL for DOC was 0.05 mg C·L−1 and precision was ≤5%. For TN, TP, NO3-N, NO2-N, NH4+-N, TDN, TDP, SRP, and COD, method-specific MDLs, recoveries, and RSDs are summarised in Table S1. For laboratory analyses, the TOC-VCSH analyzer was calibrated with potassium hydrogen phthalate (KHP) standard solutions before each analytical run, and calibration was verified every 15 samples using an independent check standard. Spectrophotometric methods (Chl-a, TN, TP, NO3-N, NO2-N, NH4+-N, SR, COD) employed external standard calibration curves with at least five concentration levels; the correlation coefficient (R2) for all calibration curves exceeded 0.999. Method blanks and certified reference materials were included in each analytical batch.

2.3. Fluorescence and Ultraviolet Spectroscopic Analysis

The 3D-EEM spectra of filtered water samples were analyzed using a fluorescence spectrometer (F-7000, Hitacha, Japan). The excitation wavelength (Ex) and emission wavelength (Em) range were set to 200–450 nm and 260–550 nm, respectively, with increments of 5 nm for both. The scanning speed was set as 12000 nm⋅min−1. PMT voltage was 700 V, with a 290 nm cutoff filter at the outgoing light to avoid secondary Rayleigh scattering interference, and subtraction of the deionized water fluorescence spectrum was performed for each sample to eliminate Raman scattering peaks [22]. Absorption spectra were acquired over 200–800 nm at 1 nm increments with a 1 cm quartz cuvette in a UV-1780 spectrophotometer (Shimadzu, Tokyo, Japan), and the absorbance values were then corrected by baseline zeroing across the full wavelength range.
The aromaticity of natural organic matter can be indirectly represented by the specific UV absorbance at 254 nm (SUVA254, L·mg·C−1·m−1), which is widely regarded as an important parameter for characterizing such organic matter [23]. It is calculated as:
S U V A 254   = A 254 c ( D O C )
where SUVA254 represents the absorbance at 254 nm (m−1), and c(DOC) represents the concentration of DOC (mg·C·L−1). A negative correlation existed between DOM molecular weight and the spectral slope ratio (SR), the latter being calculated via Equation (2),
S R = S 275 295 S 350 400
where S275–295 and S350–400 refer to the slopes within the ranges of 275–295 nm and 350–400 nm, respectively.
The fluorescence index (FI) was calculated referring to Equation (3) [24]:
F I = F ( 370,470 ) F ( 370,520 )
where F(370, 470) is the fluorescence intensity at the Ex of 370 nm and the Em of 470 nm, and F(370, 520) is the fluorescence intensity at the Ex of 370 nm and the Em of 520 nm. The humification index (HIX) served as a proxy for the humification extent of DOM. The calculation formula was described as:
H I X = 435 480 F ( 254 , λ E m ) 300 345 F ( 254 , λ E m )
where 435 480 F ( 254 , λ E m ) and 300 345 F ( 254 , λ E m ) denote the sums of fluorescence intensities over the emission ranges 435–480 nm and 300–345 nm, respectively, both recorded at an excitation wavelength of 254 nm.
Filtered water samples were analyzed via 3D-EEM spectroscopy, and the obtained spectral data were subjected to PARAFAC. All PARAFAC modeling procedures were implemented in MATLAB R2024b (MathWorks, Inc., Natick, MA, USA) with the aid of the DOMFlour toolbox [25]. The most appropriate number of fluorescent components was determined through an integrated validation procedure following established protocols [25,26]. Specifically, split-half validation was performed by randomly dividing the dataset into two independent halves and comparing the excitation and emission loadings; a component was accepted only if it appeared consistently in both halves. Core consistency diagnostics were used to evaluate the appropriateness of the model dimensionality and to avoid overfitting. Random initialization analysis was conducted to ensure that the model converged to the global minimum rather than a local optimum. Residual analysis was performed to confirm that the residuals were randomly distributed and contained no remaining fluorescent structures. The five-component model was selected based on these complementary criteria, and the components were identified by comparison with the OpenFluor spectral database, selecting matches with a similarity score exceeding 0.97. The fluorescence index (FI) serves as a source indicator: FI > 1.9 indicates predominantly autochthonous (microbial/algal) DOM, whereas FI < 1.4 suggests mainly allochthonous (terrestrial) DOM, with intermediate values representing mixed sources. The humification index (HIX) reflects the degree of humification; HIX < 4 corresponds to weakly humified, predominantly autochthonous DOM, while HIX > 10–16 indicates strongly humified, terrestrially derived material. The biological index (BIX) indicates the freshness of autochthonous DOM: BIX > 1.0 is associated with freshly produced DOM of biological origin, whereas BIX < 0.8 represents aged or decomposed DOM with lower biological activity [24].
Two-dimensional correlation spectroscopy (2D-COS) is a technique that enables the tracking of subtle responses in complex mixtures to perturbing factors. Currently, 2D-COS combined with fluorescence spectroscopy has been used to study the spatial distribution of DOM, the complexation reaction between DOM and heavy metals, and the evaluation of the efficacy of wastewater treatment. Conventional 2D-COS is usually based on maximum fluorescence intensity (F_(max)), which is derived from PARAFAC. However, PARAFAC is unable to recognize small changes between components. In contrast, the excitation load derived from PARAFAC using Chl-a concentration as a perturbation factor can differentiate changes between components. This illustrates the pattern of change for the different components [26].

2.4. Data Processing and Analysis

Statistical analysis and data processing in this research were mainly performed with Excel 2021, SPSS 27.0 and PyCharm 3.9. R software was adopted to draw heatmaps and Spearman correlation plots. ArcGIS 10.8 was applied for map visualization, and Origin 2024 was used to produce other types of data graphics.

3. Results and Discussion

3.1. Distribution of Chl-a and DOM

3.1.1. Chl-a and Other Physicochemical Characteristics

Figure S1 illustrates the temporal and spatial distribution characteristics of nutrient parameters in the Ganjiang River Estuary. The Chl-a values showed distinct spatiotemporal variability, wet season (6.61 μg/L) > normal season (4.54 μg/L) > dry season (2.01 μg/L), under different spatiotemporal conditions (Figure S1a). The spatially averaged Chl-a was higher in the middle branch of the Ganjiang River (5.36 μg/L) than in the southern branch (4.48 μg/L), and both values were higher than in the main stream (3.71 μg/L). During the wet season, water temperature ranged from 31.45 to 35.63 °C which can accelerate phytoplankton photosynthesis [27]. Additionally, we found that the trend of TN was similar to that of Chl-a (Figure S1b), which is an important factor influencing Chl-a [28].
Meanwhile, pH, NO3-N, NO2-N, NH4+-N, and TP exhibited comparatively modest temporal and spatial variations relative to the strong seasonal patterns observed for Chl-a and TN, though site-specific fluctuations were still discernible (Figure S1). The SRP concentration showed a conspicuous increase during the normal season, potentially due to reduced particle adsorption under gentle flow [29], and the avoidance of wet season dilution and dry season concentration effects [30]. The higher DOC concentrations appeared in the normal season. Notably, the higher DOC and lower dissolved inorganic carbon (DIC) at the GN9 site suggested that active photosynthesis led to DIC conversion into DOC [31]. Site GZ5 exhibited pronounced deviations across multiple parameters, most notably a significant decline in Chl-a concentration. Situated in proximity to active construction activities, this site was characterized by elevated TN and TP levels but relatively low Chl-a. This pattern suggests that, despite nutrient enrichment, algal growth may have been suppressed by factors associated with construction runoff, such as increased turbidity leading to light limitation or the presence of inhibitory substances. The coexistence of high nutrient concentrations and low Chl-a is consistent with mechanisms of light attenuation by suspended solids [32] and/or toxicity induced by construction-derived contaminants [33].

3.1.2. The Characteristics of the Fluorescence Parameter of DOM

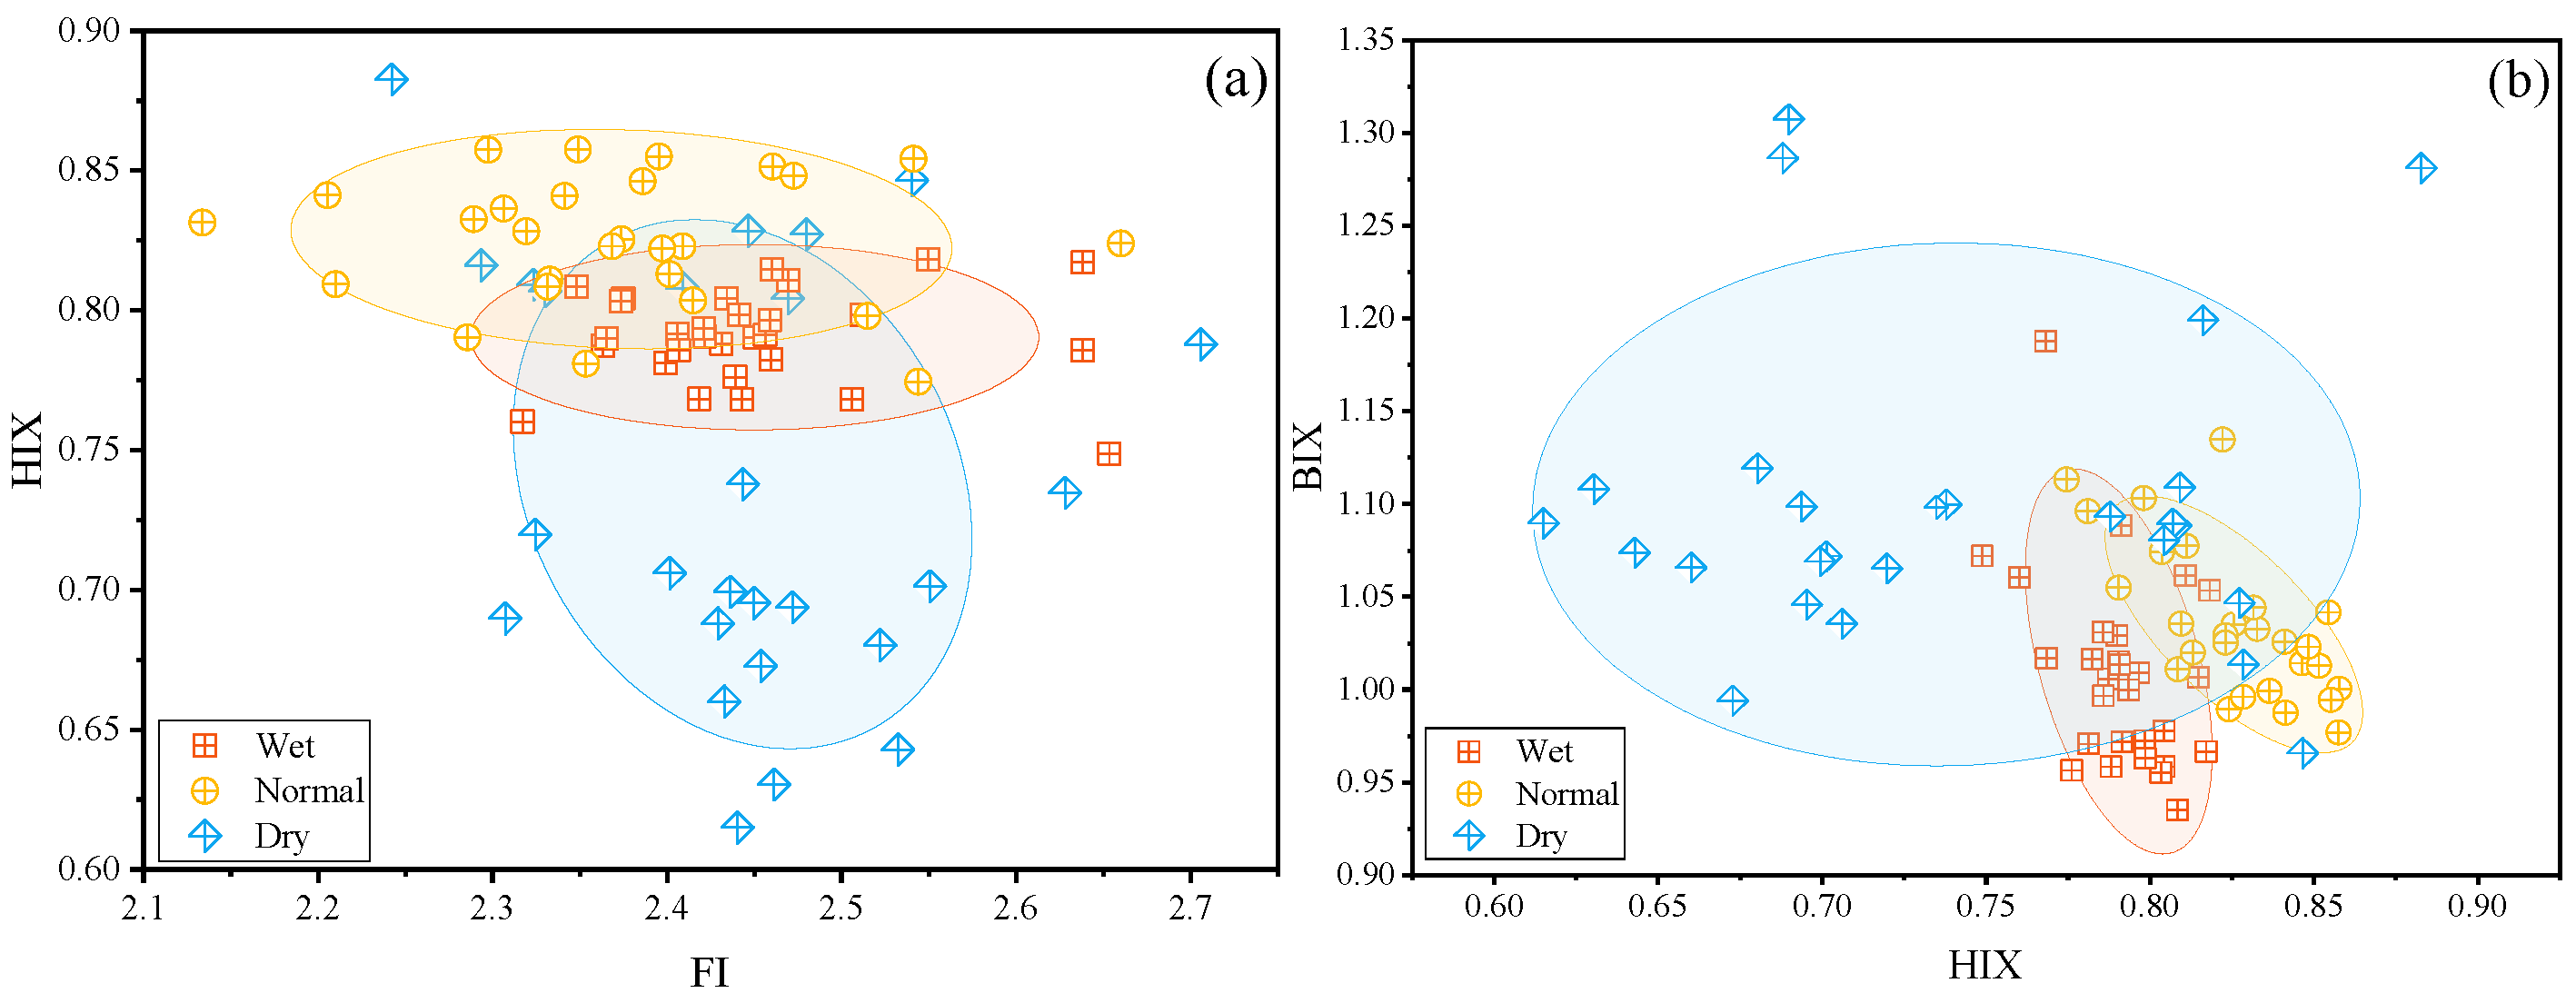
The distributions of the Humification Index (HIX), Fluorescence Index (FI), and Biological Index (BIX) are shown in Figure 2. FI values above 1.9 indicate that DOM mainly comes from endogenous production by microorganisms and algae. Conversely, FI values between 1.4 and 1.9 indicate a mixed source of DOM (Figure 2a), including both allochthonous and autochthonous inputs [34]. As seen in Figure 2a, FI values at all locations exceeded 2.0 regardless of whether it was the wet, normal, or dry season, which clearly shows the dominance of endogenous features. Specifically, the average HIX value across all sampling sites was less than 4, indicating that the DOM had relatively weak humic traits. BIX values were below 1.0 during the wet season, suggesting that there was an influx of terrestrial DOM components. In contrast, BIX values were above 1.0 during the normal and dry seasons, in which a higher proportion of relatively fresh autochthonous components was present. Overall, across different hydrological periods, the three tributaries of the Ganjiang River Estuary share common features of high FI and high BIX, and low HIX. This suggests the presence of typical fresh microbial/algal-derived DOM. These DOM characteristics are linked with phenomena like algal blooms or effluent from wastewater treatment plants [35].

3.1.3. Analysis of DOM Fluorescence Components

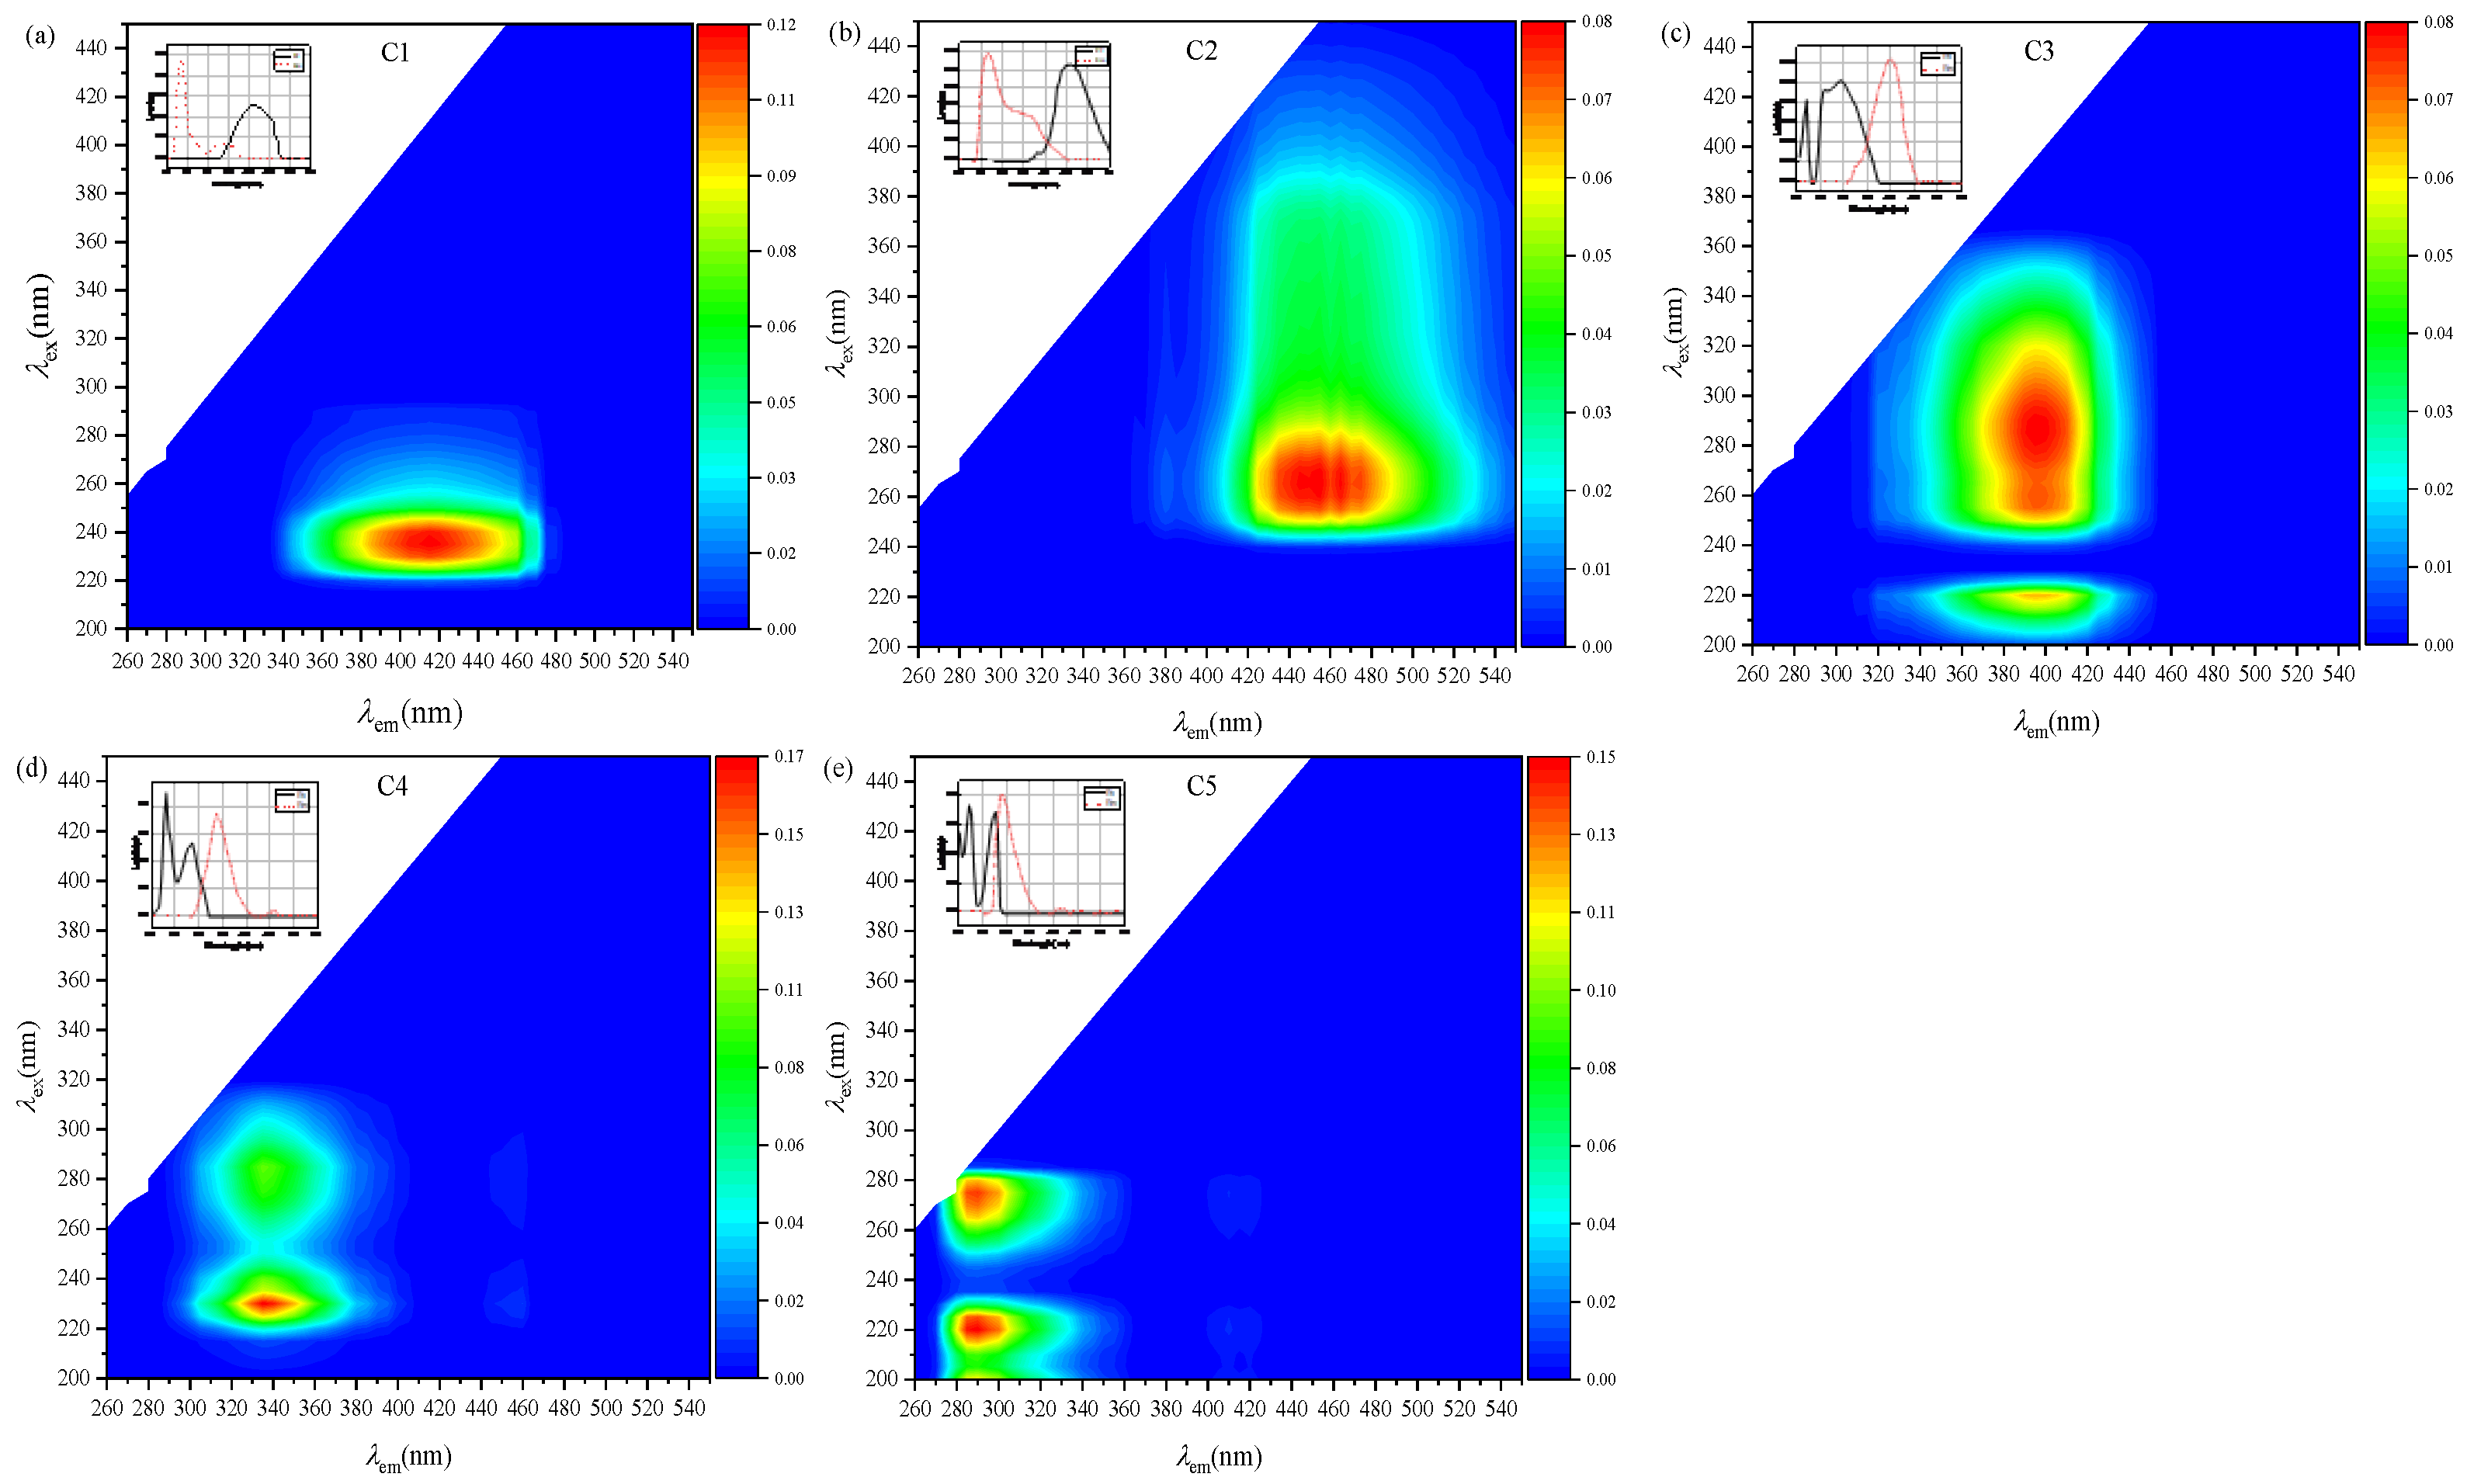
The five components in the Ganjiang River were obtained from PARAFAC. These fluorescent components were matched against established models from the OpenFluor spectral database. Only those with a similarity coefficient higher than 0.97 were screened for subsequent analysis (Figure 3). The composition variation in DOM components is evident in Table 1, as compared to the literature.
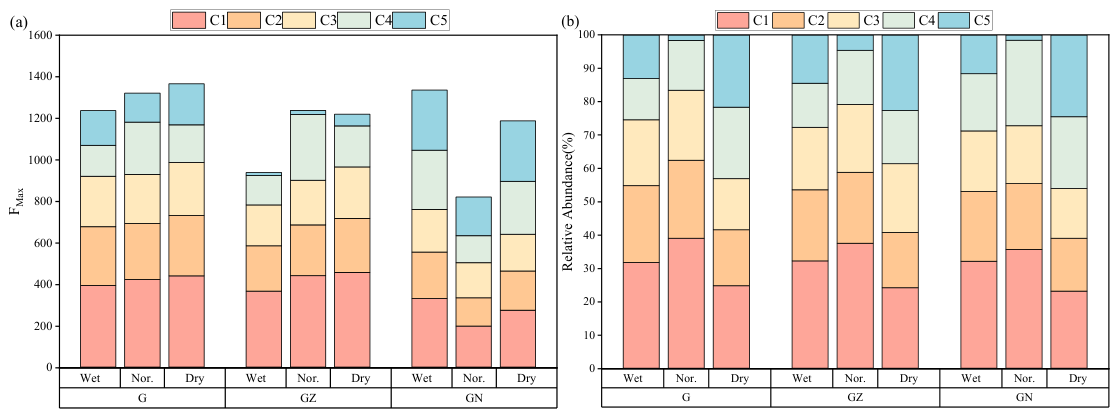
The maximum fluorescence intensity (Fmax) of each component exhibited a positive correlation with its relative abundance. The Fmax showed a characteristic of dry season (3773.2) > wet season (3510.6) > normal season (3378.9) (Figure 4a). Moreover, the fluorescence compositions exhibit distinct characteristics among tributaries, the average total Fmax value of C1 + C3 indicated that it was largest in the mainstream of Ganjiang River (664.0 ± 73.2), followed by the middle (641.7 ± 176.6) and the southern (451.8 ± 206.2) branches of Ganjiang River. The decreasing order of the average Fmax for C2 was the mainstream (281.2 ± 26.5), the middle branch (241.4 ± 50.5) and the southern branch (183.1 ± 108.9). The average Fmax for C4 was highest in the southern branch (224.1 ± 201.3), followed by the middle stream (218.7 ± 221.1) and the mainstream (194.3 ± 129.4). For component C5, the Fmax values ranked in the order: southern branch (255.4 ± 148.1) > mainstream (168.3 ± 70.5) > middle branch (30.2 ± 55.1).
Furthermore, the ratio of each component clearly varied among the DOM fractions (Figure 4b). Microbial humic-like substances (C1% + C3%) were predominant with a mean relative abundance of 49.6%, followed sequentially by C2%, C4%, and C5%. Seasonal trends showed that C1% + C3% consistently ranked highest in all three seasons. The higher C5% levels during the dry season may result from suppressed microbial activity under low temperatures, which reduces tryptophan-like (C4) and Chl-a levels and allows tyrosine-like (C5) substances to accumulate [41]. Notably, Chl-a concentrations peaked in the southern branch (Section 3.1.1), while the C5% content in the southern branch is relatively low. This might be due to the fact that the cell structure of the algae is intact, and the organic substances within the cells have not been released in large quantities yet. As a result, the accumulation of biologically available tyrosine-like substances is relatively low [42].

3.2. Dynamic Variations in DOM Fraction

3.2.1. DOM Components Variation Sequences

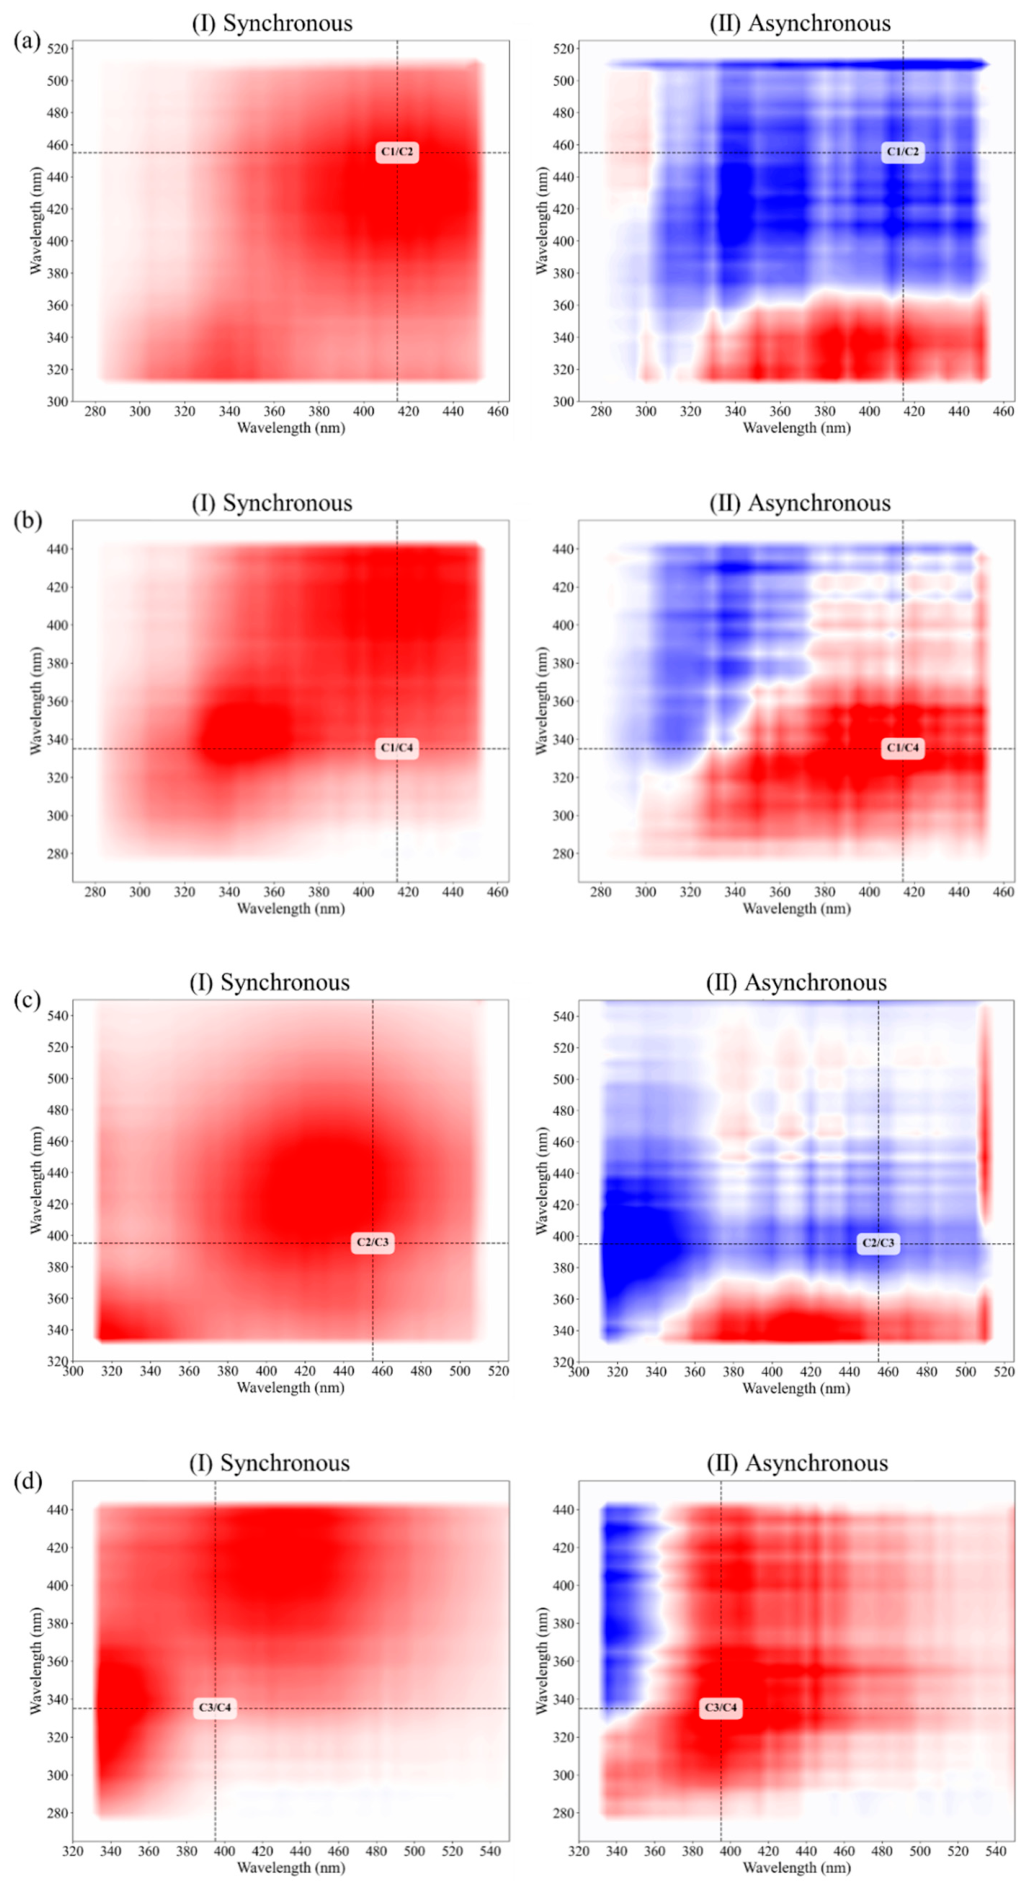
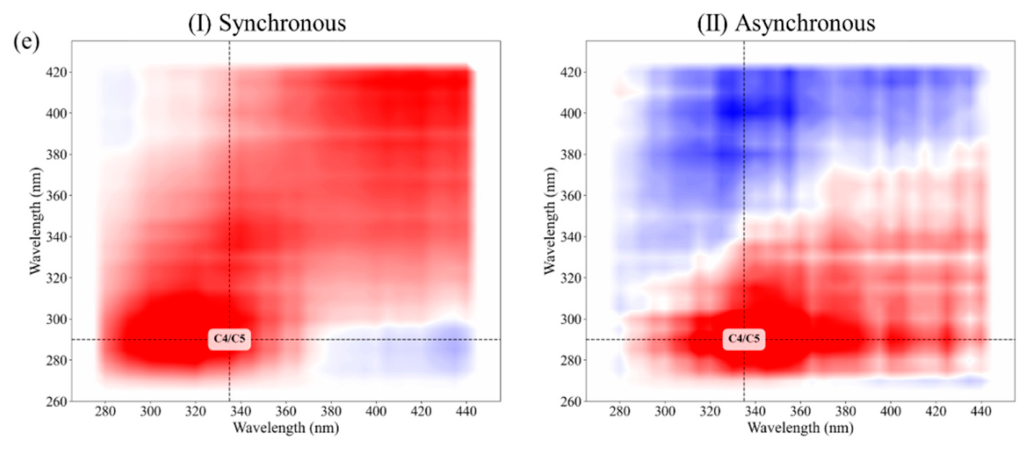
Based on the characteristic peaks of PARAFAC components in Figure 5, hetero-2D COS with synchronous and asynchronous modes was applied to clarify the evolutionary order of DOM in the Ganjiang River Estuary. In the mixed system of C1 and C2 (Figure 5a), there was a positive correlation in the synchronous map and a negative correlation in the asynchronous map. According to Noda’s rule [43], the variation sequence was C2→C1. Similarly, in the C2 and C3 combination (Figure 5c), the variation sequence was C3→C2. Positive correlation was observed in the combinations of C1/C4 (Figure 5b), C3/C4 (Figure 5d), and C4/C5 (Figure 5e) for both synchronous and asynchronous maps. The positive correlation between pairs of components across both mapping approaches indicates cooperative interactions under external perturbation in both simultaneous and sequential responses. Therefore, the overall sequential change in DOM components in the Ganjiang River Estuary is determined to be C3→C2→C1→C4→C5. This sequence can be interpreted in the context of Chl-a dynamics. As Chl-a concentration increases, water transparency and light penetration decrease, thereby modulating photodegradation processes. The photosensitive component C3 responds most rapidly to such changes in the light environment. Recent studies using 2D-COS have demonstrated that protein-like and lignin-derived components exhibit photosensitivity and undergo rapid decomposition within the first 0–4 days of photodegradation [44]. Meanwhile, elevated Chl-a levels are often associated with intensified algal metabolism, implying that C3 may also originate from early metabolic byproducts of algae. C2 responds slightly later following the increase in Chl-a. Elevated algal biomass generally indicates higher autochthonous primary productivity, which may dilute the relative contribution of terrigenous organic matter, leading to a delayed but discernible change in C2 [45]. As algal biomass accumulates beyond a certain threshold, cell senescence and lysis occur, releasing intracellular materials that are subsequently transformed by microorganisms into microbially derived humic-like components such as C1. C4, characterized as tryptophan-like, exhibits a later response. Its fluorescence derives not only from direct algal exudation but also from bacterial metabolism of algal-derived substrates. Tryptophan-like components are well-documented as indicators of microbial activity and autochthonous DOM production [46]. When algal density reaches a critical level and enters the most active metabolic phase, the production of C4 is substantially enhanced. Finally, C5, a tyrosine-like component, shows the most delayed response. Tyrosine-like fluorescence has been previously associated with the degradation of terrestrial organic matter and highly biodegraded, biorefractory low-molecular-weight DOM [47]. The delayed response of C5 is likely associated with the breakdown of algal and microbial proteinaceous materials during advanced stages of organic matter mineralization, marking the transition toward terminal degradation and the transfer of organic matter to higher trophic levels.

3.2.2. Seasonal Variations in the Effects of Chlorophyll Concentration on DOM Components

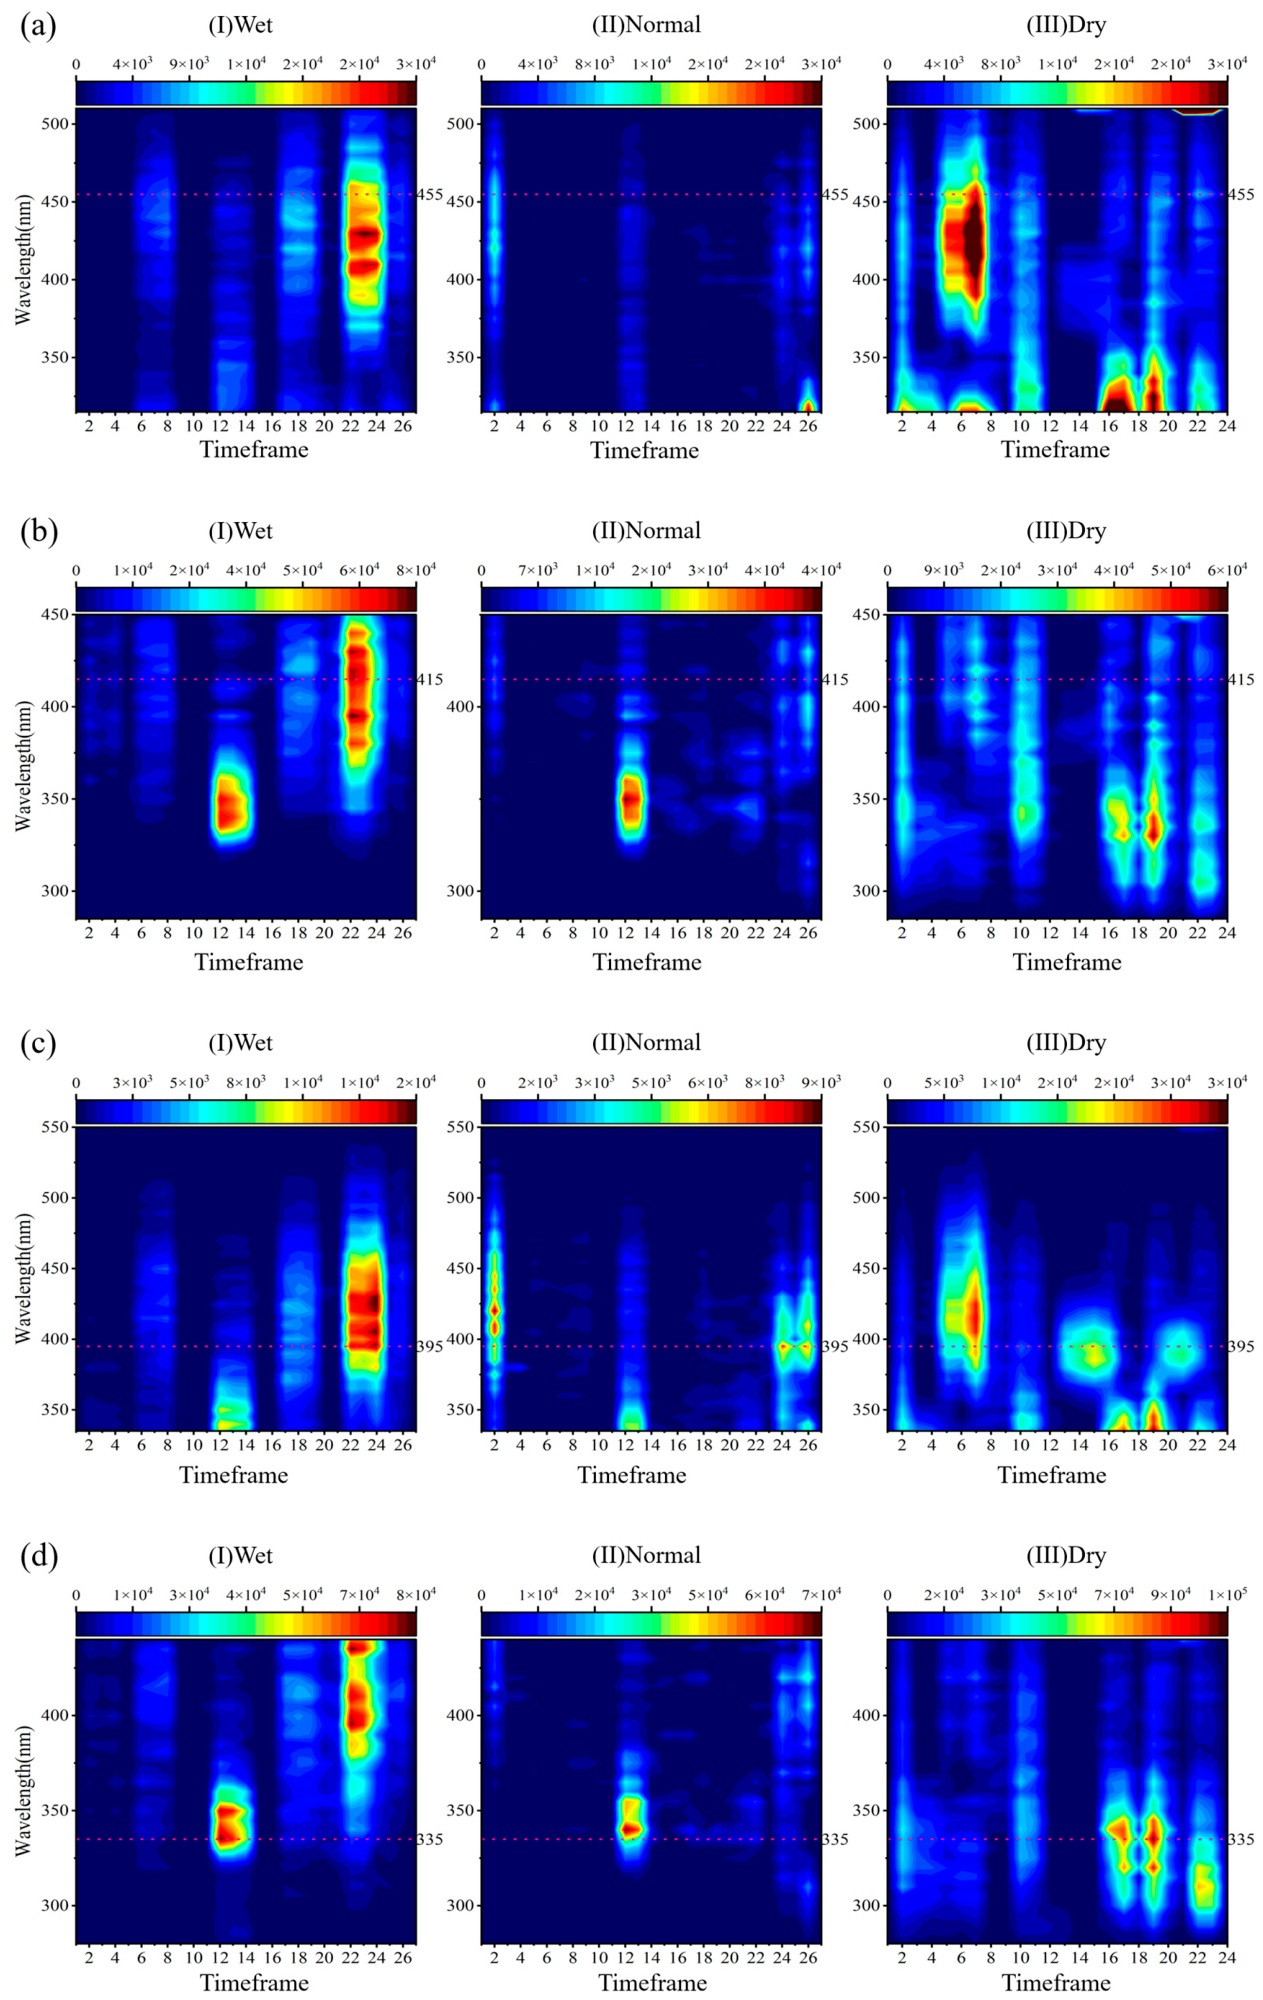
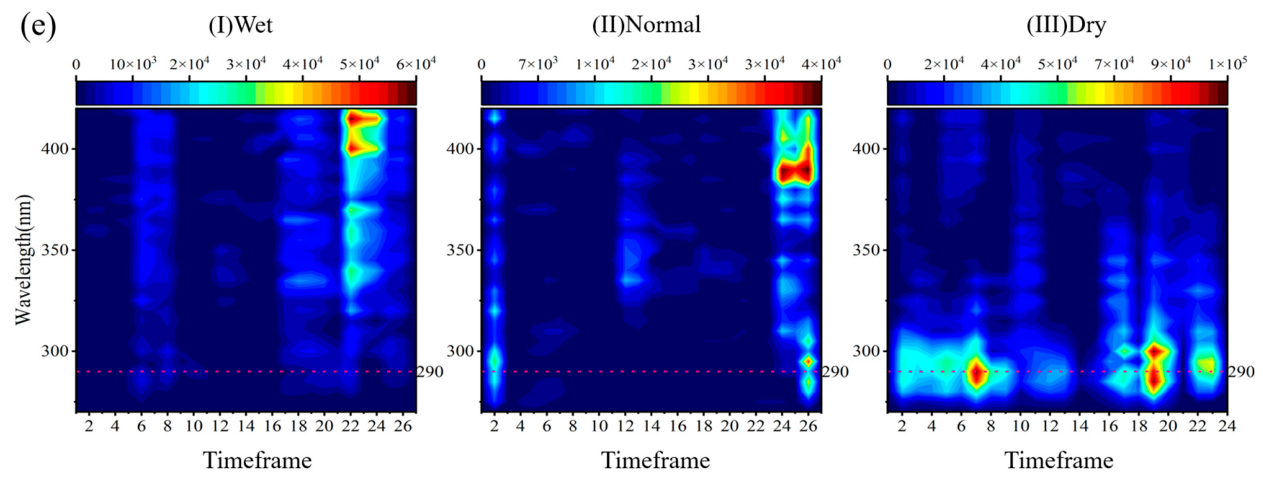
Moving window 2D-COS (MW 2D-COS) analysis across the three seasons revealed distinct temporal variations in the compositional characteristics of DOM components (Figure 6), reflecting complex biotic-abiotic interactions in the freshwater system. Zhang et al.’s research found that erosion caused by heavy rainfall runoff dominates during the wet season, and DOM mainly originates from sequential inputs from surface to deep soil layers [48]. Begum et al. found that fresh vegetation residues and allochthonous humus coexist in the river [49]. Components C1–C4 showed strong temporal variability, indicating increased microbial activity and terrestrial inputs, while weak red bands in C4 and C5 suggest minor contributions from fresh organic matter and microbial amino acids. During the normal season, hydrological conditions remain stable, with moderate flow rates (1000–1500 m3/s) and retention times of 15–30 days [50]. Correspondingly, the fluorescence intensities of all components decrease, indicating reduced allochthonous inputs and steady internal biogenic production. Weak spectral responses and low volatility indicate a dynamic balance between input and transformation processes, suggesting ongoing biotransformation and interactions with natural organic substances [51]. During the dry season, low water levels and extended retention times shift DOM sources toward endogenous production. Meanwhile, microbial metabolism and phytoplankton activity dominate, while terrestrial inputs are minimal. Sediment exposure promotes psychrophilic microbial activity that decomposes organic matter and releases tyrosine-like (C5) and microbial humic-like (C3) compounds [52,53], where elevated C3/C5 signals reflect intensified microbial and phytoplankton metabolism, and reduced dilution sustains this activity via nutrient accumulation under low temperatures, whereas weak C2 responses indicate minimal terrestrial input. Overall, MW 2D-COS results reveal pronounced seasonal shifts in DOM composition and demonstrate how DOM fractions dynamically respond to environmental drivers, providing key insights into carbon cycling and anthropogenic influences in freshwater systems.

3.3. Revealing the Response Characteristics of Chl-a to DOM Components

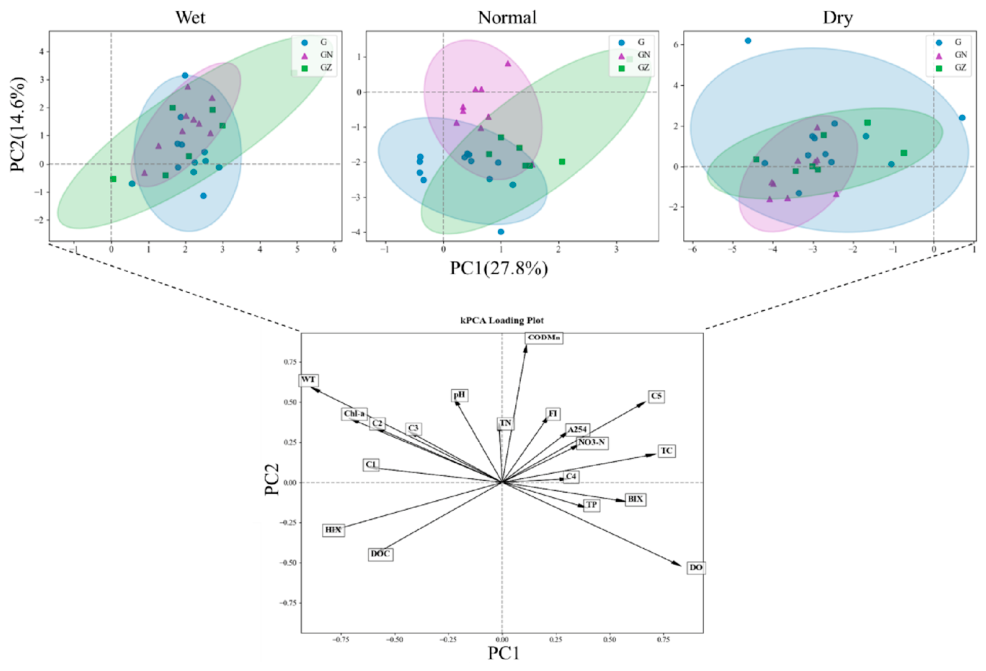
A normality test was conducted on both the sampled data and the fluorescence indices. The results indicated that neither followed a normal distribution. By incorporating kernel principal component analysis (kPCA) into the multivariate environmental study (Figure 7), this study identified nonlinear relationships among water quality parameters across the three branches during different seasonal periods. The kPCA biplot constructed based on the internal core dataset illustrates that PC1 and PC2 account for 27.8% and 24.6% of the total data variance, respectively. In kernel PC1, the high positive loadings indicators include CODMn, TP, NO3, C4, C5, etc. (Figure 7), and are closely associated with organic pollution and nutrient buildup, indicating that PC1 mainly represents the degree of organic pollution [54]. Notably, Chl-a is located on the negative side of PC1, indicating that elevated values of these parameters were associated with lower Chl-a concentrations at certain sites. This negative association, particularly evident at Site GZ5, suggests that specific components of anthropogenic inputs, such as suspended solids causing light limitation or potential toxic substances, might have locally suppressed algal biomass despite the availability of nutrients [55]. Kernel PC2 shows high positive loadings with Chl-a, C2, C3, and CODMn. These indicators are closely associated with biogenic organic matter and biological activity, indicating that PC2 primarily reflects the contribution of biogenic organic matter [54]. HIX and DOC exhibit negative loadings along the negative axis of kernel PC2, both of which correlate strongly with allochthonous organic matter and humification degrees. This agrees well with previous research by Yang et al., and further confirms that the negative direction of PC2 primarily characterizes allochthonous organic contributions [56].
As shown in Figure 7, the differences among the three branches in each season are not particularly significant. In contrast, obvious differences exist across varying hydrological phases. During the wet season, most sample points were located in the positive directions of PC1 and PC2, which could potentially be due to surface erosion transporting a large amount of nutrients and organic matter, thereby contributing to organic pollution and nutrient accumulation within the water body [57]. For the normal season, samples were distributed positively along PC1 and negatively along PC2. This observation indicates a diminished role of surface runoff relative to the wet water period, where stable flow and microbial activity promoted continuous organic pollution and increased humification. Monitoring data from the Waizhou Hydrological Station indicates that the mean monthly runoff during the dry season accounts for merely 3.11–6.32% of the annual total. This minimal river discharge corresponds to the lowest nutrients and organic matter concentrations observed throughout the year. Overall, pollution from surface runoff and algal proliferation should be controlled in the wet season, external organic loading needs proper management during the normal water period, and sediment release as well as organic matter diversity require focused attention in the dry season.
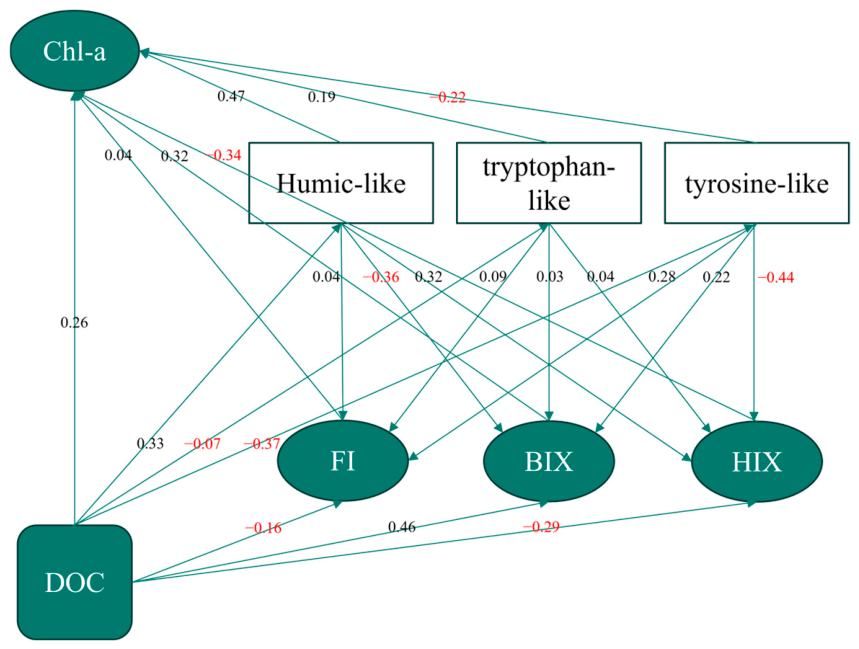
The PLS-pm model effectively delineates the complex network of relationships 395 among diverse DOM components and characteristics within the studied aquatic system, 396 elucidating their direct and indirect effects on Chl-a. As shown in Figure 8, the Goodness-of-Fit (GoF) in the model is 0.64, which is capable of accurately assessing the overall fitting quality of the model. Humic-like and protein-like substances were positively associated with Chl-a, with path coefficients of 0.47 and 0.19, respectively. These relationships should be interpreted as statistical associations rather than evidence of direct causal effects, and may reflect shared environmental conditions or the co-occurrence of DOM dynamics and algal activity [58]. In contrast, tyrosine-like substances showed a negative association with Chl-a (path coefficient = −0.22), which may be linked to environmental conditions less favorable for algal growth. The relationships between Chl-a and fluorescence indices (FI, BIX, and HIX) further suggest linkages between DOM characteristics and algal dynamics, potentially reflecting underlying biogeochemical processes [59]. In addition, DOC was positively associated with Chl-a (path coefficient: 0.26) and showed indirect associations through its relationships with FI, BIX, and HIX. Specifically, DOC was positively associated with BIX (0.46) and negatively associated with FI (−0.16) and HIX (−0.29). These patterns indicate that variations in DOC are coupled with shifts in DOM composition and microbial activity, rather than directly driving changes in algal biomass [60]. Overall, the PLS-PM results highlight the complex co-variation among DOM components, optical properties, and Chl-a, providing insight into their interactions while emphasizing the need for further studies to clarify underlying mechanisms.

4. Conclusions

This study utilized EEM-PARAFAC and MW 2D-COS methods to analyze the distribution of DOM in the Ganjiang River estuary. By integrating the KPCA and PLS-pm model the relationship between DOM composition and Chl-a was treated thoroughly. This study revealed that DOM mainly originated from autochthonous sources and was primarily composed of microbial humus. DOM components showed a sequential environmental response (C3→C2→C1→C4→C5), highlighting coupled algal-microbial-organic matter dynamics. Additionally, we found that water quality parameters indicative of anthropogenic influences and DOM components were the main drivers of the spatiotemporal variation in Chl-a. The DOM components showed significant correlations with algal growth. Allochthonous humic-like substances were positively correlated with Chl-a concentrations, suggesting that they may be associated with environmental conditions favorable for algal development rather than exerting a direct promoting effect. Tryptophan-like substances were also positively correlated with Chl-a, which may reflect the contribution of autochthonous production during algal growth. In contrast, tyrosine-like substances exhibited a significant negative correlation with Chl-a, which may be related to indirect environmental constraints rather than a direct inhibitory effect on algae. Therefore, these correlations likely reflect coupled responses to environmental drivers or internal biogeochemical processes, rather than direct causal relationships. Although traditional nutrients such as TN and TP remained important factors associated with variations in Chl-a, this study also identified significant associations between terrestrial humic substances, tryptophan-like components, and algal biomass. From a management perspective, controlling external nutrient loads, particularly nitrogen and phosphorus remains the fundamental approach for reducing Chl-a levels and managing eutrophication risk. The statistical associations between DOM components and Chl-a identified in this study suggest that DOM composition could serve as a supplementary indicator for tracking ecosystem responses to nutrient management, but DOM itself should not be considered an independent control target at this stage. Overall, the results highlight the complex co-variation among DOM components, hydrological conditions, and algal dynamics in the river-lake confluence zone. These findings offer new insights into eutrophication processes and provide a useful perspective for water quality monitoring, while the clarification of causal mechanisms awaits future targeted studies.

Supplementary Materials

The following supporting information can be downloaded at: https://www.mdpi.com/article/10.3390/w18101160/s1, Figure S1: The concentration of different environmental factors at each sampling site in various seasons in the Ganjiang River Estuarine. (a) Chl-a, (b) TN, (c) NH4+, (d) NO2-, (e) SRP, (f) NO3-, (g) DOC, (h) DIC, (i) COD, (j) TP, (k) pH; Table S1: Summary of analytical methods, detection limits, precision, and recovery for water quality parameters.

Author Contributions

Conceptualization, H.L.; methodology, D.L.; software, H.L.; validation, H.L., D.F.; formal analysis, M.J.; investigation, Z.H.; resources, H.L.; data curation, Z.H.; writing—original draft preparation, Z.H.; writing—review and editing, M.J., H.L., Y.L. and F.Y.; visualization, Z.H., Y.Z. and M.J.; supervision, H.L., W.J., Y.S. and M.L.; project administration, H.L.; funding acquisition, H.L. All authors have read and agreed to the published version of the manuscript.

Funding

This research was funded by Special Funds for Basic Scientific Research Business Expenses of Central-Level Public Welfare Research Institutes, China (NO. 2024YSKY-11).

Data Availability Statement

The data are available from the corresponding author upon reasonable request due to institutional restrictions.

Acknowledgments

During the preparation of this manuscript/study, the authors used ChatGPT-4 (OpenAI, version August 2024) for the purposes of language polishing and grammar correction. The authors have reviewed and edited the output and take full responsibility for the content of this publication.

Conflicts of Interest

The authors declare no conflicts of interest.

Abbreviations

The following abbreviations are used in this manuscript:
DOMDissolved organic matter
Chl-aChlorophyll-a
3D-EEMThree-dimensional excitation-emission matrix
PCAPrincipal component analysis
kPCAKernel principal component analysis
PLS-pmPartial least squares path model
DODissolved oxygen
WTWater temperature
ORPOxidation-reduction potential
ECElectrical conductivity
TDSTotal dissolved solid
DOCDissolved organic carbon
TNTotal nitrogen
NO3-NNitrate nitrogen
NO2-NNitrite nitrogen
NH4+-NAmmonium nitrogen
TPTotal phosphorus
SRPSoluble reactive phosphorus
TDNDissolved total nitrogen
TDPDissolved total phosphorus
CODChemical Oxygen Demand
ExExcitation wavelength
EmEmission wavelength
PARAFACParallel factor analysis
2D-COSTwo-dimensional correlation spectroscopy
HIXHumification Index
FIFluorescence Index
BIXBiological Index
MW 2D-COSMoving window 2D-COS

References

  1. He, J.; Wu, X.; Zhi, G.; Yang, Y.; Wu, L.; Zhang, Y.; Zheng, B.; Qadeer, A.; Zheng, J.; Deng, W.; et al. Fluorescence characteristics of DOM and its influence on water quality of rivers and lakes in the Dianchi Lake basin. Ecol. Indic. 2022, 142, 109088. [Google Scholar] [CrossRef] [Scilit]
  2. Zhang, H.; Cheng, D.; Song, J.; Zhang, Y. Spatiotemporal fate of dissolved organic matter (DOM) in aquatic systems: Drivers, patterns and global implications. J. Hydrol. 2025, 661, 133637. [Google Scholar] [CrossRef] [Scilit]
  3. Huang, Z.Q.; Liu, H.J.; Wang, C.; Wang, J.H.; Tian, C.M.; Feng, J.M.; Shen, J.; Wang, X.Z. Regulation of carbon cycling in plateau lakes by trophic states and seasonal variations: A focus on dissolved organic matter and microbial interactions. Water Res. 2026, 292, 125312. [Google Scholar] [CrossRef] [Scilit]
  4. Liu, X.; Yang, Z.; Cao, B.; Li, J.; Peng, L. The distribution characteristics of nitrogen and phosphorus nutrients in the main rivers of Ganjiang River during the flood season and the dry season. Environ. Monit. China 2023, 39, 21–32. [Google Scholar] [CrossRef]
  5. McIntyre, A.M.; Guéguen, C. Binding interactions of algal-derived dissolved organic matter with metalions. Chemosphere 2013, 90, 620–626. [Google Scholar] [CrossRef] [Scilit]
  6. Zhang, H.; Yang, L.; Lu, S.; Wang, Y.; Liu, S.; Bi, B.; Zhang, J. Research on spatio-temporal distribution characteristics of urban river water quality based on principal component analysis: A case study of Cangzhou City. J. Environ. Eng. Technol. 2024, 14, 1273–1283. [Google Scholar] [CrossRef]
  7. Liu, S.; Hou, J.; Suo, C.; Chen, J.; Liu, X.; Fu, R.; Wu, F. Molecular-level composition of dissolved organic matter in distinct trophic states in Chinese lakes: Implications for eutrophic lake management and the global carbon cycle. Water Res. 2022, 217, 118438. [Google Scholar] [CrossRef] [Scilit]
  8. Bao, Q.; He, H.; Tang, H.; Tang, X.; Li, X.; Ding, Y.; Xia, F.; Zhao, M. Cultivated land-wetland complex increases humified DOM inputs and elevates eutrophication potential in Lake Lugu. J. Environ. Manag. 2025, 394, 127246. [Google Scholar] [CrossRef] [Scilit]
  9. Xu, J.; Jian, Z.; Wang, Y.; Fang, C.; Hu, Q. Spatial–seasonal characteristics and influencing factors of dissolved organic carbon and chromophoric dissolved organic matter in Poyang Lake. Environ. Earth Sci. 2023, 82, 44. [Google Scholar] [CrossRef] [Scilit]
  10. Zhang, L.; Li, S. Anthropogenic dissolved organic matter accumulation fuels greenhouse gas diffusive emissions in urban lakes along trophic state levels. Process Saf. Environ. Prot. 2024, 186, 474–485. [Google Scholar] [CrossRef] [Scilit]
  11. Xi, D.; Hu, E.; Li, M.; Gao, J. Relationships between the spectral characteristics of dissolved organic matter and river ecological health indicators: A case study in the Shichuan River basin on a typical semi-arid and semi-humid region of China. Ecol. Indic. 2024, 169, 112836. [Google Scholar] [CrossRef] [Scilit]
  12. Sun, J.; Zhou, Y.; Jiang, X.; Fan, J. Different Adsorption Behaviors and Mechanisms of Anionic Azo Dyes on Polydopamine–Polyethyleneimine Modified Thermoplastic Polyurethane Nanofiber Membranes. Water 2022, 14, 3865. [Google Scholar] [CrossRef] [Scilit]
  13. Zhang, T.; Zhou, L.; Zhou, Y.; Zhang, Y.; Guo, J.; Han, Y.; Zhang, Y.; Hu, L.; Jang, K.-S.; Spencer, R.G.; et al. Terrestrial dissolved organic matter inputs accompanied by dissolved oxygen depletion and declining pH exacerbate CO2 emissions from a major Chinese reservoir. Water Res. 2024, 251, 121155. [Google Scholar] [CrossRef] [Scilit]
  14. Ma, Y.M.; Mao, R.; Li, S.Y. Hydrological seasonality largely contributes to riverine dissolvedorganicmatter chemical composition: Insights from EEM-PARAFAC and optical indicators. J. Hydrol. 2021, 595, 125993. [Google Scholar] [CrossRef] [Scilit]
  15. Adeyeye, O.A.; Hassaan, A.M.; Song, Z.; Xie, D.; Zhang, L. Disentangling the main factors influencing spring algal blooms in the Three Gorges Reservoir using partial least square structural equation modelling. Chemosphere 2024, 368, 143680. [Google Scholar] [CrossRef] [Scilit] [PubMed]
  16. Li, J.; Shen, Z. Impact of agricultural and rural phosphorus emissions on freshwater eutrophication potential in the Poyang lake basin. J. Clean. Prod. 2025, 523, 146400. [Google Scholar] [CrossRef] [Scilit]
  17. Soldatova, E.A.; Savichev, O.G.; Zhou, D.; Ivanova, I.S.; Li, J.; Dong, Y.; Sun, Z. Ecological–Geochemical Conditions of Surface Water and Groundwater and Estimation of the Anthropogenic Effect in the Basin of the Ganjiang River. Water Resour. 2022, 49, 483–492. [Google Scholar] [CrossRef] [Scilit]
  18. Xia, X.; Pan, J.; Pei, J. A new approach to estimate total nitrogen concentration in a seasonal lake based on multi-source data methodology. Ecol. Inform. 2024, 83, 102808. [Google Scholar] [CrossRef] [Scilit]
  19. Lu, Z.; Qin, G.; Zheng, L.; Zhang, Y.; Huang, L.; Zhou, J.; Liu, Y.; Zheng, M.; Hou, E.; Song, L.; et al. The role of phytoplankton in structuring global oceanic dissolved organic carbon pools. Nat. Commun. 2025, 16, 7742. [Google Scholar] [CrossRef] [Scilit]
  20. Jiang, X.; Liu, D.; Li, J.; Duan, H. Eutrophication and salinization elevate the dissolved organic matter content in arid lakes. Environ. Res. 2023, 233, 116471. [Google Scholar] [CrossRef] [Scilit]
  21. Goodarzi, H.V.; Tehrani, M.R.F.; Zadeh, S.M.; Rezaei, H.; Karimi, A.; Ostad-Ali-Askari, K. Investigation regarding assessment of potentially toxic elements (PTEs) contamination risk in Rasht city with emphasis on the two rivers, Goharroud and Zarjoub, Gilan province, Iran. Sustain. Water Resour. Manag. 2024, 10, 50. [Google Scholar] [CrossRef] [Scilit]
  22. Korak, J.A.; Dotson, A.D.; Summers, R.S.; Rosario-Ortiz, F.L. Critical analysis of commonly used fluorescence metrics to characterize dissolved organic matter. Water Res. 2014, 49, 327–338. [Google Scholar] [CrossRef] [Scilit]
  23. Pifer, A.D.; Fairey, J.L. Improving on SUVA254 using fluorescence-PARAFAC analysis and asymmetric flow-field flow fractionation for assessing disinfection byproduct formation and control. Water Res. 2012, 46, 2927–2936. [Google Scholar] [CrossRef] [Scilit] [PubMed]
  24. McKnight, D.M.; Boyer, E.W.; Westerhoff, P.K.; Doran, P.T.; Kulbe, T.; Andersen, D.T. Spectrofluorometric characterization of dissolved organic matter for indication of precursor organic material and aromaticity. Limnol. Oceanogr. 2001, 46, 38–48. [Google Scholar] [CrossRef] [Scilit]
  25. Stedmon, C.A.; Bro, R. Characterizing dissolved organic matter fluorescence with parallel factor analysis: A tutorial. Limnol. Oceanogr. Methods. 2008, 6, 572–579. [Google Scholar] [CrossRef] [Scilit]
  26. Zhu, L.; Zhao, Y.; Bai, S.; Zhou, H.; Chen, X.; Wei, Z. New insights into the variation of dissolved organic matter components in different latitudinal lakes of northeast China. Limnol. Oceanogr. 2019, 65, 471–481. [Google Scholar] [CrossRef] [Scilit]
  27. Sun, Z.; Zhu, Y.; Jiang, Y.; Zhai, H.; Chen, J.; Yan, X.; Zeng, J.; Chen, Q.; Jiang, Z. Intrusion of Kuroshio Enhances Phytoplankton Biomass and Diversity in the East China Sea. J. Geophys. Res.-Ocean 2025, 130, e2024JC021337. [Google Scholar] [CrossRef] [Scilit]
  28. Han, H.; Yan, X.; Li, X.; Zhao, X.; Qiu, J.; Huang, Z.; Yan, X.; Xia, Y. Quantile regression reveals phosphorous overwhelms nitrogen in controlling high chlorophyll-a concentration in freshwater lakes. J. Hydrol. 2025, 654, 132845. [Google Scholar] [CrossRef] [Scilit]
  29. Vissers, M.A.; Roy, J.W.; Yates, A.G.; Robinson, K.; Rakhimbekova, S.; Robinson, C.E. Spatio-temporal variability of porewater phosphorus concentrations in streambed sediments of an agricultural stream. J. Hydrol. 2023, 617, 129133. [Google Scholar] [CrossRef] [Scilit]
  30. Dietzen, T.; De Sena, E.; van Waterschoot, T. Scalable-Complexity Steered Response Power Based on Low-Rank and Sparse Interpolation. Ieee-Acm Trans. Audio Speech Lang. Process. 2024, 32, 5024–5039. [Google Scholar] [CrossRef] [Scilit]
  31. Amorim, C.A.; Moura, A.D.N. Ecological impacts of freshwater algal blooms on water quality, plankton biodiversity, structure, and ecosystem functioning. Sci. Total Environ. 2021, 758, 143605. [Google Scholar] [CrossRef] [Scilit]
  32. Calderon, M.S.; An, K.-G. Spatio-temporal variabilities of nutrients and chlorophyll, and the trophic state index deviations on the relation of nutrients-chlorophyll-light availability. J. Ecol. Environ. 2016, 39, 31–42. [Google Scholar] [CrossRef] [Scilit]
  33. Cojoc, L.; de Castro-Català, N.; de Guzmán, I.; González, J.; Arroita, M.; Besolí-Mestres, N.; Cadena, I.; Freixa, A.; Gutiérrez, O.; Larrañaga, A.; et al. Pollutants in urban runoff: Scientific evidence on toxicity and impacts on freshwater ecosystems. Chemosphere 2024, 369, 143806. [Google Scholar] [CrossRef] [Scilit]
  34. Huguet, A.; Vacher, L.; Relexans, S.; Saubusse, S.; Froidefond, J.; Parlanti, E. Properties of fluorescent dissolved organic matter in the Gironde Estuary. Org. Geochem. 2009, 40, 706–719. [Google Scholar] [CrossRef] [Scilit]
  35. Hu, A.; Choi, M.; Tanentzap, A.J.; Liu, J.; Jang, K.-S.; Lennon, J.T.; Liu, Y.; Soininen, J.; Lu, X.; Zhang, Y.; et al. Ecological networks of dissolved organic matter and microorganisms under global change. Nat. Commun. 2022, 13, 3600. [Google Scholar] [CrossRef] [Scilit]
  36. Catalá, T.S.; Reche, I.; Fuentes-Lema, A.; Romera-Castillo, C.; Nieto-Cid, M.; Ortega-Retuerta, E.; Calvo, E.; Álvarez, M.; Marrasé, C.; Stedmon, C.A.; et al. Turnover time of fluorescent dissolved organic matter in the dark global ocean. Nat. Commun. 2015, 6, 5986. [Google Scholar] [CrossRef] [Scilit]
  37. Murphy, K.R.; Hambly, A.; Singh, S.; Henderson, R.K.; Baker, A.; Stuetz, R.; Khan, S.J. Organic Matter Fluorescence in Municipal Water Recycling Schemes: Toward a Unified PARAFAC Model. Environ. Sci. Technol. 2011, 45, 2909–2916. [Google Scholar] [CrossRef] [Scilit] [PubMed]
  38. Sharma, P.; Laor, Y.; Raviv, M.; Medina, S.; Saadi, I.; Krasnovsky, A.; Vager, M.; Levy, G.J.; Bar-Tal, A.; Borisover, M. Compositional characteristics of organic matter and its water-extractable components across a profile of organically managed soil. Eoderma 2017, 286, 73–82. [Google Scholar] [CrossRef] [Scilit]
  39. Brogi, S.R.; Cossarini, G.; Bachi, G.; Balestra, C.; Camatti, E.; Casotti, R.; Checcucci, G.; Colella, S.; Evangelista, V.; Falcini, F.; et al. Evidence of Covid-19 lockdown effects on riverine dissolved organic matter dynamics provides a proof-of-concept for needed regulations of anthropogenic emissions. Sci. Total Environ. 2022, 812, 152412. [Google Scholar] [CrossRef] [Scilit] [PubMed]
  40. Menendez, A.; Tzortziou, M. Driving factors of colored dissolved organic matter dynamics across a complex urbanized estuary. Sci. Total Environ. 2024, 921, 171083. [Google Scholar] [CrossRef] [Scilit]
  41. Zhu, E.; Cao, Z.; Jia, J.; Liu, C.; Zhang, Z.; Wang, H.; Dai, G.; He, J.; Feng, X. Inactive and inefficient: Warming and drought effect on microbial carbon processing in alpine grassland at depth. Glob. Change Biol. 2021, 27, 2241–2253. [Google Scholar] [CrossRef] [Scilit]
  42. Zhang, T.-Z.; Zhou, L.-M.; Wang, Y.-Y.; Han, L.; Cao, X.-Y.; Yang, G.-P. Spectral characteristics of organic matter from algae and its complexation with copper: A case study of Ulva prolifera. Mar. Environ. Res. 2025, 210, 107305. [Google Scholar] [CrossRef] [Scilit]
  43. Noda, I. Frontiers of Two-Dimensional Correlation Spectroscopy. Part 1. New concepts and noteworthy developments. J. Mol. Struct. 2014, 1069, 3–22. [Google Scholar] [CrossRef] [Scilit]
  44. Xiao, T.; Hou, J.; Zhang, S.; Liu, D.; Gao, H.; Yu, H. Two-Dimensional Heterospectral Correlation Analysis Elucidates Photodegradation Pathways of Riverine Dissolved Organic Matter Using Excitation–Emission Matrix and Ultraviolet Spectroscopy. Anal. Chem. 2025, 97, 16346–16354. [Google Scholar] [CrossRef] [Scilit]
  45. Wang, Z.; Feng, F.; Liu, D.; Gao, H.; Li, Q.; Yu, H. Changes in the complexation behavior of cadmium with dissolved organic matter in the Huaihe River basin: Environmental drivers, regional differences and socio-economic impacts. Environ. Res. 2025, 285, 122305. [Google Scholar] [CrossRef] [Scilit]
  46. Yao, X.; Zhang, Y.; Zhu, G.; Qin, B.; Feng, L.; Cai, L.; Gao, G. Resolving the variability of CDOM fluorescence to differentiate the sources and fate of DOM in Lake Taihu and its tributaries. Chemosphere 2015, 27, 197–206. [Google Scholar] [CrossRef] [Scilit] [PubMed]
  47. Lee, Y.K.; Hong, S. Copper-binding properties of microplastic-derived dissolved organic matter revealed by fluorescence spectroscopy and two-dimensional correlation spectroscopy. Water Res. 2020, 187, 116775. [Google Scholar] [CrossRef] [Scilit]
  48. Zhang, L.; Xu, Y.J.; Li, S. Source and quality of dissolved organic matter in streams are reflective to land use/land cover, climate seasonality and pCO2. Environ. Res. 2023, 216, 114608. [Google Scholar] [CrossRef] [Scilit] [PubMed]
  49. Begum, M.S.; Park, H.-Y.; Shin, H.-S.; Lee, B.-J.; Hur, J. Separately tracking the sources of hydrophobic and hydrophilic dissolved organic matter during a storm event in an agricultural watershed. Sci. Total Environ. 2023, 873, 162347. [Google Scholar] [CrossRef] [Scilit]
  50. Zhang, S.; Xu, X.; Xu, X.; Chu, V.; Wu, N.; Fu, S.; Li, X. Seasonal variations of water age in Lake Poyang. J. Lake Sci. 2018, 30, 199–210. [Google Scholar] [CrossRef] [Scilit]
  51. Ghattas, A.-K.; Fischer, F.; Wick, A.; Ternes, T.A. Anaerobic biodegradation of (emerging) organic contaminants in the aquatic environment. Water Res. 2017, 116, 268–295. [Google Scholar] [CrossRef] [Scilit]
  52. Maltauro, R.; Stone, M.; Collins, A.; Krishnappan, B. Advancing mechanistic understanding of cohesive sediment transport: Integrating flume experiments; field measurements; and modelling approaches in a gravel-bed river. Sci. Total Environ. 2024, 956, 177301. [Google Scholar] [CrossRef] [Scilit]
  53. Ouyang, W.; Zhao, Y.; Li, Z.; Yin, H.; Lu, L.; Zhang, Y. Hydraulic residence time thresholds and seasonal regimes governing DOM transformation in upper Yangtze River cascading reservoirs. Water Res. 2025, 287, 124325. [Google Scholar] [CrossRef] [Scilit]
  54. Zhang, X.; Ma, L.; Zhu, Y.; Lou, W.; Xie, B.; Sheng, L.; Hu, H.; Zheng, K.; Gu, Q. Temporal Stability Analysis for the Evaluation of Spatial and Temporal Patterns of Surface Water Quality. Water Resour. Manag. 2022, 36, 1413–1429. [Google Scholar] [CrossRef] [Scilit]
  55. He, Y.; Wang, X.; Xu, F. How reliable is chlorophyll-a as algae proxy in lake environments? New insights from the perspective of n-alkanes. Sci. Total Environ. 2022, 836, 155700. [Google Scholar] [CrossRef] [Scilit] [PubMed]
  56. Wang, G.; Yang, J.; Qian, Y.; Han, J.; Jiao, J. KPCA-CCA-Based Quality-Related Fault Detection and Diagnosis Method for Nonlinear Process Monitoring. Ieee Trans. Ind. Inform. 2023, 19, 6492–6501. [Google Scholar] [CrossRef] [Scilit]
  57. Yang, J.; Han, M.; Zhao, Z.; Jiang, H. Positive Priming Effects Induced by Allochthonous and Autochthonous Organic Matter Input in the Lake Sediments With Different Salinity. Geophys. Res. Lett. 2022, 49, e2021GL096133. [Google Scholar] [CrossRef] [Scilit]
  58. Range, D.; Scherer, C.; Stock, F.; Ternes, T.A.; Hoffmann, T.O. Hydro-geomorphic perspectives on microplastic distribution in freshwater river systems: A critical review. Water Res. 2023, 245, 120567. [Google Scholar] [CrossRef] [Scilit] [PubMed]
  59. Cai, S.; Liu, W.; Tong, Z.; Lin, L.; Ou, L.; Xiao, W.; Huang, B. Salinity threshold for phosphorus limitation in an estuary-coast continuum. Front. Mar. Sci. 2024, 11, 1437405. [Google Scholar] [CrossRef] [Scilit]
  60. Chang, C.; Hu, E.; Xue, X.; Li, J.; Du, D.; Yang, F.; Li, M. Hydro-morphology and water quality jointly shape the structure and network stability of the plankton community in multi-tributary river basins. J. Hydrol. 2024, 643, 131945. [Google Scholar] [CrossRef] [Scilit]
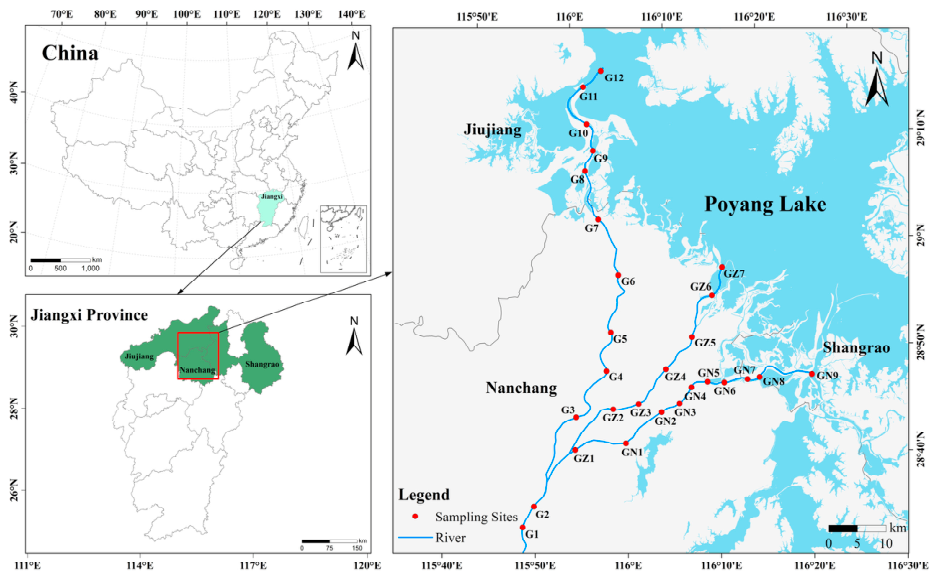
Figure 1. Sampling sites in the Ganjiang River Estuary.
Water 18 01160 g001
Figure 2. Distribution of fluorescence characteristics parameter covering (a) FI versus HIX, (b) HIX versus BIX, where FI stands for fluorescence index, HIX stands for humification index, and BIX stands for biological index.
Water 18 01160 g002
Figure 3. Fluorescence component and peak identified of DOM in the Ganjiang River Estuary. (a) C1, (b) C2, (c) C3, (d) C4, (e) C5.
Water 18 01160 g003
Figure 4. The Fmax (a) and the Relative Abundance (b) of fluorescence components for each branch of Ganjiang River Estuary.
Water 18 01160 g004
Figure 5. Synchronous and asynchronous mapping obtained via hetero-2D-COS of PARAFAC components. (Red represents positive correlations; blue represents negative correlations). (a) C1, (b) C2, (c) C3, (d) C4, (e) C5.
Water 18 01160 g005aWater 18 01160 g005b
Figure 6. Fluorescence components behavior across different seasons in Ganjiang River Estuary using moving window 2D-COS: (a) C1, (b) C2, (c) C3, (d) C4, and (e) C5.
Water 18 01160 g006aWater 18 01160 g006b
Figure 7. Demonstration of kPCA on the water quality and DOM fluorescence indices in different branches in Ganjiang River Estuary seasonality.
Water 18 01160 g007
Figure 8. Analysis of the relationship among Chl-a, DOC, and DOM fluorescence components and indices based on the partial least squares path model (PLS-pm).
Water 18 01160 g008
Table 1. Summary of DOM fluorescence components identified by EEM-PARAFAC according to the wavelength.
ComponentEx (max)/nmEm (max)/nmComponent IdentityReference
C1235415microbial humic-like substancesCatalá et al., 2015 [36]
C2265455terrestrial humic-like substancesMurphy et al., 2011 [37]
C3220/285395photodegradation/microbial humic-like substancesSharma et al., 2017 [38]
C4230335tryptophan-like substanceBrogi et al., 2022 [39]
C5220/275290tyrosine-like substanceMenendez and Tzortziou, 2024 [40]
Disclaimer/Publisher’s Note: The statements, opinions and data contained in all publications are solely those of the individual author(s) and contributor(s) and not of MDPI and/or the editor(s). MDPI and/or the editor(s) disclaim responsibility for any injury to people or property resulting from any ideas, methods, instructions or products referred to in the content.