Article

Effect of Filter Media Composition on Water Quality in a Rainwater Harvesting System: A Longitudinal Pilot Study in Santiago, Dominican Republic


by
Edward A. Delgado Suero
1,
Christine E. Stauber
2,*,
Karen E. Nielsen
2,
José O. Payero
3 and
César E. Cruz Mena
4
1
Laboratorio de Inocuidad de Alimentos y Análisis Industrial (LIAAI), Universidad ISA, La Herradura, Santiago, Dominican Republic
2
Department of Population Health Sciences, Georgia State University, Atlanta, GA 30303, USA
3
Department of Agricultural Sciences, Clemson University, Blackville, SC 29817, USA
4
Departamento de Agronomía, Universidad ISA, La Herradura, Santiago, Dominican Republic
*
Author to whom correspondence should be addressed.
Water 2026, 18(10), 1158; https://doi.org/10.3390/w18101158
Submission received: 30 March 2026 / Revised: 6 May 2026 / Accepted: 7 May 2026 / Published: 12 May 2026
(This article belongs to the Section Water Quality and Contamination)

Abstract

Santiago, Dominican Republic, faces a growing deficit in the supply of drinking water. Rainwater harvesting systems have the potential to provide a reliable and sustainable source of drinking water. This research examines water quality from the pilot testing of a rainwater harvesting system designed to directly capture rainwater in planter boxes, pre-filter it and store it. The pilot testing consisted of a field experiment comparing rainwater harvested with four filter media compositions with varying levels of sand (34, 62, 66 and 76%). From May 2024 to May 2025, bi-weekly water samples were tested for physicochemical and microbiological parameters including pH, electrical conductivity, total dissolved solids, turbidity, biochemical oxygen demand, heterotrophic bacteria, total and fecal coliforms, E. coli, and Enterobacteriaceae. Statistical models were fitted for each water quality parameter, using linear mixed-effects models or generalized linear mixed-effects models with a logit link, to evaluate the association between filter unit design and water quality outcomes. Results showed that physicochemical quality met Dominican drinking water standards but infrequently met bacteriological standards. However, filters with higher sand composition produced higher quality water for both physicochemical and microbiological parameters. Additional treatment such as chlorination would reduce bacteria and protect the water during storage.

1. Introduction

Globally, the issue of water bankruptcy has highlighted irreversible water loss and growing concerns of the water crisis [1]. Across Latin American, poor water infrastructure and sustainability concerns contribute to growing recognition of water scarcity across the region [2]. The province of Santiago in the Dominican Republic is no different; it is frequently grappling with a significant deficit in drinking water supply [3,4]. This issue is exacerbated by the poor quality of the available water [4] and the high costs of alternative sources, such as tanker trucks and bottled water [5]. Additionally, the province faces increasingly frequent and prolonged periods of drought, further straining the already limited water resources [2,3]. This situation is not unique to this region or country. The scarcity of water supply and challenges with quality affect the most impoverished sectors across Latin America, who are forced to purchase low-quality water at exorbitant prices, highlighting the inequities in the water market [2,5].
Rainwater harvesting systems have been recognized for their potential to provide a reliable and sustainable source of drinking water [6]. These systems capture and store rainwater and typically include components such as catchment surfaces, conveyance systems, and storage tanks. One critical aspect of these systems is that the initial runoff often contains chemical and microbiological contaminants [7]. In traditional rainwater harvesting systems, the roof has been identified as a main source of water pollution [8,9]. In the Dominican Republic, roofs are generally made of concrete or galvanized material. During collection from the roof, dust particles, plant materials and fecal matter from small rodents, lizards and birds can be deposited on the surface of the roof. Without a first flush system to divert that contamination away from storage tanks, contaminated rainwater poses risks for chemical and microbiological hazards [7,10].
In addition to the pollution concerns of traditional rainwater harvesting systems, an important feature to consider is the ability of the systems to capture and store enough water to meet domestic use and supply needs [11,12]. Growing variability with rainfall seasonality and intensity call for additional research to understand the ability of rainwater harvesting systems to manage variability and unpredictable conditions for household or neighborhood water production uses [12,13].
In response to the growing understanding of water scarcity and household water insecurity, it is essential to investigate the ability of rainwater harvesting systems to overcome the challenges of providing and maintaining sustainable drinking water sources. To this end, we designed and field-tested a novel rainwater harvesting system. The overall goal of the study was to examine both rainwater volume production and rainwater quality. Unique to this system is a non-traditional capture feature which does not use a large flat surface but instead uses a pre-filter design. In this system, rainwater falls directly into large planter boxes with filter media. The goal of the study was to determine the key features of the design that would provide the highest quality water by comparing four filter media compositions in a longitudinal monitoring period of one year.

2. Materials and Methods

This study was conducted on the northern side of the Botanical Garden of Santiago (Jardín Botánico Profesor Eugénio De Jesús Marcano), located in the community of Jacagua, northwest of Santiago de Los Caballeros, Dominican Republic, which is in the Subtropical Dry Forest Life Zone. The annual average rainfall in this area is 990 mm and is divided into two distinct seasons [14]. Only four months of the year—April, May, September, and November—have an average monthly rainfall ≥ 100 mm. The average monthly temperature ranges from 23.9 °C in January to 28.6 °C in August.

2.1. Brief Overview of Rainwater Collection System Design

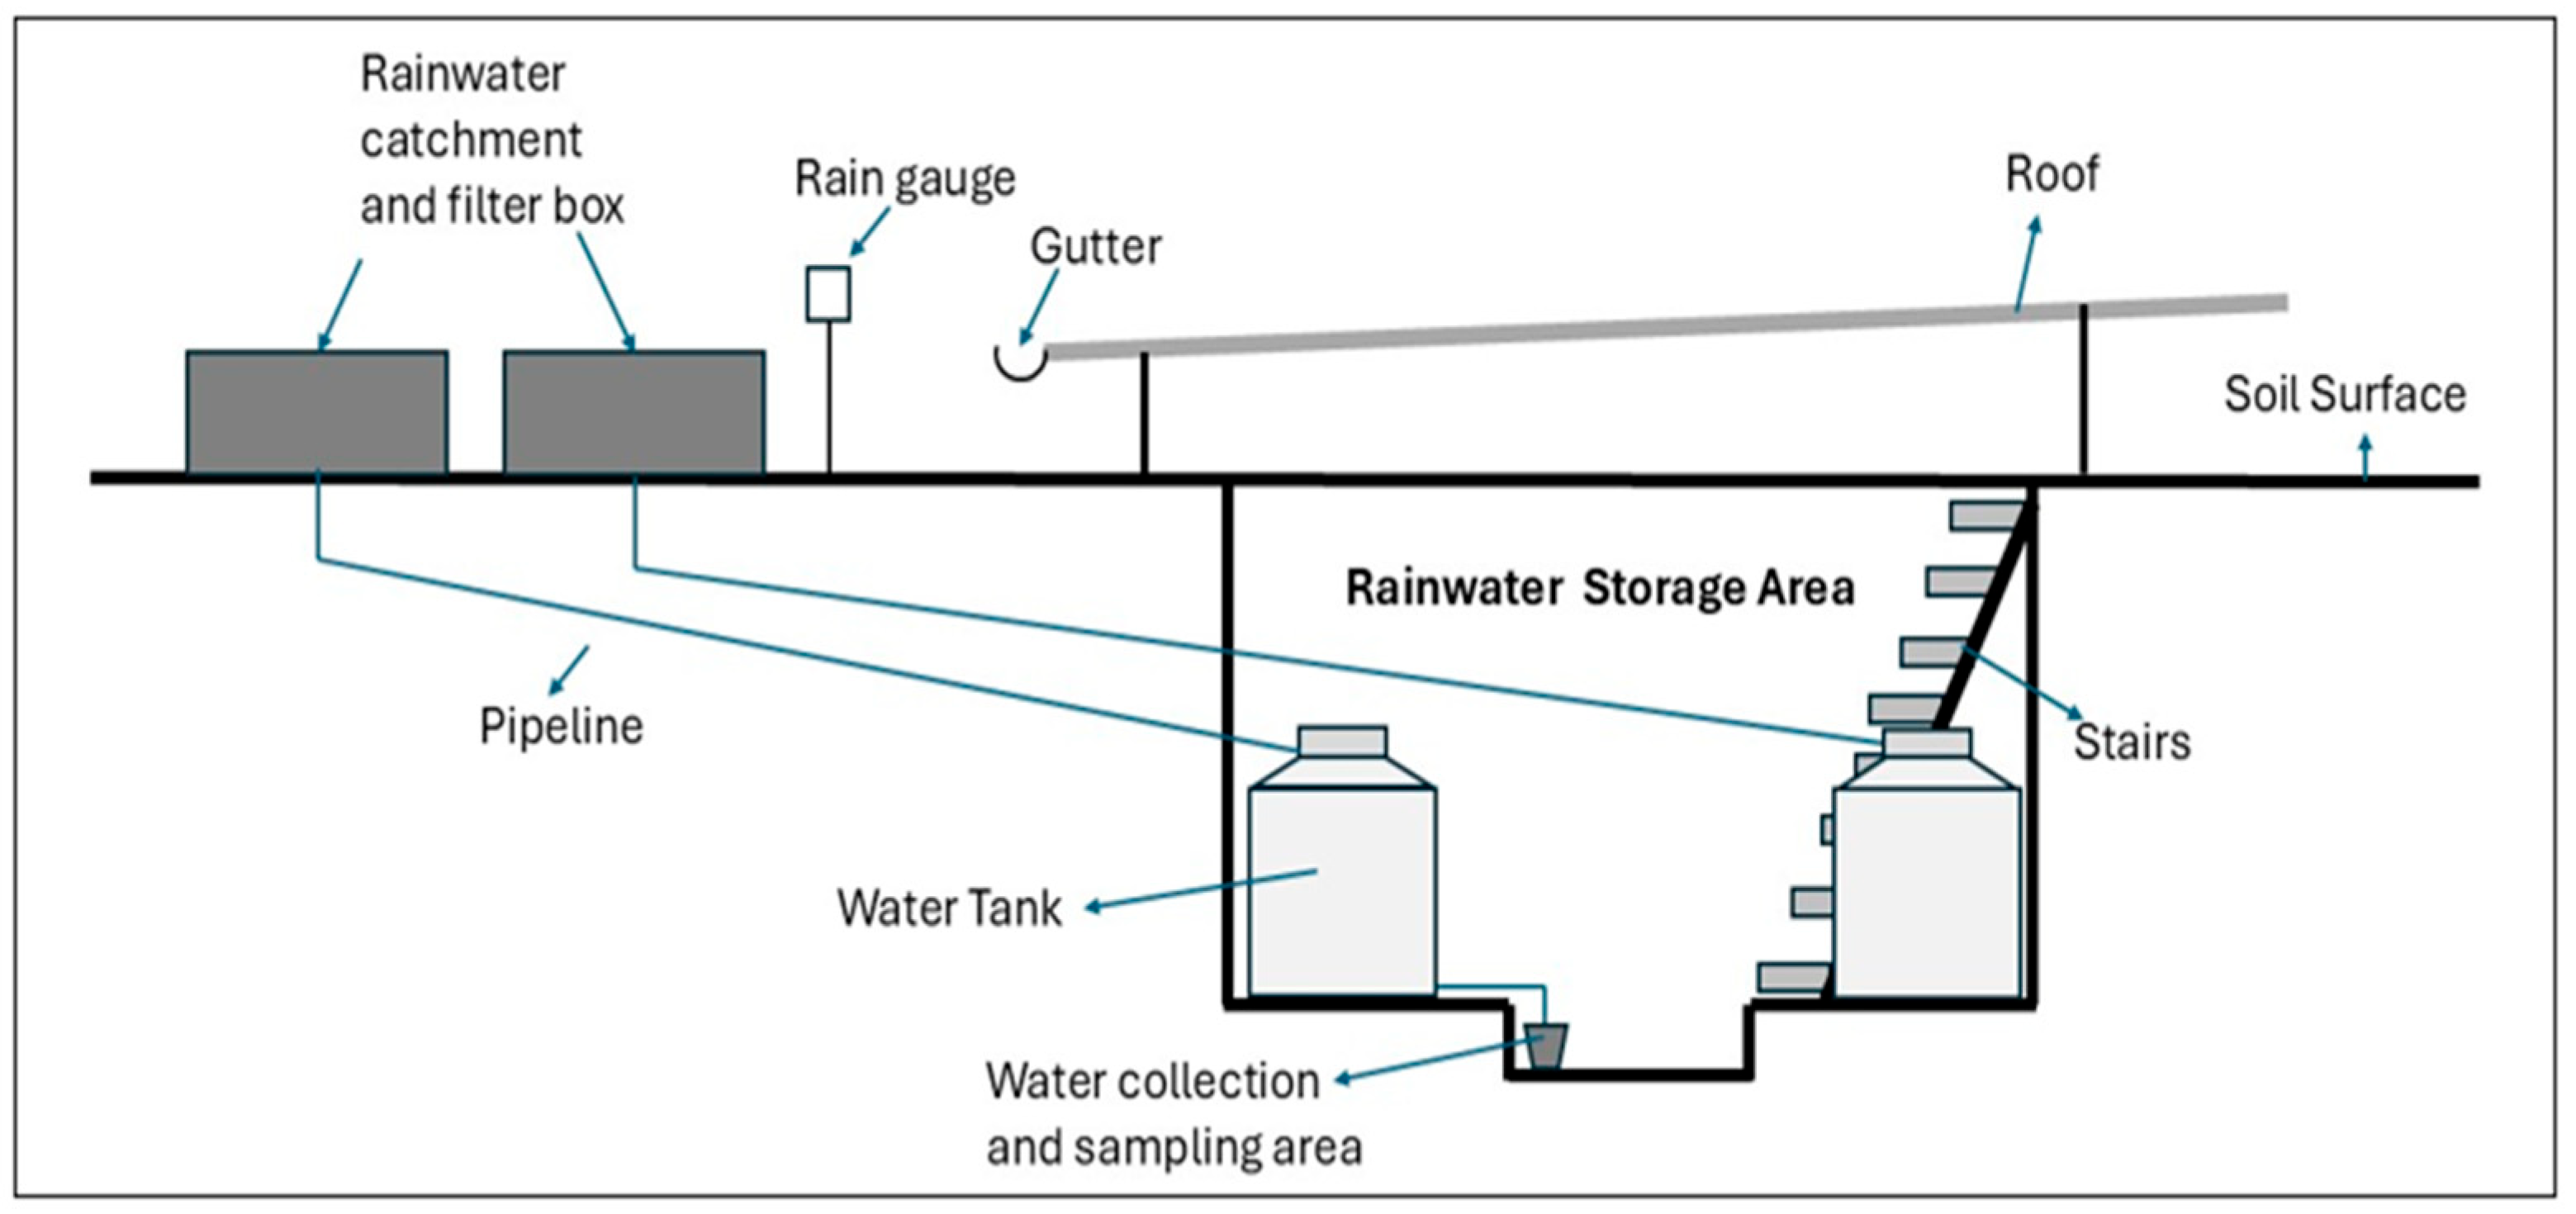
An experimental system for harvesting was developed consisting of a collection and filtration unit built as a rectangular wooden box without a bottom or lid, measuring 2.75 m in length, 1.0 m in width, and 0.5 m in height (shown in Figure 1 and Figure 2). The module was installed directly on the ground which acted as the base. A 1.0 mm thick impermeable geomembrane was placed inside, covering the bottom and lateral walls to prevent water leakage. A perforated 2” PVC pipe was laid on the membrane at the bottom to channel the collected rainwater by gravity toward a storage tank located at a lower elevation (in a below-ground storage tank). The filtration unit consisted of two layers: a lower 0.30 m deep layer of porous material (composed of sand and local soil in varying proportions), and an upper 0.20 m layer of gravel (¼ to ½ inch) designed to protect the filtration media. Four experimental treatments were created with the following proportions of sand to soil ratios: 76% sand, 66% sand, 62% sand and 34% sand (with the remaining materials being silt and clay). These percentages were selected to represent filter designs that would balance cost and efficiency as a higher percentage of sand increases the cost.
The filters were constructed using fine construction sand which was easy to obtain at a reasonable cost rather than using pure silica sand. To produce each filter media mixture, locally harvested soil and construction sand were mixed in batches with shovels according to the appropriate volume ratios. Each mixture was then tested using the Buoyocos hydrometer method to determine the percentages of sand, soil and clay [15]. Analysis revealed the following characteristics: 34% sand (22% clay, 44% silt), 62% sand (15% clay, 23% silt), 66% sand (14% clay, 20% silt) and 76% sand (11% clay, 13% silt). Each media mixture was loaded into the planter box and compacted with a concrete block and then a layer of gravel was added. Each filter unit included a porous material volume of 0.825 m3. The filter units were connected to storage tanks as part of the collection and storage (Figure 2). The experiment was conducted using four filter media compositions with four replicates (blocks) using a Randomized Complete Block Design (four blocks with four filters in each block) for a total of 16 experimental units.

2.2. Water Quality Sampling

To examine the effect of filter media composition on water quality, a longitudinal water sampling program was conducted. This program included biweekly sampling for physicochemical and microbiological parameters on alternating weeks, and weekly sampling for biochemical oxygen demand over five days (BOD5). The sampling period was from May 2024 to May 2025 for the physicochemical parameters and BOD5 and from May 2024 to March 2025 for the microbiological parameters. Samples for microbiological analysis were collected in sterile 500 mL glass bottles, and samples for physicochemical analysis were collected using 1-liter polypropylene bottles, previously washed and properly dried. All samples for analysis were taken from the water storage tanks as depicted in Figure 2. All collection procedures followed the ISO 5667-3 guidelines [16] for sampling, preservation, and transport. Each sample was labeled in the field with a sample identification number and a sampling date, and upon arrival at the laboratory, the corresponding chain-of-custody records were completed. Samples were properly preserved and transported to the Laboratory of Food Safety and Industrial Analysis (LIAAI) at Universidad ISA within one hour of collection.

2.3. Water Quality Analyses

Equipment, reagents, and measurement conditions: Physicochemical parameters were determined using instruments calibrated prior to each use. pH was measured using a pH meter (Fisher Scientific, model XL150; range 0.01–14.00 pH units, Waltham, MA, USA), calibrated with certified buffer solutions (pH 4.01, 7.00, and 14.00; HACH, Loveland, CO, USA). Electrical conductivity (EC) and total dissolved solids (TDS) were measured using a multiparameter instrument (HACH, model EC71; range 10–12,000 µS/cm), calibrated with standard conductivity solutions (147 ± 5, 1413 ± 12 µS/cm at 25 °C, and 12.88 mS/cm; HACH). Turbidity was measured using a turbidimeter (Thermo Scientific, model ORION AQ4500; range 0.2–1000 NTU), calibrated with NIST-traceable reference materials (0, 1, 10, 100, and 1000 NTU). BOD5 was determined using a BODTrak II system (HACH) with controlled incubation (Fisher Scientific, incubator model 3724). All measurement instruments had valid external calibration performed by an ISO/IEC 17025:2017 [17] accredited laboratory. Five independent measurements per week were conducted for each physicochemical parameter under controlled conditions following standardized procedures.
Physicochemical parameters: Physicochemical analyses were performed according to the Standard Methods for the Examination of Water and Wastewater, including pH (SM 4500-H+ B), turbidity (SM 2130 B), electrical conductivity (SM 2510 B), and BOD5 (SM 5210 D). TDS was determined by direct reading from the multiparameter instrument [18,19].
Microbiological parameters: Microbiological analyses included heterotrophic bacteria, total coliforms, fecal coliforms, Escherichia coli, and Enterobacteriaceae. Heterotrophic bacteria were evaluated according to the Standard Methods for the Examination of Water and Wastewater Sections 9215 A and B [19]. Total coliforms, fecal coliforms, and Escherichia coli were assessed using the membrane filtration technique following ISO 9308-1 [20], and Enterobacteriaceae were quantified according to ISO 21528-2 [21]. Microbiological samples were processed using defined dilution schemes: heterotrophic bacteria (0–300 CFU/mL; dilutions 10−1 and 10−2, in duplicate); total coliforms and E. coli (1–100 CFU/100 mL; undiluted, in duplicate); fecal coliforms (undiluted, in duplicate); and Enterobacteriaceae (10−1 dilution, in duplicate). Internal quality control procedures were applied to all microbiological analyses through the inclusion of negative and positive controls on a weekly basis. The positive control was performed using the reference strain Escherichia coli ATCC 25922, (American Tissue Culture Collection, Manassus, VA, USA) ensuring method performance verification and result traceability.

2.4. Statistical Analysis

Prior to conducting statistical analyses, all variables were graphed and inspected to assess their statistical distributions and temporal patterns. Based on these inspections and an understanding of the ability to interpret information for risk assessment and drinking water guidelines, the data were transformed as follows: heterotrophic plate counts, total coliforms, fecal coliforms, E. coli and Enterobacteriaceae were modified to be a binary presence or absence of detection of these bacteria in 100 mL (or 1 mL) of water. Specifically, these microbiological parameters were coded as present or absent using the following thresholds based on national and international guidelines [22]: heterotrophic bacteria ≥ 300 CFU/mL, total coliforms ≥ 1 CFU/100 mL, fecal coliforms ≥ 1 CFU/100 mL, E. coli ≥ 1 CFU/100 mL, and Enterobacteriaceae ≥ 1 CFU/ mL. Turbidity was log10 transformed due to substantial skew in the original scale. This decision was investigated with a sensitivity analysis comparing results on the transformed and original scale. Descriptive statistics tables were created based on these finalized outcomes.
To evaluate the effect of filtration media composition on water quality outcomes, separate statistical models were fitted for each parameter. Physicochemical outcomes and BOD5 were modeled as continuous, using linear mixed-effects models. Specifically, models took the form:
Y i j = β 0 + β 1 ( Filter   Type ) j + β 2 ( Sample   Number ) i j + β 3 ( Filter   Type × Sample   Number ) i j + b j + ε i j
where Y ij denotes the continuous outcome measured at sampling occasion i for filtration unit j . Fixed effects β 0 β 3 represent population-level effects, b j is a random intercept for block, and ε i j represents residual error.
The remaining microbiological outcomes were modeled as binary, using generalized linear mixed-effects models with a logit link. These models took the form:
l o g i t Pr Y i j = 1 = β 0 + β 1 ( Filter   Type ) j + β 2 ( Sample   Number ) i j + β 3 ( Filter   Type × Sample   Number ) i j + b j
where Y ij denotes the binary presence (1) or absence (0) of detecting the outcome at sampling occasion i for filtration unit j , fixed effects β 0 β 3 represent population-level effects, and b j is a random intercept for each block.
These mixed-effects models were selected to account for the hierarchical and longitudinal structure of data collection, with measurements collected over time within each filtration unit and across multiple blocks. All models included random intercepts for each block, which represented the geographic area in which the filter module unit was installed, to account for shared variance among samples within each block. Each filter module belonged to a single geographic block, and each block contained all filter types. Chronological sample number and interactions between filtration type and sample number were considered as fixed effects to test for temporal trends and differences in trends across filters. The interaction term tests whether the rate of change in the outcome over time differs by filtration type.
Autocorrelation was assessed using residual diagnostics and likelihood ratio tests comparing models with and without a first-order autoregressive (AR) structure. The AR structure was ultimately retained in all physicochemical models, but not the BOD5 model. Sensitivity analyses were conducted to investigate the potential impacts of excluding this AR structure. Omnibus Wald tests were used to evaluate the overall effect of filtration type, with post hoc pairwise comparisons between filtration types conducted using estimated marginal means and Tukey-adjusted p-values. Analyses were conducted in R version 4.5.0 [23].

3. Results

3.1. Physicochemical Parameters

From May 2024 to May 2025, we completed a total of 26 sequential sampling events. During this time, 385 samples were collected from the 16 experimental units. Some of the filters had fewer samples collected during this time, including a filter that was damaged during a storm and taken out of service in August 2024.
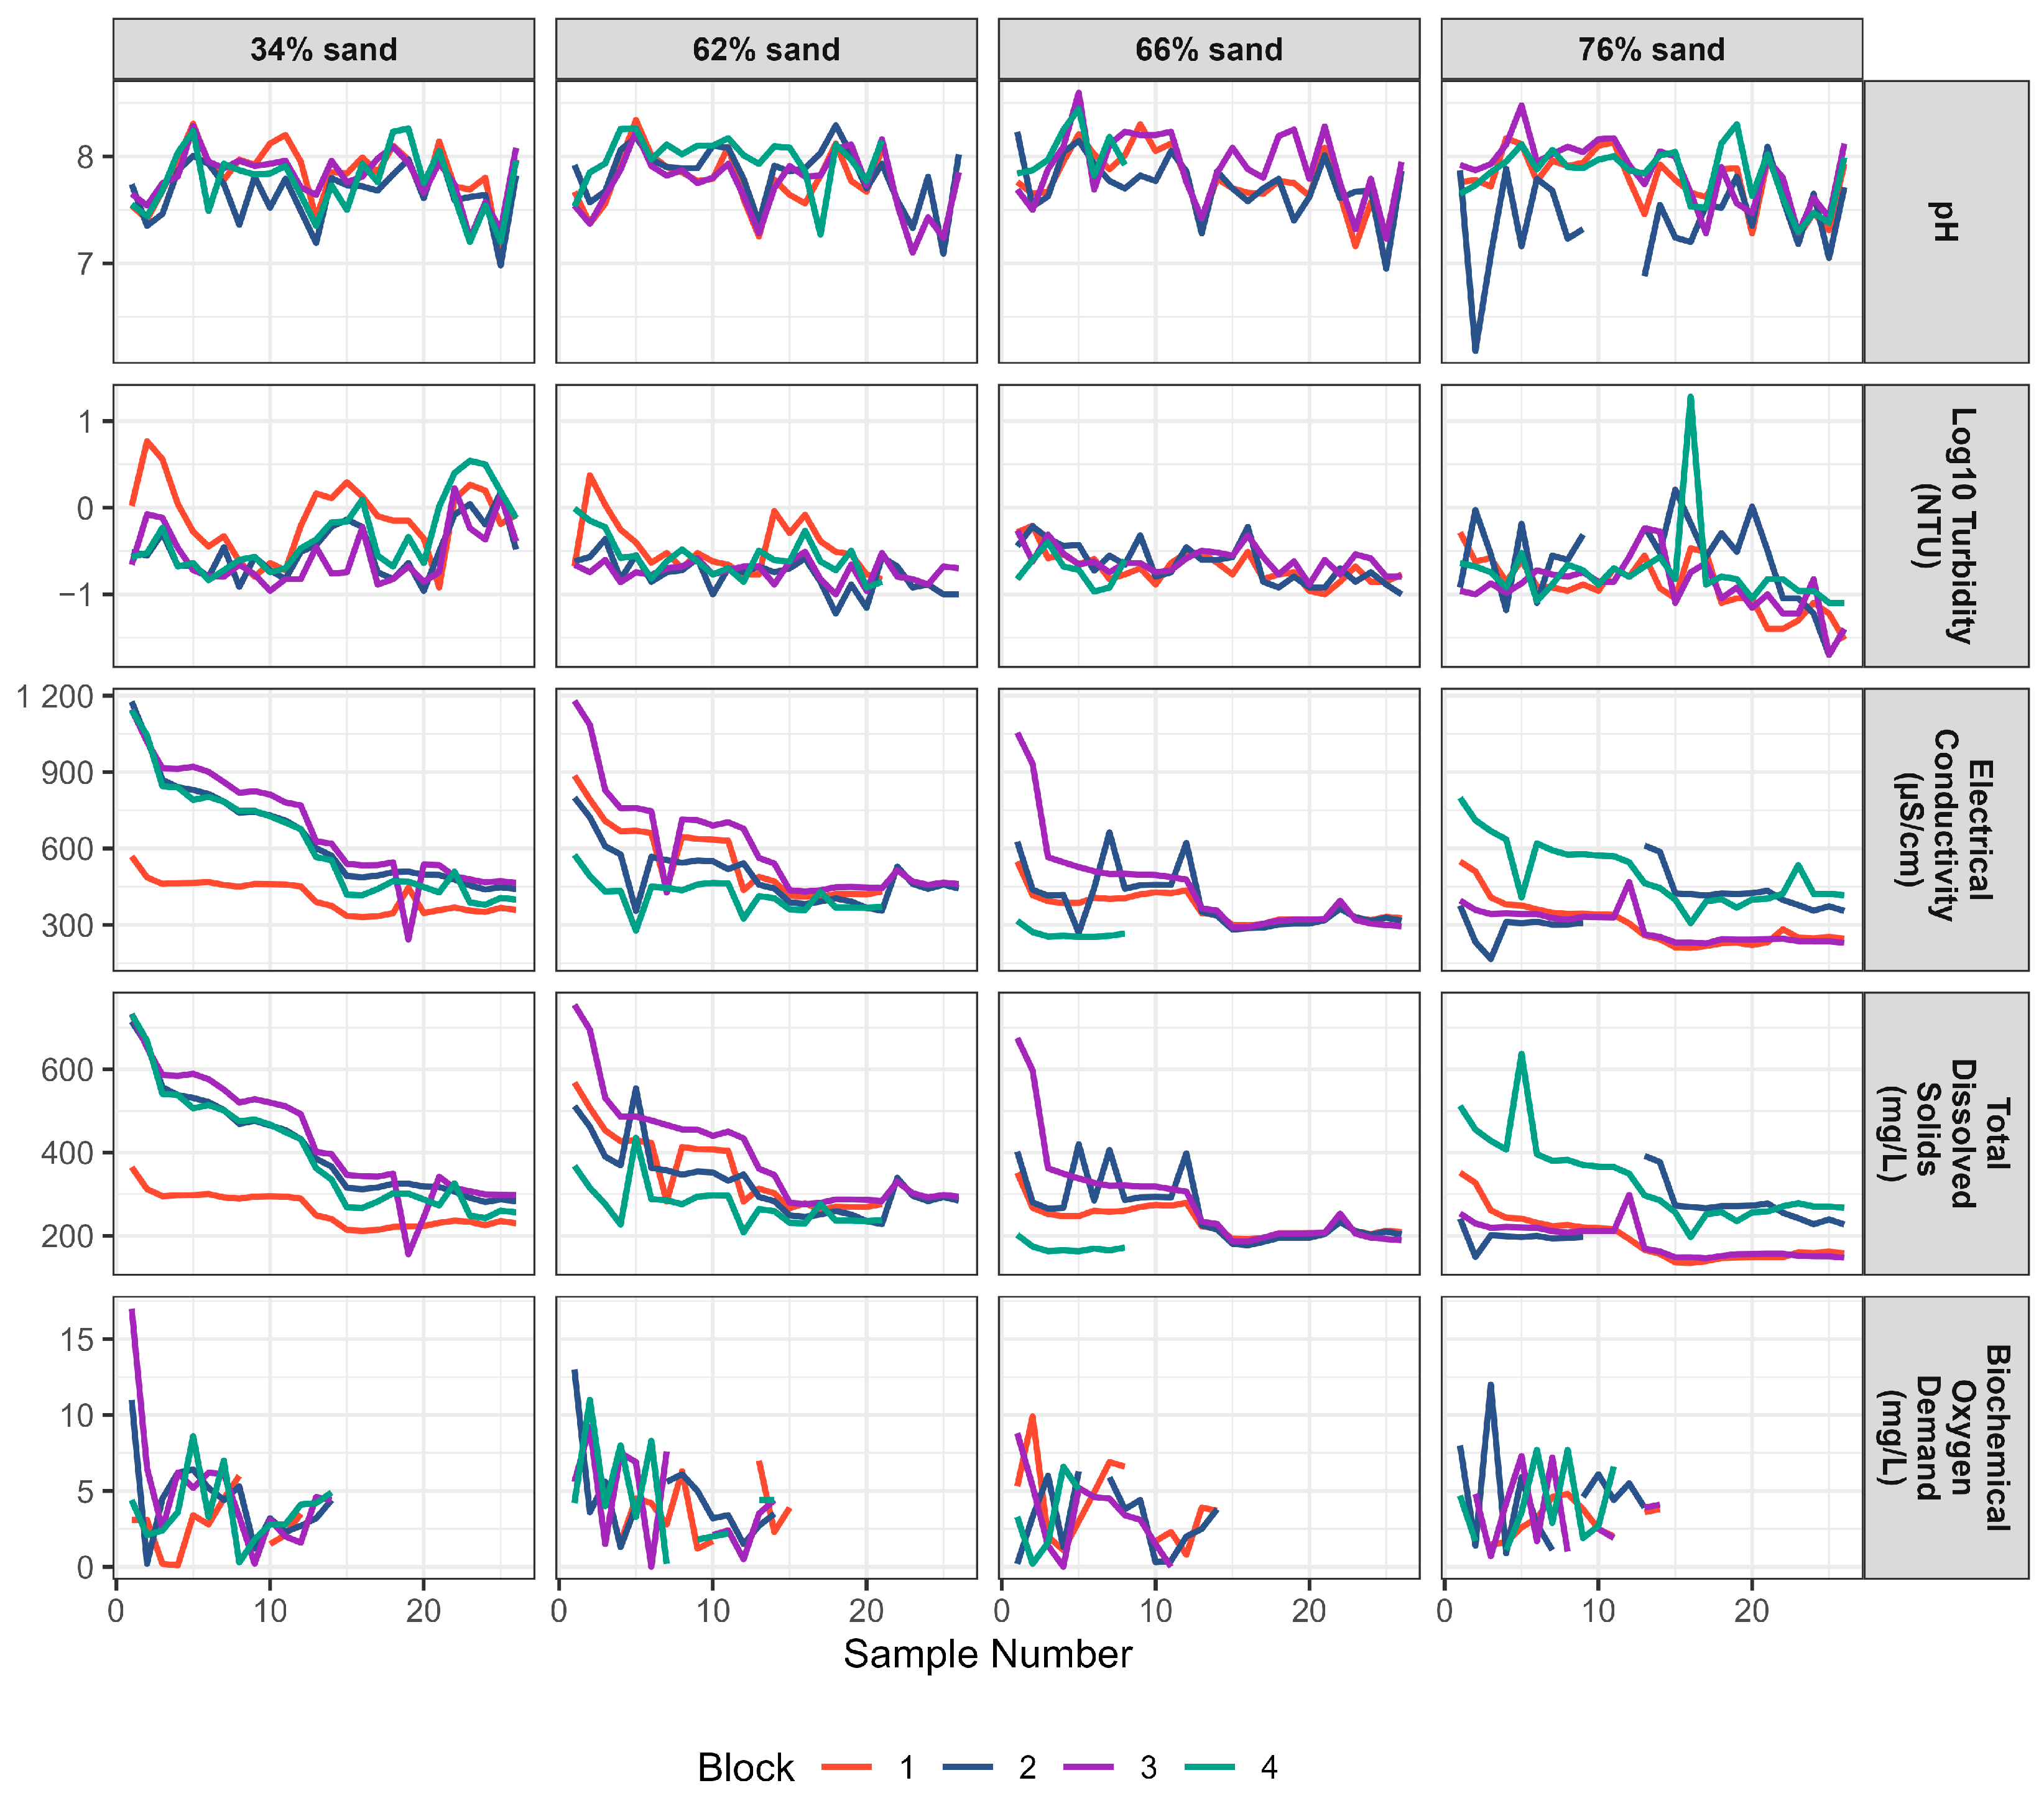
All filters produced water quality within standards for drinking water for the Dominican Republic (pH 6.5–8.5, EC (50–1500 μs/cm), TDS (100–1000 mg/L) and turbidity < 0.5 NTU) although in some cases turbidity exceeded 0.5 NTU [22]. It is important to note that the physicochemical quality generally improved over time for each filter and block as shown in Figure 3. TDS and EC both exhibited trends of decreasing concentration over time. In addition, TDS and EC both exhibited overall lower values for filters with higher proportions of sand. As the percentage of sand increased, the initial values of TDS and EC decreased in early samples, and therefore the variability across blocks decreased. Initial TDS values were as high as 700 mg/L in the filters with 34% sand while most were below 400 mg/L for the filters with 76% sand.
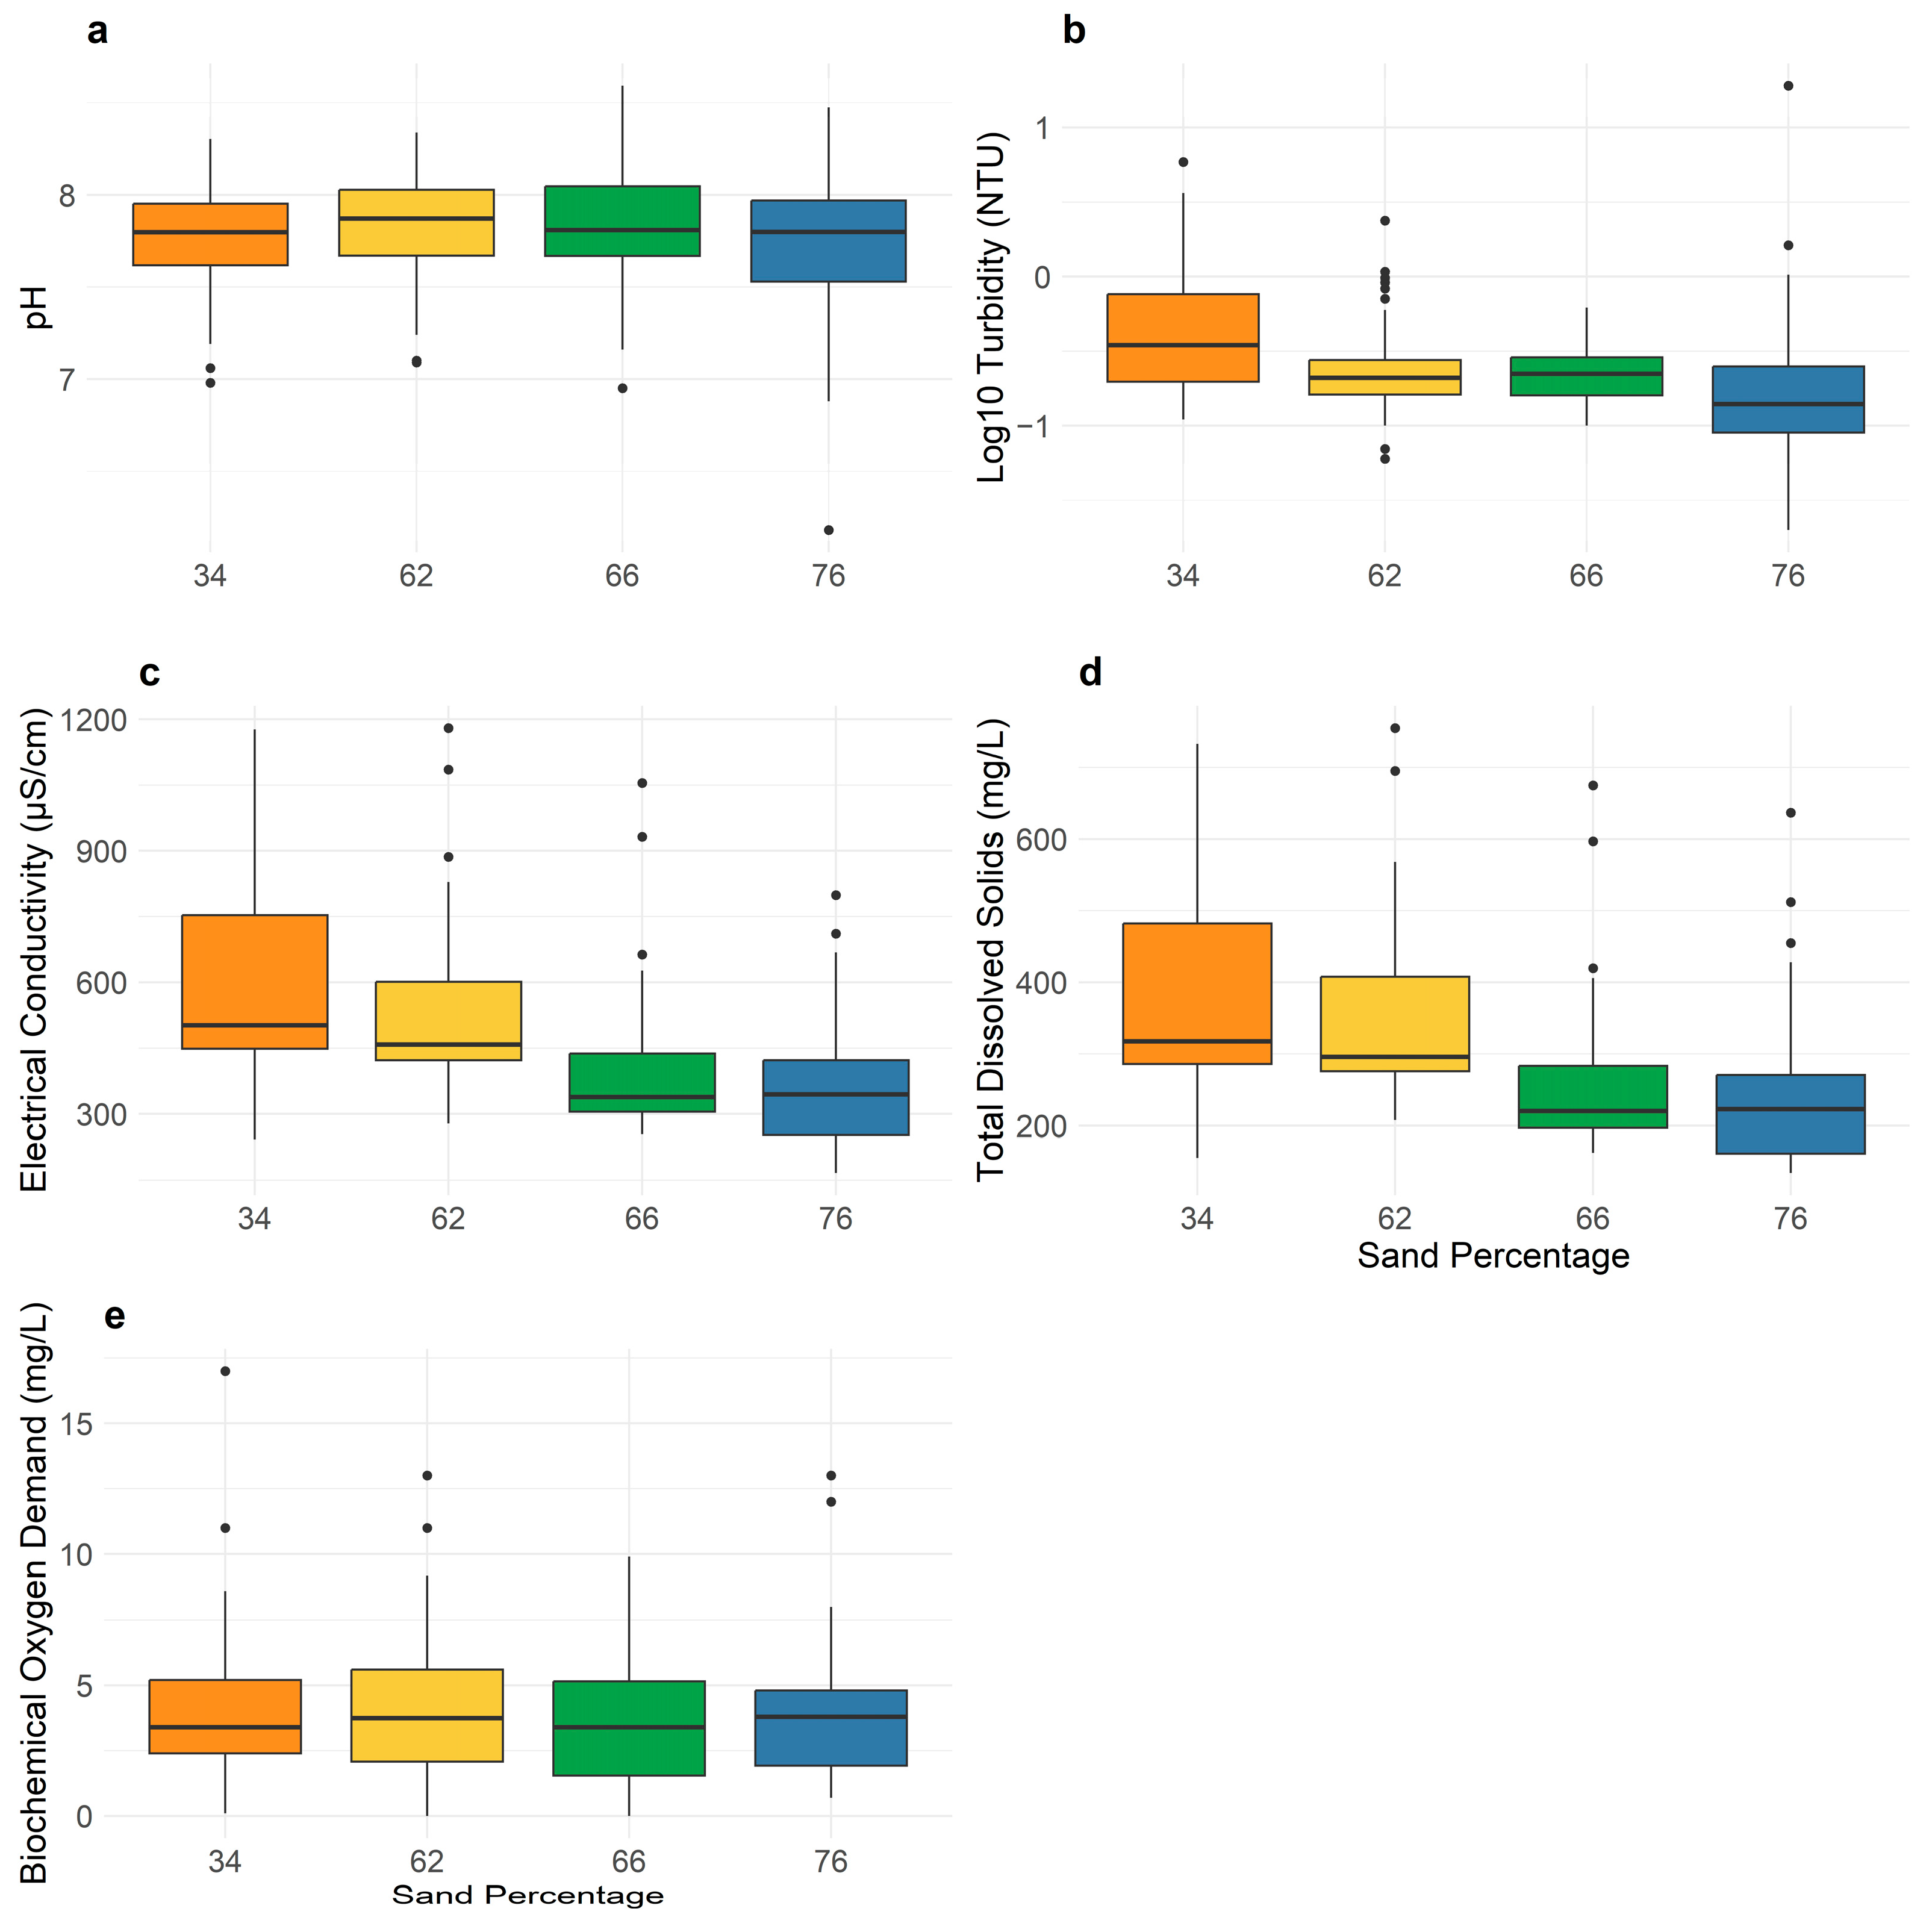
Descriptive summaries for the physicochemical parameters, including pH, NTU, EC, TDS and BOD5, are provided in Figure 4. While the pH and BOD5 remained relatively stable across filters, NTU, EC and TDS generally decreased with higher proportions of sand. Based on the descriptive investigation summarized in Figure 3 and Figure 4, two points were identified as potential outliers: a pH value of 6.18 and a log10 NTU value of 1.28, where both were obtained from 76% sand filters but from different blocks and sample numbers. The models were fitted with and without the outliers. Removal of the pH outlier changed the model findings, and the final model reflects data without the pH outlier. The NTU outlier did not change the overall findings and was left in the model.
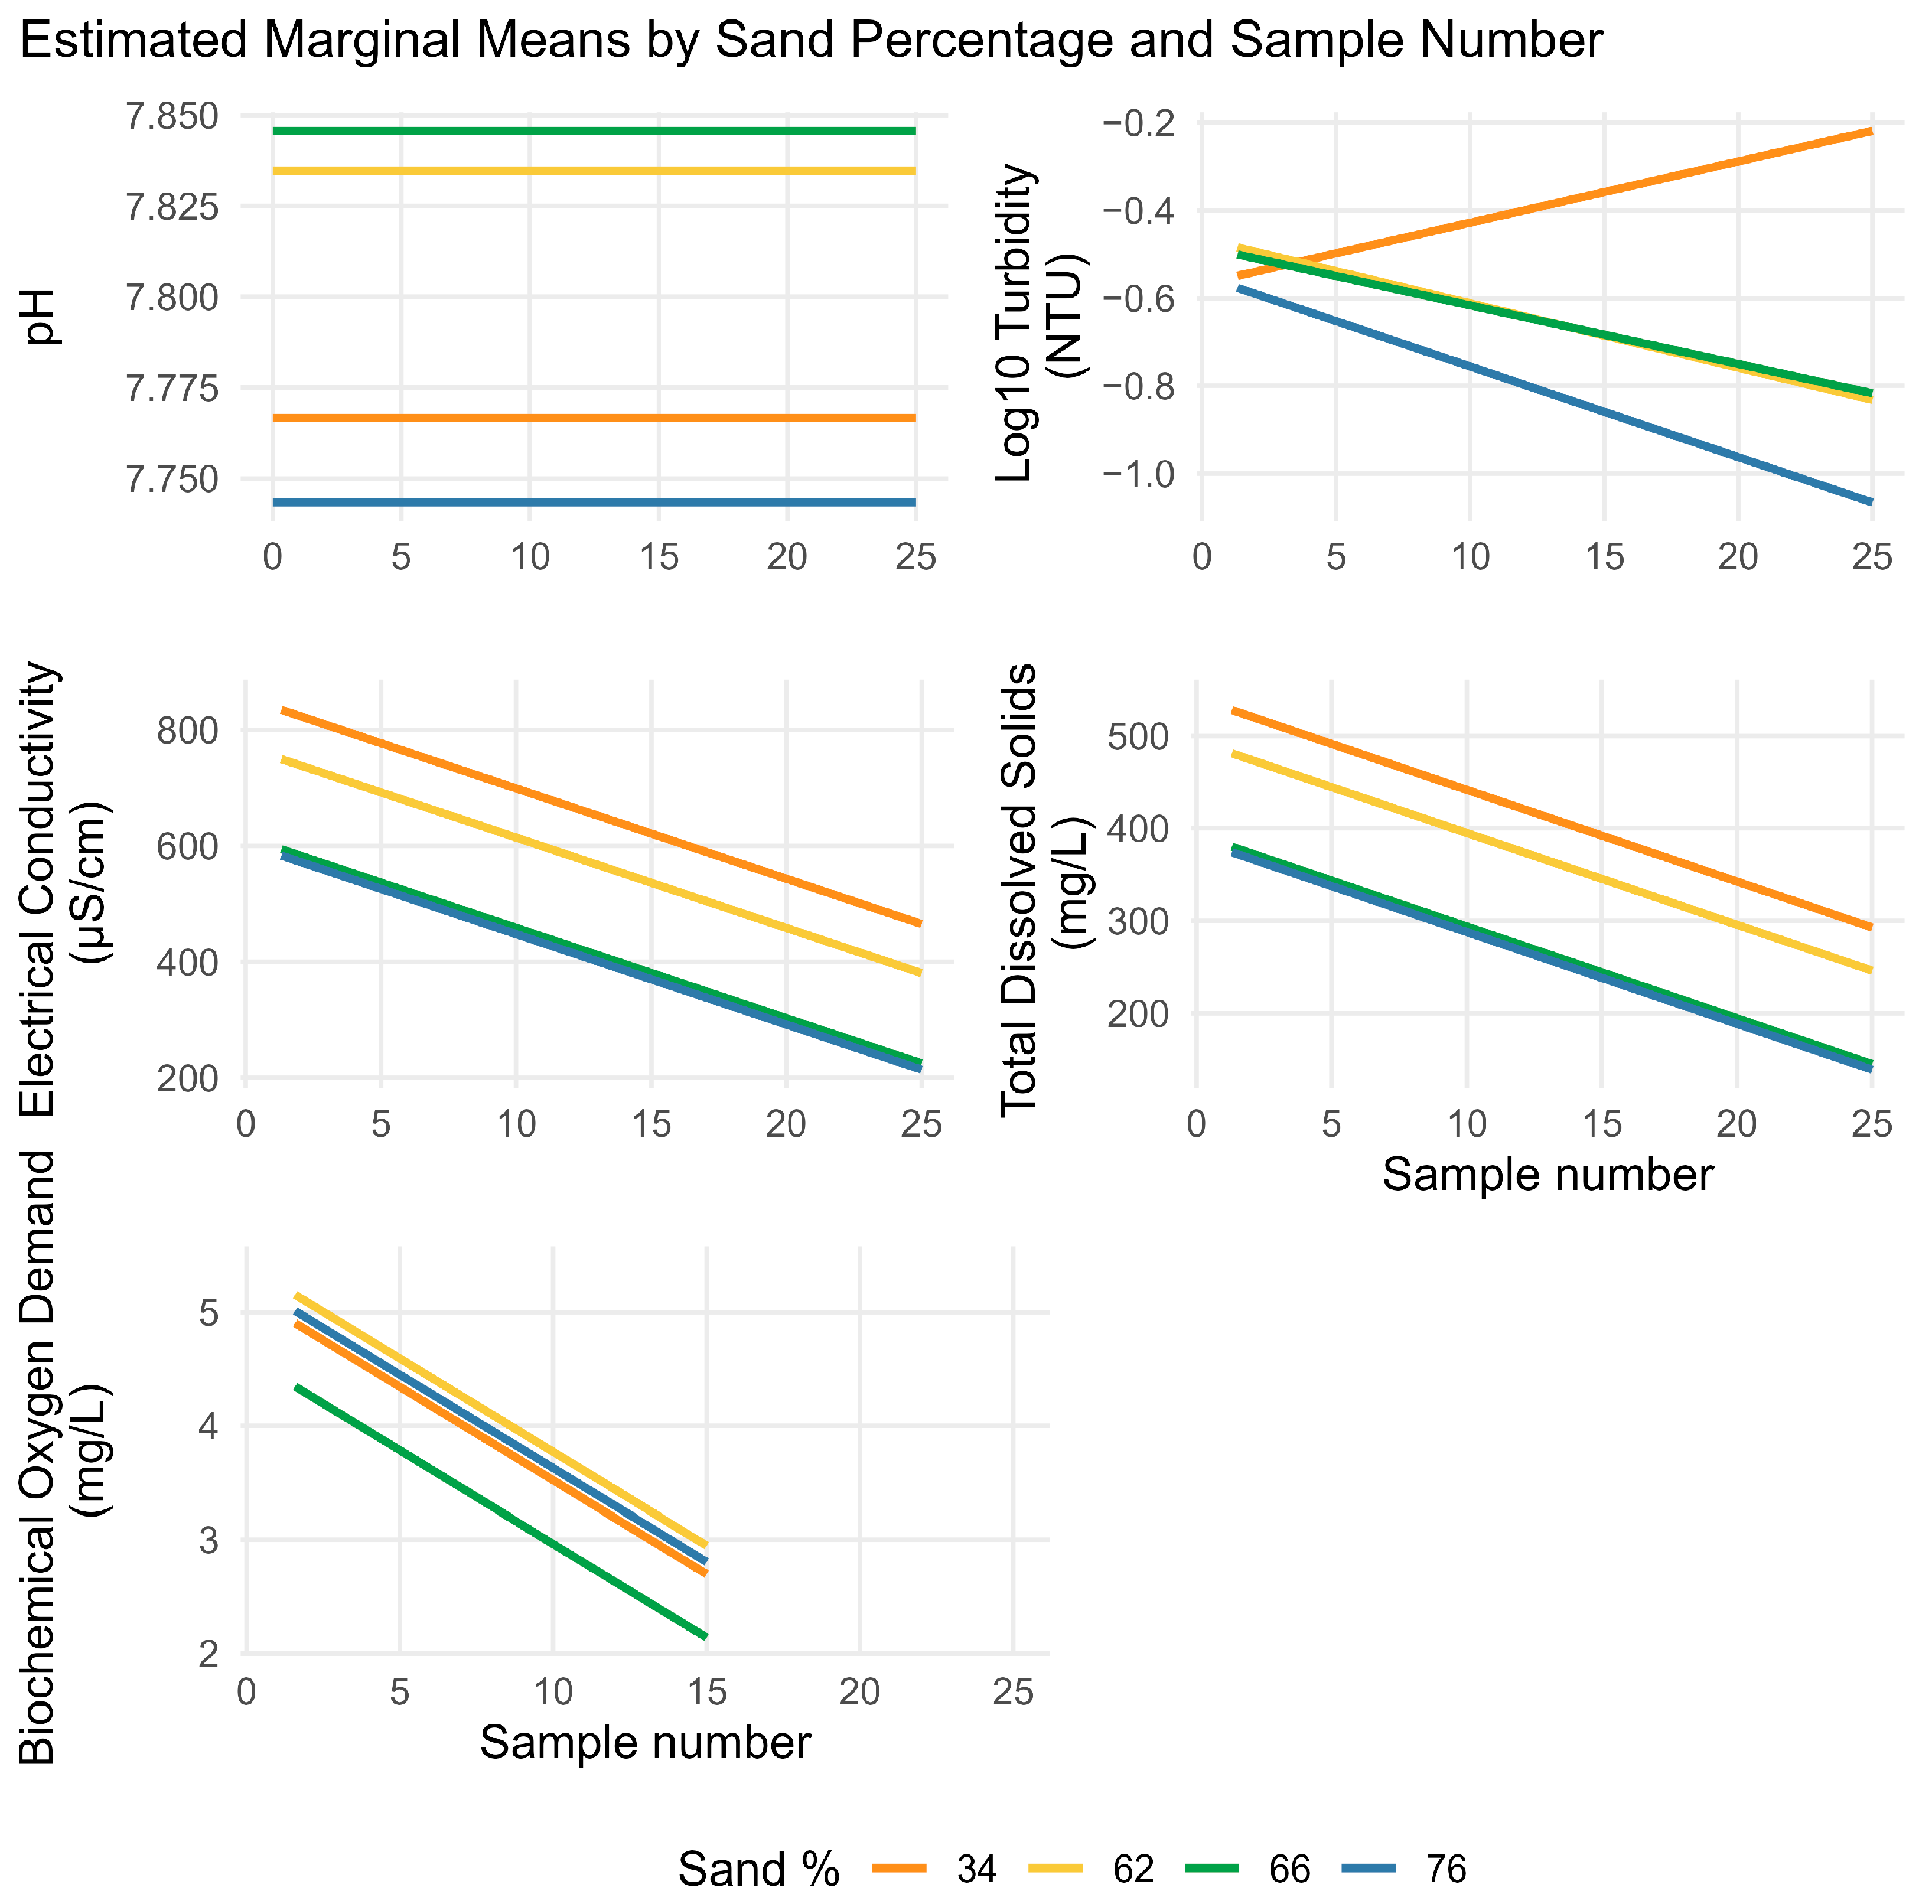
In Table 1 are the estimated marginal means from linear mixed-effects models used to model the physicochemical parameters. The plots of the estimates are provided in Figure 5. The models for EC, TDS, and BOD5 included significant trends over sample number (EC: b = −15.58, t(377) = −6.56, p < 0.0001; TDS: b = −9.94, t(377) = −6.70, p < 0.0001; BOD5: b = −0.16, t(185) = −3.46, p < 0.001) and the model for log10 NTU included a significant interaction between filter and sample number (F(3,377) = 5.78, p < 0.001). Post hoc pairwise comparisons of estimated marginal means revealed significant differences in TDS between 34% sand filters and 66% sand filters (est = 147.96, t(377) = 2.93, p = 0.019) and between 34% sand filters and 76% sand filters (est = 153.99, t(377) = 3.14, p = 0.010). We similarly found significant differences in EC between 34% sand and 66% sand filters (est = 240.3, t(377) = 2.85, p = 0.024) and between 34% sand and 76% sand filters (est = 251.2, t(377) = 3.06, p = 0.013). We also found significant differences in NTU over time, with significant slope differences between 34% sand and 62% sand filters (est. slope diff. = 0.028, t(373) = 2.98, p = 0.016), 34% and 66% sand filters (est. slope diff. = 0.026, t(373) = 2.90, p = 0.021), and 34% and 76% sand filters (est. slope diff. = 0.034, t(373) = 3.86, p = 0.001). The results highlight the overall trend for all filters that EC, TDS, BOD5, and turbidity were reduced during operation of the filters and that the filter media composition had an important impact on water quality parameters especially between filters with 34% sand and those with 66% and 76% sand.
Sensitivity analyses investigating the decision to transform NTU found that, on the original scale, the 34% sand filter continued to perform worse than other filters but evidence for temporal and filter-by-time effects were attenuated. Sensitivity analyses for models excluding the AR correlation structures indicated that results for pH and NTU models were consistent across specifications. For EC and TDS, models without AR structures exhibited less variability in estimates, resulting in statistically significant differences between the 34% sand and 62% sand filters that were not present in models that included AR structures. The point estimates remained similar between models with and without AR structures.

3.2. Microbiological Parameters

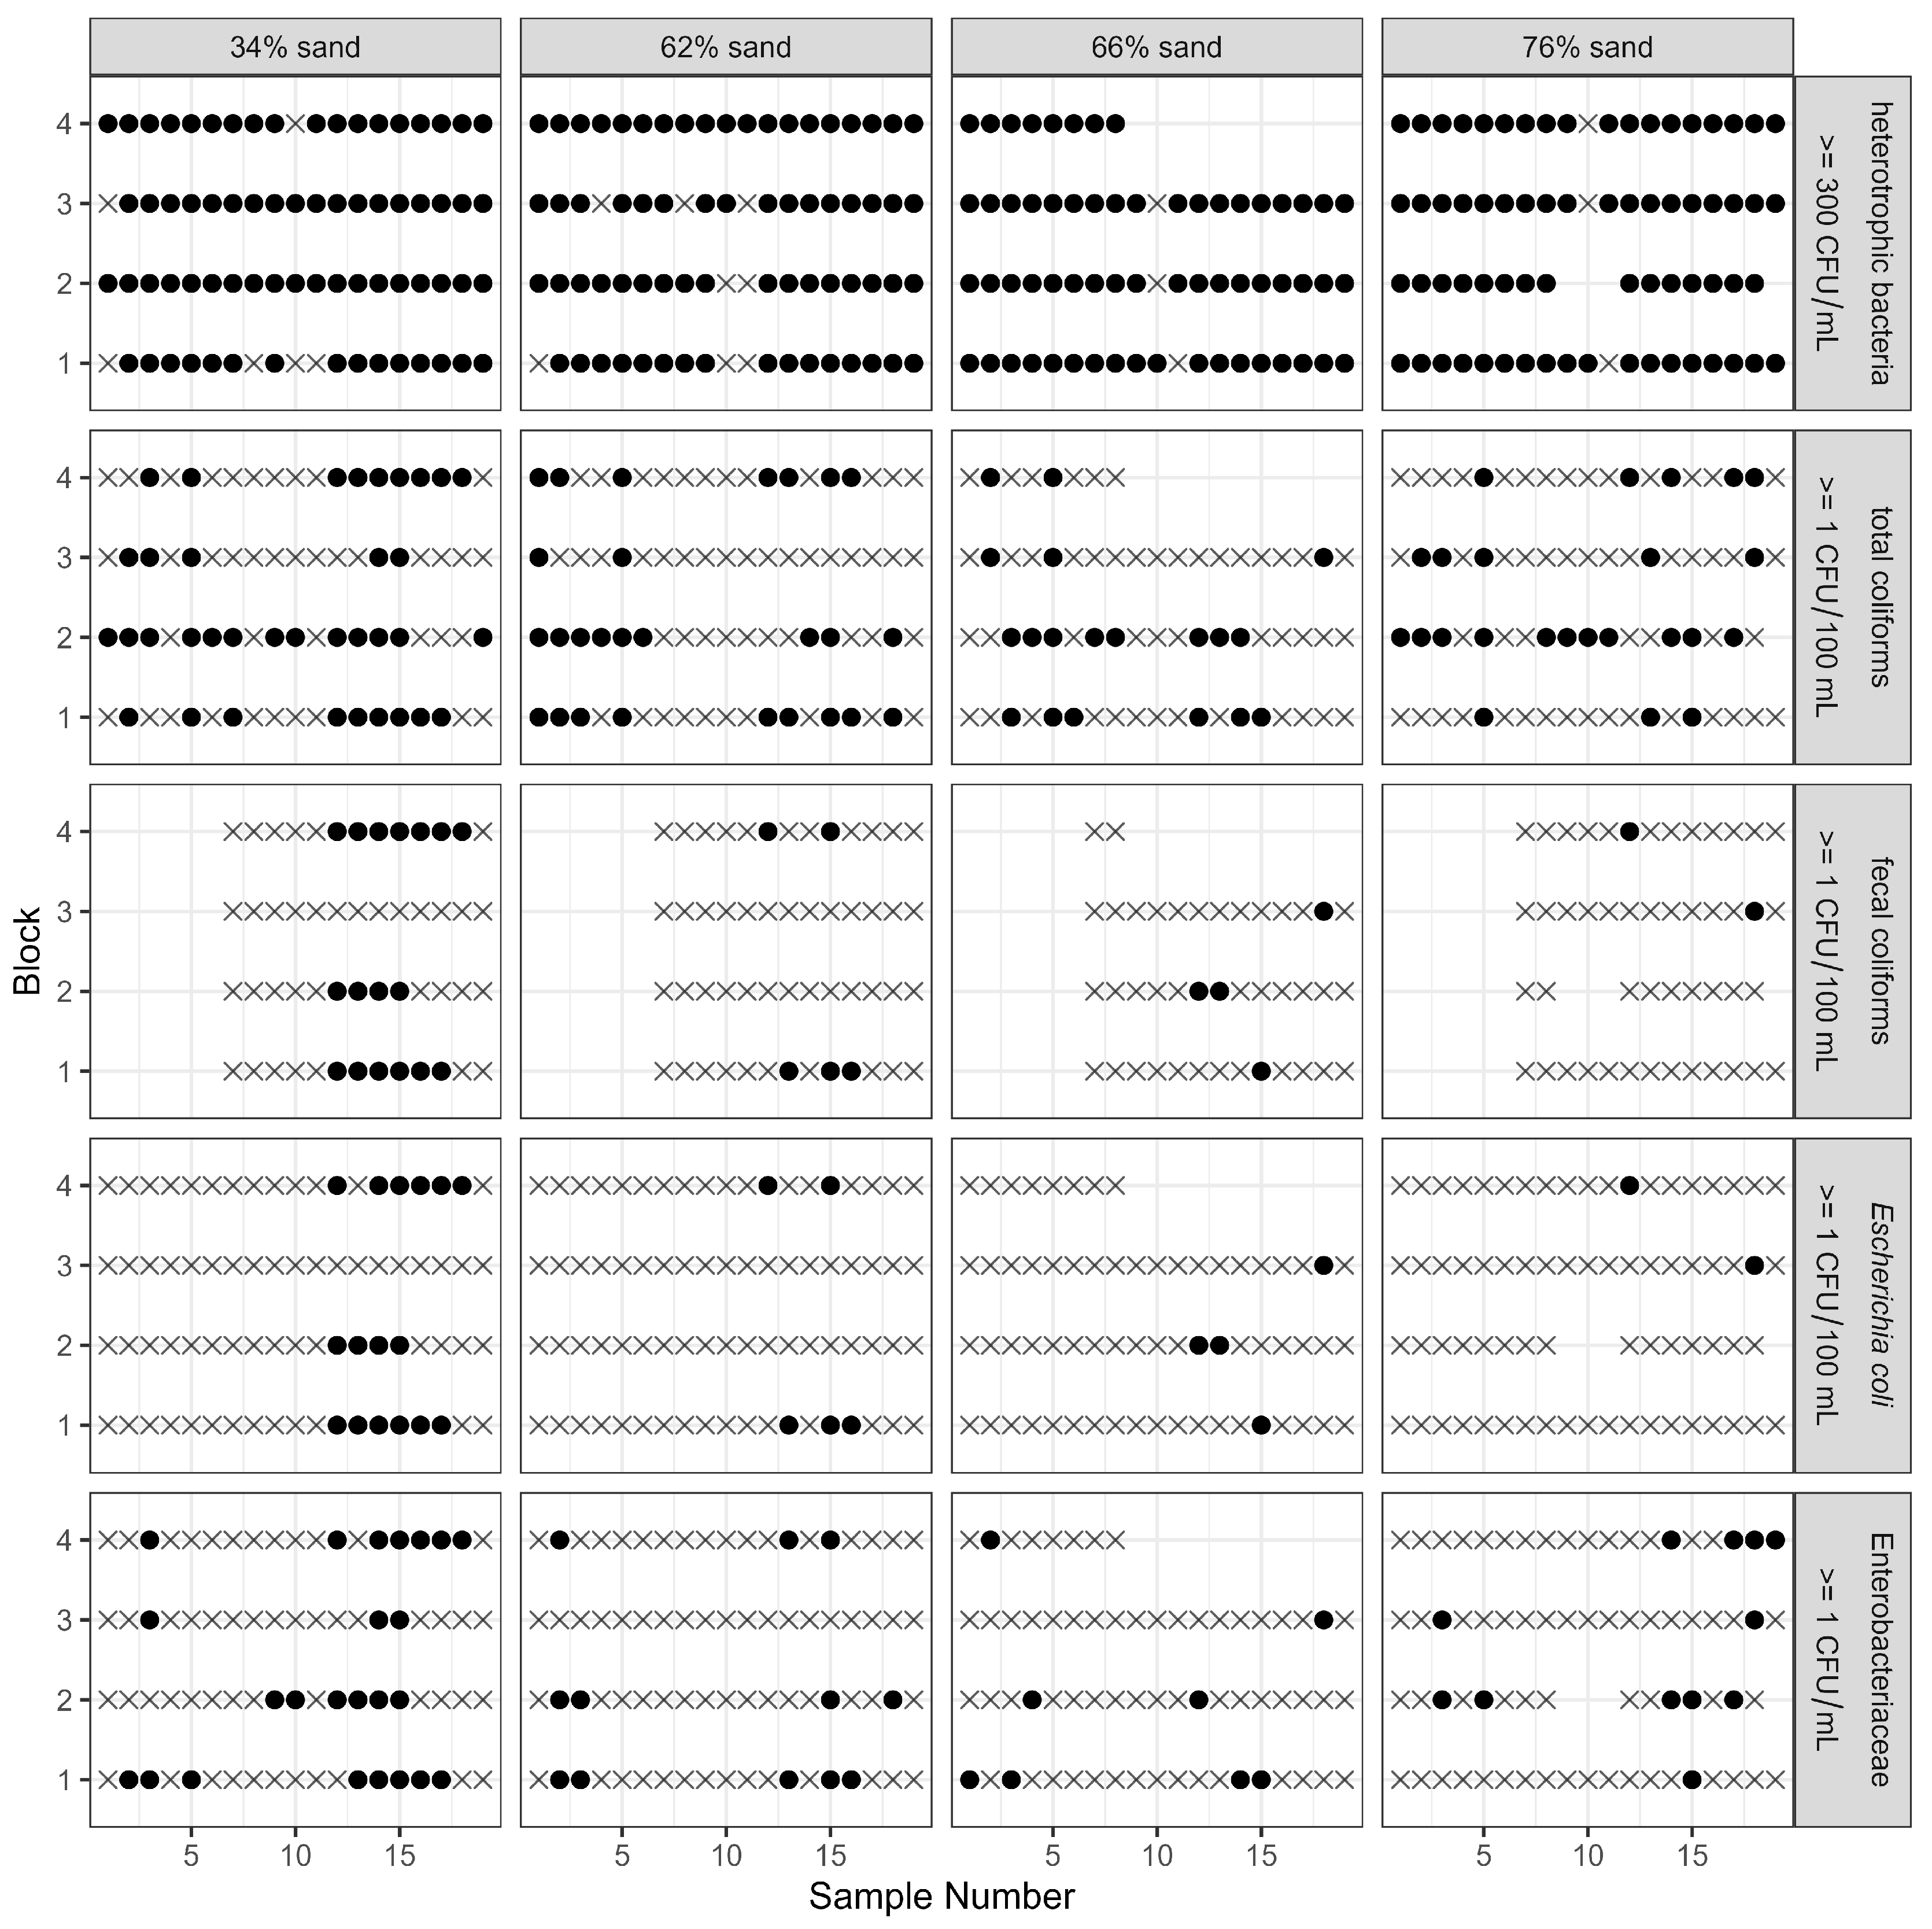
During the sampling period, a total of 289 samples were collected and processed for five microbiological parameters. There were 19 separate sequential sampling events, although fecal coliforms were not measured until the seventh sequential sampling event. Additional missing data occurred for a filter unit because it was damaged and taken out of service in August 2024. As shown in Figure 6, microbiological indicator presence varied over time and within each experimental block. Notably, the presence of fecal coliforms and E. coli bacteria in the water samples appeared only after the 11th sequential sampling and was the most frequent for the filters with 34% sand. After the 12th sampling event (which occurred on 14 October 2024), three out of four filters with 34% sand samples were positive for fecal coliforms and E. coli. The presence of E. coli and fecal coliforms coincided with a large flood that disrupted filter operation for approximately four weeks.
The predicted probabilities for the proportion of positive samples for HPC, total coliforms, fecal coliforms, E. coli and Enterobacteriaceae are provided in Table 2. The proportion of sand in the filter did not correspond to statistically significant differences for HPC (χ2(3) = 3.01, p = 0.388) or total coliforms (χ2(3) = 6.34, p = 0.096). However, there were statistically significant differences by filter type for the other three parameters: fecal coliforms (χ2(3) = 16.55, p = 0.001), E. coli2(3) = 15.25, p = 0.002), and Enterobacteriaceae (χ2(3) = 9.61, p = 0.022). There were also significant temporal effects for E. coli (OR = 1.2, z = 4.33, p < 0.001) and Enterobacteriaceae (OR = 1.06, z = 2.12, p = 0.034), suggesting that the presence of the microbiological parameters became more common over time. Post hoc pairwise comparisons of estimated marginal means indicated higher odds of fecal coliform presence for the 34% sand filters compared to the 62% sand filters (OR = 4.90, 95% CI [1.15, 20.95], z = 2.81, p = 0.026) and for the 34% sand filters compared to the 76% sand filters (OR = 12.37, 95% CI [1.64, 93.47], z = 3.20, p = 0.008). Similarly, we found higher odds of E. coli presence for the 34% sand filters compared to the 62% sand filters (OR = 4.85, 95% CI [1.07, 21.90], z = 2.69, p = 0.036) and for the 34% sand filters compared to 76% sand filters (OR = 12.68, 95% CI [1.60, 100.50], z = 3.15, p = 0.009). Despite the significant Wald test, no pairwise comparisons were significant for Enterobacteriaceae presence after adjusting for multiple post hoc pairwise tests. Unlike the physicochemical parameters, the microbiological parameters more frequently exceeded Dominican regulatory standards for drinking water for HPC (<200/mL) as well as total coliforms and E. coli. (<1/100 mL) [22].

4. Discussion

This study examined a novel approach to rainwater harvesting using direct capture of rainwater into planter boxes with pre-filtration and storage. These filters were operated for one year demonstrating the potential longevity of the collection systems. Despite variable weather patterns and one large flooding event, the results provide insights into functioning and operation with a comprehensive monitoring of physicochemical and microbiological quality. All four filter media compositions tested produced water that would consistently meet Dominican drinking water standards [22] for pH, electrical conductivity, total dissolved solids and turbidity. Less clear was the ability of the current design to meet bacteriological drinking water standards without additional treatment as these standards were frequently exceeded. However, filter media with a higher proportion of sand resulted in higher compliance for indicators such as E. coli.
Due to the unique design of our rainwater harvesting system, we do not have an untreated sample as a comparison. However, our results are in line with similar results for both physicochemical parameters and microbiological parameters collected from traditional rainwater harvesting systems [24]. In comparison with a study in Colombia, our system produced comparable water quality in terms of physicochemical parameters such as EC, TDS and turbidity compared to traditional systems even after they employed treatment systems or first flush diversion [25]. Furthermore, our results for bacteriological water quality demonstrated higher water quality for E. coli compared to drinking rainwater samples provided by households in the Dominican Republic which found that ~40% of rainwater samples > 10 E. coli MPN per 100 mL [26].
When considering appropriate system design, we found that filter media composition significantly influenced the quality of the harvested rainwater. Filters with higher sand content (76% and 66%) demonstrated overall lower EC and TDS levels in product water, as well as lower turbidity levels. This suggests that increasing the proportion of sand in rainwater harvesting filters of this pre-filter design can enhance the quality of the collected water. It is possible that filters with less sand exhibited higher levels of dissolved solids due to the presence of silt and clay resulting in the flushing of those materials during filter operation. Previous work has also documented that sand filters are effective in treating rainwater to remove both chemical and physical contaminants in rainwater [27,28].
Microbiological analysis further supported these findings revealing that filters with higher sand content also had lower levels of total coliforms, fecal coliforms, and E. coli. The presence of E. coli bacteria was significantly reduced in filters with 76% sand compared to filters with 34% sand. It is possible that a higher percentage of sand was effective in preventing microbiological contamination or possibly in reducing or slowing the growth of microbiological contamination in this design [29]. It is important to note that the indicators of potential fecal contamination, such as fecal coliforms or E. coli, did not appear until later in the sampling process, after a large flood where the overflow of muddy waters could have easily introduced contamination. Despite this event, only the filters with 34% sand were consistently positive for these bacterial indicators suggesting important considerations for future design to reduce the potential for bacterial contamination.
In our study, bacterial indicators of fecal contamination were infrequently present but not absent. However, bacterial contamination is frequent in traditional rainwater harvesting systems which are commonly prone to fecal contamination [24]. It is a critical next step to consider what additional disinfection should be provided to prevent or reduce bacterial contamination and protect water during storage [30,31]. In future work on this design, more could be undertaken to determine the source of these bacteria. In addition to the large rainfall event with flooding, the filters could have been subject to surface-level contamination by wild animals in the area. Furthermore, the storage of drinking water may impact water quality deterioration that a residual disinfectant such as a low dose of chlorine could prevent.
The temporal analysis of the physicochemical parameters indicated that EC, TDS, turbidity and BOD5 decreased over time. This trend highlights the dynamic nature of rainwater quality and the potential for further improvements with continued use and optimization of the filter units. Filter flushing and filter maturation are likely to function together to improve water quality as is common in both slow and rapid sand filtration [32,33]. The reduction in variability of these parameters suggests that the system becomes more stable and reliable with prolonged operation. While the filter design here is not intended to be slow sand filtration, stabilization and biological optimization within sand filtration can also enhance water quality [34]. The temporal trend that indicated increased bacterial presence was likely due to their appearance after the flooding event. Additional sampling of the system has since been completed and it will be important to understand whether the bacteria remain detectable or were eventually reduced after continued operation.

5. Conclusions

Overall, this study provides an important contribution to our understanding of the potential to use a novel rainwater capture system during one year of operation. The pilot test demonstrated that the water captured was of high quality and that the design may allow for domestic water usage. Overall, the results of this study demonstrate the viability of using rainwater harvesting systems with optimized filter compositions to help address some of the drinking water deficit in Santiago. By implementing filters with higher sand content, it is possible to achieve significant improvements in both physicochemical and microbiological water quality. Important next steps will be to optimize filter design and determine what additional features would enable capture and storage to support use across domestic needs including drinking water. Currently, the Dominican Republic relies heavily on bottled water for drinking [35] but increasing concerns about the sustainability of that approach require alternatives and domestic rainwater harvesting may provide one.

Supplementary Materials

The following supporting information can be downloaded at: https://www.mdpi.com/article/10.3390/w18101158/s1, Data File S1: Analytic data analyzed rainwater quality.

Author Contributions

Conceptualization, C.E.C.M. and E.A.D.S.; methodology, C.E.C.M., E.A.D.S., C.E.S., K.E.N.; software, K.E.N.; validation, K.E.N., E.A.D.S. and C.E.C.M.; formal analysis, C.E.C.M., E.A.D.S., K.E.N., J.O.P., C.E.S.; investigation, C.E.C.M., E.A.D.S., C.E.S., K.E.N., J.O.P.; resources, C.E.C.M., E.A.D.S.; data curation, C.E.C.M., E.A.D.S.; writing—original draft preparation, C.E.S., K.E.N., C.E.C.M., E.A.D.S., J.O.P.; writing—review and editing, C.E.S., C.E.C.M., E.A.D.S., J.O.P., K.E.N.; visualization, K.E.N.; supervision, C.E.C.M., E.A.D.S., C.E.S.; project administration, C.E.C.M., E.A.D.S.; funding acquisition, C.E.C.M., E.A.D.S. All authors have read and agreed to the published version of the manuscript.

Funding

This research was funded by Ministerio de Educación Superior, Ciencia y Tecnología (MESCyT/FONDOCyT) and article processing charges were waived.

Data Availability Statement

The original contributions presented in this study are included in the article/Supplementary Materials. Further inquiries can be directed to the corresponding author.

Acknowledgments

The authors would like to acknowledge the contributions of MESCyT/FONDOCyT, Universidad ISA, Jardín Botánico de Santiago, Edmundo A. Cruz G., students from the Universidad ISA: Miguel A. Jiménez, Luis R. Carrasco, Geidy Peña, Wilme González, Scarlet Betances, Stuart Pion, Naykeze Alesis, Ludmia Lazare, Emelin Diloné, and Wilmy Santos, and the laboratorians who assisted with processing the samples.

Conflicts of Interest

The authors declare no conflicts of interest. The funders had no role in the design of the study; in the collection, analyses, or interpretation of data; in the writing of the manuscript; or in the decision to publish the results.

Abbreviations

The following abbreviations are used in this manuscript:
BOD5Biochemical oxygen demand over 5 days
CIConfidence interval
CFUColony forming units
ECElectrical conductivity
HPCHeterotrophic plate count
NTUNephelometric units
OROdds ratio
TDSTotal dissolved solids

References

  1. Madani, K. Global Water Bankruptcy: Living Beyond Our Hydrological Means in the Post-Crisis Era; United Nations: Ottawa, ON, Canada, 2026. [Google Scholar]
  2. Bretas, F.; Casanova, G.; Crisman, T.L.; Embid Irujo, A.; Martin, L.; Miralles-Wilhelm, F.; Muñoz Castillo, R. Water for the Future: Water Security in Latin America and the Caribbean Strategy and Work Plan for the Inter-American Development Bank. 2020. Available online: https://publications.iadb.org/en/water-future-water-security-latin-america-and-caribbean-strategy-and-work-plan-inter-american (accessed on 29 March 2026).
  3. UNICEF. La Mitad de la Población Dominicana Recibe Agua Entre Uno y Tres Días a la Semana. Available online: https://www.unicef.org/dominicanrepublic/comunicados-prensa/unicef-la-mitad-de-la-poblacion-dominicana-recibe-agua-entre-1-y-3-dias-a-la-semana (accessed on 28 May 2025).
  4. Fernández, E. Coraasan reporta déficit de 43 millones de galones diarios por alta turbidez en fuentes de agua. Diario Libre Newspaper, 17 April 2026. Available online: https://www.diariolibre.com/actualidad/nacional/2026/04/17/coraasan-reporta-deficit-de-43-millones-galones-diarios-por-vaguada/3506317 (accessed on 29 March 2026).
  5. Martínez-Espiñeira, R.; Pérez-Urdiales, M. Water affordability challenges in Latin America and the Caribbean: Accounting for coping costs due to reliance on multiple, non-exclusive sources. World Dev. 2025, 186, 106825. [Google Scholar] [CrossRef]
  6. Campisano, A.; Butler, D.; Ward, S.; Burns, M.J.; Friedler, E.; DeBusk, K.; Fisher-Jeffes, L.N.; Ghisi, E.; Rahman, A.; Furumai, H.; et al. Urban rainwater harvesting systems: Research, implementation and future perspectives. Water Res. 2017, 115, 195–209. [Google Scholar] [CrossRef]
  7. Mendez, C.B.; Klenzendorf, J.B.; Afshar, B.R.; Simmons, M.T.; Barrett, M.E.; Kinney, K.A.; Kirisits, M.J. The effect of roofing material on the quality of harvested rainwater. Water Res. 2011, 45, 2049–2059. [Google Scholar] [CrossRef]
  8. Abu-Zreig, M.; Ababneh, F.; Abdullah, F. Assessment of rooftop rainwater harvesting in northern Jordan. Phys. Chem. Earth Parts A/B/C 2019, 114, 102794. [Google Scholar] [CrossRef]
  9. Matta-Ortíz, A.F.; Güiza-Valdes, I.A.; Trujillo-González, J.M.; Rojas-Peña, J.I.; Torres-Mora, M.A.; García-Navarro, F.J.; Jiménez-Ballesta, R. Assessing Rainwater Quality and Harvesting Potential: A Spatial Analysis in a Medium-Sized City of Colombia. Water 2024, 16, 3411. [Google Scholar] [CrossRef]
  10. Choi, J.; Lee, J.; Kim, M.; Lee, J.; Cho, Y. Analysis of Rainwater Quality and Temperature Reduction Effects Using Rainwater Harvesting Facilities. Buildings 2024, 14, 3183. [Google Scholar] [CrossRef]
  11. de Sá Silva, A.C.R.; Bimbato, A.M.; Balestieri, J.A.P.; Vilanova, M.R.N. Exploring environmental, economic and social aspects of rainwater harvesting systems: A review. Sustain. Cities Soc. 2022, 76, 103475. [Google Scholar] [CrossRef]
  12. Alim, M.A.; Rahman, A.; Tao, Z.; Samali, B.; Khan, M.M.; Shirin, S. Feasibility analysis of a small-scale rainwater harvesting system for drinking water production at Werrington, New South Wales, Australia. J. Clean. Prod. 2020, 270, 122437. [Google Scholar] [CrossRef]
  13. Rainwater Harvesting in Vulnerable Homes in Santo Domingo’s Colonial Centre. Available online: https://www.iied.org/rainwater-harvesting-vulnerable-homes-santo-domingos-colonial-centre (accessed on 29 March 2026).
  14. Historical Weather Records. Available online: https://www.timeanddate.com/weather/@3502343/climate (accessed on 29 March 2026).
  15. Bouyoucos, G.J. Hydrometer Method Improved for Making Particle Size Analyses of Soils. Agron. J. 1962, 54, 464–465. [Google Scholar] [CrossRef]
  16. ISO 5667-3:2024; Water Quality—Sampling—Part 3: Guidance on the Preservation and Handling of Water Samples. International Organization of Standardization: Geneva, Switzerland, 2024.
  17. ISO/IEC 17025:2017; SGeneral Requirements for the Competence of Testing and Calibration Laboratories. International Organization of Standardization: Geneva, Switzerland, 2017.
  18. American Public Health Association; American Water Works Association; Water Environment Federation. Standard Methods for the Examination of Water and Wastewater, 24th ed.; Lipps, W.C., Braun-Howland, E.B., Baxter, T.E., Eds.; APHA Press: Washington, DC, USA, 2023. [Google Scholar]
  19. 4500-H+ pH. In Standard Methods for the Examination of Water and Wastewater; APHA Press: Washington, DC, USA, 2023.
  20. ISO 9308-1:2014; Water Quality—Enumeration of Escherichia coli and coliform bacteria—Part 1: Membrane Filtration Method for Waters with Low Bacterial Background Flora. International Organization of Standardization: Geneva, Switzerland, 2014.
  21. ISO 21528-2:2017; Microbiology of the Food Chain—Horizontal Method for the Detection and Enumeration of Enterobacteriaceae—Part 2: Colony-Count Technique. International Organization of Standardization: Geneva, Switzerland, 2017. Available online: https://www.iso.org/standard/63504.html (accessed on 29 March 2026).
  22. Instituto Dominicano Para La Calidad (INDOCAL), Norma Dominicana, Agua Potable, Requisitos (NORDOM 1). 2021. Available online: https://indocalnormas.gob.do/catalogo/ver/nordom-918-medidores-de-agua-para-agua-potable-requisitos-metrol-gicos-y-t-cnicos (accessed on 29 March 2026).
  23. RC Team. R: A Language and Environment for Statistical Computing. 2025. Available online: https://www.R-project.org/ (accessed on 29 March 2026).
  24. de Kwaadsteniet, M.; Dobrowsky, P.H.; van Deventer, A.; Khan, W.; Cloete, T.E. Domestic Rainwater Harvesting: Microbial and Chemical Water Quality and Point-of-Use Treatment Systems. Water Air Soil Pollut. 2013, 224, 1629. [Google Scholar] [CrossRef]
  25. Barriga, F.; Gómez, G.; Diez, M.C.; Fernandez, L.; Vidal, G. Influence of Catchment Surface Material on Quality of Harvested Rainwater. Sustainability 2024, 16, 6586. [Google Scholar] [CrossRef]
  26. Baum, R.; Kayser, G.; Stauber, C.; Sobsey, M. Assessing the Microbial Quality of Improved Drinking Water Sources: Results from the Dominican Republic. Am. Soc. Trop. Med. Hyg. 2014, 90, 121–123. [Google Scholar] [CrossRef]
  27. Wang, J.; David, d.R.; Albert, v.d.W.; Sutton, N.B. Harnessing biodegradation potential of rapid sand filtration for organic micropollutant removal from drinking water: A review. Crit. Rev. Environ. Sci. Technol. 2021, 51, 2086–2118. [Google Scholar] [CrossRef]
  28. Teixeira, C.A.; Ghisi, E. Comparative Analysis of Granular and Membrane Filters for Rainwater Treatment. Water 2019, 11, 1004. [Google Scholar] [CrossRef]
  29. Zhao, Y.; Wang, X.; Liu, C.; Wang, S.; Wang, X.; Hou, H.; Wang, J.; Li, H. Purification of harvested rainwater using slow sand filters with low-cost materials: Bacterial community structure and purifying effect. Sci. Total Environ. 2019, 674, 344–354. [Google Scholar] [CrossRef]
  30. Melo Neto, M.G.d.; Freitas, B.L.S.; Fava, N.N.M.; Sabogal-Paz, L.P. Rainwater treatment system efficiency: Household slow sand filter combined with UVC lamp disinfection. J. Water Process Eng. 2024, 58, 104785. [Google Scholar] [CrossRef]
  31. Giurgiu, M.-G.; Așchilean, I.; Felseghi, R.-A. Assessment of Rainwater Treatment Using Sand and Gravel Filtration and Chlorine Disinfection for Non-Potable Domestic Reuse. Buildings 2025, 15, 3759. [Google Scholar] [CrossRef]
  32. Cescon, A.; Jiang, J.-Q. Filtration Process and Alternative Filter Media Material in Water Treatment. Water 2020, 12, 3377. [Google Scholar] [CrossRef]
  33. Elliott, M.; Stauber, C.E.; DiGiano, F.A.; de Aceituno, A.F.; Sobsey, M.D. Investigation of E. coli and Virus Reductions Using Replicate, Bench-Scale Biosand Filter Columns and Two Filter Media. Int. J. Environ. Res. Public Health 2015, 12, 10276–10299. [Google Scholar] [CrossRef]
  34. Bai, X.; Samari-Kermani, M.; Schijven, J.; Raoof, A.; Dinkla, I.J.T.; Muyzer, G. Enhancing slow sand filtration for safe drinking water production: Interdisciplinary insights into Schmutzdecke characteristics and filtration performance in mini-scale filters. Water Res. 2024, 262, 122059. [Google Scholar] [CrossRef]
  35. McLennan, J.D. Choosing bottled over tapped: Drinking water in the Dominican Republic. J. Water Sanit. Hyg. Dev. 2014, 5, 9–16. [Google Scholar] [CrossRef]
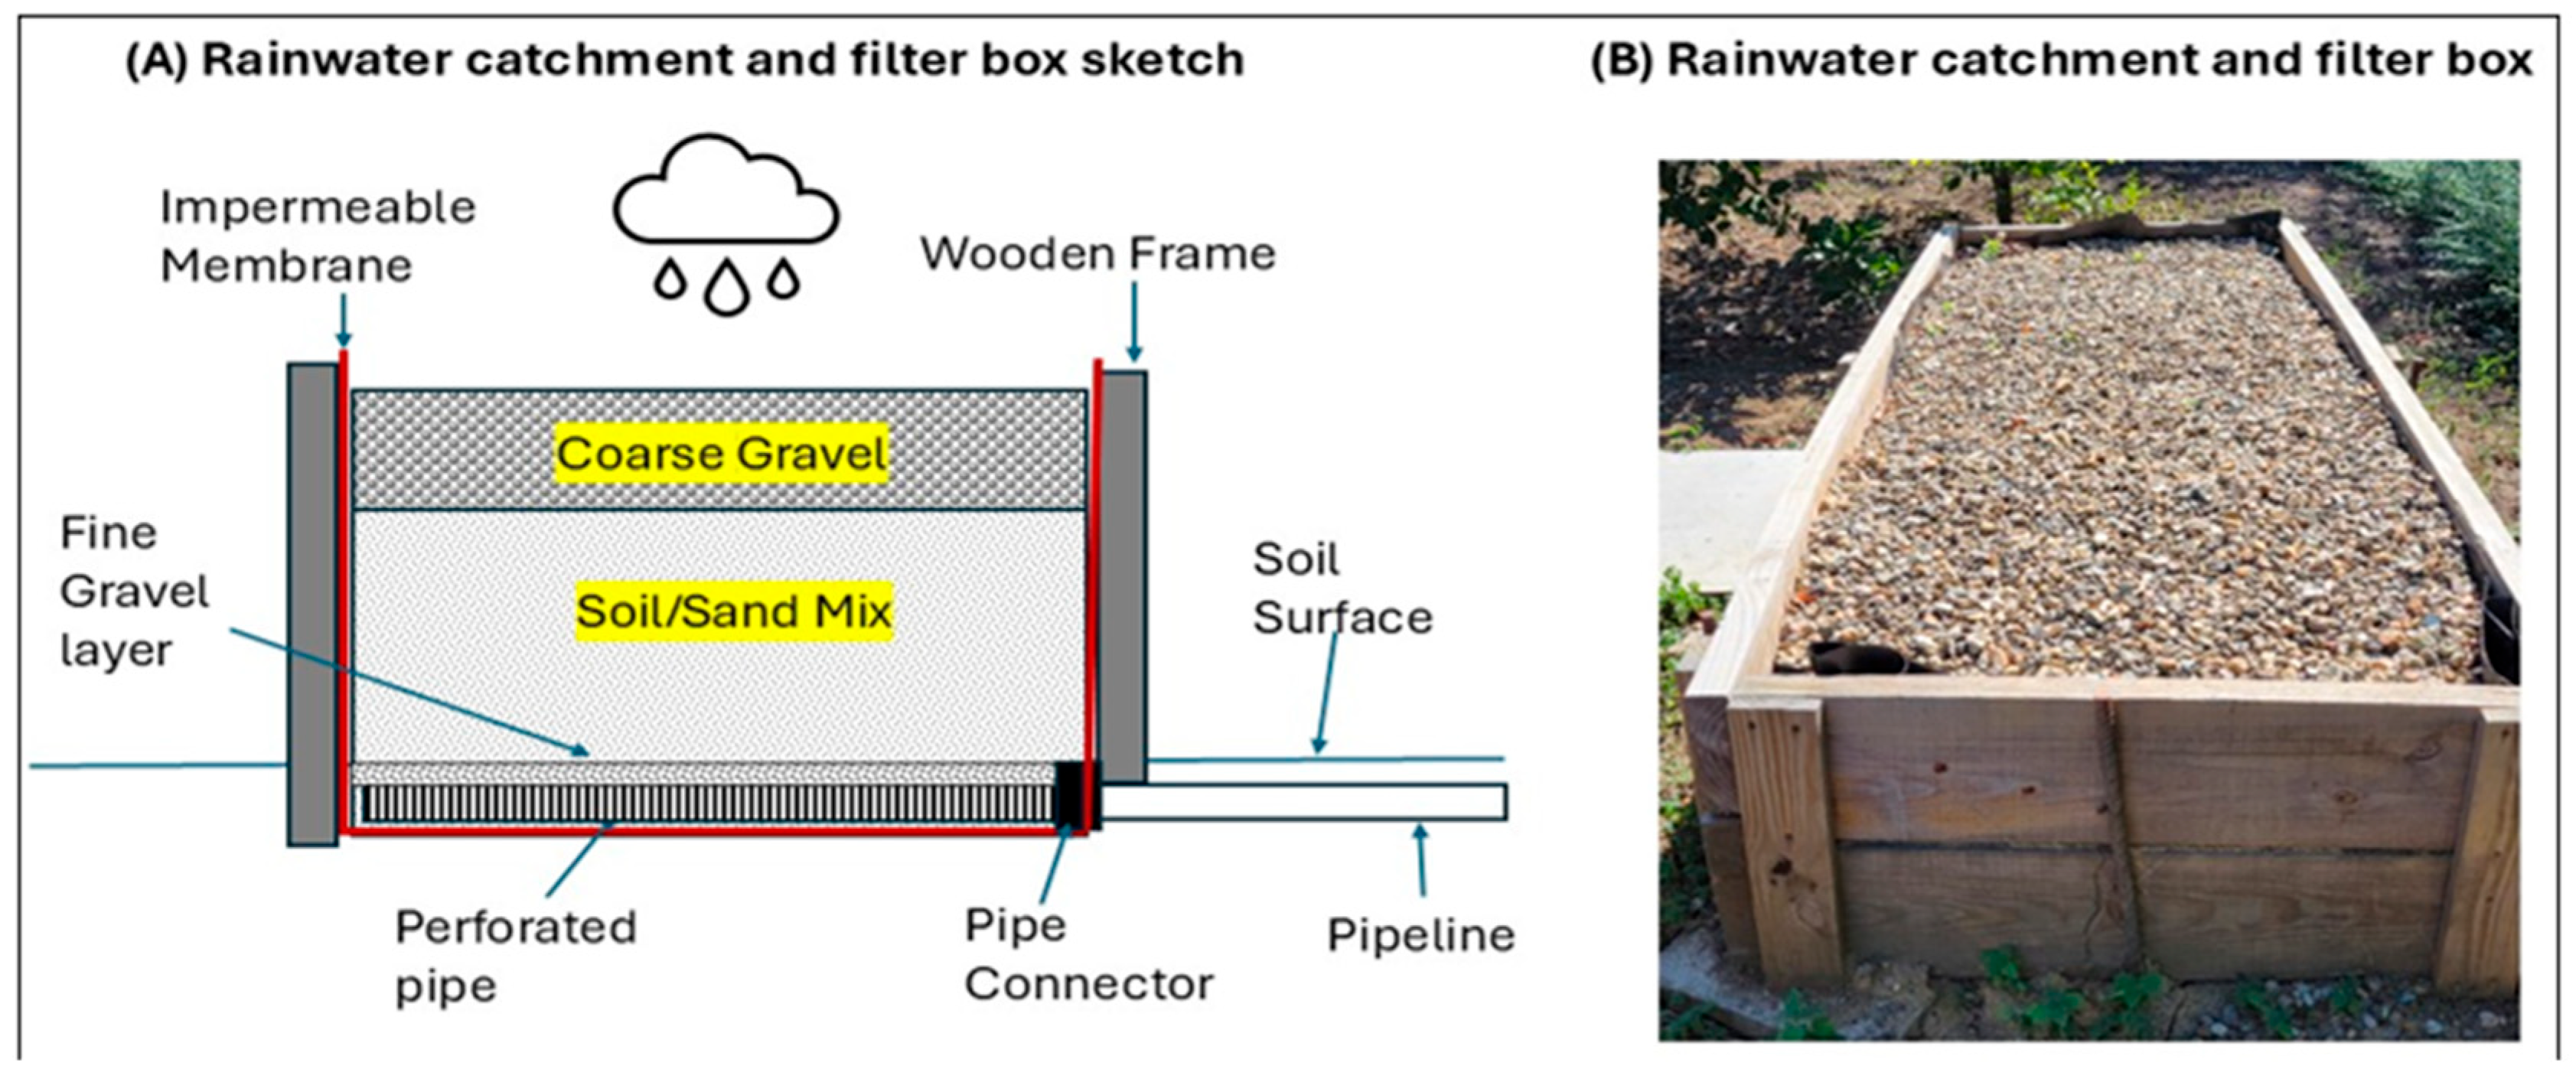
Figure 1. Filter box design for direct rainwater collection in Santiago, Dominican Republic.
Water 18 01158 g001
Figure 2. Diagram of capture and storage system in Santiago, Dominican Republic.
Water 18 01158 g002
Figure 3. Trends in physicochemical parameters over filter type (% sand) for rainwater harvested in Santiago, Dominican Republic, from May 2024 to May 2025.
Water 18 01158 g003
Figure 4. (ae): Box plots comparing physicochemical parameters over filter type (% sand) for rainwater harvested in Santiago, Dominican Republic, from May 2024 to May 2025.
Water 18 01158 g004
Figure 5. Model-estimated marginal means of physicochemical parameters by filter type (% sand), for rainwater harvested in Santiago, Dominican Republic, from May 2024 to May 2025.
Water 18 01158 g005
Figure 6. Presence of microbiological parameters over time for rainwater harvesting units sampled from May 2024 to March 2025. Note: A dot reflects the presence of a microbiological parameter, an X denotes absence, and a blank space indicates that no value was reported.
Water 18 01158 g006
Table 1. Model-estimated marginal means of physicochemical parameters by filter type (% sand), adjusting for autocorrelations and trends, for rainwater harvested in Santiago, Dominican Republic, sampled from May 2024 to May 2025.
Outcome (Physicochemical Parameter)% SandEstimated Marginal Mean *Standard Error95% Confidence Interval for Marginal Mean Autoregressive TrendTest of Filter Differences **
pH yesnoF(3,377) = 1.75, p = 0.156
347.770.057.61–7.93
627.830.057.67–8.00
667.850.057.67–8.02
767.740.057.58–7.91
Log10 NTU yesyes, interaction ***F(3,373) = 13.95, p < 0.001
34−0.380.05−0.55–−0.21
62−0.660.06−0.83–−0.48
66−0.660.06−0.84–−0.47
76−0.820.05−0.99–−0.65
EC (μS/cm) yesyesF(3,377) = 4.17, p = 0.006
34651.3058.07466.49–836.11
62566.5159.72376.46–756.57
66411.0461.16216.41–605.68
76400.1058.08215.27–584.93
TDS (mg/L) yesyesF(3,377) = 4.52, p = 0.004
34411.3835.33298.95–523.82
62364.6036.35248.90–480.29
66263.4237.27144.82–382.03
76257.3935.33144.94–369.84
BOD5 (mg/L) noyesF(3,182) = 0.62, p = 0.601
343.980.342.89–5.07
624.230.363.07–5.38
663.420.382.20–4.64
764.090.372.91–5.27
Notes: *—Marginal means reflect averages over time. **—Omnibus Wald F-tests for any difference among sand levels. ***—log10 NTU significance reflects the omnibus test for the interaction between filter type and sample number.
Table 2. Predicted probabilities (with 95% confidence interval) of microbiological presence by filter type for rainwater harvesting filters in Santiago, Dominican Republic, 2024–2025.
Outcome34% Sand62% Sand66% Sand76% Sand
HPC (≥300 CFU/1 mL)0.92 (0.83–0.97)0.9 (0.8–0.95)0.96 (0.87–0.99)0.96 (0.88–0.99)
Total Coliforms (≥1 CFU/100 mL)0.47 (0.31–0.64)0.35 (0.21–0.52)0.28 (0.15–0.45)0.31 (0.18–0.48)
Fecal Coliforms (≥1 CFU/100 mL)0.31 (0.16–0.51)0.09 (0.03–0.22)0.1 (0.03–0.27)0.04 (0.01–0.15)
E. coli (≥1 CFU/100 mL)0.14 (0.06–0.28)0.03 (0.01–0.1)0.04 (0.01–0.12)0.01 (0–0.06)
Enterobacteria (≥1 CFU/mL)0.3 (0.19–0.45)0.15 (0.07–0.26)0.12 (0.05–0.24)0.16 (0.08–0.28)
Disclaimer/Publisher’s Note: The statements, opinions and data contained in all publications are solely those of the individual author(s) and contributor(s) and not of MDPI and/or the editor(s). MDPI and/or the editor(s) disclaim responsibility for any injury to people or property resulting from any ideas, methods, instructions or products referred to in the content.