Article

Enhanced Organic Matter Recovery in the High-Rate Contact Stabilization Process by Addition of Waste Activated Sludge: A Pilot-Scale Study


Innovative Materials and Resources Research Center, Public Works Research Institute, 1-6, Minamihara, Tsukuba 305-8516, Ibaraki, Japan
*
Author to whom correspondence should be addressed.
Water 2026, 18(10), 1127; https://doi.org/10.3390/w18101127
Submission received: 16 April 2026 / Revised: 6 May 2026 / Accepted: 7 May 2026 / Published: 8 May 2026
(This article belongs to the Special Issue Biological Wastewater Treatment and Its Resource Recovery)

Abstract

The high-rate contact stabilization (HiCS) process is a potential technology for recovering energy from organic matter in wastewater; however, further performance improvement is required. This study proposes a biologically enhanced HiCS (BE-HiCS) process that introduces waste-activated sludge (WAS) from a separate conventional activated sludge (CAS) train within a wastewater treatment plant (WWTP) into the HiCS stabilization tank. The performance of the proposed process was verified using a pilot-scale plant. In a scenario combining the CAS and BE-HiCS processes, which is considered feasible for practical WWTP implementation due to the ready availability of WAS, a recovery of 0.24 ± 0.03 g-COD/g-COD of the influent COD mass was projected. This value was statistically significantly higher than that achieved by either the CAS process alone or the HiCS process alone. In this scenario, WAS was added to the BE-HiCS process at a ratio of 0.15 ± 0.03 g-COD/g-COD, resulting in a net recovery rate of 0.33 ± 0.04 g-COD/g-COD, after subtracting the COD contribution of the added WAS. The superior organic matter recovery of the BE-HiCS process was attributed to its enhanced ability to convert non-particulate organic matter into sludge through absorption and adsorption, while maintaining adequate sludge settleability for effective solid–liquid separation.

1. Introduction

Wastewater contains organic matter rich in energy [1,2,3,4]. At wastewater treatment plants (WWTPs), organic matter can be recovered and converted into biomethane through anaerobic digestion [5,6]. This biomethane can then be used for electricity generation, thereby offsetting plant energy consumption. By recovering this energy, WWTPs are expected to reduce net energy consumption and contribute to the development of a sustainable society [7,8].
The high-rate contact stabilization (HiCS) process is a high-rate suspended-growth biological treatment process with solids retention time (SRT) of less than 2 days [9]. It is considered an efficient approach for recovering organic matter from wastewater while minimizing losses due to oxidation. The HiCS process consists of a stabilization tank, in which returned sludge is aerated; a contact tank, where stabilized sludge is mixed with influent wastewater; and a secondary settling tank, which separates settleable sludge from the effluent [9]. Dissolved organics are absorbed for oxidation, biosynthesis, or intracellular storage [10,11], while colloidal and particulate matter adsorb via bioflocculation to be recovered as waste sludge [10,11,12]. The feast–famine regime of the HiCS process promotes the production of extracellular polymeric substances (EPS), essential for bioflocculation [13,14], and selects for bacteria that rapidly absorb substrate and accumulate storage materials such as polyhydroxyalkanoates (PHA) [14,15,16]. Additionally, HiCS waste sludge exhibits high methane conversion potential [17].
Applying the HiCS process to primary sedimentation tank (PST) effluent may enhance energy recovery, as the high EPS production of suits low-strength influent [18]. Despite their footprint, PSTs are energy-efficient, capturing organic matter as primary sludge with minimal oxidation [19]; thus, HiCS downstream of PSTs may surpass the high-rate activated sludge (HRAS) process in energy efficiency [20]. Although the HRAS process is extensively studied for raw influent [21,22], research on the HiCS process using actual PST effluent remains limited [17,23]. Because PSTs remove settleable organics and significantly alter sludge settleability, findings from systems without PSTs may not be directly applicable.
Enhancing the effectiveness of the HiCS process requires improvement in organic matter recovery. A previous study [24] reported that the pilot-scale continuous HiCS process recovered 13–15% of the influent organic load as waste sludge. However, approximately 60% of the organic matter remained in the treated effluent, indicating substantial potential for improvement. The HiCS process operates at short SRT and high food-to-microorganism (F/M) ratios, which promote logarithmic growth of aerobic microorganisms. Although this enhances organic absorption and adsorption, it also results in excessive production of loosely bound EPS (LB-EPS), leading to the formation of loose sludge flocs and deterioration of settling performance [25,26,27]. Therefore, effective operation of the HiCS process requires simultaneous enhancement of organic absorption/adsorption capacity and sludge settleability.
In conventional activated sludge (CAS) processes, biologically enhanced primary sedimentation has sometimes been applied to improve the concentrability of waste activated sludge (WAS) by returning WAS to the PST for cosettling with primary sludge [22]. When WAS comes into contact with influent wastewater, it absorbs dissolved organic matter [28,29,30,31]. In addition, through bioflocculation, it adsorbs colloidal and particulate organic matter, thereby increasing floc size and promoting sedimentation [32,33,34]. Owing to its relatively good settling properties, WAS may function as ballast when binding poorly settling organic matter, potentially enhancing the overall settleability of the sludge. At WWTPs equipped with CAS processes, WAS is readily available and can be utilized with minimal equipment modification [35]. Moreover, the use of WAS is generally less costly than chemical coagulants and does not adversely affect methanogenesis [36]. Some of the organic matter absorbed by WAS is also converted into PHA, which exhibits high methane conversion potential [37,38].
Incorporating WAS into the HiCS process, referred to as biologically enhanced HiCS (BE-HiCS), is expected to promote bioflocculation not only in sludge originally generated by the HiCS process but also in the added WAS under feast–famine conditions. This may enhance the absorption and adsorption of organic matter remaining in the treated effluent from the HiCS process. Furthermore, WAS is expected to function as ballast, improving overall sludge settleability and compensating for the relatively poor settling performance associated with the HiCS process. As a result, the recovery rate of organic matter may be increased. To the best of our knowledge, no previous studies have investigated this BE-HiCS approach.
In this study, the organic matter recovery rate achievable as waste sludge from the BE-HiCS process was evaluated using a pilot-scale plant treating actual municipal wastewater. The objective was to assess process performance under practical conditions, with a view toward future implementation at full-scale WWTPs. The results were compared with those of the CAS process. In addition, differences were discussed in relation to previous studies investigating the basic HiCS process. Because this study assumed application at existing WWTPs not designed for nutrient removal, nutrient removal was not considered in the treatment process.

2. Materials and Methods

2.1. Description of Pilot-Scale Plant

The configuration of the pilot-scale plant is shown in Figure 1. The systems were constructed within the experimental facilities of a full-scale public WWTP treating approximately 100,000 m3/d of municipal wastewater. Preliminary effluent, continuously withdrawn from this WWTP at an identical flow rate, was treated in parallel using the CAS process and the BE-HiCS process. Both treatment lines employed pilot-scale configurations described in our previous report [24]. The surface overflow rate (SOR) of the PST was 2.4 m3/(m2·h) for both processes. WAS withdrawn from the CAS process was continuously introduced into the stabilization tank of the BE-HiCS process without disposal, except for a small fraction removed for analytical purposes. The flow rates and operating conditions of both treatment lines were maintained constant throughout the experimental period, as summarized in Table 1. Prior to data collection, the CAS and BE-HiCS processes were operated continuously for 2 months and 1 month, respectively, to allow sufficient acclimation of the sludge. Subsequently, to confirm the stability of the reactor conditions, mixed liquor suspended solids (MLSS) measurements were taken once daily for five days. It was confirmed that the coefficient of variation for the MLSS concentration was equivalent to or lower than that reported in a previous study [24], and detailed investigations were initiated.
In the CAS process, aeration was controlled to maintain the dissolved oxygen (DO) concentration at the center of the aeration tank above 2 mg/L. In the BE-HiCS process, aeration was applied only in the stabilization tank to maintain DO above 2 mg/L, whereas the contact tank was mixed without aeration. The DO carried over from the stabilization tank was rapidly consumed in the contact tank, resulting in an average DO concentration below 0.1 mg/L. Such conditions have been reported to promote EPS production and bioflocculation [9,13,14].

2.2. Sample Collection and Analysis Methods

Primary effluent, CAS effluent, and BE-HiCS effluent were collected as 24 h composite samples at 2 h intervals and immediately refrigerated. Wasted sludge and reactor sludge from each process were collected as grab samples. All samples were analyzed for total chemical oxygen demand (tCOD), particulate COD (pCOD), colloidal COD (cCOD), soluble COD (sCOD), total suspended solids (TSS), and volatile suspended solids (VSS). Samples of reactor sludge in the CAS and BE-HiCS reactors were collected from the end of the aeration tank in the CAS process and from the contact tank in the BE-HiCS process, respectively, and sludge volume index (SVI), LB-EPS, and tightly bound EPS (TB-EPS) were measured. To minimize the influence of seasonal variations in water temperature, five investigations were conducted intensively over an 8-day period. The tCOD represents the total COD of the sample. The pCOD was calculated as the difference between tCOD and cCOD. The cCOD was determined by subtracting sCOD from the COD of the filtrate obtained using glass fiber filter paper (934-AH, Whatman, Cytiva, Marlborough, MA, USA). The sCOD was measured according to the method of Mamais et al. [39]. Analytical methods for TSS, VSS, biochemical oxygen demand (BOD), allylthiourea-BOD (ATU-BOD), and SVI followed Standard Methods [40]. COD was measured using COD reaction vials and a VIS spectrophotometer (HACH Company, Loveland, CO, USA). LB-EPS and TB-EPS were quantified according to Rahman et al. [41]. In the BE-HiCS process, DO concentrations in the contact tank and stabilization tank were continuously monitored using an optical DO sensor (FDO700IQ, Xylem Inc., Washington, DC, USA). In the CAS process, DO was continuously monitored at three locations within the aeration tank, and the average value was reported. Water temperature was continuously monitored at the end of the aeration tank for the CAS process and in the stabilization tank for the BE-HiCS process. Ambient air temperature data were obtained from the nearest observation station of the Japan Meteorological Agency [42]. Concentrations of NH4+-N, NO2-N, and NO3-N were measured using an autoanalyzer (QuAAtro39, BL TEC K. K., Osaka, Japan). Influent pH was measured using a pH meter (HM-40P; DKK-TOA Corporation, Tokyo, Japan).

2.3. Calculation

For the BE-HiCS process, the SRT (d) was calculated using Equation (1), as sludge concentrations differ between the contact tank and the stabilization tank:
S R T = V C o n × X C o n + V S t a × X S t a Q W B S × X W B S + Q E f f × X E f f
where VCon is the volume of the contact tank (L), XCon is the TSS concentration in the contact tank (mg/L), VSta is the volume of the stabilization tank (L), and XSta is the TSS concentration in the stabilization tank (mg/L). QWBS is the flow rate of the waste BE-HiCS sludge (WBS) (L/d), XWBS is the TSS concentration in WBS (mg/L), QEff is the treated water flow rate (L/d), and XEff is the TSS concentration in the BE-HiCS effluent (mg/L). Although WAS is sludge withdrawn from the CAS process, the retention time in the CAS process is not included in the SRT calculation for the BE-HiCS process. Because WAS was added to the BE-HiCS process, XSta was calculated using Equation (2):
X S t a = Q R B × X W B S + Q W A S × X W A S Q R B + Q W A S
where QRB is the return sludge flow rate (L/d) in the BE-HiCS process, QWAS is the WAS flow rate (L/d), and XWAS is the TSS concentration of WAS (mg/L).
The food-to-microorganism (F/M) ratio for the BE-HiCS process was calculated using Equation (3):
F / M   r a t i o = Q I n f × B O D I n f V C o n × X C o n + V S t a × X S t a
where QInf is the influent flow rate (L/d) and BODInf is the influent BOD concentration (mg/L). In Equation (3), XCon and XSta were calculated using VSS instead of TSS.
The COD removal rate (%) for each fraction in the CAS and BE-HiCS processes was calculated using Equation (4):
R e m o v a l   r a t e   o f   x C O D = x C O D I n f x C O D E f f / x C O D I n f × 100
where xCODInf represents the influent COD concentration of each fraction (tCOD, pCOD, cCOD, or sCOD) (mg/L), and xCODEff represents the COD concentration of each fraction in the CAS or BE-HiCS effluent (mg/L).
The oxidized COD mass was determined from the mass balance between the influent COD and the COD discharged as effluent and waste sludge. The carbon recovery rate (CRR) was defined as the ratio of the COD mass recovered as waste sludge to the influent COD mass. The methane recovery rate (MRR) was calculated as the ratio of the methane production, expressed as COD equivalents, to the influent COD mass. The MRR was obtained by multiplying the CRR by the methane conversion rate.
Following Rahman et al. [13], the carbon redirection rate (R) and the carbon harvesting rate (H) were calculated using Equations (5) and (6), respectively:
R = Q W S × ( t C O D W S t C O D E f f ) + ( Q E f f + Q W S ) × p C O D E f f Q I n f × t C O D I n f
H = Q W S × ( t C O D W S t C O D E f f ) Q W S × t C O D W S t C O D E f f + ( Q E f f + Q W S ) × p C O D E f f
where tCODWS is the tCOD concentration of the wasted sludge (WAS or WBS) (mg/L), tCODEff is the tCOD concentration of the effluent (mg/L), pCODEff is the pCOD concentration of the effluent (mg/L), QInf is the influent flow rate (L/d), and tCODInf is the influent tCOD concentration (mg/L).
To compare CRR values among processes, Tukey’s multiple comparison test was conducted at a 5% significance level using BellCurve for Excel 4.10 (Social Survey Research Information Co., Ltd., Tokyo, Japan). Before the test, the assumptions of normality and homogeneity of variance were confirmed using the Shapiro–Wilk test and Levene’s test; in all cases, p-values were greater than 0.05.

2.4. Biomethane Potential Test by Batch Procedure

Biomethane potential (BMP) tests were conducted in triplicate for WAS and WBS using an automated methane potential testing system (AMPTS3; BPC Instruments AB, Lund, Sweden). Cumulative methane production was monitored over 28 days. Because WAS and WBS could not be tested immediately, they were concentrated, stored frozen for 3 months, and subsequently thawed slowly under refrigerated conditions to avoid structural damage associated with rapid thawing before use as substrates [43]. Although frozen storage has been reported to increase the initial methane production rate, the final cumulative methane yield is generally unaffected [44]. Digested sludge collected from a full-scale WWTP was used as inoculum. Prior to use, it was preincubated for 1 week in a 35 °C water bath to reduce endogenous methane production.
For each test, 0.8 L of inoculum was added to a 1 L bottle. To achieve an inoculum-to-substrate ratio (ISR) of 5 based on volatile solids (VS), 0.2 L of substrate diluted with cooled boiled water was added. For easily degradable substrates, an ISR of 4 or higher is recommended [43]. Because the optimal ISR for HiCS sludge has not been established, a conservative ISR of 5 was adopted, consistent with previous studies [17,24]. The produced gas was passed through a 3 M sodium hydroxide solution to remove carbon dioxide. Microcrystalline cellulose (MCC, Sigma-Aldrich, #310697, St. Louis, MO, USA) was used as the positive control substrate. The BMP of each substrate was calculated by subtracting methane production measured in the blank series. All gas volumes were normalized to standard conditions (0 °C and 101.33 kPa). The VS concentration of the substrates was determined according to Standard Methods [40]. After completion of anaerobic digestion, the pH of all sludge samples was measured. Total alkalinity and ammonium concentrations were analyzed after pooling triplicate samples. Methane production was considered complete for each series because its daily production during the final three consecutive days was less than 1% of the cumulative methane production [43]. The cumulative BMP, expressed as g-CODCH4/g-COD, was calculated by converting the measured methane production (NL-CH4/g-VS) to COD using a conversion factor of 0.35 NL-CH4/g-CODCH4, and then dividing by the COD/VS ratio of the input substrate. The characteristics of the substrates and inoculum used in the tests are provided in Table A1.

3. Results

3.1. Operating Conditions

The daily average ambient temperature during the measurement period was 18 °C ± 2 °C (hereafter, values following ± represent the standard deviation). The influent and effluent water qualities are summarized in Table 2. The daily average water temperature of the primary effluent used as influent was 24 °C ± 0 °C, and the pH was 7.1 ± 0.1. In the CAS process, the effluent concentrations of BOD, TSS, and NH4+-N were low, indicating stable and effective treatment performance. In contrast, the BE-HiCS effluent exhibited higher concentrations of BOD, TSS, and NH4+-N than the CAS effluent.
The operating conditions of the CAS and BE-HiCS processes are presented in Table 3. The F/M ratio of the CAS process was 0.31 ± 0.04 g-BOD/(g-VSS·d), which falls within the typical range of 0.2–0.6 g-BOD/(g-VSS·d) [45]. The BE-HiCS process exhibited an F/M ratio of 2.0 ± 0.5 g-BOD/(g-VSS·d), generally consistent with the recommended range of 2–10 g-BOD/(g-VSS·d) for high-rate systems [45]. The concentrations of LB-EPS and TB-EPS in the BE-HiCS process were higher than those in the CAS process, consistent with previous studies reporting increased EPS production under low SRT and high F/M conditions [11,23,24]. The TB-EPS/LB-EPS ratio, which has been suggested as an indicator of sludge bioflocculation capacity [46], was slightly lower in the BE-HiCS process than in the CAS process.

3.2. COD Mass Balance of CAS and BE-HiCS Processes

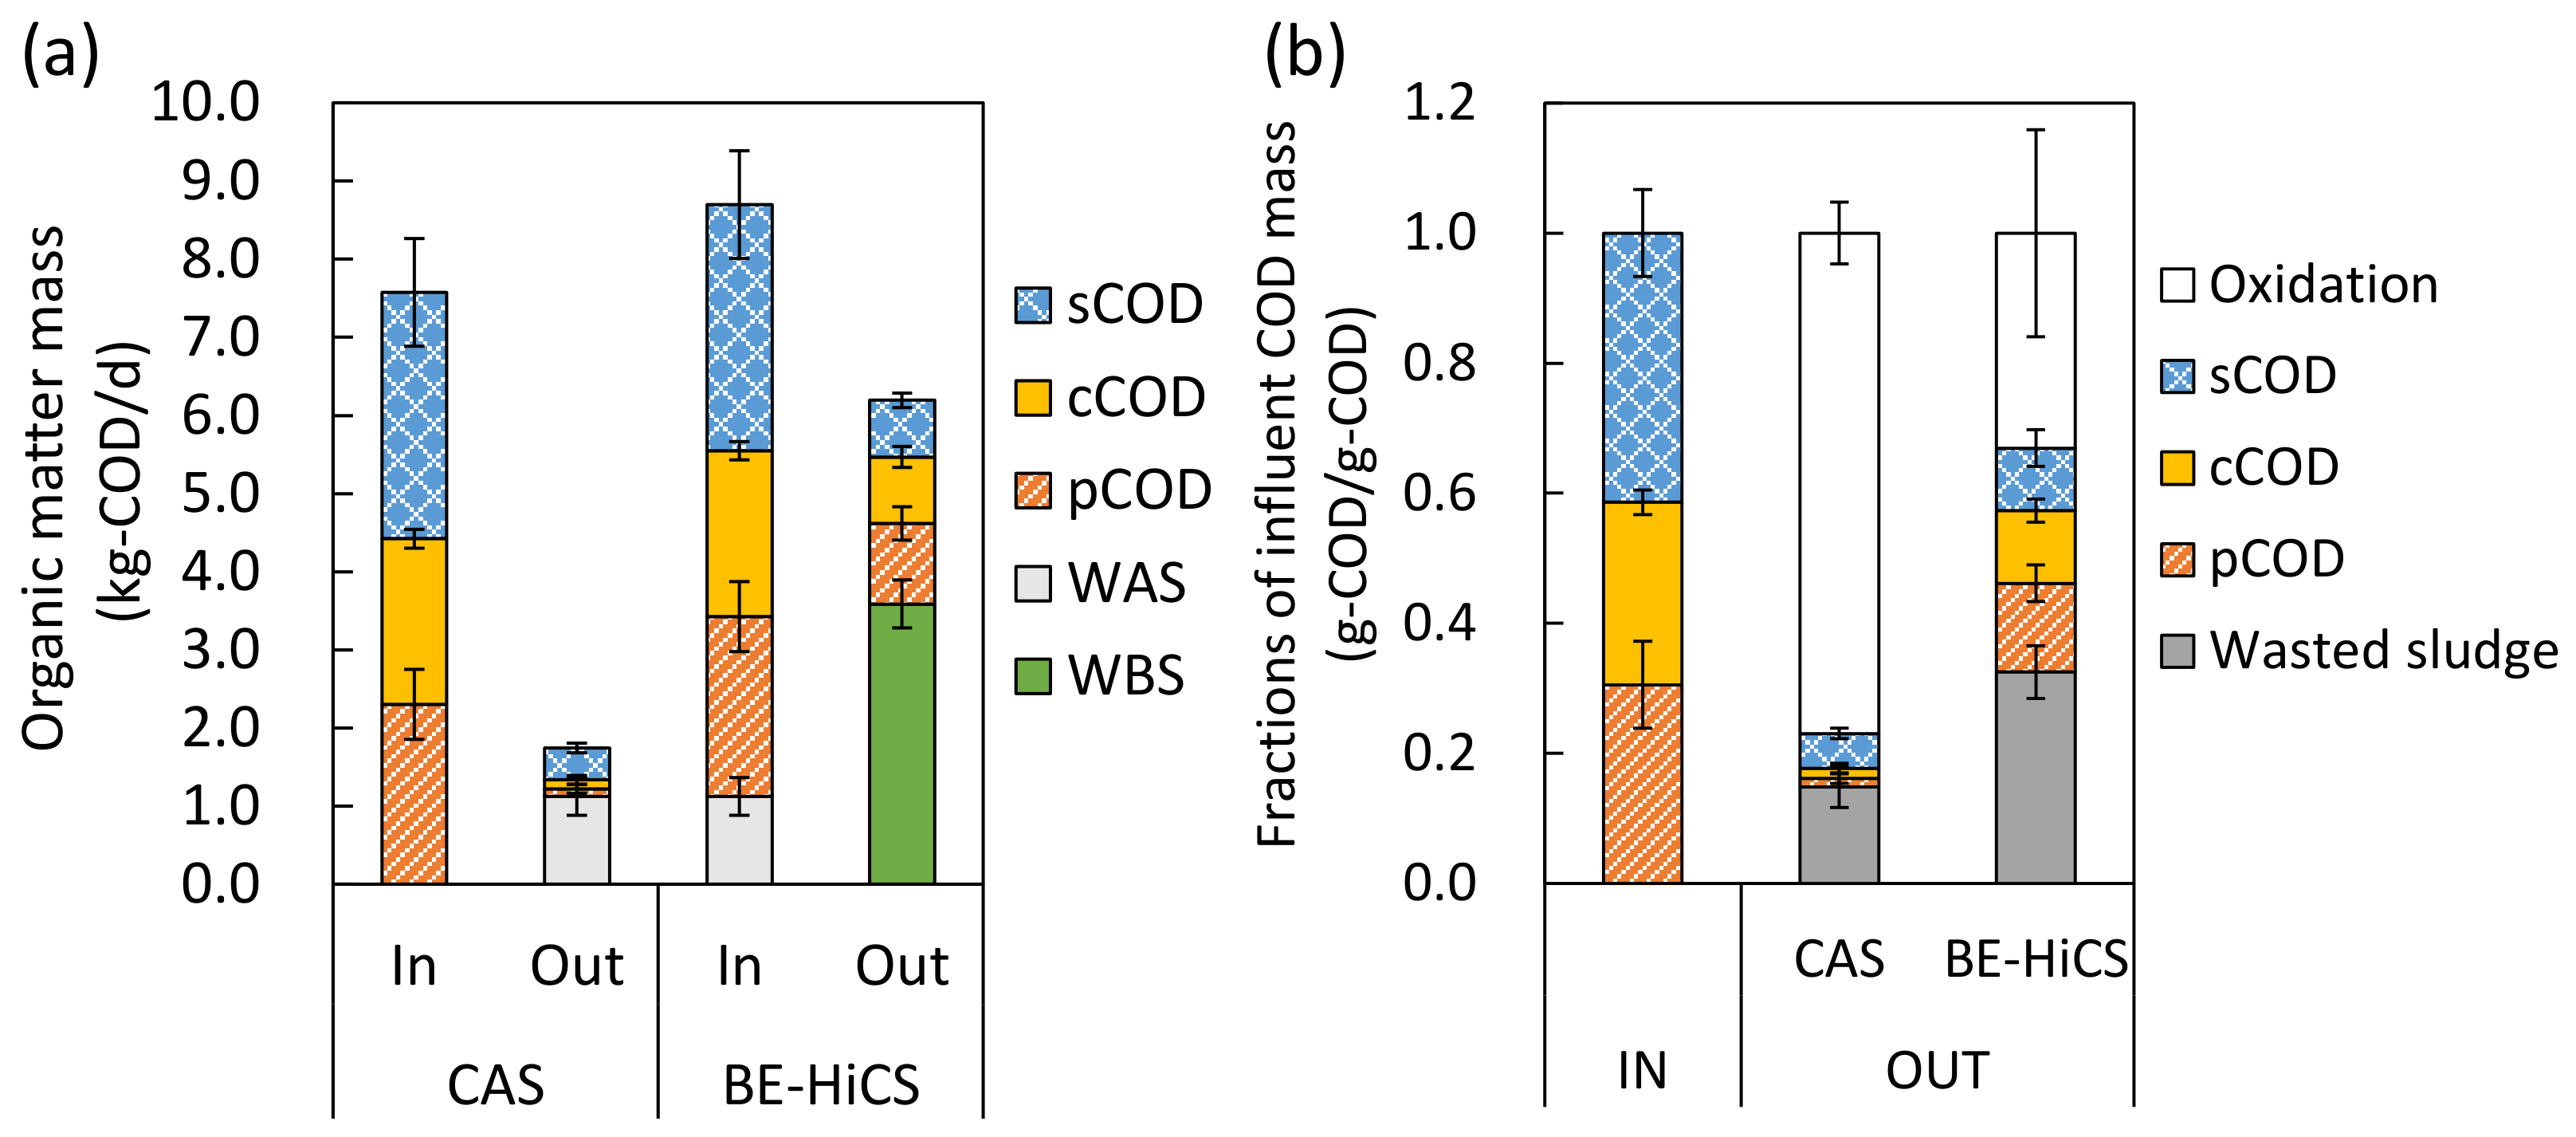
As shown in Figure 2a, the inflowing and outflowing daily COD mass for the CAS process indicated that 1.1 ± 0.2 kg-COD/d of WAS was recovered from an influent COD load of 7.5 ± 0.4 kg-COD/d entering as primary effluent. In addition, 0.63 ± 0.11 kg-COD/d was discharged as CAS effluent.
In the BE-HiCS process, the total COD inflow was 8.7 ± 0.6 kg-COD/d, consisting of the COD in the primary effluent plus the COD associated with WAS generated from the CAS process. Of this total, 3.6 ± 0.3 kg-COD/d was recovered as WBS, while 2.5 ± 0.4 kg-COD/d was discharged as BE-HiCS effluent.
Focusing on particulate organic matter, the CAS process exhibited a 47% reduction in total outflowing pCOD mass (sum of pCOD in treated water and WAS) compared with the inflowing pCOD mass. This reduction is attributed to the hydrolysis and endogenous respiration of particulate organic matter during sludge retention in the system. In contrast, for the BE-HiCS process, the total outflowing pCOD mass (sum of pCOD in treated water and WBS) was 35% higher than the total inflowing pCOD mass (sum of pCOD in influent water and WAS), indicating enhanced conversion of organic matter into particulate form.
Figure 2b presents the proportion of COD discharged in the effluent of the CAS and BE-HiCS processes relative to the primary effluent. For the BE-HiCS process, the COD mass equivalent to the added WAS was excluded from both influent and effluent to enable direct comparison with the CAS process. The CRR values relative to the primary effluent were 0.15 ± 0.03 g-COD/g-COD for the CAS process and 0.33 ± 0.04 g-COD/g-COD for the BE-HiCS process. Thus, the BE-HiCS process substantially increased the CRR compared with the CAS process. Furthermore, the fraction of oxidized COD in the BE-HiCS process (0.33 ± 0.16 g-COD/g-COD) was markedly lower than that in the CAS process (0.77 ± 0.05 g-COD/g-COD), indicating that oxidation losses were minimized in the BE-HiCS process.

3.3. Biomethane Potential of Waste Sludge

The results of the BMP tests are summarized in Table 4. After completion of anaerobic digestion, the pH of all digested samples was confirmed to be 6.8 or higher [47], indicating suitable conditions for methanogenesis. Alkalinity and ammonium concentrations remained within stable ranges across all test series [48,49]. The BMP value of MCC, as the positive control, and its relative standard deviation (RSD) met the recommended criteria [50], confirming that the tests were conducted appropriately. The BMP values for WAS and WBS were 0.49 ± 0.01 and 0.53 ± 0.02 g-CODCH4/g-COD, respectively, with WBS exhibiting a slightly higher methane production potential.

4. Discussion

Due to facility constraints at the pilot plant, it was not possible to set up and compare the basic HiCS processes in parallel in this study. This section discusses the factors influencing process performance by comparing the BE-HiCS process with the basic HiCS process previously operated at the same facility [24] and with other reported studies.

4.1. Comparison of Removal Rates for Each Fraction of Organic Matter

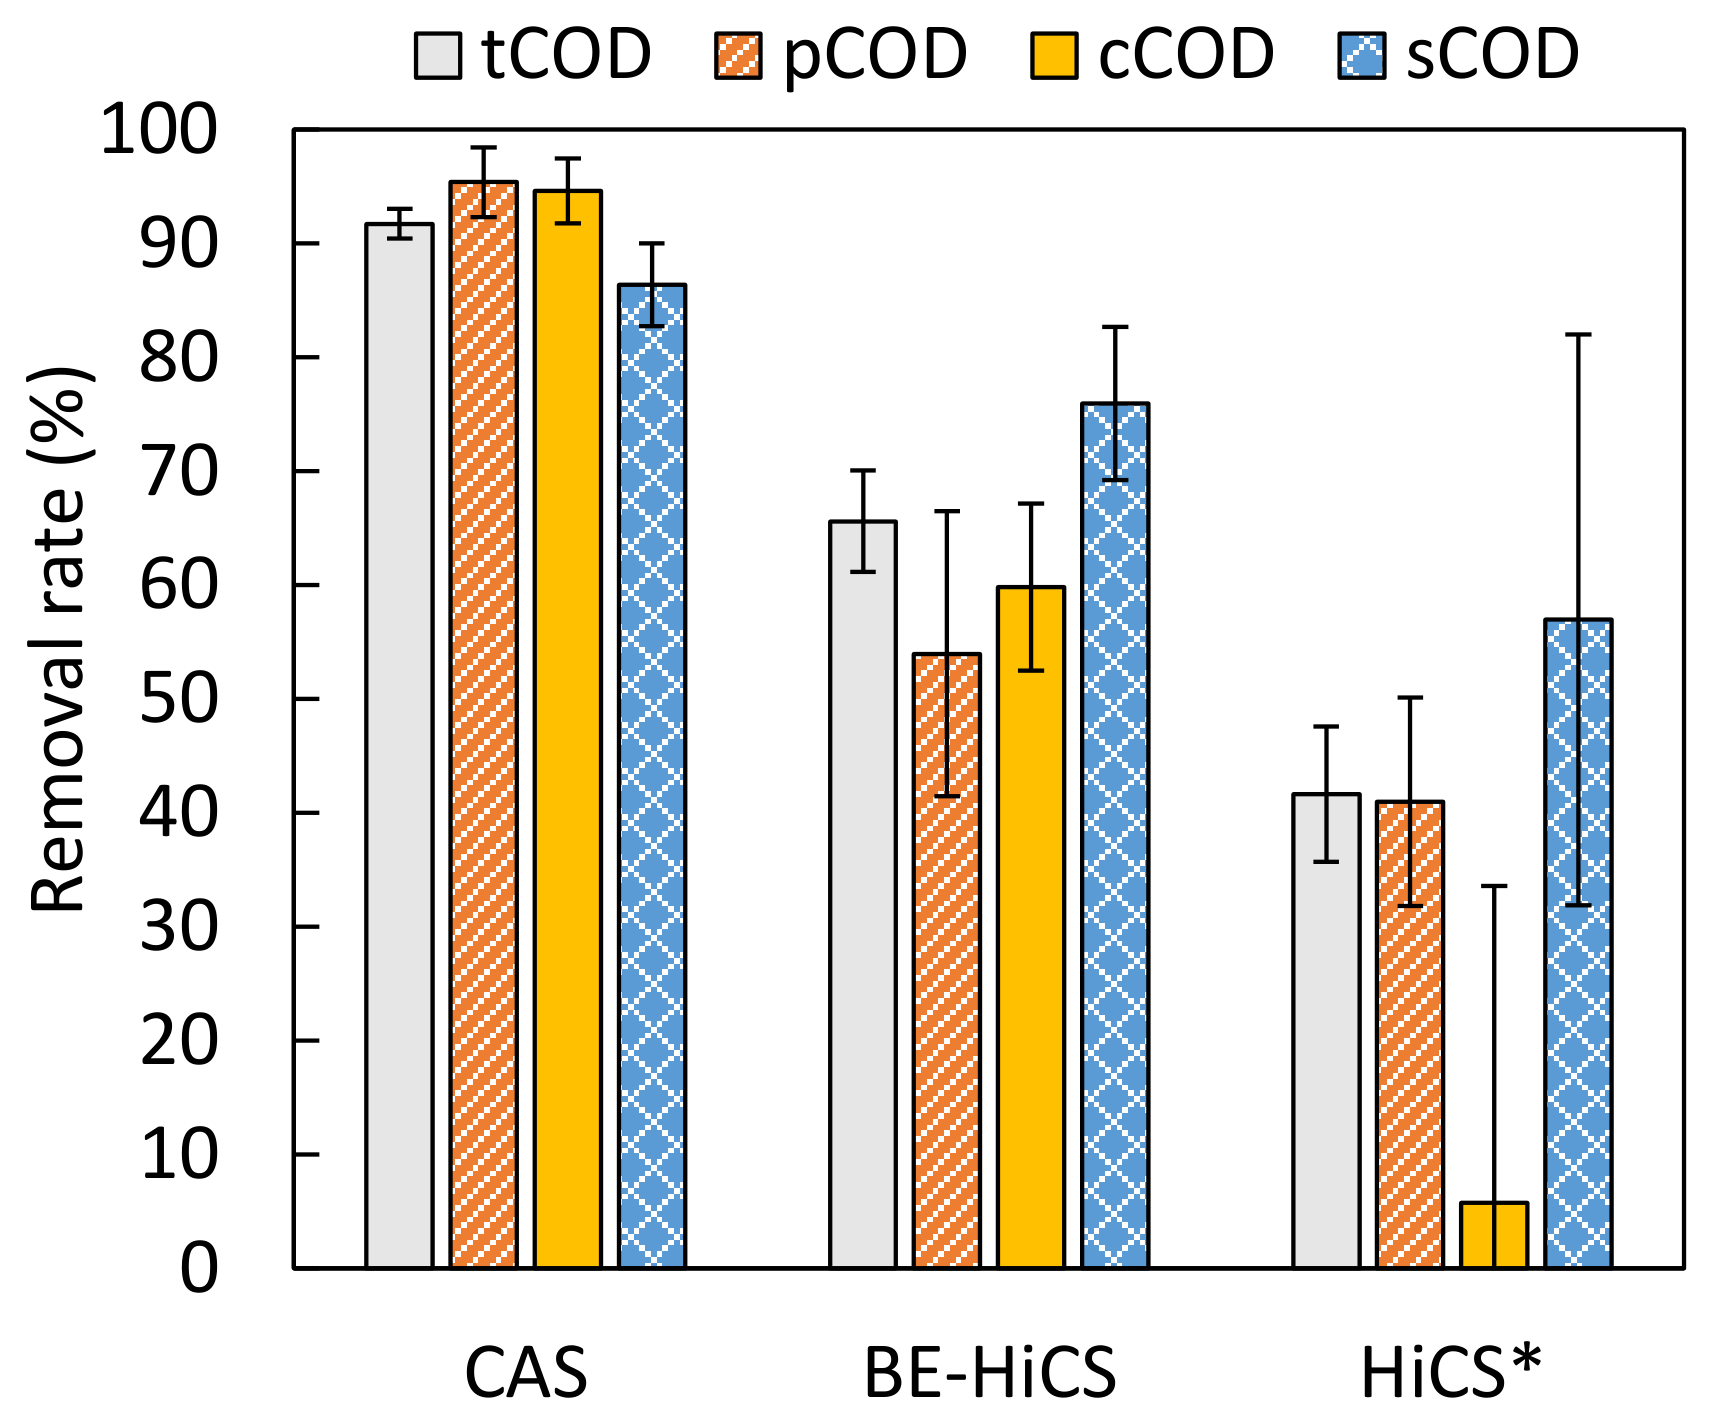
In addition to the organic matter removal rates of the CAS and BE-HiCS processes, Figure 3 also presents the removal rates of the basic continuous HiCS process previously operated at the same facility [24]. That HiCS process was operated under the same hydraulic conditions (influent flow rate and sludge withdrawal rate) as the BE-HiCS process but without WAS addition. It exhibited an SRT of 0.49 ± 0.11 d and a daily average water temperature of 21 °C ± 0 °C [24]. Although the hydraulic conditions were identical, the slightly longer SRT in the BE-HiCS process was mainly attributable to the increased reactor TSS resulting from WAS addition. Compared with the basic HiCS process, the BE-HiCS process achieved higher removal rates for all organic matter fractions.
Removal of particulate organic matter depends not only on bioflocculation performance but also on settling characteristics. In contrast, removal of colloidal organic matter is primarily governed by bioflocculation performance and thus serves as a key indicator for evaluating flocculation capacity. In previously reported basic HiCS processes [14,23,24,46], the removal rate of colloidal organic matter was relatively low. However, in the BE-HiCS process, the removal of colloidal organic matter was substantially improved. The low colloidal removal observed in the basic HiCS process has been attributed to insufficient hydrolysis rates caused by low sludge concentrations and reduced microbial diversity [11], as well as decreased bioflocculation capacity due to excessive production of LB-EPS, as reflected by a lower TB-EPS/LB-EPS ratio [46,51]. In contrast, the CAS process is known to produce EPS compositions favorable for flocculation, enhance hydrolysis, and support protozoan predation, thereby conferring superior bioflocculation properties to WAS [51,52]. The enhanced removal of colloidal organic matter observed in the BE-HiCS process was therefore likely due to the contribution of the bioflocculation capacity of the added WAS.
Regarding soluble COD (sCOD), which approximates readily biodegradable COD [39], the specific sCOD utilization rate in the BE-HiCS process was 1.1 ± 0.3 g-sCOD/(g-VSS·d). This value was lower than that reported for the basic HiCS process (2.2 g-sCOD/(g-VSS·d)) [24] and for the HRAS process (3–4.5 g-sCOD/(g-VSS·d)) [11], but substantially higher than that of the CAS process (0.17 ± 0.05 g-sCOD/(g-VSS·d)). Under high F/M conditions, as in the HiCS process, accelerated substrate utilization is generally attributed to the dominance of fast-growing microorganisms [14,53,54], along with enhanced intracellular storage and EPS production [11,14]. Similar mechanisms are considered to apply to the BE-HiCS process.

4.2. Carbon Redirection and Harvesting Rates

The carbon redirection rate and carbon harvesting rate are key indicators for evaluating carbon recovery, and generally their product corresponds to the CRR [13,55]. The carbon redirection rate represents the amount of sludge generated relative to the incoming COD mass and corresponds to the sludge discharged either as effluent or waste sludge [56]. The carbon harvesting rate represents the proportion of settleable organic matter in the produced sludge and reflects sludge settleability [55].
The calculated carbon redirection and harvesting rates are presented in Table 5. The carbon redirection rate of the CAS process was lower than the influent pCOD/tCOD ratio, indicating higher decomposition of particulate organic matter. For the BE-HiCS process, both the influent pCOD/tCOD ratio and the carbon redirection rate were also calculated using the total organic matter load, including both influent wastewater and the added WAS. Whether or not WAS was added as inflow load, the carbon redirection rate of the BE-HiCS process exceeded the pCOD/tCOD ratio, indicating efficient conversion of non-particulate organic matter into sludge via absorption and adsorption rather than loss through decomposition.
In the basic HiCS process, particulate organic matter also decreases due to decomposition, although to a lesser extent than in the CAS process [24]. As shown in Table 5, the carbon redirection rate of the HiCS process was approximately 20% lower than its influent pCOD/tCOD ratio. In contrast, the carbon redirection rate of the BE-HiCS process was higher than the corresponding pCOD/tCOD ratio. This demonstrates that the BE-HiCS process converted non-particulate organic matter into sludge more effectively than the basic HiCS process.
The carbon harvesting rate of the BE-HiCS process was substantially higher than that of the basic HiCS process, indicating improved sludge settleability. This improvement is likely attributable to incorporation of WAS into sludge flocs, which increased particle size and density and provided a ballast effect. In the HRAS process, similar to the HiCS process, sedimentation inhibition has been reported when TSS exceeds 500 mg/L, and in the CAS process when TSS exceeds 1000 mg/L, due to particle interference [57,58]. In the BE-HiCS process investigated here, sludge concentrations remained below these thresholds, suggesting it was suitable for effective sedimentation.
The CRR of the BE-HiCS (0.47 ± 0.06 g-COD/g-COD) process was higher than the sum of the CRRs for the CAS (0.15 ± 0.03 g-COD/g-COD) and HiCS (0.13 ± 0.06 g-COD/g-COD) processes, suggesting that the BE-HiCS process recovered more organic matter than simply adding the organic matter from the added WAS to the organic matter recoverable by the basic HiCS process. This is thought to be attributable to the improved conversion efficiency of non-particulate organic matter into sludge through absorption and adsorption, and to the improved sludge settleability compared to the basic HiCS process, as mentioned earlier.

4.3. Carbon Recovery Rates at WWTPs Designed for Practical Use

Because the BE-HiCS process requires WAS generated from the CAS process, it must be implemented in combination with CAS. In this study, the CAS and HiCS processes were arranged in parallel, each treating equal volumes of primary effluent. By supplying WAS from the CAS process to the HiCS process, the HiCS process was operated as the BE-HiCS process. Hereafter, this integrated configuration is referred to as the CAS+BE-HiCS process.
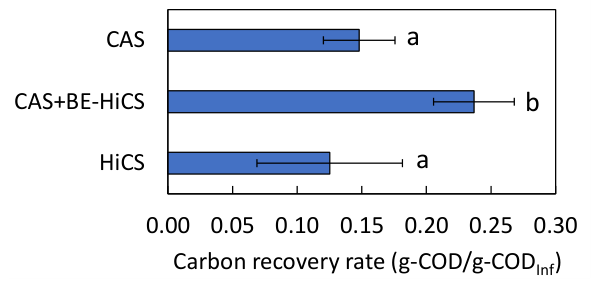
Since waste sludge was generated only from the BE-HiCS process, the overall organic matter recovery rate of the CAS+BE-HiCS process was 0.24 ± 0.03 g-COD/g-COD relative to the total COD mass of the primary effluent entering the CAS+BE-HiCS process. Figure 4 presents the CRR values of the CAS process, CAS+BE-HiCS process, and basic HiCS process, together with results of multiple comparisons. The HiCS data were taken from a previous study [24]. The CRR of the CAS+BE-HiCS process was statistically significantly higher at the 5% significance level than those of both the CAS process alone and the HiCS process alone. This indicates that the combined configuration may be an effective treatment option from the standpoint of organic matter recovery. Although the present study examined equal distribution of influent between the CAS and BE-HiCS processes, the optimal flow allocation has not been determined. Further investigation may identify conditions that further enhance organic recovery.
However, as shown in Section 3.1, the effluent quality of the BE-HiCS process, particularly in terms of BOD, TSS, and NH4+-N, was inferior to that of the CAS effluent. Therefore, if the overall effluent quality of the CAS+BE-HiCS process does not meet WWTP discharge standards, additional measures will be required. These may include implementing post-treatment for the BE-HiCS effluent or adjusting the proportion of flow treated by the CAS process to improve final effluent quality.
It should also be noted that this study was based on short-term, intensive measurements taken at a water temperature of 22 °C ± 2 °C. Although the experimental design minimized seasonal temperature variation effects, long-term seasonal fluctuations and operational stability under varying conditions remain to be evaluated. Future studies should focus on long-term performance assessment and on evaluating net energy balances, including both energy recovery and energy consumption, to support practical implementation at full-scale WWTPs.

4.4. Biomethane Production

When the basic HiCS process without WAS addition was operated under the same hydraulic conditions as in this study, the reported BMP was 0.56 ± 0.00 g-CODCH4/g-COD [24]. Waste sludge from short-SRT processes such as HiCS is known to exhibit higher methane yields than WAS because it contains a larger fraction of undecomposed, methane-fermentable organic matter [59,60]. The BMP of WBS in the present study (0.53 ± 0.02 g-CODCH4/g-COD) was slightly lower than the reported HiCS value, which is reasonable given that WBS consisted of a mixture including WAS with a lower BMP (0.49 ± 0.01 g-CODCH4/g-COD).
The sludge samples used for the BMP tests were frozen prior to testing. Previous studies have shown that freezing has only a minor effect on cumulative methane production, less than a 3% reduction [44]. Even if a slight negative impact occurred, the BMP of WBS remained higher than that of WAS. Therefore, under practical field conditions without freezing, the actual methane recovery potential would likely be equivalent to or greater than the values observed here. Accordingly, even considering the minor potential impact of freezing, the demonstrated advantages of the BE-HiCS process remain valid.
The MRR, defined as methane production relative to the influent organic load, was calculated by multiplying the BMP by the corresponding CRR. The MRR values for the CAS process and the CAS+BE-HiCS process were 0.07 ± 0.01 and 0.13 ± 0.02 g-CODCH4/g-COD, respectively. The MRR of the integrated CAS+BE-HiCS process exceeded that of the CAS process alone and that of the basic HiCS process alone (0.07 ± 0.03 g-CODCH4/g-COD) [24]. These results demonstrate the combined benefits of integrating the CAS and HiCS processes and indicate that the BE-HiCS approach represents an effective strategy for enhanced methane recovery.

5. Conclusions

In this study, the BE-HiCS process, an improved configuration of the HiCS process, was evaluated for organic matter recovery from primary effluent using a pilot-scale plant, with the objective of assessing its potential for practical application at WWTPs. The results demonstrated that the net fraction of organic matter recovered as WBS in the BE-HiCS process was 0.33 ± 0.04 g-COD/g-COD relative to the COD mass of the primary effluent, which was substantially higher than that of the parallel CAS process (0.15 ± 0.03 g-COD/g-COD). For the integrated CAS+BE-HiCS process, which demonstrated potential as a promising option for practical implementation, the projected recovery was 0.24 ± 0.03 g-COD/g-COD relative to the total primary effluent COD mass. This value was statistically significantly higher than those of the CAS process alone and the basic HiCS process alone, indicating that the integrated system is an effective treatment option for enhanced organic matter recovery. The BMP of WBS generated by the BE-HiCS process was 0.53 ± 0.02 g-CODCH4/g-COD, suggesting a methane potential slightly higher than that of WAS (0.49 ± 0.01 g-CODCH4/g-COD). From a practical perspective, the BE-HiCS process can be implemented at existing WWTPs with minimal equipment modification by utilizing readily available WAS. However, potential limitations include the need for effluent quality optimization to meet discharge standards. Additionally, while this pilot-scale study demonstrates enhanced recovery, long-term operational stability and the net energy balance under varying seasonal conditions must be evaluated to support successful large-scale implementation.

Author Contributions

K.S. and C.A. contributed to the study conception and design. Material preparation, data collection, analysis, and writing the first draft of the manuscript were performed by K.S. C.A. commented on the manuscript. All authors have read and agreed to the published version of the manuscript.

Funding

This research received no external funding.

Data Availability Statement

The data presented in this study are available on request from the corresponding author due to privacy restrictions.

Acknowledgments

The authors express their sincere gratitude to the staff of the wastewater treatment plant for their valuable assistance with wastewater sampling.

Conflicts of Interest

Authors K.S. and C.A. are the inventors of a patent application for this water treatment method in Japan (Application No.: JP-2026-65574).

Appendix A

The properties of the substrates and inoculum used in the biomethane potential test are shown in Table A1.
Table A1. Characteristics of the substrates and inoculum used in the biomethane potential test.
ItemUnitWASWBSInoculum
pH-6.56.27.9
Alkalinityg-CaCO3/L0.50.45.1
Ammoniumg-NH4+-N/L0.070.081.2
TSg/L14.916.318.6
VSg/L13.014.415.2
CODg/L22.322.925.6
VS/TS-0.870.880.82
COD/VS-1.711.591.68
Note: WAS stands for waste-activated sludge, WBS stands for waste BE-HiCS sludge, and TS stands for total solids.

References

  1. Gong, A.; Wang, G.; Qi, X.; He, Y.; Yang, X.; Huang, X.; Liang, P. Energy recovery and saving in municipal wastewater treatment engineering practices. Nat. Sustain. 2025, 8, 112–119. [Google Scholar] [CrossRef] [Scilit]
  2. McCarty, P.L.; Bae, J.; Kim, J. Domestic wastewater treatment as a net energy producer–Can this be achieved? Environ. Sci. Technol. 2011, 45, 7100–7106. [Google Scholar] [CrossRef] [Scilit] [PubMed]
  3. Shizas, I.; Bagley, D.M. Experimental determination of energy content of unknown organics in municipal wastewater streams. J. Energy Eng. 2004, 130, 45–53. [Google Scholar] [CrossRef] [Scilit]
  4. Heidrich, E.S.; Curtis, T.P.; Dolfing, J. Determination of the internal chemical energy of wastewater. Environ. Sci. Technol. 2011, 45, 827–832. [Google Scholar] [CrossRef] [Scilit]
  5. Pratap, V.; Kumar, S.; Yadav, B.R. Sewage sludge management and enhanced energy recovery using anaerobic digestion: An insight. Water Sci. Technol. 2024, 90, 696–720. [Google Scholar] [CrossRef] [Scilit]
  6. Huang, X. The promotion of anaerobic digestion technology upgrades in waste stream treatment plants for circular economy in the context of “dual carbon”: Global status, development trend, and future challenges. Water 2024, 16, 3718. [Google Scholar] [CrossRef] [Scilit]
  7. Rachbauer, L.; Granda, C.B.; Shrestha, S.; Fuchs, W.; Gabauer, W.; Singer, S.W.; Simmons, B.A.; Urgun-Demirtas, M. Energy and nutrient recovery from municipal and industrial waste and wastewater-a perspective. J. Ind. Microbiol. Biotechnol. 2024, 51, kuae040. [Google Scholar] [CrossRef] [Scilit]
  8. Wang, C.; Deng, S.-H.; You, N.; Bai, Y.; Jin, P.; Han, J. Pathways of wastewater treatment for resource recovery and energy minimization towards carbon neutrality and circular economy: Technological opinions. Front. Environ. Chem. 2023, 4, 1255092. [Google Scholar] [CrossRef] [Scilit]
  9. Meerburg, F.A.; Boon, N.; Van Winckel, T.; Vercamer, J.A.R.; Nopens, I.; Vlaeminck, S.E. Toward energy-neutral wastewater treatment: A high-rate contact stabilization process to maximally recover sewage organics. Bioresour. Technol. 2015, 179, 373–381. [Google Scholar] [CrossRef] [Scilit]
  10. Jimenez, J.A.; La Motta, E.J.; Parker, D.S. Kinetics of removal of particulate chemical oxygen demand in the activated-sludge process. Water Environ. Res. 2005, 77, 437–446. [Google Scholar] [CrossRef] [Scilit] [PubMed]
  11. Jimenez, J.; Miller, M.; Bott, C.; Murthy, S.; De Clippeleir, H.; Wett, B. High-rate activated sludge system for carbon management -Evaluation of crucial process mechanisms and design parameters. Water Res. 2015, 87, 476–482. [Google Scholar] [CrossRef] [Scilit] [PubMed]
  12. Guthi, R.S.; Tondera, K.; Gillot, S.; Buffiere, P.; Boillot, M.; Chazarenc, F. A-Stage process—Challenges and drawbacks from lab to full scale studies: A review. Water Res. 2022, 226, 119044. [Google Scholar] [CrossRef] [Scilit] [PubMed]
  13. Rahman, A.; Meerburg, F.A.; Ravadagundhi, S.; Wett, B.; Jimenez, J.; Bott, C.; Al-Omari, A.; Riffat, R.; Murthy, S.; De Clippeleir, H. Bioflocculation management through high-rate contact-stabilization: A promising technology to recover organic carbon from low-strength wastewater. Water Res. 2016, 104, 485–496. [Google Scholar] [CrossRef] [Scilit]
  14. Meerburg, F.A.; Boon, N.; Van Winckel, T.; Pauwels, K.T.G.; Vlaeminck, S.E. Live fast, die young: Optimizing retention times in high-rate contact stabilization for maximal recovery of organics from wastewater. Environ. Sci. Technol. 2016, 50, 9781–9790. [Google Scholar] [CrossRef] [Scilit]
  15. AlSayed, A.; Soliman, M.; Eldyasti, A. The A-stage process to promote bioflocculation and microbial storage for carbon redirection: Current perspectives and future research directions. Rev. Environ. Sci. Bio/Technol. 2023, 22, 1009–1035. [Google Scholar] [CrossRef] [Scilit]
  16. He, L.; Guo, B.; Vlaeminck, S.E.; Wang, M. Deciphering the interplay of sludge age and aeration on reactor performance and microbial dynamics in high-rate contact stabilization. ACS ES T Eng. 2024, 4, 851–860. [Google Scholar] [CrossRef] [Scilit]
  17. Sakurai, K.; Okayasu, Y.; Abe, C. Energy recovery from organic matter in municipal wastewater using a two-stage system with high-rate contact stabilization and activated sludge processes under seasonal water temperature variations. Environ. Sci. Water Res. Technol. 2025, 11, 1016–1025. [Google Scholar] [CrossRef] [Scilit]
  18. Rahman, A.; Hasan, M.; Meerburg, F.; Jimenez, J.A.; Miller, M.W.; Bott, C.B.; Al-Omari, A.; Murthy, S.; Shaw, A.; De Clippeleir, H.; et al. Moving forward with A-stage and high-rate contact-stabilization for energy efficient water resource recovery facility: Mechanisms, factors, practical approach, and guidelines. J. Water Process Eng. 2020, 36, 101329. [Google Scholar] [CrossRef] [Scilit]
  19. Gori, R.; Giaccherini, F.; Jiang, L.M.; Sobhani, R.; Rosso, D. Role of primary sedimentation on plant-wide energy recovery and carbon footprint. Water Sci. Technol. 2013, 68, 870–878. [Google Scholar] [CrossRef] [Scilit]
  20. Rahman, A.; De Clippeleir, H.; Thomas, W.; Jimenez, J.A.; Wett, B.; Al-Omari, A.; Murthy, S.; Riffat, R.; Bott, C. A-stage and high-rate contact-stabilization performance comparison for carbon and nutrient redirection from high-strength municipal wastewater. Chem. Eng. J. 2019, 357, 737–749. [Google Scholar] [CrossRef] [Scilit]
  21. Versprille, A.I.; Zuurveen, B.; Stein, T. The A–B process: A novel two stage wastewater treatment system. Water Sci. Technol. 1985, 17, 235–246. [Google Scholar] [CrossRef] [Scilit]
  22. Modin, O.; Persson, F.; Wilen, B.M.; Hermansson, M. Nonoxidative removal of organics in the activated sludge process. Crit. Rev. Environ. Sci. Technol. 2016, 46, 635–672. [Google Scholar] [CrossRef] [Scilit]
  23. Sakurai, K.; Okayasu, Y. Improvement of organic carbon recovery from wastewater by changing water temperature in high-rate contact stabilization process. Int. J. Environ. Sci. Technol. 2025, 22, 2127–2136. [Google Scholar] [CrossRef] [Scilit]
  24. Sakurai, K.; Abe, C. Enhanced biomethane production from organic matter recovered from municipal wastewater by a pilot-scale plant using continuous high-rate contact stabilization process. Sci. Rep. 2026, 16, 11078. [Google Scholar] [CrossRef] [Scilit]
  25. Fu, S.; Li, D.; Fu, K.; Zhu, Y.; Yang, S.; Zhang, X.; Zhang, J. Towards a high-rate operation of contact stabilization process: Challenges of flocculation and floc stability. J. Environ. Manag. 2024, 370, 123014. [Google Scholar] [CrossRef] [Scilit] [PubMed]
  26. Jiang, Z.; Deng, M.; Qiu, S.; Fu, M.; Yuan, M.; Wen, Q.; Jia, X. Indicative impacts of sludge properties and biological metabolic characteristics on high-rate contact stabilization process performance. J. Environ. Manag. 2024, 370, 122569. [Google Scholar] [CrossRef] [Scilit] [PubMed]
  27. Li, X.Y.; Yang, S.F. Influence of loosely bound extracellular polymeric substances (EPS) on the flocculation, sedimentation and dewaterability of activated sludge. Water Res. 2007, 41, 1022–1030. [Google Scholar] [CrossRef] [Scilit]
  28. Tan, K.N.; Chua, H. COD adsorption capacity of the activated sludge—Its determination and application in the activated sludge process. Environ. Monit. Assess. 1997, 44, 211–217. [Google Scholar] [CrossRef] [Scilit]
  29. Guellil, A.; Thomas, F.; Block, J.C.; Bersillon, J.L.; Ginestet, P. Transfer of organic matter between wastewater and activated sludge flocs. Water Res. 2001, 35, 143–150. [Google Scholar] [CrossRef] [Scilit]
  30. Zhang, X.; Li, X.; Zhang, Q.; Peng, Q.; Zhang, W.; Gao, F. New insight into the biological treatment by activated sludge: The role of adsorption process. Bioresour. Technol. 2014, 153, 160–164. [Google Scholar] [CrossRef] [Scilit]
  31. Lu, J.; Lu, Q.; Hu, Q.; Qiu, B. Recovery of organic matters by activated sludge from municipal wastewater: Performance and characterization. Environ. Res. 2024, 252, 118829. [Google Scholar] [CrossRef] [Scilit]
  32. Yetis, Ü.; Tarlan, E. Improvement of primary settling performance with activated sludge. Environ. Technol. 2002, 23, 363–372. [Google Scholar] [CrossRef] [Scilit]
  33. Ross, R.D.; Crawford, G.V. The influence of waste activated sludge on primary clarifier operation. J. (Water Pollut. Control Fed.) 1985, 57, 1022–1026. [Google Scholar]
  34. Diamantis, V.; Eftaxias, A.; Bundervoet, B.; Verstraete, W. Performance of the biosorptive activated sludge (BAS) as pre-treatment to UF for decentralized wastewater reuse. Bioresour. Technol. 2014, 156, 314–321. [Google Scholar] [CrossRef] [Scilit] [PubMed]
  35. Araneda, M.; Pavez, J.; Luza, B.; Jeison, D. Use of activated sludge biomass as an agent for advanced primary separation. J. Environ. Manag. 2017, 192, 156–162. [Google Scholar] [CrossRef] [Scilit]
  36. Shen, N.; Wei, L.; Wang, X.; Yang, F.; Ma, J.; Chen, Y.; Zhou, Y. Making waves: Reevaluating iron dosing for carbon recovery in mainstream wastewater treatment system. Water Res. 2025, 283, 123875. [Google Scholar] [CrossRef] [Scilit] [PubMed]
  37. Oshiki, M.; Yang, Y.; Onuki, M.; Satoh, H.; Peng, Y.-Z.; Mino, T. Occurrence of polyhydroxyalkanoate as temporal carbon storage material in activated sludge during the removal of organic pollutants. J. Water Environ. Technol. 2008, 6, 77–83. [Google Scholar] [CrossRef] [Scilit]
  38. Soda, S.; Iwama, K.; Yokoe, K.; Okada, Y.; Ike, M. High methane production potential of activated sludge accumulating polyhydroxyalkanoates in anaerobic digestion. Biochem. Eng. J. 2016, 114, 283–287. [Google Scholar] [CrossRef] [Scilit]
  39. Mamais, D.; Jenkins, D.; Pitt, P. A rapid physical-chemical method for the determination of readily biodegradable soluble COD in municipal wastewater. Water Res. 1993, 27, 195–197. [Google Scholar] [CrossRef] [Scilit]
  40. American Public Health Association; American Water Works Association; Water Environment Federation. Standard Methods for the Examination of Water and Wastewater, 23rd ed.; American Public Health Association: Washington, DC, USA, 2017. [Google Scholar]
  41. Rahman, A.; Mosquera, M.; Thomas, W.; Jimenez, J.A.; Bott, C.; Wett, B.; Al-Omari, A.; Murthy, S.; Riffat, R.; De Clippeleir, H. Impact of aerobic famine and feast condition on extracellular polymeric substance production in high-rate contact stabilization systems. Chem. Eng. J. 2017, 328, 74–86. [Google Scholar] [CrossRef] [Scilit]
  42. Japan Meteorological Agency. Climate Statistics. Available online: http://www.jma.go.jp/jma/index.html (accessed on 21 February 2026).
  43. Holliger, C.; Alves, M.; Andrade, D.; Angelidaki, I.; Astals, S.; Baier, U.; Bougrier, C.; Buffiere, P.; Carballa, M.; de Wilde, V.; et al. Towards a standardization of biomethane potential tests. Water Sci. Technol. 2016, 74, 2515–2522. [Google Scholar] [CrossRef] [Scilit] [PubMed]
  44. Lallement, A.; Siaud, A.; Peyrelasse, C.; Kaparaju, P.; Schraauwers, B.; Maunas, S.; Monlau, F. Impact of operational factors, inoculum origin, and feedstock preservation on the biochemical methane potential. Bioengineering 2021, 8, 176. [Google Scholar] [CrossRef] [Scilit]
  45. Sancho, I.; Lopez-Palau, S.; Arespacochaga, N.; Cortina, J.L. New concepts on carbon redirection in wastewater treatment plants: A review. Sci. Total Environ. 2019, 647, 1373–1384. [Google Scholar] [CrossRef] [Scilit]
  46. Fau, Z.; Azais, A.; Gillot, S.; Chazarenc, F.; Derlon, N. Impact of slowly biodegradable COD and loosely bound polymeric substances accumulation in high-rate activated sludge: Implications for bioflocculation and organic matter harvesting. ACS ES T Eng. 2025, 5, 3632–3644. [Google Scholar] [CrossRef] [Scilit]
  47. VDI 4630; Fermentation of Organic Materials—Characterization of the Substrate, Sampling, Collection of Material Data, Fermentation Tests. VDI-Gesellschaft Energie und Umwelt: Düsseldorf, Germany, 2016.
  48. Appels, L.; Baeyens, J.; Degrève, J.; Dewil, R. Principles and potential of the anaerobic digestion of waste-activated sludge. Prog. Energy Combust. Sci. 2008, 34, 755–781. [Google Scholar] [CrossRef] [Scilit]
  49. McCarty, P.L. Anaerobic waste treatment fundamentals, part two, environmental requirements and control. Public Work. 1964, 95, 123–126. [Google Scholar]
  50. Holliger, C.; Astals, S.; de Laclos, H.F.; Hafner, S.D.; Koch, K.; Weinrich, S. Towards a standardization of biomethane potential tests: A commentary. Water Sci. Technol. 2021, 83, 247–250. [Google Scholar] [CrossRef] [Scilit]
  51. Yang, S.-f.; Li, X.-y. Influences of extracellular polymeric substances (EPS) on the characteristics of activated sludge under non-steady-state conditions. Process Biochem. 2009, 44, 91–96. [Google Scholar] [CrossRef] [Scilit]
  52. Suresh, A.; Grygolowicz-Pawlak, E.; Pathak, S.; Poh, L.S.; Abdul Majid, M.b.; Dominiak, D.; Bugge, T.V.; Gao, X.; Ng, W.J. Understanding and optimization of the flocculation process in biological wastewater treatment processes: A review. Chemosphere 2018, 210, 401–416. [Google Scholar] [CrossRef] [Scilit] [PubMed]
  53. Friedrich, M.; Jimenez, J.; Pruden, A.; Miller, J.H.; Metch, J.; Takacs, I. Rethinking growth and decay kinetics in activated sludge—Towards a new adaptive kinetics approach. Water Sci. Technol. 2017, 75, 501–506. [Google Scholar] [CrossRef] [Scilit]
  54. Shao, Y.; Zhang, H.; Xu, C.; Yan, G.; Wang, H.; Liu, G.-h.; Qi, L. Study on microbial characteristics of the ultra-short sludge retention time activated sludge system. Results Eng. 2025, 26, 105560. [Google Scholar] [CrossRef] [Scilit]
  55. Canals, J.; Cabrera-Codony, A.; Carbo, O.; Toran, J.; Martin, M.; Baldi, M.; Gutierrez, B.; Poch, M.; Ordonez, A.; Monclus, H. High-rate activated sludge at very short SRT: Key factors for process stability and performance of COD fractions removal. Water Res. 2023, 231, 119610. [Google Scholar] [CrossRef] [Scilit]
  56. Ekama, G.A.; Wentzel, M.C. Organic matter removal. In Biological Wastewater Treatment: Principles, Modelling and Design; Chen, G., van Loosdrecht, M.C.M., Ekama, G.A., Brdjanovic, D., Eds.; IWA Publishing: London, UK., 2023; pp. 111–160. [Google Scholar]
  57. Mancell-Egala, W.; Kinnear, D.J.; Jones, K.L.; De Clippeleir, H.; Takacs, I.; Murthy, S.N. Limit of stokesian settling concentration characterizes sludge settling velocity. Water Res. 2016, 90, 100–110. [Google Scholar] [CrossRef] [Scilit] [PubMed]
  58. Torfs, E.; Nopens, I.; Winkler, M.K.H.; Vanrolleghem, P.A.; Balemans, S.; Smets, I.Y. Settling tests. In Experimental Methods In Wastewater Treatment; Loosdrecht, M.C.M., Nielsen, P.H., Lopez-Vazquez, C.M., Brdjanovic, D., Eds.; IWA Publishing: London, UK, 2016. [Google Scholar]
  59. Ge, H.; Batstone, D.J.; Mouiche, M.; Hu, S.; Keller, J. Nutrient removal and energy recovery from high-rate activated sludge processes—Impact of sludge age. Bioresour. Technol. 2017, 245, 1155–1161. [Google Scholar] [CrossRef] [Scilit] [PubMed]
  60. Ge, H.; Batstone, D.J.; Keller, J. Operating aerobic wastewater treatment at very short sludge ages enables treatment and energy recovery through anaerobic sludge digestion. Water Res. 2013, 47, 6546–6557. [Google Scholar] [CrossRef] [Scilit] [PubMed]
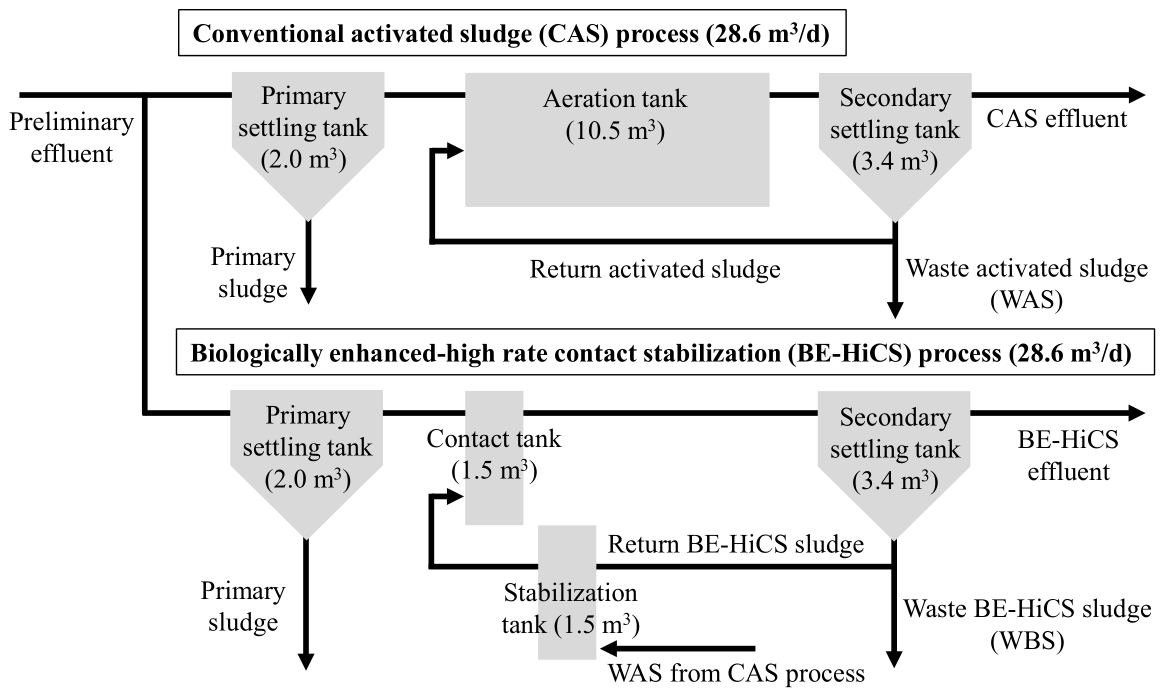
Figure 1. Flow scheme and tank capacities of the pilot plant employing the conventional activated sludge (CAS) process and the biologically enhanced high-rate contact stabilization (BE-HiCS) process.
Water 18 01127 g001
Figure 2. (a) Inflowing and outflowing daily COD mass and (b) percentage of effluent COD mass relative to primary effluent for the CAS and BE-HiCS processes. sCOD, cCOD, and pCOD denote the respective COD fractions in influent or effluent. WAS and WBS represent waste sludge generated by the CAS and BE-HiCS processes, respectively. In (b), the COD equivalent to WAS was subtracted from WBS for comparison. Error bars represent standard deviation.
Water 18 01127 g002
Figure 3. Removal rates of each organic matter fraction in the CAS, BE-HiCS, and HiCS processes. An asterisk indicates data from reference [24].
Water 18 01127 g003
Figure 4. Multiple comparison of carbon recovery rates among processes. Error bars indicate standard deviation. Different letters denote statistically significant differences at p < 0.05. HiCS process data were cited from Reference [24].
Water 18 01127 g004
Table 1. Hydraulic operating conditions of the pilot plant.
ItemUnitCAS ProcessBE-HiCS Process
Influent flow ratem3/d28.628.6
Waste sludge withdrawal ratem3/d0.241.72
Return sludge flow rate-50%50%
HRTh8.81.3
SOR of SSTm3/(m2·h)0.620.62
Notes: Hydraulic retention time (HRT) was calculated by dividing the volume of the aeration tank (CAS) or contact tank (BE-HiCS) by the influent flow rate. SOR denotes surface overflow rate. SST refers to the secondary settling tank.
Table 2. Water quality of influent and effluent.
ItemUnitInfluentCAS eff.BE-HiCS eff.
tCODmg/L265 ± 1522 ± 491 ± 14
pCODmg/L80 ± 163.5 ± 2.136 ± 8
cCODmg/L74 ± 44.0 ± 2.130 ± 5
sCODmg/L110 ± 2414 ± 225 ± 3
TSSmg/L40 ± 72.8 ± 1.430 ± 14
VSSmg/L36 ± 62.6 ± 1.227 ± 14
BODmg/L156 ± 238.5 ± 0.655 ± 10
ATU-BODmg/Ln.m.5.0 ± 1.338 ± 7
NH4+-Nmg/L31 ± 30.2 ± 0.116 ± 2
NO2-Nmg/L<0.10.8 ± 0.4<0.1
NO3-Nmg/L<0.12.1 ± 0.3<0.1
Notes: Primary effluent was used as influent. n.m. indicates not measured. Values following ± represent standard deviation. eff. indicates effluent.
Table 3. Operating conditions of the CAS and BE-HiCS processes.
ItemUnitCAS ProcessBE-HiCS Process
Stabilization TankContact Tank
WT°C23 ± 122 ± 2n.m.
DOmg/L2.8 ± 0.24.5 ± 0.7<0.1
MLSSmg-TSS/L1560 ± 611306 ± 241403 ± 24
MLVSSmg-VSS/L1384 ± 581179 ± 220365 ± 18
LB-EPSmg-COD/g-VSS23 ± 3n.m.60 ± 4
TB-EPSmg-COD/g-VSS186 ± 11n.m.261 ± 10
SVImL/g176 ± 29n.m.247 ± 27
SRTd18 ± 40.84 ± 0.10
F/M ratiog-BOD/(g-VSS·d)0.31 ± 0.042.0 ± 0.5
Notes: WT indicates water temperature. n.m. indicates not measured. MLVSS means mixed liquor volatile suspended solids. Values following ± represent standard deviation.
Table 4. Results of the biomethane potential test for each series.
ItemUnitWASWBSMCC
pH-7.7 ± 0.07.8 ± 0.07.6 ± 0.0
Alkalinityg-CaCO3/L5.04.84.2
Ammoniumg-NH4+-N/L1.11.11.1
BMPg-CODCH4/g-COD0.49 ± 0.010.53 ± 0.020.82 ± 0.02
RSD-2.5%4.6%2.5%
Notes: WAS denotes waste activated sludge, WBS denotes waste BE-HiCS sludge, and RSD denotes relative standard deviation. Microcrystalline cellulose (MCC) was used as the positive control substrate. The BMP values for WAS, WBS, and MCC were calculated after subtracting the BMP of the blank.
Table 5. Carbon redirection and carbon harvesting rates in the CAS, BE-HiCS, and HiCS processes.
ItemUnitCAS ProcessBE-HiCS ProcessHiCS Process
pCOD/tCOD in influentg-COD/g-COD0.31 ± 0.070.31 ± 0.07
(0.40 ± 0.05 *)
0.44 ± 0.10
Carbon redirection rateg-COD/g-COD0.16 ± 0.030.61 ± 0.06
(0.53 ± 0.06 *)
0.35 ± 0.05
Carbon harvesting rateg-COD/g-COD0.87 ± 0.060.78 ± 0.040.35 ± 0.13
Carbon recovery rateg-COD/g-COD0.15 ± 0.030.47 ± 0.06
(0.41 ± 0.06 *)
0.13 ± 0.06
Notes: The asterisk indicates that WAS generated from the CAS process was added to the inflow organic load. Dagger indicates data cited from reference [24].
Disclaimer/Publisher’s Note: The statements, opinions and data contained in all publications are solely those of the individual author(s) and contributor(s) and not of MDPI and/or the editor(s). MDPI and/or the editor(s) disclaim responsibility for any injury to people or property resulting from any ideas, methods, instructions or products referred to in the content.