Article

Assessing the Effects of Climate Change on the Hydrology of a Small Catchment: The Krapina River near Kupljenovo

by
Ognjen Bonacci
1,
Ana Žaknić-Ćatović
2,*,
Tanja Roje-Bonacci
1 and
Duje Bonacci
3
1
Faculty of Civil Engineering, Architecture and Geodesy, Split University, Matice Hrvatske 15, 21000 Split, Croatia
2
Department of Physical and Environmental Sciences, University of Toronto Scarborough, 1265 Military Trail, Scarborough, Toronto, ON M1C 1A4, Canada
3
Faculty of Croatian Studies, University of Zagreb, Borongajska Cesta 83d, 10000 Zagreb, Croatia
*
Author to whom correspondence should be addressed.
Water 2025, 17(9), 1403; https://doi.org/10.3390/w17091403
Submission received: 9 April 2025 / Revised: 2 May 2025 / Accepted: 5 May 2025 / Published: 7 May 2025

Abstract

:
The aim of this study was to examine variations in the hydrological regime of the Krapina River from 1964 to 2023. The river basin spans 1263 km2 and is characterized by a temperate, humid continental climate with warm summers. Hydrological data from the Kupljenovo gauging station, which monitors 91.1% of the basin (1150 km2), indicate an average annual discharge of 11.2 m3/s, ranging from 3.25 m3/s to 18.3 m3/s. Over the 60-year study period, the minimum mean daily discharges show a statistically insignificant increasing trend, while the mean annual and maximum annual mean daily discharges exhibit statistically insignificant declines. Annual precipitation averages 1037 mm, varying between 606 mm and 1459 mm, with a non-significant decreasing trend. In contrast, the mean annual air temperatures demonstrate a statistically significant increasing trend, with a pronounced intensification beginning in 1986. The annual runoff coefficients series exhibits a statistically insignificant downward trend, with an average value of 0.293 (range: 0.145–0.399). Application of the New Drought Index (NDI) revealed a marked increase in the frequency of strong and extreme droughts since 2000.

1. Introduction

Recent climate changes have altered the characteristics of interconnected climatic variables, significantly affecting natural processes linked to the hydrological cycle. Understanding how these changes influence river hydrology across different temporal and spatial scales is of particular interest.
Rivers play a crucial role in Earth’s system, acting as key regulators of global, regional, and local hydrological cycles. They shape ecological processes and influence diverse social and economic activities within their watersheds and beyond. As integral components of terrestrial water balance, river flows are highly sensitive to shifts in precipitation, evapotranspiration, and soil moisture.
Research on global climate change has primarily focused on the rising air temperatures observed in recent decades and their consequences for natural and societal systems [1,2,3,4]. The scientific community has devoted a significant amount of attention to modeling future climate scenarios, yet uncertainties remain regarding the intensity of future changes. While the exact intensity of this concerning process in the future remains uncertain, scientists agree that it will persist. Numerous studies have confirmed, with high confidence, that global warming is intensifying all components of the global water cycle [5,6,7]. Continued warming is expected to accelerate hydrological processes, increasing water exchange between land, oceans, and the atmosphere.
Climate warming enhances evapotranspiration, increases the frequency of intense short-term precipitation events, and alters intra-annual precipitation patterns. Investigating how rising temperatures amplify hydrological cycles at regional and river-basin scales is therefore essential. Reliable answers can and should be derived from detailed analyses of past hydrological processes in specific river basins. In this vein, emphasis should be placed on processes ranging from the second half of the 20th century to the present, with recent decades showing particularly pronounced warming trends.
Changes in precipitation amounts, intensity, and distribution, along with interactions between soil moisture and evapotranspiration, can trigger significant and hazardous hydrological variations. Evapotranspiration has increased due to altered precipitation regimes, rising temperatures, and recently observed greening of vegetation in high northern latitudes [8]. The extent of these anomalies depends on watershed characteristics and climate change intensity. Climate change profoundly impacts river hydrology and thermal regimes, altering ecosystems and affecting the availability of water for human use [9]. Assessing the effects of climate change on individual river systems with high precision is crucial. Understanding the extent to which these changes may disrupt freshwater ecosystems and water management sectors is essential. Numerous open watercourses and their surrounding environments are already experiencing declining water quality, habitat degradation, and reduced availability of water for hydropower and drinking water. These challenges are expected to intensify in the future, with region-specific manifestations [10].
Numerous researchers have investigated hydrological regime changes in open watercourses across various regions. Abbas et al. [11] conducted a detailed study on the impact of climate change on aquatic environments and river hydrology, highlighting strong correlations between climatological parameters and hydrological patterns. Their findings indicate that rising global temperatures significantly influence streamflow variations and evapotranspiration processes. Dai et al. [12] analyzed streamflow variations in 200 of the world’s largest rivers, including the Congo, Mississippi, Yenisei, Paraná, Ganges, Columbia, Uruguay, and Niger, over the 1948–2004 period. Their results reveal substantial annual discharge variability, with statistically significant decreasing trends in 45 rivers and increasing trends in 19. Alkama et al. [5] emphasized that regional climate processes primarily drive streamflow trends in large rivers, with precipitation playing a dominant role, while acknowledging the influence of global warming on permafrost and glacier-fed rivers at high latitudes. Gudmundsson et al. [13] reported on the heterogeneous behavior of trends in low, medium, and high waters worldwide during the 1971–2010 period. They analyzed discharge records from 7250 gauging stations worldwide, providing clear evidence that externally forced climate change is a key driver of observed trends in mean and extreme streamflows. In contrast, Douglas et al. [14] found no significant trends in high-flow events in the United States but reported increasing trends in low flows, particularly in the Midwest and, to a lesser extent, in Ohio and the Upper Midwest regions.
While there is broad scientific consensus that climate change—primarily rising global temperatures—significantly influences hydrological trends in large river basins, smaller catchments (particularly those under 1000 km2) are often more affected by anthropogenic interventions [15]. Bonacci [16] underscored the necessity of considering both natural and human-induced drivers of hydrological cycle changes across different spatial and temporal scales. When considering factors that influence the hydrological cycle at different temporal and/or spatial scales, it is necessary to examine numerous potential causes and understand their interactions. Understanding these interactions is essential for accurately assessing hydrological responses to climate change.
Tsegaw et al. [17] investigated the impacts of climate change on the hydrological regimes of small catchments in Western Norway where there are no hydrological observations. The results were obtained using multiple global and regional climate models. The flow duration curves for all the studied catchments showed there will be more wet periods in the future than during the reference period (1981–2011). Their results suggest an increase in annual mean discharge by 16–33% and an increase in annual maximum peak flows by 29–38%. Return-period flood magnitudes (2–200 years) are projected to increase by 16–43%.
Pumo et al. [18] studied the potential impacts of climatic variations on the hydrological regimes of small river catchments in Mediterranean, seasonally dry regions. Their study provides quantitative estimates of potential changes in flow duration curves and the distribution of surface and groundwater contributions to river flow while also examining the impact of soil and vegetation composition. Their findings reveal diverse hydrological responses across the studied catchments, with a significant downward shift in the flow duration curves, a substantial reduction in mean annual flows, and significant seasonal changes in runoff partitioning between surface and subsurface components.
De Girolamo et al. [19] examined the long-term effects of climate change on the Celone River (SE Italy), which experiences intermittent flow. Using the SWAT (Soil and Water Assessment Tool) model, they projected reductions in mean annual flow of 21–39%, decreases in maximum 90-day annual flow of up to 18%, and an extension of dry periods by up to 12 days. Aykut and Turoğlu [20] studied two small watersheds (<100 km2) in Northwestern Turkey and found weak correlations between discharge and temperature but a strong correlation between discharge and precipitation.
The above relatively brief review of studies highlights that hydrological regimes in different climate regions respond differently to climate change. To improve our understanding, detailed analyses of streamflow variability and trends in the hydrological parameters of open watercourses—particularly for characteristic low, mean, and high flows—are essential over observation periods spanning 50–100 years [21]. This period provides a robust dataset of reliable hydrological measurements.
A similar analysis will be carried out in this article, focusing on the behavior of characteristic annual flows observed from 1964 to 2023 at the Kupljenovo gauging station on the Krapina River. The primary objective is to assess the relative influence of annual precipitation and mean air temperature on annual minimum, mean, and maximum streamflows.
The Krapina River basin is globally recognized for its archaeological significance. The Krapina Neanderthal site, located in the Hušnjakovo Cave near Krapina (Figure 1), contains one of the largest collections of Neanderthal fossils, excavated by Dragutin Gorjanović-Kramberger between 1899 and 1905. The collection comprises nearly 900 fragmented bones from approximately 70 individuals aged 3 to 27 [22,23].
The aim of this study is to foster a more comprehensive understanding of how climate change affects water resources in a small, undisturbed river basin where natural characteristics have remained largely unaffected by anthropogenic interventions. To achieve this, several drought indices were applied; these are described in detail in the following sections. By analyzing the time series of annual runoff coefficients, this study evaluates the extent to which trends and variations in annual precipitation and mean annual temperature have contributed to the observed decline in runoff values. The analysis also identifies when the declining trend began.

2. Materials and Methods

2.1. Description of the Basin and Used Data

The Krapina River Basin is located in Northern Croatia, near the border with Slovenia (Figure 1). The Krapina River originates from the slopes of Mount Ivanščica, whose highest peak reaches 1061 m above sea level (m a.s.l.), while the river’s source is at an altitude of approximately 1000 m a.s.l. The river flows into the Sava River at an elevation of 125 m a.s.l. The total area of the Krapina River Basin is 1236 km2. Agricultural land covers 58% of the basin (of which 13% consists of pastures and meadows), while forests occupy 40%. The remaining 2% of the basin consists of urbanized, industrial areas and transportation infrastructure [24,25]. Notably, the basin’s natural characteristics remain largely unaltered by human activities. The watershed boundary extends 209.7 km and is asymmetrical, with the right side (867 km2) being significantly larger than the left side (369 km2). The length of the Krapina River’s main channel varies slightly between sources, ranging from 68 km [26] to 70.26 km [25,27].
According to the Köppen classification [28], the Krapina Basin falls under the Cfb climate type, characterized as a moderately warm and humid continental climate with warm summers [29,30].
The hydrological regime of the Krapina River follows a Peripannonian pluvial–nival pattern, with two peak flows—one in March or April and a more pronounced one in November or December. The primary minimum occurs in August, while the secondary, less pronounced minimum is regularly recorded in February [31].
This study utilizes hydrological data from the Kupljenovo hydrological station, located 13.8 km upstream from the Krapina River’s confluence with the Sava River, at a zero-gauge elevation of 128.88 m a.s.l. (Figure 1). This station covers 93% of the basin area (1150 km2) and provides 60 years (1964–2023) of annual mean, minimum, and maximum daily flow data [32].
This study uses precipitation and air temperature data recorded at the Stubičke Toplice climatological station (45°58′31″ N; 15°55′26″ E; 180 m a.s.l.) over the 1961–2024 period (64 years).
All hydrological and meteorological data were obtained from the official records of the Croatian Meteorological and Hydrological Service (DHMZ), Zagreb.
Several additional climatological and rain gauge stations (Zabok, Pregrada, Krapina, Kumrovec, and Klanjec) exist within the basin. However, due to their short and interrupted datasets, they were excluded from primary analyses, but they were used for climatological regime assessments within the Krapina Basin. The coefficient of determination (R2) for annual precipitation comparisons between stations ranged from 0.741 (Stubičke Toplice–Klanjec) to 0.905 (Stubičke Toplice–Zabok), while for mean annual temperature, R2 values approached 0.95.
Furthermore, the Bizeljsko climatological station (46°00′58″ N, 15°41′46″ E; 175 m a.s.l.) in Slovenia (Figure 1), which provides 74 years of records (1951–2024) publicly available online from the Environmental Agency of the Republic of Slovenia (ARSO), was used for comparative analyses. Given its high data quality, long observation period, and proximity to the Krapina Basin, annual precipitation and mean annual air temperature data from Stubičke Toplice and Bizeljsko were compared for the overlapping period of 1961–2024 (64 years). The R2 values between Stubičke Toplice and Bizeljsko were 0.731 for precipitation and 0.871 for temperature, indicating a high degree of regional climatic uniformity.
In addition, it should be noted that the mean annual air temperature differences among the analyzed stations were within 5%, with an average deviation of less than 0.4 °C, while annual precipitation variations remained under 10%. The long-term average precipitation for the Krapina Basin is approximately 1000 mm/year.
Given the uniformity of temperature and precipitation regimes across the Krapina River Basin, the use of data from a single climatological station—Stubičke Toplice—provides a sufficiently reliable basis for the hydrological analyses conducted in this study.

2.2. Methods

Linear regression was applied to analyze the relationship between the dependent variable (discharge, Q) and independent variables (precipitation, P, and air temperature, T). This method was also used to identify linear trends in hydrological and climatological time series. The general form of the linear regression equation is
Y = (A × X) + B,
where Y is the dependent variable, X is the independent variable (representing time in trend analysis), and A and B are regression coefficients determined using the least squares method, which minimizes the squared differences between observed data and the regression line. The slope coefficient A represents the gradient of the regression line. A negative value indicates an inverse relationship between the examined parameters or a decline, while a positive value reflects an opposite interdependence (a direct relationship or an increasing trend).
Pearson’s linear correlation coefficient R quantifies the strength and direction of the linear association between two statistical variables, reflecting the likelihood that the values of one statistical variable correspond to a specific value of another statistical variable in direct or reciprocal proportionality. For each case examined in this study, correlation coefficient (R) and coefficient of determination R2 were computed. The coefficient of determination R2 is defined as the square of the correlation coefficient R. Both coefficients indicate how well one variable explains the variation of another variable in linear regression or how well the regression line fits the data. For instance, an R2 value of 0.80 (R = 0.894) indicates that 80% of the variability in Y is attributable to its linear relationship with X, while the remaining 20% reflects unexplained or non-linear variation.
The Chaddock’s scale [33] was used to interpret correlation strength based on the value of the correlation coefficient R: (1) 0.00–0.30—negligible correlation; (2) 0.30–0.50—weak correlation; (3) 0.50–0.70—moderate correlation; (4) 0.70–0.90—strong correlation; and (5) 0.90–1.00—very strong correlation [34].
The multiple linear determination coefficient RM2 was also computed in this study to evaluate the strength of the linear association between the dependent variable Y (mean annual discharge of the Krapina River at the Kupljenovo gauging station, Q) and the independent variables X1 (annual precipitation in Stubičke Toplice, P) and X2 (mean annual air temperature in Stubičke Toplice, T) [35]. The expression used to define the multiple linear determination coefficient RM2 is as follows:
RM2 = (R2Y,X1 + R2Y,X2 − 2 × RY,X1 × RY,X2 × RX1,X2)/(1 − R2X1,X2),
To assess the presence of statistically significant subsequences—namely, abrupt shifts or discontinuities within the analyzed time series—the Rescaled Adjusted Partial Sums (RAPS) method was applied [36,37]. The RAPS method enables the identification of sub-periods characterized by statistically significant deviations from the long-term mean of the examined variable. The expression for defining RAPS statistics is:
RAPSk = Σk ((Yk –YN)/SN),
where Yk represents the average value of the analyzed parameter in time interval k, YN is the average value over the entire time series, SN is the standard deviation of the entire series consisting of N elements, and k = 1, 2, …, N denotes the summation index.
To assess the statistical significance of differences between the mean values of two adjacent subsequences defined by the RAPS method, the F-test and t-test were applied [38].
While the F-test was used to evaluate the statistical significance of variance differences, the t-test assessed whether the average values of two consecutive time subsets differ significantly. A significance level of p < 0.05 was selected in both tests as the threshold for accepting the hypothesis that the mean values of adjacent subsequences differ statistically significantly.
For the series of mean annual discharges at Kupljenovo (1964–2023), annual runoff coefficients (c) were calculated based on the corresponding annual precipitation series from Stubičke Toplice. The runoff coefficient represents the ratio of the annual volume of water discharged at the analyzed stream profile to the volume of precipitation falling over the corresponding catchment during the same year. This coefficient is a crucial hydrological indicator in the analysis of runoff processes and water balance [39].
To evaluate the statistical significance of monotonic trends in hydrological and climatological parameters, the Mann–Kendall test [40,41] was applied using the software developed by Shourov and Mahmud [42]. The null hypothesis assumes there is no significant trend, while the alternative hypothesis suggests a statistically significant trend. A probability level of p < 0.05 is used as the criterion for accepting the alternative hypothesis.
Numerous methods and quantitative indicators, commonly referred to as indices, have been developed to study drought, one of the most dangerous natural disasters [43,44,45,46,47,48].
Using mean annual air temperature (T) and annual precipitation (P) data from Stubičke Toplice for the 1961–2024 period, values of the New Drought Index (NDI) [49] were calculated on a calendar-year scale. This index is a recent drought intensity indicator that has been applied in various regions worldwide and has proven to be a reliable measure of drought [37,50,51,52]. Weaver et al. [53] used it to redefine drought in the state of Missouri (USA) during the 2018–2024 period. Regarding its properties, they state the following: “The New Drought Index aims to address some of the limitations of other indices by incorporating diverse parameters, including vegetation health and soil moisture, through normalized monthly and seasonal precipitation and temperature anomalies, to provide a more holistic evaluation of drought conditions. To complement this framework, we incorporate the New Drought Index (NDI), a recently developed quantitative metric that integrates atmospheric anomalies. However, even advanced indices like the NDI may benefit from supplementary qualitative insights that reflect localized impacts. The NDI is a composite index that integrates precipitation, soil moisture, and vegetation health, offering a more holistic view of drought compared to traditional indices.”.
The expression for defining the NDI [49] is as follows:
NDIi = [(Pi − Pav)/SP] − [(Ti − Tav)/ST],
where Pi is the precipitation in year i, Pav is the average value of the precipitation series for the analyzed period, SP is the standard deviation of the annual precipitation series, Ti is the mean annual air temperature in year i, Tav is the average value of the analyzed series of mean annual air temperatures for the period, and ST is the standard deviation of the series of mean annual air temperatures.
Drought monitoring and early-warning systems are essential components of drought preparedness. These systems typically rely on drought indicators, such as the Standardized Precipitation Index (SPI), which is not an effective indicator for hydrological droughts. To improve the understanding of drought hazards in the United Kingdom, Barker et al. [54] linked the SPI with the Standardized Streamflow Index (SQI). Similarly, Nalbantis and Tsakiris [55] applied the Streamflow Drought Index (SDI) to reliable data from the Evinos River Basin in Greece, demonstrating its suitability for inclusion in the Drought Watch System, particularly in basins with significant storage infrastructure or sparse streamflow records. The standardized streamflow index SQI of the series of mean annual discharges of the Krapina River at the Kupljenovo gauging station was also calculated in this study. The expression for defining the SQI is [54]
SQIi = (Qi − Qav)/SQ,
where Qi is the mean annual discharge in year i, Qav is the average value of the series of mean annual discharges for the analyzed period, and SQ is the standard deviation of the analyzed series.
Drought intensity categories were classified based on the values of the NDI and SQI. Mild droughts occur in the NDI-SQI range from 0 to −1.0, moderate droughts are in the NDI-SQI range from −1.0 to −1.5, severe droughts occur when the NDI-SQI value is between −1.5 and −2.0, and extreme droughts are characterized by NDI-SQI values less than −2.0.

3. Results and Discussion

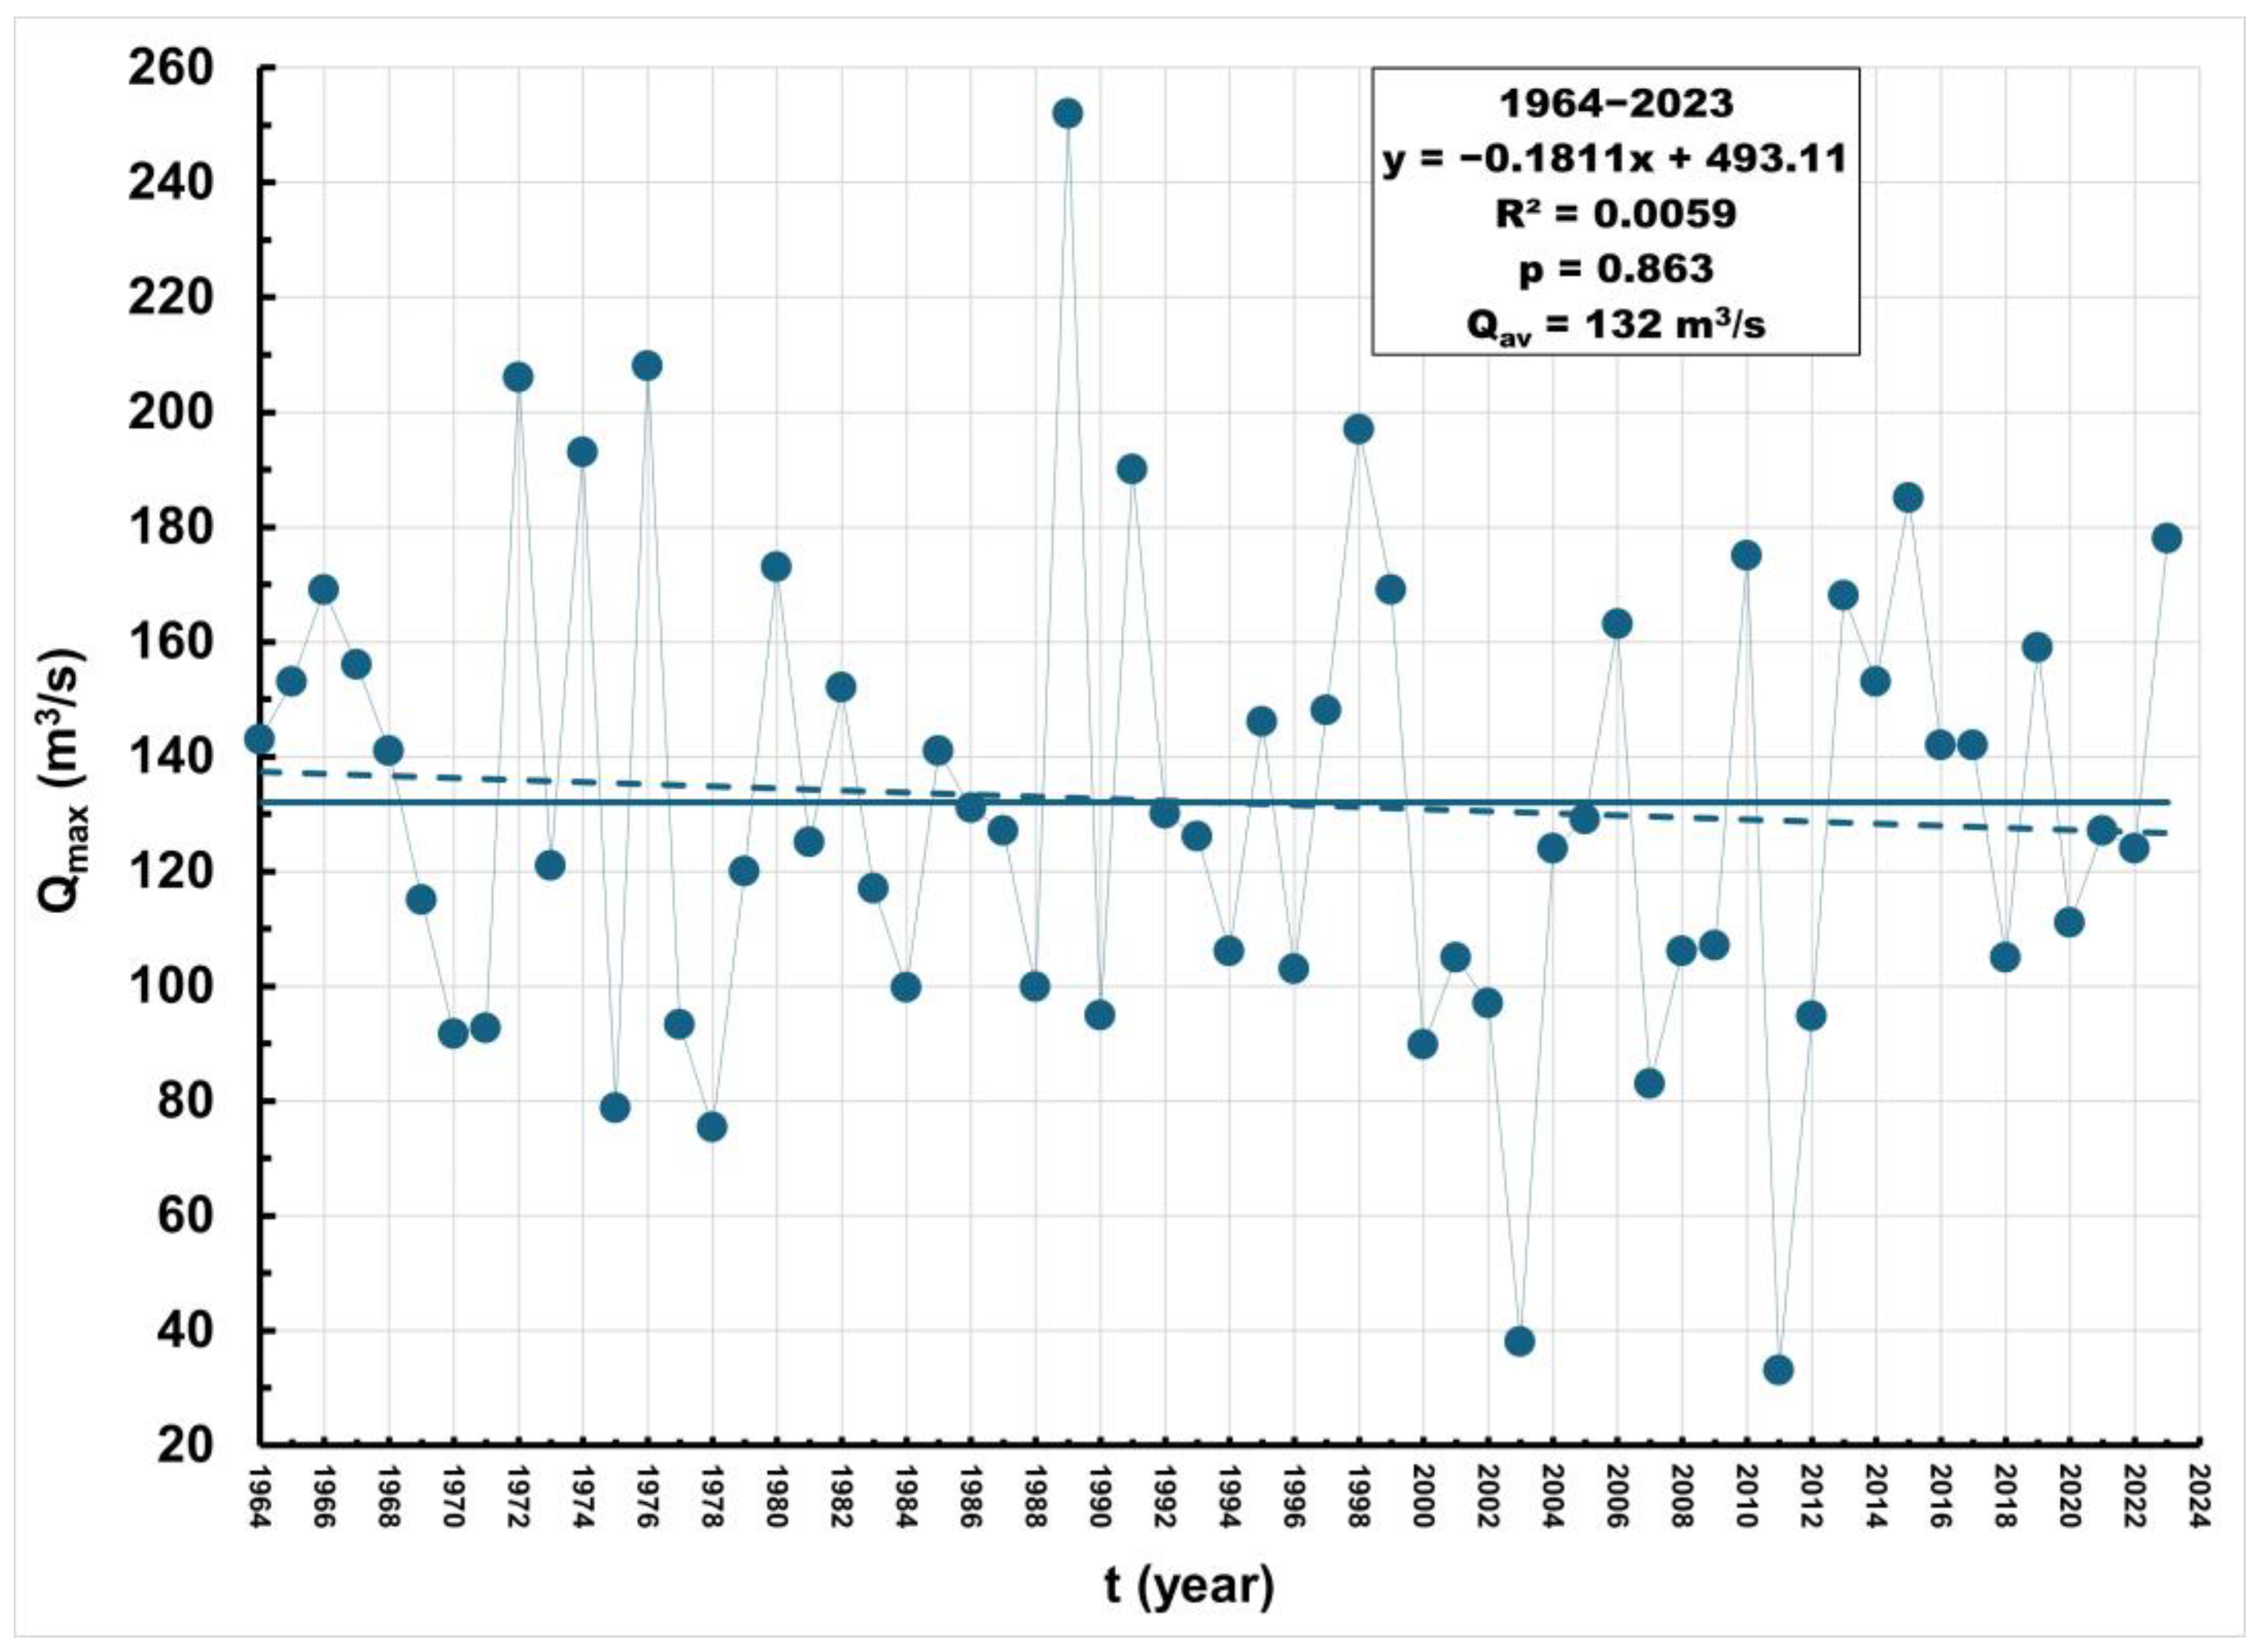
3.1. Characteristic Annual Discharges

The series of minimum annual mean daily discharges of the Krapina River at the Kupljenovo gauging station for the 1964–2023 period is shown in Figure 2. The average value is 1.27 m3/s, with values ranging from 0.343 m3/s in 2000 to a maximum of 2.51 m3/s in 1999. The observed upward trend is not statistically significant, as the p-value calculated using the Mann–Kendall test (p = 0.495) is well above the threshold of 0.05.
Figure 3 shows the series of mean annual discharges of the Krapina River at the Kupljenovo gauging station for the 1964–2023 period. The average value is 11.2 m3/s, with values ranging from the lowest observed value of 3.25 m3/s in 2011 to the highest observed value of 18.3 m3/s in 1965. An upward trend can be observed in this series, but it is not statistically significant (p = 0.121). Čanjevac and Orešić [32] analyzed the behavior of mean annual discharges of the Krapina River at the Kupljenovo station for the 1990–2009 period, finding evidence of a redistribution of flows within the year, with increased autumn and winter flows and reduced summer flows.
Figure 4 shows the series of maximum annual mean daily discharges of the Krapina River at the Kupljenovo gauging station for the 1964–2023 period. The average value is 132 m3/s, with values ranging from the lowest observed value of 33 m3/s in 2011 to the highest observed value of 252 m3/s in 1989. Within the analyzed period, the series shows a statistically insignificant downward trend, as the probability value calculated using the M-K test is significantly higher (p = 0.863) than the threshold value of 0.05.

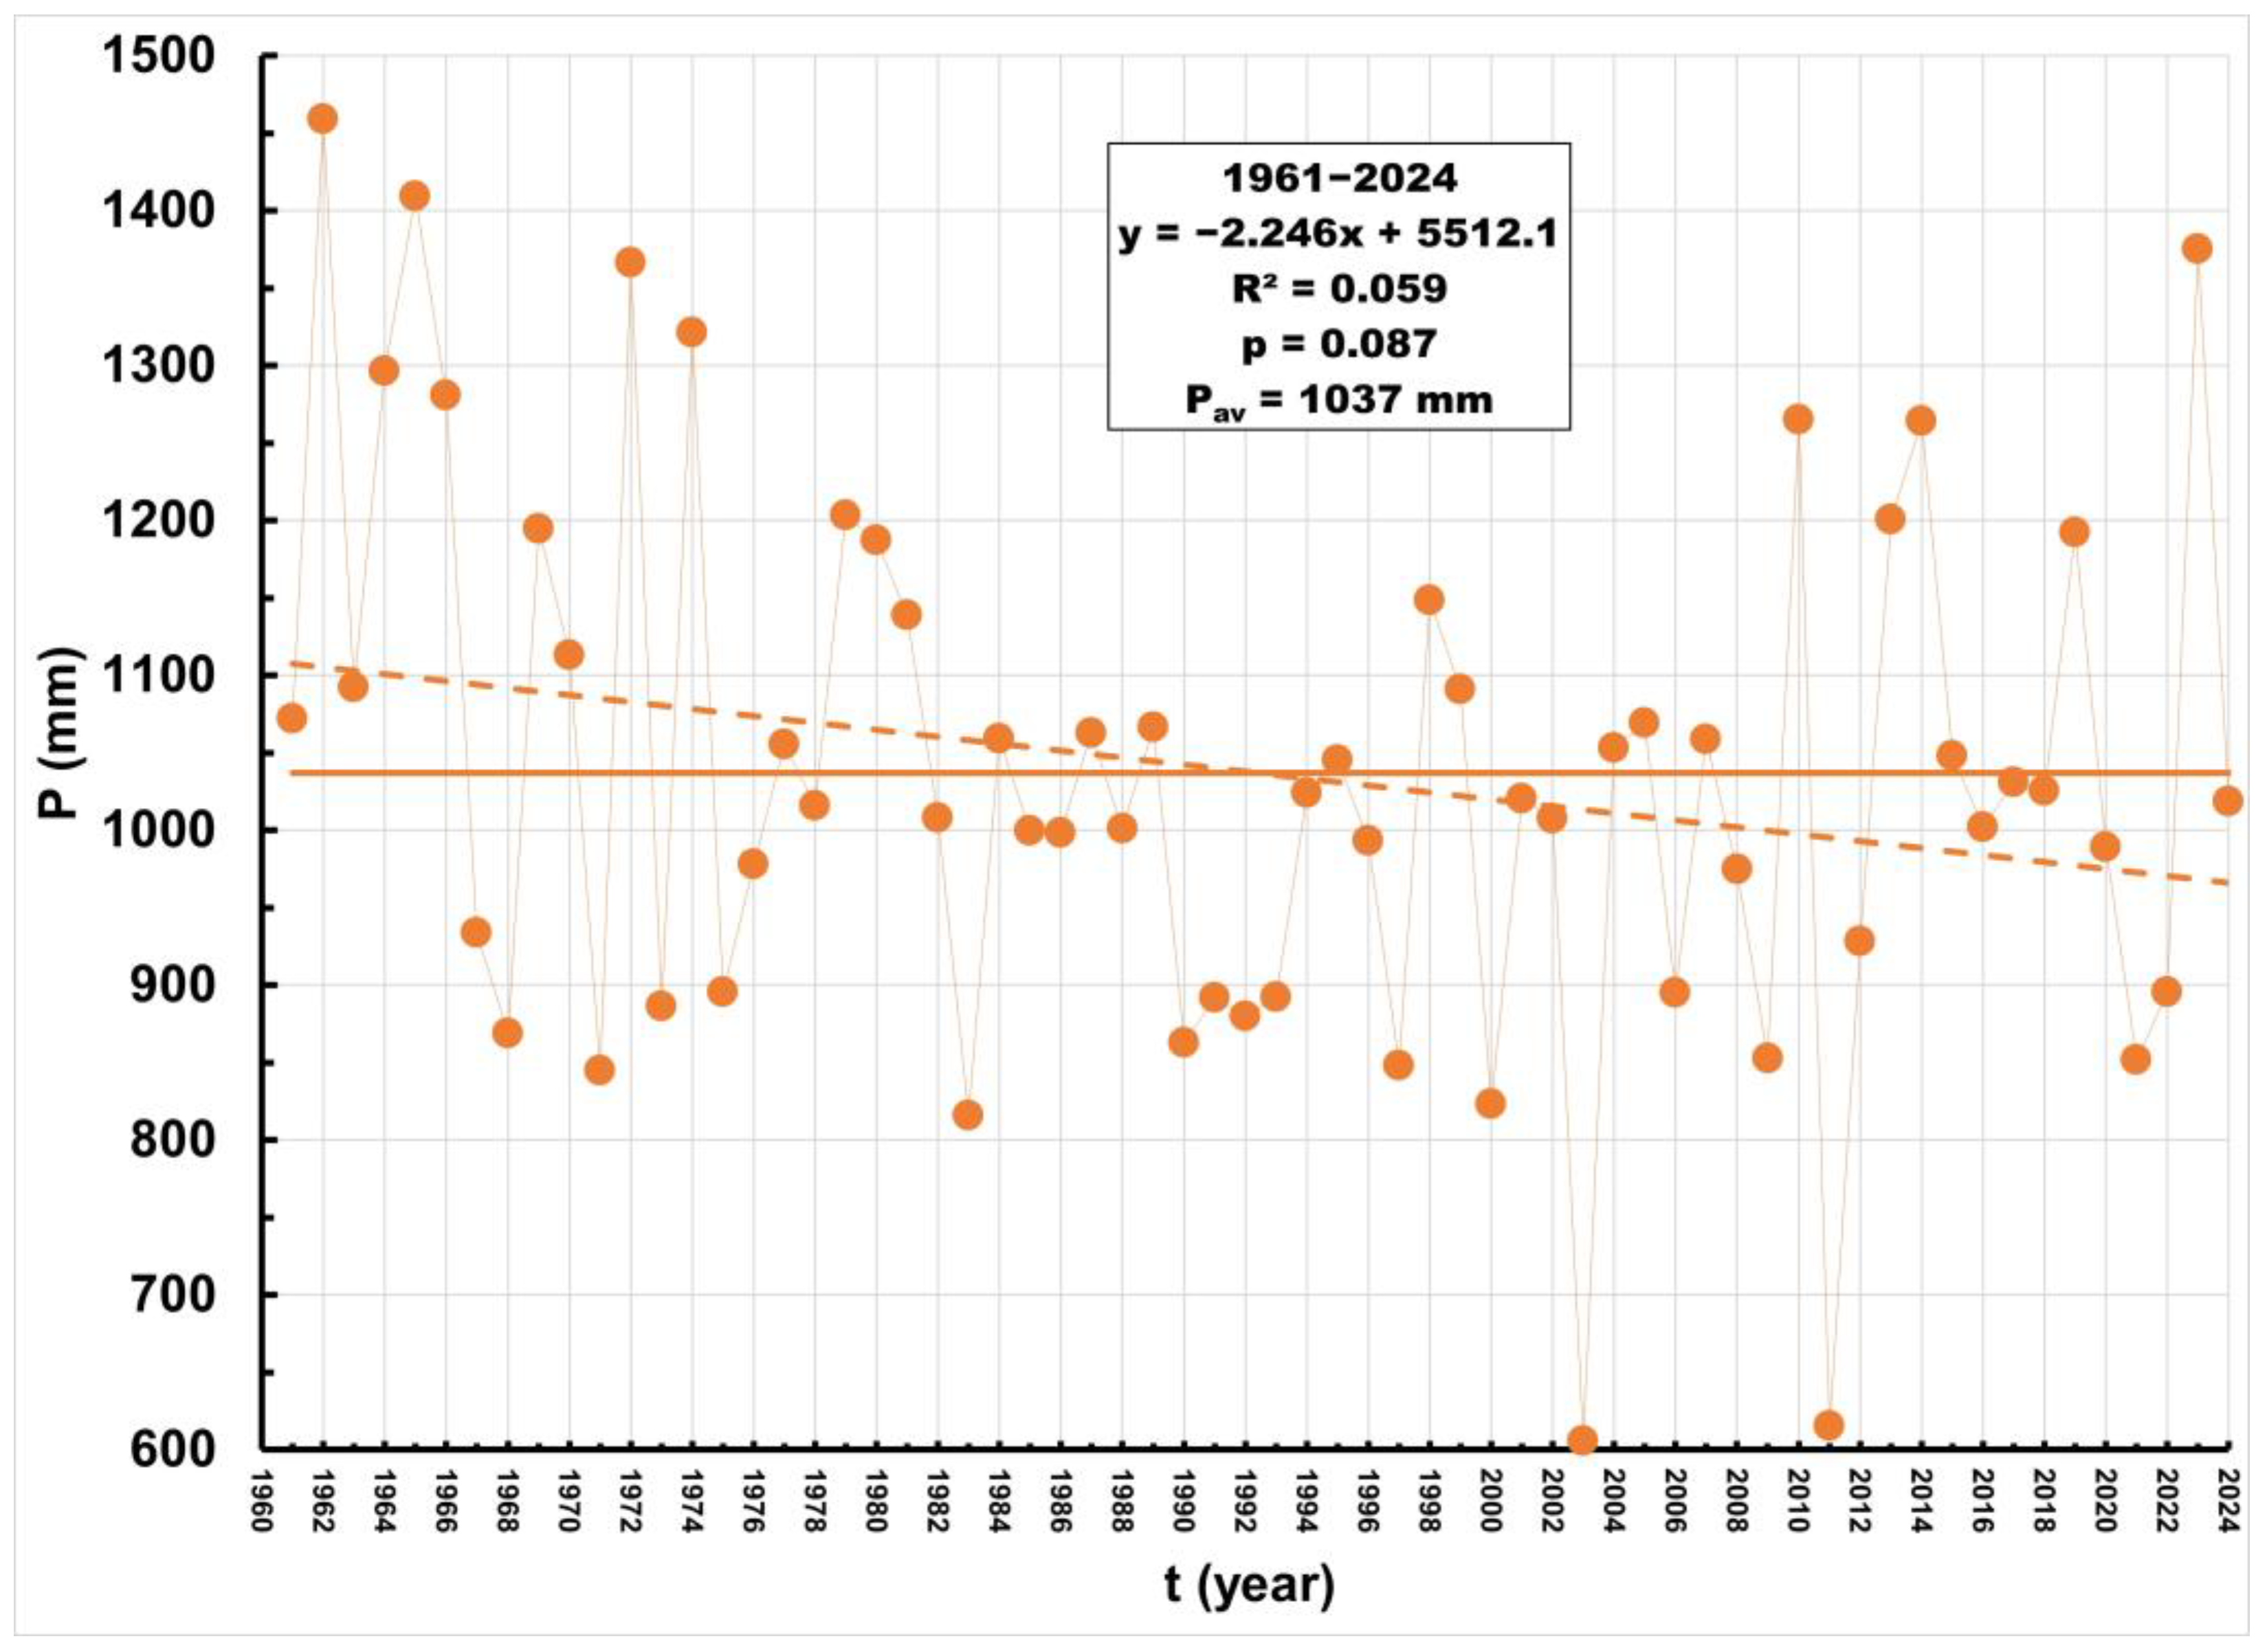
3.2. Annual Precipitation

Figure 5 presents the series of annual precipitation values measured at the Stubičke Toplice meteorological station for the 1961–2024 period. The average value is 1037 mm, with values ranging from the lowest observed value of 605.6 mm in 2003 to the highest observed value of 1458.9 mm in 1965. A statistically insignificant downward trend can be observed, with the probability value calculated using the M-K test being slightly higher (p = 0.087) than the threshold value of 0.05.
The RAPS method allowed us to identify three distinct time sub-periods in the annual precipitation series: (1) 1961–1981; (2) 1982–2012; and (3) 2013–2024 (Figure 6). The average values for each sub-period are as follows: P1961–1981 = 1124 mm, P1982–2012 = 963 mm, and P2013–2024 = 1074 mm. Testing the significance of the variance differences between adjacent sub-periods using the F-test showed that the variances of adjacent sub-periods do not significantly differ. However, testing the significance of differences in average values between adjacent sub-periods using the t-test revealed that the mean values of adjacent sub-periods differ significantly. The probability between the first and second sub-period was p = 3.7 × 10⁻⁴, while between the second and third sub-periods, it was p = 0.013.

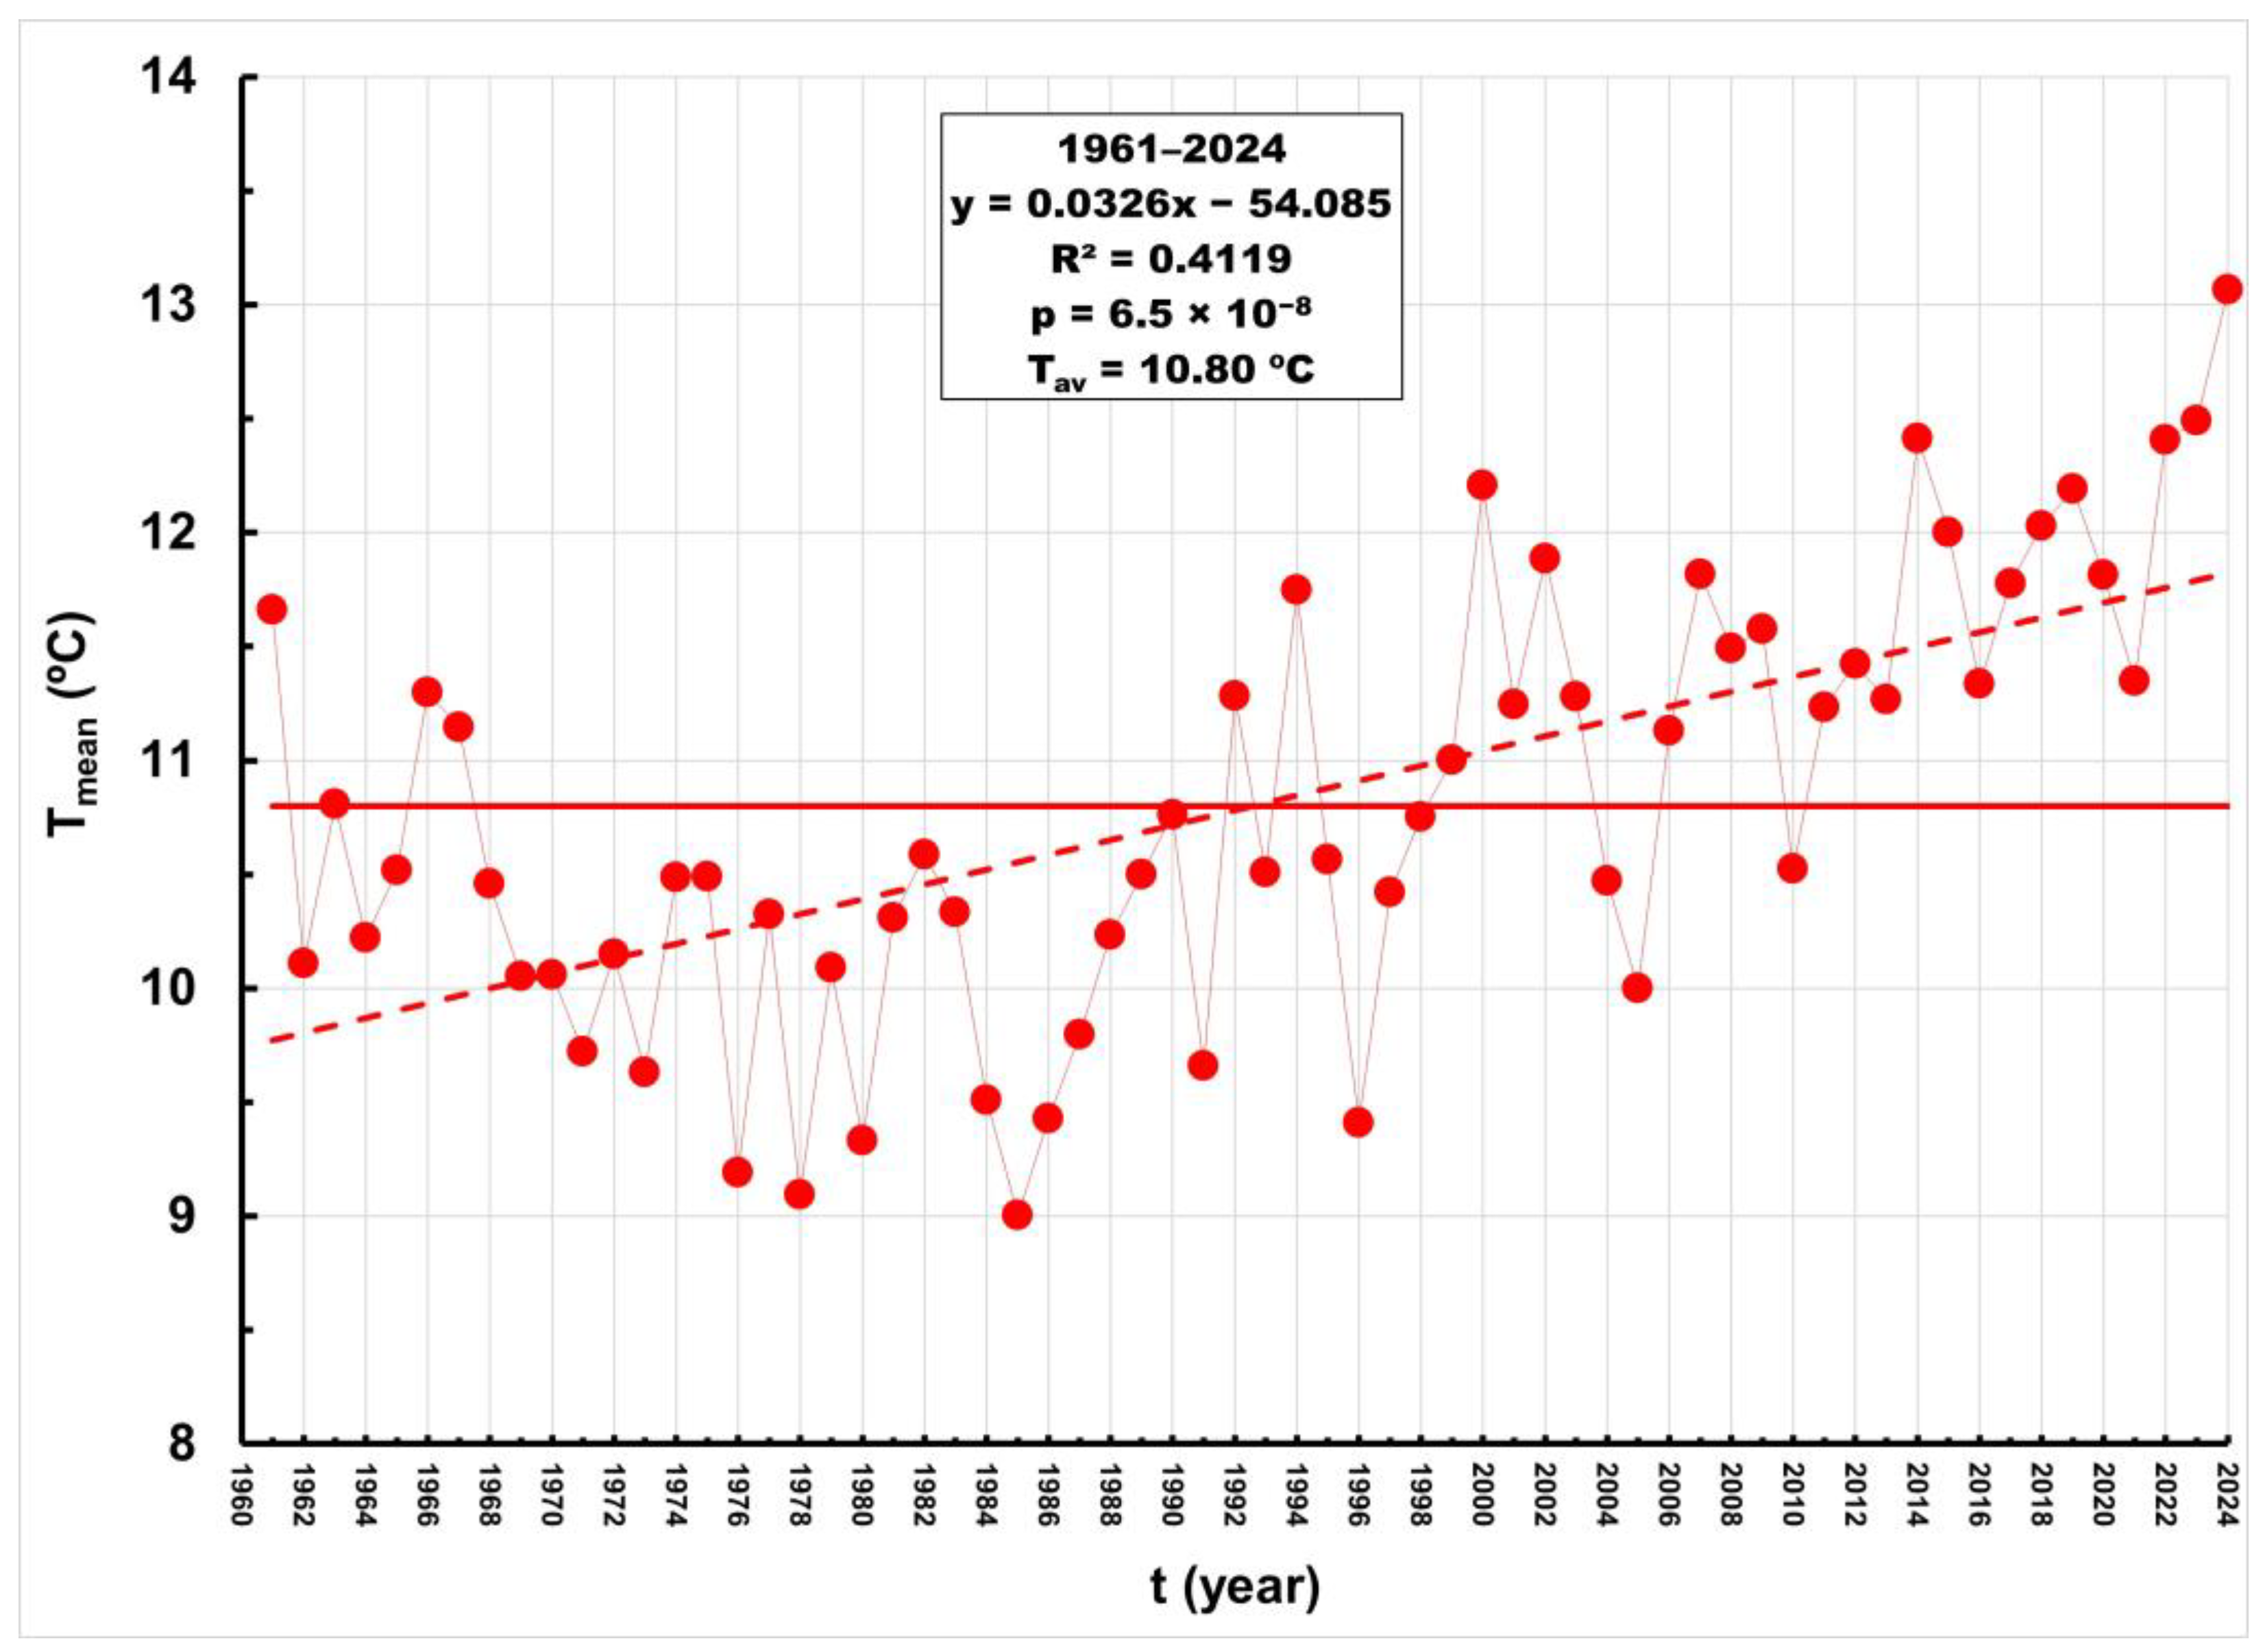
3.3. Mean Annual Air Temperatures

Figure 7 presents a graphical representation of the annual mean air temperature series measured at the Stubičke Toplice meteorological station for the 1961–2024 period.
Over the 64-year period studied (1961–2024), the average annual mean air temperature was 10.80 °C. The values ranged from the lowest observed value of 9.0 °C in 1985 to the highest observed value of 13.1 °C in 2024. The upward trend is statistically significant, as the probability value calculated using the M-K test is substantially lower (p = 6.5 × 10⁻⁸) than the threshold value of 0.05.
Using the RAPS method, it was determined that there are two sub-periods of mean air temperatures with significantly different behaviors, as clearly shown in Figure 8.
It is evident from the figure that in the first sub-period (1961–1985), there was a statistically significant downward trend (p = 0.0125), with the average mean annual temperature for this sub-period being 10.18 °C. In the second sub-period, which encompasses the recent period of 1986–2024, the average temperature was 1.01 °C higher, with an average of 11.19 °C. The upward trend in the recent period is statistically significant, as the probability value calculated using the M-K test is considerably lower (p = 3.8 × 10⁻⁷) than the threshold value of 0.05. The variances in the two analyzed sub-periods do not significantly differ, while the probability for the average values is significantly lower (p = 8.3 × 10⁻⁶) than the threshold. Based on these indicators, it appears that a further serious and concerning increase in air temperatures in the Krapina catchment can be anticipated.

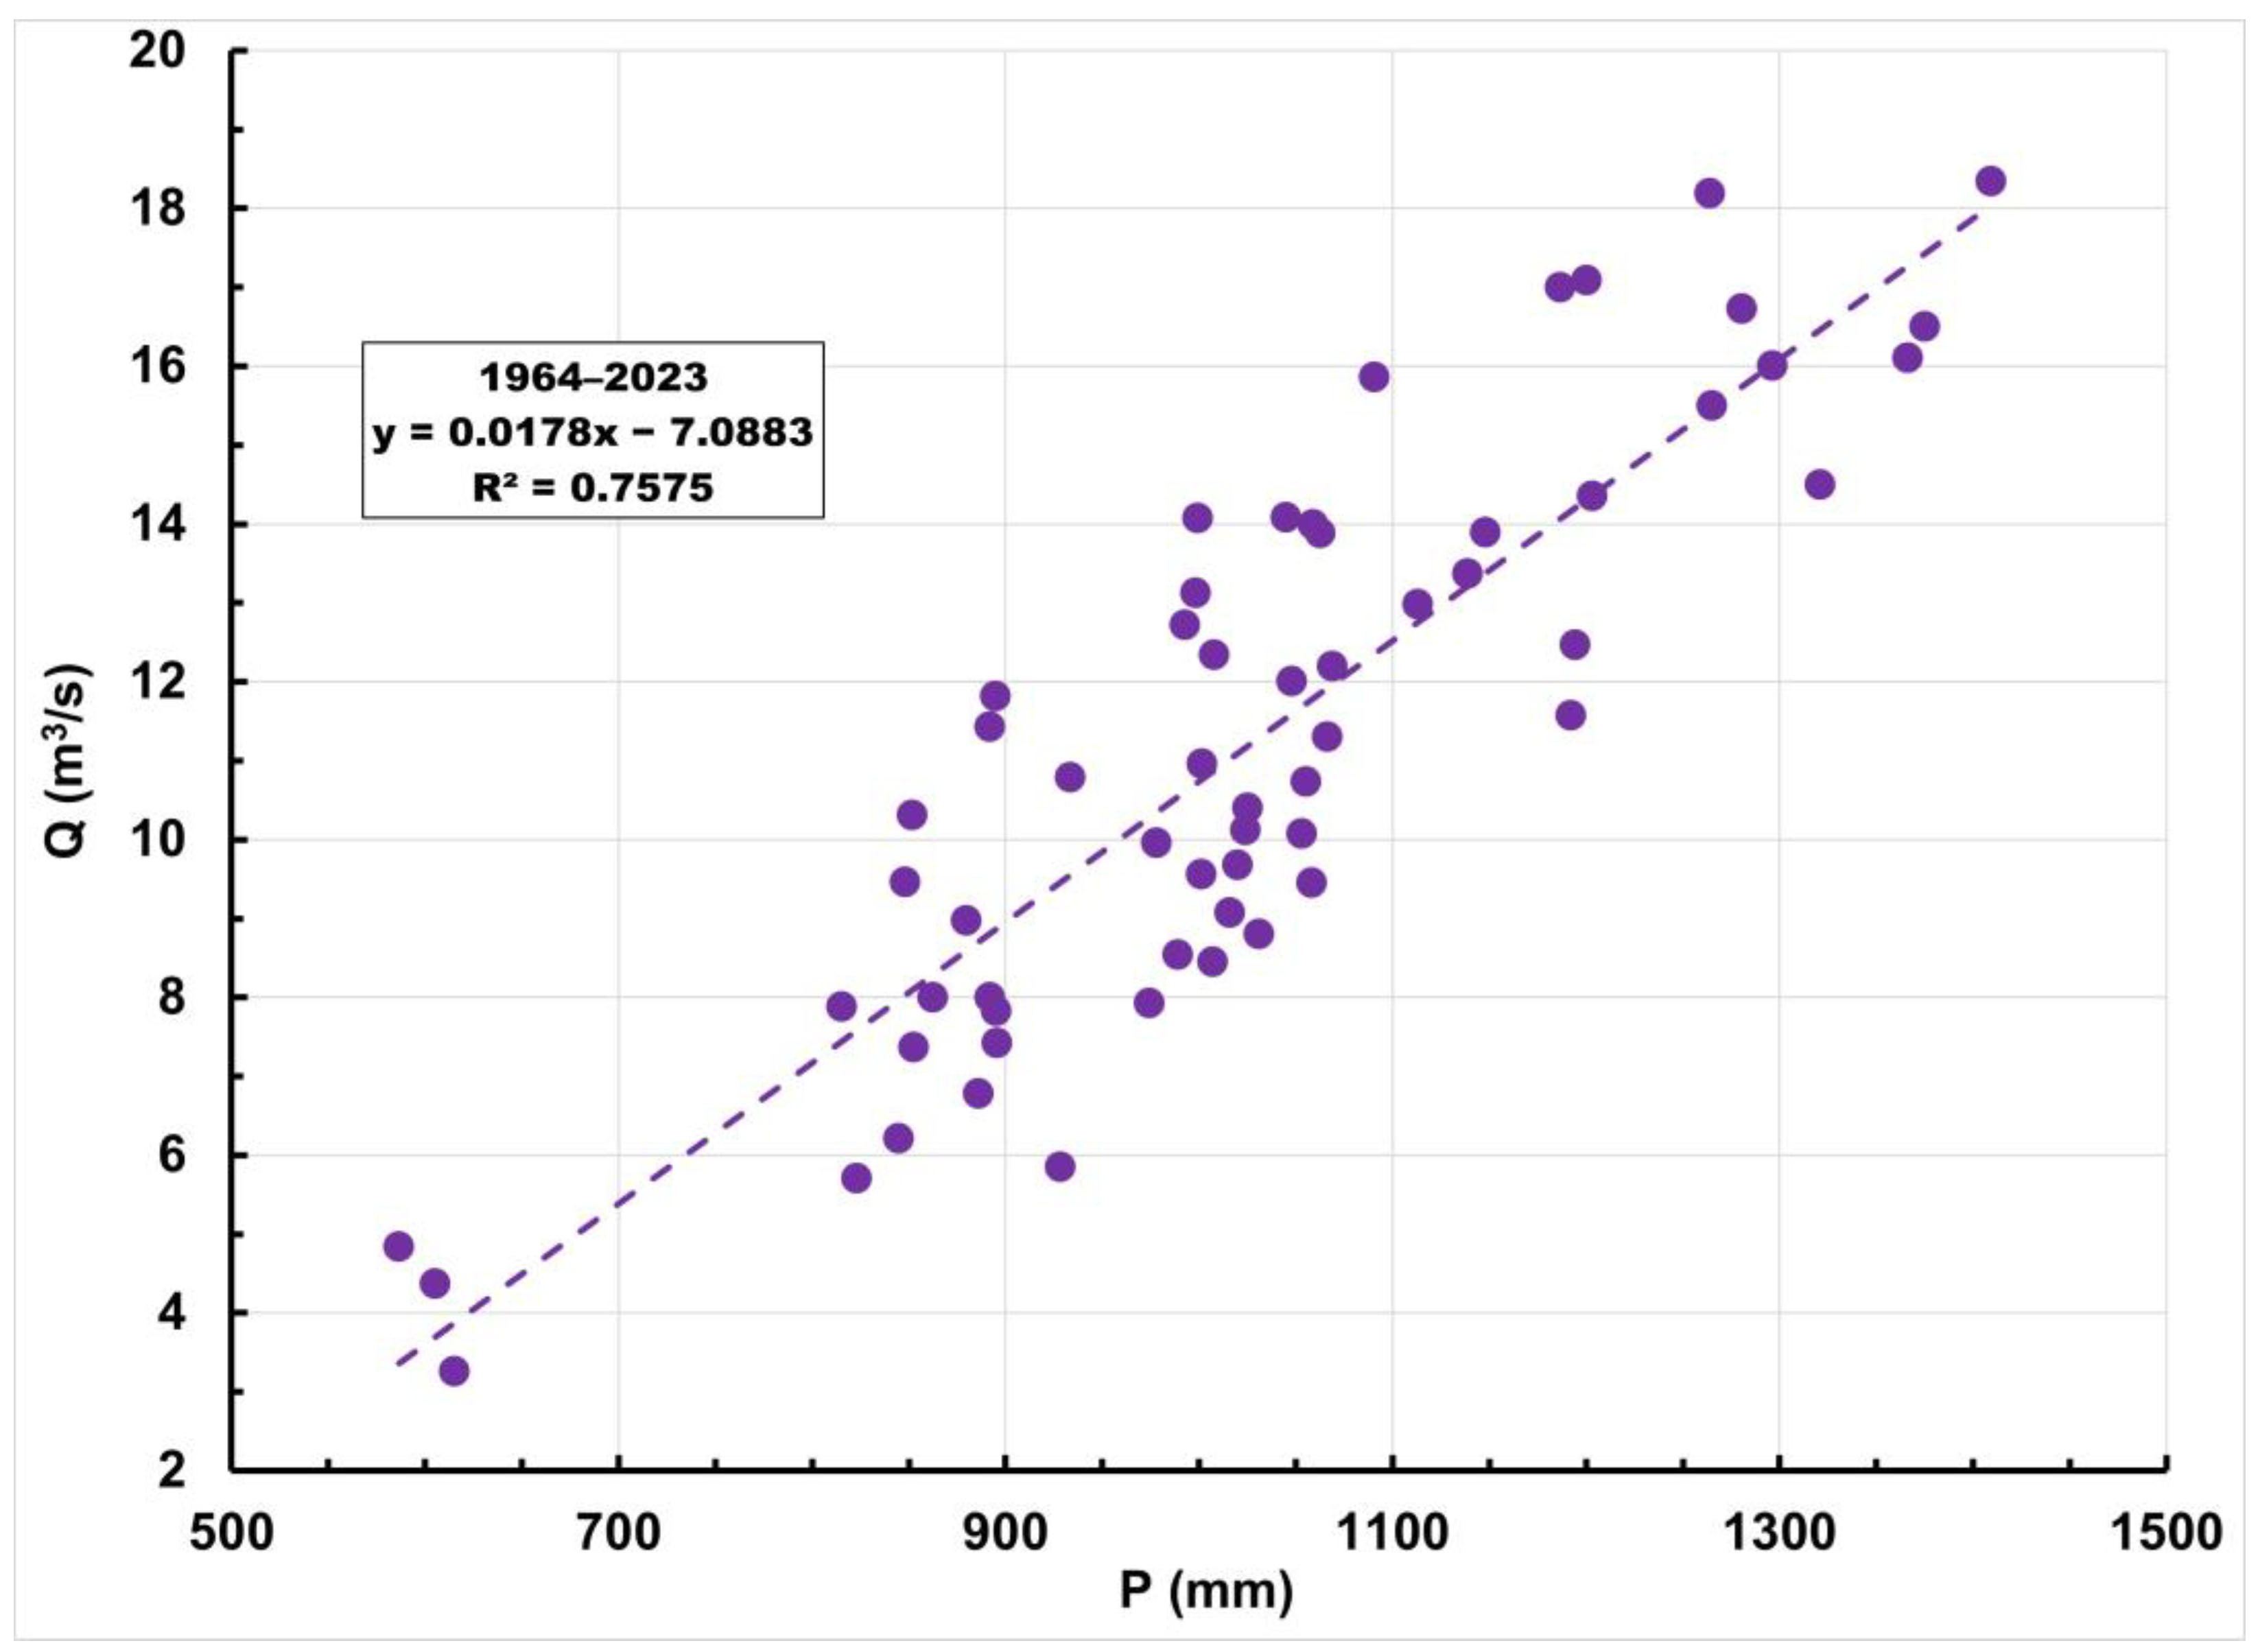
3.4. Relationship Between Mean Annual Discharges, Annual Precipitation, and Mean Annual Air Temperatures

Figure 9 shows the relationship between the mean annual discharge of the Krapina River at the Kupljenovo station and the annual precipitation measured at the Stubičke Toplice station for the 1964–2023 period. The high value of the coefficient of determination, R2 = 0.7575, indicates the significant impact of precipitation on runoff processes, which was expected. According to Chaddock’s scale, the value of the linear correlation coefficient, R = 0.870, confirms there is a strong correlation between the dependent and independent variables.
The relationship between the Krapina River discharge at the Kupljenovo station and the mean annual temperatures measured at the Stubičke Toplice station for the 1964–2023 period is inversely proportional. The coefficient of determination is low: R2 = 0.0292. The regression equation is as follows:
Q = (−0.0433 × T) + 11.241,
where the mean annual discharge Q is expressed in m3/s, and the mean annual temperature T is expressed in °C.
Table 1 presents the values of the coefficients of determination R2 and the multiple determination coefficient RM2 between the mean annual discharge Q, annual precipitation P, and mean annual air temperature T calculated for three different periods: (1) 1964–2023, (2) 1964–1985, and (3) 1986–2023. The first period (1964–2023) covers the entirety of the available datasets, while the second (1964–1985) and third (1986–2023) subperiods were selected to explore how the analyzed parameters relate in the subperiod of lower air temperatures (1964–1985) compared to the more recent period (1986–2023), when air temperatures significantly increased. It is important to note that in the recent period (1986–2023), the values of the coefficients of determination are lower than in the previous subperiod (1964–1985). This could be explained by the fact that the impact of higher air temperatures in the recent period has altered the hydrological processes in the Krapina catchment. However, drawing reliable conclusions will require more nuanced analyses conducted using additional indicators and information.
Regarding the relationship between the independent variables, annual precipitation (P) and mean annual air temperature (T), the values of the coefficients of determination given in column 4 of Table 1 show significant changes across the three periods analyzed.
Throughout the entire period, the coefficient of determination was practically zero. In the 1964–1985 subperiod, the relationship between precipitation and temperature was inversely proportional, while in the recent subperiod, it was proportional; i.e., the increase in annual precipitation accompanied the rise in mean annual air temperatures. The values of the coefficient of determination themselves are low.

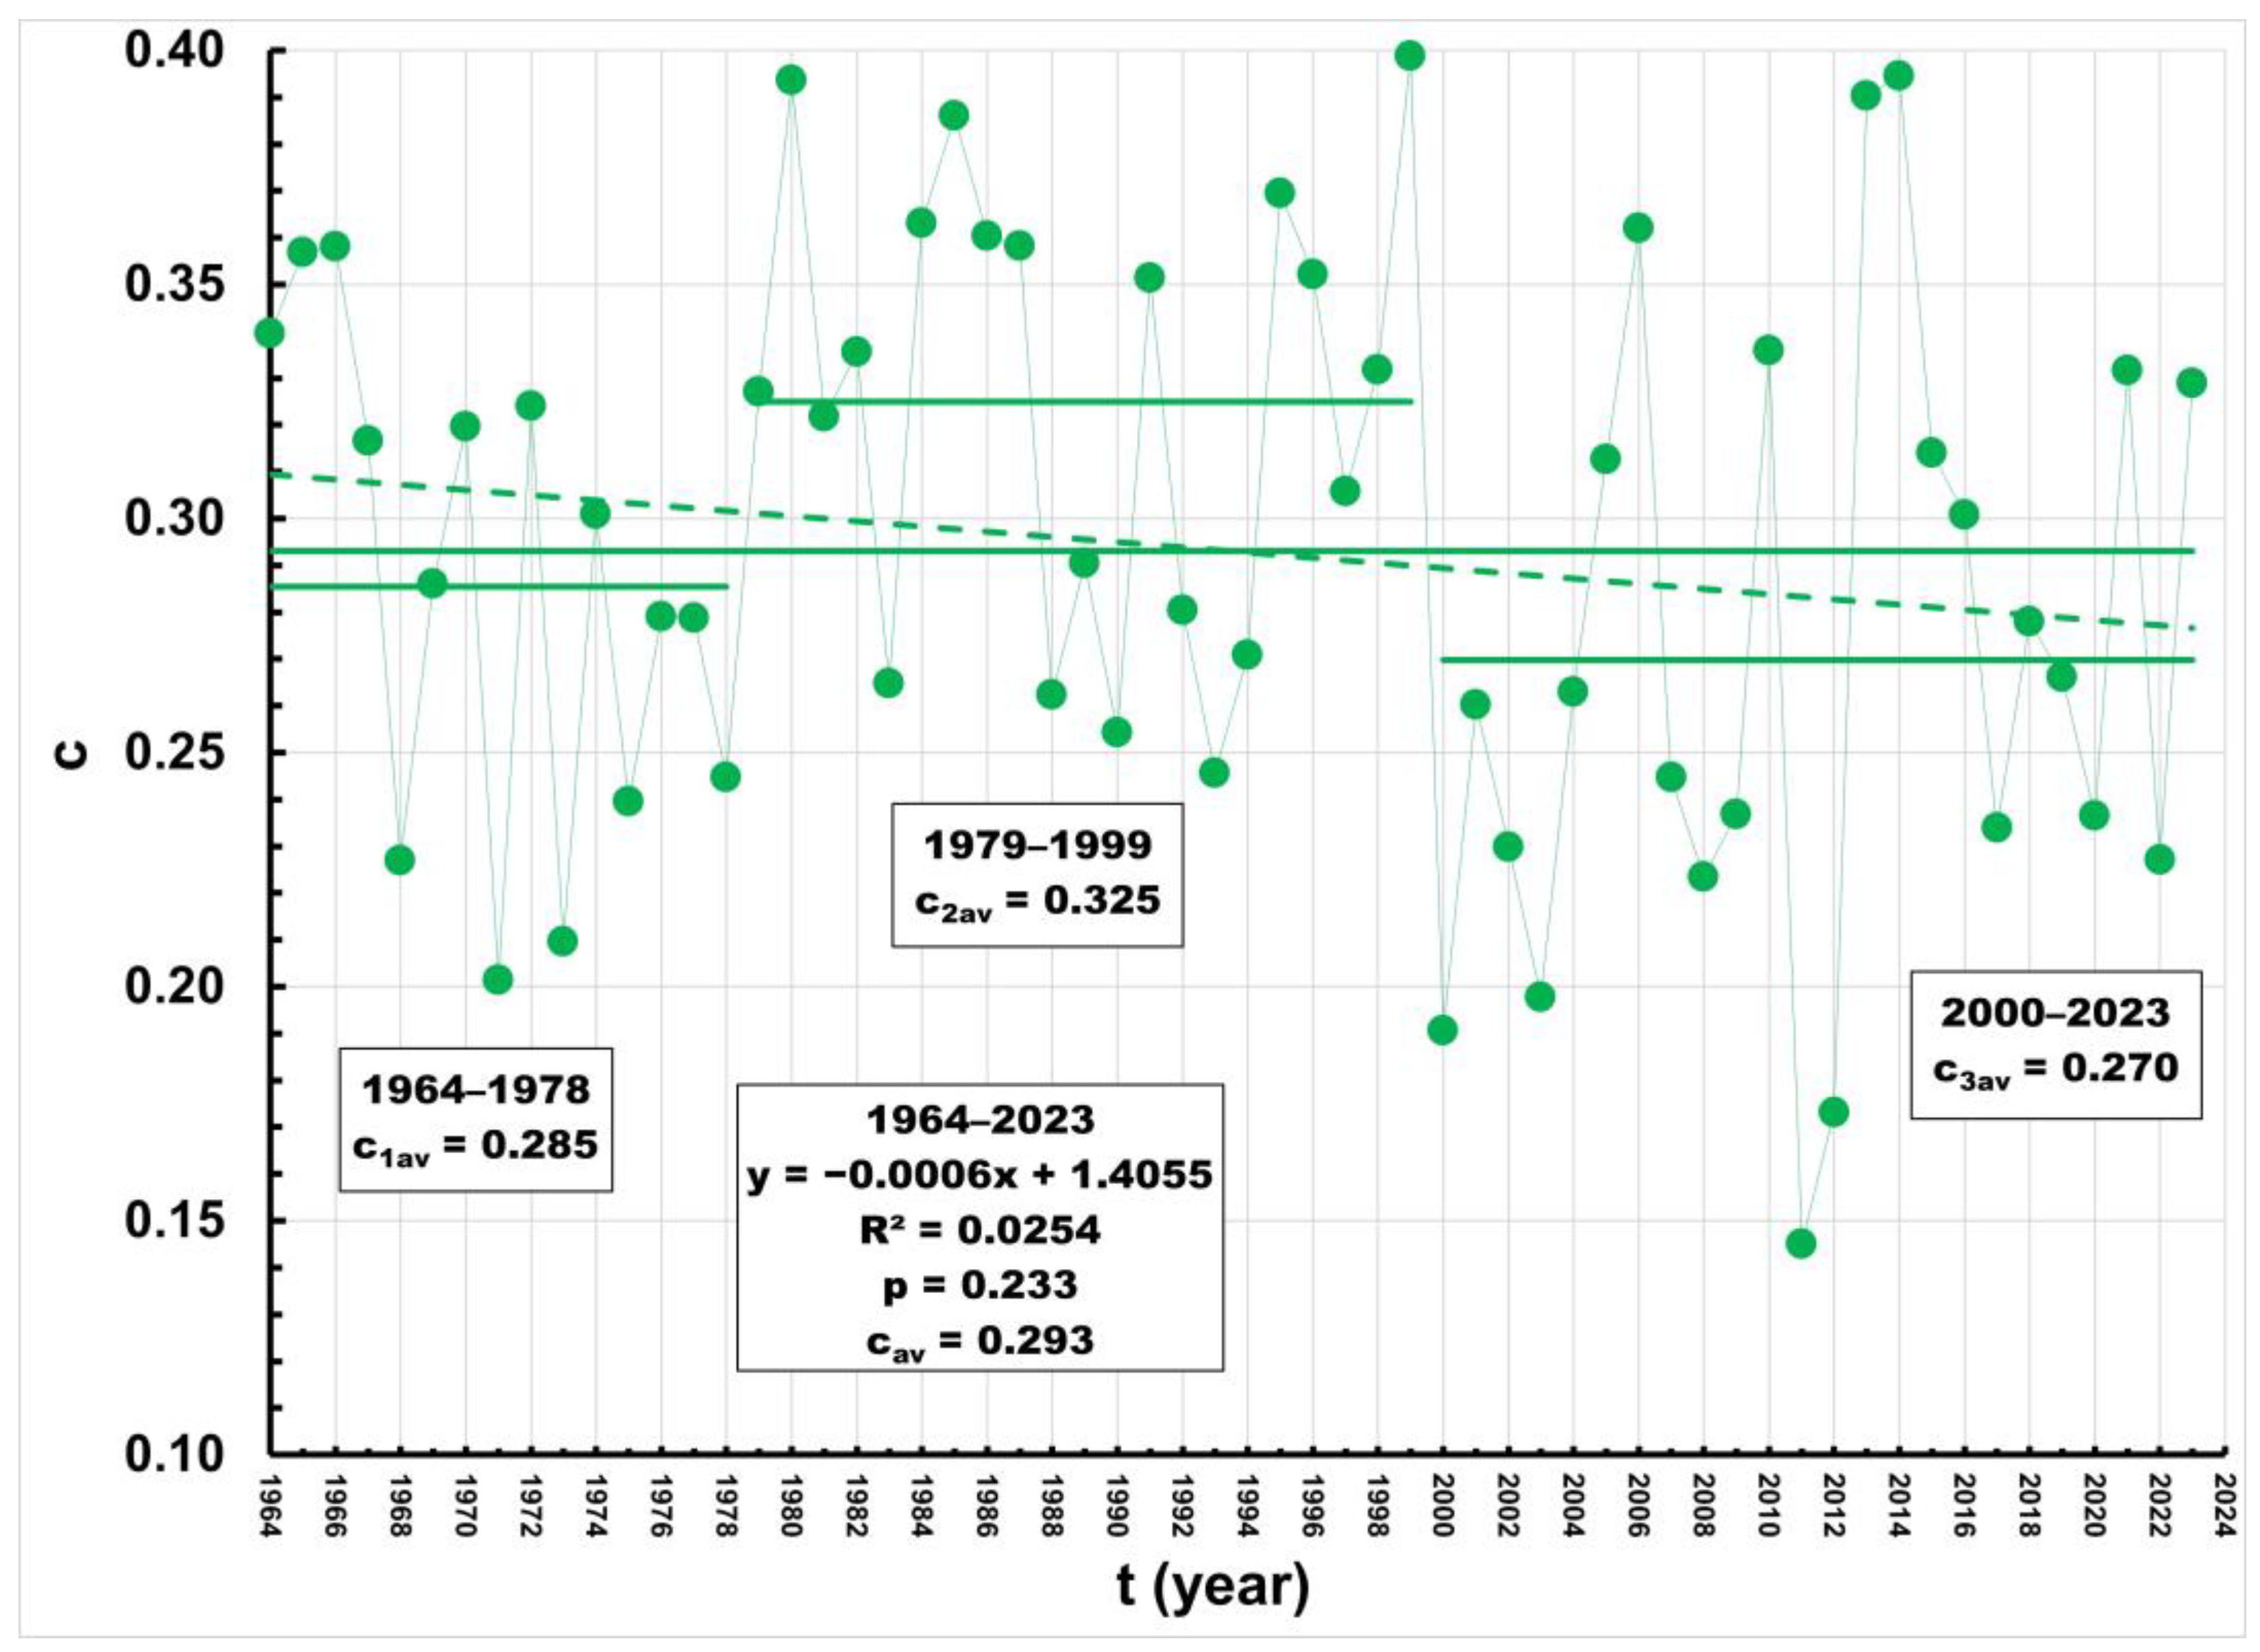
3.5. Annual Runoff Coefficients

Figure 10 shows the series of annual runoff coefficients c for the Krapina River at the Kupljenovo gauging station over the 1964–2023 period. The average value for the entire available period is 0.233, ranging from the lowest value of 0.145 (in 2011) to the highest value of 0.399 (in 1999). A decreasing trend is evident, although it is not statistically significant.
Using the RAPS method, three subperiods with statistically significant differences in average values were identified: (1) 1964–1978, (2) 1979–1999, and (3) 2000–2023. All three subperiods are marked in Figure 10, and the average values of the runoff coefficients c are indicated. The variances between the subperiods do not differ statistically significantly. However, using the t-test, it was confirmed that the average values of the runoff coefficients differ significantly between subperiods. The probability between the first and second subperiod is p = 0.025, while the probability between the second and third subperiods is p = 3.0 × 10⁻³.
Figure 11 shows the relationship between the annual runoff coefficient c and the mean annual discharge Q over the 1964–2023 period. The coefficient of determination is R2 = 0.8146.
Figure 12 presents the relationship between the annual runoff coefficient c and annual precipitation P for the 1964–2023 period. The coefficient of determination is R2 = 0.3518. The linear correlation coefficient, R = 0.593, indicates a moderate correlation according to the Chaddock scale.

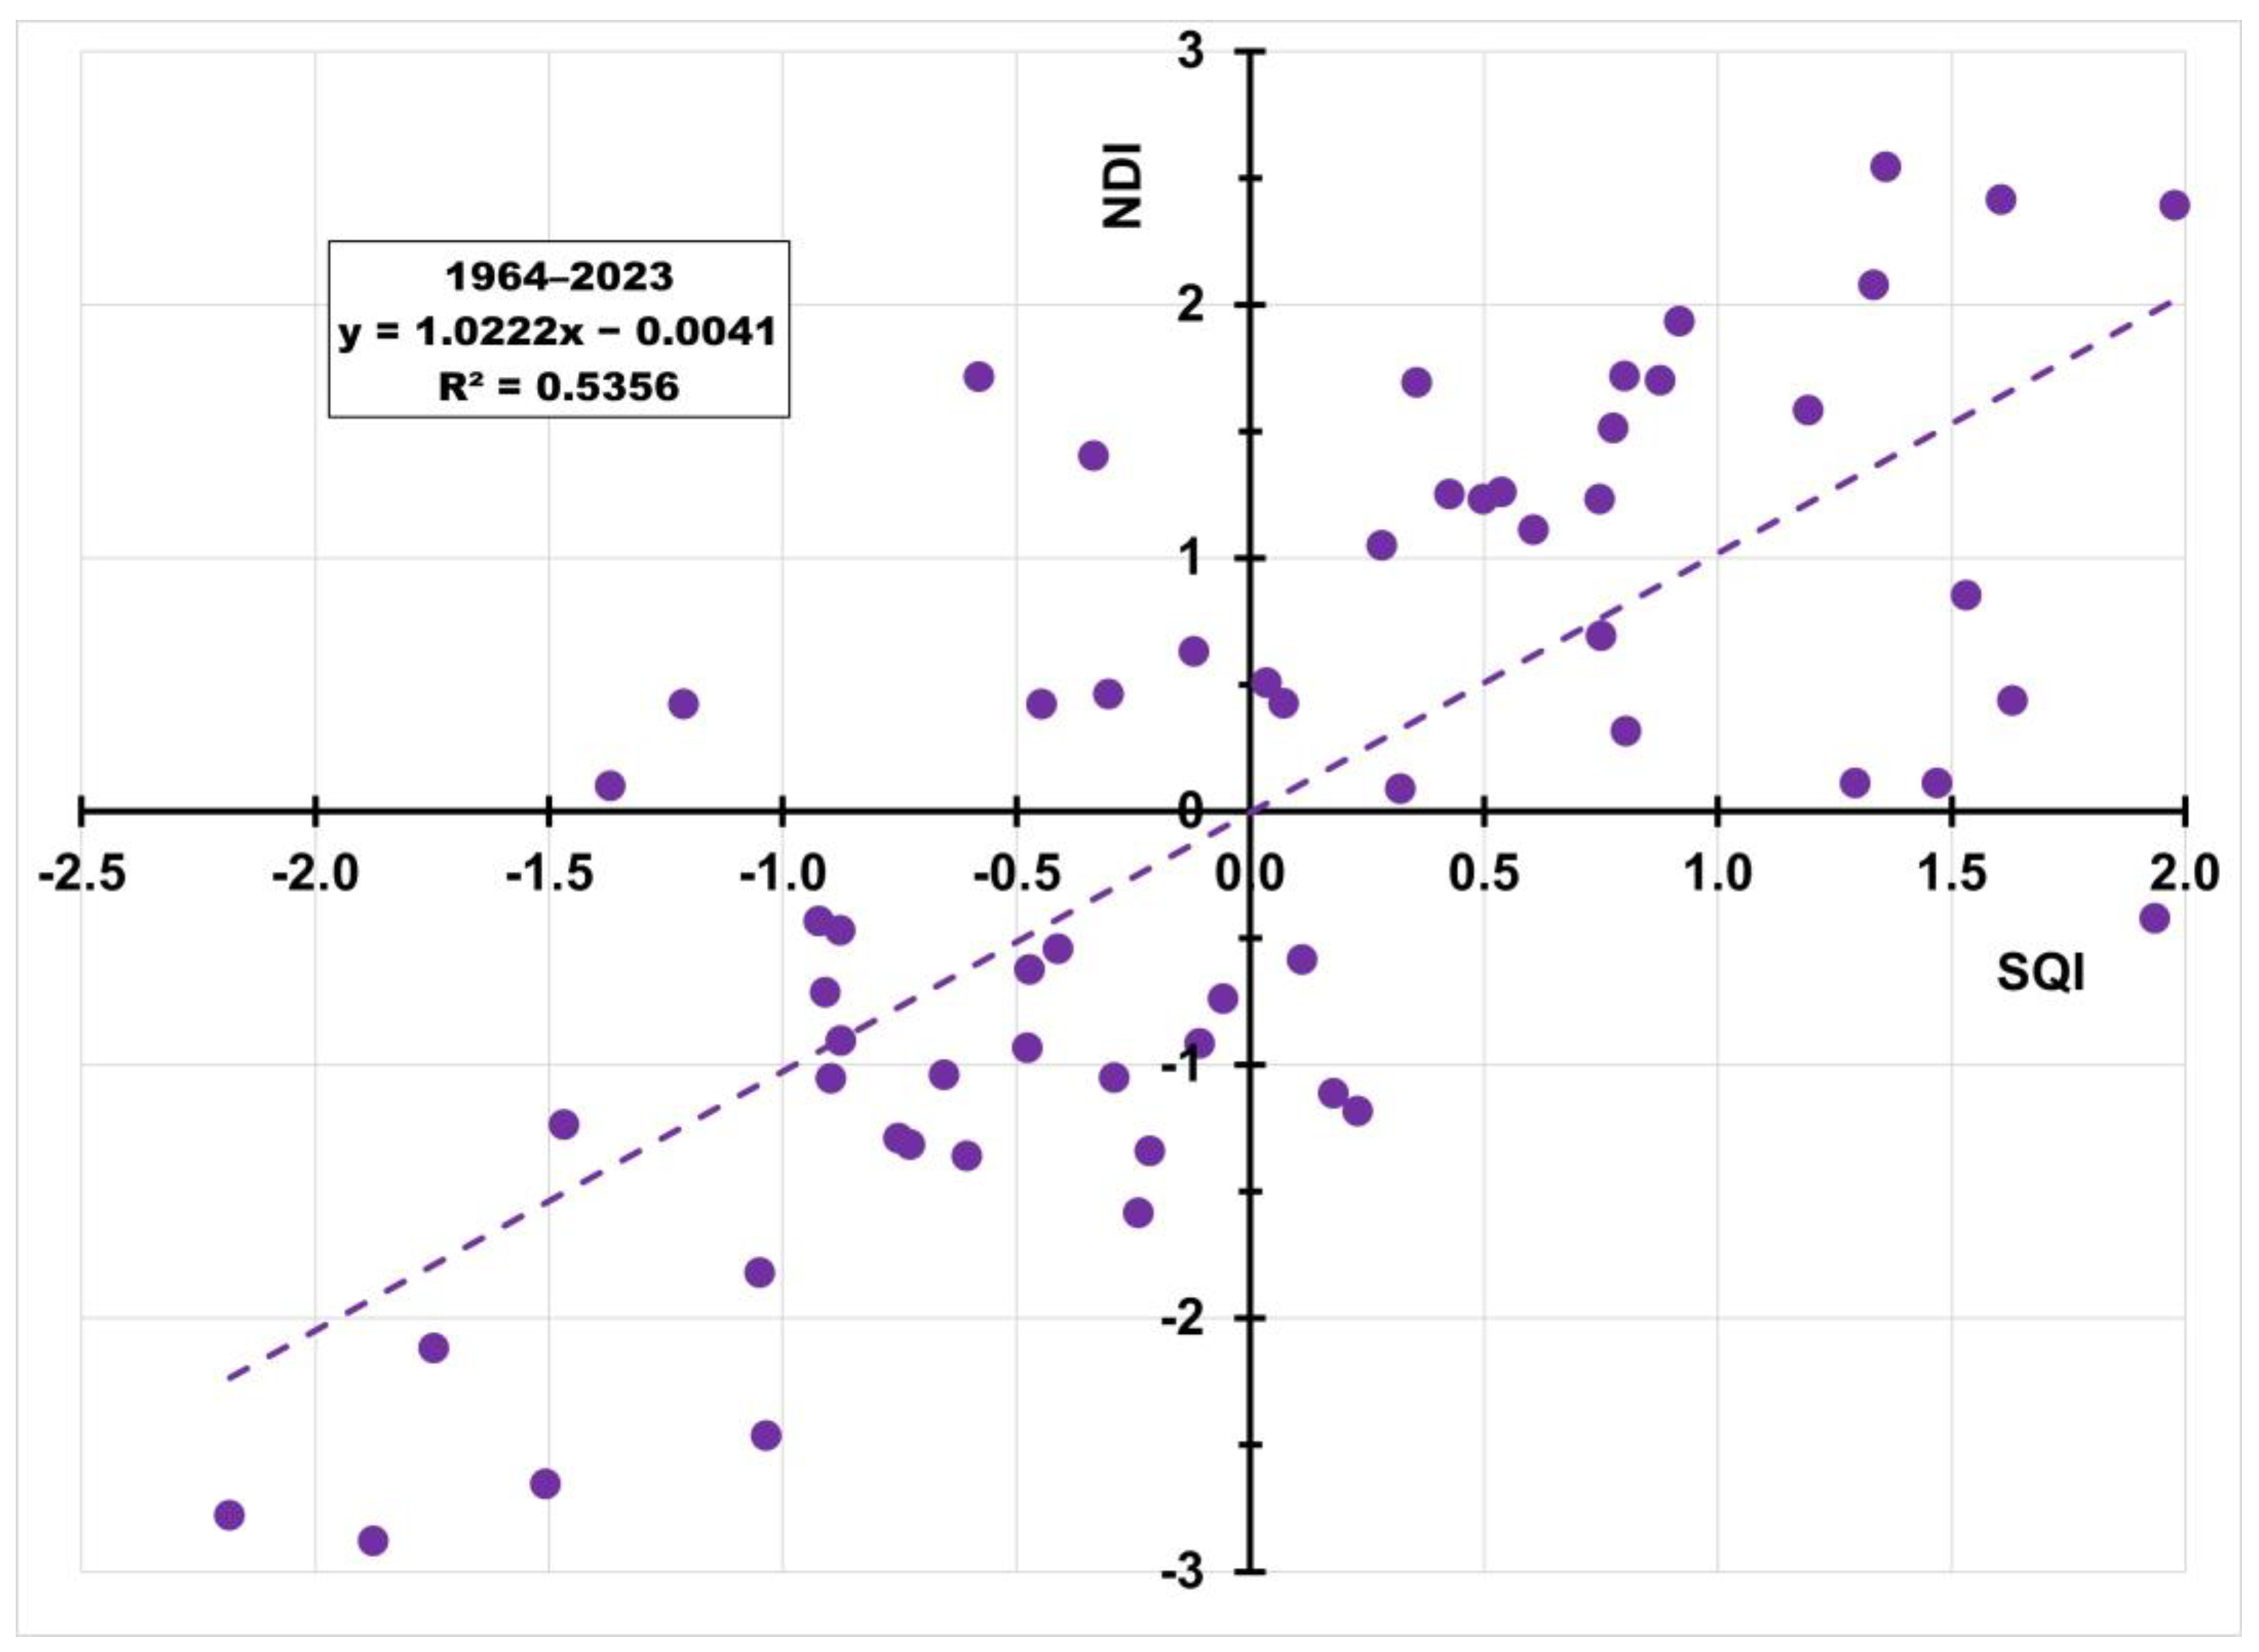
3.6. New Drought Index (NDI) and Standardized Streamflow Index (SQI)

In the previous analyses, a statistically insignificant decreasing trend in annual precipitation was observed, along with a statistically significant increasing trend in the average annual temperature. A statistically insignificant decreasing trend in the average annual streamflow of the Krapina River at the Kupljenovo gauging station was also noted.
A key factor in the occurrence and intensity of drought in any environment is a lower-than-average amount of precipitation. In addition, air temperature has a strong impact on droughts. The higher the temperature is above the average value for a particular time of year, the more severe the negative consequences of drought. In the era of recent global climate change, which is most notably manifested through rising air temperatures, this key climatological parameter must be incorporated into the calculation of drought indices. By including this parameter alongside precipitation, it becomes possible to define an integrated drought index applicable for analyzing any type of drought. In this study, the New Drought Index (NDI) was used, which utilizes standardized values of precipitation and average air temperature for a given period [49]. In this paper, the NDI was calculated on an annual scale. Weaver et al. [53] argue that the NDI is a composite index that integrates precipitation, soil moisture, and vegetation health, offering a more comprehensive view of drought compared to traditional indices.
Figure 13 presents the values of the NDI calculated using data on annual precipitation and average annual air temperatures measured at the Stubičke Toplice climatological station between 1961 and 2024. A statistically significant trend of intensifying drought is clearly visible, as confirmed by the trend probability value from the M-K test, which is p = 6.9 × 10⁻⁷, significantly lower than the threshold of p = 0.05. During the most recent 25-year period (2000–2024), there were only five years wherein no droughts of any type occurred. In five years, droughts were classified as extreme; in two years, they were severe; and in eight years, they were moderate.
Figure 14 presents the annual values of the SQI for the Krapina River at the Kupljenovo gauging station from 1964 to 2023. A decreasing trend can also be observed for this drought index, although it is not statistically significant, as the p-value is 0.131. It is important to note that over the last 24 years (2000–2023), an extreme drought occurred once in 2011, while severe droughts were observed five times.
To further explore the relationship between meteorological and hydrological drought indicators, Figure 15 and Figure 16 present a comparative analysis of the NDI and SQI for the overlapping period from 1964 to 2023. Figure 15 shows the relationship between annual NDI (y-axis) and SQI (x-axis) values. The relatively high coefficient of determination (R2 = 0.5356) suggests that both indices exhibit similar variability and can be used together to enhance drought assessments.
Figure 16 shows the time series of differences between the SQI and NDI (SQI-NDI). A clear upward trend is visible, which is likely a reflection of the increasing impact of rising air temperatures on the reduction in mean annual streamflow. The trend is statistically significant according to the Mann–Kendall test (p < 0.01), indicating a high level of confidence in the observed change.
If this trend continues, further declines in the average flows of the Krapina River may occur. Given the potentially hazardous implications of this process, it requires continued monitoring and appropriate mitigation efforts to minimize the adverse effects.

4. Conclusions and Guidelines for Future Investigations

The aim of the analyses conducted in this study was to gain a deeper understanding of how climate changes, specifically rapid and intense increases in air temperature, manifest in the hydrological regime of a small watershed. A watershed where the natural environment has been minimally impacted by anthropogenic activities was selected. The analyses were performed on an annual time scale. It is important to note that, unlike the significant increase in air temperature, there are no notable trends in the increase or decrease in annual precipitation, not only in this watershed but also in the broader region [56,57,58].
One potential conclusion drawn from the analysis of this watershed is that water flows respond more slowly to increases in air temperature. However, this process, although gradual, is likely irreversible. This is supported by the NDI trend shown in Figure 13. Droughts in the Krapina watershed and the broader region are becoming more frequent and more intense. It is reasonable to assume that the most severe consequences will be experienced by the environment, with slower impacts on the hydrological regime, primarily occurring through a reduction in average annual flows and changes in the intra-annual flow patterns. Nie et al. [59] highlight the risks associated with abrupt transitions from drought conditions to flooding.
It is evident that climate change, land-use changes, and water consumption by humans are causing significant alterations in the hydrological regimes of rivers globally, with particularly marked effects on small watercourses. This trend is expected to persist and intensify in the future, leading to more frequent and severe hydrological droughts. However, due to a lack of data and research on ephemeral rivers in the past, the processes driving flow intermittency and desiccation and their temporal patterns, frequency, and long-term evolution under climate change remain poorly understood. In recent years, several authors have addressed the issue of the drying of small watercourses [60,61,62]. Whether through analysis of measured data or the use of various models, all have reached the same conclusion: these drought events are becoming more frequent and prolonged. Models confirm that this trend is expected to persist and intensify. Moreover, they emphasize that rivers in varying environmental and climatic settings will respond distinctively. Therefore, conducting detailed analyses of each individual catchment is essential.
Xiong et al. [63] warn that meteorological droughts, by disrupting the hydrological cycle, can profoundly affect water resources, ecosystems, agriculture, and socio-economic systems. They highlight the significant gap in current research concerning the processes that govern the transition from meteorological to hydrological droughts, a highly complex phenomenon influenced by numerous factors. Given that each catchment responds differently due to its unique characteristics, drawing general conclusions remains a challenge. In their global-scale analysis, Xiong et al. [63] established a framework for analyzing drought propagation across 1089 catchments at the event scale, revealing that meteorological conditions play the dominant role, while catchment properties exert secondary yet important influences. Their findings highlight that major meteorological droughts are more likely to attenuate in severity and intensity as they propagate, offering valuable insights into the mechanism of drought development. This underscores the urgent need for more effective strategies for drought monitoring and management.
The observed divergence between meteorological and hydrological drought indices, likely driven by rising air temperatures and reduced streamflow, highlights a potentially hazardous trend that requires continued monitoring and the implementation of adaptive water management strategies to mitigate future impacts.
Freshwater systems play a vital role in global biodiversity, yet freshwater organisms are expected to face significant challenges due to the projected increases in water temperature and other climate-induced changes. However, most existing models predominantly focus on air temperature changes and may fail to incorporate these critical impacts. In catchments such as the Krapina River, there is an urgent need to plan mitigation actions to address biodiversity loss. This requires robust data and comprehensive analyses as well as consideration of feasible and cost-effective measures.
This study, as with any analysis of the trends and variability of climatic factors, involves certain limitations. However, the results clearly indicate a concerning trend of a declining streamflow in the Krapina River at the Kupljenovo gauging station. The reliability of the findings is supported by the fact that both the Stubičke Toplice climatological station and the Kupljenovo gauging station are high-quality monitoring stations operated by the Croatian Meteorological and Hydrological Service.
The approach employed in this study to assess the impacts of climate change on the hydrological regime may serve as an effective framework for informed decision-making in regard to addressing this urgent, far-reaching, and globally significant challenge.

Author Contributions

Conceptualization, O.B. and A.Ž.-Ć.; methodology, T.R.-B.; software, D.B.; validation, O.B., T.R.-B. and A.Ž.-Ć.; formal analysis, O.B. and T.R.-B.; investigation, A.Ž.-Ć.; resources, O.B. and A.Ž.-Ć.; data curation, O.B. and T.R.-B.; writing—original draft preparation, O.B.; writing—review and editing, A.Ž.-Ć.; visualization, O.B. and A.Ž.-Ć.; supervision, D.B.; project administration, D.B.; funding acquisition, O.B. All authors have read and agreed to the published version of the manuscript.

Funding

This research received no external funding.

Data Availability Statement

The dataset is available from the authors upon requesting it.

Conflicts of Interest

The authors declare no conflicts of interest.

References

  1. Arnell, N. Climate change and global water resources. Glob. Environ. Change 1999, 9, S31–S49. [Google Scholar] [CrossRef]
  2. Intergovernmental Panel on Climate Change. Climate Change Widespread, Rapid, and Intensifying—IPCC. 2021. Available online: https://www.ipcc.ch/2021/08/09/ar6-wg1-20210809-pr (accessed on 25 March 2025).
  3. Huntington, T.G. Evidence for intensification of the global water cycle: Review and synthesis. J. Hydrol. 2006, 319, 83–95. [Google Scholar] [CrossRef]
  4. Hansen, J.E.; Kharecha, P.; Sato, M.; Tselioudis, G.; Kelly, J.; Bauer, S.E.; Ruedy, R.; Jeong, E.; Jin, Q.; Rignot, E.; et al. Global Warming Has Accelerated: Are the United Nations and the Public Well-Informed? Environ. Sci. Policy Sustain. Dev. 2025, 67, 6–44. [Google Scholar] [CrossRef]
  5. Alkama, R.; Marchand, L.; Ribes, A.; Decharme, B. Detection of global runoff changes: Results from observations and CMIP5 experiments. Hydrol. Earth Syst. Sci. 2013, 17, 2967–2979. [Google Scholar] [CrossRef]
  6. Douville, H.; Allan, R.P.; Arias, P.A.; Betts, R.A.; Caretta, M.A.; Cherchi, A.; Mukherji, A.; Raghavan, K.; Renwick, J. Water remains a blind spot in climate change policies. PLoS Water 2022, 1, e0000058. [Google Scholar] [CrossRef]
  7. Müller, O.V.; McGuire, P.C.; Vidale, P.L.; Hawkins, E. River flow in the near future: A global perspective in the context of a high-emission climate change scenario. Hydrol. Earth Syst. Sci. 2024, 28, 2179–2201. [Google Scholar] [CrossRef]
  8. Yang, Y.; Roderick, M.L.; Guo, H.; Miralles, D.G.; Zhang, L.; Fatichi, S.; Luo, X.; Zhang, Y.; McVicar, T.R.; Tu, Z.; et al. Evapotranspiration on a greening Earth. Nat. Rev. Earth Environ. 2023, 4, 626–641. [Google Scholar] [CrossRef]
  9. van Vliet, M.T.; Franssen, W.H.; Yearsley, J.R.; Ludwig, F.; Haddeland, I.; Lettenmaier, D.P.; Kabat, P. Global river discharge and water temperature under climate change. Glob. Environ. Change 2013, 23, 450–464. [Google Scholar] [CrossRef]
  10. Milly, P.C.D.; Dunne, K.A.; Vecchia, A.V. Global pattern of trends in streamflow and water availability in a changing climate. Nature 2005, 438, 347–350. [Google Scholar] [CrossRef]
  11. Abbas, M.; Zhao, L.; Wang, Y. Perspective impact on water environment and hydrological regime owing to climate change: A review. Hydrology 2022, 9, 203. [Google Scholar] [CrossRef]
  12. Dai, A.; Qian, T.; Trenberth, K.E.; Milliman, J.D. Changes in Continental Freshwater Discharge from 1948 to 2004. J. Clim. 2009, 22, 2773–2792. [Google Scholar] [CrossRef]
  13. Gudmundsson, L.; Boulange, J.; Do, H.X.; Gosling, S.N.; Grillakis, M.G.; Koutroulis, A.G.; Leonard, M.; Liu, J.; Schmied, H.M.; Papadimitriou, L.; et al. Globally observed trends in mean and extreme river flow attributed to climate change. Science 2021, 371, 1159–1162. [Google Scholar] [CrossRef] [PubMed]
  14. Douglas, E.; Vogel, R.; Kroll, C. Trends in floods and low flows in the United States: Impact of spatial correlation. J. Hydrol. 2000, 240, 90–105. [Google Scholar] [CrossRef]
  15. Tigkas, D.; Vangelis, H.; Tsakiris, G. Drought and climatic change impact on streamflow in small watersheds. Sci. Total. Environ. 2012, 440, 33–41. [Google Scholar] [CrossRef]
  16. Bonacci, O. Factors affecting variations in the hydrological cycle at different temporal and spatial scales. Acta Hydrotech. 2023, 36, 1–15. [Google Scholar] [CrossRef]
  17. Tsegaw, A.T.; Pontoppidan, M.; Kristvik, E.; Alfredsen, K.; Muthanna, T.M. Hydrological impacts of climate change on small ungauged catchments—Results from a global climate model–regional climate model–hydrologic model chain. Nat. Hazards Earth Syst. Sci. 2020, 20, 2133–2155. [Google Scholar] [CrossRef]
  18. Pumo, D.; Caracciolo, D.; Viola, F.; Noto, L.V. Climate change effects on the hydrological regime of small non-perennial river basins. Sci. Total. Environ. 2016, 542, 76–92. [Google Scholar] [CrossRef]
  19. De Girolamo, A.; Barca, E.; Leone, M.; Porto, A.L. Impact of long-term climate change on flow regime in a Mediterranean basin. J. Hydrol. Reg. Stud. 2022, 41, 101061. [Google Scholar] [CrossRef]
  20. Aykut, T.; Turoğlu, H. Effects of climate change on streamflow in NE Edirne (NW Türkiye): Implications for sustainable hydrological development. Sustain. Water Resour. Manag. 2023, 10, 2. [Google Scholar] [CrossRef]
  21. Ribes, A.; Qasmi, S.; Gillett, N.P. Making climate projections conditional on historical observations. Sci. Adv. 2021, 7, eabc0671. [Google Scholar] [CrossRef]
  22. Frayer, D.W. The Krapina Neandertals—A Comprehensive, Centennial, Illustrated Bibliography; Croatian Natural History Museum: Zagreb, Croatia, 2006. [Google Scholar]
  23. Frayer, D.W.; Radovčić, J.; Radovčić, D. Krapina and the Case for Neandertal Symbolic Behavior. Curr. Anth. Curr. Anthropol. 2020, 61, 713–731. [Google Scholar] [CrossRef]
  24. Ivezić, V.; Bekić, D.; Horvat, B. Modelling of basin wide daily evapotranspiration with a partial integration of remote sensing data. Atmosphere 2018, 9, 120. [Google Scholar] [CrossRef]
  25. Orešić, D. Morfografski pokazatelji porječja Krapine. Acta Geogr. Croat. 1995, 30, 29–38. [Google Scholar]
  26. Orešić, D.; Filipčić, A. Promjene protočnih režima najvećih Savskih i Dravskih pritoka u Hrvatskom Zagorju i gornjoj Podravini 1961–2020. Podravina 2024, 23, 33–52. [Google Scholar]
  27. Orešić, D. Osnovne značajke režima tekućica poriječja Krapine. Hrvat. Geogr. Glas. 1995, 57, 37–53. [Google Scholar]
  28. Köppen, W.; Geiger, R. Handbuch der Klimatologie: Das Geographische System der Klimate; Verlag vod Gebrüder Born-traeger: Berlin, Germany, 1936. [Google Scholar]
  29. Filipčić, A. Klimatska regionalizacija Hrvatske po W. Köppenu za standardno razdoblje 1961–1990 u odnosu na razdoblje 1931–1960. Acta Geogr. Croat 1998, 33, 7–14. [Google Scholar]
  30. Šegota, T.; Filipčić, A. Köppenova podjela klima i hrvatsko nazivlje. Geoadria 2003, 8, 17–37. [Google Scholar] [CrossRef]
  31. Čanjevac, I. Tipologija protočnih režima rijeka u Hrvatskoj. Hrvat. Geogr. Glas. 2013, 75, 23–42. [Google Scholar] [CrossRef]
  32. Čanjevac, I.; Orešić, D. Contemporary changes of mean annual and seasonal river discharges in Croatia. Hrvat. Geogr. Glasnik 2015, 77, 7–27. [Google Scholar] [CrossRef]
  33. Chaddock, R.E. Principles and Methods of Statistics; Houghton Mifflin: Cambridge, UK, 1925. [Google Scholar]
  34. Borovskaya, R.; Krivoguz, D.; Chernyi, S.; Kozhurin, E.; Khorosheltseva, V.; Zinchenko, E. Surface water salinity evaluation and identification for using remote sensing data and machine learning approach. J. Mar. Sci. Eng. 2022, 10, 257. [Google Scholar] [CrossRef]
  35. Jobson, J.D. Multiple linear regression. In Applied Multivariate Data Analysis. Springer Texts in Statistics; Springer: New York, NY, USA, 1991. [Google Scholar] [CrossRef]
  36. Garbrecht, J.; Fernandez, G.P. Visualization of trends and fluctuations in climatic records. Water Res. Bull. 1994, 30, 297–306. [Google Scholar] [CrossRef]
  37. Bonacci, O.; Žaknić-Ćatović, A.; Roje-Bonacci, T. Prominent Increase in Air Temperatures on Two Small Mediterranean Islands, Lastovo and Lošinj, Since 1998 and Its Effect on the Frequency of Extreme Droughts. Water 2024, 16, 3175. [Google Scholar] [CrossRef]
  38. McGhee, J.W. Introductory Statistics; West Publishing Company: St. Paul, MN, USA; New York, NY, USA, 1985. [Google Scholar]
  39. Bonacci, O. Monthly and annual effective infiltration coefficients in Dinaric karst: Example of the Gradole karst spring catchment. Hydrol. Sci. J. 2001, 46, 287–299. [Google Scholar] [CrossRef]
  40. Mann, H.B. Nonparametric test of randomness against trend. Econometrica 1945, 13, 245–259. [Google Scholar] [CrossRef]
  41. Kendall, M.G. Rank Correlation Methods, 4th ed.; Charles Griffin: London, UK, 1975. [Google Scholar]
  42. Shourov, M.M.H.; Mahmud, I. pyMannKendall: A python package for non parametric Mann Kendall family of trend tests. J. Open Source Softw. 2019, 4, 1556. [Google Scholar] [CrossRef]
  43. McKee, T.B.; Doeskin, N.J.; Kleist, J. Drought Monitoring with Multiple Time Scales, 8th ed.; Conference of Applied Climatology; American Meteorological Society: Boston, MA, USA, 1995; pp. 179–184. [Google Scholar]
  44. Guttman, N.B. Accepting the Standardized Precipitation Index: A calculation algorithm. J. Am. Water Resour. Assoc. 1999, 35, 311–322. [Google Scholar] [CrossRef]
  45. Vicente-Serrano, S.M.; Beguería, S.; López-Moreno, J.I. A Multiscalar Drought Index Sensitive to Global Warming: The Standardized Precipitation Evapotranspiration Index. J. Clim. 2010, 23, 1696–1718. [Google Scholar] [CrossRef]
  46. Tadić, L.; Dadić, T.; Bosak, M. Comparison of different drought assessment methods in continental Croatia. Građevinar 2015, 67, 11–22. [Google Scholar] [CrossRef]
  47. World Meteorological Organization (WMO); Global Water Partnership (GWP). Handbook of Drought Indicators and Indices; Svoboda, M., Fuchs, B.A., Eds.; Integrated Drought Management Programme (IDMP), Integrated Drought Management Tools and Guidelines Series 2; WMO: Geneva, Switzerland, 2016. [Google Scholar]
  48. Lončar-Petrinjak, I.; Pasarić, Z.; Cindrić Kalin, K. Drought monitoring in Croatia using the standardized precipitation-evapotranspiration index. Geofizika 2024, 41, 1–23. [Google Scholar] [CrossRef]
  49. Bonacci, O.; Bonacci, D.; Roje-Bonacci, T.; Vrsalović, A. Proposal of a new method for drought analysis. J. Hydrol. Hydromech. 2023, 71, 100–110. [Google Scholar] [CrossRef]
  50. Sidiqi, M.; Kasiviswanathan, K.S.; Scheytt, T.; Devaraj, S. Assessment of meteorological drought under the climate change in the Kabul river basin, Afghanistan. Atmosphere 2023, 14, 570. [Google Scholar] [CrossRef]
  51. Arganis, M.; Preciado, M.; De Luna, F. New Drought Index implementation at station 15130, Valle de Bravo, Mexico. Mag. Hydraul. Pneum. Tribol. Ecol. Sensorics Mechatron. Hydraul. 2024, 1, 40–47. [Google Scholar]
  52. Kim, S.U.; Seo, D.-I. Comparison of the drought return periods by univariate, bivariate probability distribution, and copula function under SSPs scenarios. Theor. Appl. Clim. 2025, 156, 67. [Google Scholar] [CrossRef]
  53. Weaver, S.M.; Lupo, A.R.; Hunt, S.; Aloysius, N. Refining Drought Assessment: A Multi-Dimensional Analysis of Condition Monitoring Observer Reports in Missouri (2018–2024). Atmosphere 2025, 16, 389. [Google Scholar] [CrossRef]
  54. Barker, L.J.; Hannaford, J.; Chiverton, A.; Svensson, C. From meteorological to hydrological drought using standardised indicators. Hydrol. Earth Syst. Sci. 2016, 20, 2483–2505. [Google Scholar] [CrossRef]
  55. Nalbantis, I.; Tsakiris, G. Assessment of Hydrological Drought Revisited. Water Resour. Manag. 2007, 23, 881–897. [Google Scholar] [CrossRef]
  56. Pandžić, K.; Likso, T. Homogeneity of average annual air temperature time series for Croatia. Int. J. Clim. 2009, 30, 1215–1225. [Google Scholar] [CrossRef]
  57. Bonacci, O. Increase of mean annual surface air temperature in the Western Balkans during last 30 years. Vodoprivreda 2012, 44, 75–89. [Google Scholar]
  58. Bonacci, O.; Andrić, I.; Vrsalović, A.; Bonacci, D. Precipitation Regime Changes at Four Croatian Meteorological Stations. Atmosphere 2021, 12, 885. [Google Scholar] [CrossRef]
  59. Nie, W.; She, D.; Xia, J. Five-Century monthly streamflow reconstruction of the upper Brahmaputra River reveals Historically frequent and intense Drought-Flood abrupt alternation events. J. Hydrol. 2025, 658, 133195. [Google Scholar] [CrossRef]
  60. Domadenik, J.C.; Šraj, M.; Kobold, M. Analysis of river drying in Slovenia. Acta Hydrotec. 2023, 36, 123–137. [Google Scholar] [CrossRef]
  61. Mimeau, L.; Künne, A.; Devers, A.; Branger, F.; Kralisch, S.; Lauvernet, C.; Vidal, J.-P.; Bonada, N.; Csabai, Z.; Mykrä, H.; et al. Projections of streamflow intermittence under climate change in European drying river networks. Hydrol. Earth Syst. Sci. 2025, 29, 1615–1636. [Google Scholar] [CrossRef]
  62. Yuce, M.I.; Aytek, A.; Esit, M.; Deger, I.H.; Yasa, I.; Simsek, A.; Ugur, F. Investigation of the meteorological and hydrological drought characteristics in yeşilirmak basin, Türkiye. Theor. Appl. Clim. 2025, 156, 208. [Google Scholar] [CrossRef]
  63. Xiong, H.; Han, J.; Yang, Y. Propagation from Meteorological to Hydrological Drought: Characteristics and Influencing Factors. Water Resour. Res. 2025, 61, e2024WR037765. [Google Scholar] [CrossRef]
Figure 1. (A) Map of the Krapina River catchment marking the locations of rain gauges, climatological stations, the Kupljenovo gauging station, and the site of the Krapina Neanderthal discovery. (B) Elevation map of the Krapina River Basin (adapted from [24]). (C) Photos of the Krapina River and (D) the Krapina Neanderthal Museum.
Water 17 01403 g001
Figure 2. Series of annual minimum mean daily discharges, Qmin, of the Krapina River at the Kupljenovo station for the 1964–2023 period.
Water 17 01403 g002
Figure 3. Series of annual mean daily discharges, Qmean, of the Krapina River at the Kupljenovo station for the 1964–2023 period.
Water 17 01403 g003
Figure 4. Series of annual maximum mean daily discharges, Qmax, of the Krapina River at the Kupljenovo station for the 1964–2023 period.
Water 17 01403 g004
Figure 5. Series for annual precipitation, P, recorded at the Stubičke Toplice climatological station for the 1961–2024 period.
Water 17 01403 g005
Figure 6. Three subsets of annual precipitation, P, recorded at the Stubičke Toplice climatological station for the following three sub-periods: (1) 1961–1981; (2) 1982–2012; and (3) 2013–2024.
Water 17 01403 g006
Figure 7. Series of mean annual air temperatures, T, recorded at the Stubičke Toplice climatological station for the 1961–2024 period.
Water 17 01403 g007
Figure 8. Two subsets of mean annual air temperatures, T, recorded at the Stubičke Toplice climatological station for the following two sub-periods: (1) 1961–1985 and (2) 1986–2024.
Water 17 01403 g008
Figure 9. Relationship between the annual mean discharges, Qmean, of the Krapina River at the Kupljenovo station and the annual precipitation, P, at Stubičke Toplice for the 1964–2023 period.
Water 17 01403 g009
Figure 10. Series of annual runoff coefficients, c, of the Krapina River at the Kupljenovo station for the 1964–2023 period.
Water 17 01403 g010
Figure 11. Relationship between annual runoff coefficients, c, and annual mean discharges, Qmean, of the Krapina River at the Kupljenovo station for the 1964–2023 period.
Water 17 01403 g011
Figure 12. Relationship between annual runoff coefficients, c, and annual precipitation, P, in Stubičke Toplice for the 1964–2023 period.
Water 17 01403 g012
Figure 13. Series of annual New Drought Index (NDI) values for Stubičke Toplice for the 1961–2024 period.
Water 17 01403 g013
Figure 14. Series of annual Standardized Streamflow Index (SQI) values measured at the Kupljenovo gauging station for the 1964–2023 period.
Water 17 01403 g014
Figure 15. Relationship between annual NDI and SQI values for the 1964–2023 period.
Water 17 01403 g015
Figure 16. Time series of differences between SQI and NDI values (SQI-NDI) for the 1964–2023 period.
Water 17 01403 g016
Table 1. Values of the coefficients of determination, R2, and the multiple coefficient of determination, RM2, between mean annual discharges (Q), annual precipitation (P), and mean annual air temperature (T).
PeriodR2 (Q–P)R2 (Q–T)R2 (P–T)RM2
12345
1964–20230.7580.02920.00040.78106
1964–19850.8290.01410.01960.85959
1986–20230.6930.02700.01320.72913
Notes: Blue indicates an inverse (negative) relationship between parameters. Red indicates a direct (positive) relationship between parameters.
Disclaimer/Publisher’s Note: The statements, opinions and data contained in all publications are solely those of the individual author(s) and contributor(s) and not of MDPI and/or the editor(s). MDPI and/or the editor(s) disclaim responsibility for any injury to people or property resulting from any ideas, methods, instructions or products referred to in the content.

