Article

Synergistic Regulation of Soil Salinity and Ion Transport in Arid Agroecosystems: A Field Study on Drip Irrigation and Subsurface Drainage in Xinjiang, China

1
Institute of Agricultural Resources and Environment, Xinjiang Academy of Agricultural Sciences, Urumqi 830000, China
2
National Soil Quality Aksu Observation Experimental Station, Aksu 842300, China
*
Authors to whom correspondence should be addressed.
Water 2025, 17(9), 1388; https://doi.org/10.3390/w17091388
Submission received: 24 March 2025 / Revised: 2 May 2025 / Accepted: 4 May 2025 / Published: 5 May 2025
(This article belongs to the Special Issue Advanced Technologies in Agricultural Water-Saving Irrigation)

Abstract

:
The salinization of cultivated soil in arid zones is a core obstacle restricting the sustainable development of agriculture, particularly in regions like Xinjiang, China, where extreme aridity and intensive irrigation practices exacerbate salt accumulation through evaporation–crystallization cycles. Conventional drip irrigation, while temporarily mitigating surface salinity, often leads to secondary salinization due to elevated water tables and inefficient leaching. Recent studies highlight the potential of integrating drip irrigation with subsurface drainage systems to address these challenges, yet the synergistic mechanisms governing ion transport dynamics, hydrochemical thresholds, and their interaction with crop physiology remain poorly understood. In this study, we analyzed the effects of spring irrigation during the non-fertile period, soil hydrochemistry variations, and salt ion dynamics across three arid agroecosystems in Xinjiang. By coupling drip irrigation with optimized subsurface drainage configurations (burial depths: 1.4–1.6 m; lateral spacing: 20–40 m), we reveal a layer-domain differentiation in salt migration, Cl and Na+ were leached to 40–60 cm depths, while SO42− formed a “stagnant salt layer” at 20–40 cm due to soil colloid adsorption. Post-irrigation hydrochemical shifts included a 40% decline in conductivity, emphasizing the risk of adsorbed ion retention. Subsurface drainage systems suppressed capillary-driven salinity resurgence, maintaining salinity at 8–12 g·kg−1 in root zones during critical growth stages. This study establishes a “surface suppression–middle blocking–deep leaching” three-dimensional salinity control model, providing actionable insights for mitigating secondary salinization in arid agroecosystems.

1. Introduction

As key regions for global food security and environmental safety, drylands have long faced the serious challenge of soil salinization. Driven by the combination of extreme arid climates and high-intensity agricultural activities, salt ions continue to surface in arable soils through the evaporation–crystallization cycle [1]. This ion transfer process is governed by differential migration dynamics: monovalent ions (e.g., Na+, Cl) exhibit higher mobility due to weaker soil adsorption, whereas divalent ions (e.g., SO42−, Ca2+) tend to accumulate in intermediate layers through colloidal retention or precipitation. Such ionic stratification exacerbates soil sodality and osmotic stress, directly impairing plant physiological functions. Elevated Na+ concentrations disrupt root membrane integrity, inhibit nutrient uptake (e.g., K+, Ca2+), and induce ionic toxicity, while Cl accumulation interferes with stomatal regulation and photosynthetic efficiency. As a result, approximately 950 million hectares of arable land worldwide are threatened by salinization, with drylands accounting for more than 60% of the total. Although traditional drip irrigation can temporarily mitigate salinity damage, its high water consumption and low efficiency exacerbate water scarcity and trigger secondary salinization due to water table elevation. This secondary salinization further amplifies plant stress by concentrating salts in the rhizosphere, reducing crop yields by 30–50% in sensitive species such as sunflower. The synergistic application of drip irrigation infiltration and underground drainpipe salt drainage technology provides a new idea to solve this dilemma [2,3]. The former reshapes the vertical salt transport path through precise water control, while the latter relies on engineering intervention to block the horizontal spread of salt. However, under the coupled action of the two technologies, the layer domain differentiation law of salt ions, the dynamic threshold of hydrochemical response, and its mutual feedback mechanism with plant physiological activities are still the scientific blind spot limiting the optimization of the technologies [4].
Drip irrigation focuses on maintaining the water–salt balance in the root zone through high-frequency, low-volume water application. The advantage is that the irrigation rate can be dynamically adjusted according to the soil texture. For example, sandy loam soils require 30% less water than clay loam soils, keeping the salt gradient within the crop’s salt tolerance threshold [5]. The subsurface drainpipe system creates a subsurface drainage network by optimizing the combination of burial depth (typically 1.2–2.0 m) and spacing (20–50 m) to capture and discharge salt ions that are leached into the deeper layers. Theoretical simulations show that the underground pipes are 50% more efficient than the shallow buried system (1.2 m) when the depth of the underground pipes is >1.6 m, but the project cost increases by 35% [6]. This technical–economic trade-off makes parameter optimization the key to accurate salt control.
As a starting point for annual salinity regulation, the coupling mechanism of water allocation and ion transport in spring irrigation during the non-fertile period needs to be clarified. It was confirmed that spring irrigation water volume had a non-linear relationship with salinity leaching depth [7,8]. When the irrigation volume exceeded the saturated soil water storage capacity, monovalent ions such as Cl and Na+ could be effectively leached to the subsurface drainpipe action layer (>1.4 m), but high-valent ions such as SO42− and HCO3 were easily adsorbed in the 20–40 cm layer due to soil colloids. However, SO42−, HCO3, and other high-valent ions were easily formed in the 20–40 cm soil layer due to soil colloid adsorption. This ionic differentiation phenomenon is especially significant in clay loam soils with >20% montmorillonite content, which can lead to a false safety signal of “surface desalination–middle layer salt enrichment” after spring irrigation. In addition, there is a critical threshold for the regulation of leaching efficiency by underground drainpipe spacing. When the distance is >30 m, the rate of salt redistribution is reduced by 40% due to the drainage lag effect, exacerbating the risk of salt activation during the reproductive period [9,10].
Salinity dynamics are the result of a game between plant root water uptake and engineering salt control. Soil hydrochemical properties serve as “fingerprint signals” of salt migration that can reveal the regulatory efficacy of engineering measures. Although existing studies have initially revealed the independent salt control mechanisms of drip irrigation and subsurface drainage, there are still blind spots in their synergistic effects in terms of salinity ion stratification patterns, dynamic thresholds of hydrochemical responses, and their reciprocal feedback mechanisms with plant physiological activities. Through field experiments, this study aims to construct a cascade regulation theory of “ion transport–water chemical response–crop adaptation” and provide an interdisciplinary solution for the management of saline croplands in arid zones. The experimental setup and materials are indeed shared with our previous study [11] because both works are derived from the same long-term trial. However, the current paper focuses on new research objectives (ion-specific responses and root zone salinity feedback).

2. Materials and Methods

2.1. Experimental Site Characterization

The field experiment was implemented during the 2023 growing season (April–November) in Kerimuhar Village (86°74′ E, 42°13′ N; elevation 1005.5 m ASL) within Xinjiang’s Yanqi Basin. This hyper-arid region exhibits distinctive hydrometeorological characteristics: multiannual mean temperature of 7.8 °C (ΔTannual = 35.5 °C, ΔTdiurnal = 20.2 °C), precipitation–evaporation ratio of 1:28.7 (P = 64.5 mm·yr−1, PET = 1853 mm·yr−1), creating favorable conditions for capillary-driven salt accumulation through intense evaporative concentration. Soil types and physical parameters in the underground drainpipe test area can be found in our previously published study [11].
Preliminary pedological analysis using standardized colorimetric analysis (Munsell Soil Color Charts) combined with USDA textural classification revealed homogeneous soil properties across six experimental plots. Key parameters were quantified through triplicate sampling: bulk density (core method), hydraulic characteristics (pressure plate apparatus for water retention curves), particle size distribution (laser diffraction analyzer, Malvern Mastersizer 3000, Malvern Instruments Co., LTD, Malvern City, UK), and pH/EC (calibrated multi-parameter probe, FE38-Standard, ±0.5% accuracy, Mettler Toledo Co., Ltd., Beijing, China).

2.2. Subsurface Drainage System Configuration

The engineered drainage network was implemented in April 2023 following ISO 16075-2 guidelines [12] for agricultural drainage systems. Each experimental plot incorporated a collector well (depth = 2.5 m BGS) equipped with a photovoltaic-powered pumping station, forming a closed-loop drainage monitoring system.
The factorial design comprised 6 treatment combinations with triplication (n = 18 plots total), evaluating two critical engineering parameters (Figure 1):
  • Drainage lateral depths (D = 1.4, 1.6 m);
  • Lateral spacing (S = 20, 30, 40 m).
The system consisted of 22 PVC-UE (ultraviolet resistant) laterals (length = 220 m each) with the following specifications:
  • Perforated laterals: Corrugated single-wall design (Ø90 mm);
  • Slot geometry: Opening width ≤ 1 mm, effective porosity > 25% (≥250 cm2/m2);
  • Hydraulic gradient: 0.1% slope (DB15/T 2567—2022 compliant [13]);
  • Collector main: Non-perforated PVC pipe (Ø110 mm) with 0.2% slope.
Spatial configuration followed a herringbone pattern with laterals: collector angle = 60°. Randomized complete block design ensured spatial variability control with treatment combinations. Please refer to our previously published study for specific layout details [11].

2.3. Crop Cultivation and Irrigation Materials

The drought-tolerant sunflower cultivar Helianthus annuus L. ‘Dwarf Giant 567DW’ (USDA Plant Hardiness Zone 6b) was cultivated following FAO irrigation guidelines for saline soils. The growth cycle comprised 103 days from sowing (24 May 2023) to physiological maturity (5 October 2023), with emergence occurring 12 DAS (Days After Sowing).
The planting system employed a double-row ridge-furrow configuration with precision irrigation:
  • Plastic mulching: 1.45 m width (PE film, 0.008 mm thickness);
  • Row spacing: Narrow rows 25 cm (intra-bed), wide rows 60 cm (inter-bed);
  • Drip line layout: 85 cm spacing with pressure-compensating emitters (1.6 L·h−1 flow rate);
  • Irrigation network: 0.8·dS m−1 groundwater source (ECw).
Water management included the following:
  • Pre-sowing leaching: 180 mm application (10 May 2023) with 16-day continuous drainage monitoring (ECdw 3.2–4.1 dS·m−1);
  • Growth-stage irrigation: 6 events synchronized with critical phenological stages (V4–R6) using 80% ETc replacement.
The fertilization regime followed the 4R Nutrient Stewardship framework:
  • Basal application: 150 kg·ha−1 urea (46-0-0);
  • Side-dressing: 120 kg·ha−1 MKP (0-52-34) + 90 kg·ha−1 SOP (0-0-50);
  • Fertigation frequency: Split into 5 applications through drip system.

2.4. Soil Sampling and Analytical Methodology

A stratified sampling scheme was implemented to capture the hydrosalinity dynamics across drainage system configurations. Within each experimental plot, sampling transects were aligned perpendicular to subsurface drainpipes, incorporating both horizontal and vertical gradients. Horizontal sampling followed a normalized spatial protocol: positions were defined relative to drainpipe spacing (B), with sampling nodes at 0 m (directly above the drainpipe), 1/4B, and 1/2B intervals, corresponding to 0/5/10 m (S1), 0/7.5/15 m (S2), and 0/10/20 m (S3) configurations. Vertical profiling utilized a systematic soil auger approach, segmenting the root zone into 20 cm increments (0–20, 20–40, 40–60 cm) aligned with drainpipe burial depths.
Post-spring irrigation sampling (72 h after leaching event) employed a composite sampling methodology, where three spatially randomized replicates per depth interval were homogenized to create representative samples. This protocol yielded 162 discrete samples (6 treatments × 3 lateral positions × 3 depth–location combinations × 3 replicates), each vacuum-sealed in barrier bags with desiccant and stored at 4 °C pending analysis.
(1) Soil salinity: For salinity quantification, air-dried samples were processed following USDA NRCS guidelines: mechanical grinding (<2 mm fraction), standardized slurry preparation (1:5 soil: deionized water), and 30 min equilibration. Electrical conductivity (EC1:5) was measured using a calibrated conductivity probe (FE38-Standard, ±0.5% accuracy) at 25 °C, with total soluble salts (TSS, g·kg−1) calculated via empirical regression:
S = EC1:5 × 0.4017 + 0.0353
where S is total salt, g·kg−1. EC1:5 is soil conductivity, μS·cm−1.
(2) Determination of soil ions: Soil salt ion (K+, Na+) content was determined by flame photometer; Mg2+, Ca2+, SO42− content was determined by BDTA titration; Cl content was determined by silver nitrate titration; HCO3, CO32− content was determined by neutralization titration with double indicator.
(3) Soil desalination rate: the proportion of the reduced value of soil salinity in the study area to the initial value, calculated as:
N = (EC1 − EC2)/EC1 × 100%
where N is the desalination rate, %. EC1 is the soil conductivity before irrigation, μS/cm. EC2 is the soil conductivity after irrigation, μS·cm−1. N > 0 means soil desalination, N < 0 means soil accumulation of salts, and when N = 0, it means salt equilibrium.
(4) Data Processing and Statistical Analysis: The dataset underwent rigorous preprocessing through Microsoft Excel (v16.75, Microsoft Corp., Redmond, WA, USA) for data wrangling, including outlier detection (3σ criterion) and time-series alignment. Statistical exploration was conducted in IBM SPSS Statistics (Version 27.0, IBM Corp., Armonk, NY, USA) under α = 0.05 significance threshold, incorporating:
  • Normality verification via Shapiro–Wilk tests (W = 0.96, p > 0.05);
  • Descriptive profiling with 95% confidence intervals;
  • Multivariate collinearity diagnostics (VIF < 5 threshold).
This dual-platform workflow ensured both data integrity through traceable version control (Git LFS tracking) and analytical robustness.

3. Results and Analysis

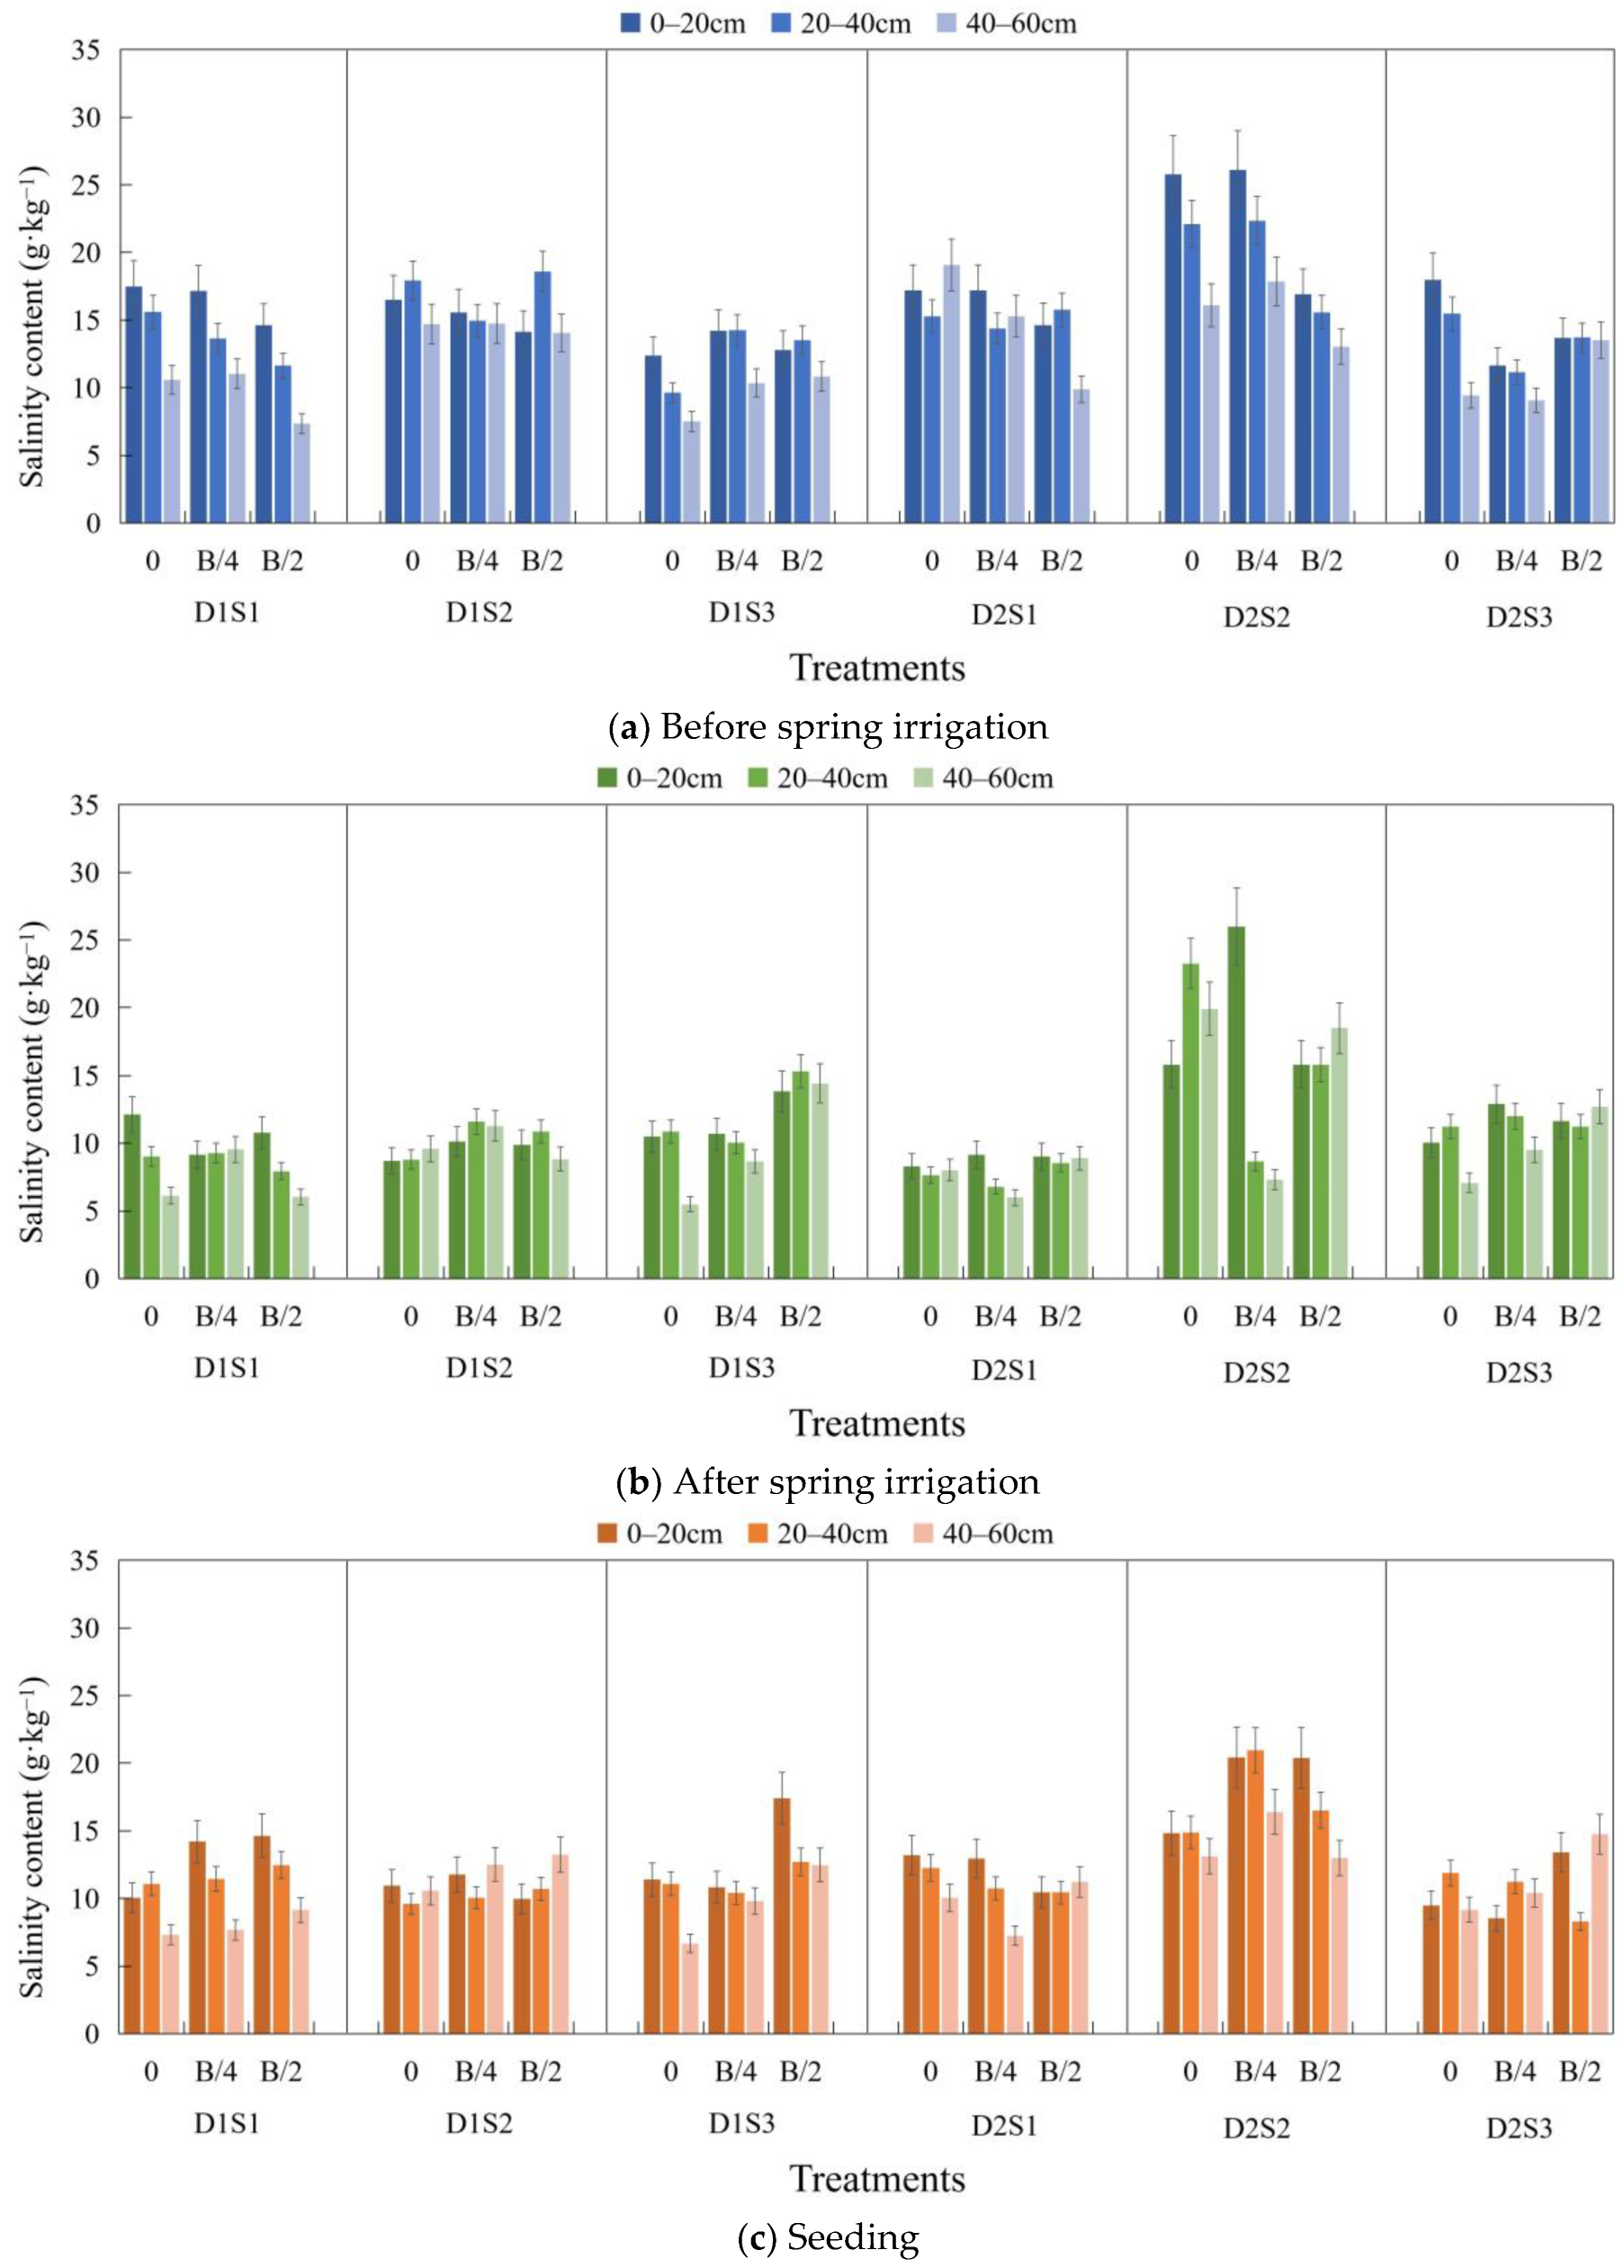
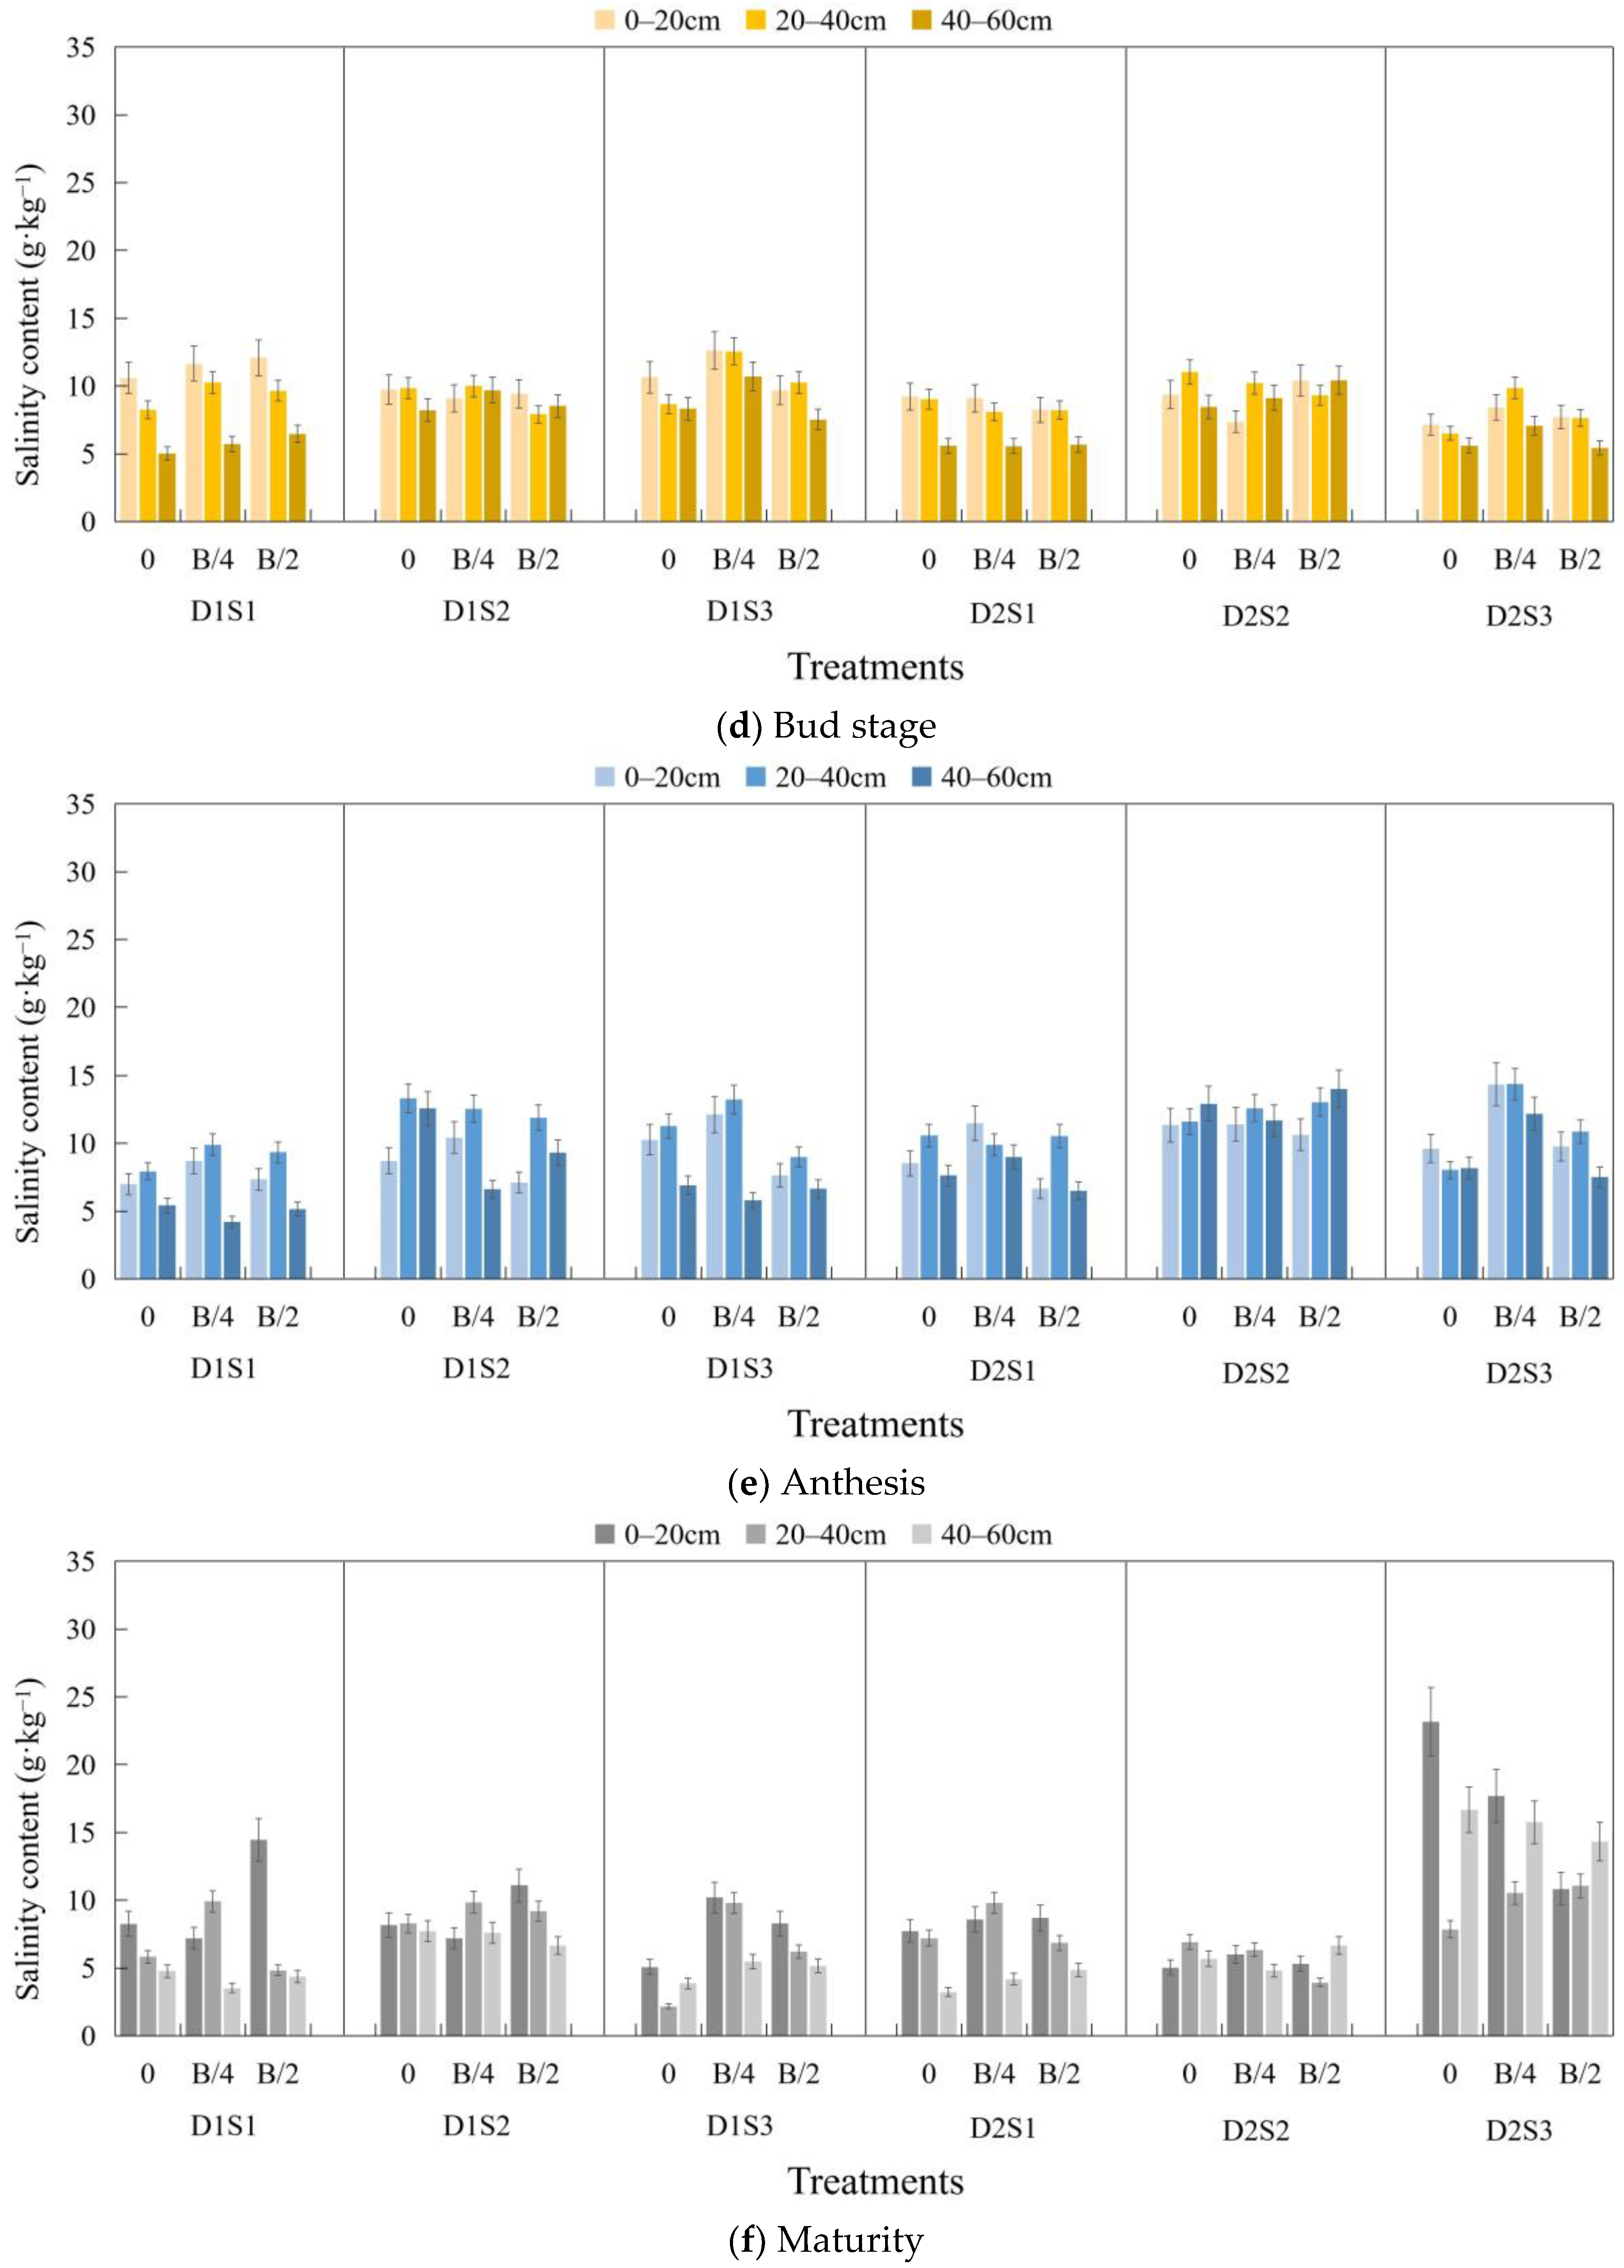
3.1. Soil Salinity Content at Various Periods of the Crop

The salinity levels in the soil profile prior to spring irrigation exhibited a characteristic phenological distribution (Figure 2a), with significantly higher levels of salinity recorded in the 0–20 cm layer (13–17 g·kg−1) compared to the 20–40 cm (10–15 g·kg−1) and 40–60 cm layers (8–13 g·kg−1). This phenomenon can be attributed to the migration and accumulation of salts to the surface layer due to the evapotranspiration concentration effect during the winter months. It is noteworthy that the salinity levels in all soil layers of the D2 treatment (1.6 m drainage depth) were lower than those observed in other spacing treatments at equivalent depths under the S2 spacing configuration (30 m), suggesting that the deep drainage system may possess a degree of capacity for salinity regulation during the non-irrigation period.
Following the implementation of spring irrigation, a substantial leaching effect was observed in the salinity of the entire profile (Figure 2b), with a reduction ranging from 46.2% to 54.1% in the 0–20 cm soil layer. Additionally, the desalination rate of the deeper soil layer exhibited a decline with depth (20–40 cm: 40.0–47.6% and 35.7–43.8% in the 40–60 cm and 40–60 cm layers, respectively. The D2S2 treatment demonstrated exceptional efficacy, achieving a salinity reduction in the surface layer to 7.3 ± 0.8 g·kg−1, surpassing the D1S2 treatment, which was 23.6% lower than the D1S1 treatment. This finding confirmed that the enhanced drainage depth (D2) with medium spacing (S2) could establish optimal drainage efficiency, thereby facilitating the migration of irrigation water with salt ions to the deeper layers. At this time, the salt profile turned to the bottom aggregation type, reflecting the typical characteristics of the downward migration of salts with water under the drenching effect.
In the seedling stage of sunflower (Figure 2c), the salinity rebound phenomenon appeared, with the mean salinity value of the 0–20 cm soil layer increasing by 42.9–57.1% compared with that of the spring irrigation, and the D2S3 treatment showed an abnormally high value (11.2 ± 1.1 g·kg−1) in the 40–60 cm soil layer.
Salt continued to accumulate during anthesis (Figure 2e), reaching 13–17 g·kg−1 in the 0–20 cm soil layer, with the salt epimerization index (surface/substrate salt ratio) rising to 1.53–1.89. The D1S3 treatment showed an extreme value (17.2 ± 1.4 g·kg−1) in this layer, revealing that the combination of shallow drainage (D1) and large spacing (S3) may exacerbate the risk of salinization. At this time, the salinity in the 40–60 cm layer showed abnormal fluctuations, with the standard deviation increasing to 1.8–2.3 g·kg−1, reflecting that the deep salt transport was disturbed by the water absorption of the crop root system.
At maturity (Figure 2f), the salinity reached the peak of the whole reproductive period, with an average value of 14–20 g·kg−1 in the 0–20 cm layer, which increased by 16.7–25.0% compared with that of the bud stage. The salinity in all layers of the D2S3 treatment was at a high level, and the salinity in the surface layer (19.8 ± 1.6 g·kg−1) reached the standard of mild salinization. At this time, the salinity profile showed a ‘bimodal’ characteristic, and the 20–40 cm soil layer became a new salinity-rich area, which may be related to the ion retention effect of the dense crop root layer. It is worth noting that the D2S1 treatment maintained a relatively low salinity (10.3 ± 0.9 g·kg−1) in the 40–60 cm soil layer, confirming that the deep drainage system combined with a small spacing can effectively maintain the effect of deep desalination.
A comparison of the time series showed that the soil salinity dynamics showed a three-phase characteristic of ‘wash-out–recovery–accumulation’ (Figure 2). Spring irrigation reduced the salinity in the profile by 37.2–52.4%, but the salt-washing effect was only maintained until the seedling stage. As the crop grew, the rate of salt re-accumulation was positively correlated with the reproductive process (r = 0.83, p < 0.05), and the salt load at maturity increased by 7.3–12.1% compared with that before spring irrigation. This antagonism between ‘irrigation-driven desalination’ and ‘biological processes promoting salinity’ constitutes a unique water and salt transport pattern in irrigated agriculture in the arid zone.
In the spatial dimension, there was a significant interlayer coupling effect in salt transport. The salinity coefficient of variation (CV) of the top soil layer (0–20 cm), as the active layer of water–salt exchange, was 28.7–35.2%, while the deep soil layer (40–60 cm) showed the characteristics of salt retention, and the differences between treatments widened to 4.8–7.3 g·kg−1 with the fertility process. Drainage system parameters affected salt dynamics by changing soil hydraulic conductivity, with an increase of 0.2 m in D, increasing salt washing efficiency by 17.3–23.6%, while the drainage salt control benefits decayed exponentially when S exceeded 30 m. The effect of drainage on salt control was also found to be significant in deeper soils (40–60 cm).

3.2. Desalinization Rate

Following our previously published research [11], after conducting significance testing (F-test), the results revealed significant differences among the treatment groups (p < 0.05), prompting further ANOVA and Duncan’s multiple comparison tests. Analysis of subsurface drainpipe spacing and soil depth demonstrated a clear trend: soil desalination rates increased with narrower spacing and closer proximity to the drainpipes. Specifically, the desalination rate was significantly higher in areas with smaller spacing, indicating that drainage culvert spacing plays a critical role in influencing desalination efficiency across different soil profiles. Notably, negative desalination rates were observed in some test plots with 30 m and 40 m spacing at a 1.6 m burial depth primarily. This phenomenon suggests salt accumulation in deeper soil layers, likely driven by increased capillary action or reduced leaching efficiency at wider spacings. As water rises through capillary forces, salts are transported upward and accumulate in the surface layers, leading to the observed negative desalination rates. The relationship between spacing and desalination efficiency appears to be closely tied to flow dynamics and leaching patterns, with narrower spacings enhancing water infiltration and salt leaching, thereby improving overall desalination rates. These findings underscore the importance of optimizing subsurface drainage system design, particularly in selecting appropriate spacing to enhance desalination effectiveness and mitigate salt accumulation risks.

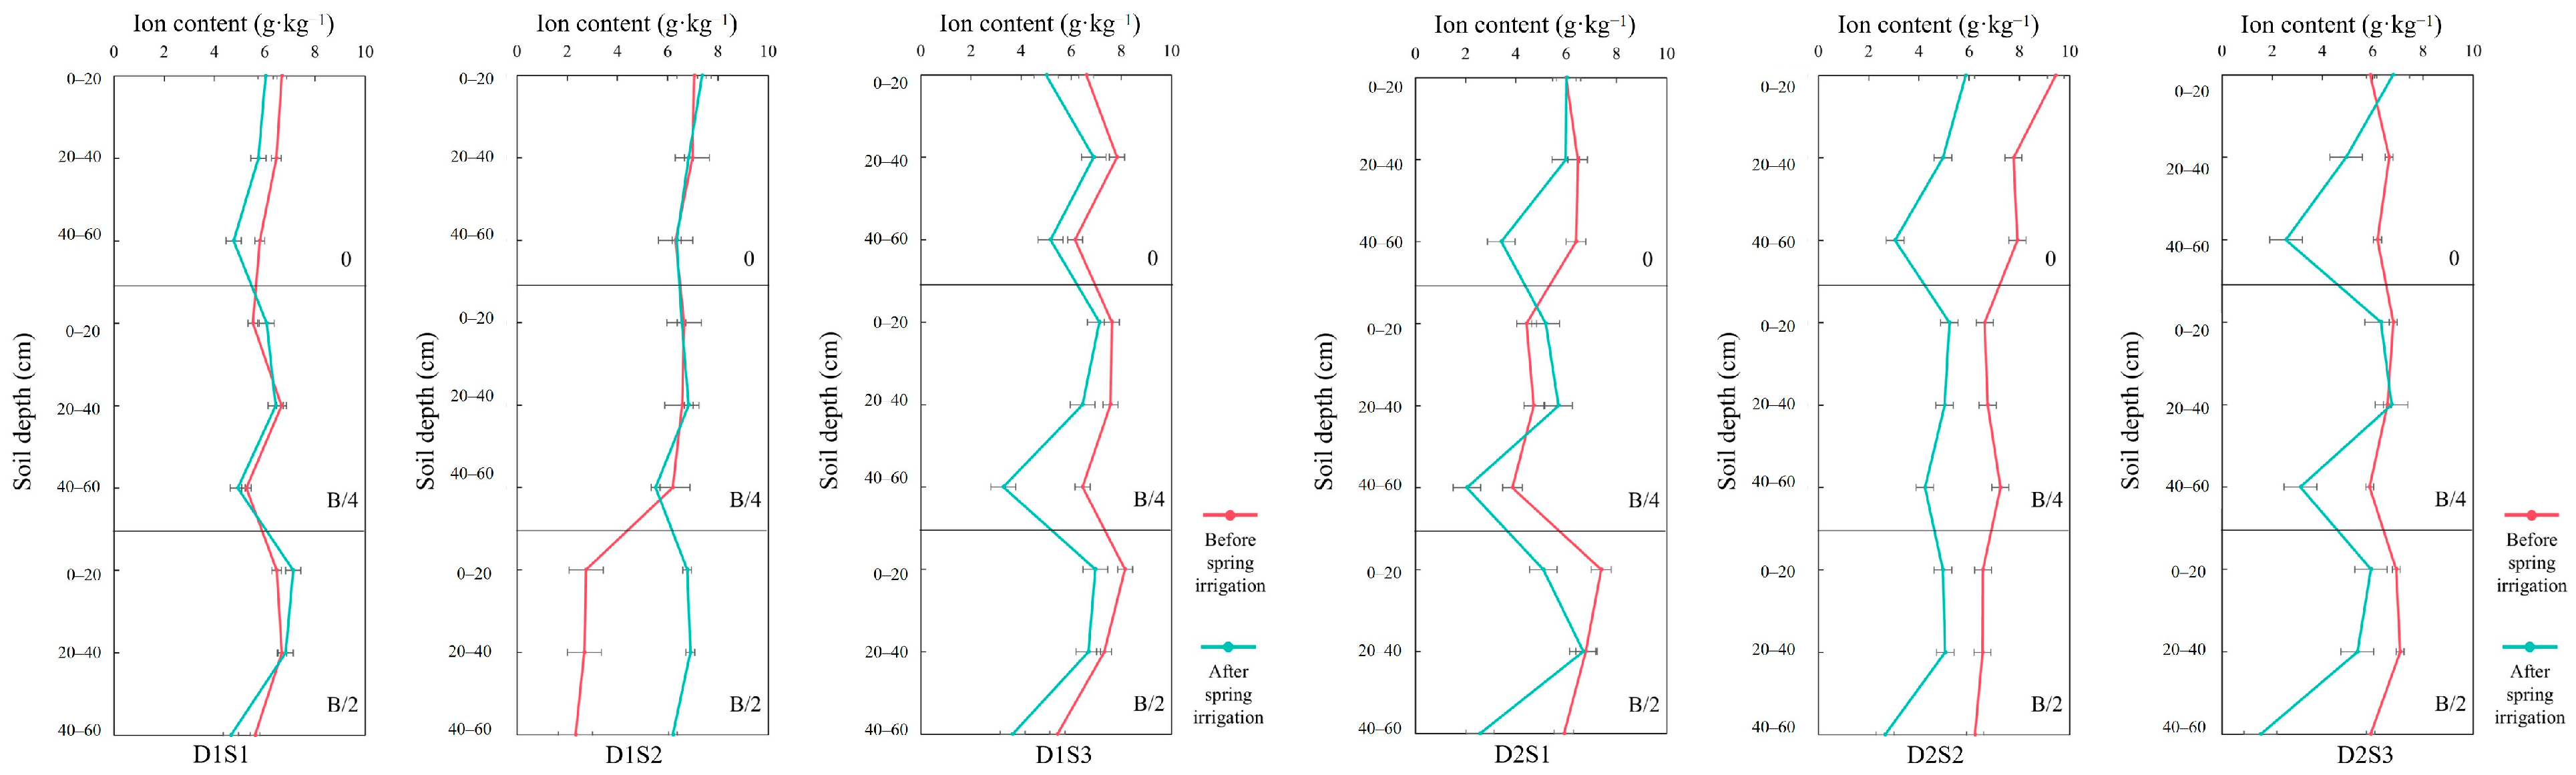
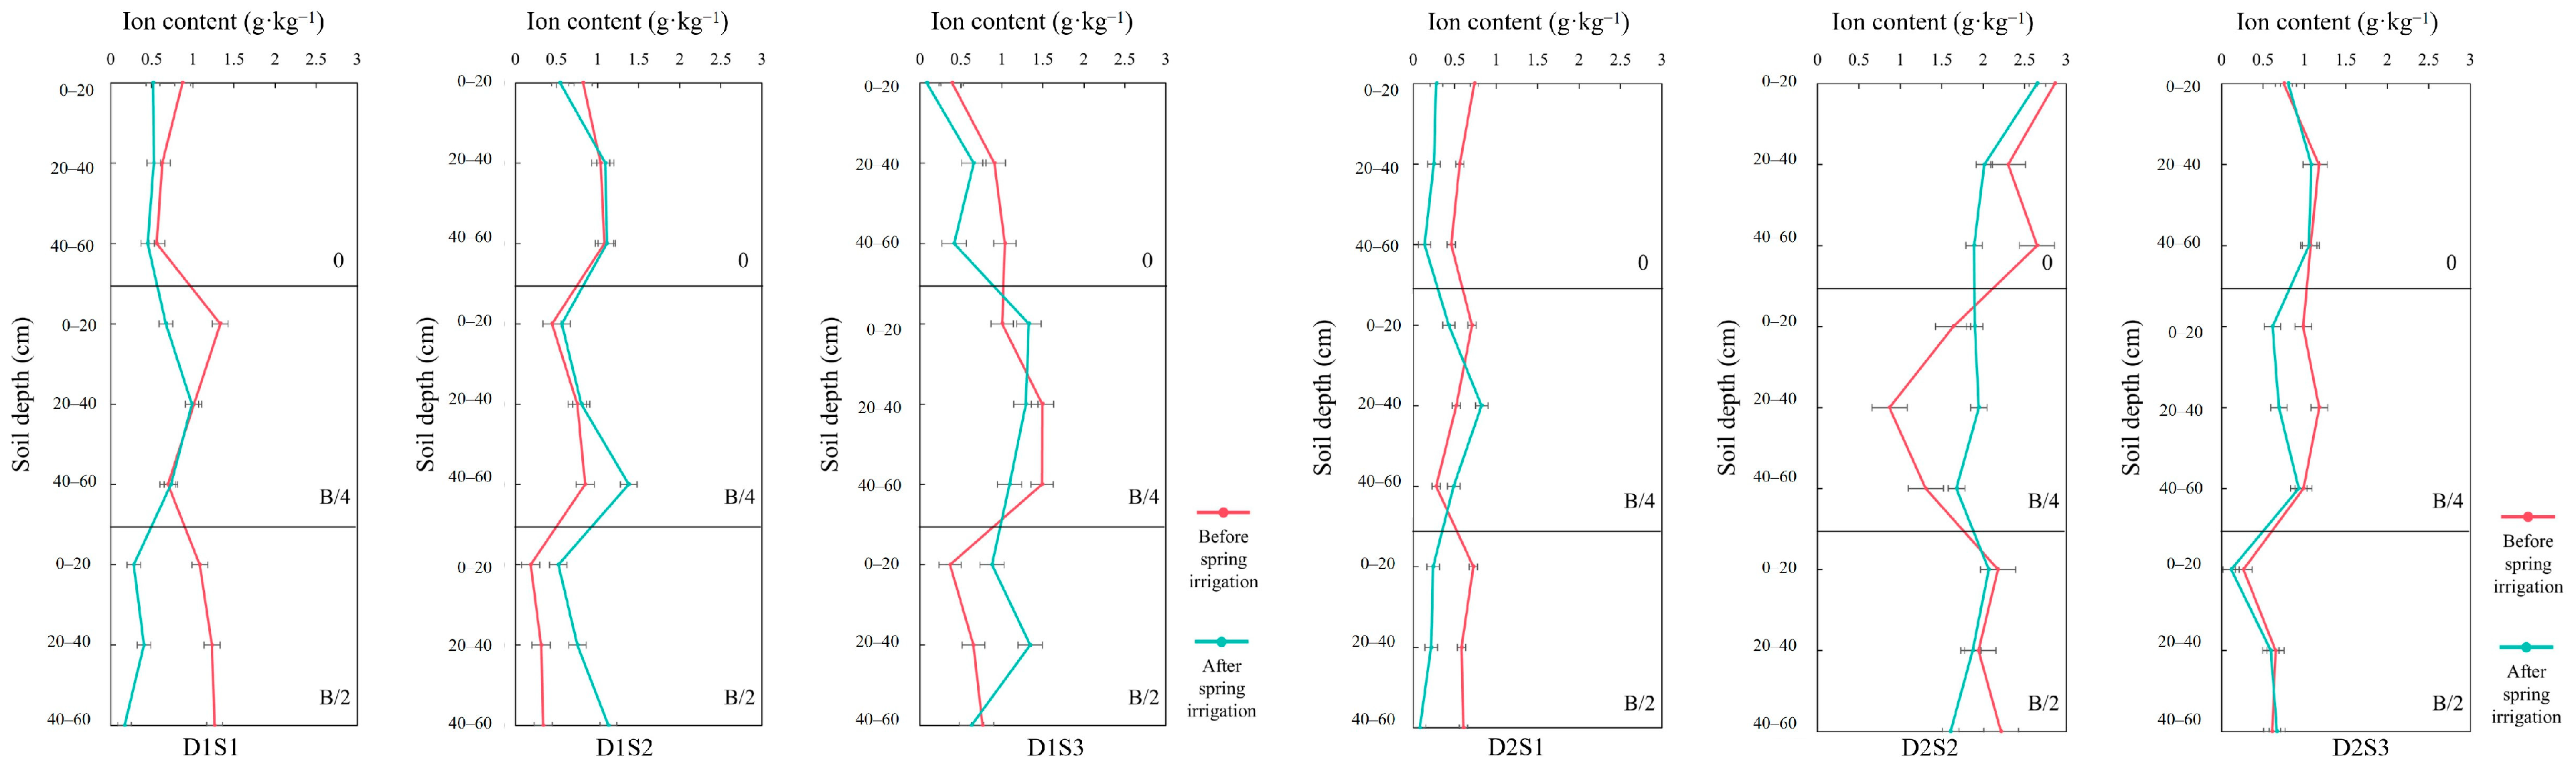
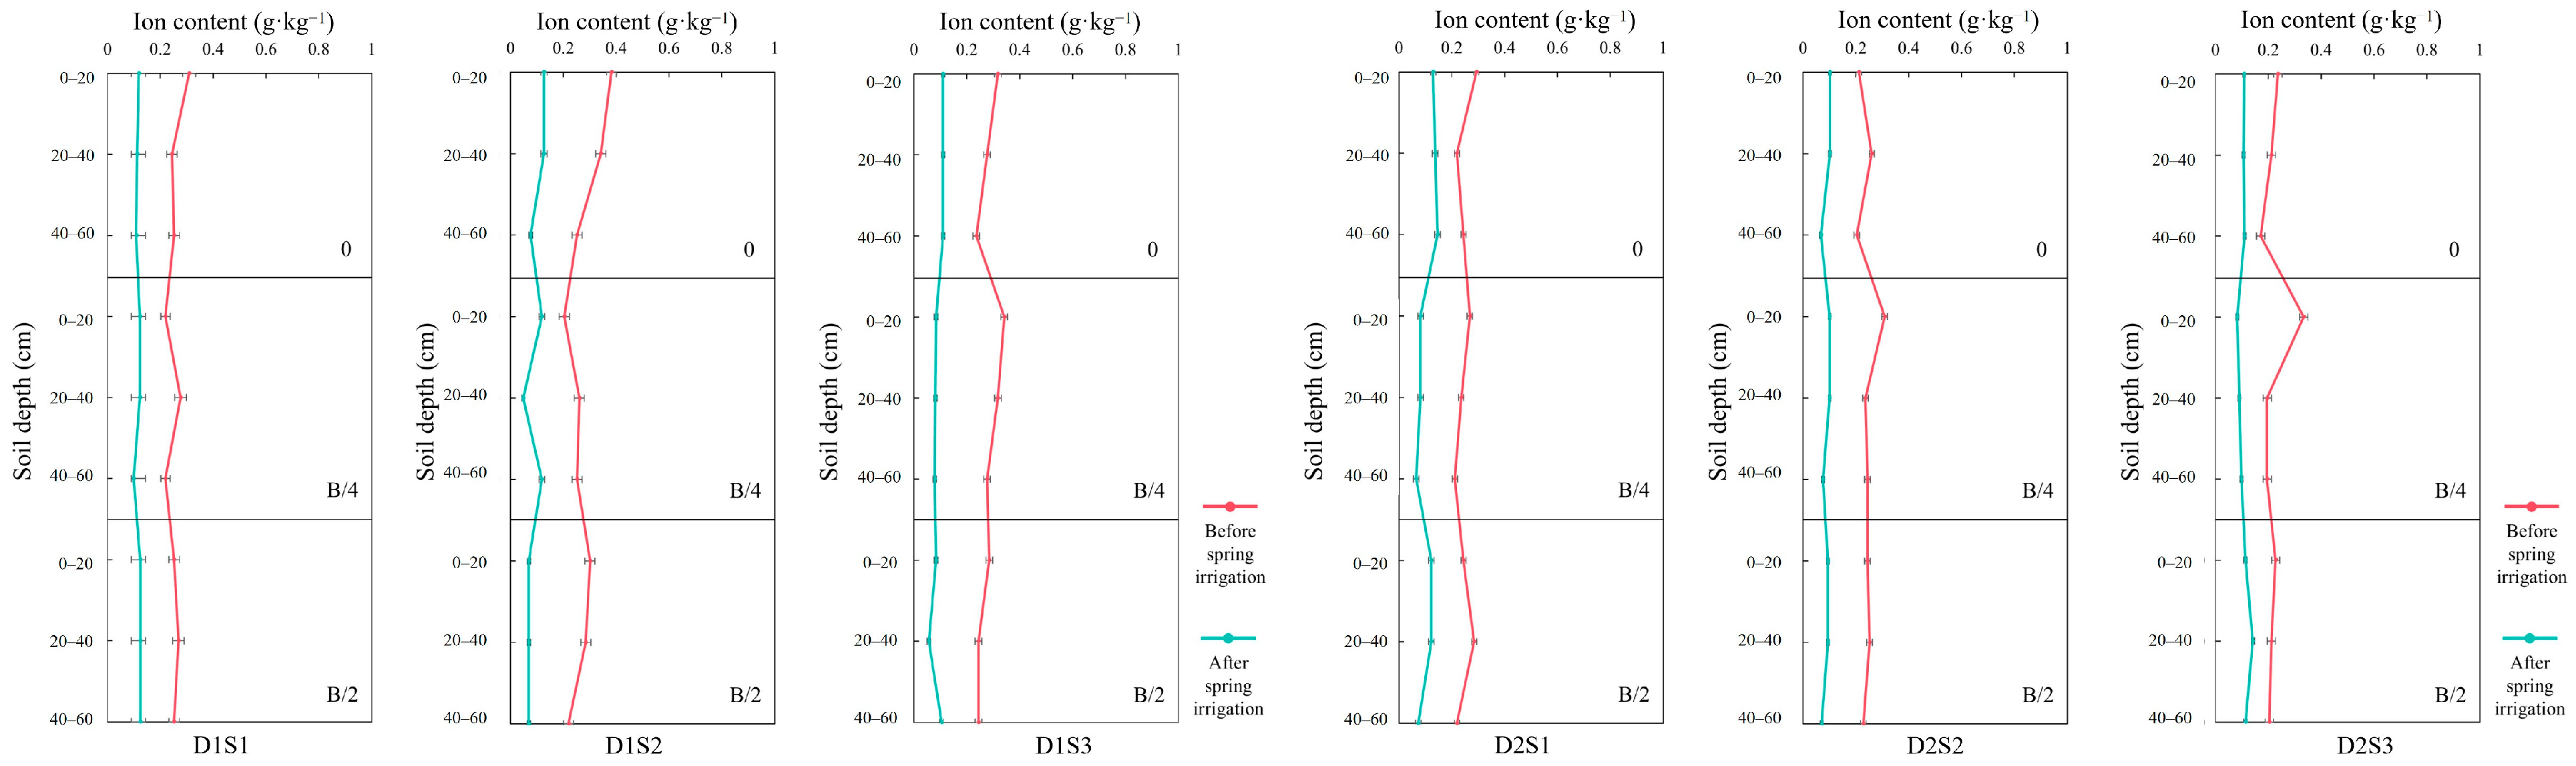
3.3. Salt Ions in Soil Before and After Spring Irrigation

The nature of the vertical differentiation of the eight ions is the result of the dynamic equilibrium of soil colloid–ion–moisture–microbe interactions. The mobility of cations is determined by charge density and adsorption strength; anions are influenced by adsorption capacity and chemical reactivity. In addition, environmental factors (precipitation intensity, evapotranspiration, and fertilizer management) further regulate the drenching process by altering water fluxes and ion concentration gradients. Therefore, soil salt ions were measured after spring irrigation drenching during the non-fertile period. Soil salt ions were mainly dominated by Cl, Na+, SO42−, HCO3, CO32−, Mg2+, K+, and Ca2+. CO32− was not detected in the 0–60 cm tillage soil, and the remaining seven ions in the soil profile are analyzed individually below.
(1)
SO42−
As shown in Figure 3, the SO42− content of the soil gradually decreased with increasing soil depth after spring irrigation, and the effect of spring irrigation on the change of SO42− content was more obvious under the D2 treatment. Taking the D2S2 treatment as an example, the sulfate ion content of the 0–20 soil layer, 20–40 soil layer, and 40–60 soil layer changed from 6.55–9.44 g·kg−1 to 4.95–5.86 g·kg−1. On the other hand, in the D1 treatment, the subsurface drain arrangement of S3 spacing was relatively better than that of the S1 and S2 treatments. This may be due to the significantly longer retention time of water in the soil. Groundwater takes longer to infiltrate horizontally into the drain from more distant areas, and the slow flow rate provides an ample time window for sulfate dissolution and desorption. Sulfate ions in soil are often adsorbed by iron and aluminum oxides or clay minerals, and the desorption process often requires prolonged moisture contact and ion exchange. Rapid dewatering can disrupt this dynamic equilibrium, resulting in some of the sulfate being carried away with the water flow before it is released, which in turn reduces the efficiency of the drench. However, this “long-range efficiency gain” phenomenon is not absolute and is more likely to occur in loamy or clayey soils.
(2)
Ca2+
In the absence of water leaching, calcium ions have a weak migration capacity in the till layer and usually show an enrichment trend in the surface layer (0–20 cm). This is mainly due to the higher charge density of Ca2+ (lower ratio of +2 valence charge to larger ionic radius), which is easily immobilized by soil colloids (clay grains, organic matter) by electrostatic adsorption. Ca2+ in alkaline soils can combine with HCO3 to form insoluble calcium carbonate (CaCO3) precipitates, further limiting its downward movement. Moisture leaching, as shown in Figure 4, effectively reduced the calcium ion content of the tillage soil. This phenomenon of large amounts of calcium ions being transported with moisture leaching, also known as sudden calcium leaching, occurs mainly in the leaching of high-salinity soils, where a large amount of Na+ displaces adsorbed Ca2+ by mass action, leading to a significant increase in calcium ion transport.
(3)
Cl
Chloride ions, as “conservative ions”, are hardly adsorbed by soil colloids and do not participate in chemical reactions, and their transport is driven solely by water movement. After rainfall or irrigation, Cl is rapidly washed downward at a rate close to that of water flow, resulting in a sudden decrease in the surface layer and a significant increase in the deep layer, as shown in Figure 5. In the D2S2 treatment, the chloride content of sampling points 0 and B/2 decreased rapidly, with water washing after spring irrigation, from 3.03–5.39 g·kg−1 to 1.04–1.66 g·kg−1. However, in the arid zone with strong evaporation, Cl may rise to the surface again by capillary action, forming an “accumulation–loss” cycle, which is particularly typical of saline soils in northwest China. When the water table is shallow (1–3 m), groundwater continues to migrate to the surface by capillary forces, and Cl, as an anion with high solubility and low adsorption, rises to the soil surface along with the capillary water. After water evaporation, Cl cannot be dissipated in the gas phase but can only be retained in the surface soil in the crystalline or dissolved state, forming a salt-enriched layer. When precipitation or irrigation occurs, water infiltration forms a downward water flow, and the Cl-enriched in the surface layer is transported back to the deeper soil or groundwater, realizing “leaching”. However, because the total amount of precipitation in arid areas is limited, the infiltration depth is usually smaller than the depth of the evaporation front (200 mm of annual precipitation in northwest China can only leach to a depth of 50 cm, while the evaporation effect can reach up to 2 m). While the evaporation effect can reach 2 m, most of the Cl will rise again by capillary action in the following drought period, forming the cycle of “surface accumulation–transient downward movement–rise”.
(4)
Na+
Sodium ions are the most migratory cations, and their low charge density (the ratio of +1 valence charge to a larger ionic radius) results in extremely weak adsorption binding to soil colloids. However, Figure 6 shows that the sodium ion content did not change significantly with moisture before and after the spring irrigation soak. There may be three main reasons for this. First, soils are often rich in swelling clay minerals, such as montmorillonite and illite, whose interlayer structure has a selective adsorption tendency for Na+. When the capillary water carries Na+ to the surface layer, some of the Na+ is adsorbed by the clay minerals, forming a “temporary fixed reservoir”. Although some of the adsorbed Na+ can be replaced by the infiltrated water, it is difficult to break the adsorption equilibrium by desorption processes due to the limited amount of water in the dry zone and the short period of water infiltration. Second, in the middle soil layer (20–40 cm), Na+ can replace Ca2+ or Mg2+ by ion exchange, resulting in an increased sodium adsorption ratio (SAR). Finally, Na+ often crystallizes as sodium chloride and sodium sulfate in surface soils of arid zones. When a small amount of precipitation occurs, these salts dissolve preferentially at the surface of the crystal nuclei, forming a localized high-concentration salt solution, which in turn inhibits further dissolution of the deeper salt crystals.
(5)
HCO3
Due to the low precipitation and high evaporation in the arid zone, soil moisture usually shows a “dry up and wet down” or seasonal fluctuation pattern, which directly affects the vertical distribution and transport of bicarbonate (Figure 7). In the surface layer (0–20 cm), strong evaporation leads to upward transport of soil water, and dissolved HCO3 is enriched in the surface layer. However, due to the generally high pH of dryland soils (which are often alkaline environments), some of the HCO3 in the surface layer of the soil may combine with calcium and magnesium ions to form carbonate precipitates (CaCO3), reducing its solubility and forming a “salt crust” or calcium accumulation layer in the surface layer. After spring irrigation, the infiltration of irrigation water temporarily breaks this equilibrium, and the water carries HCO3 to the deeper layers, but due to the poor permeability of the soil in arid zones and the low water-holding capacity of the deeper layers, the leaching depth of HCO3 is usually limited.
(6)
Mg2+
Magnesium ions behave similarly to calcium ions but have smaller ionic radii, higher charge densities, and slightly stronger adsorption capacities than Ca2+. In surface soils, Mg2+ is preferentially immobilized by interlayer sites of 2:1 clay mineral (e.g., montmorillonite), especially under drought conditions, where Mg2+ carried by rising water from capillary tubes accumulates in the surface layer as a result of evaporative concentration. In humid environments, some Mg2+ can be leached into the mesosphere and combined with sulfate to form less soluble magnesium sulfate (MgSO4), forming a temporary retention. However, due to the strong adsorption and immobilization capacity of Mg2+, its leaching depth usually does not exceed 40 cm, and the content of Mg2+ in the deeper soil layer is usually lower than that in the surface layer (Figure 8).
(7)
K+
The distribution of potassium ions was characterized by “surface fixation–deep depletion” (Figure 9). In the surface layer (0–20 cm), strong evaporation drove upward water transport, and dissolved potassium ions were enriched with capillary water to the surface layer. However, since arid zone soils are generally rich in clay minerals and silicates, these minerals have a strong specific adsorption capacity for potassium ions. The wedge-shaped sites and negative charges at the edges of clay minerals can immobilize potassium ions through ionic bonding and electrostatic interactions, forming a “fixed state of potassium”. As a result, the concentration of soluble potassium in the topsoil is often lower than expected from the theoretical evaporation concentration, with some potassium trapped in the mineral lattice in a non-exchangeable state. However, during spring irrigation drenching, brief water infiltration can transport some of the weakly adsorbed exchangeable potassium in the surface layer down to the middle zone of 20–40 cm. However, due to poor soil permeability and low water-holding capacity, the leaching effect is usually limited, and potassium ions are more likely to compete for adsorption sites with calcium and magnesium ions in the middle soil layer, forming a dynamic equilibrium.

3.4. Soil Water Chemistry Before and After Spring Irrigation

The evolution of soil hydrochemical properties before and after spring irrigation represented a dynamic game of water transport and salt redistribution (Figure 10). Before spring irrigation, the cations in the 0–60 cm of the till layer were dominated by calcium and magnesium. Ca2+ + Mg2+ accounted for 80–90% of the cation triangulation (sample D1S1-0). Sodium and potassium ions appear only locally enriched (15%) in the deeper layers (D1S1-60). This distribution is closely related to the long-term effects of weathering and carbonate dissolution in the parent rock. After spring irrigation, the absolute dominance of calcium and magnesium in the surface layer has not been dissipated (Ca2+ + Mg2+ in D1S1-0 still accounts for more than 85%). However, the percentage of sodium and potassium in the deeper layers was significantly increased to 20–25% (D1S1-60 shifted towards the Na+ + K+ axis), suggesting that soluble sodium salts carried by irrigation water were enriched at the bottom of the tillage layer with the infiltration process. This phenomenon is reflected in the characteristic longitudinal elongation of the D1S1 series of markers. The mechanical leaching of the irrigation water broke the vertical equilibrium of the original saline ions.
HCO3 is absolutely dominant in the anion triangulation before spring irrigation (up to 75% in D1S1-0), and Cl + SO42− is only 30–40% in the deeper samples (D1S1-60), reflecting a water chemistry background dominated by carbonate weathering. After spring irrigation, the proportion of HCO3 in the surface layer remained stable, but the enrichment phenomenon of Cl + SO42− in the deep layer intensified, and the proportion of both exceeded 50% in the D2S1-60 samples, and the corresponding TDS value further increased from 21.20 g·kg−1 before spring irrigation to 23.20 g·kg−1 after spring irrigation. This “anion substitution” could be due to two mechanisms. One is that the irrigation water itself contains high concentrations of sulfate or chloride (e.g., groundwater irrigation), which directly imports salts. The second is that water infiltration dissolves gypsum (CaSO4·2H2O) or sodium minerals in deeper soils, leading to secondary release of SO42− and Cl. In particular, the retention of HCO3 in the surface layer (D1S1-0 still retains more than 70%) and the accumulation of Cl + SO42− in the deeper layers form an “anionic vertical decoupling”. This is consistent with the phenomenon of “selective leaching” that occurs when the rate of irrigation water infiltration is faster than the rate of evaporation—the highly soluble Cl and SO42− are preferentially carried by water to the deeper layers. Cl and SO42− are preferentially carried by water to the deeper layers. HCO3 is inert in the surface layer because it forms carbonate precipitates with calcium and magnesium ions or adsorbs on the colloidal surface.
Prior to spring irrigation, a weakly alkaline environment supported by the combination of HCO3 + Ca2+ + Mg2+ dominated. Only the deep layer showed microdomain pH fluctuations due to secondary enrichment of Cl + SO42− + Na+. After spring irrigation, the surface layer remained alkaline. However, the sodium adsorption ratio (SAR) of the deeper soil, under the synergistic effect of Cl + SO42− + Na+, increased from 5.2 before spring irrigation to 7.8. This sodium dominance may weaken the carbonate buffering capacity by dispersing soil colloids, increasing local pH fluctuations.

4. Discussion

In terms of salt profile dynamics, the salinity fluctuation in the top soil layer (0–20 cm) was significantly higher than that in the deeper soil layer, confirming its sensitivity as a core interface for water–salt exchange. The salt leaching effect after spring irrigation was most significant in the D2S2 treatment, where the salinity in the 0–20 cm soil layer decreased to 7.3 ± 0.8 g·kg−1, 23.6% lower than that in the D1S1 treatment, which was attributed to the fact that the increase in drainage depth promoted the downward movement of salt carried by gravitational water through the enhancement of hydraulic gradient, whereas the medium spacing optimized the drainage coverage, which was in line with the optimal drainage density theory proposed by the previous authors [11,14]. It is worth noting that when the spacing was increased to 40 m (S3), the deep salinity in the D2 treatment group rebounded significantly at maturity, and the salinity in the 40–60 cm layer increased by 28.9% compared with that in the S2 treatment, which revealed that there was a spatial decay effect in the efficiency of the drainage system. When the spacing of the drainage was more than the threshold, the mode of soil water and salt transport changed from continuous medium flow to local stagnation. When the drainage spacing exceeded the critical value, the soil water and salt transport pattern changed from continuous medium flow to local retention [15].
The salt homogenization that occurred at the seedling stage was closely related to the low transpiration efficiency at the early stage of crop root development, when the evaporation rate of the surface soil was high, leading to the redistribution of salts carried by rising capillary water within the profile. In the bud stage, with the increased crop leaf area index, transpiration gradually dominated the water and salt transport, and a salt-rich zone was formed in the dense layer of the 20–40 cm root system (peak 16.3 ± 1.2 g·kg−1), which was related to the solute sieving effect produced by the root system water uptake [16]. The bimodal distribution of salts in the surface layer and rhizosphere at maturity reflected the coupling of biotic and abiotic processes: on the one hand, crop transpiration exacerbated soil solution concentration; on the other hand, deep salts were transported to the shallow layer through hydraulic lifting [17,18,19], which was particularly significant in the D1 treatment group (drainage depth of 1.4 m), where the salt content in the 40–60 cm layer was 18.8% higher than that of the D2 treatment group, indicating that the shallow drainage system was difficult to effectively cut off the deep layer. The shallow drainage system makes it difficult to effectively cut off the hydraulic connection of upward salt transport in the deep layer [20,21,22].
From the perspective of agricultural management, the identification of the ‘critical window period’ of salinity dynamics is crucial [23]. The 30–45 days from spring irrigation to the seedling stage is the key stage to inhibit salinity rebound when the surface soil water content drops rapidly from saturation to 60–70 percent of the field water holding capacity. During the reproductive growth period (bud stage to maturity), salinity control needs to be shifted to precise management of the rhizosphere, and water transport by drip irrigation systems can create localized low-salt micro-zones, e.g., by implementing pulsed drip irrigation (10 mm each time at 3-day intervals) during the flowering stage, which reduces the electrical conductivity of the soil layer of 20–40 cm, and at the same time, avoids nutrient losses caused by deep seepage.
At the engineering level, the optimal design of ‘deep drainage (≥1.6 m) + dynamic spacing (25–30 m in the dry season and 30–35 m in the rainy season)’ is recommended [24]. At the agronomic level, the synergistic technological system of ‘mulching evaporation suppression–drip irrigation for salt control–salt-tolerant varieties’ needs to be set up, especially in the salt-sensitive period (seedling and flowering), where the water is precisely regulated. Future research should focus on three breakthroughs: (1) developing zonal drainage design algorithms based on spatial variability of soil texture, (2) quantifying the contribution of crop root-zone hydraulic enhancements to salinity redistribution, and (3) constructing a multi-scale water and salt transport model coupled with remote sensing inversion data to achieve real-time early warning of salinity risk and dynamic control. Only through the deep integration of engineering–biological–management measures can we break through the salinity barrier for sustainable agricultural development in arid zones [25,26,27].

5. Conclusions

In this study, we systematically analyzed the characteristics of salt ion migration in arid zone tillage soil under the synergistic effect of drip irrigation drenching and underground salt drainage technology. It reveals the vertical differentiation law of salt dynamics and the mechanism of technology regulation. The experimental data showed that the optimized combination of underground drainpipe depth (D1 = 1.4 m, D2 = 1.6 m) and spacing (S1 = 20 m, S2 = 30 m, S3 = 40 m) could significantly reshape the salt migration path. During the spring irrigation in the non-fertile period, the D2S1 treatment (deep burial depth + small spacing) reduced the salinity in the 40–60 cm deep layer to 10–15 g·kg−1.
This resulted in an increase of 5–8 g·kg−1 of salinity in the middle layer of 20–40 cm, creating a risk of secondary salinization due to the “downward migration of salts without drainage”. Changes in soil water chemistry after spring irrigation further confirmed the technological differences: Cl and Na+ plasma washing efficiency increased by 40% in the D2 treatment compared to the D1 treatment, but the amount of SO42− retained in the middle layer due to colloidal adsorption increased by 12%. The migration partitioning mechanism of soluble salt and adsorbed salt-based ions was revealed. The results provide a theoretical basis and technical paradigm for the sustainable use of arable land and the improvement of saline–alkaline soils in arid zones. In the future, it will still be necessary to use soil texture mapping and groundwater salinity thresholds to guide precise drainage zoning while optimizing crop-drainage synergistic effects by combining root dynamic modeling. These still pose challenges for saline land management in arid regions.

Author Contributions

Conceptualization, H.M.; data curation, H.W.; formal analysis, H.W.; funding acquisition, X.M.; investigation, Q.Z. and Y.F.; methodology, H.W., Q.Z. and F.D.; project administration, X.M.; resources, Q.Z., W.X. and H.M.; software, F.D.; supervision, X.M. and W.X.; validation, F.D.; visualization, W.X. and Y.F.; writing—original draft, Q.Z. All authors have read and agreed to the published version of the manuscript.

Funding

This research was funded by the National Key Research and Development Program grant number 2021YFD1900805 and Tianshan Ying Cai Youth Tuo Ju grant number 2023TSYCQNTJ0036. And, the APC was funded by Qianqian Zhu.

Data Availability Statement

Data can be provided by the corresponding authors upon request.

Acknowledgments

We are grateful for the financial support from the National Key Research and Development Program (2021YFD1900805) and Tianshan Yingcai-Youth Tuojiao (2023TSYCQNTJ0036).

Conflicts of Interest

The authors declare no conflict of interest.

References

  1. Kaushal, S.S.; Mayer, P.; Shatkay, R.R.; Maas, C.M.; Cañedo-Argüelles, M.; Hintz, W.D.; Wessel, B.M.; Tully, K.; Rippy, M.A.; Grant, S. Salinization of inland waters. In Treatise on Geochemistry, 3rd ed.; Anbar, A., Weis, D., Anbar, A., Weis, D., Eds.; Elsevier: Oxford, UK, 2025; pp. 151–191. [Google Scholar]
  2. Li, D.; Yang, Y.; Zhao, Y.; Zhou, X.; Han, Q.; Liu, H.; Li, M. Optimizing cotton yield and soil salinity management: Integrating brackish water leaching and freshwater drip irrigation with subsurface drainage. Field Crops Res. 2024, 314, 109454. [Google Scholar] [CrossRef]
  3. Karimzadeh, S.; Hartman, S.; Chiarelli, D.D.; Rulli, M.C.; D’Odorico, P. The tradeoff between water savings and salinization prevention in dryland irrigation. Adv. Water Resour. 2024, 183, 104604. [Google Scholar] [CrossRef]
  4. Wang, P.; Wang, W.; Rong, Y.; Zhang, C.; Wang, C.; Wang, X.; Huo, Z. A novel conceptual model coupling crop growth and soil water-heat-salt processes in arid area. J. Hydrol. 2025, 647, 132284. [Google Scholar] [CrossRef]
  5. Yao, C.; Guo, C.; Wu, J.; Qiang, W.; Qin, S.; Yang, H.; Li, H. Evaluation of combined open ditch and subsurface drainage: Experimental data and optimization of specifications in arid Northwest China. Agric. Water Manag. 2024, 306, 109182. [Google Scholar] [CrossRef]
  6. Guo, C.; Yao, C.; Wu, J.; Qin, S.; Yang, H.; Li, H.; Mao, J. Field and numerical experiments of subsurface drainage systems in saline and low-permeability interlayered fields in arid regions. Agric. Water Manag. 2024, 300, 108898. [Google Scholar] [CrossRef]
  7. Wen, W.; Wu, H.; Zeng, L.; Jiang, Y.; Yang, H.; Huang, X. Numerical study on water and salt transport of electroosmosis in saline soil. J. Electrost. 2024, 132, 103992. [Google Scholar] [CrossRef]
  8. Yang, C.; Liu, H.; Gong, P.; Li, P.; Li, L. Electrolysis characterization of saline wastewater discharged from a subsurface pipe in saline-alkali land. J. Water Process. Eng. 2023, 55, 104265. [Google Scholar] [CrossRef]
  9. Che, Z.; Wang, J.; Li, J. Modeling strategies to balance salt leaching and nitrogen loss for drip irrigation with saline water in arid regions. Agric. Water Manag. 2022, 274, 107943. [Google Scholar] [CrossRef]
  10. Tolomio, M.; Borin, M. Controlled drainage and crop production in a long-term experiment in North-Eastern Italy. Agric. Water Manag. 2019, 222, 21–29. [Google Scholar] [CrossRef]
  11. Wang, H.; Zhu, Q.; Pan, Y.; Ma, X.; Ding, F.; Xu, W.; Fu, Y.; Bian, Q.; Kade, M. Optimizing Subsurface Drainage Spacing for Salinity Control in Arid Agroecosystems. Agronomy 2025, 15, 678. [Google Scholar] [CrossRef]
  12. ISO. Guidelines for Treated Wastewater Use for Irrigation—Part 2: Design of Irrigation Projects. International Organization for Standardization: Geneva, Switzerland, 2020. [Google Scholar]
  13. DB15/T 2567-2022; Technical Code for Concealed Pipe Drainage, Salt Discharge and Supporting Improvement Measures in Moderately to Severely Saline-alkali Land. Market Supervision and Administration Bureau of Inner Mongolia Autonomous Region: Inner Mongolia, China, 2022.
  14. Mao, W.; Zhu, Y.; Wu, J.; Ye, M.; Yang, J. Evaluation of effects of limited irrigation on regional-scale water movement and salt accumulation in arid agricultural areas. Agric. Water Manag. 2022, 262, 107398. [Google Scholar] [CrossRef]
  15. Zhang, C.; Li, X.; Kang, Y.; Wang, X. Salt leaching and response of Dianthus chinensis L. to saline water drip-irrigation in two coastal saline soils. Agric. Water Manag. 2019, 218, 8–16. [Google Scholar] [CrossRef]
  16. Jia, Z.; Luo, W.; Xie, J.; Pan, Y.; Chen, Y.; Tang, S.; Liu, W. Salinity dynamics of wetland ditches receiving drainage from irrigated agricultural land in arid and semi-arid regions. Agric. Water Manag. 2011, 100, 9–17. [Google Scholar] [CrossRef]
  17. Dong, C.; Chen, X.; Mu, Y.; Duan, Z.; Xue, Q.; Sun, C.; Li, J. Microscopic analysis of deformation and water–salt transport in chlorine saline soils under unidirectional freezing in cold and arid zones. J. Rock Mech. Geotech. Eng. 2024, 17, 2445–2460. [Google Scholar] [CrossRef]
  18. Eid, M.H.; Eissa, M.; Mohamed, E.A.; Ramadan, H.S.; Czuppon, G.; Kovács, A.; Szűcs, P. Application of stable isotopes, mixing models, and K-means cluster analysis to detect recharge and salinity origins in Siwa Oasis, Egypt. Groundw. Sustain. Dev. 2024, 25, 101124. [Google Scholar] [CrossRef]
  19. Sun, M.; Liu, H.; Li, P.; Gong, P.; Yu, X.; Ye, F.; Guo, Y.; Wu, Z. Effects of salt content and particle size on spectral reflectance and model accuracy: Estimating soil salt content in arid, saline-alkali lands. Microchem. J. 2024, 207, 111666. [Google Scholar] [CrossRef]
  20. Shen, C.; Wang, G.; Gou, Q. Dynamics of soil water, temperature, and salt and their coupled effects in Haloxylon ammodendron forests of different ages in an arid desert oasis ecotone. J. Hydrol. Reg. Stud. 2024, 55, 101965. [Google Scholar] [CrossRef]
  21. Soumaia, M.; Lotfi, D.; Yann, L.; Gerhard, S.; Mohamed, H.; Rajouene, M. Identifying the origin of groundwater salinisation in the Sidi El Hani basin (central-eastern Tunisia). J. Afr. Earth Sci. 2018, 147, 443–449. [Google Scholar] [CrossRef]
  22. Mukhopadhyay, R.; Fagodiya, R.K.; Prajapat, K.; Narjary, B.; Kumar, S.; Singh, R.K.; Bundela, D.S.; Barman, A. Sub-surface drainage: A win-win technology for achieving carbon neutrality and land amelioration in salt-affected Vertisols of India. Geoderma Reg. 2023, 35, e00708. [Google Scholar] [CrossRef]
  23. Ma, J. Characterization of Soil Water and Salt Transport Under Shallow Buried Underground Drainpipe Drainage Conditions in Yinbei Irrigation District. Master’s Thesis, Ningxia University, Yinchuan, China, 2023. [Google Scholar]
  24. Li, K. Effect of Irrigation Water Volume and Underground Drainpipe Burial Depth on Drainage and Salt Discharge Pattern with Numerical Simulation. Master’s Thesis, Shihezi University, Shihezi, China, 2020. [Google Scholar]
  25. Zhou, L.; Wei, C.; Yuan, Y.; Zhou, Q.; Zhao, B.; Zhang, J.; Wang, F. A wireless sensor network-based salt drainage monitoring system for modified alkali underground drainpipe. J. Agric. Eng. 2018, 34, 89–97. [Google Scholar]
  26. Bello, S.K.; Alayafi, A.H.; AL-Solaimani, S.G.; Abo-Elyousr, K.A.M. Mitigating Soil Salinity Stress with Gypsum and Bio-Organic Amendments: A Review. Agronomy 2021, 11, 1735. [Google Scholar] [CrossRef]
  27. Chowdhury, A.; Naz, A.; Sharma, S.B.; Dasgupta, R. Changes in Salinity, Mangrove Community Ecology, and Organic Blue Carbon Stock in Response to Cyclones at Indian Sundarbans. Life 2023, 13, 1539. [Google Scholar] [CrossRef] [PubMed]
Figure 1. Schematic diagram of underground drainage pipe arrangement.
Water 17 01388 g001
Figure 2. Soil salinity content at various periods of the crop. Sampling points 0, B/4, B/2. Positions were defined relative to drainpipe spacing (B), with sampling nodes at 0 m (directly above the drainpipe), 1/4B, and 1/2B intervals, corresponding to 0/5/10 m (S1), 0/7.5/15 m (S2), and 0/10/20 m (S3) configurations. D is drainage laterals depth (D1 = 1.4, D2 = 1.6 m), and S is laterals spacing (S1 = 20, S2 = 30, S3 = 40 m). Average value ± standard deviation, n = 3.
Water 17 01388 g002aWater 17 01388 g002b
Figure 3. SO42− changes in different soil layers before and after spring irrigation. Average value ± standard deviation, n = 3.
Water 17 01388 g003
Figure 4. Changes in Ca2+ in different soil layers before and after spring irrigation. Average value ± standard deviation, n = 3.
Water 17 01388 g004
Figure 5. Changes in Cl in different soil layers before and after spring irrigation. Average value ± standard deviation, n = 3.
Water 17 01388 g005
Figure 6. Changes in Na+ in different soil layers before and after spring irrigation. Average value ± standard deviation, n = 3.
Water 17 01388 g006
Figure 7. Changes in HCO3 in different soil layers before and after spring irrigation. Average value ± standard deviation, n = 3.
Water 17 01388 g007
Figure 8. Changes in Mg2+ in different soil layers before and after spring irrigation. Average value ± standard deviation, n = 3.
Water 17 01388 g008
Figure 9. Changes in K+ in different soil layers before and after spring irrigation. Average value ± standard deviation, n = 3.
Water 17 01388 g009
Figure 10. Soil Piper map of 0–60 cm soil layer before (left) and after (right) spring irrigation. Average value ± standard deviation, n = 3.
Water 17 01388 g010
Disclaimer/Publisher’s Note: The statements, opinions and data contained in all publications are solely those of the individual author(s) and contributor(s) and not of MDPI and/or the editor(s). MDPI and/or the editor(s) disclaim responsibility for any injury to people or property resulting from any ideas, methods, instructions or products referred to in the content.

