Article

Nutrient Monitoring and Comparison of On-Site Community Science Data Collection Methods for Indigenous Water Protection

1
School of Environment and Sustainability, University of Saskatchewan, Saskatoon, SK S7N 5A9, Canada
2
Ron and Jane Graham School of Professional Development, College of Engineering, University of Saskatchewan, Saskatoon, SK S7N 5A9, Canada
3
Toxicology Centre, University of Saskatchewan, Saskatoon, SK S7N 5A9, Canada
4
Community-Based Research Partner, Yellow Quill First Nation, Yellow Quill, SK S0A 3A0, Canada
5
College of Medicine, University of Saskatchewan, Saskatoon, SK S7N 5A9, Canada
6
Councilor and Community-Based Research Partner, James Smith Cree Nation, Melfort, SK S0E 1A0, Canada
*
Author to whom correspondence should be addressed.
Water 2025, 17(9), 1386; https://doi.org/10.3390/w17091386
Submission received: 18 March 2025 / Revised: 28 April 2025 / Accepted: 29 April 2025 / Published: 5 May 2025
(This article belongs to the Section Water Quality and Contamination)

Abstract

:
Excessive nutrient loading in freshwater is a water quality and safety concern for Indigenous communities, especially those with inadequate water treatment. Continuous nutrient monitoring efforts in collaboration with community members require cost-effective but information-rich methods. Data gathered through community-science approaches could enhance source water protection programs and can provide first-hand knowledge and expertise through reciprocal information exchange with local community members. Yet, there are still misconceptions about the validity of data gathered by community scientists. This study validates the use of two inexpensive nutrient monitoring devices (YSI 9500 Photometer and the Nutrient Smartphone App) for community-based environmental research by testing the accuracy of each device, identifying nutrient hotspots, and determining if nutrient concentrations relate to precipitation patterns in a drought-prone region of Saskatchewan within the Lake Winnipeg Basin in Canada. We found that the measurement accuracy of these devices varied depending on the compound tested, with the poorest results for nitrate (r2 = 0.07) and the best results for phosphate (r2 = 0.89) when using the photometer. Seasonal nutrient concentration patterns differed between the years of moderate (2019) and low (2021) precipitation, but there was no correlation between rainfall amounts and nutrient concentrations, suggesting other drivers. This study identifies the strengths and weaknesses of cost-effective nutrient testing devices, guiding continuous monitoring efforts with communities.

1. Introduction

Excessive nutrient loading in surface waters has become a recurring issue globally, with radiating adverse effects on local communities and surrounding ecosystems [1,2,3]. Since the mid-20th century, nutrient inputs have increased beyond the assimilative capacity of the natural environment due to intensive crop production methods [4], a changing climate [5,6,7], and greater frequency of extreme weather such as flooding, heavy precipitation, and droughts [8,9]. Identifying nutrient hotspots and monitoring changes in nitrate, phosphate, and ammonia concentrations is important as a preventative action to harmful algal bloom (HAB) growth and as a precursor to adaptive environmental planning [10,11].
First Nation reserve communities in Treaty 4, 5, and 6 Territories, in areas now known as the Canadian Prairies, often rely on surface water and shallow aquifers for source water. The predominantly flat topography of the region allows the accumulation of freshwater in surface depressions and in underground aquifers and is reminiscent of various changes to the landscape by receding glaciation, annual spring runoff, and the cultivation of land for agriculture. The topography is known as the prairie pothole region and has complex hydrology with rivers, streams, wetlands, and lakes that are intermittently connected. It transfers water and accompanying nutrients through open and closed basins [12]. With many reserve community treatment plants lacking advanced technologies to reduce cyanotoxins [13,14,15,16], some of these communities are at risk of HAB exposure [17,18,19,20]. As the climate continues to destabilize, it is becoming more difficult to confidently predict changes to the pothole regions’ hydro-ecological processes and their effects on algal bloom formation, creating monitoring and governance challenges [21]. Therefore, continuous research and collaborative efforts between people with different knowledge and backgrounds and the involvement of affected individuals are needed [22] to develop practical solutions. Indigenous knowledge systems—cumulative, place-based understandings of ecosystems developed through generations of observation and experience—offer critical insight into water stewardship. Strengthening First Nations and Tribal Nations’ capacities for source water monitoring is important for sovereign water management, particularly through community-led programs that examine, in parallel, both long-term observations on water quality and sacred cultural teachings [23,24,25]. This study supports bridging knowledge systems by combining Indigenous-led seasonal monitoring with Western sensor-based water quality analysis to co-test a set of potential tools for providing data that would support water governance strategies. Addressing these challenges requires investments in infrastructure, real-time monitoring technologies, and local training initiatives that build shared platforms by which communities can take an active role in water monitoring alongside researchers [26,27].
Nutrient loading is complex as various factors contribute to input levels, so regular monitoring through community science methods provides an important solution for preventative action [28,29], especially for communities that are more vulnerable to contamination due to geographical location and limited capacity in source water protection and water treatment. Source Water Protection Plans can mediate some of the effects of nutrient loading, but implementation of these plans can be difficult in remote locations and where there are jurisdictional and cultural barriers, allowing toxic algal blooms to develop before excessive nutrient loading is documented [16,30,31]. Despite some challenges in implementation, more researchers are recruiting local residents to engage in community science, making monitoring efforts more responsive and data more accessible, such that intervention planning can begin before the problem becomes severe [32,33]. Some studies have shown that community science methods are reliable, beneficial, and should be employed in research [21,34,35]. However, there continues to be push-back on the use of community science for decision-making and project planning owing to assumptions that community-collected data are unreliable, despite the development of portable and user-friendly measuring devices that have been simplified to account for user error and optimized to obtain accurate field-collected data.
This specific project began because community leaders shared that members noticed more frequent and extensive algal blooms in lakes and waterways and wanted to identify areas of excess nutrient loading, causes, and paths to reduce risks to health and culture due to bloom formation. In this paper, we highlight collaborative nutrient monitoring in Central Saskatchewan, a drought-prone prairie-based region dominated by agriculture. First, we test the capacity of two different nutrient testing devices (YSI 9500 Photometer and test strips coupled with a smartphone app) for in-field water monitoring and environmental community science. Photometer measurements are then used to examine nutrient concentrations in surface waters flowing through reserve lands of two participating Indigenous communities (James Smith Cree Nation (JSCN) and Yellow Quill First Nation (YQFN)). Lastly, we provide insight into the seasonal and interannual changes in nutrient concentrations in water systems and emphasize the importance of monitoring through community science methods as a long-term preventative action.

2. Approach, Materials, and Methods

The project described in this paper is part of a research program on issues of water security that started in 2011 between researchers at the University of Saskatchewan and partnered communities in Treaty Areas 4, 5, and 6. Co-authors (Bradford, Jardine, Bharadwaj, Strickert) have been engaging in community-driven research projects with formal arrangements (research agreements, memoranda of understanding) and informal agreements (mutual desire) to learn more about phenomena noticed in communities. Yellow Quill First Nation is a Saulteaux community with about 800 on-reserve residents located about 250 km east of Saskatoon, SK (Figure 1). The reserve surrounds Nut Lake, a lake with sacred value and a former fishing and drinking water source for the community. James Smith Cree Nation is a Cree community of about 1800 members on a reserve located about 200 km northeast of Saskatoon, SK (Figure 1). The reserve lies along the shore of the Saskatchewan River, where members fish across the river from the Fort a La Corne Forest, a traditional hunting and harvesting ground of the community, which is now a diamond mine site. Community-based research partners from each community were water samplers and authors of this paper. An ethics approval was needed since this study involved engagement with Indigenous communities on water monitoring and nutrient management, along with teaching and collaborating with community members on how to use the devices to gather data. Ethics approval was received from the University of Saskatchewan Behavioural Ethics Committee in 2018, renewed annually (BEH-REB 2478).

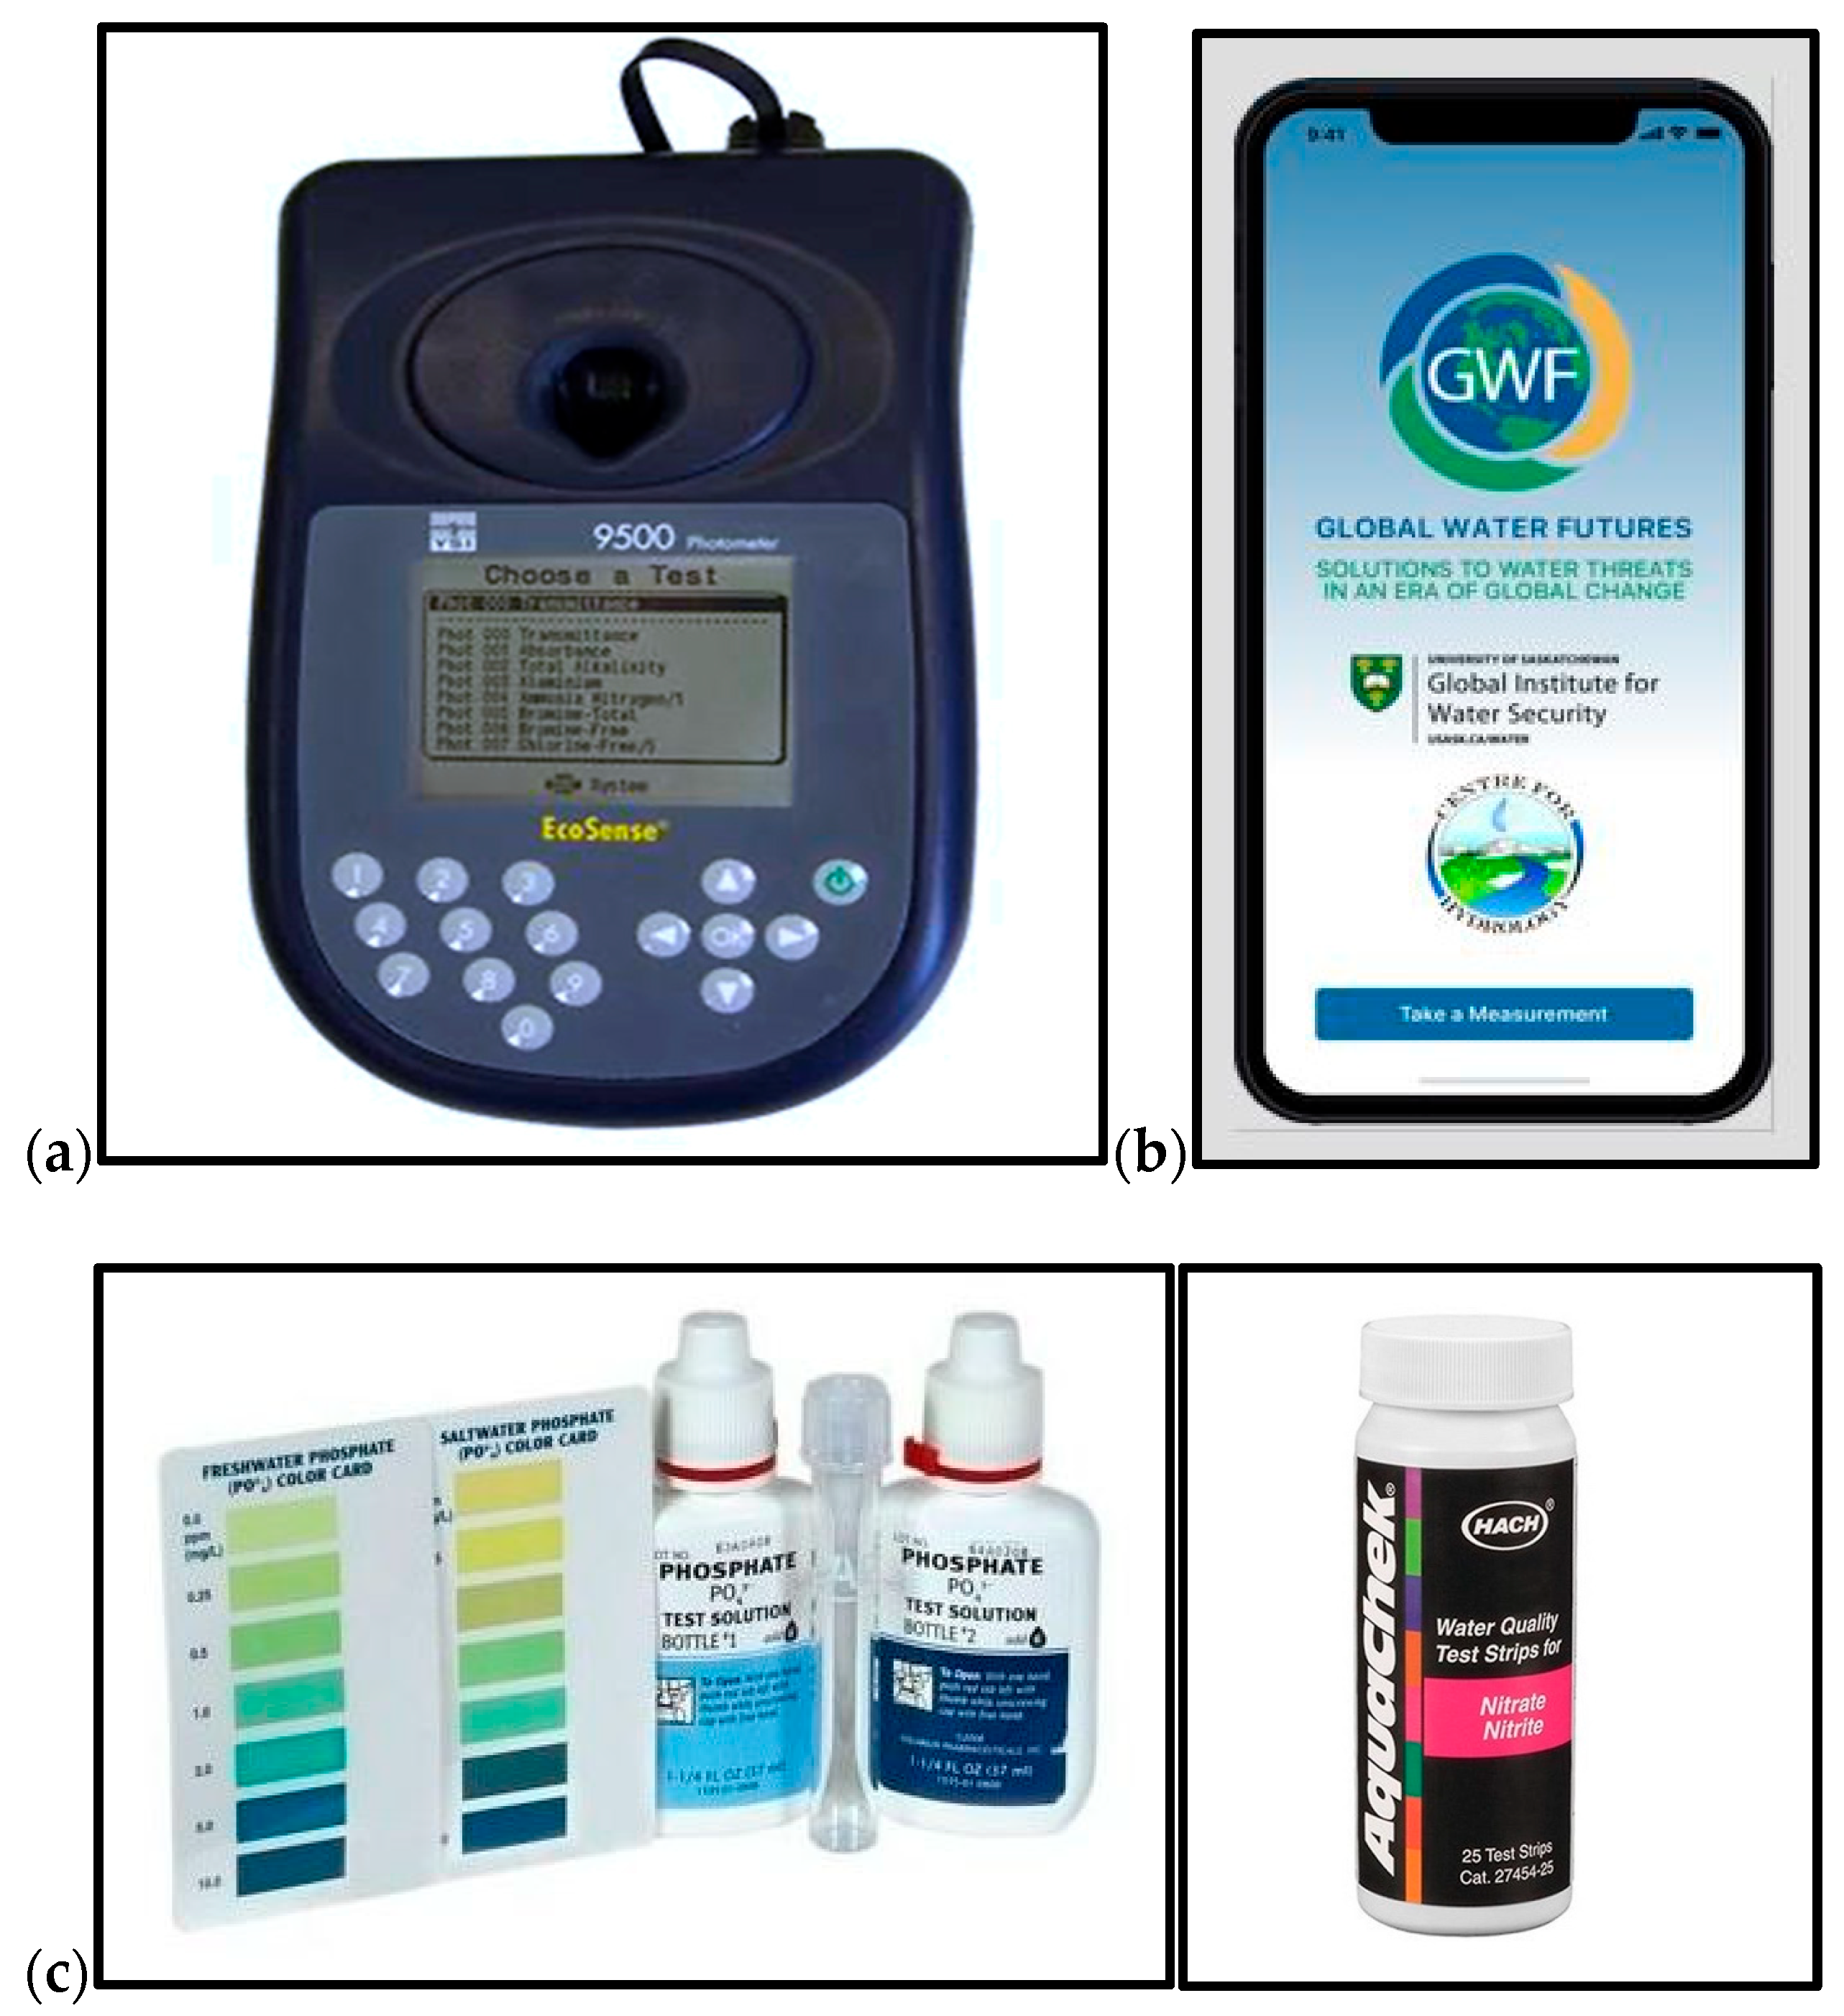
2.1. Assessing Community Science Device Accuracy

In 2021, nutrient concentrations in water samples were measured with two low-cost devices: (1) a YSI 9500 Photometer and (2) test strips combined with a smartphone app called the Nutrient App developed by the Global Institute for Water Security at the University of Saskatchewan [36]. Due to COVID-19 restrictions, water samples were collected from outside the boundaries of the YQFN and JSCN from nine sites by Porter weekly from 24 May to 25 August, then bi-weekly in September (Table 1). While it was the goal for the researchers and the community members to sample together at more sites than we report here and to include interviews and reflections on combining Western researcher and local Indigenous coordinator insights, sampling adjustments were necessary to protect the health and safety of community members, researchers, and staff, aligning with ethical recommendations to adapt field methods during pandemics without compromising participant welfare [37].
The YSI 9500 Photometer is a user-friendly, portable device that can be used to measure nutrient concentrations in water (Figure 2). The testing procedures for the photometer are uncomplicated for community researchers of various educational backgrounds to test water samples. The simplified process is important as this helps to reduce user errors in collected data. Reagents for this device are proportioned into correctly sized tablets, removing the step of measuring reagents and the possibility of using incorrect amounts. The photometer’s testing procedures are clearly explained in the manual, which can also be found online: https://www.ysi.com/File%20Library/Documents/Manuals/YPT282-9300-9500-manual-with-test-procedures.pdf (accessed on 10 April 2025).
The Nutrient (Smartphone) App can also be used by an array of people who have access to a smartphone with a functional camera. Presently, the Nutrient App tests for nitrate and phosphate using AquaChek and API test kits that are commonly used for testing water in aquariums and pools. Concentrations are measured using a Delta-E colour distance algorithm adapted from textile and graphic arts fields, which takes image pixel colouration and other variable inputs (temperature, light conditions, waterbody type) to produce a numerical value in mg/L [36]. The algorithm details and code are available through the developer’s public repository at https://github.com/DiogoCostaPT/Nutrient_app.git (accessed on 10 April 2025). Like the photometer, the testing procedure is straightforward to minimize user error. Still, there are variable sources of error that could potentially affect values. For instance, a person could have difficulty choosing the best spot on the image to measure due to a small phone screen size, larger fingers, or limited dexterity. Hence, several calibration sessions occurred between researchers and community coordinators prior to data collection. Additional details and video instructions on testing procedures for the Nutrient App can be found online: https://gwf.usask.ca/projects-facilities/nutrient-app.php#Howitworks (accessed on 10 April 2025).
While we did not have any absolute criteria for the performance of these community science devices, we expected them to be able to differentiate sites with low versus high nutrient concentrations. As such, to assess the accuracy of the photometer and Nutrient App, a subset of samples (n = 34 each for nitrate, ammonia, and phosphate, Table 1) was analysed for the same nutrient compounds in the laboratory on a SmartChem 170 Discrete Analyser (produced by Westco Scientific Instruments), which we set as the standard for measurement accuracy. Analyses on the SmartChem used U.S. EPA methods 365.1 Rev 2.0 1993, 350.1 Rev 2.0 1993, and 353.2 Rev 2.0 1993 for soluble reactive phosphorus, ammonia, and nitrate, respectively. In each case, stock standards analysed alongside samples had recoveries of 99 ± 4% (n = 12), 96 ± 5% (n = 12), and 98 ± 2% (n = 8) for the three analytes. For the photometer and the Nutrient App, measurements were made following the manufacturer’s protocols, with water tested on the same day of sampling. Regressions of nutrient concentrations measured in the laboratory (SmartChem) vs. those measured with community science instruments were conducted using R version 4.1.3 in RStudio. The accuracy of the YSI 9500 Photometer and the Nutrient App devices were assessed by slopes (and associated 95% confidence intervals) and goodness of fit of these regressions. A slope = 1 and r2 = 1 would suggest data from the community science devices are perfectly comparable to the more expensive and time-intensive laboratory measurements, while a significant regression (p < 0.05) would indicate acceptable comparability.

2.2. Identifying Nutrient Hotspot Identification

While the research program occurred in three different communities over three years, here we focus on the most-completed dataset for analysis from one community (Yellow Quill First Nation) in 2019 and comparative data from another community (James Smith Cree Nation) where a complete dataset was established in 2021 (Table 1). In each case, one community researcher from each of JSCN (Burns) and YQFN (Neapetung) was trained on these devices by Bradford.
Sampling sites in YQFN were determined through communications between geospatial experts, community members, and research team members. Samples were collected and tested by Neapetung. These sites included wetlands near roads and bridges, the centre of Nut Lake (Pagāni-sāgahigan)—a culturally important lake—and a wetland west of Rose Valley, SK. Samples were collected weekly from April 8th to August 26th, 2019. The 2021 nutrient concentration dataset was collected outside reserve boundaries to comply with COVID-19 restrictions, as described above. Both the 2019 and 2021 water samples were measured using a YSI 9500 Photometer. Testing procedures for the photometer are provided above.
To identify hotspots for nutrient concentrations in 2019 and 2021, we calculated the average nutrient concentrations for each sampled site based on measurements provided by the YSI 9500 Photometer and corrected using the best-fit line for the relationship between laboratory-measured (SmartChem) and photometer-measured data (Figure 3). The equation for corrected ammonia measurements is AmmoniaSmartChem = (1.12 x Ammoniaphotometer) − 0.11, and for corrected phosphate measurements is PhosphateSmartChem = (0.40 x Phosphatephotometer) − 0.07.

2.3. Nutrient Concentrations in Normal and Low Precipitation Years

We compared phosphate and ammonia concentrations between 2019 and 2021 using corrected photometer data. Precipitation data were obtained from an online public Daily Climate Data site from the Canadian Government (https://climate-change.canada.ca/climate-data/#/daily-climate-data accessed 10 April 2025) for the Muenster and the Prince Albert Glass Field recording stations for YQFN and JSCN, respectively. These recording stations were chosen due to their proximity to all sampling sites. Line graphs were developed to visualize the temporal changes in nutrient concentrations from sampled sites and the daily precipitation during the study period in both 2019 and 2021. We correlated precipitation (total in the week prior to sampling) against nutrient concentrations for the 2019 and 2021 data, using z-scores relative to means within sites to allow a single analysis that included all sites. For the Nut Lake Outlet site, which was sampled in both 2019 and 2021, we tested for differences in nutrient concentrations in the normal and drought years using a one-way analysis of variance test to compare ammonia and phosphate concentrations between years.

3. Results

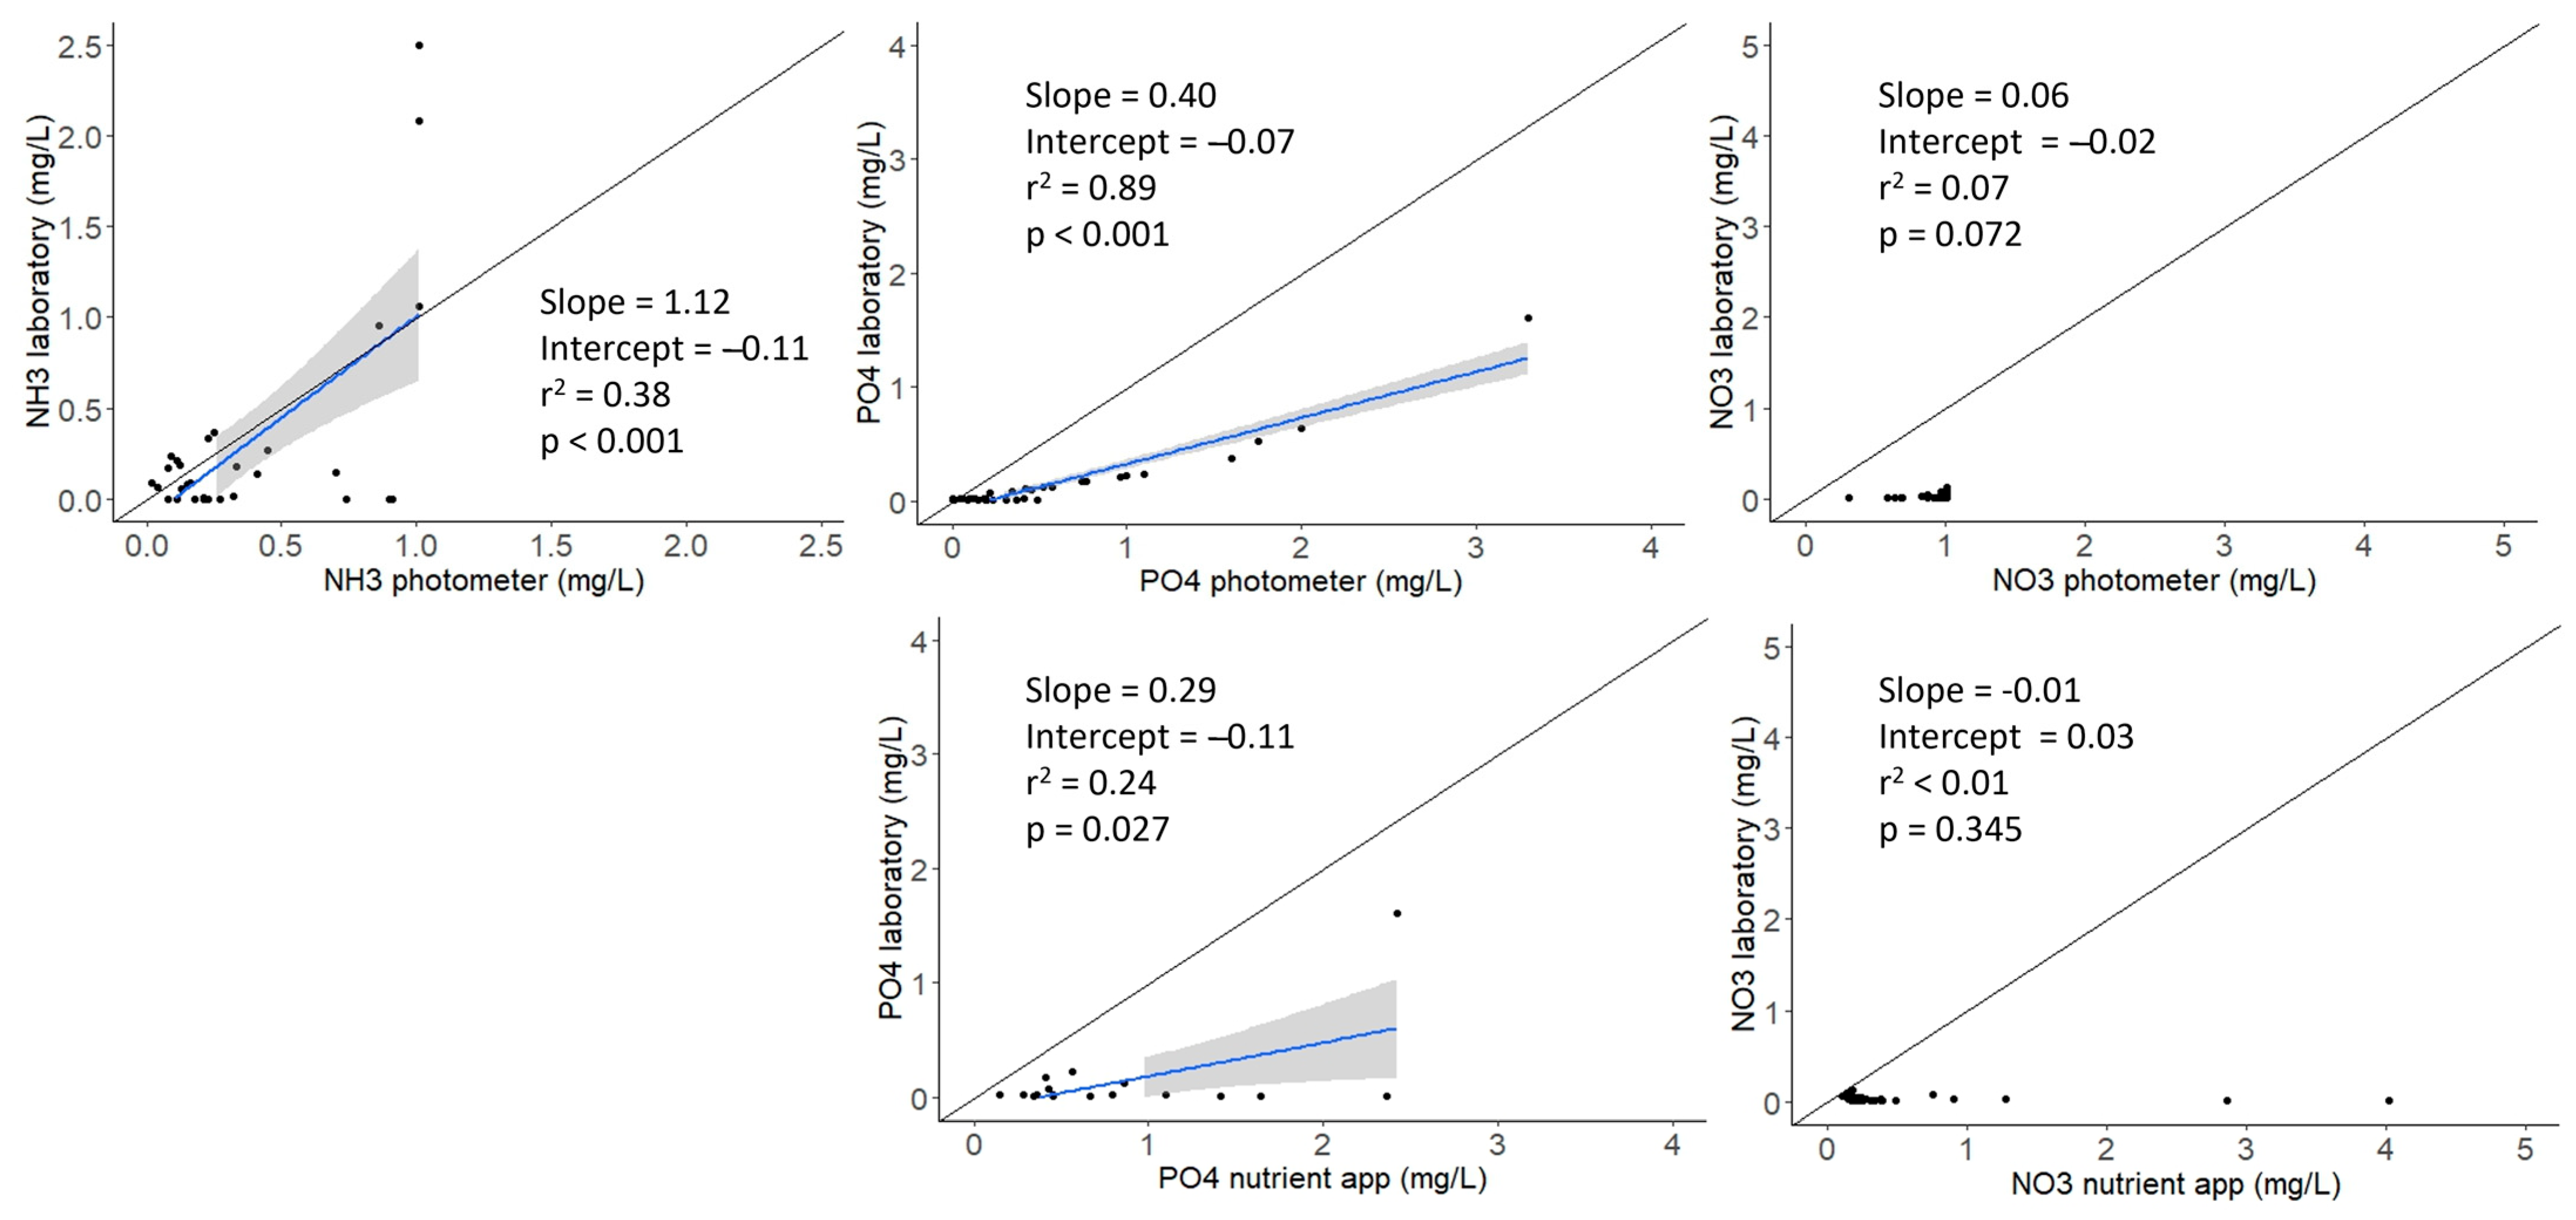
3.1. Community Science Device Accuracy

The YSI 9500 Photometer had reasonable accuracy in measuring ammonia (slope = 1.12 ± 0.50 CI; r 2 = 0.38) and better accuracy measuring phosphate (slope = 0.40 ± 0.10 CI; r 2 = 0.89). Ammonia concentrations determined by the photometer were significantly related to concentrations determined by the SmartChem 170 Discrete Analyser in the lab, albeit with significant scatter in the relationship (Figure 3). This suggests that the photometer could provide adequate ammonia concentrations when averaged over time, but this device has a high degree of error for any individual measurement. Phosphate concentrations measured with the photometer were higher than those determined by laboratory methods. However, a strong correlation was observed between these two methods above a photometer concentration of 0.5 mg/L (corresponding to a laboratory measurement of 0.13 mg/L), meaning simple corrections can be applied to increase its accuracy above these values. The Nutrient App measured phosphate concentrations higher than the SmartChem in the laboratory and showed a weaker correlation (slope = 0.29 ± 0.51 CI; r 2 = 0.24) between methods compared with the photometer. One point also had considerable leverage (Figure 3), so additional paired data are needed at high concentrations to determine the reliability of this community science device prior to its widespread adoption.
Both the YSI 9500 Photometer and Nutrient App performed poorly when measuring nitrate. Nitrate measurements using the photometer were five times higher than those determined through laboratory methods. Regressions between the photometer results and those from the laboratory (slope = 0.06 ± 0.07; r 2 = 0.07) yielded a zero within the confidence interval, indicating that photometer measurements were not accurate (Figure 3). The higher values measured by the photometer could have been due to the reagent particles remaining buoyant in the sample and detected by the photometer light. We suggest that further testing with longer waiting times could allow reagent particles to settle, which may improve measurement accuracy. There was also a poor fit between values obtained from the Nutrient App and those from the laboratory (slope < 0.01 ± 0.02 CI; r 2 < 0.01), and nitrate concentrations measured on the app were vastly higher than those in the laboratory. As a result, we recommend avoiding the use of both devices for nitrate testing and treating existing results with extreme caution.

3.2. Nutrient Hotspot Identification

Initial sampling in 2019 at YQFN (Table 2) indicated widely ranging ammonia and phosphate concentrations. The middle of Nut Lake had the highest mean concentration of both nutrients (Table 2), likely due to the lake being a central basin for the watershed. The outlet of this lake had correspondingly low nutrient concentrations, suggesting nutrient retention within the lake.
In 2021, average nutrient concentrations at YQFN were lower than 2019 concentrations, though only one site (Nut Lake Outlet) was sampled at YQFN in both years. Due to COVID restrictions, we were unable to re-test concentrations in the middle of Nut Lake, so this site should be a priority for future monitoring. The lowest concentrations of ammonia and phosphate were measured in flowing waters of creeks and lake outlets (Table 2).

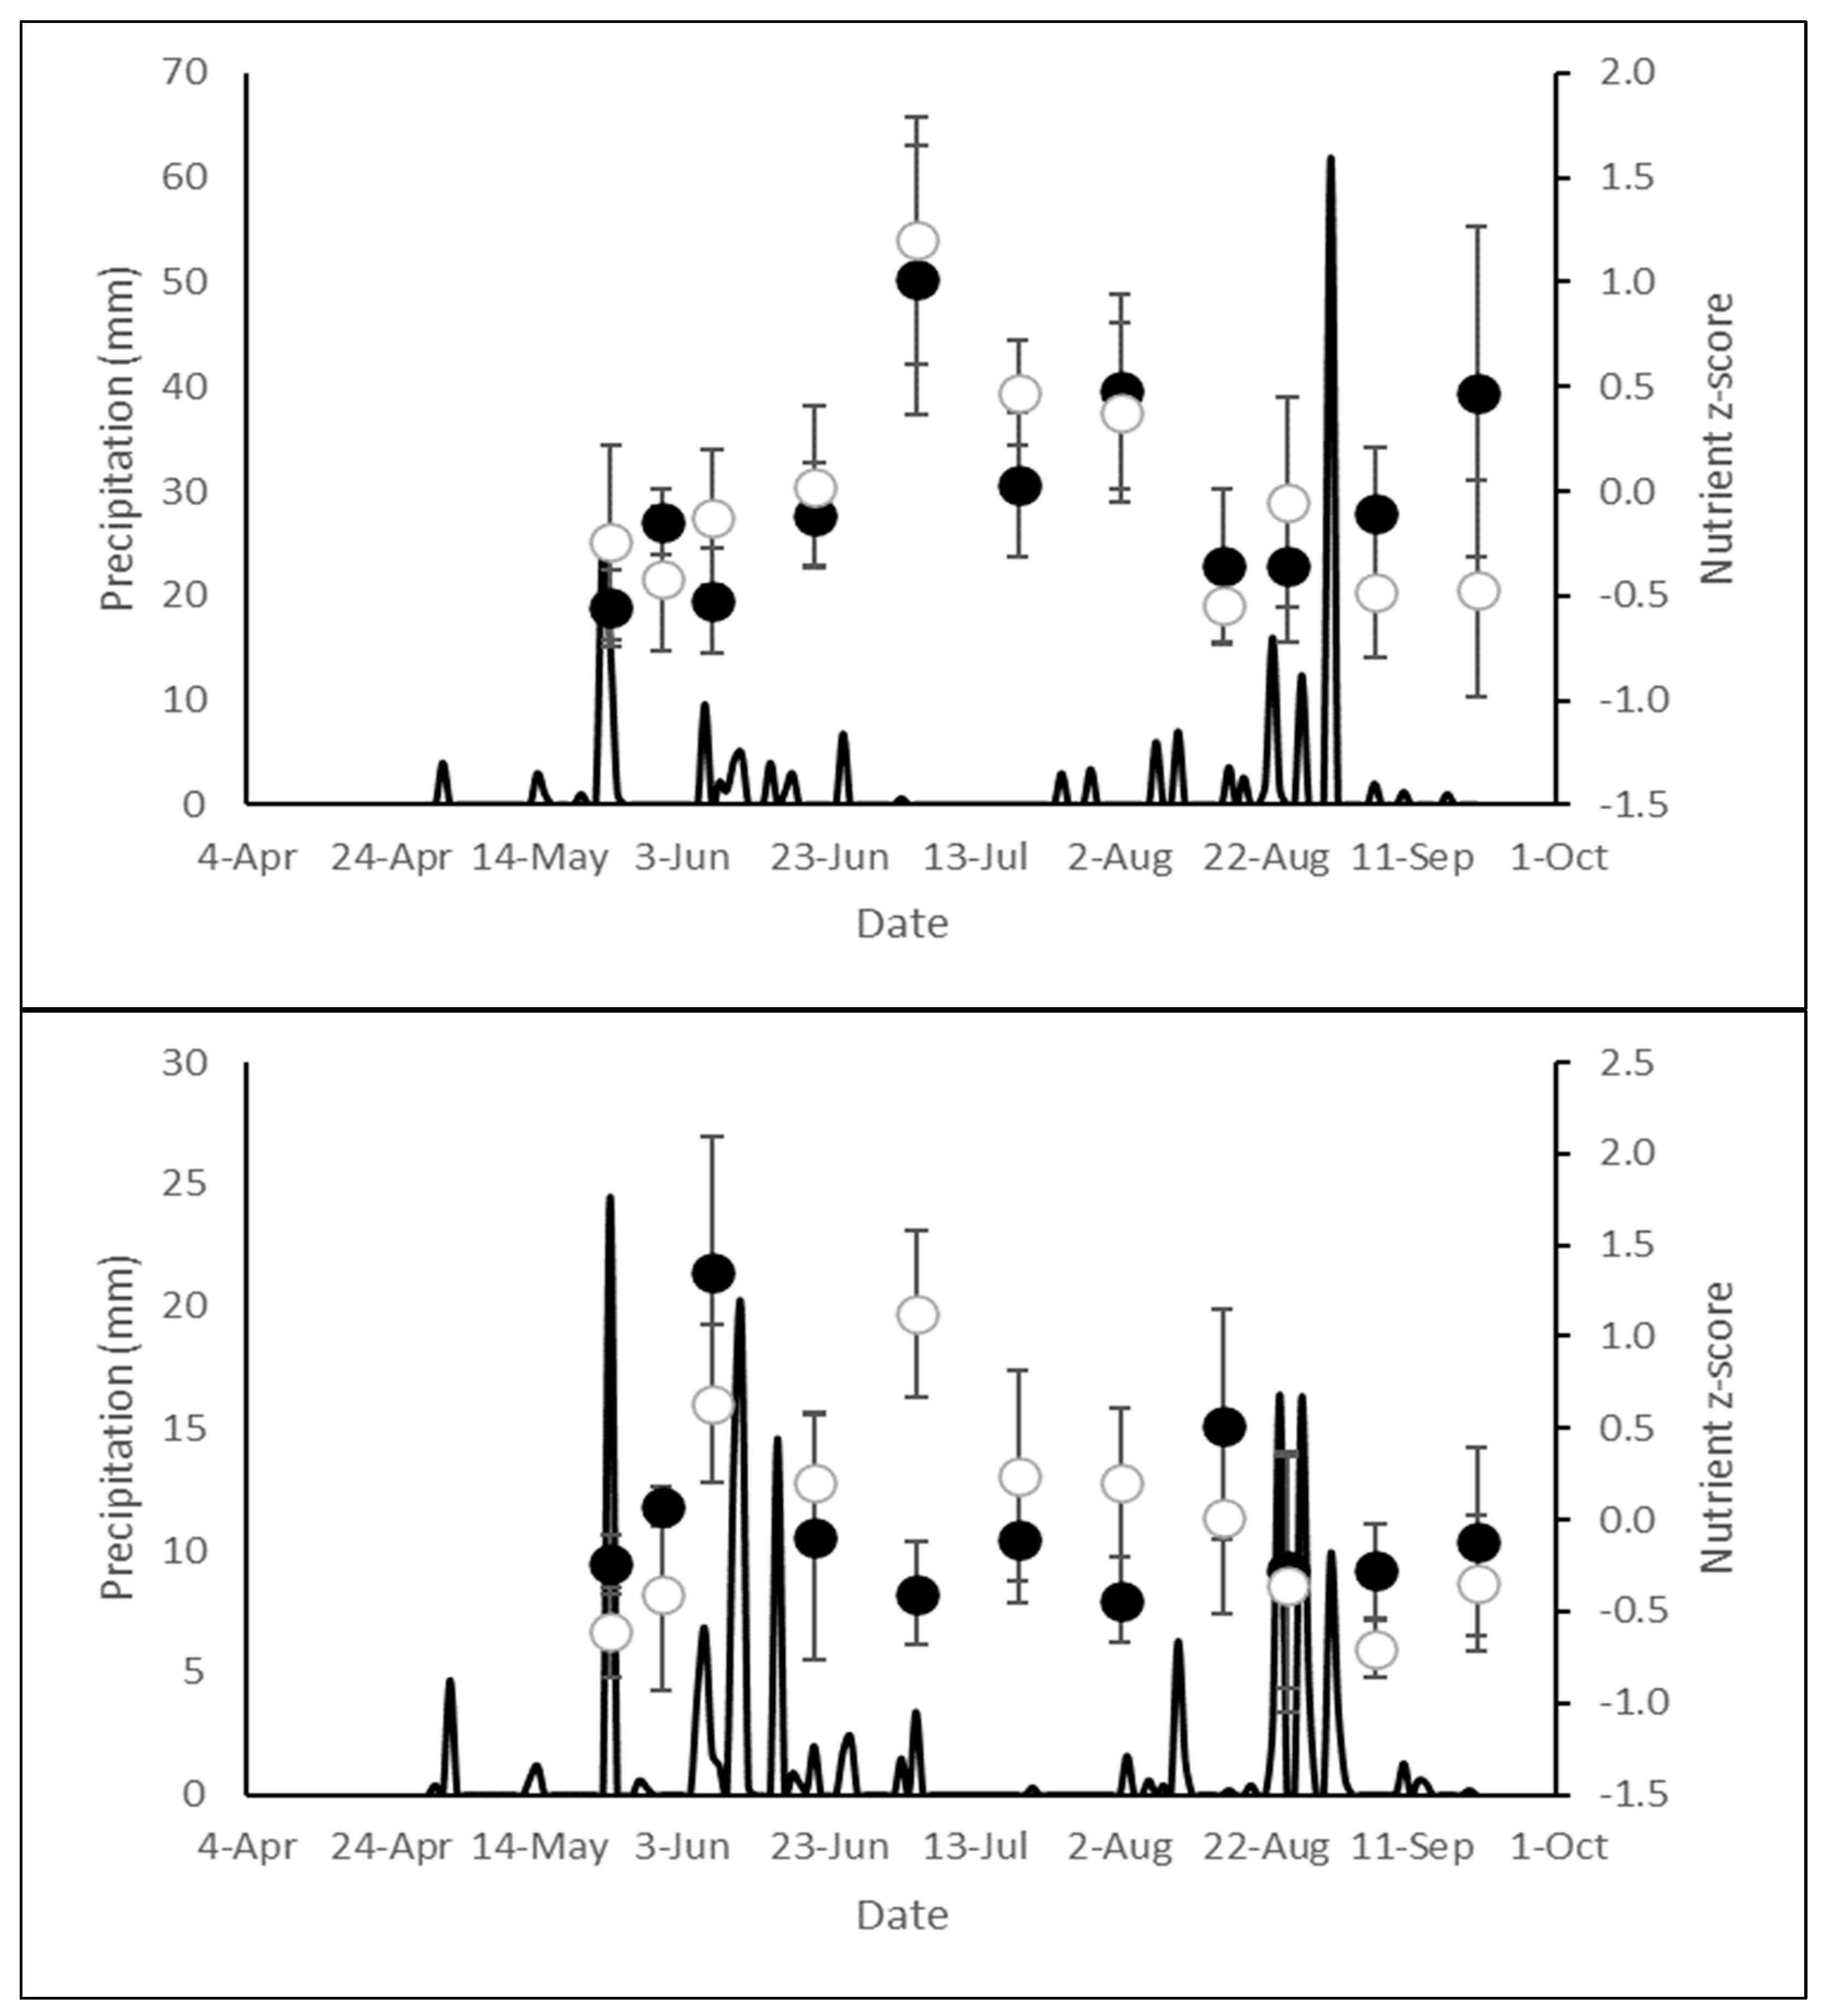
3.3. Nutrient Concentration Within and Between Years of Normal and Low Precipitation

Water sample data from 2019 and 2021 were analysed to compare nutrient concentrations within and between years with different climate conditions (precipitation frequency, evaporation rates, and average temperatures). During the study period (29 April–20 September), rainfall occurred on an equal number of days in 2019 (26.8%; 30 of 112 days) and 2021 (27.7%; 31 of 112 days) (Figure 4 and Figure 5). Yet total rainfall differed, with 249 mm falling in 2019 and 194 mm in 2021 (between 29 April and 20 September for both years), and much of the precipitation recorded by the Muenster site occurred in one day near the end of the 2021 study period (August 31 = 62 mm). The average temperature ranges between the years (2019 = 7.95 °C–20.89 °C; 2021 = 8.9 °C–23.0 °C) were very similar, but the number of times temperatures reached over 30.0 °C greatly differed (2 days in 2019; 20 days in 2021).
Differences in nutrient concentrations in the one shared site between 2019 and 2021, the outlet of Nut Lake (N 52.3721, W −103.6947), were compared. In 2021, Nut Lake Outlet had 38% lower mean concentrations of phosphate (F1, 26 = 4.421; p = 0.045), potentially due to drought-like conditions preventing the release of phosphate-rich water from the reservoir upstream (mid of Nut Lake, Table 2) over a long period. Further research with the collection of baseline data is needed to confirm this interpretation, which could not be collected within the timeframe of this study. Ammonia concentrations were similar in 2019 and 2021 (F1, 26 = 0.632; p = 0.434), which may be due to uptake by autotrophs within the reservoir and limited downstream release.
Seasonal patterns in nutrient concentrations showed no signs of increases associated with rainfall events. In 2019, concentrations rose steadily at all sites from spring through summer (Figure 4), with no noticeable peaks following rainfall. The largest increases occurred in May when little rainfall occurred. The year 2021 was a drought year, with extreme heat peaking in mid-summer and only two precipitation events occurring at Muenster (Figure 5). Nutrient concentrations fluctuated but were inconsistent with a precipitation signal. Overall, there was no correlation between z-scores and precipitation (ammonia, r = −0.05, p = 0.612; phosphate, r = −0.06, p = 0.581).

4. Discussion

Uptake and application of community science methods will involve tradeoffs between the benefits of knowledge co-production with communities and limitations to low-cost devices that can be operated by non-specialists in rural or remote areas. Field research projects can be challenging, costing time, money, and effort, especially when the research involves a large or remote region and the research team is small. Community science methods can alleviate some of these challenges and are becoming accepted as suitable research approaches by both professionals and the public [34,35,38,39]. We provided much-needed routine, in-field testing [34] that can serve as input to developers on the limitations and accuracy of community science devices, along with some considerations on improvements.
Some benefits of using community science devices for in-field testing over laboratory testing are a lessened need for prior experience or extensive training, a lower cost for materials, shorter testing times, and a reduced risk of sample degradation during transport. The Nutrient App is preferable to the YSI 9500 Photometer when considering these benefits. Testing with the app is more cost-efficient (approx. $1 per test), takes far less time (30 s per test), and is easier to transport to sampling sites. This was reiterated by community water testers who preferred the use of the app over the photometer and required less time because of test strips over complicated reagent processes. There is also the bonus of sharing results with research partners through the app’s GPS function. Using the photometer for community science is also better than laboratory testing, but it costs slightly more (approx. $3 per test) than the Nutrient App. Each test takes a minimum of 10 min, and the photometer is less portable in the field. The cost per laboratory test at the time in a university-based laboratory was phosphate ($35 CAD), nitrate ($37), and ammonia ($26), which were much higher than the field tools we tested. In addition, pragmatic and environmental factors were brought up by those sampling; for example, the constant cleaning of the photometer’s testing tubes to prevent cross-contamination takes away time for sampling, and some of the reagents are not safe for release into the local environment. The photometer could be set up in a central, indoor, or sheltered location, but that risks sample degradation if samples are not well-sealed or kept cool during transport. As important as these considerations are in choosing which method to use, the most important one for partners is the degree of accuracy.
The Nutrient App currently measures only phosphate and nitrate. Though there are many benefits that this app provides to users (noted above), we determined that corrections to improve Nutrient App accuracy and reliability are needed. The Nutrient App had poor accuracy for phosphate—with the significant regression relationship driven by a single data point—and was clearly ineffective for nitrate measurements. These results differ from those of Costa et al. [36], who found good agreement between the Nutrient App and laboratory analyses. This is likely because our data represent routine analyses by operators without long-standing training in the methods, as opposed to the App developers operating under more optimal conditions. Despite the initial testing by its developers, this app needs modifications to improve its accuracy and account for possible errors by less experienced users. Some potential sources of error include the poor resolution in the colour range of the API nitrate test strips and the lack of a zoom function which would make for an easier selection of the correct colour pixel. Additional studies could examine how accuracy is impacted by each source of error.
The photometer provided usable data but with some limitations. Given the scatter in the photometer vs. SmartChem data for ammonia, we urge some caution in interpreting individual data points with the former device. However, mean values were similar to those measured by SmartChem, and multiple high concentrations measured by the photometer were also measured as high in the laboratory. Therefore, the photometer could be used as a screening tool to identify potential high ammonia sites, but the photometer’s measurement accuracy is not as adequate with samples with lower ammonia concentrations. For phosphate, there was scatter at low concentrations but a strong linear relationship above a concentration of 0.13 mg/L. While this lower threshold as a reporting limit by the photometer already exceeds eutrophication thresholds for total phosphorus [40], this value is tenfold lower than our highest observed concentration, meaning this device could also be useful in surveillance of spatial and temporal changes in phosphate availability to primary producers.
Despite the limitations to the photometer’s sensitivity, this study builds on the current literature emphasizing that community science methods could benefit long-term nutrient and water quality monitoring by identifying areas with high and low nutrient concentrations. For example, the high phosphate concentrations classify Nut Lake as hypereutrophic [40] even after correcting for the overestimation of phosphate concentrations by the photometer. Internal loading of legacy phosphate could be responsible for these higher concentrations [41,42], and remediation options might be considered for this culturally important lake. Future monitoring of phosphorus in surface waters in the Treaty 4, 5, and 6 Territories should include the collaboration of both Indigenous communities and local agriculturalists. This would enable information exchange about the source and fate of nutrients in these watersheds to gain a clearer understanding of whether concentrations are high due to fertilizers, livestock wastes, another point source, or some combination.
Overall, we found nitrogen concentrations that were in the same range as those elsewhere in the region, such as the Qu’Appelle River Basin [43], the South Saskatchewan River [44], and shallow prairie lakes in South Dakota and Minnesota [45,46]. However, despite agriculture being the dominant land use in the region, our measured nitrate concentrations were low (mean = 0.03 mg/L, range 0.01 to 0.13 mg/L, n = 34 samples measured by the SmartChem method) relative to other prairie reservoirs (mean = 0.68 mg/L, range < detection to 5.6 mg/L) [47]. Ammonia concentrations (mean = 0.28 mg/L) were at the higher end of the range reported in Harris et al. [47]. These comparisons are presented to illustrate general regional patterns in nitrogen concentrations rather than to suggest direct methodological equivalence across studies. Together, however, these findings suggest a need for further investigation of nitrogen release, transformation, and storage in waterbodies in regions similar to the prairie pothole landscape [48,49]. Future research could involve isotopic tracing, diagenesis modeling, microbial community analysis, and comparative analysis of nitrogen cycling in diverse landscapes and waterbodies.
Precipitation is a key factor in the movement of nutrients but also likely interacts with topography, abiotic features, and economic (agricultural) activities in the surrounding environment to dictate nutrient inputs and processing. Nutrient losses from soils occur more readily under high-intensity precipitation [50,51], but much of the annual nutrient runoff in prairie waterbodies is associated with snowmelt [52]. As such, sporadic summer storms likely did not generate significant runoff and associated nutrient delivery to these waterbodies. During the 2019 study period, Saskatchewan experienced normal weather conditions, with average seasonal temperatures and more rain than in 2021. In this earlier year, sites showed steady increases in nutrient concentrations for ammonia and phosphate over time. Since ground saturation must occur before land runoff happens, the variability in measured concentrations during 2021 was likely attributed to other factors, including nutrient-enriched dust carried by the wind; dilution or evaporation; algal uptake; and other causes, such as nearby road construction, cattle, and wildlife. Capturing year-round variation in nutrient concentrations, including those under ice and in melting snow, would be helpful to better understand the source and fate of nutrients in these waterbodies. Given the different patterns in nutrient concentrations between 2019 and 2021, agricultural beneficial management practices such as riparian buffers and precision fertilizer application rates could have differential effects during years of low, average, and high seasonal temperatures and precipitation [53].
Spatial and temporal variation in nutrient concentrations in these Canadian Prairie’s freshwater systems and periodic increases that exceeded eutrophication thresholds emphasize the need for continued monitoring [54]. Continued monitoring efforts should be formally supported through long-term partnerships between First Nations, provincial agencies, and academic institutions, with funding earmarked for local training, equipment maintenance, and data governance protocols. Establishing Indigenous-led monitoring programs tied to water management decision-making processes would help ensure sustainability and sovereignty over water resources. Collaboration with interested Indigenous community-based water sampling teams is both invited and necessary for successful monitoring and management of on-reserve water sources [27,55]. This monitoring should be a continuous process with some degree of flexibility to accommodate future changes in anthropogenic and climate pressures on the environment. Since the prairie climate fluctuates between normal and adverse conditions, past predictability is no longer viable for environmental management and planning [21]. With the rising complexity of factors impacting nutrient loading, there is a need to develop strategies best suited to tackle the combination of needs unique to each affected region. For First Peoples, studies like this one act as a channel for collaboration where their voice and participation are valued in the research process. Collaboration, as practiced in this study, benefited all involved and nurtured shared responsibility and meaningful discussion toward a shared goal of water security.

Author Contributions

Conceptualization, L.B., J.D.P. and T.D.J.; methodology, L.B., J.D.P., T.D.J.; software, T.D.J. and J.D.P.; validation, T.D.J., M.N. and J.B.; formal analysis, J.D.P. and T.D.J.; investigation, L.B., J.D.P., J.B. and M.N.; resources, G.S., L.A.B., L.B., M.N., J.D.P. and J.B.; data curation, J.D.P. and T.D.J.; writing—original draft preparation, J.D.P., T.D.J. and L.B.; writing—review and editing, all authors; visualization, J.D.P. and T.D.J.; supervision, L.B., T.D.J., G.S. and L.A.B.; project administration, L.B.; funding acquisition, L.B., L.A.B., G.S., T.D.J., M.N. and J.B. All authors have read and agreed to the published version of the manuscript.

Funding

This work was supported by the Lake Winnipeg Basin Program, Environment Climate Change Canada, under Grant LW-SK-2019n008, and the Global Water Futures program at the University of Saskatchewan.

Data Availability Statement

The data that support the findings of this study are available from the corresponding author, L.B., upon reasonable request and with permission of communities involved.

Acknowledgments

We thank the communities of James Smith Cree Nation (JSCN), Yellow Quill First Nation (YQFN), the Northern Village of Cumberland House (NVCH), Cumberland House Cree Nation (CHCN), and Métis Local #42 (ML42) for their support of this research project, the University of Saskatchewan, Environment Climate Change Canada, the MITACS Program (Canada). Special thanks to Helen Baulch, Katy Nugent, and Cameron Hoggarth for their assistance with nutrient analyses, and Tayyab Shah (Geospatial research manager at the Canadian Hub for Applied and Social Research (CHASR), University of Saskatchewan) for assistance with maps.

Conflicts of Interest

The authors reported no potential conflicts of interest.

References

  1. Suresh, K.; Tang, T.; Van Vliet, M.T.; Bierkens, M.F.; Strokal, M.; Sorger-Domenigg, F.; Wada, Y. Recent advancement in water quality indicators for eutrophication in global freshwater lakes. Environ. Res. Lett. 2023, 18, 063004. [Google Scholar] [CrossRef]
  2. du Plessis, A. Persistent degradation: Global water quality challenges and required actions. One Earth 2022, 5, 129–131. [Google Scholar] [CrossRef]
  3. Beusen, A.H.; Bouwman, A.F. Future projections of river nutrient export to the global coastal ocean show persisting nitrogen and phosphorus distortion. Front. Water 2022, 4, 893585. [Google Scholar] [CrossRef]
  4. Ginger, L.J.; Zimmer, K.D.; Herwig, B.R.; Hanson, M.A.; Hobbs, W.O.; Small, G.E.; Cotner, J.B. Watershed vs. within-lake drivers of nitrogen: Phosphorus dynamics in shallow lakes. Ecol. Appl. 2017, 27, 2155–2169. [Google Scholar] [CrossRef]
  5. Paerl, H.W.; Paul, V.J. Climate change: Links to global expansion of harmful cyanobacteria. Water Res. 2011, 46, 1349–1363. [Google Scholar] [CrossRef]
  6. Kling, H.J.; Watson, S.B.; McCullough, G.K.; Stainton, M.P. Bloom development and phytoplankton succession in Lake Winnipeg: A comparison of historical records with recent data. Aquat. Ecosyst. Health Manag. 2011, 14, 219–224. [Google Scholar] [CrossRef]
  7. McKindles, K.M.; Zimba, P.V.; Chiu, A.S.; Watson, S.B.; Gutierrez, D.B.; Westrick, J.; Davis, T.W. A multiplex analysis of potentially toxic cyanobacteria in Lake Winnipeg during the 2013 bloom season. Toxins 2019, 11, 587. [Google Scholar] [CrossRef]
  8. Akhtar, M.K.; Simonovic, S.P.; Wibe, J.; MacGee, J. Future realities of climate change impacts: An integrated assessment study of Canada. Int. J. Glob. Warm. 2019, 17, 59–88. Available online: https://globalchange-uwo.ca/manuals/J226_ANEMI2_CDN_IJGW_2018.pdf (accessed on 10 April 2025). [CrossRef]
  9. Gmitrowicz-Iwan, J.; Ligęza, S.; Pranagal, J.; Smal, H.; Olenderek, H. Small floodplain reservoirs in the face of climate change—Sink or source of nutrients? Water 2020, 12, 3423. [Google Scholar] [CrossRef]
  10. Lan, J.; Liu, P.; Hu, X.; Zhu, S. Harmful algal blooms in eutrophic marine environments: Causes, monitoring, and treatment. Water 2024, 16, 2525. [Google Scholar] [CrossRef]
  11. Sutton, M.A.; Howard, C.M.; Brownlie, W.J.; Kanter, D.R.; de Vries, W.; Adhya, T.K.; Ometto, J.P.; Baron, J.S.; Winiwarter, W.; Ju, X.; et al. Global challenges for nitrogen science-policy interactions: Towards the international nitrogen management system (INMS) and improved coordination between multi-lateral environmental agreements. In Just Enough Nitrogen: Perspectives on How to Get There for Regions with too Much and too Little Nitrogen; Springer: Berlin/Heidelberg, Germany, 2020; pp. 517–560. [Google Scholar]
  12. Shaw, D.A.; Pietroniro, A.L.; Martz, L.W. Topographic analysis for the prairie pothole region of Western Canada. Hydrol. Process. 2013, 27, 3105–3114. [Google Scholar] [CrossRef]
  13. Carmichael, W.W.; Boyer, G.L. Health impacts from cyanobacteria harmful algae blooms: Implications for the North American Great Lakes. Harmful Algae 2016, 54, 194–212. [Google Scholar] [CrossRef] [PubMed]
  14. Rashidi, H.; Baulch, H.; Gill, A.; Bharadwaj, L.; Bradford, L. Monitoring, managing, and communicating risk of harmful algal blooms (HABs) in recreational resources across Canada. Environ. Health Insights 2021, 15, 11786302211014401. [Google Scholar] [CrossRef]
  15. Brooks, B.W.; Lazorchak, J.M.; Howard, M.D.; Johnson, M.V.; Morton, S.L.; Perkins, D.A.; Reavie, E.D.; Scott, G.I.; Smith, S.A.; Steevens, J.A. Are harmful algal blooms becoming the greatest inland water quality threat to public health and aquatic ecosystems? Environ. Toxicol. Chem. 2016, 35, 6–13. [Google Scholar] [CrossRef]
  16. Collins, L.; McGregor, D.; Allen, S.; Murray, C.; Metcalfe, C. Source water protection planning for Ontario First Nations communities: Case studies identifying challenges and outcomes. Water 2017, 9, 550. [Google Scholar] [CrossRef]
  17. Galway, L.P. Boiling over: A descriptive analysis of drinking water advisories in First Nations communities in Ontario, Canada. Int. J. Environ. Res. Public Health 2016, 13, 505. [Google Scholar] [CrossRef]
  18. Patrick, R.J.; Grant, K.; Bharadwaj, L. Reclaiming indigenous planning as a pathway to local water security. Water 2019, 11, 936. [Google Scholar] [CrossRef]
  19. Lam, S.; Cunsolo, A.; Sawatzky, A.; Ford, J.; Harper, S.L. How does the media portray drinking water security in Indigenous communities in Canada? An analysis of Canadian newspaper coverage from 2000–2015. BMC Public Health 2017, 17, 282. [Google Scholar] [CrossRef]
  20. McLeod, L.; Bharadwaj, L.A.; Daigle, J.; Waldner, C.; Bradford, L.E. A quantitative analysis of drinking water advisories in Saskatchewan Indigenous and rural communities 2012–2016. Can. Water Resour. J. 2020, 45, 345–357. [Google Scholar] [CrossRef]
  21. De Loë, R.; Plummer, R. Climate Change, Adaptive Capacity, and Governance for Drinking Water in Canada. In Adaptive Capacity and Environmental Governance; Springer: Berlin/Heidelberg, Germany, 2010; pp. 157–178. [Google Scholar] [CrossRef]
  22. Kalcic, M.M.; Kirchhoff, C.; Bosch, N.; Muenich, R.L.; Murray, M.; Griffith Gardner, J.; Scavia, D. Engaging stakeholders to define feasible and desirable agricultural conservation in western Lake Erie watersheds. Environ. Sci. Technol. 2016, 50, 8135–8145. [Google Scholar] [CrossRef]
  23. de Figueiredo, D.R. Harmful Cyanobacterial Blooms: Going beyond the “Green” to Monitor and Predict HCBs. Hydrobiology 2024, 3, 11–30. [Google Scholar] [CrossRef]
  24. Leonard, K.; David-Chavez, D.; Smiles, D.; Jennings, L.; ‘Anolani Alegado, R.; Tsinnajinnie, L.; Manitowabi, J.; Arsenault, R.; Begay, R.L.; Kagawa-Viviani, A.; et al. Water Back: A review centering rematriation and Indigenous water research sovereignty. Water Altern. 2023, 16, 374–428. [Google Scholar]
  25. O’Donnell, E.; Kennedy, M.; Garrick, D.; Horne, A.; Woods, R. Cultural water and Indigenous water science. Science 2023, 381, 619–621. [Google Scholar] [CrossRef]
  26. Haque, M.I.; Rahman, M.T.; Nuruzzaman, M.; Prentice, C. Real-time water quality monitoring using IoT-based sensors: Current status and future prospects. Water 2022, 16, 1734. [Google Scholar] [CrossRef]
  27. MacDonald, R.J.; Jones, K.E.; Bradford, L. Indigenous water governance and community-based monitoring: Advancing self-determination in water security. Water 2023, 16, 934. [Google Scholar] [CrossRef]
  28. Capdevila, A.S.L.; Kokimova, A.; Ray, S.S.; Avellán, T.; Kim, J.; Kirschke, S. Success factors for citizen science projects in water quality monitoring. Sci. Total Environ. 2020, 728, 137843. [Google Scholar] [CrossRef]
  29. Conrad, C.C.; Hilchey, K.G. A review of citizen science and community-based environmental monitoring: Issues and opportunities. Environ. Monit. Assess. 2011, 176, 273–291. [Google Scholar] [CrossRef]
  30. Baijius, W.; Patrick, R.J. Planning around reserves: Probing the inclusion of First Nations in Saskatchewan’s watershed planning framework. Int. Indig. Policy J. 2019, 10, 5. [Google Scholar] [CrossRef]
  31. Pick, F.R. Blooming algae: A Canadian perspective on the rise of toxic cyanobacteria. Can. J. Fish. Aquat. Sci. 2016, 73, 1149–1158. [Google Scholar] [CrossRef]
  32. Kim, S.; Robson, C.; Zimmerman, T.; Pierce, J.; Haber, E.M. Creek watch: Pairing usefulness and usability for successful citizen science. In Proceedings of the SIGCHI Conference on Human Factors in Computing Systems, Vancouver, BC, Canada, 7–12 May 2011; pp. 2125–2134. [Google Scholar] [CrossRef]
  33. Aceves-Bueno, E.; Adeleye, A.S.; Bradley, D.; Tyler Brandt, W.; Callery, P.; Feraud, M.; Garner, K.L.; Gentry, R.; Huang, Y.; McCullough, I.; et al. Citizen science as an approach for overcoming insufficient monitoring and inadequate stakeholder buy-in in adaptive management: Criteria and evidence. Ecosystems 2015, 18, 493–506. [Google Scholar] [CrossRef]
  34. Herman-Mercer, N.; Antweiler, R.; Wilson, N.; Mutter, E.; Toohey, R.; Schuster, P. Data Quality from a Community-Based, Water-Quality Monitoring Project in the Yukon River Basin. Citiz. Sci. Theory Pract. 2018, 3, 1. Available online: https://link.gale.com/apps/doc/A563813374/EAIM?u=usaskmain&sid=bookmark-EAIM&xid=c98b0fe2 (accessed on 10 April 2025). [CrossRef]
  35. Wilson, N.; Mutter, E.; Inkster, J.; Satterfield, T. Community-Based Monitoring as the practice of Indigenous governance: A case study of Indigenous-led water quality monitoring in the Yukon River Basin. J. Environ. Manag. 2018, 210, 290–298. [Google Scholar] [CrossRef] [PubMed]
  36. Costa, D.; Aziz, U.; Elliot, J.; Baulch, H.; Roy, B.; Schneider, K.; Pomeroy, J. The Nutrient App: Developing a smartphone application for on-site instantaneous community-based and monitoring. Environ. Model. Softw. Environ. Data News 2020, 133, 104829. [Google Scholar] [CrossRef]
  37. Newman, P.A.; Guta, A.; Black, T. Ethical considerations for qualitative research methods during the COVID-19 pandemic and other emergency situations: Navigating the virtual field. Int. J. Qual. Methods 2021, 20, 16094069211047823. [Google Scholar] [CrossRef]
  38. Waldner, C.L.; Alimezelli, H.T.; McLeod, L.; Zagozewski, R.; Bradford, L.E.; Bharadwaj, L.A. Self-reported effects of water on health in First Nations communities in Saskatchewan, Canada: Results from community-based participatory research. Environ. Health Insights 2017, 11, 1–13. [Google Scholar] [CrossRef]
  39. Wilderman, C.C.; McEver, C.; Bonney, R.; Dickinson, J.; Kelling, S.; Rosenberg, K. Models of community science: Design lessons from the field. In Proceedings of the Citizen Science Toolkit Conference, Cornell Laboratory of Ornithology, Ithaca, NY, USA, 20–23 June 2007; McEver, C., Bonney, R., Dickinson, J., Kelling, S., Rosenberg, K., Shirk, J.L., Eds.; National Science Foundation: Alexandria, VA, USA, 2007; Volume 1, pp. 83–96. Available online: https://www.researchgate.net/publication/283490639_Models_of_Community_Science_Design_Lessons_from_the_Field (accessed on 10 April 2025).
  40. Smith, V.H.; Tilman, G.D.; Nekola, J.C. Eutrophication: Impacts of excess nutrient inputs on freshwater, marine, and terrestrial ecosystems. Environ. Pollut. 1999, 100, 179–196. [Google Scholar] [CrossRef]
  41. Allan, R.J.; Williams, J.D.H.; Joshi, S.R.; Warwick, W.F. Historical changes and relationship to internal loading of sediment phosphorus forms in hypertrophic prairie lakes. J. Environ. Qual. 1980, 9, 199–206. [Google Scholar] [CrossRef]
  42. Orihel, D.M.; Baulch, H.M.; Casson, N.J.; North, R.L.; Parsons, C.T.; Seckar, D.C.; Venkiteswaran, J.J. Internal phosphorus loading in Canadian fresh waters: A critical review and data analysis. Can. J. Fish. Aquat. Sci. 2017, 74, 2005–2029. [Google Scholar] [CrossRef]
  43. Hosseini, N.; Akomeah, E.; Davis, J.; Baulch, H.; Lindenschmidt, K. Water quality modelling of a prairie river-lake system. Environ. Sci. Pollut. Res. 2018, 25, 31190–31204. [Google Scholar] [CrossRef]
  44. Akomeah, E.; Chun, K.P.; Lindenschmidt, K. Dynamic water quality modelling and uncertainty analysis of phytoplankton and nutrient cycles for the upper South Saskatchewan River. Environ. Sci. Pollut. Res. 2015, 22, 18239–18251. [Google Scholar] [CrossRef]
  45. Haertel, L. Nutrient limitation of algal standing crops in shallow prairie lakes. Ecology 1976, 57, 664–678. [Google Scholar] [CrossRef]
  46. Haertel, L. A Long-Term Database for Plankton Populations and Nutrient Levels in Prairie Lakes; South Dakota Academy of Science: Madison, SD, USA, 2003; Volume 82, p. 169. [Google Scholar]
  47. Harris, T.D.; Smith, V.H.; Graham, J.L.; Van de Waal, D.B.; Tedesco, L.P.; Clercin, N. Combined effects of nitrogen to phosphorus and nitrate to ammonia ratios on cyanobacterial metabolite concentrations in eutrophic Midwestern USA reservoirs. Inland Waters 2016, 6, 199–210. [Google Scholar] [CrossRef]
  48. Crumpton, W.G.; Goldsborough, L.G. Nitrogen transformation and fate in prairie wetlands. Great Plains Res. 1998, 8, 57–72. [Google Scholar]
  49. Hergott, A.E. Prairie Potholes as Transformers on the Landscape: Exploring the Rates of Planktonic Nitrogen Uptake, DNRA, and Denitrification. Master’s Thesis, University of Saskatchewan, Saskatoon, SK, Canada, 2022. [Google Scholar]
  50. Kleinman, P.J.; Srinivasan, M.S.; Dell, C.J.; Schmidt, J.P.; Sharpley, A.N.; Bryant, R.B. Role of rainfall intensity and hydrology in nutrient transport via surface runoff. J. Environ. Qual. 2006, 35, 1248–1259. [Google Scholar] [CrossRef]
  51. Liu, R.; Wang, J.; Shi, J.; Chen, Y.; Sun, C.; Zhang, P.; Shen, Z. Runoff characteristics and nutrient loss mechanism from plain farmland under simulated rainfall conditions. Sci. Total Environ. 2014, 468, 1069–1077. [Google Scholar] [CrossRef]
  52. Timmons, D.R.; Holt, R.F. Nutrient losses in surface runoff from a native prairie. J. Environ. Qual. 1977, 6, 369–373. [Google Scholar] [CrossRef]
  53. Bosch, N.S.; Evans, M.A.; Scavia, D.; Allan, J.D. Interacting effects of climate change and agricultural BMPs on nutrient runoff entering Lake Erie. J. Great Lakes Res. 2014, 40, 581–589. [Google Scholar] [CrossRef]
  54. Nanayakkara, L.; Wissel, B. Preliminary investigation of lake-use patterns in prairie lakes, stakeholder perceptions, and resulting management implications. Lake Reserv. Manag. 2017, 33, 49–61. [Google Scholar] [CrossRef]
  55. Datta, R.; Chapola, J.; Lewis, K. Rethinking Indigenous Community-Led Water Sustainability: Decolonial and Relational Approaches in Western Canada. Water 2025, 17, 334. [Google Scholar] [CrossRef]
Figure 1. Map of the Study Area. Treaty 4 encompasses the lakes and wetlands of the Yellow Quill First Nation. Treaty 6 includes the Saskatchewan River and other creeks passing through the James Smith Cree Nation. Treaty 5 (unlabelled in the main map; labelled in inset) includes the eastern end of the Saskatchewan River downstream from the James Smith Cree Nation and extends into Saskatchewan from Manitoba.
Water 17 01386 g001
Figure 2. Community science devices and testing reagents. The community science devices used in this project were a YSI 9500 Photometer (a) and a Nutrient (Smartphone) App (b). API Phosphate test kits and AquaChek Nitrate tests (c) were used to test nutrient concentrations with the Nutrient App, as instructed by the app developers.
Water 17 01386 g002
Figure 3. Concentrations of nutrients measured in a laboratory vs. concentrations measured using low-cost community science instruments (YSI 9500 Photometer and Nutrient App). Trendlines show slopes and 95% confidence intervals. Best-fit (solid blue) lines show slopes and 95% confidence intervals (shaded areas). Solid circles are individual paired measurements.
Water 17 01386 g003
Figure 4. Nutrient z-scores for ammonia (solid circles, secondary axis) and phosphate (open circles, secondary axis) during 2019 relative to precipitation (solid line, primary axis) within and outside the Yellow Quill First Nation Reserve (North of Kelvington, SK). Concentrations were measured using a YSI 9500 Photometer and corrected using best-fit equations relative to a SmartChem Analyser.
Water 17 01386 g004
Figure 5. Nutrient z-scores for ammonia (solid circles, secondary axis) and phosphate (open circles, secondary axis) during 2021 relative to precipitation (solid line, primary axis) outside the Yellow Quill First Nation Reserve (North of Kelvington, SK) and James Smith Cree Nation (West of Melfort, SK). Concentrations were measured using a YSI 9500 Photometer and corrected using best-fit equations relative to a SmartChem Analyser.
Water 17 01386 g005
Table 1. Meta Data of the Project. Photometer tests include nitrate, phosphate, and ammonia test. Nutrient App tests included nitrate and phosphate tests. * These numbers indicate that there are some missing measurements due to missing water samples or missing reagents. A complete dataset for this project can be requested from one of the authors.
Year 2019 2021
Study Period29 April–20 September 29 April–20 September
Days with Precipitation30 days31 days
Total Precipitation249 mm194 mm
Average Temperature7.9 °C–20.9 °C8.9 °C–20.0 °C
Days over 30 °C2 days20 days
Total Samples Taken at YQFN (sites)* 180 samples (9 sites)* 80 samples (5 sites)
Total Samples Taken at JSCN (sites)None* 64 samples (4 sites)
Total Photometer Tests (nitrate, ammonia, phosphate) * 459 tests (153 nitrate, 153 ammonia, 153 phosphate)* 285 tests (95 nitrate, 95 ammonia, 95 phosphate)
Total Nutrient App Tests (nitrate, phosphate)* 360 tests (180 nitrate, 180 phosphate)* 183 tests (135 nitrate, 48 phosphate)
Total Laboratory (SmartChem) Tests (nitrate, ammonia, phosphate)No lab tests were conducted* 102 tests (34 nitrate, 34 ammonia, 34 phosphate)
Table 2. Mean nutrient concentrations (±S.D.) measured during 2019 and 2021 using the YSI 9500 Photometer and corrected to estimated laboratory values using equations in Figure 3. Nitrates were not included since they were unreliable based on the previous accuracy testing data. The complete dataset can be requested from the authors.
Sample Site Location Year Ammonia ( N H 3 , mg/L)
(Measured by Photometer)
Ammonia ( N H 3 , m g / L )
(Estimated Mean Value)
Phosphate ( P O 4 , m g / L )
(Measured by Photometer)
Phosphate (PO4, mg/L) (Estimated Mean Value)
Southeast End of Little Nut LakeYQFN20190.48 ± 0.36 (17)0.402.23 ± 0.87 (17)0.82
Pond by 756YQFN20190.56 ± 0.25 (17)0.501.99 ± 0.76 (17)0.73
Nut Lake South End YQFN20190.71 ± 0.24 (17)0.662.29 ± 1.46 (17)0.85
Middle of Nut LakeYQFN20190.91 ± 0.10 (16)0.883.90 ± 0.26 (16)1.49
Nut Lake DamYQFN20190.56 ± 0.26 (17)0.500.96 ± 0.41 (17)0.31
Nut Lake OutletYQFN20190.48 ± 0.15 (17)0.410.58 ± 0.18 (17)0.16
Nut Lake West End InletYQFN20190.65 ± 0.15 (17)0.591.46 ± 0.42 (17)0.51
Nut Lake (average of five sites)YQFN20190.65 ± 0.24 (84)0.601.81 ± 1.40 (84)0.42
Wetland on 756YQFN20190.77 ± 0.24 (17)0.743.45 ± 0.57 (17)1.31
Wetland on 35YQFN20190.72 ± 0.14 (17)0.681.28 ± 0.73 (17)0.44
Carps Lake OutletYQFN20210.24 ± 0.25 (10)0.140.08 ± 0.09 (10)<0.13
Nut Lake OutletYQFN20210.54 ± 0.28 (11)0.480.36 ± 0.36(11)<0.13
Little Nut Lake InletYQFN20210.23 ± 0.17 (9)0.120.59 ± 0.27(9)0.17
Little Nut Lake OutletYQFN20210.55 ± 0.44 (10)0.490.06 ± 0.15 (10)<0.13
Duck CreekJSCN20210.30 ± 0.22 (11)0.190.36 ± 0.27 (11)<0.13
North Saskatchewan RiverJSCN20210.17 ± 0.11 (11)0.060.14 ± 0.15 (11)<0.13
PehanonJSCN20210.51 ± 0.31 (11)0.401.83 ± 0.88 (11)0.66
Carrot RiverJSCN20210.28± 0.24 (11)0.281.04± 0.51 (11)0.35
Goose Hunting CreekJSCN20210.20± 0.12 (11)0.110.36± 0.23 (11)<0.13
Disclaimer/Publisher’s Note: The statements, opinions and data contained in all publications are solely those of the individual author(s) and contributor(s) and not of MDPI and/or the editor(s). MDPI and/or the editor(s) disclaim responsibility for any injury to people or property resulting from any ideas, methods, instructions or products referred to in the content.

