Article

Comparative Analysis of Nonlinear Models from Different Domains: A Case Study on the Quality of Groundwater in an Alluvial Aquifer in Northwestern Croatia

1
Faculty of Geotechnical Engineering, University of Zagreb, Hallerova aleja 7, 42000 Varaždin, Croatia
2
Institute of Public Health of Koprivnica-Križevci County, Trg Tomislava dr. Bardeka 10/10, 48000 Koprivnica, Croatia
*
Authors to whom correspondence should be addressed.
Water 2025, 17(9), 1378; https://doi.org/10.3390/w17091378
Submission received: 20 March 2025 / Revised: 29 April 2025 / Accepted: 30 April 2025 / Published: 2 May 2025

Abstract

:
In groundwater quality analysis, nonlinear models are typically used, with domains spanning the entire real number line. In this study, alongside these models (Logistic, Gompertz and Richards), nonlinear models defined based on functions whose domain is only the positive part of the real number line are presented (Michaelis–Menten, Hill 1 and 2 and Rosin–Rammler 1 and 2). Two case studies were observed in the paper: (i) the dependence of nitrate concentration on the pumping rate in the Bartolovec wellfield, and (ii) the dependence of nitrate concentration on the distance from the source of pollution in the Varaždin wellfield. Both wellfields are located in the alluvial aquifer in northwestern Croatia. In this way, the curves obtained on the basis of the mentioned mathematical functions were fitted to the experimental data. The results show a good fit, so that the values of the coefficients of determination R2 are greater than 0.82 for the case study (i) and greater than 0.96 for the case study (ii). Since the models differ in the number of parameters (e.g., three parameters for Michaelis–Menten and five parameters for Rosin–Rammler), the corrected Akaike information criterion (AICc) was used for their comparison. In this way, the best fit for the case study (i) was obtained for the Rosin–Rammler 1 model, while for the case study (ii), it was for the Hill 1 model. A t-test was performed for all models, and they can be considered reliable at a significance level of 0.05. However, t-values and p-values were also calculated for each parameter of each model. Based on these results, it is concluded that all model parameters can be considered reliable at a significance level of 0.05 only for the Hill 1 and Rosin–Rammler 1 models in both case studies. For this reason, these models can generally be considered the best fit to the experimental data. The study demonstrates the superiority of nonlinear models with domains restricted to positive real numbers (e.g., Hill 1, Rosin–Rammler 1) over traditional models (e.g., Logistic, Richards) in groundwater quality analysis. These findings offer practical tools for predicting contaminant extremes (e.g., maximum/minimum concentrations) and optimizing groundwater management strategies.

1. Introduction

Continuous economic development puts pressure on all components of the environment, and despite many protective measures, its increasing pollution by anthropogenic activities is still occurring [1,2,3]. The results of numerous scientific and professional studies show that anthropogenic activity affects the quality of air [4,5], rivers [6,7], lakes [8], oceans [9], soils [10], but also groundwater [11,12]. Groundwater is one of the most important sources of water for human needs [13], and in this respect, it is extremely important to maintain or even improve its quality. The groundwater is affected by various sources of pollution, which can arise from urban areas [14], industry [15], agriculture [16,17], traffic [18], etc. Numerous studies show that the use of fertilizers in agricultural production contributes significantly to the increase in nitrate concentrations in groundwater [19,20,21]. The consumption of water with high nitrate concentrations can affect human health by causing the disease methemoglobinemia [22,23].
Apart from the qualitative sense, the demand for water today is also growing in the quantitative sense, due to the increase in human population at a global level [24] and the increase in economic activities that require ever larger quantities of water [25,26]. This leads to an increase in the pumping rate of existing wellfields or the construction of new wellfields, which puts further pressure on available water resources. The results of scientific studies show that changes in pumping rates alter surface and groundwater quality [27,28]. It was shown that the growing demand for water due to urban and industrial development and the increase in irrigated agricultural land is leading to overuse of groundwater [29]. As a result, groundwater levels are declining and cones of depression are forming, leading to a degradation in groundwater quality due to untreated discharges of urban and industrial wastewater or seawater intrusion [30,31,32]. Therefore, various studies have been conducted on the effects of pumping on temporal changes in groundwater quality, and the results showed a significant deterioration in groundwater quality [33,34]. In some cases of overexploitation, it has been shown that the use of groundwater for irrigation becomes impossible because of the quality reduction or economic unprofitability [35]. The method for determining the maximum contaminant load near pumping wells was investigated using the backward equation derived from the general advection–dispersion equation to determine the maximum load limit [36]. Therefore, additional monitoring systems [37,38,39] and methods for estimating and predicting the quantity and quality of surface and groundwater resources [40,41] need to be developed.
Several approaches were used in the previous research. One of these is the use of nonlinear growth functions to determine the maximum or minimum contamination levels [42,43]. This is because many natural growth phenomena show a sigmoidal pattern in which the growth rate is initially low, then increases and reaches its maximum value at the inflection point. After this point, the rate decreases and asymptotically approaches zero growth rate. Some applications of classical growth models include growth modeling in birds and mammals [44,45,46], forestry modeling [47] and human growth modeling [48,49]. Sigmoidal models were also used to determine the maximum value of nitrate [50] and ammonia concentrations [51] in groundwater. Growth functions have also been successfully used to assess the impact of point and surface sources of nitrate pollution in groundwater [52], as well as to determine the dependence of the nitrate concentration on the pumping rate [53] and the dependence of nitrate concentration on the distance to the pollution source [54]. The aforementioned works present models defined on the basis of functions whose domain is the entire number line, which is mathematically correct but has some restrictions in practice. Indeed, the pumping rate cannot be negative (unless water is pumped into the system), nor can the distance from the pollution source. Given the observed limitations of previously utilized growth functions, this study employs sigmoidal functions, which are inherently restricted to the positive domain of the number line. For this purpose, the functions Michaelis–Menten, Hill 1 and 2 and Rosin–Rammler 1 and 2 were used. The study area includes two wellfields in northern Croatia, Varaždin and Bartolovec. The wellfields are suitable for this type of research as previous studies have shown changes in nitrate concentrations in space and time. At the Varaždin wellfield, a dependence of nitrate concentration with increasing distance from a point source of pollution was found [52], while at the Bartolovec wellfield, a dependence of nitrate concentration on the pumping rate was established [53]. Accordingly, the scientific contribution of this work lies in demonstrating that the proposed models that are mathematically constrained to the positive domain due to logical and practical considerations exhibit superior agreement with the experimental data over traditional models with the entire domain of the number line. The results presented are of practical meaning. Namely, numerical methods are now widely used in water resources management, and the development of a reliable model requires good estimates of various parameters. Some of the parameters in the groundwater flow and pollution transport models are the maximum and minimum values of pollutant concentration (e.g., maximum nitrate concentration at the point source of pollution). Using the methods presented, these values can be successfully estimated.

2. Materials and Methods
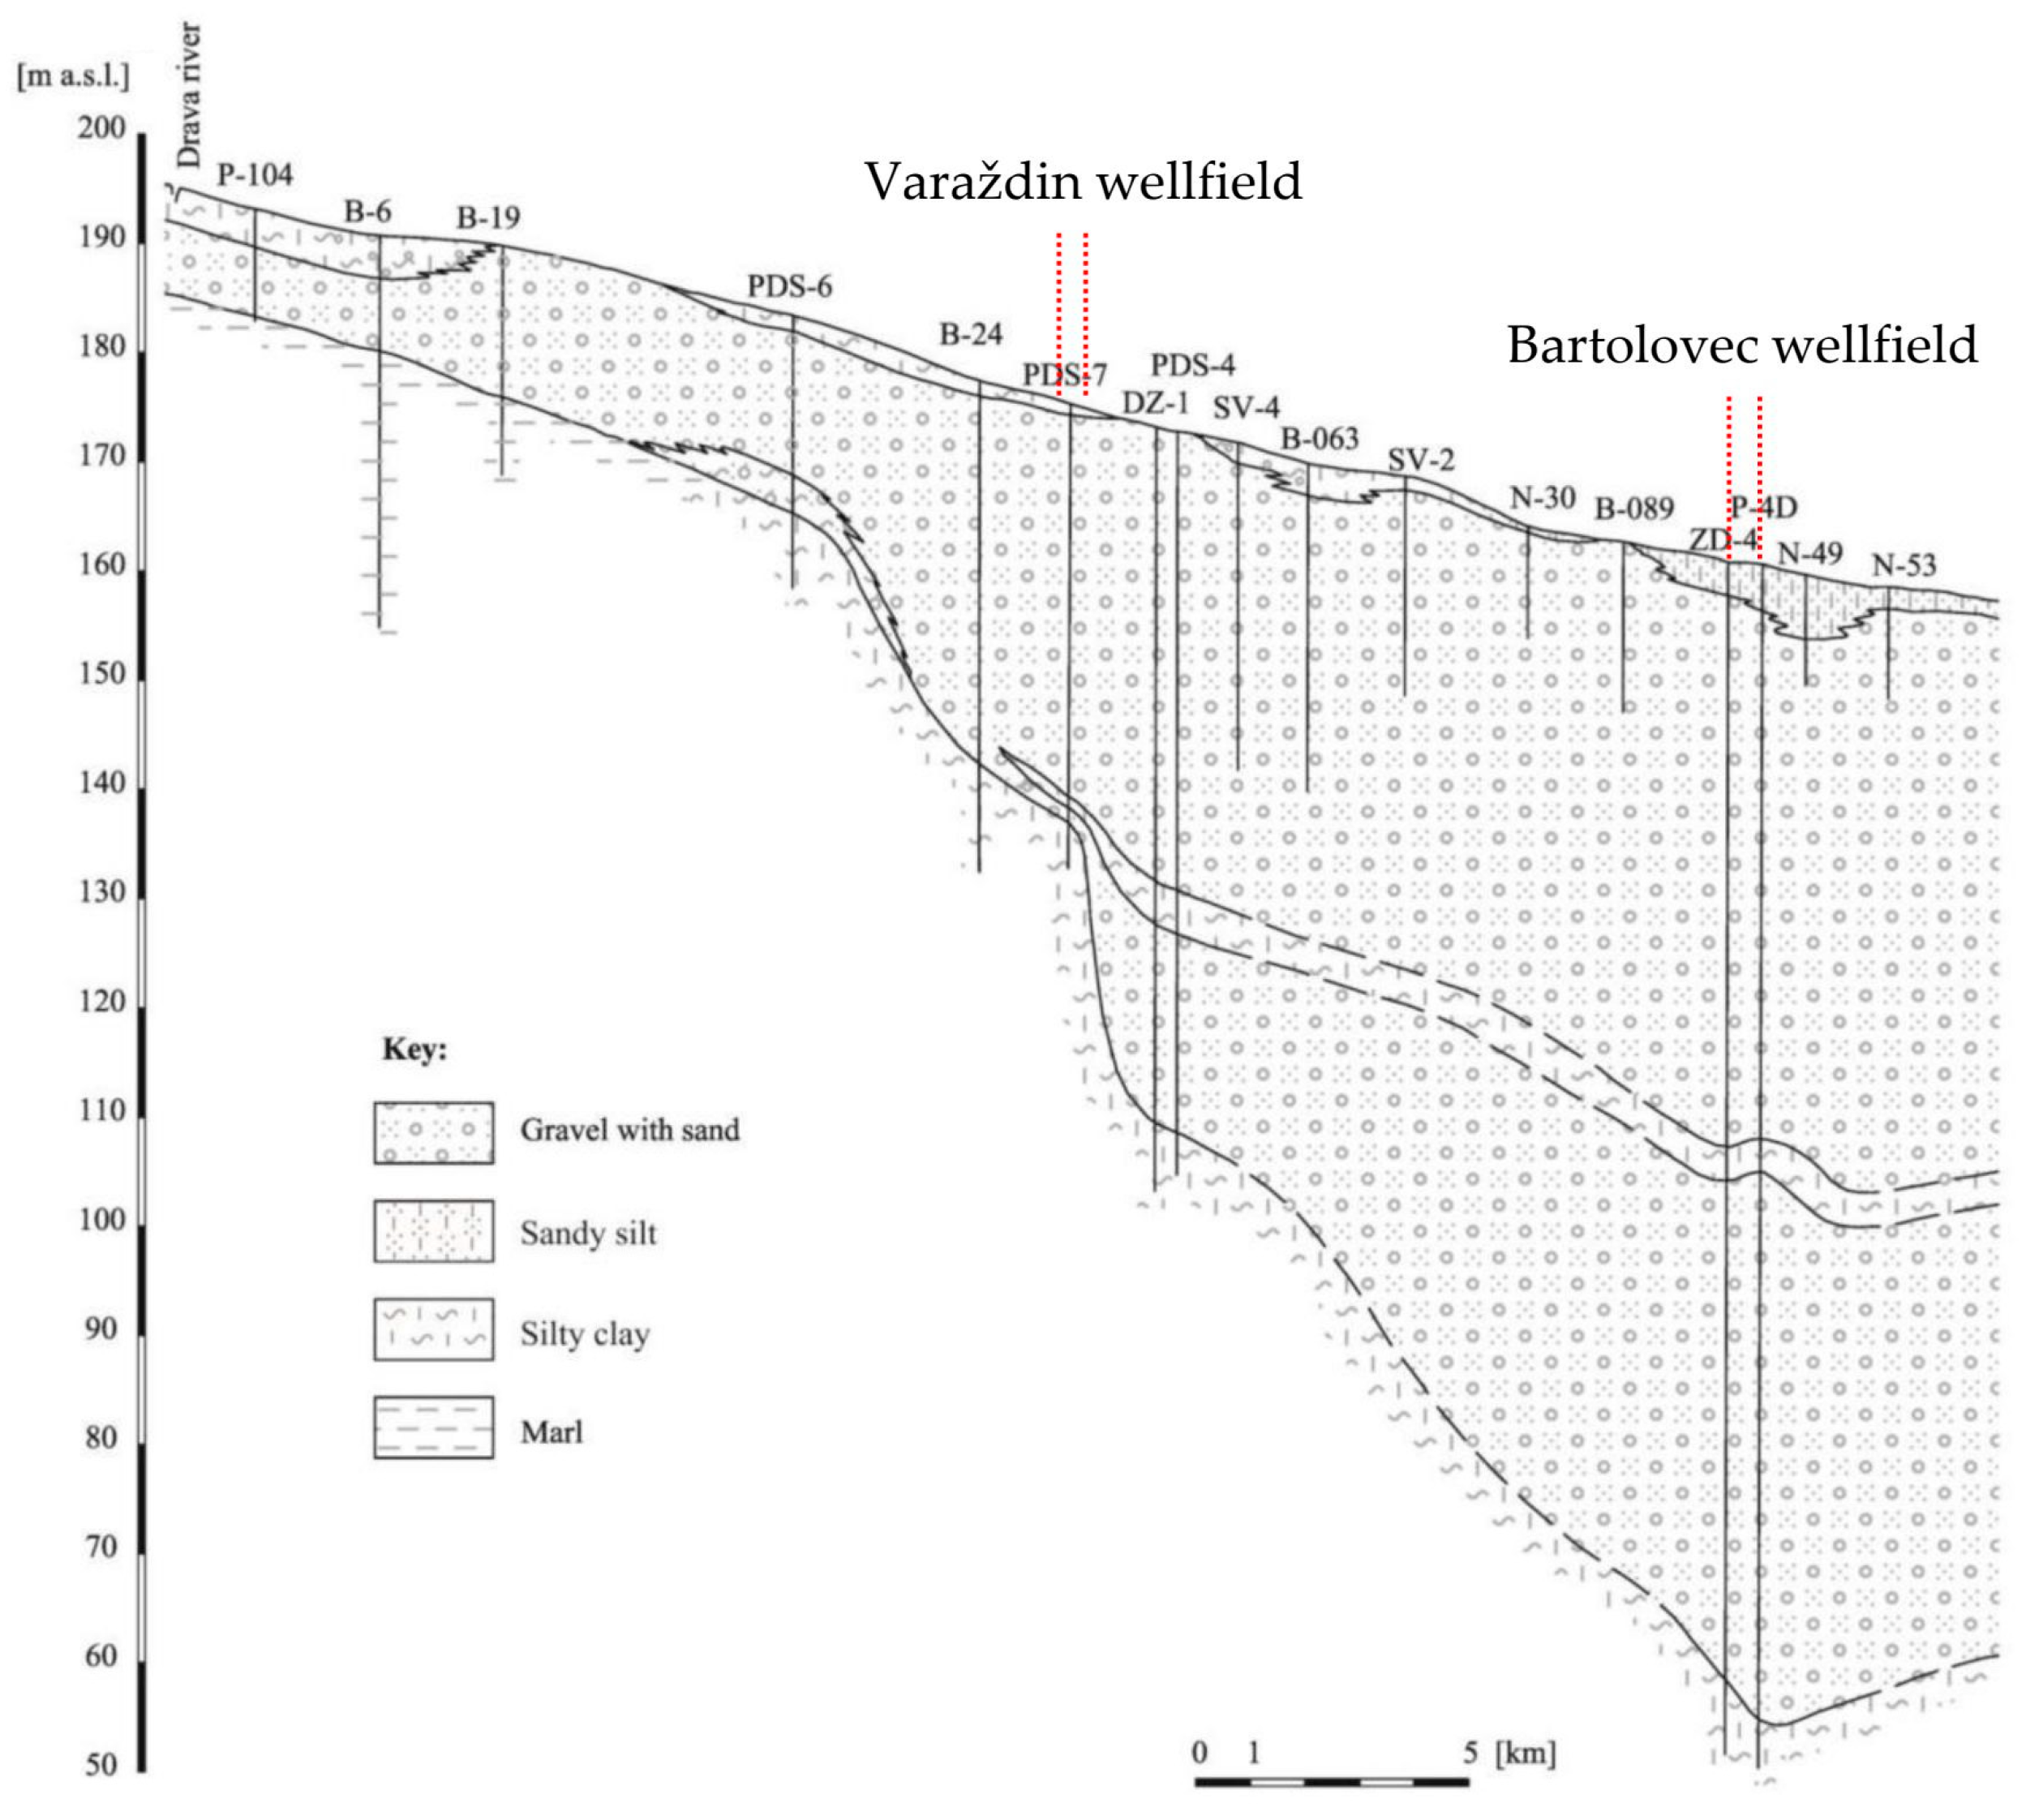
2.1. The Study Area

The study area is located in the north of the Republic of Croatia and includes the area of the Varaždin and Bartolovec wellfields, which are located near the town of Varaždin (Figure 1). The Varaždin region is one of the most densely populated and economically developed areas in Croatia. The quality of the groundwater in the wellfields is generally consistent and within the prescribed limits, except in terms of nitrate concentration. Namely, the average values at the Varaždin wellfield are above the maximum allowable concentration (MAC) according to the national limits of 50 mg/L NO3, while at the Bartolovec wellfield is below MAC. As previous studies have shown, the reason for the high nitrate concentration in the Varaždin wellfield is agricultural land and point sources of pollution located in the immediate vicinity of the wellfield (Figure 1) [55]. Due to high level of nitrates, the Varaždin wellfield was put out of operation in 2004. In order to meet the quantitative demand for drinking water and at the same to time reduce the nitrate concentration in the regional water supply system, the pumping rates were reduced at the Varaždin wellfield, and increased at other wellfields in the area [56].
The groundwater in both wellfields was pumped from the same alluvial aquifer system. The aquifer consists of two permeable layers of gravel and sand, most of which are separated by a semi-permeable silty and clayey aquitard [57]. The aquifer is unconfined, it is parallel with the Drava River and its thickness increases from the west to the east. At the far west end, the thickness is 5 m, while in the area of the Varaždin wellfield, it is about 75 m and in the Bartolovec wellfield area, it is 100 m. In the eastern part, the thickness of the aquifer increases to its maximum value of 148 m, and then it decreases gradually. The aquifer is composed of two permeable gravel and sand layers, divided mostly by a semipermeable silty and clay aquitard. The upper layer of the aquifer is composed of coarse-grained gravel and sand, while the lower part is composed mostly of finer-grained gravel with sand (Figure 2). The groundwater flow is in the west–east direction. The nitrate concentrations in the upper aquifer are significantly higher than in the lower aquifer, due to the mentioned anthropogenic influences [58]. The results in this article refer to water from the upper aquifer layer.

2.2. Experimental Data

Groundwater samples were collected in 0.5 L DURAN laboratory glass bottles using the method for sampling drinking water from treatment plants and piped distribution systems according to Croatian Standard Guidance on sampling of drinking water from treatment works and piped distribution systems. The spectrophotometric determination of nitrate according to the Standard Methods for the Examination of Water and Wastewater 4500-NO3B (2012) was performed using the UV spectrophotometer from CAMSPEC Ltd., Cambridge, UK, model M-501, with a nitrate detection limit of 10 μg/L.
At the Bartolovec wellfield, the groundwater quality was monitored at four wells in the period from 2002 to 2017. The periodicity of the sampling was at least once a week for the active wells and at least once a month for the piezometers according to the valid regulations. The activity of wells during the observed period changed, which means that a different combination of wells was active in a particular period. Based on the total number of data, annual averages of nitrate concentrations were calculated for the entire field (c), as described in Kovač et al. [53]. In addition, the pumping rate (Q) was determined for each year. Thus, 17 pairs of data (Q, c(Q)) were collected in this way (Table 1). Considering the seasonal changes in physical parameters and water consumption, the annual average proved to be the best measure of time, as it covers the entire natural consumption cycle, which is repeated annually and is mainly caused by agricultural and other anthropogenic activities characteristic of the region.
The groundwater quality at the Varaždin wellfield was monitored by regular sampling at eight wells and five piezometers in the period from 1994 to 2003, since the wellfield was no longer in operation. The periodicity of the sampling was at least once a week for the active wells and at least once a month for the piezometers. During this period, the average nitrate concentrations were calculated at each well/piezometer (c). Previous analyses have determined the impact of an illegal landfill of waste material from poultry farms on the nitrate concentration at that wellfield; therefore, the distance from the landfill (h) was measured for each sampling location, as shown in Šrajbek et al. [52]. Thirteen pairs of data (h, c(h)) were collected in this way (Table 1).

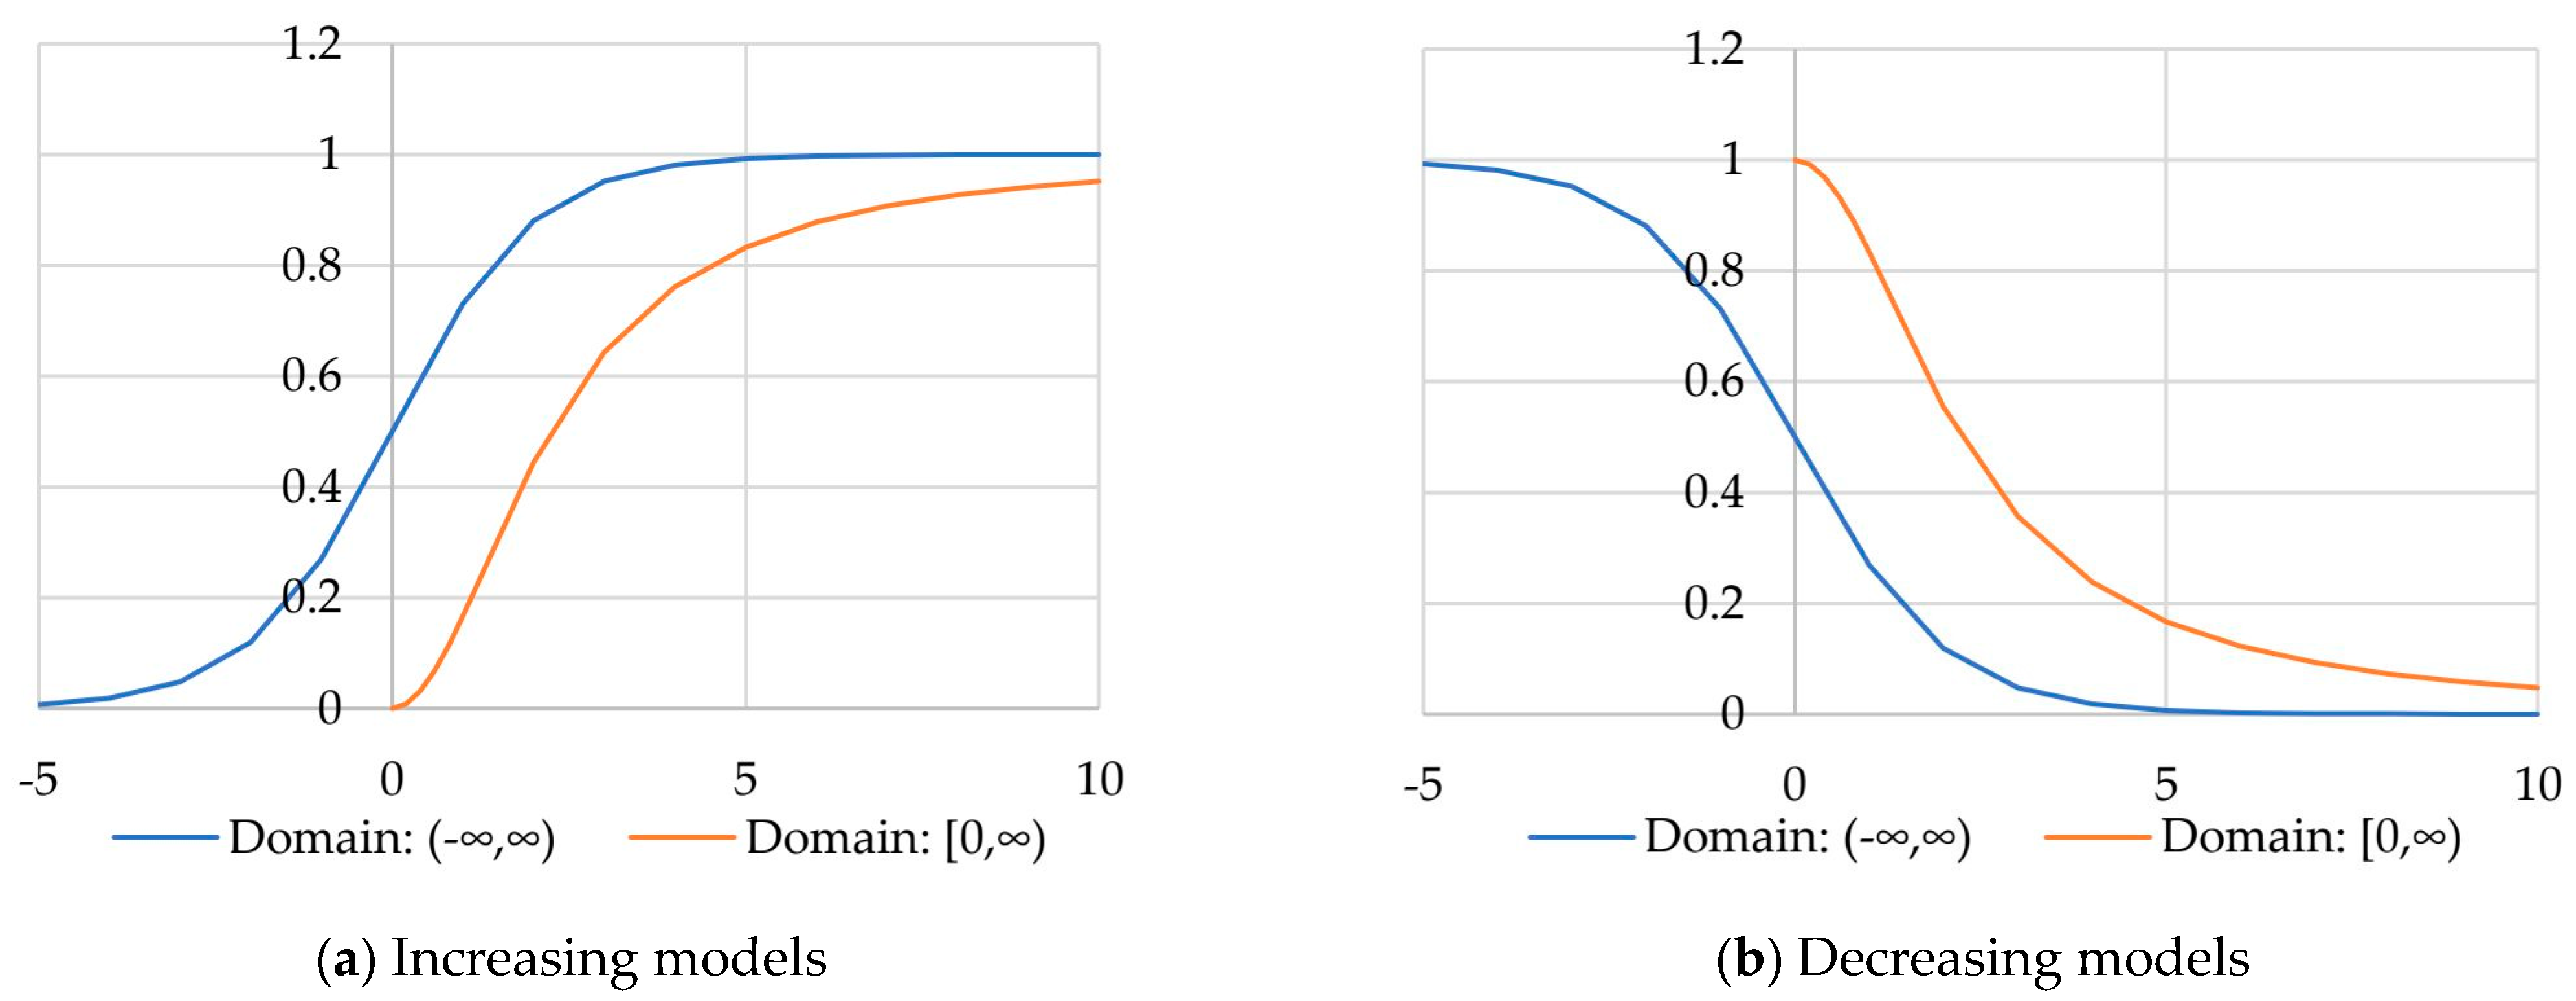
2.3. Nonlinear Models

When analyzing groundwater quality, sigmoidal models are often used, which are defined on the basis of Logistic, Gompertz or Richards functions. These are sigmoidal functions that describe growth as slowest at the beginning and end of a given period. These functions are used in a number of areas, e.g., biology, chemistry, demography, economics, geoscience, probability, statistics and others. The domain of these functions is the entire number line, and they were used to define time series that mathematically describe changes in groundwater quality over time [50,52,53]. As mentioned in the introduction, the shortcoming of this functions is that their domain is the whole number line (−∞, +∞). Since the pumping rate cannot be negative (except when pumping water into the system which is not the subject of this research), nor can the distance from the source of pollution, and the mathematical descriptions of the influence of nitrate concentration on these factors in this paper are defined on the basis of the following functions: Michaelis–Menten, Hill 1 and 2 and Rosin–Rammler 1 and 2. The domain of these functions is only the positive part of the number line [0, +∞). The functions are also used in many fields, such as biochemistry, pharmacology or even particle size distribution analysis [60,61,62]. The models are modified depending on whether they are monotonically increasing or decreasing. Thus, monotonically increasing models were used for the dependence of the nitrate concentration on the pumping rate (Figure 3a), while monotonically decreasing models were used for the dependence of the nitrate concentration on the distance from the pollution source (Figure 3b). The figure shows the theoretical models, and as can be seen, their fit to the experimental data is different due to the different domain. So, domain-restricted models (Michaelis–Menten, Hill and Rosin–Rammler) were selected to address physical realities: pumping rates and distances cannot be negative, while traditional models (Logistic, Gompertz or Richards) were retained for comparison purposes.
The values of the model parameters were determined with the iterative Levenberg–Marquardt method of nonlinear regression using the software TIBCO Statistica, version 13.5.0.17. The software used has already been successfully used in groundwater flow and quality analyses [63,64,65]. Considering the presented methodology, the following hypothesis is put forward: Models that use the domain [0, +∞) fit the experimental data better than models that use the domain of the entire number line (−∞, +∞).
The selection of independent variables for each wellfield was guided by the site-specific hydrogeological processes and the observed contamination patterns. For the Bartolovec wellfield, pumping rate was chosen as the primary variable because it has a direct influence on contaminant transport dynamics, as shown by field data and previous research [53]. In contrast, the Varaždin wellfield showed a stronger spatial dependence of nitrate concentrations on proximity to the point pollution source [52,54], which can be attributed to advective–dispersive transport mechanisms in the aquifer. The high hydraulic conductivity (147–242 m/day) and effective porosity (13–30%) of the alluvial aquifer facilitated rapid nitrate dispersion [66], making distance to sources a more reliable predictor of concentration gradients than pumping rates alone. This difference highlights the importance of adapting the choice of variables to the prevailing transport processes at each location.
For each model used, both a t-value and a p-value were determined for each parameter. If the critical value for the significance level of 0.05 was exceeded, the values of the parameters are marked in red, meaning that the parameters cannot be considered reliable. The values of the corrected coefficients of determination (Rc2) and the sum of squared residuals (SS) were determined for the purpose of comparing the models with each other. However, as the models differ in the number of parameters, the values for the Akaike information criterion (AIC) were determined. The AIC value is calculated using the following equation:
A I C = N · l n S S N + 2 K
where N stands for a number of data points in a scatter diagram and K stands for a number of parameters of the model. Since the ratio between the number of data (N) and the number of model parameters (K) is less than 40 (small samples), the values for the corrected Akaike information criterion (AICc) were also determined:
A I C C = A I C + 2 K ( K + 1 ) N K + 1
The best model is the one with the smallest AICc value. The reliability of each model was determined using the linearization method and the t-test was applied:
t = r · d f 1 r 2
where df stands for the degree of freedom and r is the correlation coefficient. The obtained t-values were compared with the critical value (tα), which was determined based on the degrees of freedom and a significance level of 0.05. In all models, A is the lower and B the upper asymptote. Table 2 and Table 3 provides an overview of the modified and linearized models.
The monotonically increasing models presented must meet the following conditions:
Domain: c ( Q ) ,   lim Q c ( Q ) = A lim Q c ( Q ) = B
Domain: c ( Q ) 0 ,   c Q = A ,   f o r   Q = 0 lim Q c ( Q ) = B
The presented monotonically decreasing models must meet the following conditions:
Domain: c ( h ) ,   lim h c ( h ) = B lim h c ( h ) = A
Domain: c ( h ) 0 ,   c h = B ,   f o r   h = 0 lim h c ( h ) = A

3. Results

Building on the proposed methodology, this section presents the results for two distinct scenarios: (i) increasing monotonic models describing the relationship between nitrate concentration and pumping rate, as investigated in the Bartolovec wellfield case study, and (ii) decreasing monotonic models characterizing the dependence of nitrate concentration on the distance from the pollution source, as analyzed in the Varaždin wellfield case study.

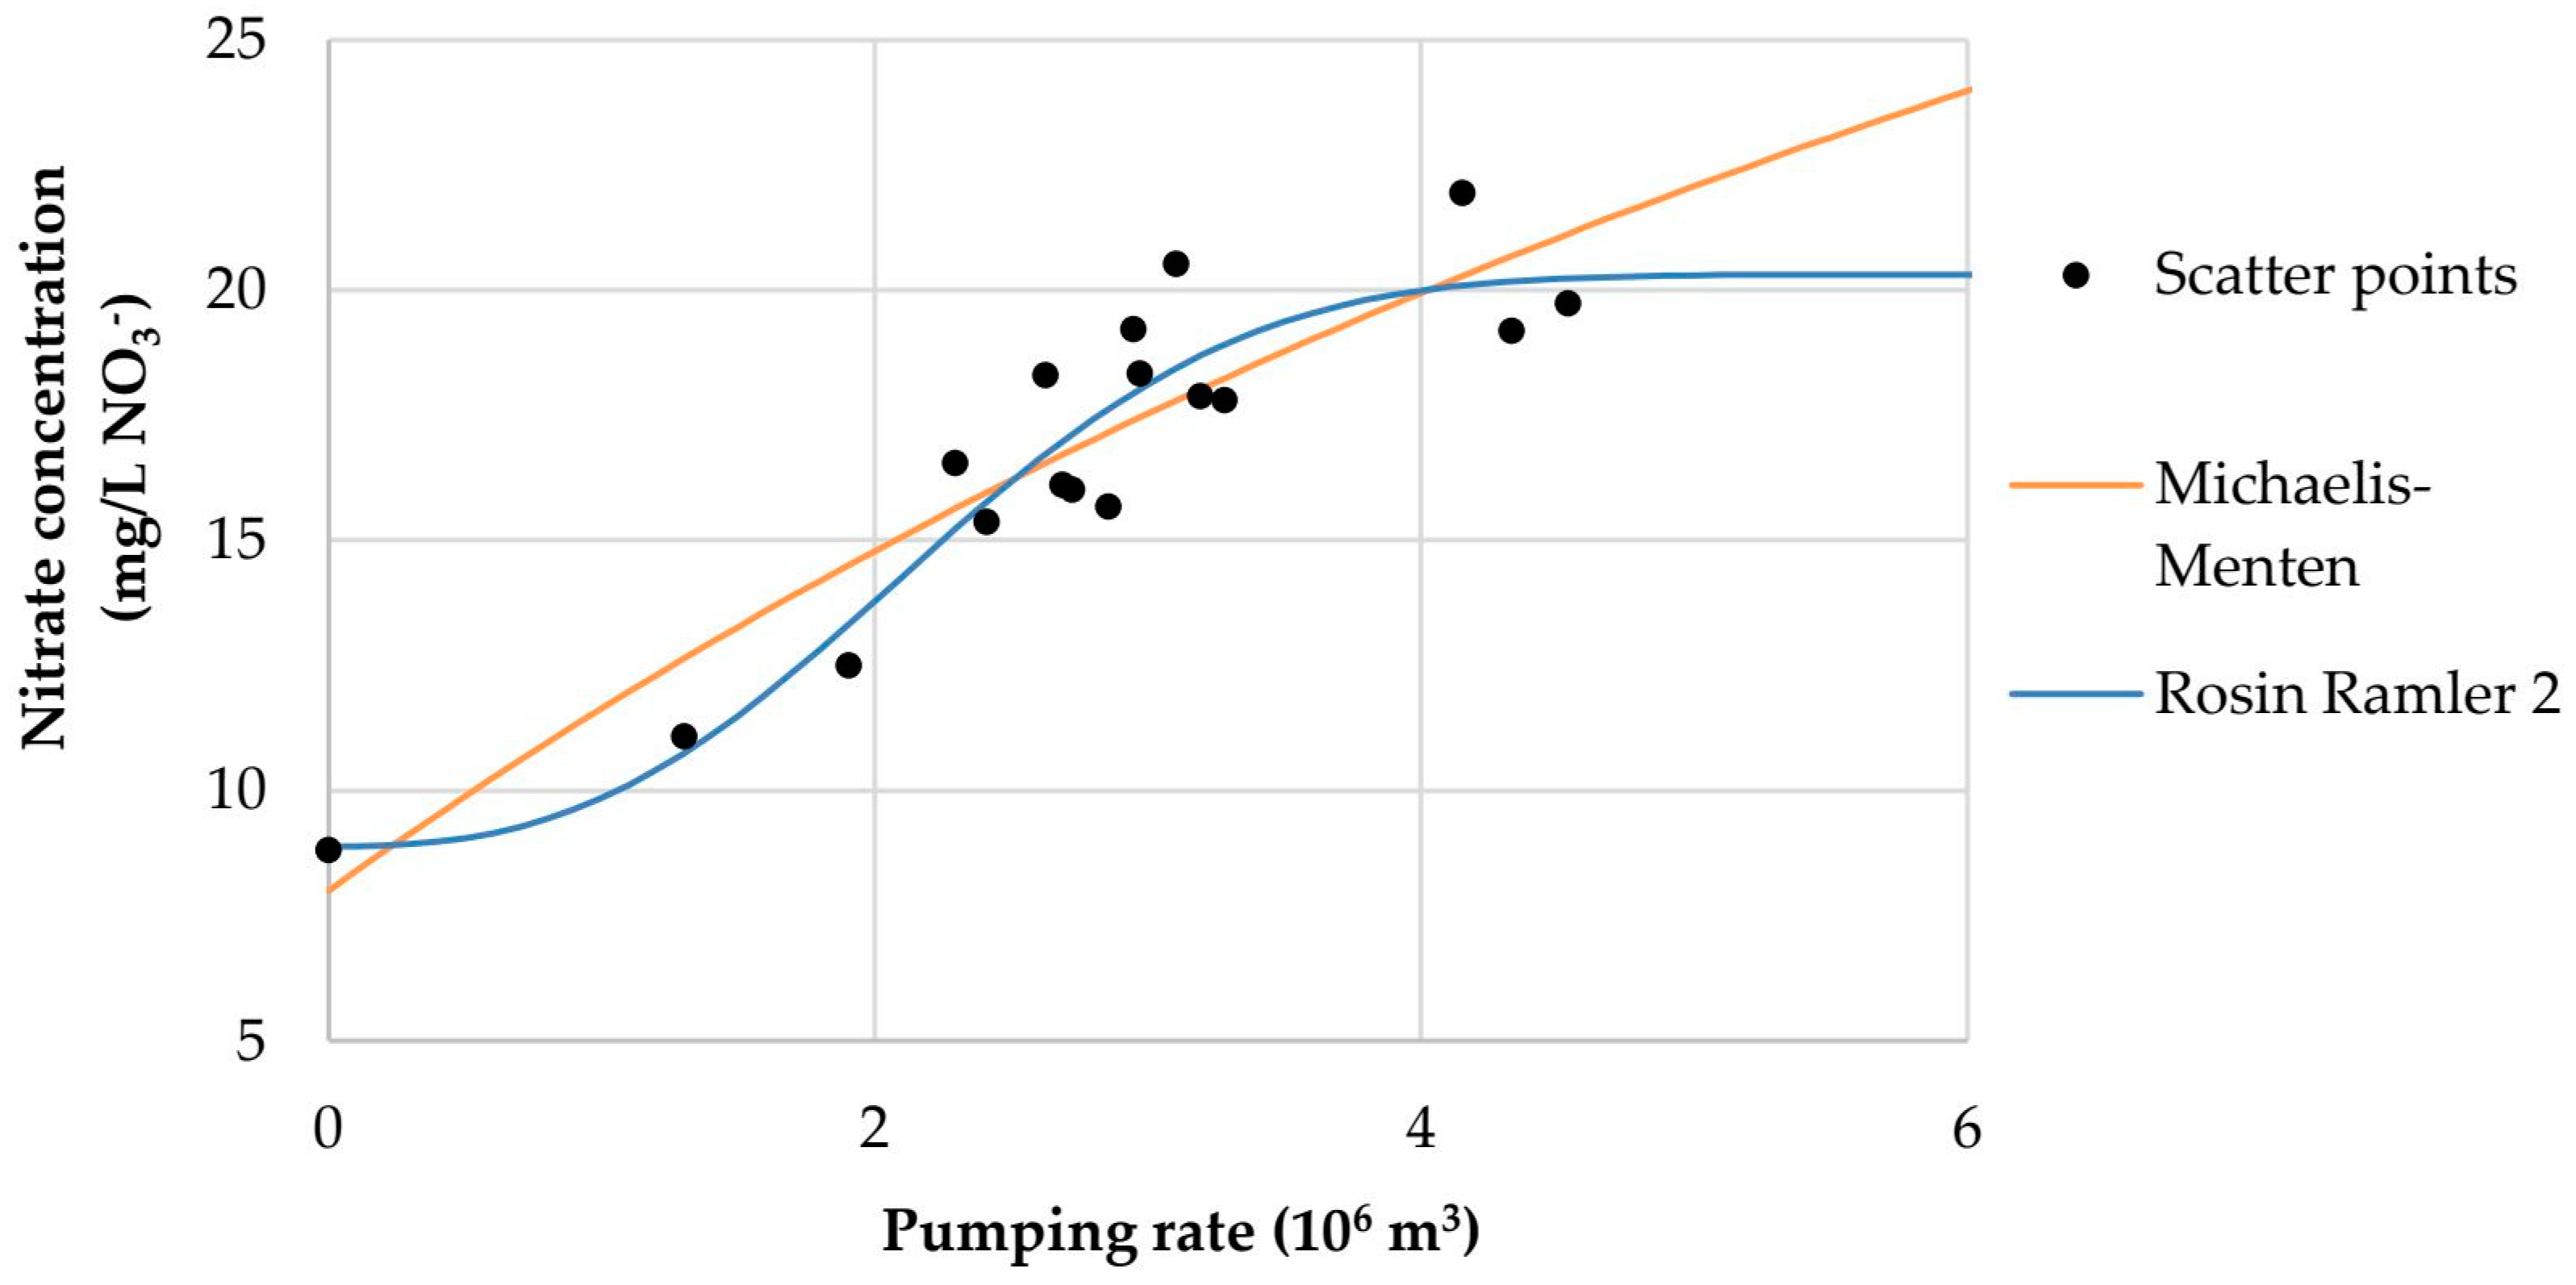
3.1. Increasing Monothonic Models (Nitrate Concentration Vs. Pumping Rate)

Increasing monotonic models were fitted to the experimental data at the Bartolovec wellfield. The results of the analysis show that the models fit the experimental data well, as shown by the values of the coefficients of determination (R2), which are greater than 0.8 in all cases. Since the models differ in the number of parameters, the models were compared using the AICc values, and the best fitting model has the lowest AICc value. Thus, the best fitting model is the Rosin–Rammler 1 model (AICc = 14.0993) and the worst fitting model is the Richards function model (AICc = 20.1759). In general, the results show that sigmoidal functions of the domain [0, +∞) fit better than sigmoidal functions of the domain (−∞, +∞), which confirms the hypothesis. In this case, the exception is the Michaelis–Menten function (AICc = 18.9739), which, according to the results obtained, fits worse than the Logistic (AICc = 16.4215) and Gompertz functions (AICc = 16.6834).
The results of the analysis show that for all models the t-values exceeded the critical tα value (Table 4). Based on these results, it can be concluded that all models are reliable. However, for each model parameter, the t and p values were also calculated. The Michaelis–Menten is listed here as an example (Table 5) and also shown to not describe the measured data well. This is not surprising as the Michaelis–Menten and Monod function are more suitable to describe contaminant degradation due to bacteria [70]. Since the t and p values in this case are greater than the critical (0.05) for parameters B and C, their values are marked in red, so the models cannot be considered reliable.
The pumping rate at the Bartolovec wellfield changed over time, which caused a change in the nitrate concentration in the groundwater, but it did not exceed the MAC. The dependence of annual average nitrate concentration on pumping rate is shown in the scatter diagram (Figure 4). As examples, the worst (Michaelis–Menten) and best (Rosin–Rammler 1) fitted functions are given here. From the point distribution, it is evident that nitrate concentrations in groundwater increase with the increasing pumping rates.
The estimated value to which the nitrate concentration will increase with further increases in pumping rate (parameter B) is the highest in the Michaelis–Menten model and is 57.3746 mg/L NO3. However, the t and p values obtained for this parameter, as well as for the parameter C, are greater than the critical value, so this model cannot be considered reliable. The other values for this parameter vary from model to model, ranging from 20.3112 (Rosin Rammler 1) to 24.9841 mg NO3/L (Hill 1) (Table 4). In the design of the public water supply system expansion, this data are crucial. Specifically, the expansion of the system requires an increase in the pumping rate. Consequently, the nitrate concentration will also increase up to a certain value (upper asymptote, parameter B). Therefore, such data must be reliable.

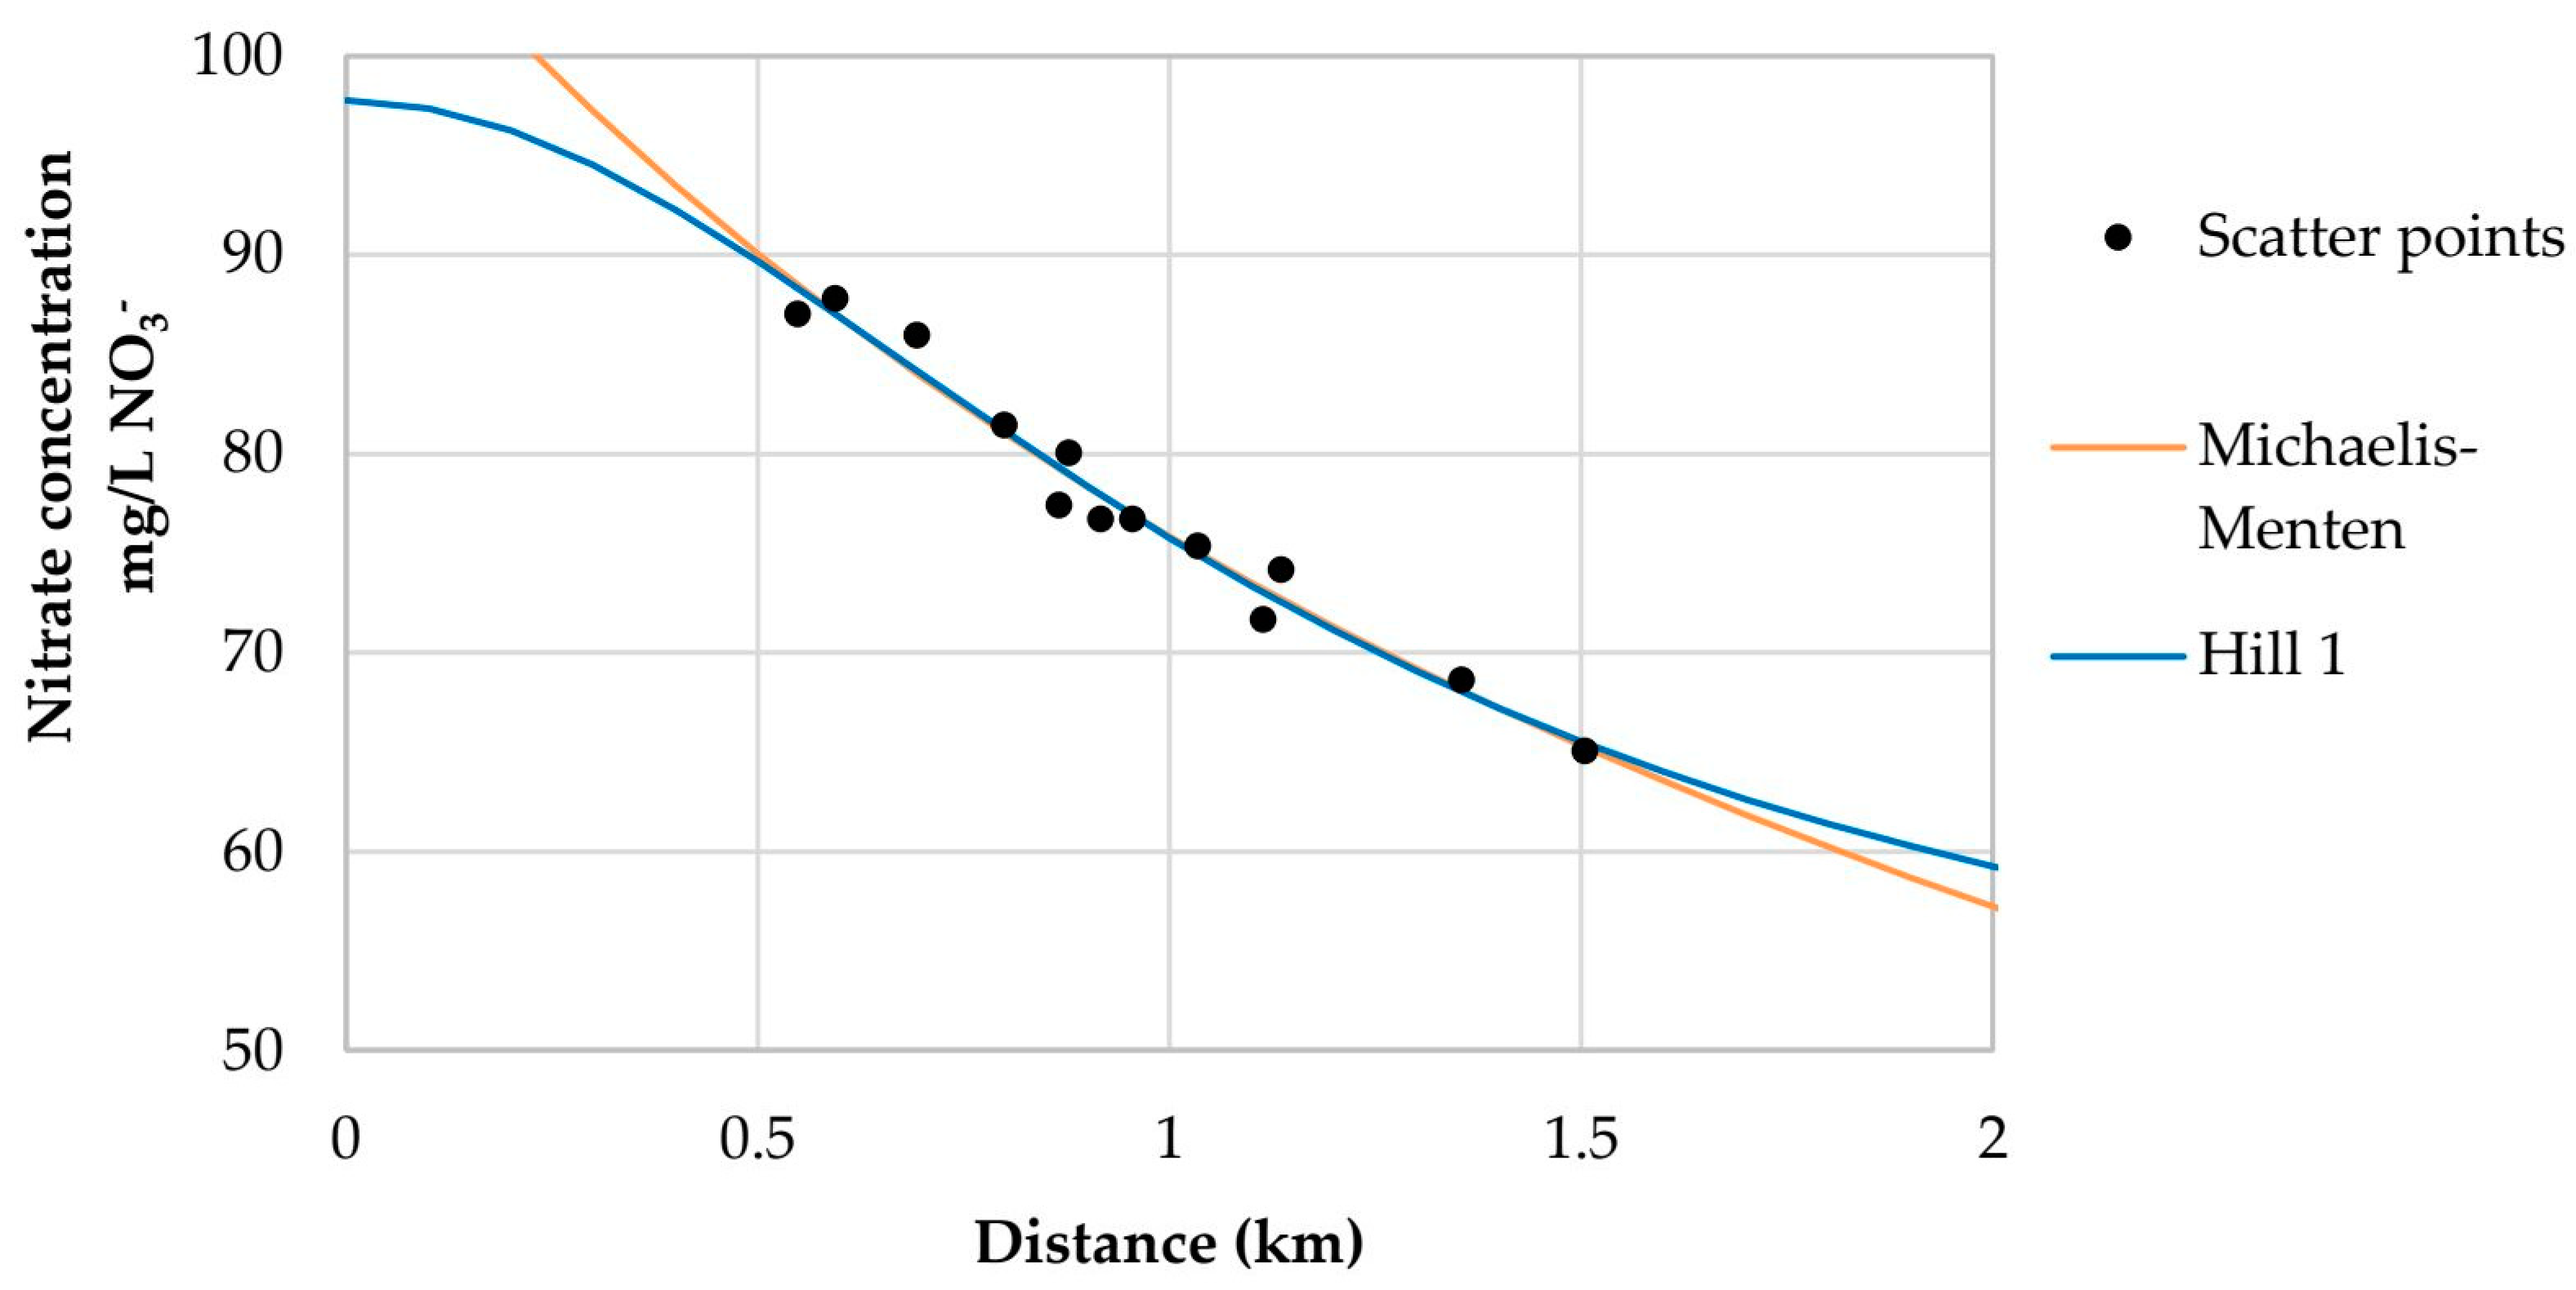
3.2. Decreasing Monothonic Models (Nitrate Concentration Vs. Distance)

Decreasing monotonic models were fitted to the experimental data of the Varaždin wellfield. The results show that the models used fit the experimental data well, so that the coefficients of determination (R2) are greater than 0.96 (Table 6). These high values indicate that the variability in nitrate concentration as a function of distance from the landfill is lower compared to the variability observed in the relationship between nitrate concentration and pumping rate at the Bartolovec wellfield (Table 4).
Given the unequal number of parameters, the AICc values were also calculated in this case. Considering the lowest value for the Hill 1 function (AICc = 11.5864), this model can be considered the best fitting model. On the other hand, the highest value (AICc = 20.4404) was obtained for the Richards function, which means that this model can be considered as the worst fitting model. Moreover, as in the previous analysis, the results show a better fit of sigmoidal functions whose domain is [0, +∞) compared to functions of domain (−∞, +∞), which confirms the hypothesis. For all models, the t-values are higher than the critical tα-value. It can, therefore, be concluded that the models are reliable. However, the t and p values of the parameters only show reliability for the Hill 1 and Rosin–Rammler 1 functions, so only those functions can be considered reliable.
At the Varaždin wellfield, the nitrate concentration was above the MAC (50 mg/L NO3) at all groundwater sampling locations (the reason of putting the station out of operation). The dependence of nitrate concentration on the distance from the point source of pollution is shown in the scatter diagram (Figure 5). From the point distribution, it is evident that nitrate concentration in groundwater decreases with distance of the pollution source. As examples, the worst (Michaelis–Menten) and best (Hill 2) fitted functions are given here.
The estimated value to which the nitrate concentration (parameter A) will decrease with increasing distance from the landfill is the lowest in the Michaelis–Menten model, and is −5.3808 mg/L NO3. However, this result is in a practical sense unrealistic because concentration cannot be less than zero. Also, the t and p values obtained for this parameter in this function, as well as for parameter C, are greater than the critical value, so the model cannot be considered reliable. The other values for the parameter A vary from model to model, ranging from 46.3523 (Hill 1) to 60.3845 mg/L NO3 (Rosin–Rammler 2) (Table 6). In the assessment of the impact of the point source of pollution on nitrate concentration at the Varaždin wellfield, it is essential to determine the value to which this concentration (lower asymptote, parameter A) will decrease with increasing distance from the landfill. Therefore, in this case, such data must be reliable.

4. Discussion

Nowadays, groundwater is the most important source of water for human needs [71], but at the same time, aquifers are highly vulnerable to anthropogenic activities [72,73]. Therefore, it is important to preserve their quality and contribute to the management of these extremely important resources by developing new assessment methods. For this reason, sigmoidal growth functions in the domain [0, +∞), which have no logical restrictions in a practical sense, were used in this work, unlike functions that utilize the entire domain of the number lines (−∞, +∞) and have been previously used for this purpose. This methodological choice not only better reflects physical realities of contaminant concentrations, but also demonstrates measurable improvements in model performance. As evidenced by the obtained results, the proposed functions demonstrate a superior fit to the experimental data, thereby enabling more effective management of water resources.
The results of the study showed that nitrates pose a major threat to the deterioration of groundwater quality, which is the reason why the Varaždin wellfield was suspended from further water usage. Point sources (farms) [74] and surface sources of pollution (agricultural land) [75] are the main sources of nitrate pollution, and the area studied is no exception in this respect. These findings emphasize the need for targeted agricultural management policies in vulnerable recharge areas. The study on the Bartolovec wellfield has also shown that the level of pumping rate affects groundwater quality. In particular, an increase in pumping rate was associated with increased nitrate concentrations in the extracted groundwater, suggesting that increased pumping may draw in more contaminated water from surrounding areas. This observation is consistent with the findings of other studies, such as Ahmadi et al. [76], who demonstrated through numerical modeling that higher pumping rates can accelerate the transport of contaminants towards the wells and thus increase the risk of groundwater contamination. Similarly, studies in the Varaždin region showed that higher pumping rates in the Bartolovec and Vinokovščak wellfields correlated with higher nitrate levels, highlighting the impact of pumping intensity on groundwater quality [53]. Further evidence of this correlation is a study in South Korea, which found that increased groundwater abstraction in agricultural areas led to increased nitrate concentrations [77]. This underlines the global importance of controlling pumping rates to protect water quality.
In water resources management, as well as in the development of accurate numerical models for groundwater flow and contaminant transport, and the simulation of various pumping rates, it is crucial to accurately estimate specific parameters [78], e.g., the concentration of a contaminant in the source itself, the average impact of a contaminant source on certain wells and the increase in the concentration of contaminants as pumping rates increase. Therefore, the results presented in this paper may be of practical importance. The ability to accurately predict these extreme values is essential for constructing reliable numerical groundwater flow and contaminant transport models. Maximum concentrations are critical for identifying zones of highest risk and ensuring health and environmental safety, while minimum values help define background levels and delineate the extent of contaminant plumes. Incorporating these extremes into models enhances their robustness and improves the effectiveness of simulations and long-term management strategies. The case study at the Bartolovec wellfield concluded that, assuming no changes in other external factors, the nitrate concentration will remain below the maximum allowable concentration (MAC) despite an increase in the pumping rate. However, the increase in the pumping rate leads to a certain increase in nitrate groundwater level, so further monitoring of the quality is necessary. For the second observed case of the dependence of the nitrate concentration on the distance to the pollution source at the Varaždin wellfield, the results showed significant in fit the experimental data in the models. In this way, it is possible to estimate the maximum (for h = 0) and minimum value (for h = +∞) of the pollution concentration.
In both cases presented, the lowest values for the coefficient of determination R2 were obtained for the Michaelis–Menten model, while the highest values were obtained for the Rosin–Rammler 2 model for the case of nitrate concentration dependence on pumping rate, and the Richards model for the case of nitrate concentration dependence on the distance from the waste landfill. The better fit of the Rosin–Rammler 2 and Richards models to the experimental data compared to the Michaelis–Menten model can be explained by the difference in the number of model parameters (column K in Table 4 and Table 5): the greater the number of parameters, the higher the coefficient of determination, as a rule. However, when comparing the Michaelis–Menten and Hill 1 models, which have the same number of parameters, the Hill 1 model fits better in both cases. The reason for this is the limitation of the Michaelis–Menten model, which does not have a point of inflection (Figure 4 and Figure 5). This limitation suggests that models lacking inflection points may struggle to capture the full dynamics of contaminant transport when dealing with spatial gradients. The better fit of Hill 1 is therefore due to the flexibility with which the exponent parameter captures the nonlinear attenuation.
Given the unequal number of parameter and the ratio of data points to the number of parameters, the models were compared based on the obtained AICc values (Table 4 and Table 6). The lowest AICc values were obtained for the Rosin–Rammler 1 model for the pumping rate and the Hill 1 model for the landfill distance case. The highest AICc values in both cases were obtained for the Richards model. The results clearly show that the t and p values for all parameters are below the critical values only for Hill 1 and Rosin Rammler 1, and this applies to both analyzed cases. For these models, the lowest AICc values were also obtained, in both cases. It can be concluded that the models obtained with the above functions best fit the experimental data of the observed cases. However, for a general conclusion in other locations, further investigations are needed. Extending the model evaluation across different hydrogeological settings would help verify its broader applicability and enhance its utility in regional water quality assessments.
While sigmoid functions provided an empirical fit to the observed nitrate concentration trends, an error function derived from the advection–dispersion equation would provide a theoretically more rigorous representation of contaminant transport under continuous source conditions. This approach would require accurate estimates of hydrodynamic parameters, such as dispersion coefficients and average flow velocity. For this reason, future work will prioritize field measurements, such as tracer tests to enable modeling based on error functions, and thus close the gap between empirical approximations and physically based simulations.

5. Conclusions

Sigmoid models with the domain of the entire real number are often used in groundwater quality analysis. However, the results obtained in this study point to the justification for applying models whose domain is only the positive part of number line. Two cases were observed: (i) the dependence of nitrate concentration on pumping rate and (ii) the dependence of nitrate concentration on distance from pollution source. The results showed that such models fit better to the experimental data. In both case studies, coefficients of determination (R2) exceeded 0.82 for case (i) and 0.96 for case (ii), indicating a strong correlation between model predictions and observed values.
Among all mathematical models fitted to experimental data in this study, the Hill 1 and Rosin–Rammler 1 models (with domains limited to positive real numbers) fit best. From the perspective of t-test results, all models were reliable. However, t and p values for each model parameter were below the critical values only for these models, and their respective AICc values were the lowest. From this reason, these results are relevant for the design of the expansion of the water supply system, as well as for quantifying the impact of pollution sources on groundwater quality.
In the case study of the Bartolovec wellfield, it can be concluded that the nitrate concentration will remain below the MAC, with a further increase in pumping rate, of course, unless external factors change. However, it has been shown that increasing the pumping rate has had an effect on the increase in nitrate concentration. Therefore, daily monitoring is of utmost importance to maintain the existing quality. Furthermore, the case study on the Varaždin wellfield confirms the influence of point sources of pollution on nitrate concentration, and the models used can provide a good estimate of pollution concentration at h = 0 and h = +∞ as well as in the spatial domain of the wellfield. Such determination of extreme values is essential for managing health risks, identifying high-risk zones, and developing effective remediation plans. These values also represent good indicative values when developing numerical models.
It would be unjustified to assert, based on only two analyzed cases, that models such as Hill and Rosin–Rammler outperform Logistic, Gompertz, and Richards models. However, based on the findings of this study, it is evident that the application of models with a non-negative real number domain is warranted in the analysis of groundwater quality.

Author Contributions

Conceptualization, I.K. and M.Š.; methodology, I.K.; software, I.K. and M.Š.; validation, N.S. and J.N.-J. formal analysis, I.K. and M.Š.; investigation, I.K., M.Š. and N.S.; resources, I.K. and M.Š.; data curation, M.Š.; writing—original draft preparation, I.K. and M.Š.; writing—review and editing, N.S. and J.N.-J.; visualization, M.Š.; supervision, N.S. All authors have read and agreed to the published version of the manuscript.

Funding

This research was funded under the Interreg Central Europe project CE0100184 “Management of urban water resources in Central Europe facing climate change (MAURICE)”.

Data Availability Statement

The data used in this study are presented in the article. Additional data are available upon request from the corresponding authors.

Conflicts of Interest

The authors declare no conflicts of interest.

References

  1. De Luca Peña, L.V.; Taelman, S.E.; Préat, N.; Boone, L.; Van der Biest, K.; Custódio, M.; Hernandez Lucas, S.; Everaert, G.; Dewulf, J. Towards a Comprehensive Sustainability Methodology to Assess Anthropogenic Impacts on Ecosystems: Review of the Integration of Life Cycle Assessment, Environmental Risk Assessment and Ecosystem Services Assessment. Sci. Total Environ. 2022, 808, 152125. [Google Scholar] [CrossRef] [PubMed]
  2. Amundson, K.K.; Borton, M.A.; Wilkins, M.J. Anthropogenic Impacts on the Terrestrial Subsurface Biosphere. Nat. Rev. Microbiol. 2025, 23, 147–161. [Google Scholar] [CrossRef] [PubMed]
  3. Chiang, F.; Mazdiyasni, O.; AghaKouchak, A. Evidence of Anthropogenic Impacts on Global Drought Frequency, Duration, and Intensity. Nat. Commun. 2021, 12, 2754. [Google Scholar] [CrossRef]
  4. Jain, D.; Bhatnagar, S.; Sachdeva, K. Impact of Degrading Air Quality on Mode Choice and Emissions—Study of Ten Global Cities. World Dev. Sustain. 2022, 1, 100002. [Google Scholar] [CrossRef]
  5. You, G. A Comprehensive Approach for Calibrating Anthropogenic Effects on Atmosphere Degradation. Renew. Sustain. Energy Rev. 2024, 191, 114226. [Google Scholar] [CrossRef]
  6. Vigiak, O.; Udias, A.; Pistocchi, A.; Zanni, M.; Aloe, A.; Grizzetti, B. Probability Maps of Anthropogenic Impacts Affecting Ecological Status in European Rivers. Ecol. Indic. 2021, 126, 107684. [Google Scholar] [CrossRef]
  7. Bonisławska, M.; Nędzarek, A.; Rybczyk, A.; Tański, A. The Influence of Anthropogenic Pollution on the Physicochemical Conditions of the Waters of the Lower Section of the Sąpólna River. Water 2023, 16, 35. [Google Scholar] [CrossRef]
  8. Dusaucy, J.; Gateuille, D.; Perrette, Y.; Naffrechoux, E. Microplastic Pollution of Worldwide Lakes. Environ. Pollut. 2021, 284, 117075. [Google Scholar] [CrossRef]
  9. Alava, J.J.; McMullen, K.; Jones, J.; Barragán-Paladines, M.J.; Hobbs, C.; Tirapé, A.; Calle, P.; Alarcón, D.; Muñoz-Pérez, J.P.; Muñoz-Abril, L.; et al. Multiple Anthropogenic Stressors in the Galápagos Islands’ Complex Social–Ecological System: Interactions of Marine Pollution, Fishing Pressure, and Climate Change with Management Recommendations. Integr. Environ. Assess. Manag. 2023, 19, 870–895. [Google Scholar] [CrossRef]
  10. Khan, S.; Naushad, M.; Lima, E.C.; Zhang, S.; Shaheen, S.M.; Rinklebe, J. Global Soil Pollution by Toxic Elements: Current Status and Future Perspectives on the Risk Assessment and Remediation Strategies—A Review. J. Hazard. Mater. 2021, 417, 126039. [Google Scholar] [CrossRef]
  11. Jadeja, N.B.; Banerji, T.; Kapley, A.; Kumar, R. Water Pollution in India—Current Scenario. Water Secur. 2022, 16, 100119. [Google Scholar] [CrossRef]
  12. Kranjcevic, L.; Srajbek, M.; Grbcic, L.; Carija, Z. Analysis of Well Field Nitrates Pollution Distribution in Agricultural Area. In Proceedings of the 29th International DAAAM Symposium “Intelligent Manufacturing & Automation”, Zadar, Croatia, 24–27 October 2018; pp. 1053–1058. [Google Scholar]
  13. van der Gun, J. Groundwater Resources Sustainability. In Global Groundwater; Elsevier: Amsterdam, The Netherlands, 2021; pp. 331–345. [Google Scholar]
  14. Zhang, Y.; Yan, Y.; Yao, R.; Wei, D.; Huang, X.; Luo, M.; Wei, C.; Chen, S.; Yang, C. Natural Background Levels, Source Apportionment and Health Risks of Potentially Toxic Elements in Groundwater of Highly Urbanized Area. Sci. Total Environ. 2024, 935, 173276. [Google Scholar] [CrossRef] [PubMed]
  15. Xiao, J.; Wang, L.; Chai, N.; Liu, T.; Jin, Z.; Rinklebe, J. Groundwater Hydrochemistry, Source Identification and Pollution Assessment in Intensive Industrial Areas, Eastern Chinese Loess Plateau. Environ. Pollut. 2021, 278, 116930. [Google Scholar] [CrossRef]
  16. Kou, X.; Ding, J.; Li, Y.; Li, Q.; Mao, L.; Xu, C.; Zheng, Q.; Zhuang, S. Tracing Nitrate Sources in the Groundwater of an Intensive Agricultural Region. Agric. Water Manag. 2021, 250, 106826. [Google Scholar] [CrossRef]
  17. Cabrera, A.; Cendón, D.I.; Aparicio, V.; Currell, M.J. Intensive Agriculture, a Pesticide Pathway to >100 m Deep Groundwater below Dryland Agriculture, Cordoba Pampas, Argentina. J. Hydrol. 2024, 643, 131989. [Google Scholar] [CrossRef]
  18. Uliasz-Misiak, B.; Winid, B.; Lewandowska-Śmierzchalska, J.; Matuła, R. Impact of Road Transport on Groundwater Quality. Sci. Total Environ. 2022, 824, 153804. [Google Scholar] [CrossRef]
  19. Bijay-Singh; Craswell, E. Fertilizers and Nitrate Pollution of Surface and Ground Water: An Increasingly Pervasive Global Problem. SN Appl. Sci. 2021, 3, 518. [Google Scholar] [CrossRef]
  20. Abascal, E.; Gómez-Coma, L.; Ortiz, I.; Ortiz, A. Global Diagnosis of Nitrate Pollution in Groundwater and Review of Removal Technologies. Sci. Total Environ. 2022, 810, 152233. [Google Scholar] [CrossRef] [PubMed]
  21. Liu, R.; Xie, X.; Hou, Q.; Han, D.; Song, J.; Huang, G. Spatial Distribution, Sources, and Human Health Risk Assessment of Elevated Nitrate Levels in Groundwater of an Agriculture-Dominant Coastal Area in Hainan Island, China. J. Hydrol. 2024, 634, 131088. [Google Scholar] [CrossRef]
  22. Fossen Johnson, S. Methemoglobinemia: Infants at Risk. Curr. Probl. Pediatr. Adolesc. Health Care 2019, 49, 57–67. [Google Scholar] [CrossRef]
  23. Costa Santos, R.; Aguilar da Silva, R.; Moreira dos Santos, M.; Botelho Bovo, A.; Furtado da Silva, A. Assessing Nitrate Contamination in Groundwater for Public Supply: A Study in a Small Brazilian Town. Groundw. Sustain. Dev. 2024, 25, 101084. [Google Scholar] [CrossRef]
  24. He, C.; Liu, Z.; Wu, J.; Pan, X.; Fang, Z.; Li, J.; Bryan, B.A. Future Global Urban Water Scarcity and Potential Solutions. Nat. Commun. 2021, 12, 4667. [Google Scholar] [CrossRef] [PubMed]
  25. Bouziotas, D.; Rozos, E.; Makropoulos, C. Water and the City: Exploring Links between Urban Growth and Water Demand Management. J. Hydroinformatics 2015, 17, 176–192. [Google Scholar] [CrossRef]
  26. Rosegrant, M.W.; Cai, X. Global Water Demand and Supply Projections. Water Int. 2002, 27, 170–182. [Google Scholar] [CrossRef]
  27. Kamra, S.K.; Lal, K.; Singh, O.P.; Boonstra, J. Effect of Pumping on Temporal Changes in Groundwater Quality. Agric. Water Manag. 2002, 56, 169–178. [Google Scholar] [CrossRef]
  28. Gӧdeke, S.H.; Malik, O.A.; Lai, D.T.C.; Bretzler, A.; Schirmer, M.; Mansor, N.H. Water Quality Investigation in Brunei Darussalam: Investigation of the Influence of Climate Change. Environ. Earth Sci. 2020, 79, 419. [Google Scholar] [CrossRef]
  29. Changming, L.; Jingjie, Y.; Kendy, E. Groundwater Exploitation and Its Impact on the Environment in the North China Plain. Water Int. 2001, 26, 265–272. [Google Scholar] [CrossRef]
  30. Costall, A.R.; Harris, B.D.; Teo, B.; Schaa, R.; Wagner, F.M.; Pigois, J.P. Groundwater Throughflow and Seawater Intrusion in High Quality Coastal Aquifers. Sci. Rep. 2020, 10, 9866. [Google Scholar] [CrossRef]
  31. Sappa, G.; Iacurto, S.; Ferranti, F.; De Filippi, F.M. Groundwater Quality Assessment in a Karst Coastal Region of the West Aurunci Mountains (Central Italy). Geofluids 2019, 2019, 3261713. [Google Scholar] [CrossRef]
  32. Lovrinović, I.; Bergamasco, A.; Srzić, V.; Cavallina, C.; Holjević, D.; Donnici, S.; Erceg, J.; Zaggia, L.; Tosi, L. Groundwater Monitoring Systems to Understand Sea Water Intrusion Dynamics in the Mediterranean: The Neretva Valley and the Southern Venice Coastal Aquifers Case Studies. Water 2021, 13, 561. [Google Scholar] [CrossRef]
  33. Gomaa, S.M.; Hassan, T.M.; Helal, E. Assessment of Seawater Intrusion under Different Pumping Scenarios in Moghra Aquifer, Egypt. Sci. Total Environ. 2021, 781, 146710. [Google Scholar] [CrossRef]
  34. Ha, K.; Lee, E.; An, H.; Kim, S.; Park, C.; Kim, G.-B.; Ko, K.-S. Evaluation of Seasonal Groundwater Quality Changes Associated with Groundwater Pumping and Level Fluctuations in an Agricultural Area, Korea. Water 2020, 13, 51. [Google Scholar] [CrossRef]
  35. Dennehy, K.F.; Litke, D.W.; McMahon, P.B. The High Plains Aquifer, USA: Groundwater Development and Sustainability. Geol. Soc. Lond. Spec. Publ. 2002, 193, 99–119. [Google Scholar] [CrossRef]
  36. Lim, J.-W.; Bae, G.-O.; Lee, K.-K. Groundwater Vulnerability Assessment by Determining Maximum Contaminant Loading Limit in the Vicinity of Pumping Wells. Geosci. J. 2009, 13, 79–85. [Google Scholar] [CrossRef]
  37. Mastrocicco, M.; Colombani, N.; Castaldelli, G.; Jovanovic, N. Monitoring and Modeling Nitrate Persistence in a Shallow Aquifer. Water Air Soil Pollut. 2011, 217, 83–93. [Google Scholar] [CrossRef]
  38. Baba, A.; Tayfur, G. Groundwater Contamination and Its Effect on Health in Turkey. Environ. Monit. Assess. 2011, 183, 77–94. [Google Scholar] [CrossRef]
  39. Nemčić-Jurec, J.; Konjačić, M.; Jazbec, A. Monitoring of Nitrates in Drinking Water from Agricultural and Residential Areas of Podravina and Prigorje (Croatia). Environ. Monit. Assess. 2013, 185, 9509–9520. [Google Scholar] [CrossRef]
  40. Debele, B.; Srinivasan, R.; Parlange, J.-Y. Coupling Upland Watershed and Downstream Waterbody Hydrodynamic and Water Quality Models (SWAT and CE-QUAL-W2) for Better Water Resources Management in Complex River Basins. Environ. Model. Assess. 2008, 13, 135–153. [Google Scholar] [CrossRef]
  41. Arabgol, R.; Sartaj, M.; Asghari, K. Predicting Nitrate Concentration and Its Spatial Distribution in Groundwater Resources Using Support Vector Machines (SVMs) Model. Environ. Model. Assess. 2016, 21, 71–82. [Google Scholar] [CrossRef]
  42. Abdullah, S.; Ismail, M.; Ahmed, A.N.; Abdullah, A.M. Forecasting Particulate Matter Concentration Using Linear and Non-Linear Approaches for Air Quality Decision Support. Atmosphere 2019, 10, 667. [Google Scholar] [CrossRef]
  43. Rovira, J.; Paredes-Ahumada, J.A.; Barceló-Ordinas, J.M.; García-Vidal, J.; Reche, C.; Sola, Y.; Fung, P.L.; Petäjä, T.; Hussein, T.; Viana, M. Non-Linear Models for Black Carbon Exposure Modelling Using Air Pollution Datasets. Environ. Res. 2022, 212, 113269. [Google Scholar] [CrossRef] [PubMed]
  44. Tompić, T.; Dobša, J.; Legen, S.; Tompić, N.; Medić, H. Modeling the Growth Pattern of In-Season and off-Season Ross 308 Broiler Breeder Flocks. Poult. Sci. 2011, 90, 2879–2887. [Google Scholar] [CrossRef]
  45. Wojnarowska, A.; Pałka, S.; Otwinowska-Mindur, A.; Ptak, E. Comparison of Two Non-Linear Functions Describing the Growth of Popielno White and New Zealand White Rabbits. Anim. Sci. Genet. 2022, 18, 7. [Google Scholar] [CrossRef]
  46. Eberhardt, L.L.; Breiwick, J.M. Models for Population Growth Curves. ISRN Ecol. 2012, 2012, 815016. [Google Scholar] [CrossRef]
  47. Rammig, A.; Bebi, P.; Bugmann, H.; Fahse, L. Adapting a Growth Equation to Model Tree Regeneration in Mountain Forests. Eur. J. For. Res. 2006, 126, 49–57. [Google Scholar] [CrossRef]
  48. Cole, T.J.; Pan, H.; Butler, G.E. A Mixed Effects Model to Estimate Timing and Intensity of Pubertal Growth from Height and Secondary Sexual Characteristics. Ann. Hum. Biol. 2014, 41, 76–83. [Google Scholar] [CrossRef]
  49. Asadi, M.; Di Crescenzo, A.; Sajadi, F.A.; Spina, S. A Generalized Gompertz Growth Model with Applications and Related Birth-Death Processes. Ric. Mat. 2023, 72, 1–36. [Google Scholar] [CrossRef]
  50. Dobša, J.; Kovač, I. Nonlinear Growth Models for Modelling Time Series of Groundwater Nitrate Concentrations. Environ. Model. Assess. 2018, 23, 175–184. [Google Scholar] [CrossRef]
  51. Madani, A.; Hagage, M.; Elbeih, S.F. Random Forest and Logistic Regression Algorithms for Prediction of Groundwater Contamination Using Ammonia Concentration. Arab. J. Geosci. 2022, 15, 1619. [Google Scholar] [CrossRef]
  52. Srajbek, M.; Kovac, I.; Novotni-Horcicka, N.; Kranjcevic, L. Assessment of average contributions of point and diffuse pollution sources to nitrate concentration in groundwater by nonlinear regression. Environ. Eng. Manag. J. 2020, 19, 95–104. [Google Scholar] [CrossRef]
  53. Kovač, I.; Šrajbek, M.; Kranjčević, L.; Novotni-Horčička, N. Nonlinear Models of the Dependence of Nitrate Concentrations on the Pumping Rate of a Water Supply System. Geosci. J. 2020, 24, 585–595. [Google Scholar] [CrossRef]
  54. Kovač, I.; Šrajbek, M.; Klišanin, N.; Gilja, G. Analysis of the Distance between the Measured and Assumed Location of a Point Source of Pollution in Groundwater as a Function of the Variance of the Estimation Error. Hydrology 2023, 10, 199. [Google Scholar] [CrossRef]
  55. Šrajbek, M.; Kranjčević, L.; Kovač, I.; Biondić, R. Groundwater Nitrate Pollution Sources Assessment for Contaminated Wellfield. Water 2022, 14, 255. [Google Scholar] [CrossRef]
  56. Novotni-Horčička, N.; Šrajbek, M.; Kovač, I. Nitrati u Regionalnom Vodovodu Varaždin (Nitrates in the Regional Water Supply System Varaždin). In Proceedings of the Voda i Javna Vodoopskrba, Krk, Croatia, 4–7 October 2010; Hrvatski Zavod za Javno Zdravstvo (HZJZ): Zagreb, Croatia, 2010; pp. 123–131. [Google Scholar]
  57. Urumović, K. O Kvartnom Vodonosnom Kopleksu u Području Varaždina. Geološki Vjesn. 1971, 43, 109–118. [Google Scholar]
  58. Kovač, I.; Kovačev-Marinčić, B.; Novotni-Horčička, N.; Mesec, J.; Vugrinec, J. Komparativna Analiza Koncentracije Nitrata u Gornjem i Donjem Sloju Varaždinskog Vodonosnika. Rad. Zavoda Znan. Varaždin 2017, 28, 41–57. [Google Scholar] [CrossRef]
  59. Larva, O.; Brkić, Ž.; Marković, T. Vulnerability and Risk of Contamination of the Varaždin Aquifer System, NW Croatia. Sustainability 2023, 15, 16502. [Google Scholar] [CrossRef]
  60. González-Tello, P.; Camacho, F.; Vicaria, J.M.; González, P.A. A Modified Nukiyama–Tanasawa Distribution Function and a Rosin–Rammler Model for the Particle-Size-Distribution Analysis. Powder Technol. 2008, 186, 278–281. [Google Scholar] [CrossRef]
  61. Goutelle, S.; Maurin, M.; Rougier, F.; Barbaut, X.; Bourguignon, L.; Ducher, M.; Maire, P. The Hill Equation: A Review of Its Capabilities in Pharmacological Modelling. Fundam. Clin. Pharmacol. 2008, 22, 633–648. [Google Scholar] [CrossRef]
  62. Srinivasan, B. A Guide to the Michaelis–Menten Equation: Steady State and Beyond. FEBS J. 2022, 289, 6086–6098. [Google Scholar] [CrossRef]
  63. Frazar, S.; Gold, A.J.; Addy, K.; Moatar, F.; Birgand, F.; Schroth, A.W.; Kellogg, D.Q.; Pradhanang, S.M. Contrasting Behavior of Nitrate and Phosphate Flux from High Flow Events on Small Agricultural and Urban Watersheds. Biogeochemistry 2019, 145, 141–160. [Google Scholar] [CrossRef]
  64. Buškulić, P.; Kovač, Z.; Matiatos, I.; Parlov, J. Tracing Nitrate Contamination Sources and Dynamics in an Unconfined Alluvial Aquifer System (Velika Gorica Well Field, Croatia). Environ. Sci. Process. Impacts 2025, 27, 154–171. [Google Scholar] [CrossRef] [PubMed]
  65. Buškulić, P.; Parlov, J.; Kovač, Z.; Brenko, T.; Pejić, M. Determination of Nitrate Migration and Distribution through Eutric Cambisols in an Area without Anthropogenic Sources of Nitrate (Velika Gorica Well Field, Croatia). Sustainability 2023, 15, 16529. [Google Scholar] [CrossRef]
  66. Karlović, I.; Posavec, K.; Larva, O.; Marković, T. Numerical Groundwater Flow and Nitrate Transport Assessment in Alluvial Aquifer of Varaždin Region, NW Croatia. J. Hydrol. Reg. Stud. 2022, 41, 101084. [Google Scholar] [CrossRef]
  67. Michaelis, M.; Menten, M.L. Die Kinetik Der Invertinwirkung. Biochem. Z. 1913, 49, 333–369. [Google Scholar]
  68. Hill, A.V. The Possible Effects of The Aggregation of The Molecules of Haemoglobin on Its Dissociation Curves. J. Physiol. 1910, 40, 4–7. [Google Scholar]
  69. Rosin, P.; Rammler, E. The Law Governing the Fineness of Powdered Coal. J. Inst. Fuel 1933, 7, 109–122. [Google Scholar]
  70. Gödeke, S.; Vogt, C.; Schirmer, M. Estimation of Kinetic Monod Parameters for Anaerobic Degradation of Benzene in Groundwater. Environ. Geol. 2008, 55, 423–431. [Google Scholar] [CrossRef]
  71. Fryar, A.E. Fundamentals of Ground Water: (Franklin, W. Schwartz and Hubao Zhang). Environ. Eng. Geosci. 2005, 11, 285–286. [Google Scholar] [CrossRef]
  72. Rama, F.; Busico, G.; Arumi, J.L.; Kazakis, N.; Colombani, N.; Marfella, L.; Hirata, R.; Kruse, E.E.; Sweeney, P.; Mastrocicco, M. Assessment of Intrinsic Aquifer Vulnerability at Continental Scale through a Critical Application of the Drastic Framework: The Case of South America. Sci. Total Environ. 2022, 823, 153748. [Google Scholar] [CrossRef]
  73. Goodarzi, M.R.; Niknam, A.R.R.; Jamali, V.; Pourghasemi, H.R. Aquifer Vulnerability Identification Using DRASTIC-LU Model Modification by Fuzzy Analytic Hierarchy Process. Model. Earth Syst. Environ. 2022, 8, 5365–5380. [Google Scholar] [CrossRef]
  74. Alam, S.M.K.; Li, P.; Fida, M. Groundwater Nitrate Pollution Due to Excessive Use of N-Fertilizers in Rural Areas of Bangladesh: Pollution Status, Health Risk, Source Contribution, and Future Impacts. Expo. Health 2024, 16, 159–182. [Google Scholar] [CrossRef]
  75. Nakagawa, K.; Amano, H.; Persson, M.; Berndtsson, R. Spatiotemporal Variation of Nitrate Concentrations in Soil and Groundwater of an Intensely Polluted Agricultural Area. Sci. Rep. 2021, 11, 2598. [Google Scholar] [CrossRef] [PubMed]
  76. Ahmadi, H.; Kilanehei, F.; Nazari-Sharabian, M. Impact of Pumping Rate on Contaminant Transport in Groundwater—A Numerical Study. Hydrology 2021, 8, 103. [Google Scholar] [CrossRef]
  77. Cheong, J.-Y.; Hamm, S.-Y.; Lee, J.-H.; Lee, K.-S.; Woo, N.-C. Groundwater Nitrate Contamination and Risk Assessment in an Agricultural Area, South Korea. Environ. Earth Sci. 2012, 66, 1127–1136. [Google Scholar] [CrossRef]
  78. Herrera, P.A.; Marazuela, M.A.; Hofmann, T. Parameter Estimation and Uncertainty Analysis in Hydrological Modeling. WIREs Water 2022, 9, e1569. [Google Scholar] [CrossRef]
Figure 1. Locations of the Varaždin and Bartolovec wellfields.
Water 17 01378 g001
Figure 2. Hydrogeological cross-section of the Varaždin aquifer [59].
Water 17 01378 g002
Figure 3. Monotonically (unitary) models of different domains.
Water 17 01378 g003
Figure 4. Scatter diagram: nitrate concentration vs. pumping rate and fitted Michaelis–Menten and Rosin–Rammler 2 increasing models.
Water 17 01378 g004
Figure 5. Dispersion diagram: nitrate concentration vs. distance from the landfill and fitted Michaelis–Menten and Hill 2 decreasing models.
Water 17 01378 g005
Table 1. Experimental data for Bartolovec wellfield (pumping rate (Q) and nitrate concentration (c)) and Varaždin wellfield (distance from the point source of pollution (h) and nitrate concentration (c)).
BartolovecVaraždin
Q (106 m3/year)c (mg/L NO3)h (km)c (mg/L NO3)
1.30313311.081.135474.14
1.90463312.501.0343975.35
3.28259117.800.9548876.7
2.62629618.300.8777480.04
2.94841619.210.9162776.71
2.85632615.660.7994981.42
2.29650216.530.6932485.92
2.40985515.370.5938987.8
2.68777916.101.5049765.03
2.72387416.001.1139571.67
2.9714318.330.8656977.4
3.19199617.881.3550168.62
4.33362819.180.5486787
4.53843619.73
4.15427121.93
3.10333820.52
08.80
Table 2. Modified and linearized monotonically increasing models.
FunctionModified ModelLinearized Model
Domain :   c ( Q ) ,  
Logistic c Q = A + ( B A ) 1 1 + C / e D · Q D Q l n C = l n c Q A l n B c ( Q )
Gompertz c Q = A + ( B A ) 1 e C / e D · Q l n C D Q = l n ln B A l n c Q A
Richards c Q = A + ( B A ) 1 1 + C / e D · Q 1 E l n C D Q = l n B A c Q A E 1
Domain :   c ( Q ) 0 ,  
Michaelis–Menten [67] c Q = A + ( B A ) Q C + Q Q C = c Q A B c ( Q )
Hill 1 [68] c Q = A + ( B A ) Q 2 C + Q 2 Q C = c Q A B c ( Q )
Hill 2 c Q = A + ( B A ) Q D C + Q D Q C 1 / D = c Q A B c ( Q ) 1 / D
Rosin–Rammler 1 [69] c Q = A + ( B A ) ( 1 1 e C · Q 2 ) Q C = ln B A l n B c ( Q )
Rosin–Rammler 2 c Q = A + ( B A ) ( 1 1 e C · Q D ) Q C 1 / D = ln B A l n B c ( Q ) 1 / D
Notes: Q—Annual pumping rate. c(Q)—Nitrate concentration as a function of Q.
Table 3. Modified and linearized monotonically decreasing models.
FunctionModified ModelLinearized Model
Domain :   c ( Q ) ,  
Logistic c h = A + ( B A ) C / e D h 1 + C / e D h D h l n C = l n B c h l n c ( h ) A )
Gompertz c h = A + ( B A ) e C / e D h 1 e C / e D h l n C D h = l n ln B A l n B c h
Richards c h = A + ( B A ) C / e D h 1 + C / e D h 1 / E D h l n C = l n B A c h A E 1
Domain :   c ( Q ) 0 ,  
Michaelis–Menten c h = A + ( B A ) C C + h C + h C = B A c h A
Hill 1 c h = A + ( B A ) C C + h 2 h C = B c h c Q A
Hill 2 c h = A + ( B A ) C C + h D h C 1 / D = B c h c h A 1 / D
Rosin–Rammler 1 c h = A + ( B A ) ( 1 e C · h 2 ) h C = ln B A l n c h A
Rosin–Rammler 2 c h = A + ( B A ) ( 1 e C · h D ) h C 1 / D = ln B A l n c h A 1 / D
Notes: h—distance between the pollution source and the groundwater sampling location. c(Q)—nitrate concentration as a function of h.
Table 4. Results of the monotonically increasing models.
FunctionABCDEKR2SSAICAICCrt
Logistic8.526220.470536.62911.6710-40.873723.583013.564316.42150.934910.202
Gompertz8.950420.88859.23581.1752-40.871723.949113.826216.68340.71813.996
Richards8.404720.433254.4400−1.74841.195250.873723.577715.560520.1759 0.87016.837
Michaelis–Menten7.991657.374612.5358--30.822233.190517.373918.97390.88507.362
Hill 18.271024.98416.8457--30.855926.903713.803915.40390.85786.464
Hill 29.030921.27483.616118.9408-40.871424.008013.867916.32510.77324.722
Rosin–Rammler 18.325521.00370.1570--30.866524.916412.499314.0993 0.84916.226
Rosin–Rammler 28.888120.31120.08792.6698-40.873823.562713.549716.40690.87707.069
tα = 2.131
Notes: A, B, C, D, E—model parameters; K—number of parameters; SS—sum of squared residuals; AIC—Akaike information criterion; AICc—corrected Akaike information criterion; R2—coefficient of determination; tt-value; —best fitting model; —worst fitting model; values in red—the critical value for the significance level of 0.05 was exceeded.
Table 5. Michaelis–Menten increasing model for the case of nitrate concentration vs. pumping rate.
ParameterEstimateStandard
Error
t-Value
df = 14
p-ValueLo. Conf
Limit
Up. Conf
Limit
A7.991831.476675.4120560.0000924.824711.1590
B57.3856246.719921.2282900.239588−42.8187157.5899
C12.5396616.065660.7805260.448078−21.917746.9971
Note: Values in red—the critical value for the significance level of 0.05 was exceeded.
Table 6. Results of the monotonically decreasing models.
FunctionABCDEKR2SSAICAICcrt
Logistic57.8916109.78704.70122.1920-40.970217.104111.566815.56680.986119.684
Gompertz59.139794.33935.89722.2277-40.970716.836011.361415.36140.985719.401
Richards38.2582145.49180.19022.78904.252850.969817.378613.773820.4404 0.88226.214
Michaelis–Menten−5.3808110.25672.3613--30.969617.49489.860412.04220.986319.830
Hill 146.352397.74481.3395--30.970616.89209.404611.5864 0.986419.904
Hill 255.205893.91191.12472.7158-40.971016.682211.242115.24210.986019.612
Rosin–Rammler 160.384596.29830.8494--30.970317.07729.546311.72820.985819.470
Rosin–Rammler 258.542897.84120.82501.8040-40.970417.035611.514615.51460.986219.757
tα = 2201
Notes: A, B, C, D, E—model parameters; K—number of parameters; SS—sum of squared residuals; AIC—Akaike information criterion; AICc—corrected Akaike information criterion; R2—coefficient of determination; tt-value; —best fitting model; —worst fitting model; values in red—the critical value for the significance level of 0.05 was exceeded.
Disclaimer/Publisher’s Note: The statements, opinions and data contained in all publications are solely those of the individual author(s) and contributor(s) and not of MDPI and/or the editor(s). MDPI and/or the editor(s) disclaim responsibility for any injury to people or property resulting from any ideas, methods, instructions or products referred to in the content.

