
Experimental Study on the Influence of Rising Water Levels on the Buoyancy of Building Structure


Abstract
1. Introduction
2. Test Scheme
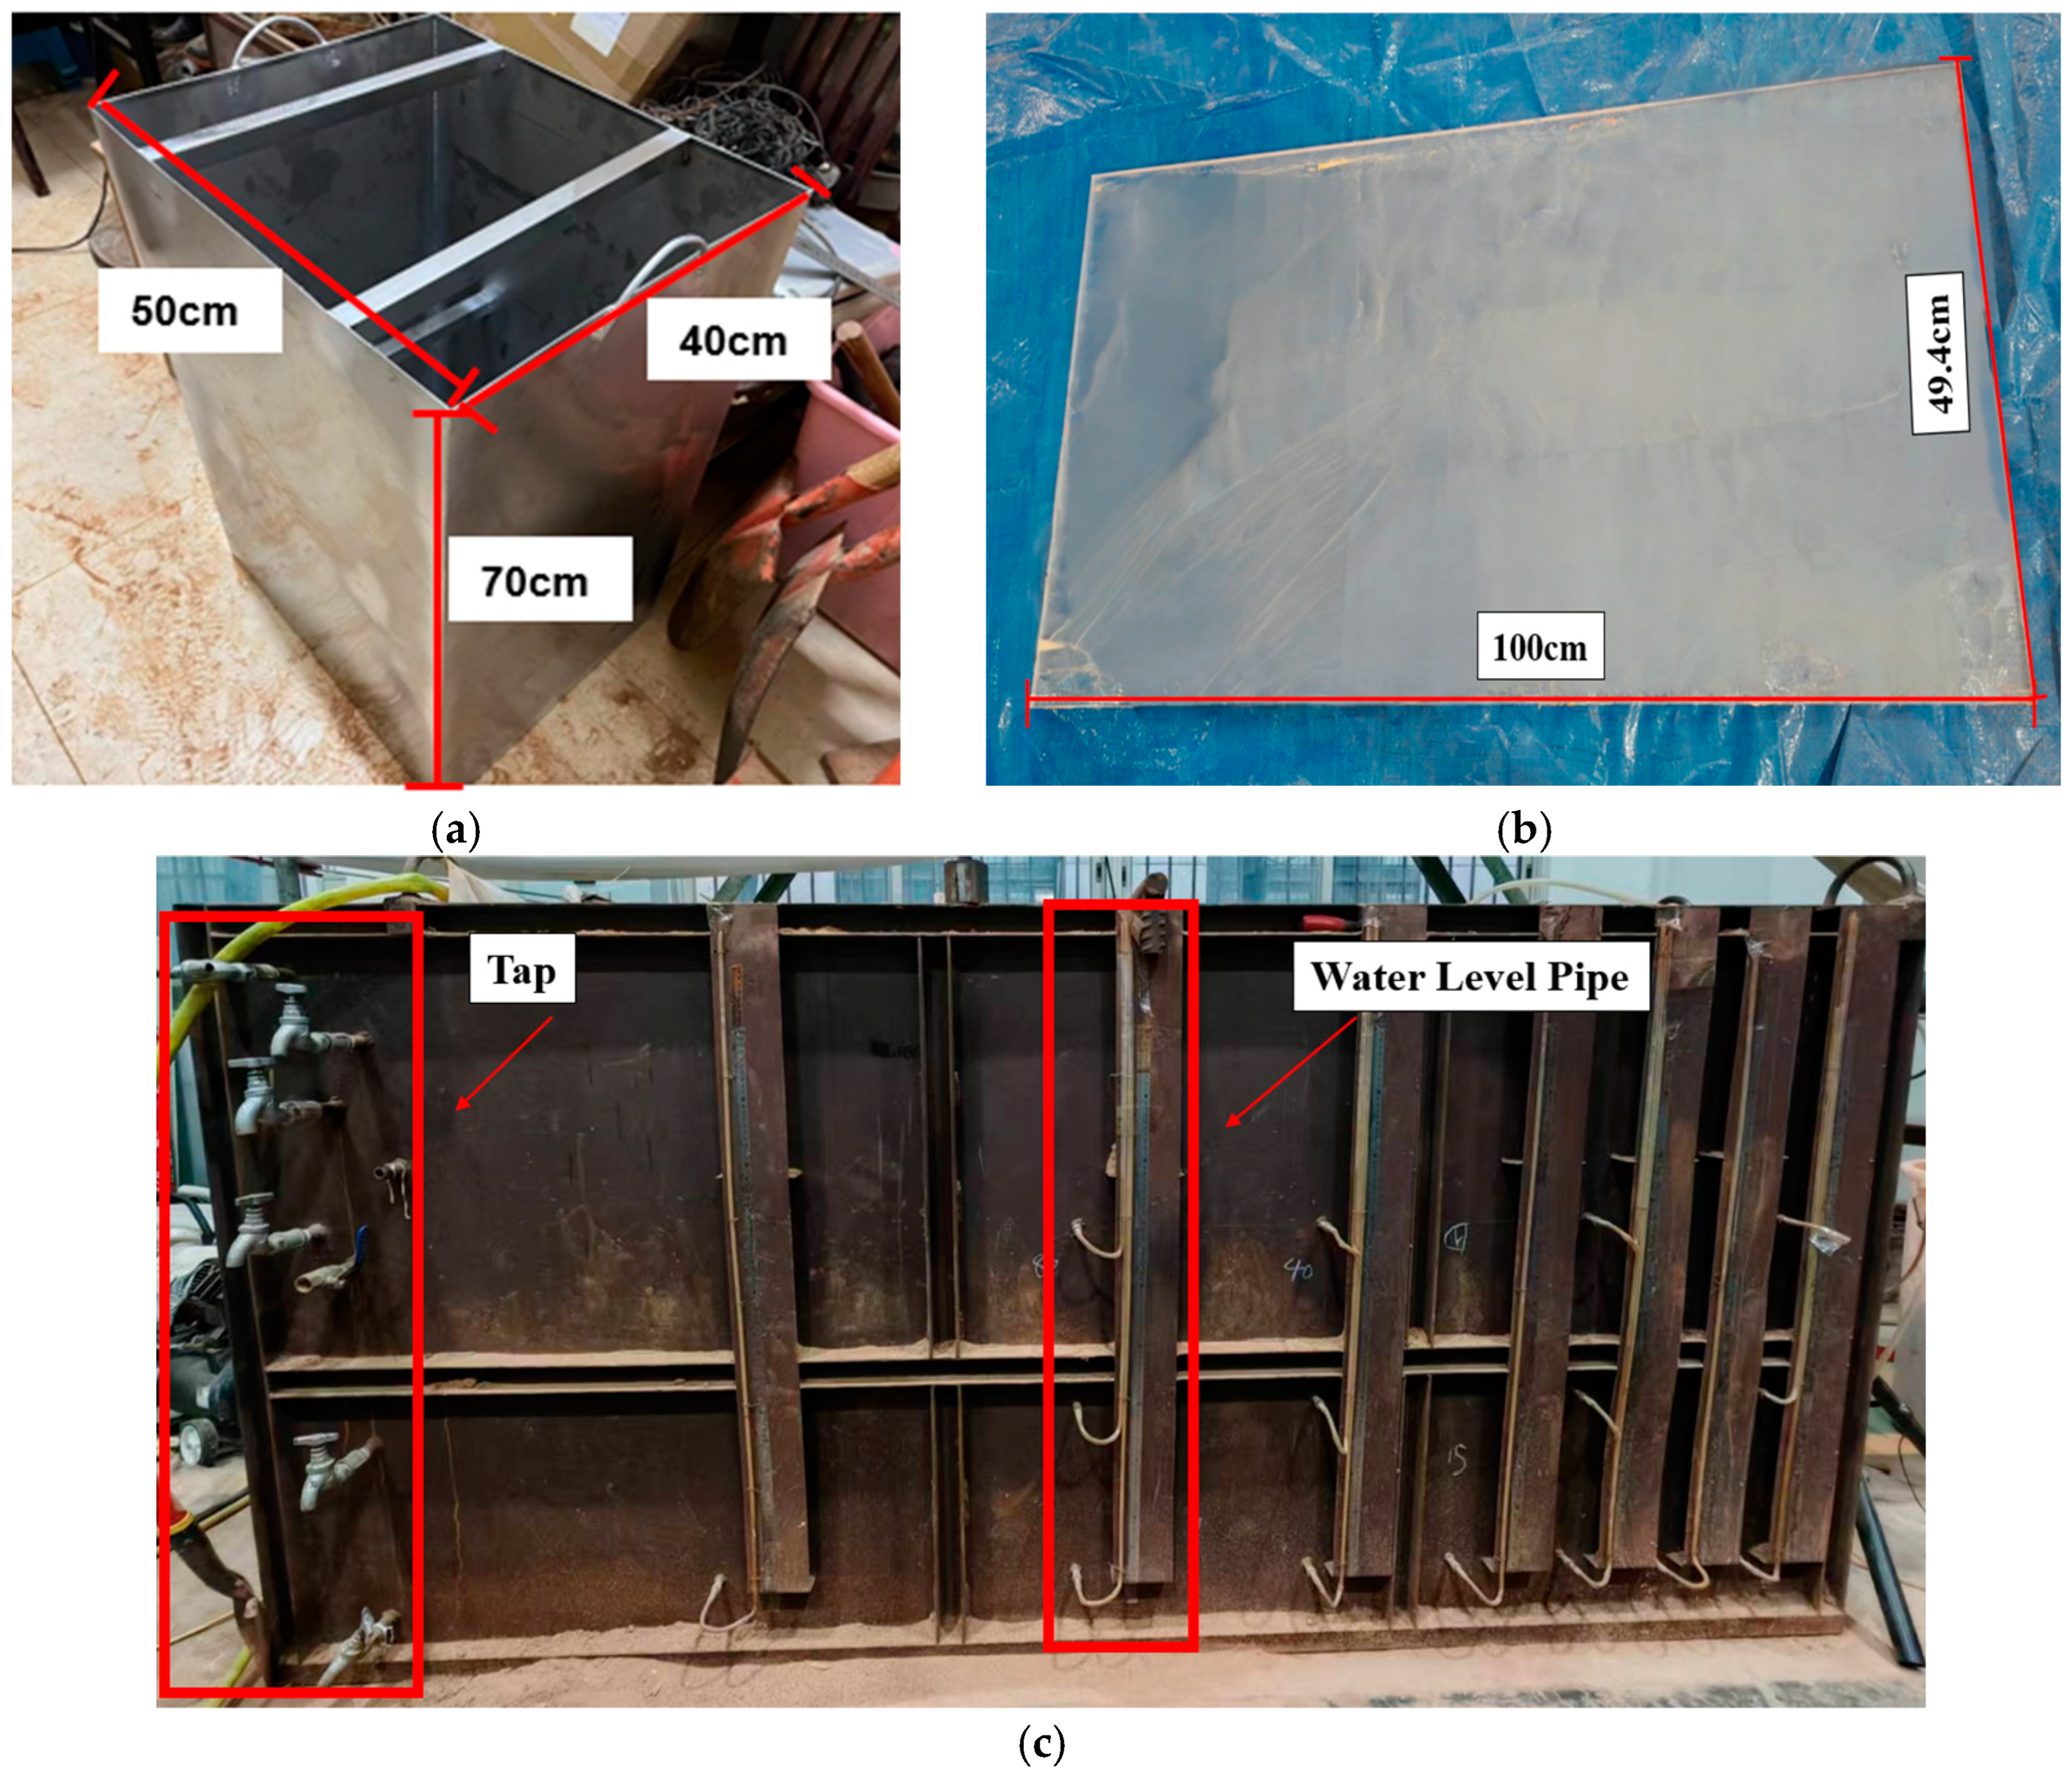
2.1. Test Equipment
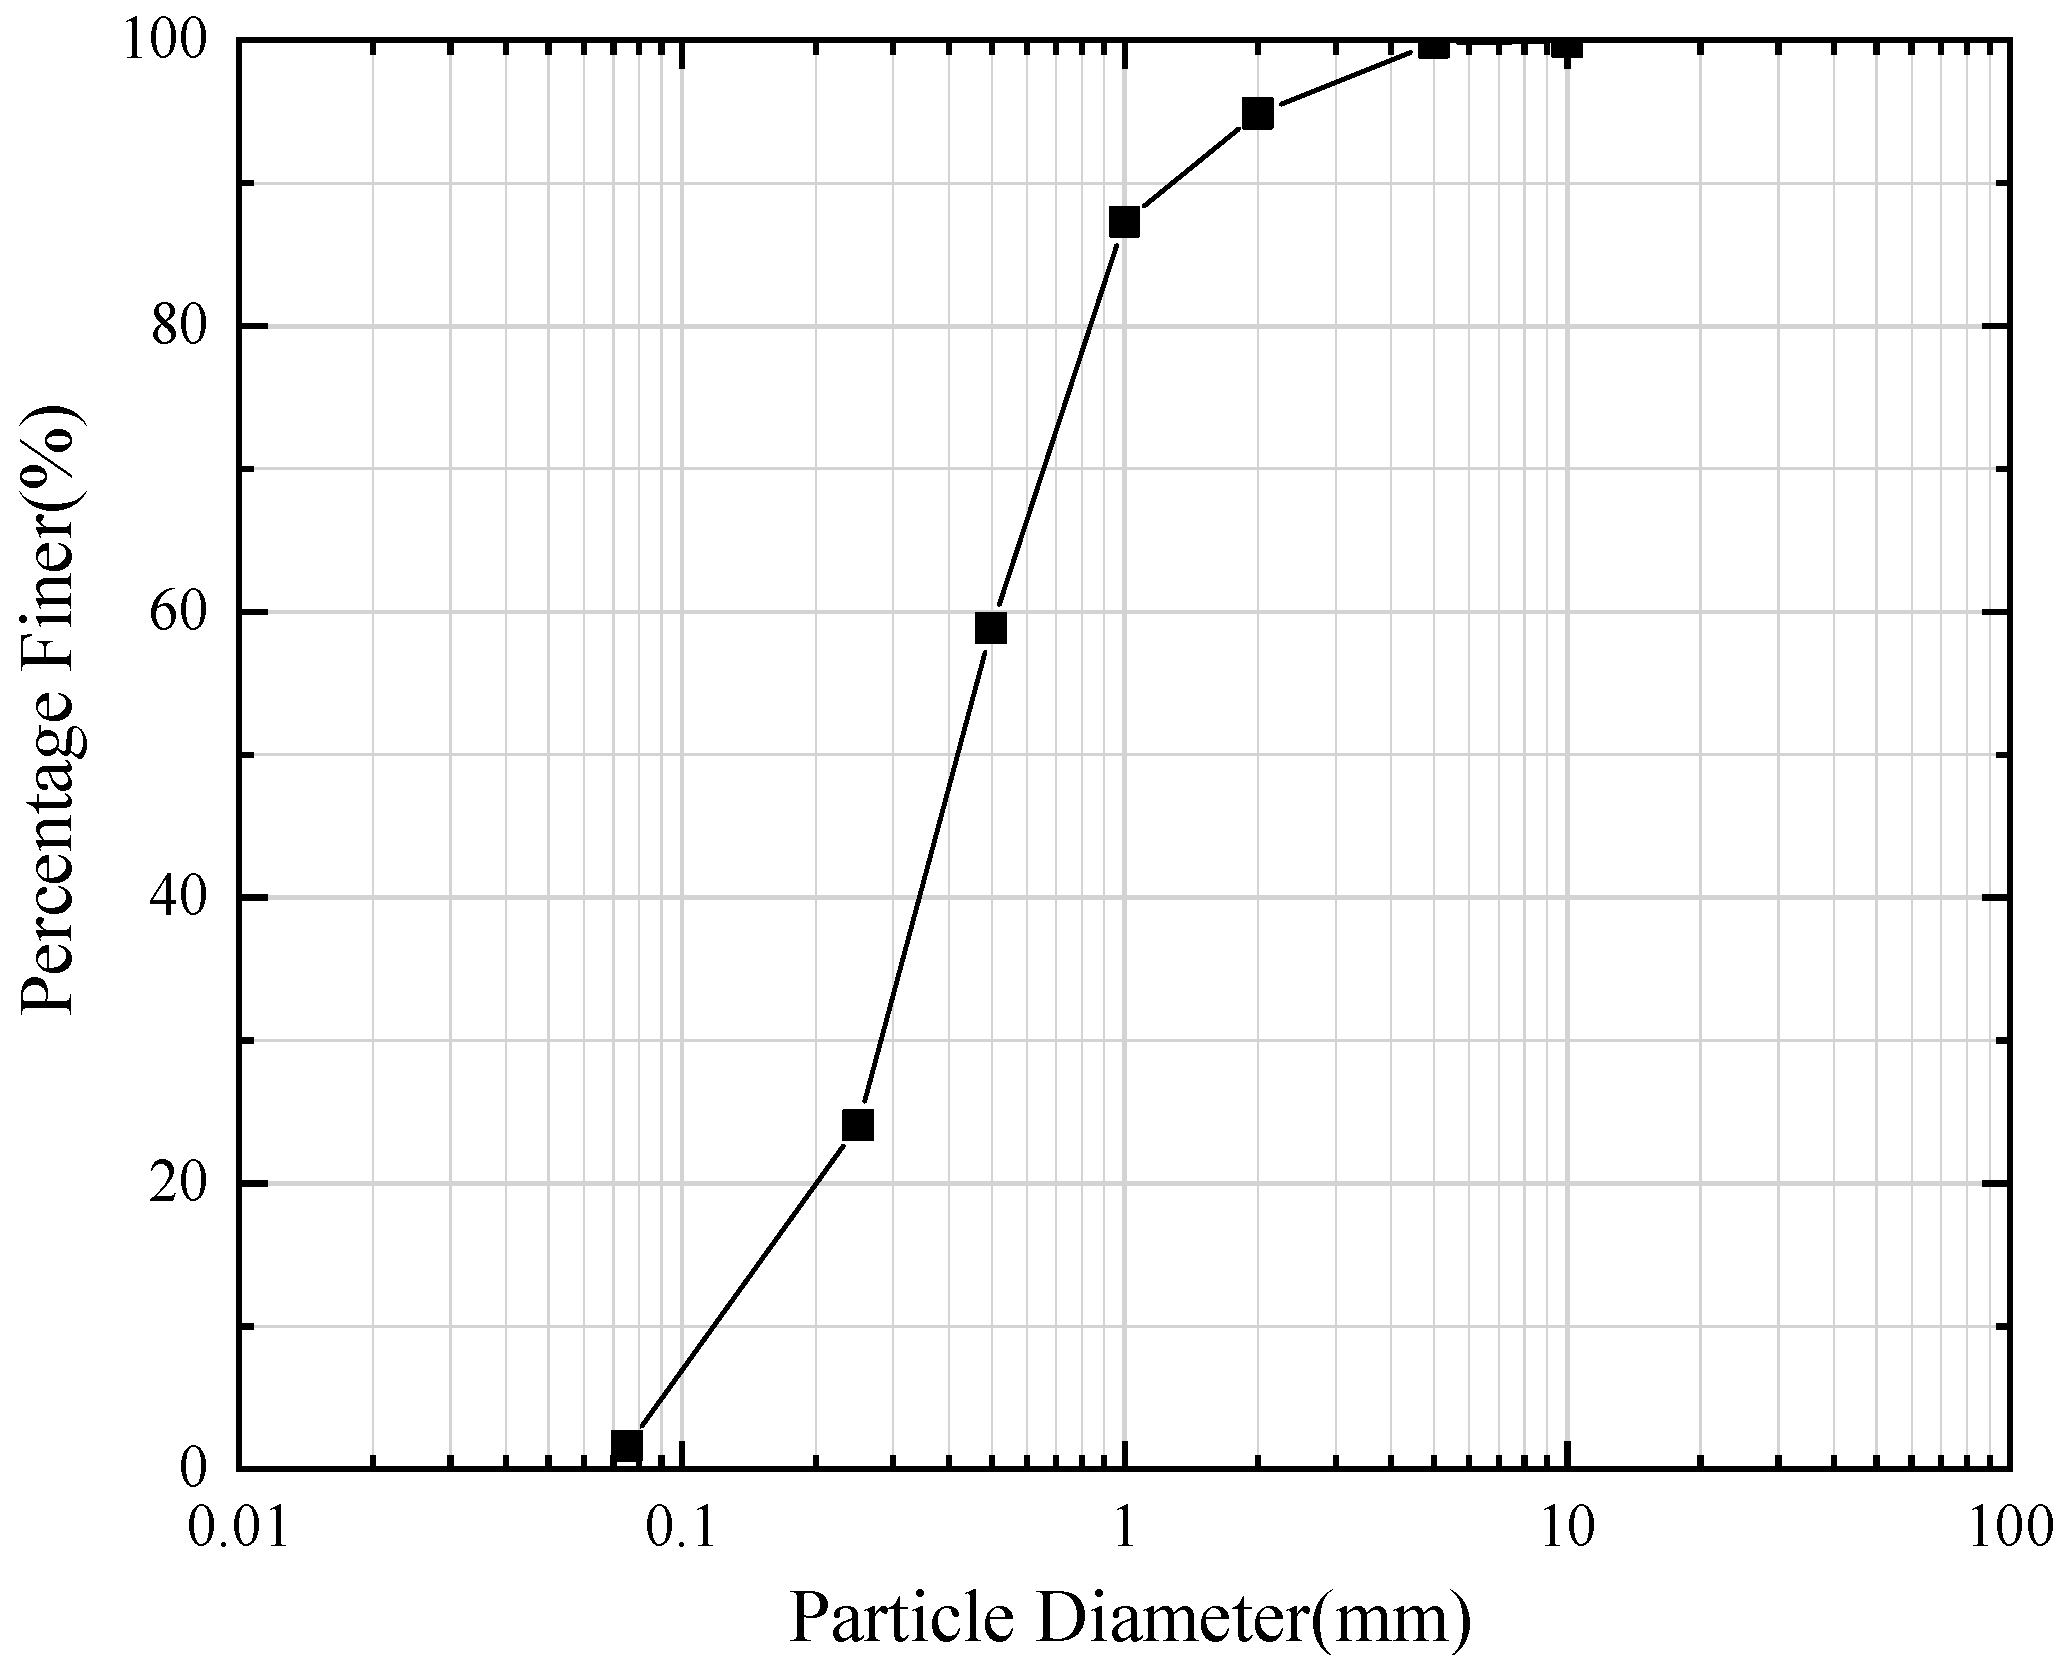
2.2. Soil Parameters and Test Conditions
2.3. Test Procedure
- (1)
- Test preparation. Before the experiment, the water and soil pressure box was put into pure water for calibration and repeated 4 times; the two sides of the barrier structure (acrylic plate) were installed with transparent water sealing film to achieve better water-blocking effect; the main structure (steel model box) was coated with vaseline and PVC film from the bottom up to 30 cm around, on the one hand to reduce the friction between the structure and the soil, on the other hand to prevent water from leaking out from the bottom corners of the structure.
- (2)
- Lay the soil and place the structure. The soil layer is laid and compacted in layers of 10cm each until the thickness reaches 70 cm. The quality of each layer of soil is controlled during the filling process, and the compacted soil density is tested with a micro-penetration instrument to ensure the similarity of the compacted soil inside the box. In addition, in the process of soil laying, they are buried and filled in strict accordance with the positions of the lower structures and measuring points in Figure 3. When the building structure is placed, the counterweight is added to it immediately and the data are recorded.
- (3)
- The soil is static and saturated. Slowly drain water from the tank until the water level reaches about 70 cm and maintain this water level all the time, waiting for 3d to saturate the soil. During this process, the L-shaped water level tube on the side of the model box is observed at regular intervals to confirm that the overall water level has reached the set state.
- (4)
- Rising water level. Start the experiment and put water into the tank. The water level starts from 70 cm and rises successively to 80 cm, 90 cm, 100 cm and 110 cm. The L-shaped water level tube, observation well and water and soil pressure box data are always observed during each water level raising process. Once the L-shaped water level gauge and soil-pressure sensors demonstrated consistent readings with less than 1% variation over a 20 min period, the system would proceed to the next stage of controlled water level elevation.
3. Results and Analysis
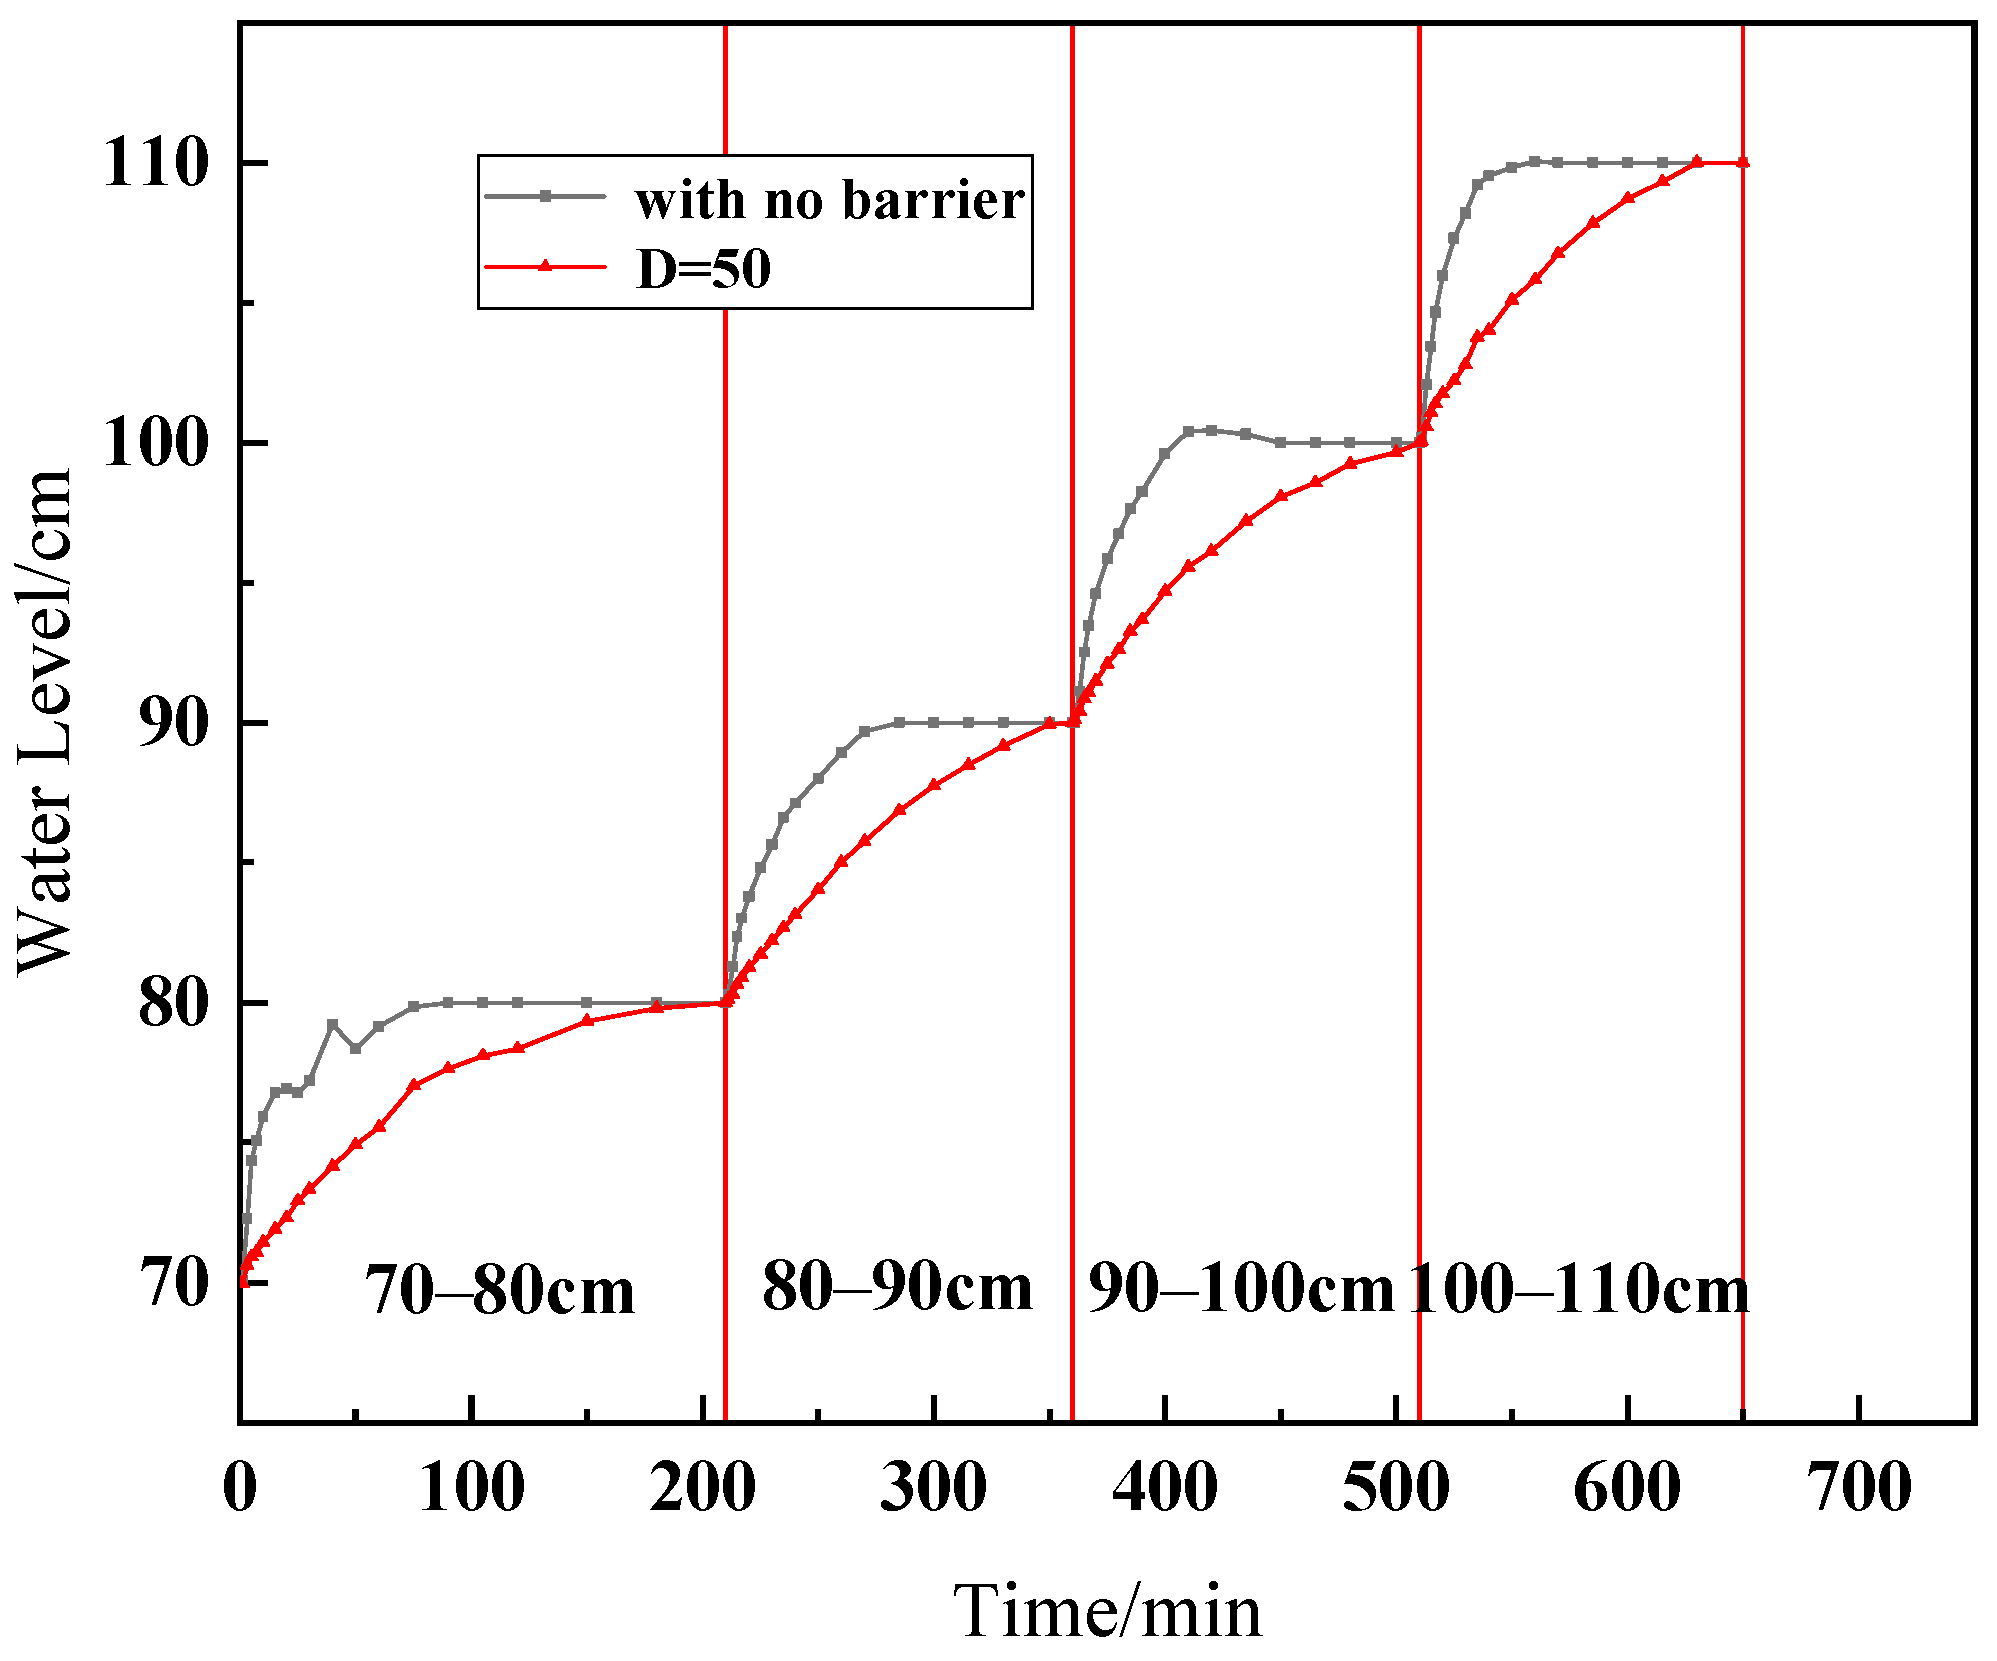
3.1. Water Level Change Process
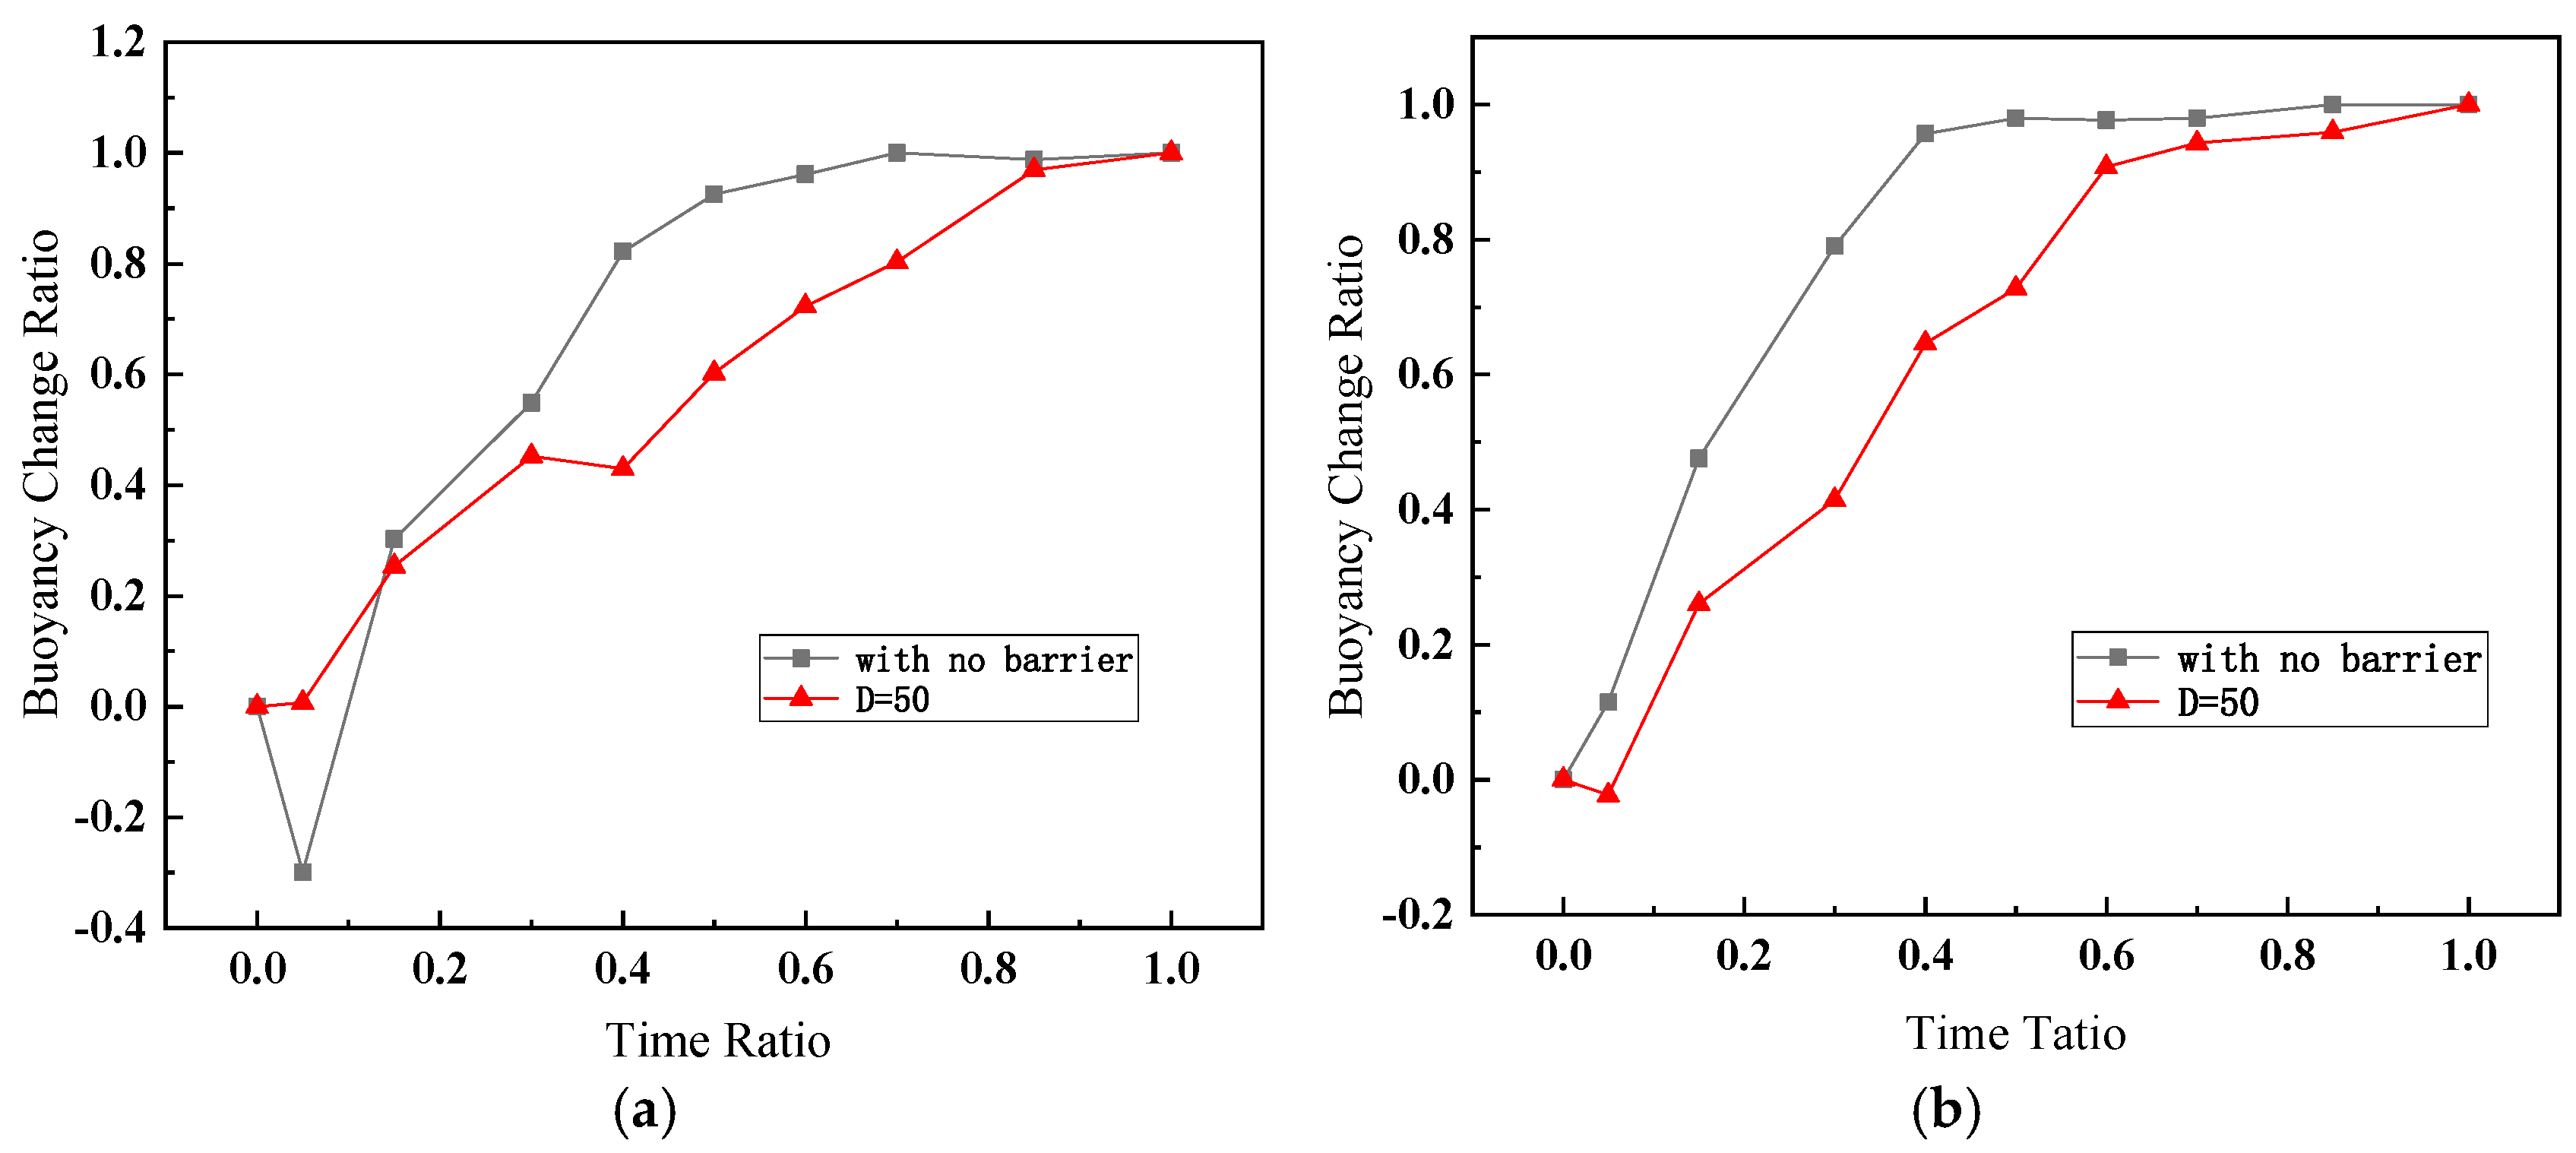
3.2. Buoyancy Change Process
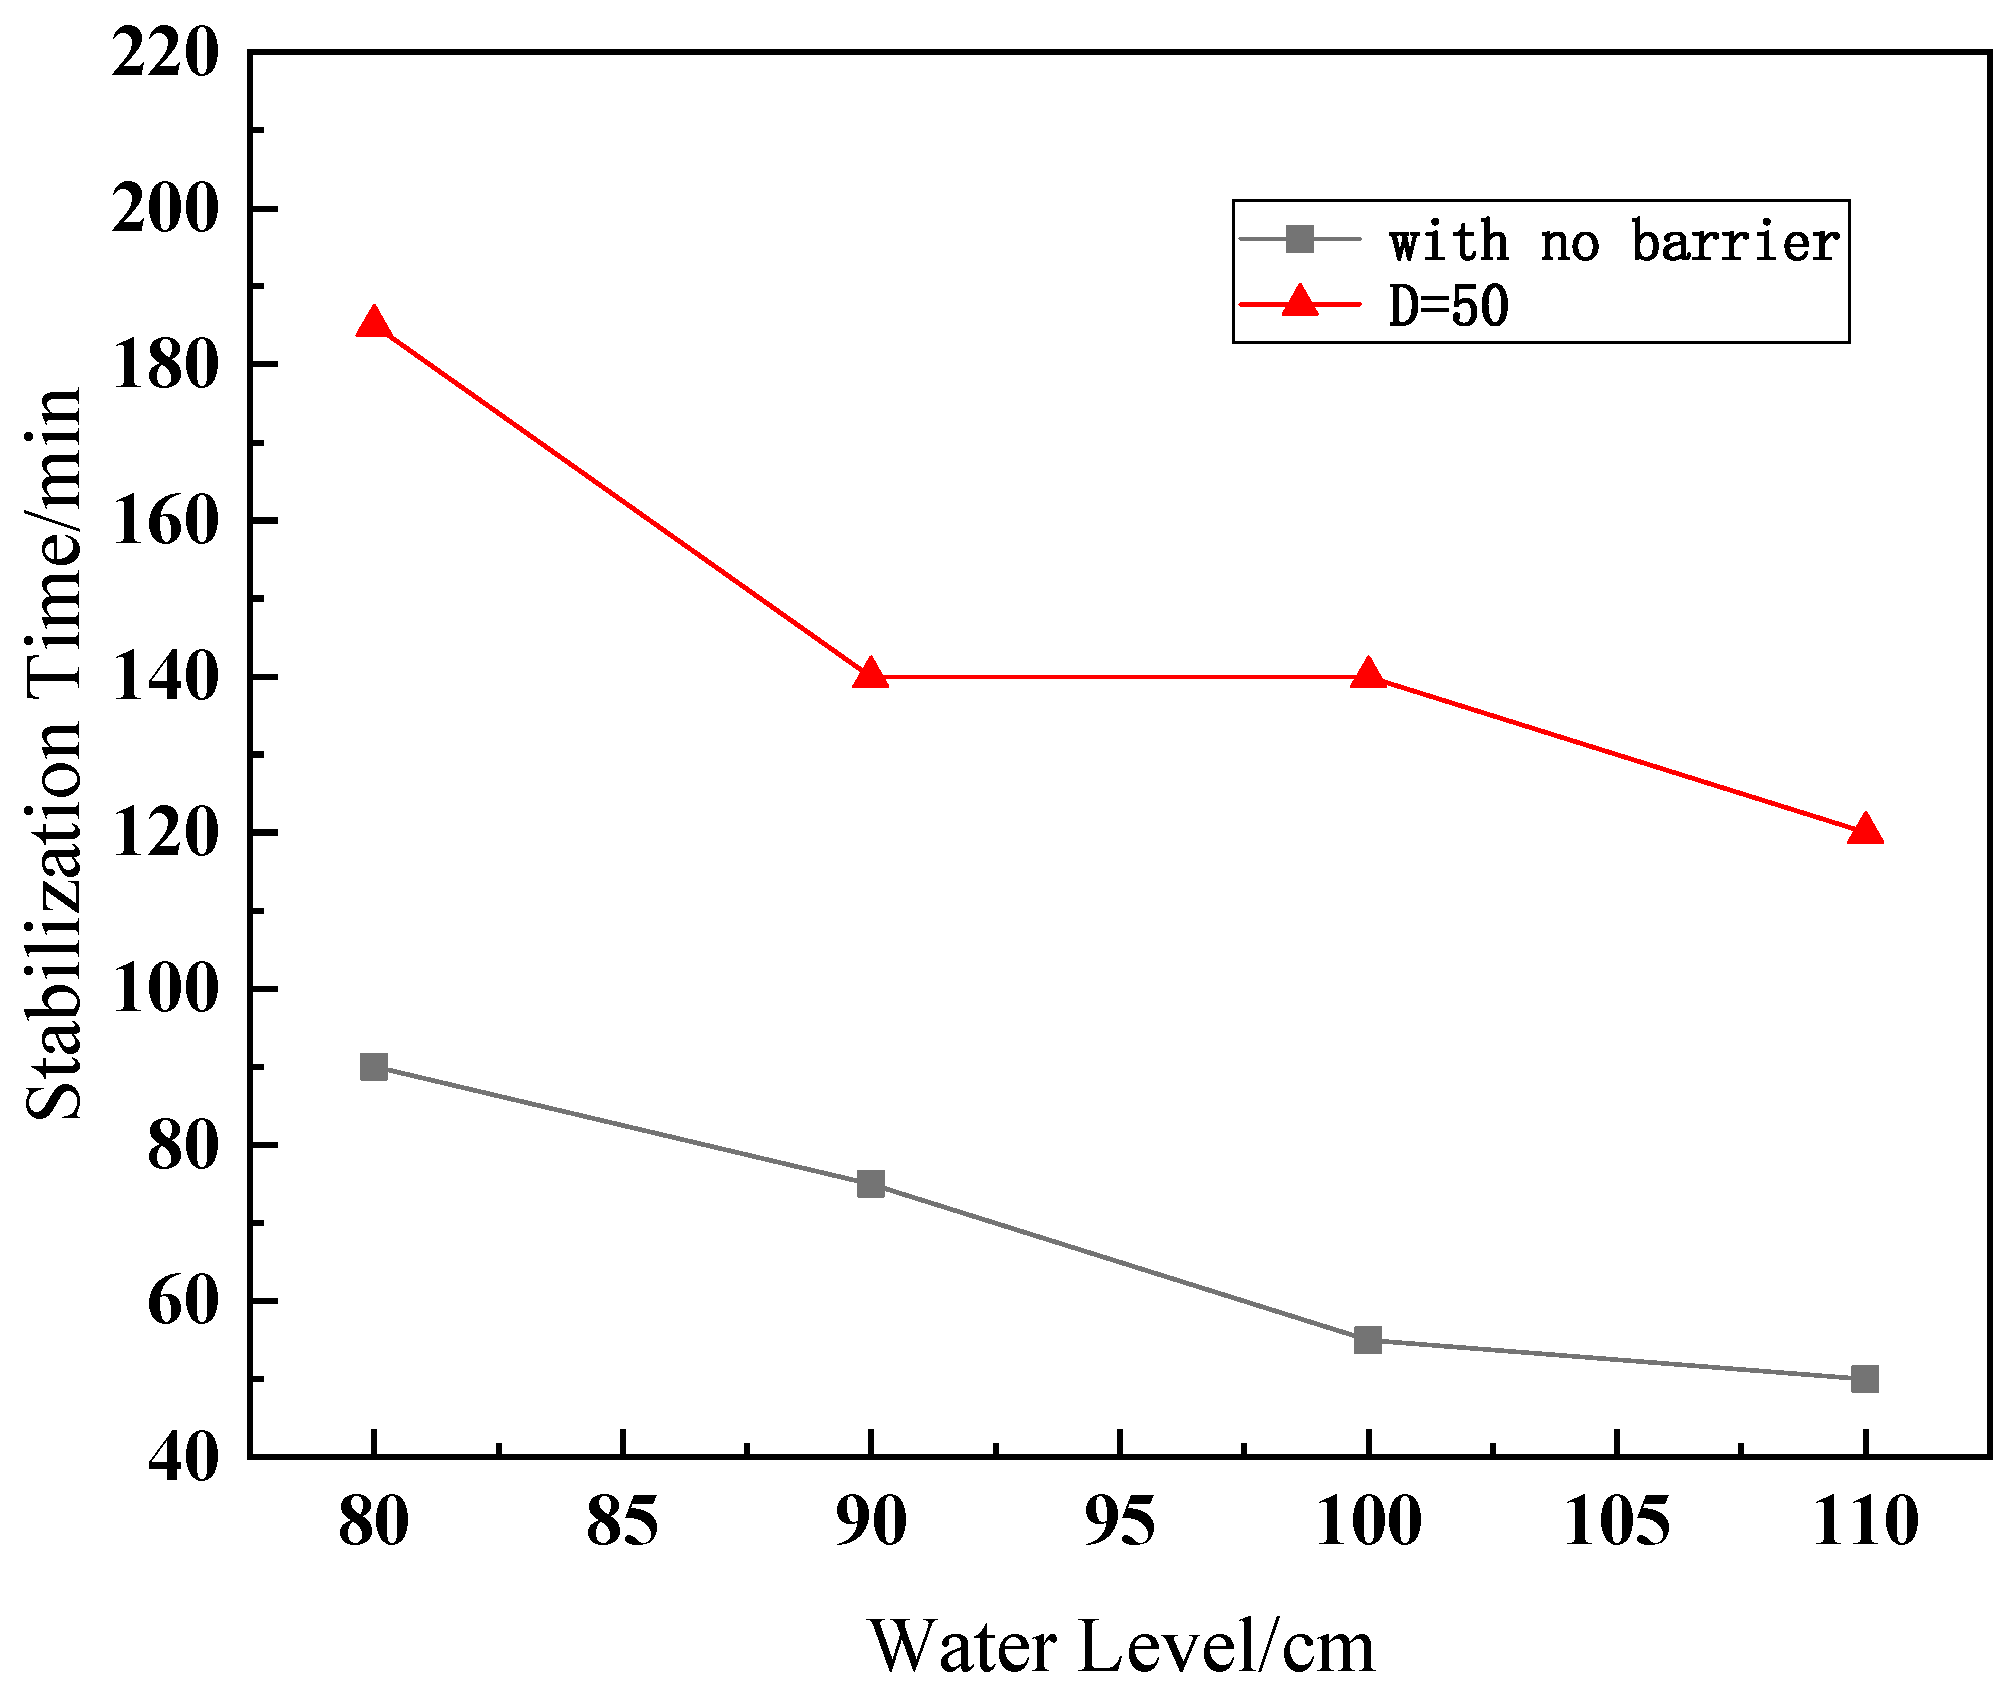
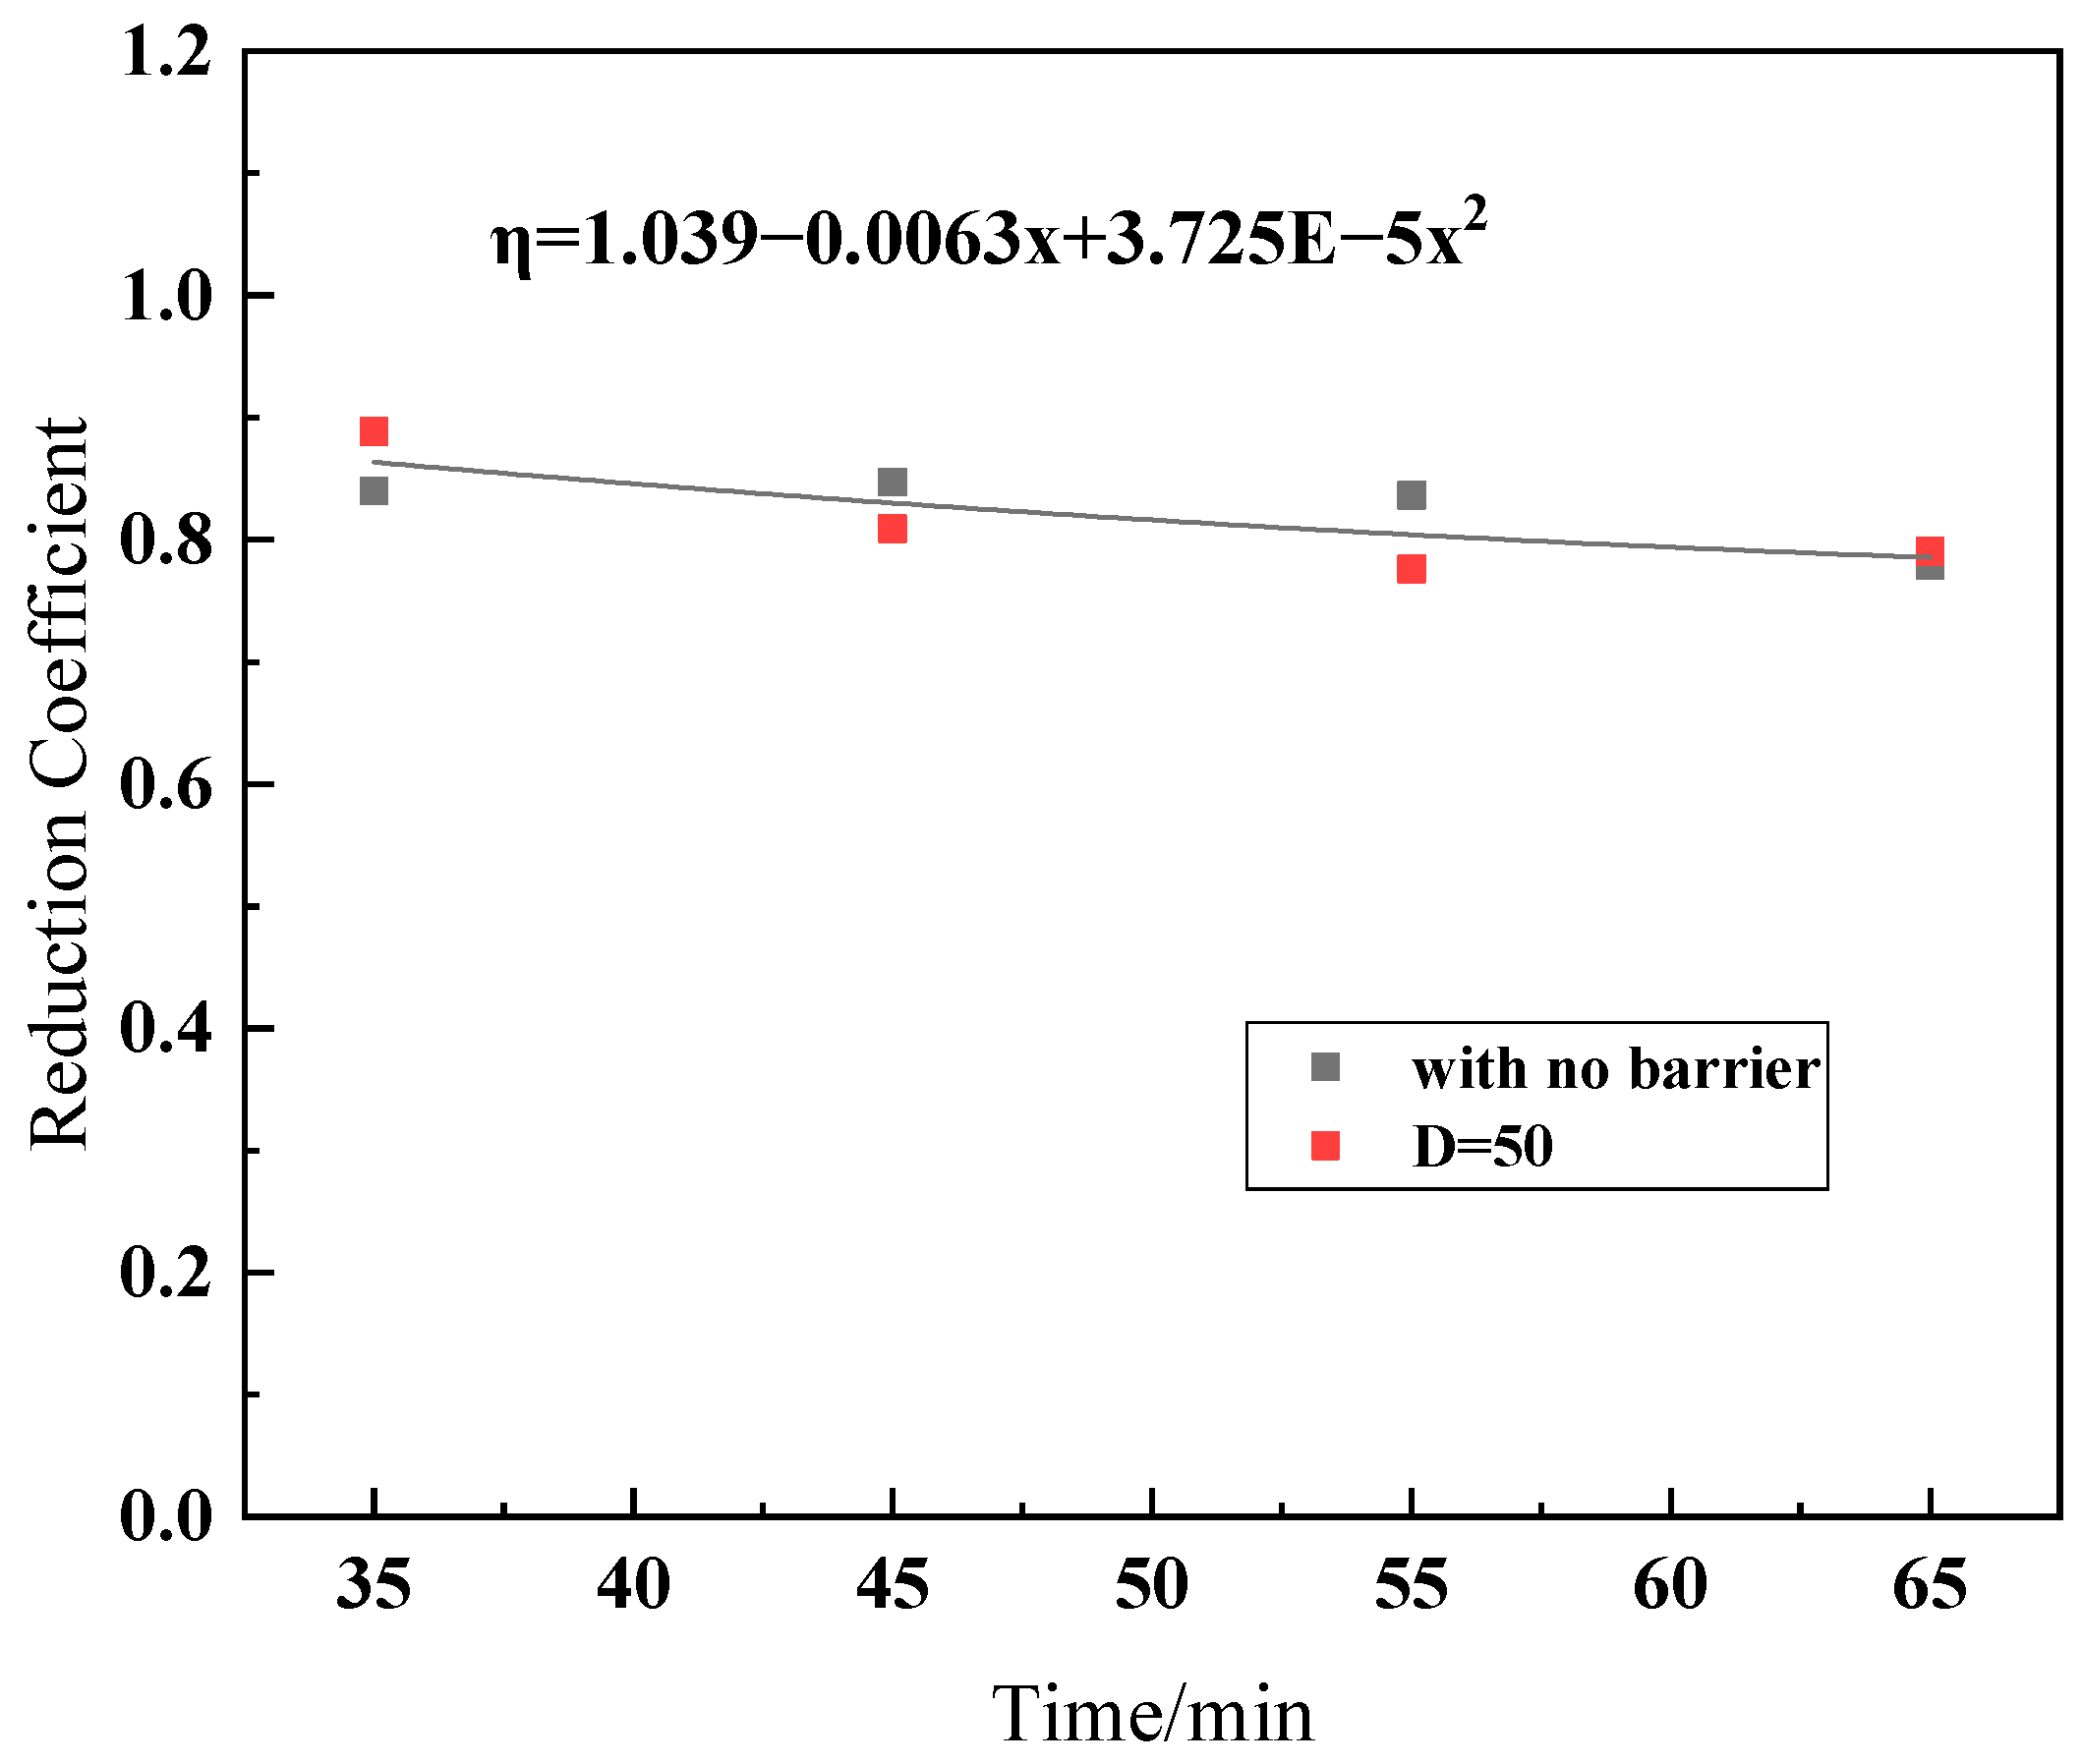
3.3. Buoyancy Attenuation Coefficient
4. Discussion
5. Conclusions
- (1)
- Under the same change of head pressure, the buoyancy growth of the structure with the barrier effect is significantly slower than that without a barrier, which indicates that the situation with other structures around the building has more sufficient time to deal with the accident of water level surge.
- (2)
- Regardless of whether there is a barrier or not, the influence rate of water level change under high head water pressure on the structural stress is much higher than that under low head water pressure. Therefore, more attention should be paid to the detection of the water levels around the building structure in practical projects to avoid engineering accidents caused by sudden changes to water levels under high head water pressure.
- (3)
- No matter whether there is a barrier or not, the pore pressure and buoyancy of the structure are basically consistent with the theoretical values based on Archimedes’ law under sandy geological conditions, with only a small amount of reduction, and the reduction coefficient is between 0.78 and 0.96.
Author Contributions
Funding
Data Availability Statement
Acknowledgments
Conflicts of Interest
References
- Zheng, G.; Ha, D.; Zeng, C.; Cheng, X.; Zhou, H.; Cao, J. Influence of the opening timing of recharge wells on settlement caused by dewatering in excavations. J. Hydrol. 2019, 573, 534–545. [Google Scholar] [CrossRef]
- Zheng, G.; Ha, D.; Loaiciga, H.; Zhou, H.; Zeng, C.; Zhang, H. Estimation of the hydraulic parameters of leaky aquifers based on pumping tests and coupled simulation/optimization: Verification using a layered aquifer in Tianjin, China. Hydrogeol. J. 2019, 27, 3081–3095. [Google Scholar] [CrossRef]
- Zeng, C.-F.; Zheng, G.; Zhou, X.-F.; Xue, X.-L.; Zhou, H.-Z. Behaviours of wall and soil during pre-excavation dewatering under different foundation pit widths. Comput. Geotech. 2019, 115, 103169. [Google Scholar] [CrossRef]
- Ni, J.C.; Cheng, W.-C.; Ge, L. A case history of field pumping tests in a deep gravel formation in the Taipei Basin, Taiwan. Eng. Geol. 2011, 117, 17–28. [Google Scholar] [CrossRef]
- Gornitz, V.; Oppenheimer, M.; Kopp, R.; Horton, R.; Orton, P.; Rosenzweig, C.; Solecki, W.; Patrick, L. Enhancing New York City’s resilience to sea level rise and increased coastal flooding. Urban Clim. 2020, 33, 100654. [Google Scholar] [CrossRef]
- Zeng, C.-F.; Zheng, G.; Xue, X.-L.; Mei, G.-X. Combined recharge: A method to prevent ground settlement induced by redevelopment of recharge wells. J. Hydrol. 2019, 568, 1–11. [Google Scholar] [CrossRef]
- Zeng, C.-F.; Zheng, G.; Xue, X.-L. Responses of deep soil layers to combined recharge in a leaky aquifer. Eng. Geol. 2019, 260, 105263. [Google Scholar] [CrossRef]
- Zeng, C.-F.; Xue, X.-L.; Zheng, G.; Xue, T.-Y.; Mei, G.-X. Responses of retaining wall and surrounding ground to pre-excavation dewatering in an alternated multi-aquifer-aquitard system. J. Hydrol. 2018, 559, 609–626. [Google Scholar] [CrossRef]
- Zeng, C.-F.; Xue, X.-L.; Li, M.-K. Use of cross wall to restrict enclosure movement during dewatering inside a metro pit before soil excavation. Tunn. Undergr. Space Technol. 2021, 112, 103909. [Google Scholar] [CrossRef]
- Zeng, C.F.; Powrie, W.; Xu, C.J.; Xue, X.L. Wall movement during dewatering inside a diaphragm wall before soil excavation. Undergr. Space 2025, 22, 355–368. [Google Scholar] [CrossRef]
- Rice, J.D.; Duncan, J.M. Findings of case histories on the long-term performance of seepage barriers in dams. J. Geotech. Geoenviron. Eng. 2010, 136, 2–15. [Google Scholar] [CrossRef]
- Attard, G.; Winiarski, T.; Rossier, Y.; Eisenlohr, L. Impact of underground structures on the flow of urban groundwater. Hydrogeol. J. 2016, 24, 5–19. [Google Scholar] [CrossRef]
- Zeng, C.-F.; Wang, S.; Xue, X.-L.; Zheng, G.; Mei, G.-X. Characteristics of ground settlement due to combined actions of groundwater drawdown and enclosure wall movement. J. Hydrol. 2022, 17, 4095–4112. [Google Scholar] [CrossRef]
- Abu-Rizaiza, O.S. Threats from groundwater table rise in urban areas in developing countries. Water Int. 1999, 24, 46–52. [Google Scholar] [CrossRef]
- Guan, X.; Madabhushi, G.S.P. Effect of water table on the behaviour of retaining walls and adjacent structures during earthquake loading. Soil Dyn. Earthq. Eng. 2025, 191, 109273. [Google Scholar] [CrossRef]
- Feng, S.-J.; Li, Y.-C.; Chen, H.; Chen, Z.-L. Response of pavement and stratified ground due to vehicle loads considering rise of water table. Int. J. Pavement Eng. 2019, 20, 191–203. [Google Scholar] [CrossRef]
- Zeng, C.-F.; Wang, S.; Xue, X.-L.; Zheng, G.; Mei, G.-X. Evolution of deep ground settlement subject to groundwater drawdown during dewatering in a multi-layered aquifer-aquitard system: Insights from numerical modelling. J. Hydrol. 2021, 603, 127078. [Google Scholar] [CrossRef]
- Zeng, C.-F.; Song, W.-W.; Xue, X.-L.; Li, M.-K.; Bai, N.; Mei, G.-X. Construction dewatering in a metro station incorporating buttress retaining wall to limit ground settlement: Insights from experimental modelling. Tunn. Undergr. Space Technol. 2021, 116, 104124. [Google Scholar] [CrossRef]
- Ha, D.; Zheng, G.; Zhou, H.; Zeng, C.; Zhang, H. Estimation of hydraulic parameters from pumping tests in a multiaquifer system. Undergr. Space 2020, 5, 210–222. [Google Scholar] [CrossRef]
- Yang, K.; Xu, C.; Zeng, C.; Zhu, L.; Xue, X.; Han, L. Analysis of Recharge Efficiency Under Barrier Effects Incurred by Adjacent Underground Structures. Water 2025, 17, 257. [Google Scholar] [CrossRef]
- Shi, J.; Ng, C.W.W.; Chen, Y. Three-dimensional numerical parametric study of the influence of basement excavation on existing tunnel. Comput. Geotech. 2015, 63, 146–158. [Google Scholar] [CrossRef]
- Xue, X.-L.; Sun, H.-Y.; Zeng, C.-F.; Chen, H.-B.; Zheng, G.; Xu, C.-J.; Han, L. Why pile-supported building settled continuously after water level was stabilized during dewatering: Clues from interaction between pile and multi aquifers. J. Hydrol. 2024, 638, 131539. [Google Scholar] [CrossRef]
- He, D.; Zeng, C.; Xu, C.; Xue, X.; Zhao, Y.; Han, L.; Sun, H. Barrier Effect of Existing Building Pile on the Responses of Groundwater and Soil During Foundation Pit Dewatering. Water 2024, 16, 2977. [Google Scholar] [CrossRef]
- Xue, T.; Xue, X.; Long, S.; Chen, Q.; Lu, S.; Zeng, C. Effect of pre-existing underground structures on groundwater flow and strata movement induced by dewatering and excavation. Water 2023, 15, 814. [Google Scholar] [CrossRef]
- Zeng, C.-F.; Liao, H.; Xue, X.-L.; Long, S.-C.; Luo, G.-J.; Diao, Y.; Li, M.-G. Responses of groundwater and soil to dewatering considering the barrier effect of adjacent metro station on multi-aquifers. J. Hydrol. 2022, 612, 128117. [Google Scholar] [CrossRef]
- Chen, R.; Meng, F.; Li, Z.; Ye, Y.; Ye, J. Investigation of response of metro tunnels due to adjacent large excavation and protective measures in soft soils. Tunn. Undergr. Space Technol. 2016, 58, 224–235. [Google Scholar] [CrossRef]
- Bikçe, M.; Örnek, M.; Cansız, Ö.F. The effect of buoyancy force on structural damage: A case study. Eng. Fail. Anal. 2018, 92, 553–565. [Google Scholar] [CrossRef]
- Acosta-Martinez, H.E.; Gourvenec, S.M.; Randolph, M.F. An experimental investigation of a shallow skirted foundation under compression and tension. Soils Found. 2008, 48, 247–254. [Google Scholar] [CrossRef]
- Chian, S.; Madabhushi, S. Effect of buried depth and diameter on uplift of underground structures in liquefied soils. Soil Dyn. Earthq. Eng. 2012, 41, 181–190. [Google Scholar] [CrossRef]
- Huang, Y.; Yu, M. Review of soil liquefaction characteristics during major earthquakes of the twenty-first century. Nat. Hazards 2013, 65, 2375–2384. [Google Scholar] [CrossRef]
- Kosekt, J.; Matsuo, O.; Koga, Y. Uplift behavior of underground structures caused by liquefaction of surrounding soil during earthquake. Soils Found. 1997, 37, 97–108. [Google Scholar] [CrossRef]
- Wong, I. Methods of resisting hydrostatic uplift in substructures. Tunn. Undergr. Space Technol. 2001, 16, 77–86. [Google Scholar] [CrossRef]
- Zhang, D. Experimental Study on Anti-Floating of Underground Structures. Master’s Thesis, Shanghai Jiaotong University, Shanghai, China, 2007. [Google Scholar]
- Li, G. Some problems about principle of effective stress. Chin. J. Geotech. Eng. 2011, 33, 315–320. [Google Scholar]
- Ni, P.; Mei, G.; Zhao, Y. Antiflotation design for water tank using pressure relief technique. Mar. Georesour. Geotechnol. 2018, 36, 471–483. [Google Scholar] [CrossRef]
- Jackson, D.C. It Is a Crime to Design a Dam without Considering upward Pressure: Engineers and Uplift, 1890–1930. In Henry PG Darcy and Other Pioneers in Hydraulics; ASCE Library: Reston, VA, USA, 2003; pp. 220–232. [Google Scholar]
- Liu, G.; Jia, P.; Sun, J.; Jiang, Z.; Yang, F.; Yang, G.; Shao, G. Research and application of new anti-floating anchor in anti-floating reinforcement of existing underground structures. Front. Earth Sci. 2024, 12, 1364752. [Google Scholar] [CrossRef]
- Kong, D.; Guan, Y.; Yuan, H. Study on the anti-floating water level of the underground structure’s comprehensive anti-floating. Structures 2023, 56, 104921. [Google Scholar] [CrossRef]
- Yibin, L.; Jibin, C.; Yuanyuan, W.; Pan, S. Anti-floating failure mechanism of underground structures in expansive soil area and application of active anti-floating measures. Hydrogeol. Eng. Geol. 2022, 49, 64–73. [Google Scholar]
- Luo, G.; Yang, F.; Li, H.; Pan, H.; Cao, H. Simplified Calculation Method for Active Anti-Floating of Elliptical Basements by Relief Wells. Appl. Sci. 2023, 13, 12647. [Google Scholar] [CrossRef]
- Sun, W.; Liu, H.; Zhang, W.; Liu, S.; Gao, X. Investigation on overburden thickness considering face and anti-floating stability of shallow shield tunnel. Comput. Geotech. Res. 2023, 160, 105562. [Google Scholar] [CrossRef]
- Kou, H.-l.; Guo, W.; Zhang, M.-Y. Pullout performance of GFRP anti-floating anchor in weathered soil. Tunn. Undergr. Space Technol. 2015, 49, 408–416. [Google Scholar] [CrossRef]
- Yang, M.; Wu, J.; Lu, Q.; Li, P. Optimization of Uplift Piles for a Base Plate Considering Local Anti-Floating Stability. Appl. Sci. 2024, 14, 5000. [Google Scholar] [CrossRef]
- Huang, Q.; Wang, J.; Li, M.; Fei, M.; Dong, J. Modeling the influence of urbanization on urban pluvial flooding: A scenario-based case study in Shanghai, China. Nat. Hazards 2017, 87, 1035–1055. [Google Scholar] [CrossRef]
- Boltton, M.; Stewart, D. The effect on propped diaphragm walls of rising groundwater in stiff clay. Géotechnique 1994, 44, 111–127. [Google Scholar] [CrossRef]
- Lee, F.; Juneja, A.; Tan, T. Stress and pore pressure changes due to sand compaction pile installation in soft clay. Géotechnique 2004, 54, 1–16. [Google Scholar] [CrossRef]
- Li, M.-G.; Chen, J.-J.; Xu, Y.-S.; Tong, D.-G.; Cao, W.-W.; Shi, Y.-J. Effects of groundwater exploitation and recharge on land subsidence and infrastructure settlement patterns in Shanghai. Eng. Geol. 2021, 282, 105995. [Google Scholar] [CrossRef]
- López-Fernández, C.; Prieto, D.A.; Fernández-Viejo, G.; Pando, L.; Fernández, E.C. Surface subsidence induced by groundwater drainage tunneling in granite residual soils (Burata Railway Tunnel, Spain). J. Geotech. Geoenviron. Eng. 2013, 139, 821–824. [Google Scholar] [CrossRef]
- Schwamb, T.; Elshafie, M.Z.; Soga, K.; Mair, R.J. Considerations for monitoring of deep circular excavations. Proc. Inst. Civ. Eng. Geotech. Eng. 2016, 169, 477–493. [Google Scholar] [CrossRef]
- Wang, J.; Wu, Y.; Liu, X.; Yang, T.; Wang, H.; Zhu, Y. Areal subsidence under pumping well–curtain interaction in subway foundation pit dewatering: Conceptual model and numerical simulations. Env. Earth Sci. 2016, 75, 198. [Google Scholar] [CrossRef]
- Figueroa-Miranda, S.; Tuxpan-Vargas, J.; Ramos-Leal, J.A.; Hernández-Madrigal, V.M.; Villaseñor-Reyes, C.I. Land subsidence by groundwater over-exploitation from aquifers in tectonic valleys of Central Mexico: A review. Eng. Geol. 2018, 246, 91–106. [Google Scholar] [CrossRef]
- Motagh, M.; Shamshiri, R.; Haghighi, M.H.; Wetzel, H.-U.; Akbari, B.; Nahavandchi, H.; Roessner, S.; Arabi, S. Quantifying groundwater exploitation induced subsidence in the Rafsanjan plain, southeastern Iran, using InSAR time-series and in situ measurements. Eng. Geol. 2017, 218, 134–151. [Google Scholar] [CrossRef]
- Ou, C.-Y.; Liao, J.-T.; Cheng, W.-L. Building response and ground movements induced by a deep excavation. Geotechnique 2000, 50, 209–220. [Google Scholar] [CrossRef]
- Hu, W.; Wang, Y.; Li, H.; Huang, M.; Hou, M.; Li, Z.; She, D.; Si, B. Dominant role of climate in determining spatio-temporal distribution of potential groundwater recharge at a regional scale. J. Hydrol. 2019, 578, 124042. [Google Scholar] [CrossRef]
- Oo, K.T.; Haishan, C.; Jonah, K. Climate Change Impact on the Trigger of Natural Disasters over South-Eastern Himalayas Foothill Region of Myanmar: Extreme Rainfall Analysis. Int. J. Geophys. 2023, 2023, 2186857. [Google Scholar] [CrossRef]
- Walia, D. Rainfall Induced Landslide Hazards and Forecast under Changing Climatic Patterns and Associated Adaptations. In Climate Change in India; CRC Press: Boca Raton, FL, USA, 2024; pp. 144–173. [Google Scholar]
- Wang, Y.; Hu, Y.; Wang, H.; Luo, J.; Hou, D. Extreme rainfall effects on water table dynamics and surface water-groundwater interactions: Insights from a semiarid alluvial fan in Northern China. J. Hydrol. 2025, 657, 133157. [Google Scholar] [CrossRef]
- Wittenberg, H.; Aksoy, H.; Miegel, K. Fast response of groundwater to heavy rainfall. J. Hydrol. 2019, 571, 837–842. [Google Scholar] [CrossRef]
- Tsuchida, T.; Athapaththu, A.; Hanaoka, T.; Kawaguchi, M. Investigation of landslide calamity due to torrential rainfall in Shobara City, Japan. Soils Found. 2015, 55, 1305–1317. [Google Scholar] [CrossRef]
- Chowdhuri, I.; Pal, S.C.; Chakrabortty, R.; Malik, S.; Das, B.; Roy, P. Torrential rainfall-induced landslide susceptibility assessment using machine learning and statistical methods of eastern Himalaya. Nat. Hazards 2021, 107, 697–722. [Google Scholar] [CrossRef]
- Chen, L.; Wang, W.; Bu, A. Numerical Simulation Study of Basement Water Discharge Pressure Relief Method under Rainstorm Conditions. Buildings 2023, 13, 2772. [Google Scholar] [CrossRef]
- Fowler, H.J.; Lenderink, G.; Prein, A.F.; Westra, S.; Allan, R.P.; Ban, N.; Barbero, R.; Berg, P.; Blenkinsop, S.; Do, H.X. Anthropogenic intensification of short-duration rainfall extremes. Nat. Rev. Earth Environ. 2021, 2, 107–122. [Google Scholar] [CrossRef]
- Abancó, C.; Hürlimann, M.; Moya, J.; Berenguer, M. Critical rainfall conditions for the initiation of torrential flows. Results from the Rebaixader catchment (Central Pyrenees). J. Hydrol. 2016, 541, 218–229. [Google Scholar] [CrossRef]
- Wasko, C.; Nathan, R.; Stein, L.; O’Shea, D. Evidence of shorter more extreme rainfalls and increased flood variability under climate change. J. Hydrol. 2021, 603, 126994. [Google Scholar] [CrossRef]
- Mao, X.; Enot, P.; Barry, D.A.; Li, L.; Binley, A.; Jeng, D.-S. Tidal influence on behaviour of a coastal aquifer adjacent to a low-relief estuary. J. Hydrol. 2006, 327, 110–127. [Google Scholar] [CrossRef]
- Saucier, F.J.; Chassé, J. Tidal circulation and buoyancy effects in the St. Lawrence Estuary. Atmos. Ocean 2000, 38, 505–556. [Google Scholar] [CrossRef]
- Zheng, L.; Weisberg, R.H. Tide, buoyancy, and wind-driven circulation of the Charlotte Harbor estuary: A model study. J. Geophys. Res. Ocean. 2004, 109. [Google Scholar] [CrossRef]
- Münchow, A.; Garvine, R.W. Dynamical properties of a buoyancy-driven coastal current. J. Geophys. Res. Ocean. 1993, 98, 20063–20077. [Google Scholar] [CrossRef]
- Preusse, P.; Eckermann, S.; Oberheide, J.; Hagan, M.; Offermann, D. Modulation of gravity waves by tides as seen in CRISTA temperatures. Adv. Space Res. 2001, 27, 1773–1778. [Google Scholar] [CrossRef]
- Herman, J.P.; Tsegaye, S.; Missimer, T.M. Evaluating Stormwater Infiltration Systems in High Water Table Areas: Insights from Southwest Florida. Water 2024, 16, 3198. [Google Scholar] [CrossRef]
- Luo, C.-Y.; Shen, S.-L.; Han, J.; Ye, G.-L.; Horpibulsuk, S. Hydrogeochemical environment of aquifer groundwater in Shanghai and potential hazards to underground infrastructures. Nat. Hazards 2015, 78, 753–774. [Google Scholar] [CrossRef]
- Tariq Amin Chaudhary, M. Implications of rising groundwater level on structural integrity of underground structures–investigations and retrofit of a large building complex. Struct. Surv. 2012, 30, 111–129. [Google Scholar] [CrossRef]
- Liu, H.; Song, E. Working mechanism of cutoff walls in reducing uplift of large underground structures induced by soil liquefaction. Comput. Geotech. 2006, 33, 209–221. [Google Scholar] [CrossRef]
- Zeng, C.-F.; Powrie, W.; Xue, X.-L.; Li, M.-K.; Mei, G.-X. Effectiveness of a buttress wall in reducing retaining wall movement during dewatering before bulk excavation. Acta Geotech. 2021, 16, 3253–3267. [Google Scholar] [CrossRef]
- Zeng, C.-F.; Powrie, W.; Chen, H.-B.; Wang, S.; Diao, Y.; Xue, X.-L. Ground behavior due to dewatering inside a foundation pit considering the barrier effect of preexisting building piles on aquifer flow. J. Geotech. Geoenviron. Eng. 2024, 150, 05024004. [Google Scholar] [CrossRef]
- Zeng, C.-F.; Chen, H.-B.; Liao, H.; Xue, X.-L.; Chen, Q.-N.; Diao, Y. Behaviours of groundwater and strata during dewatering of large-scale excavations with a nearby underground barrier. J. Hydrol. 2023, 620, 129400. [Google Scholar] [CrossRef]
- Terzaghi, K. Theoretical Soil Mechanics; Wiley: Hoboken, NJ, USA, 1943. [Google Scholar]
- Kaul, K. Cut-and-Cover Metro Structures: Geo-Structural Design: An Integrated Approach; CRC Press: Boca Raton, FL, USA, 2010. [Google Scholar]
- Piazza, R.; Buzzaccaro, S.; Secchi, E.; Parola, A. What buoyancy really is. A generalized Archimedes’ principle for sedimentation and ultracentrifugation. Soft Matter 2012, 8, 7112–7115. [Google Scholar] [CrossRef]
- Bear, J. Hydraulics of Groundwater; Courier Corporation: New York, NY, USA, 1979. [Google Scholar]
- Eid, H.T. Bearing capacity and settlement of skirted shallow foundations on sand. Int. J. Geomech. 2013, 13, 645–652. [Google Scholar] [CrossRef]
- Guo, H.; Zhou, R.; Sun, C.; Lin, Y.; Xie, J. Buoyancy of underground structures and pore water pressure conduction law in silty clay strata. Heliyon 2024, 10, e24256. [Google Scholar] [CrossRef]
- Hu, Z.; Yang, Z.; Wilkinson, S.P. Analysis of passive earth pressure modification due to seepage flow effects. Can. Geotech. J. 2018, 55, 666–679. [Google Scholar] [CrossRef]
- Kolay, P.; Kumar, S.; Tiwari, D. Improvement of bearing capacity of shallow foundation on geogrid reinforced silty clay and sand. J. Constr. Eng. 2013, 2013, 293809. [Google Scholar] [CrossRef]
- Luke, A.M.; Rauch, A.F.; Olson, R.E.; Mecham, E.C. Components of suction caisson capacity measured in axial pullout tests. Ocean Eng. 2005, 32, 878–891. [Google Scholar] [CrossRef]
- Ni, P.; Kang, X.; Song, L.; Mei, G.; Zhao, Y. Model tests of buoyant force on underground structures. J. Test. Eval. 2019, 47, 1216–1235. [Google Scholar] [CrossRef]
- Ren, Z.; Lu, Q.; Liu, K.; Ni, P.; Mei, G. Model-scale tests to examine water pressures acting on potentially buoyant underground structures in clay strata. J. Rock Mech. Geotech. Eng. 2022, 14, 861–872. [Google Scholar] [CrossRef]
- Santos, P.J.; Barros, P.L. Active earth pressure due to soil mass partially subjected to water seepage. Can. Geotech. J. 2015, 52, 1886–1891. [Google Scholar] [CrossRef]
- Shen, S.-L.; Wu, Y.-X.; Misra, A. Calculation of head difference at two sides of a cut-off barrier during excavation dewatering. Comput. Geotech. 2017, 91, 192–202. [Google Scholar] [CrossRef]
- Taiebat, H.; Carter, J. Numerical studies of the bearing capacity of shallow foundations on cohesive soil subjected to combined loading. Géotechnique 2000, 50, 409–418. [Google Scholar] [CrossRef]
- Song, L.; Kang, X.; Mei, G. Buoyancy force on shallow foundations in clayey soil: An experimental investigation based on the “Half Interval Search”. Ocean Eng. 2017, 129, 637–641. [Google Scholar] [CrossRef]
- Ren, Z.; Ni, P.; Mei, G. Time effect of buoyant force reduction for underground structures in clays: Model test and case study. Int. J. Geomech. 2020, 20, 04020185. [Google Scholar] [CrossRef]
- Mei, G.; Song, L.; Zai, J. Experimental study on reduction of groundwater buoyancy. Chin. J. Geotech. Eng. 2009, 31, 1476–1480. [Google Scholar]
- Song, L.; Wang, X.; Wu, H.; Zhou, K.; Mei, G. Permeation process of clay under different stresses. Chin. J. Geotech. Eng. 2022, 44, 755–761. [Google Scholar]
- Zhou, J.; Yao, Z.; Gang, Z. Mesomechanical simulation of seepage flow in sandy soil. Chin. J. Geotech. Eng. 2007, 29, 977–981. [Google Scholar]
- Xu, Y.; Shen, S.; Ma, L. Cutoff effect of groundwater seepage due to existence of underground structure. J. Zhejiang Univ. Eng. Sci. 2010, 44, 1902–1906. [Google Scholar]
- Wang, X.; Xu, Y. Experimental investigation on the permeability of gap-graded soil due to horizontal suffusion considering boundary effect. J. Rock Mech. Geotech. Eng. 2024, 16, 1072–1084. [Google Scholar] [CrossRef]
- Li, Y.; Mu, L.; Cao, J. Impact of Seepage on the Underground Water Level in a Complex Soil-Water-Structure System. Adv. Civ. Eng. 2022, 2022, 7034778. [Google Scholar] [CrossRef]
- Zhang, J.-W.; Cao, J.; Mu, L.; Wang, L.; Li, J. Buoyancy force acting on underground structures considering seepage of confined water. Complexity 2019, 2019, 7672930. [Google Scholar] [CrossRef]
- Tang, Y.-F.; Cao, X.-W.; Li, M.; Cui, C.; Song, L.-H. Experimental Research on Pore Pressure and Transfer Mechanism in Clay. J. Chang. River Sci. Res. Inst. 2024, 41, 110. [Google Scholar]
- Tang, Y.-F.; Jiao, M.; Liu, X.-Y.; Qi, D.; Song, L. Experimental study on variation of pore pressure of clay foundation during groundwater level fluctuation. J. Nanjing Tech Univ. 2024, 46, 103–111. [Google Scholar]
- Zhang, Q.; Ouyang, L.; Wang, Z.; Liu, H.; Zhang, Y. Buoyancy reduction coefficients for underground silos in sand and clay. Indian Geotech. J. 2019, 49, 216–223. [Google Scholar] [CrossRef]
- Liu, H.; Sun, W.; Zhang, Y.; Zhang, W.; Han, F.; Su, W. Experimental analysis on the interaction between underground structures and sand layer under groundwater level change. Undergr. Space 2023, 10, 15–36. [Google Scholar] [CrossRef]
- Liu, H.-L.; Kong, G.-Q.; Sun, X.-J. Comparative test of effect of pore liquid on permeability characteristics of transparent soil. J. Hydraul. Eng. 2017, 48, 1303–1310. [Google Scholar]
- Sun, W.; Zhang, W.; Han, L. Determination of groundwater buoyancy reduction coefficient in clay: Model tests, numerical simulations and machine learning methods. Undergr. Space 2023, 13, 228–240. [Google Scholar] [CrossRef]


| Soil Type | Dry Density (g/cm3) | Wet Density (g/cm3) | Moisture Content (%) | Void Ratio (e) | Specific Gravity (GS) | Permeability (m/d) |
|---|---|---|---|---|---|---|
| Sandy | 1.61 | 1.85 | 14.66 | 0.7 | 2.65 | 7.65 |
| Conditions | H | D | h |
|---|---|---|---|
| no barrier | 0 | 0 | 25 cm |
| barrier | 50 cm | 50 cm | 25 cm |
Disclaimer/Publisher’s Note: The statements, opinions and data contained in all publications are solely those of the individual author(s) and contributor(s) and not of MDPI and/or the editor(s). MDPI and/or the editor(s) disclaim responsibility for any injury to people or property resulting from any ideas, methods, instructions or products referred to in the content. |
© 2025 by the authors. Licensee MDPI, Basel, Switzerland. This article is an open access article distributed under the terms and conditions of the Creative Commons Attribution (CC BY) license (https://creativecommons.org/licenses/by/4.0/).
Share and Cite
Fan, Z.; Xu, C.; Yang, K.; Xue, X.; Zeng, C. Experimental Study on the Influence of Rising Water Levels on the Buoyancy of Building Structure. Water 2025, 17, 1377. https://doi.org/10.3390/w17091377
Fan Z, Xu C, Yang K, Xue X, Zeng C. Experimental Study on the Influence of Rising Water Levels on the Buoyancy of Building Structure. Water. 2025; 17(9):1377. https://doi.org/10.3390/w17091377
Chicago/Turabian StyleFan, Zhisong, Changjie Xu, Kelang Yang, Xiuli Xue, and Chaofeng Zeng. 2025. "Experimental Study on the Influence of Rising Water Levels on the Buoyancy of Building Structure" Water 17, no. 9: 1377. https://doi.org/10.3390/w17091377
APA StyleFan, Z., Xu, C., Yang, K., Xue, X., & Zeng, C. (2025). Experimental Study on the Influence of Rising Water Levels on the Buoyancy of Building Structure. Water, 17(9), 1377. https://doi.org/10.3390/w17091377