Article

Integrating GIS, Remote Sensing, and Machine Learning to Optimize Sustainable Groundwater Recharge in Arid Mediterranean Landscapes: A Case Study from the Middle Draa Valley, Morocco

1
Department of Geography, Faculté Des Sciences Humaines et Sociales, Ibn Tofail University, Kenitra 14000, Morocco
2
Department of Computer Science, Faculty of Sciences, University Ibn Tofail, Kenitra 14000, Morocco
3
Department of Geography and Environment, Jagannath University, Dhaka 1100, Bangladesh
4
Department of Geodesy and Geomatics, University North, 48000 Koprivnica, Croatia
5
Department of Civil Engineering, University North, 42000 Varaždin, Croatia
6
Department of Civil Engineering, College of Engineering, Taif University, Taif 21944, Saudi Arabia
7
Geological and Geophysical Engineering Department, Faculty of Petroleum and Mining Engineering, Suez University, Suez 43518, Egypt
*
Authors to whom correspondence should be addressed.
Water 2025, 17(15), 2336; https://doi.org/10.3390/w17152336 (registering DOI)
Submission received: 25 June 2025 / Revised: 26 July 2025 / Accepted: 4 August 2025 / Published: 6 August 2025

Abstract

Groundwater plays a crucial role in sustaining agriculture and livelihoods in the arid Middle Draa Valley (MDV) of southeastern Morocco. However, increasing groundwater extraction, declining rainfall, and the absence of effective floodwater harvesting systems have led to severe aquifer depletion. This study applies and compares six machine learning (ML) algorithms—decision trees (CART), ensemble methods (random forest, LightGBM, XGBoost), distance-based learning (k-nearest neighbors), and support vector machines—integrating GIS, satellite data, and field observations to delineate zones suitable for groundwater recharge. The results indicate that ensemble tree-based methods yielded the highest predictive accuracy, with LightGBM outperforming the others by achieving an overall accuracy of 0.90. Random forest and XGBoost also demonstrated strong performance, effectively identifying priority areas for artificial recharge, particularly near ephemeral streams. A feature importance analysis revealed that soil permeability, elevation, and stream proximity were the most influential variables in recharge zone delineation. The generated maps provide valuable support for irrigation planning, aquifer conservation, and floodwater management. Overall, the proposed machine learning–geospatial framework offers a robust and transferable approach for mapping groundwater recharge zones (GWRZ) in arid and semi-arid regions, contributing to the achievement of Sustainable Development Goals (SDGs))—notably SDG 6 (Clean Water and Sanitation), by enhancing water-use efficiency and groundwater recharge (Target 6.4), and SDG 13 (Climate Action), by supporting climate-resilient aquifer management.

1. Introduction

The Mediterranean region has increasingly suffered from groundwater-related challenges due to climate variability, overextraction, saline intrusion, and rising pollution levels [1,2,3,4,5,6]. These pressures are particularly acute in arid and semi-arid zones, where groundwater often serves as the primary source of water for agriculture and domestic use [7,8,9].
Groundwater depletion in Morocco’s oasis regions represents a critical environmental concern within the arid Mediterranean climate regions over past years [6,10,11,12], particularly within the Middle Draa Valley (MDV)—an arid area in southeastern Morocco encompassing six oases reliant on surface and subsurface water sourced from the High Atlas Mountains [13]. Spanning approximately 200 km, the MDV depends heavily on regulated releases from the upstream El Mansour Eddahbi Dam. Despite its importance, climate change-induced prolonged drought in the area [14] poses challenges to the sufficiency of dam releases for meeting irrigation demands in the oases [15]. The Ternata Oasis serves as the central oasis in the MDV, encompassing the provincial capital, Zagora city, characterized by an arid climate, featuring an average annual rainfall of around 70 mm. This oasis has encountered significant challenges over the years. A study by Moumane et al. [16], analyzing data from 1991 to 2021, revealed alarming expansions in desertified lands (+168.09%), primarily attributed to water scarcity. This escalation has compounded the environmental and socioeconomic challenges, leading to labor migration, oasis abandonment, and the loss of income sources [17].
In response to these challenges, firstly, farmers within the oases are increasingly turning to groundwater extraction from shallow wells [18]. This transition, initially perceived as a contingency measure [19], has now become a widespread practice, substantially accelerating the depletion of already limited groundwater resources. Secondly, new agricultural practices are emerging in the rangeland outside the ancient oases, especially in the Feija Plain [20,21,22], with the availability of both land and groundwater serving as the driving factors. However, this adaptive technique also leads to the depletion of groundwater resources. The situation in the Feija Plain is particularly concerning. While groundwater resources are alarmingly overexploited, this concern is substantiated by regional studies. Lamqadem et al. (2019) [23] showed that irrigated cropland in the Feija Basin expanded from only 0.17 km2 in 1975 to over 20 km2 by 2017, largely due to intensification under the Green Morocco Plan and massive use of groundwater via deep boreholes. This transformation, also highlighted by Moumane et al. (2021) [21], has accelerated land degradation, soil salinization, and intensified the hydrosocial crisis in the area [24,25,26], as farmers shift toward market-driven crops, like watermelon, stressing the fragile aquifer system [27]. This unsustainable imbalance has threatened water availability, risked declining agricultural productivity, and led to water quality issues and social conflicts over dwindling resources [27]. Without intervention, the region faces a future of severe water scarcity and socioeconomic challenges. Compounding this crisis, the region occasionally experiences significant flash floods, such as those in 2014, 2024, and 2025 [28,29]. However, the absence of infrastructure to capture and store this water for aquifer recharge represents a critical missed opportunity. Rather than alleviating groundwater depletion, these flash floods—if unutilized—exacerbate water scarcity by allowing vast amounts of water to dissipate instead of replenishing depleted reserves. The lack of effective floodwater harvesting structures not only leads to water wastage but increases the risk of erosion and sedimentation, further degrading the land.
To confront these interconnected challenges, an integrated approach employing remote sensing (RS), geographic information systems (GIS), and machine learning (ML) offers a promising pathway toward sustainable groundwater management. ML algorithms can process large-scale climatic and hydrological data to predict groundwater variability, delineate suitable artificial recharge zones, and identify long-term availability patterns [30,31,32,33,34,35,36,37,38]. Among these techniques, classification and regression trees (CART) are frequently employed to develop interpretable decision rules based on variables such as precipitation, soil permeability, and terrain slope for classifying groundwater recharge potential [31,39]. Random forest (RF) algorithms enhance predictive accuracy by aggregating outputs from multiple decision trees, effectively capturing complex, non-linear interactions among features like land use, geological structure, and elevation [38,40,41]. Light Gradient-Boosting Machine (LightGBM) offers significant computational efficiency and scalability, making it well-suited for large-scale groundwater recharge studies involving high-dimensional data, including precipitation, soil type, and land cover [42,43,44]. Similarly, eXtreme Gradient Boosting (XGBoost) demonstrates high predictive performance by modeling complex feature relationships while mitigating overfitting risks [45]. K-nearest neighbors (k-NN) classifies recharge potential by evaluating feature similarity (e.g., rainfall, soil, slope) between a given location and its nearest data points [34,46], whereas support vector machines (SVM) are effective in identifying non-linear boundaries between classes of recharge potential based on features like vegetation and topography [37,47,48]. However, several research gaps remain insufficiently addressed. First, most studies utilizing ML and RS techniques have been conducted in semi-arid or sub-humid regions, while hyper-arid zones, such as southeastern Morocco—including the MDV—remain significantly underrepresented [34]. Second, although ensemble algorithms, like RF, have been widely applied, there is a lack of comparative evaluation between newer gradient boosting algorithms, including LightGBM and XGBoost, in arid groundwater recharge contexts. Third, the existing studies often rely on single-model evaluations; few have implemented integrative, multi-algorithm validation frameworks using consistent metrics, such as confusion matrices and ROC-AUC, to assess model robustness across diverse hydrological and geomorphological variables. Addressing these gaps is crucial for improving the scientific basis of groundwater recharge planning in extreme arid environments.
Despite their demonstrated effectiveness, ML-based groundwater recharge zone (GWRZ) algorithms have yet to be applied in the MDV. Their implementation could significantly enhance water harvesting strategies and improve agricultural productivity in this highly water-stressed environment. Bridging this gap is imperative for the development of data-driven groundwater management practices tailored to arid Mediterranean ecosystems. This study aims to identify and map groundwater recharge potential zones in the arid to hyper-arid Middle Draa Valley (MDV) of Morocco by integrating remote sensing data, field-based groundwater observations, and advanced machine learning (ML) techniques. Specifically, it evaluates and compares the predictive performance of six ML algorithms—CART, random forest, LightGBM, XGBoost, k-NN, and SVM—for delineating recharge-prone areas and analyzing key influencing factors, including topographic, geological, hydrogeological, and anthropogenic-related variables. This study also seeks to provide actionable geospatial outputs to support sustainable water resource management, to inform recharge infrastructure planning, and to contribute to achieving Sustainable Development Goals.

2. Materials and Methods

2.1. Study Area Characteristics

The Feija Plain, a 1145 km2 arid region situated west of the Ternata Oasis (latitudes 30.10° N–30.16° N, longitudes 5.32° W–6.14° W) (Figure 1), the plain has historically supported nomadic pastoralism but now faces severe groundwater depletion due to a dramatic shift toward intensive watermelon cultivation over the past decade (Figure 2). This transition, driven by the region’s sandy soils, short crop cycles, and the profitability of watermelon, has been accelerated by external investors who lease tribal lands, finance well construction, and share profits with local farmers [27,49,50], leading to fierce competition over communal resources and disrupting traditional land governance [24].
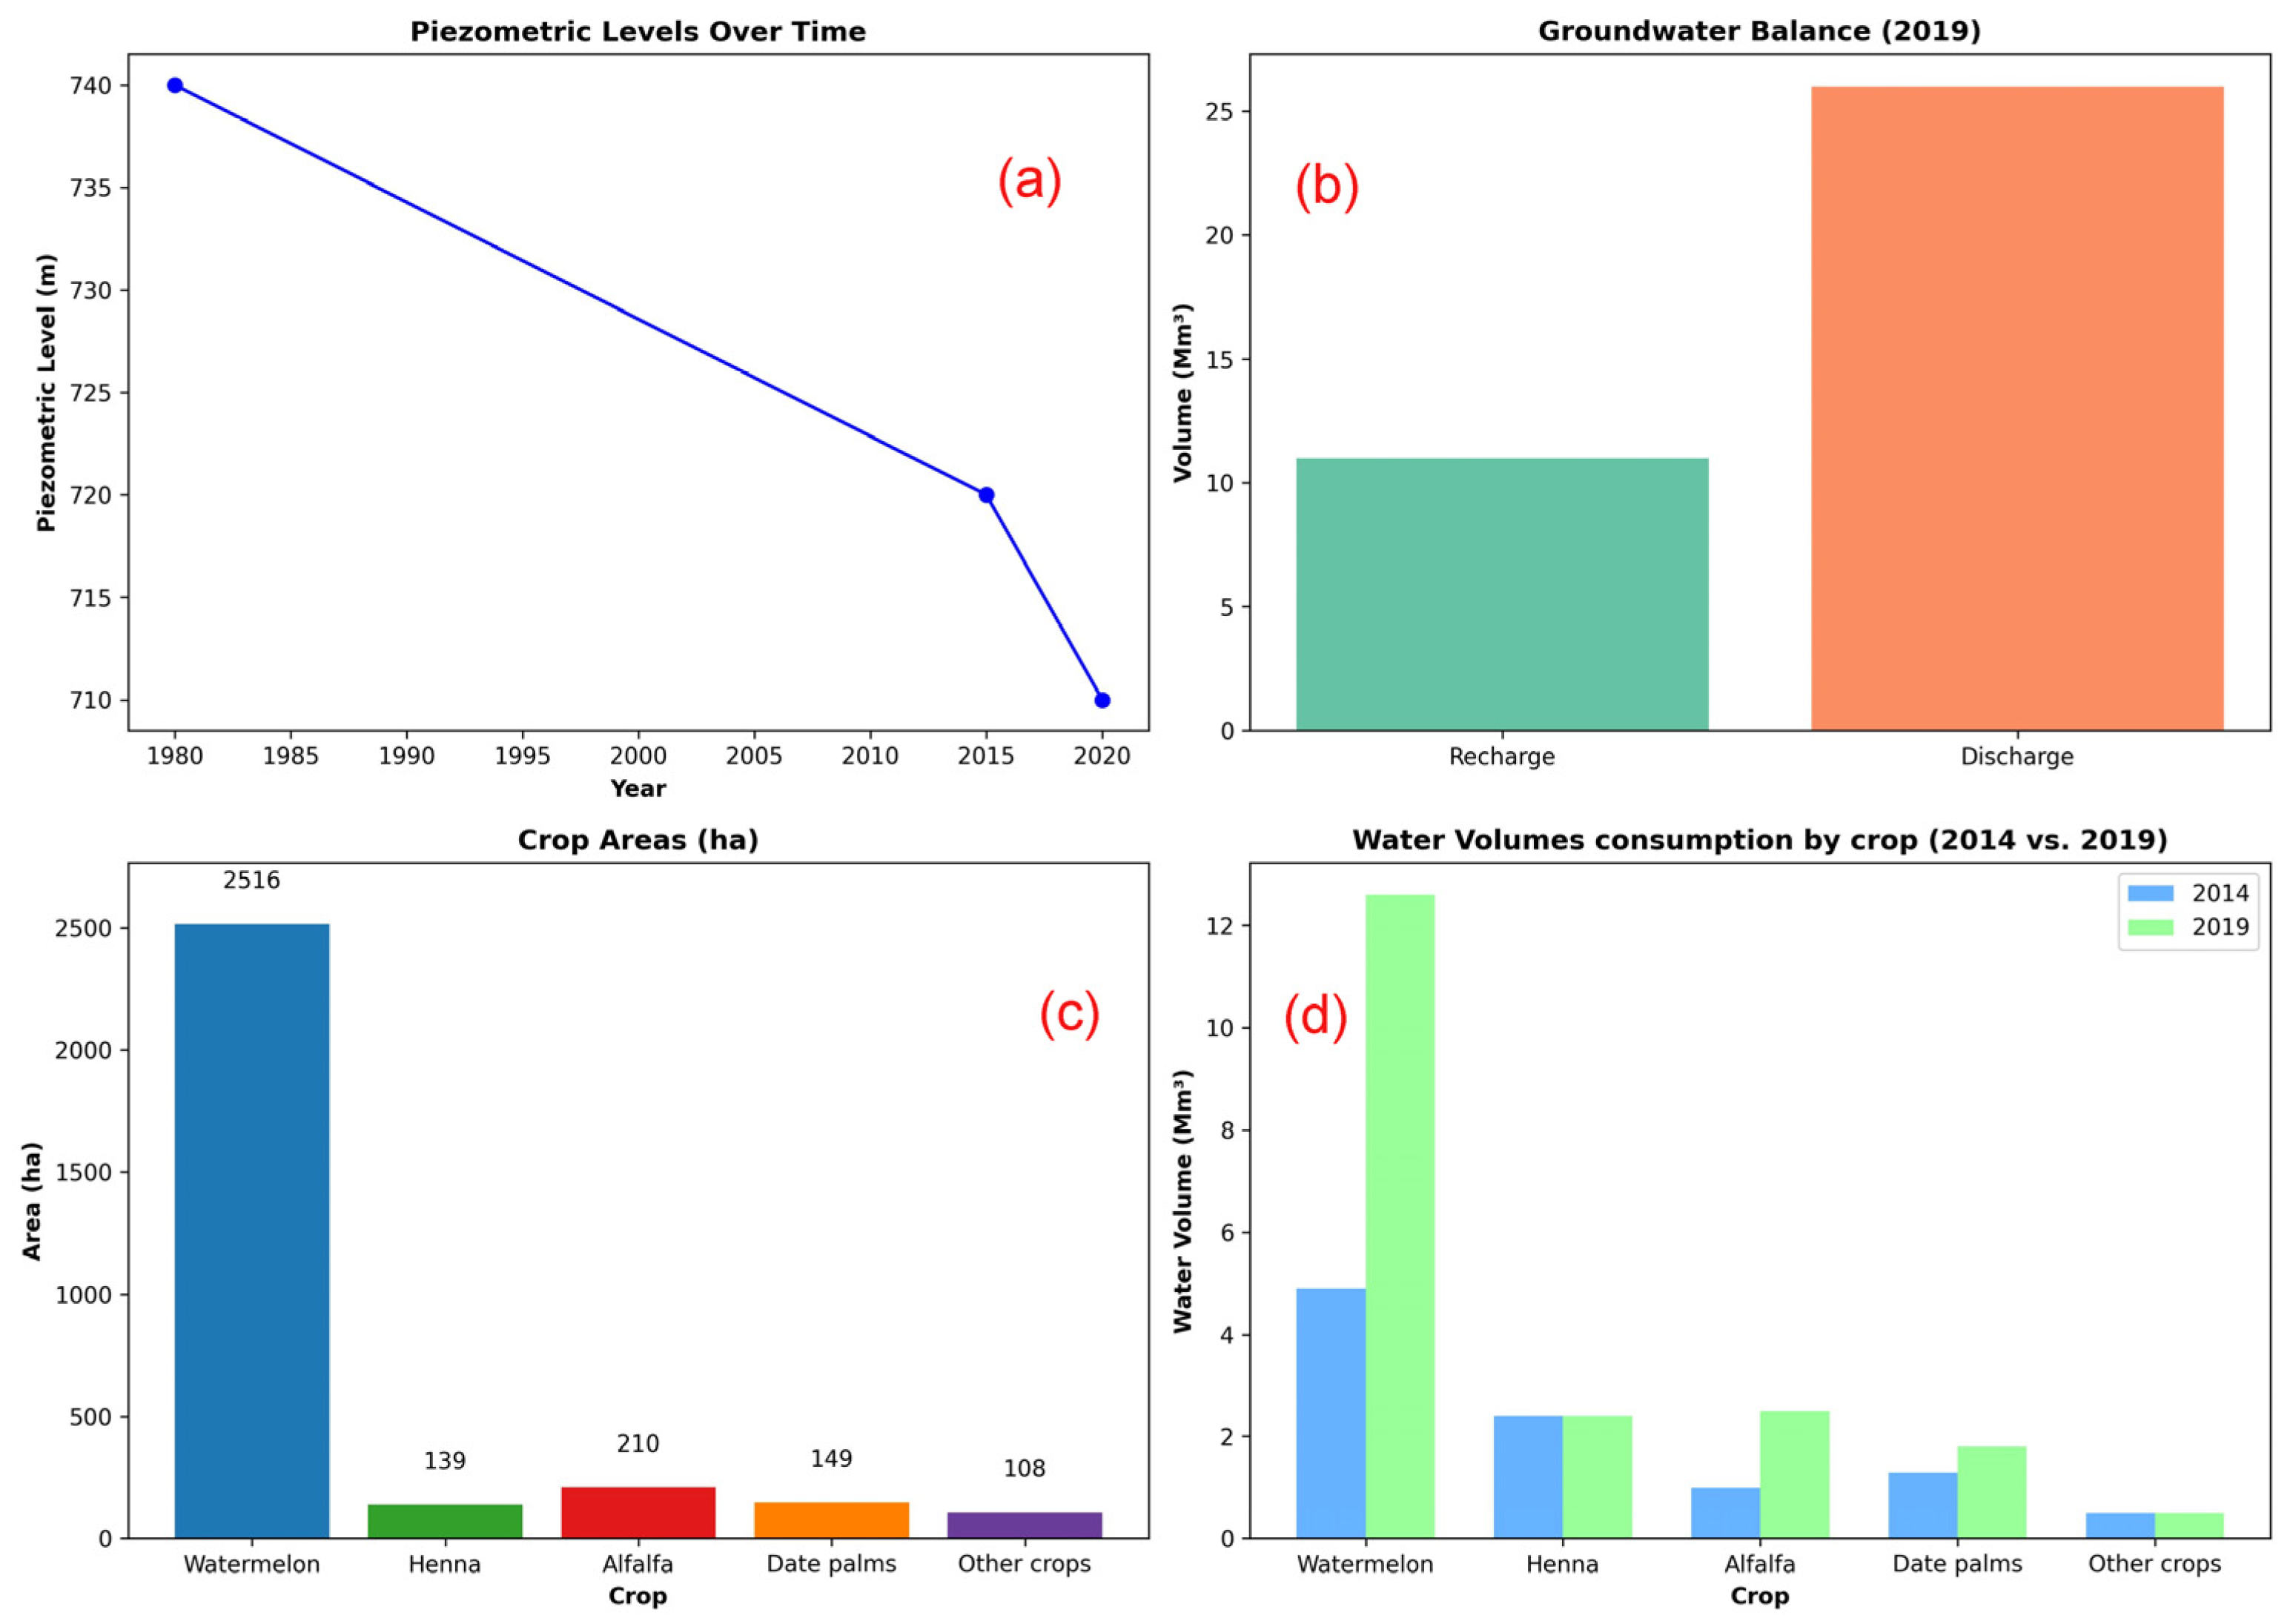
The agricultural boom has triggered exponential growth in groundwater infrastructure [27,51,52], with irrigation wells proliferating (Figure 3a) from fewer than 50 in 1980 to approximately 344 in 2014 and to around 850 by 2019 [53]. Meanwhile, annual groundwater extraction for watermelon alone surged from 4.9 mm3 in 2014 to 12.6 mm3 in 2019 (Figure 3c,d), effectively doubling total agricultural water use [53,54].
The situation is alarming: piezometric levels have dropped sharply, with numerous peripheral wells completely dry—a phenomenon confirmed through field observations, which revealed abandoned farms and water storage basins filled with encroaching sand. Interviews with local farmers further corroborate this decline, highlighting the total depletion of several wells tapping into the Quaternary aquifer. In response, many have resorted to drilling deeper—often exceeding 100 m—to access the confined deep aquifer (Figure 4). The aquifer system faces a severe imbalance, as the estimated annual recharge of approximately 11 mm3 is significantly outstripped by annual withdrawals reaching nearly 26 mm3 (Figure 3b), resulting in a critical deficit of –15 mm3 [53]. However, accurately quantifying this overexploitation remains difficult due to the lack of systematic piezometric monitoring prior to 2020. It was only in 2023 that piezometers and water meters were installed on farmers’ wells in the Feija Plain; before this, available data was sparse or entirely lacking.
However, a field study by Moumane et al. (2021) [21] analyzed groundwater levels between April 2013 and April 2018 and revealed a sharp decline of around 10 m over that five-year span. The unsustainable extraction regime has cascading consequences: wells are tapping ever deeper, mineral-rich layers, increasing salinization risks, and mounting social conflicts are emerging between tribal communities and external investors over dwindling water resources [25].
To curb further groundwater depletion, the Governor of Zagora issued Decision No. 00008267, which restricts agricultural cultivation in the study area to a maximum of one hectare per farmer. This measure was implemented in response to escalating water scarcity and overexploitation of the aquifer. Field evidence and interviews suggest that most farmers have complied with the regulation, recognizing the urgent need to preserve the remaining groundwater resources and to avoid complete system collapse.
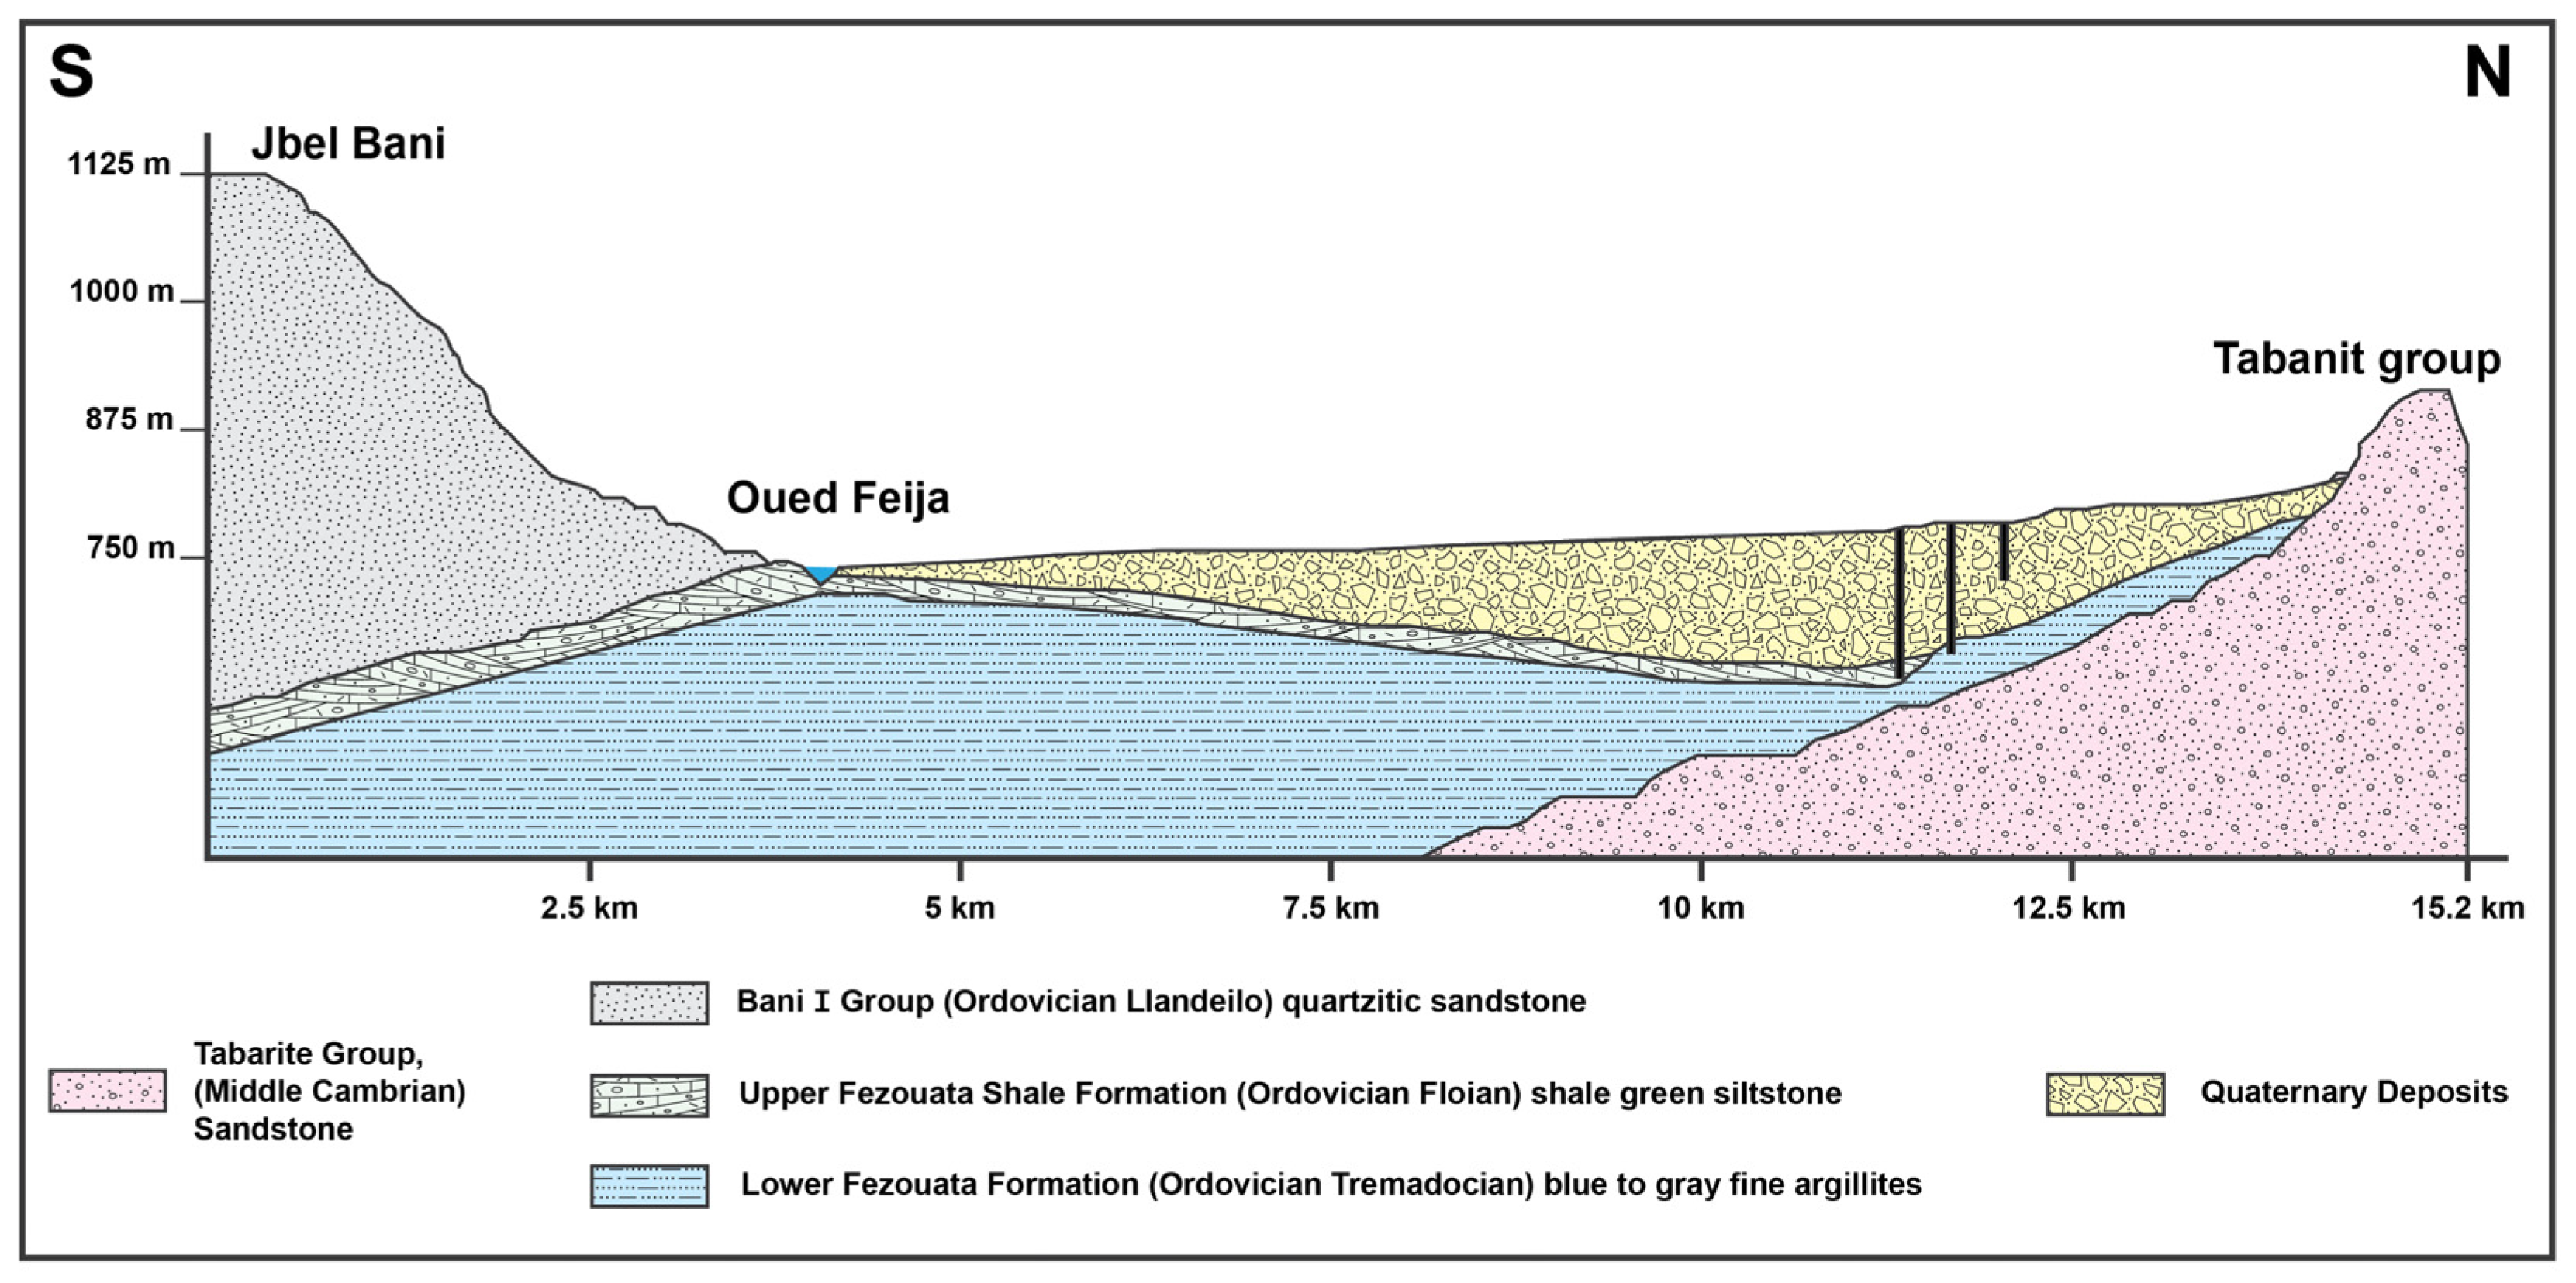
The Feija Plain is geologically situated between the Middle Cambrian sandstones of the Tabanit Group to the north and the Ordovician quartzitic rocks of the Bani I Group to the south [55] (Figure 4). The subsurface is primarily composed of Lower and Upper Fezouata shale formations, ranging from Tremadocian to Floian age, which form the impermeable bedrock of the basin. Overlying these Paleozoic units are extensive Quaternary deposits—fluvial, aeolian [56], and lacustrine in origin—comprising the main productive layers of the shallow unconfined aquifer system. This upper aquifer, 5 to 50 m thick [54], is moderately to highly permeable, while a deeper confined aquifer exists between the Fezouata Shales and the Cambrian sandstones, providing high-yield groundwater through a conglomeratic horizon. The Jbel Bani escarpment and Tabanit ridges structurally frame the basin, influencing recharge, runoff, and water flow. The entire system reflects a stratified hydrogeological configuration where ancient lithologies and modern sediments jointly govern water storage and availability across the Feija Basin.

2.2. Methodological Framework

This study follows a widely adopted methodological framework used in groundwater potential mapping, which combines remote sensing, GIS-derived variables, and ML classification [38,57]. While similar in structure to other studies, our approach is distinctly tailored to the specific environmental and hydrogeological conditions of the Middle Draa Valley. Ten key conditioning factors were carefully selected based on their local relevance, encompassing topographical, hydrological, geological, and anthropogenic-related parameters [58]. A groundwater inventory map was developed using spatially distributed well locations and corresponding annual extraction volumes. As outlined in Figure 5, these inputs were used to train and validate six ML algorithms to delineate groundwater recharge potential zones with greater accuracy and contextual sensitivity.

2.2.1. Data Acquisition and Preparation of Thematic Layers

Based on an extensive review of the literature and considering the specific environmental and geological context of the study area, ten key hydrological and environmental factors were identified and analyzed to delineate potential groundwater recharge zones. These criteria include distance from main streams, soil permeability, rainfall, normalized difference vegetation index (NDVI), lineament density, geomorphology, slope, curvature, topographic wetness index (TWI), and elevation. The spatial datasets corresponding to these variables were compiled from multiple sources, as detailed in Table 1. All thematic layers were generated and processed using ArcGIS 10.8 (Table 2).

2.2.2. Data Homogenization

To ensure the compatibility and reliability of spatial data for subsequent analysis, a systematic homogenization procedure was implemented using ArcGIS 10.8. This process involved the conversion of all vector datasets into a raster format to establish a uniform data structure. A consistent spatial resolution of 30 × 30 m was applied to all raster layers to facilitate spatial comparability and analytical coherence. Furthermore, all layers were reprojected to a common coordinate reference system—WGS_1984_UTM_Zone_29N—to ensure alignment in spatial referencing.
Categorical variables, such as land use/land cover (LULC), geomorphological units, and hydrogeological soil (HGS) types—used for evaluating soil permeability—were standardized by assigning them appropriate numerical codes. This step allowed their integration with continuous variables, including NDVI, TWI, rainfall, and others, thereby enabling consistent and meaningful multi-criteria spatial analysis.

2.2.3. Training Dataset

The dataset used for training the ML algorithms integrates detailed hydrogeological information obtained from the local water agency, including actual pumped volumes and precise spatial coordinates in metric projection [53]. A total of 406 georeferenced points were selected, in order to ensure balanced and representative modeling across different recharge conditions. The well locations were rigorously verified through field surveys using a Garmin GPS device (Figure 2), enhancing spatial accuracy and data reliability.
Each well or borehole was attributed a groundwater extraction value, with annual pumped volumes ranging from 2500 to 76,000 m3/year. Based on these volumes, the wells were classified into three recharge potential categories: low (<15,000 m3/year), medium (15,000–30,000 m3/year), and high (>30,000 m3/year). These labels were subsequently used as the ground truth for supervised classification. Following the preparation of thematic layers (e.g., elevation, slope, NDVI, TWI, rainfall, etc.), the raster values of all input factors were extracted for each point using ArcGIS’s “Extract Multi Values to Points” tool. The resulting attribute table, where each point was assigned a complete set of explanatory variables and its corresponding class label, was cleaned to remove incomplete records, ensuring that all 406 training points contained valid values for all layers. This cleaned and labeled dataset was subsequently exported and used to train and evaluate the six ML algorithms using a Python-based workflow (Python version 3.10.12) implemented on the Google Colab platform.

2.2.4. Multicollinearity Test

To ensure reliability, an evaluation of multicollinearity among the selected influencing factors, which occurs when predictor variables are highly correlated, can distort outcomes by introducing redundancy. A common method for detecting this issue is the variance inflation factor (VIF), widely applied in geosciences and groundwater studies [59]. This study adopted a VIF threshold of 10, retaining only those parameters that met this criterion for the final analysis [37].

2.2.5. Prediction Mapping and Interpolation

To delineate groundwater potential zones with high predictive accuracy, this study utilized a range of advanced ML algorithms (Table 3). These included tree-based ensemble methods (CART, RF, LightGBM, XGBoost), a distance-based classifier (k-NN), and a margin-based method (SVM), each selected for its strengths in handling diverse environmental features and enhancing algorithm robustness.
Following the training phase, the entire study area raster was converted into a dense point dataset in ArcGIS. For each of these points, values corresponding to the ten selected conditioning factors were extracted. After rigorous cleaning to remove any points with missing values, the complete dataset was exported as a CSV file and uploaded to the Google Colab environment. There, the previously trained ML algorithms were applied to predict the groundwater recharge class for each point based on its extracted feature values. Each point was assigned a recharge class label (1 = Low, 2 = Medium, 3 = High), along with its geographic coordinates (X, Y).
The labeled prediction results were then re-imported into ArcGIS, and the inverse distance weighting (IDW) interpolation method was employed to generate continuous predictive maps of groundwater recharge potential across the study area for each ML algorithm.

2.2.6. Sensitivity Analysis Using SHAP

To evaluate feature influence across multiple ML algorithms, we implemented a global sensitivity analysis using SHapley Additive exPlanations (SHAP), a model-agnostic interpretability framework rooted in Shapley values from cooperative game theory. SHAP calculates the contribution of each input variable to the algorithm’s output, reflecting both individual effects and interactions by averaging over all possible feature combinations.
For tree-based ML we employed TreeExplainer, which delivers exact SHAP values in linear time with respect to the number of leaves [66]. Distance-based k-NN and margin-based SVM were interpreted with KernelExplainer, a sampling-based approximation [66].
We generated bar plots of the mean absolute SHAP values for each feature—a well-established global metric for assessing variable importance in SHAP-based studies. By averaging the absolute Shapley values across all data instances, these bar charts effectively rank the overall influence of predictors on model output. This visualization approach is widely used across domains, including hydrogeology, groundwater potential zones, and water-quality modeling, to highlight which variables most significantly drive the results rather than just capturing isolated effects [67,68].

2.2.7. Algorithms Evaluation and Performance Metrics

To ensure a robust and reliable evaluation of the ML algorithms, the dataset was partitioned into 70% for training and 30% for testing. The performance of each algorithm was rigorously assessed using a suite of complementary validation metrics.
The confusion matrix offered a detailed account of classification performance by quantifying true positives, false positives, true negatives, and false negatives, allowing for the identification of specific misclassification trends. The Receiver Operating Characteristic–Area Under the Curve (ROC-AUC) was employed to evaluate the algorithms’ discriminatory capacity in distinguishing between classes of groundwater potential, with higher AUC values indicating superior classification ability. Furthermore, the F1-Score, represents the harmonic mean of precision and recall.

3. Results

3.1. Conditioning Factors

3.1.1. Topographical Factors

Elevation
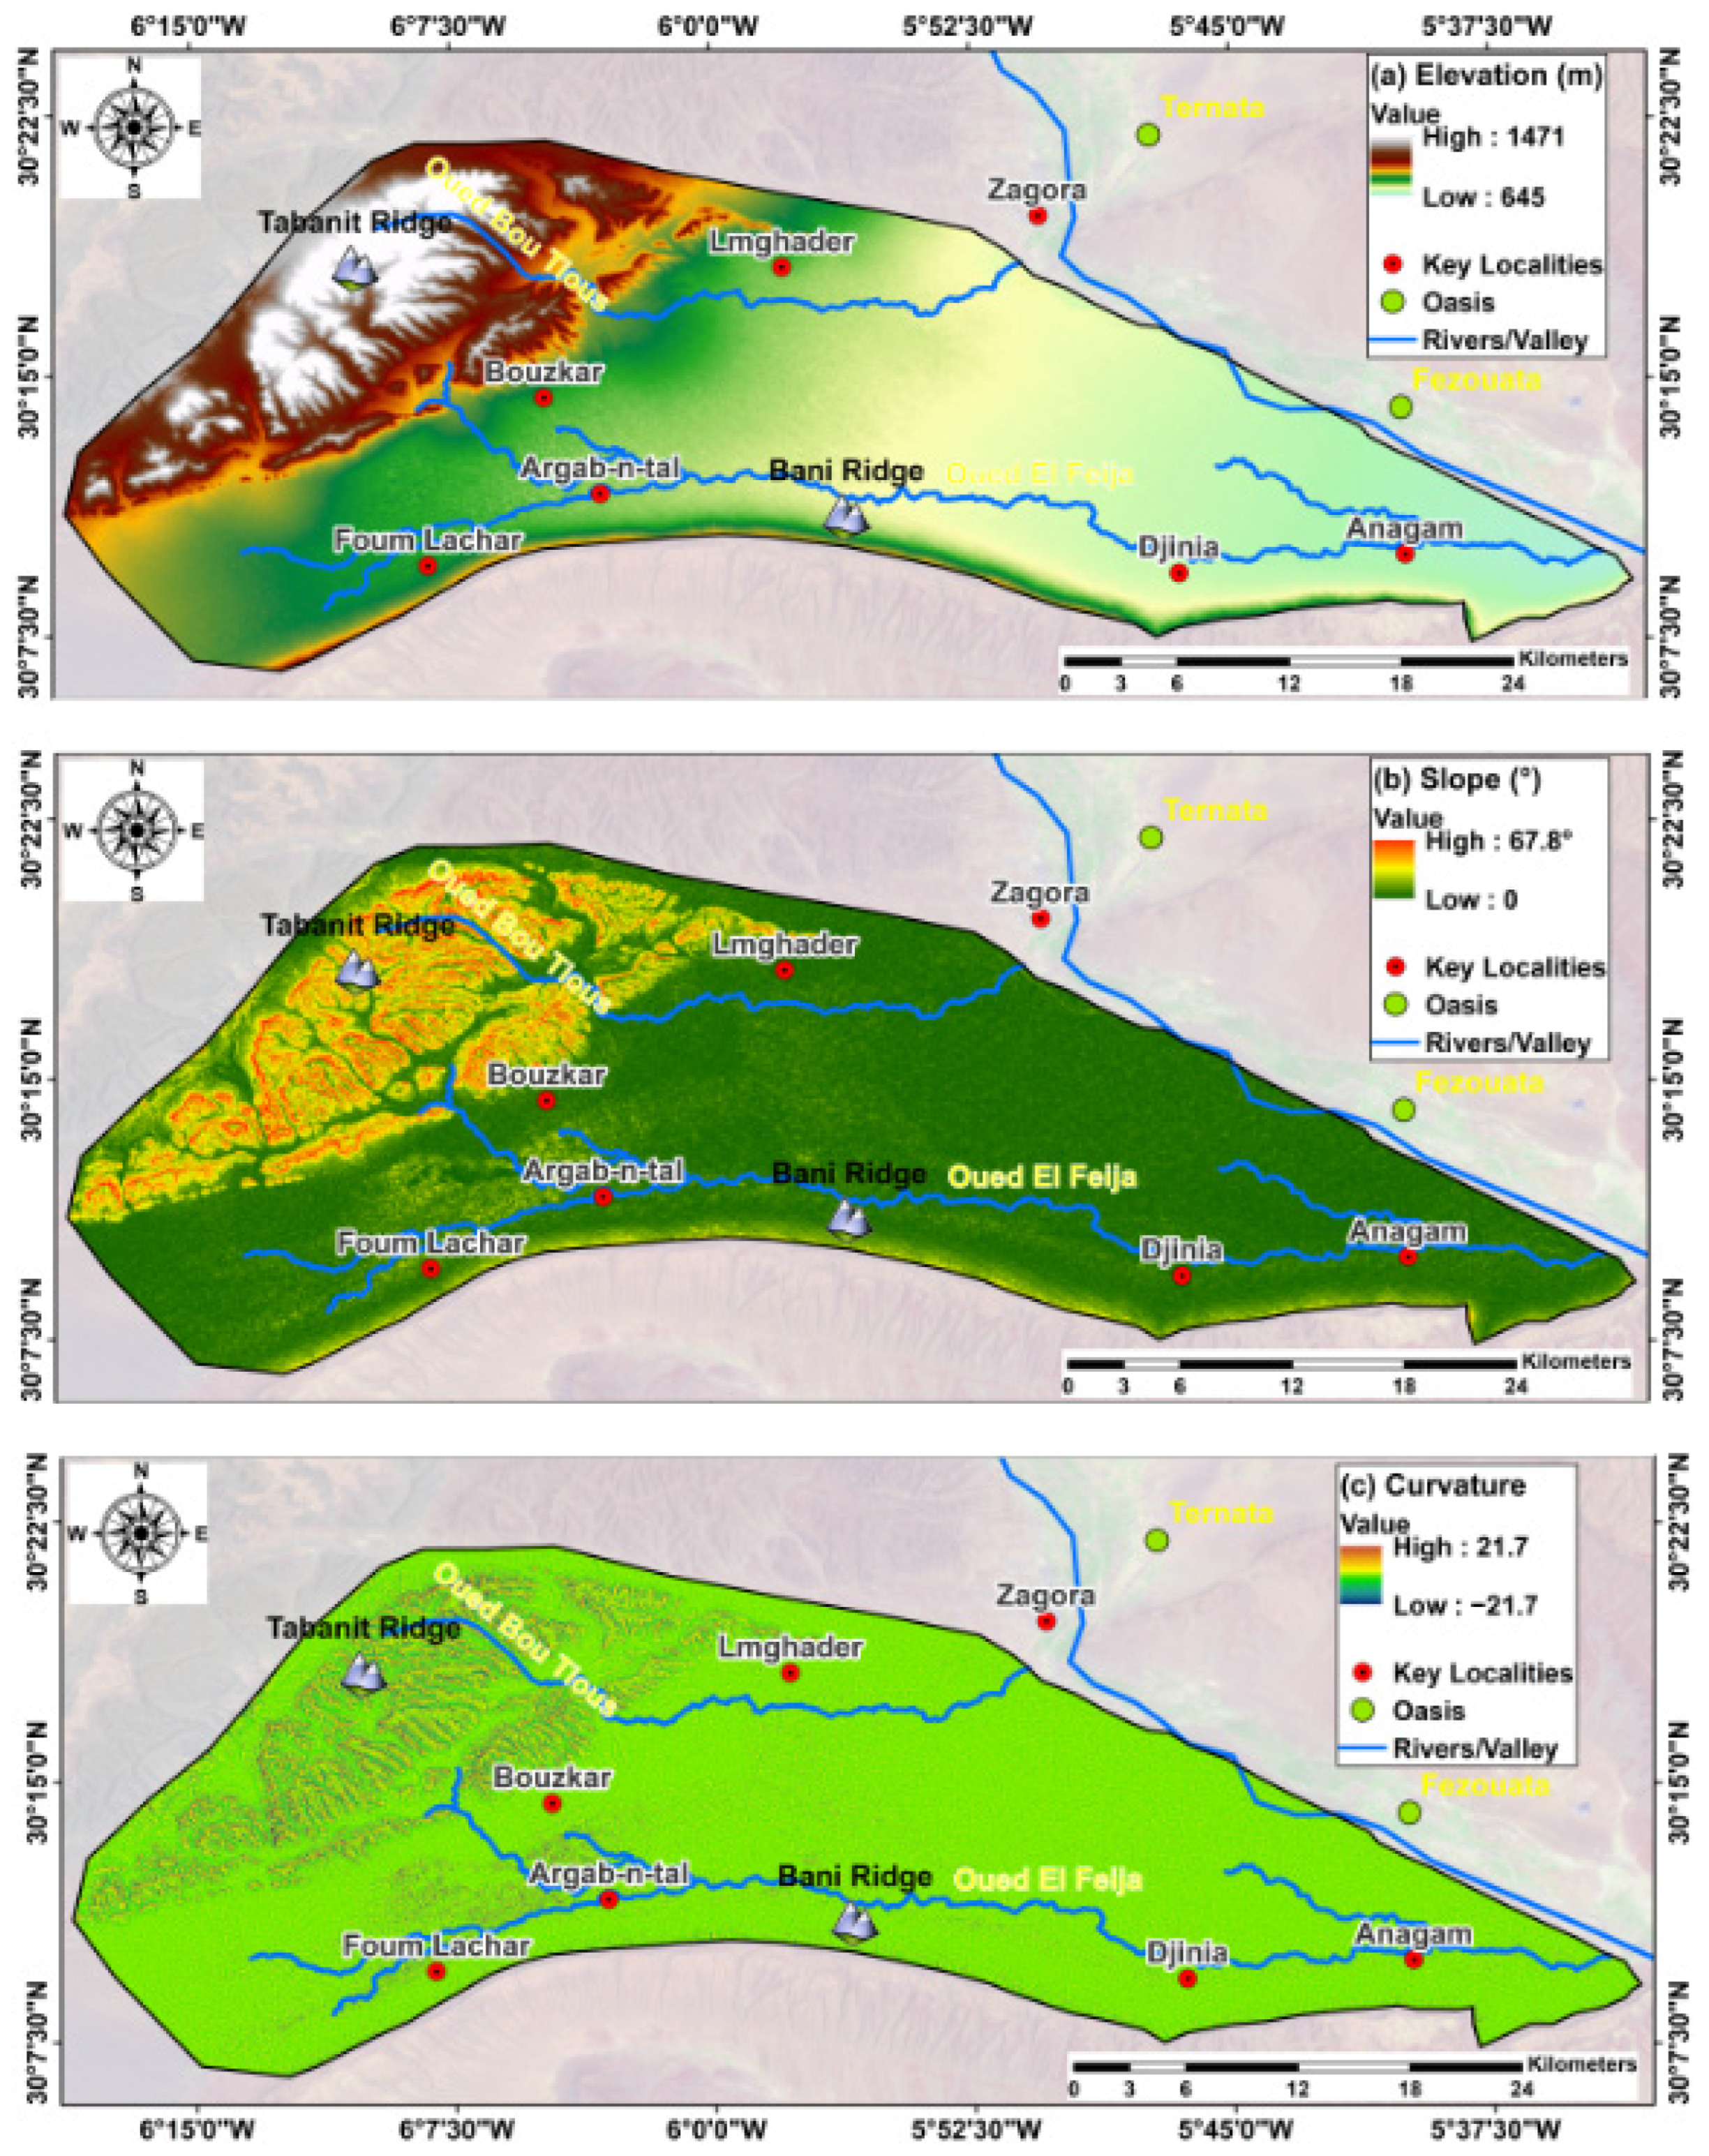
Elevation is the most critical parameter influencing the identification of potential groundwater zones in the study area. It controls all other topographic factors and governs surface water movement, which is essential for groundwater recharge. Lower elevations tend to retain water for longer periods, promoting greater infiltration and reducing runoff during rainfall. By contrast, higher elevations retain rainwater for shorter durations, resulting in increased runoff [69]. The elevation in the study area ranges from 645 to 1471 m (Figure 6a).
Slope
Slope significantly influences groundwater potential by affecting water movement. Steeper slopes promote rapid runoff, reducing soil infiltration and lowering groundwater recharge rates, while gentle slopes enhance water infiltration, contributing to groundwater replenishment [70,71]. The study area was classified into three slope categories: Class 1 (0–5 degrees), covering 71.47% of the area and supporting high recharge; Class 2 (5–15 degrees), comprising 17.78% and indicating moderate recharge potential; and Class 3 (15–67.88 degrees), accounting for 10.76% and characterized by steeper slopes that promote higher runoff and reduced recharge potential (Figure 6b).
Curvature
Curvature values serve as indicators of the land’s morphology. A positive curvature represents a convex surface (Figure 6c), while a negative curvature indicates a concave surface. A value close to zero signifies a flat surface [72]. Curvature is important for understanding how water flows across the land, affecting groundwater recharge [73]. The significance of concave slopes lies in their propensity to accumulate surface water, particularly during intense storms. This characteristic enhances their importance in assessing groundwater potential. Conversely, a convex slope facilitates rapid runoff, minimizing water storage and, consequently, assigning lesser significance to groundwater potential in such areas [74].

3.1.2. Hydrogeological Factors

Distance from Main Streams
Distance from a river significantly influences groundwater dynamics, a key aspect of hydrogeology. Proximity to a river enhances groundwater recharge, as areas closer to rivers are more likely to experience surface water infiltration, replenishing the groundwater [75,76]. In the Feija Plain, two ephemeral streams are present: Oued Bou Tious in the north, originating in the Cambrian Tabanit Mountains (Figure 1), and the Feija Valley in the south, extending along the foothills of the Ordovician sandstone of the Jbel Bani Mountain (Figure 7a). These geological features shape the region’s hydrology, influencing water flow and distribution. Despite the area’s arid climate and low rainfall, these streams experience significant annual runoff, particularly during flash floods between August and November.
Topographic Wetness Index (TWI)
The TWI is a crucial tool in hydrological studies, quantifying the influence of topography on hydrological processes and providing insights into groundwater dynamics (Figure 5). Derived from slope and elevation data, the TWI helps identify potential groundwater recharge zones in diverse topographic settings [77]. Higher TWI values indicate areas with greater potential for groundwater recharge [78,79], making it a valuable metric for assessing topographic impacts on groundwater processes (Figure 7b).
Rainfall
In the absence of a local weather station within the study area, rainfall data were sourced from the NASA POWER (Prediction of Worldwide Energy Resources) database (Table 1). To generate a spatial distribution of precipitation, the inverse distance weighting (IDW) interpolation method was applied using ArcGIS 10.8 (Figure 7c). The reliability of the satellite-derived data was assessed by comparing it with observations from the nearest ground-based meteorological station, located in the city of Zagora.

3.1.3. Geological Factors

Soil Permeability
Soil permeability data were obtained through field sampling and laboratory analysis using the laser diffraction method. Based on the results, four major soil types were identified within the study area and categorized according to their permeability potential:
  • Group A: High permeability (rating = 4), comprising sandy, loamy sand, and sandy loam soils.
  • Group B: Moderate permeability (rating = 3), consisting of loam and silt loam.
  • Group C: Low permeability (rating = 2), represented by sandy clay loam.
  • Group D: Very low permeability (rating = 1), corresponding to bare rocky outcrops in mountainous zones.
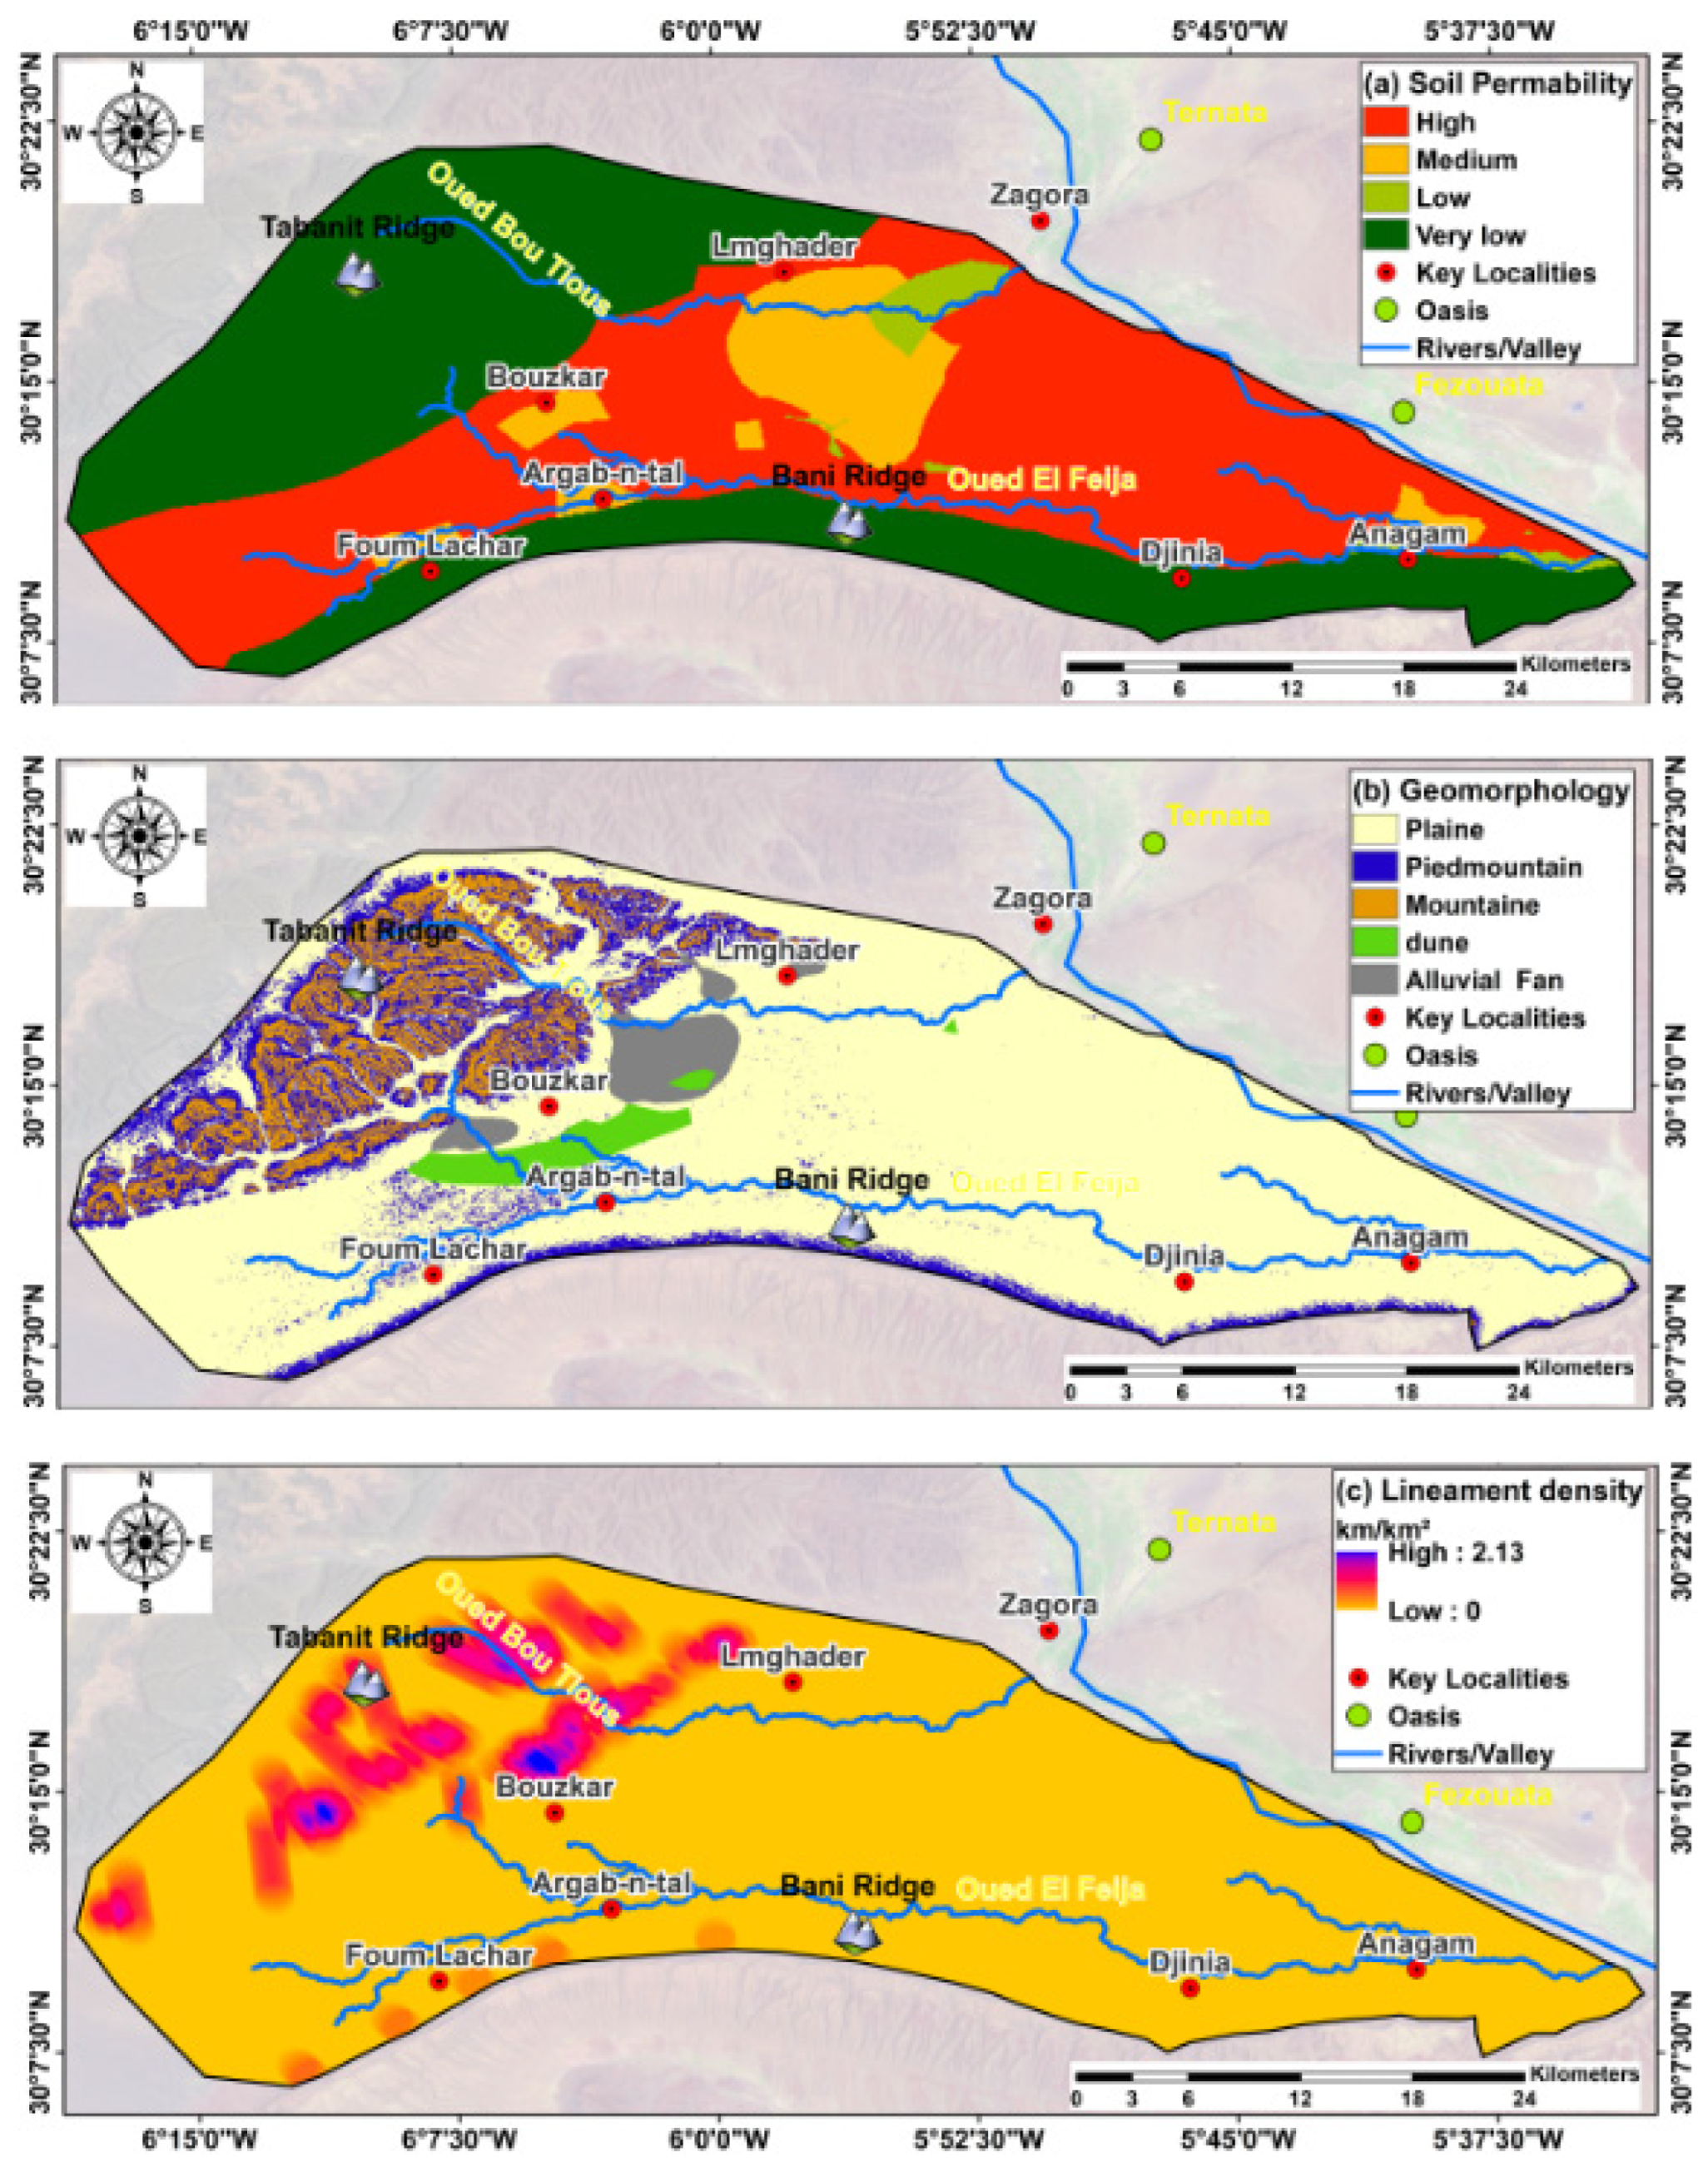
In terms of spatial distribution, Group A soils cover approximately 43.67% of the area, Group B 9.5%, and Group C 2.04%. Bare rocky areas (Group D), characterized by minimal permeability, constitute a significant portion of the landscape, accounting for 44.8% of the total surface (Figure 8a).
Geomorphology
Geomorphological characteristics significantly influence water infiltration and groundwater recharge [80,81]. Alluvial fans, characterized by fan-shaped sediment deposits, are vital for groundwater recharge [82], while pediments, with gently sloping surfaces, exhibit moderate recharge potential [83]. The geomorphological layer was developed through field observations, DEM analysis, and topographic and geological maps. The study area was categorized into five units and reclassified based on groundwater recharge suitability (Figure 8b): mountain (low suitability), covering 8.1% of the area and located in the southern and northern regions; piedmont (medium suitability), accounting for 13.95%; alluvial fan (high suitability), comprising ~3% and situated at the boundary between mountain and plain units; plain (high suitability), dominating the area at 72.78%; and sand dune (high suitability). The flat plain constitutes the majority of the study area, while alluvial fans and sand dunes are critical for high groundwater recharge potential (Figure 8b).
Lineament Density
Lineament density, representing the concentration of linear geological features, like faults and fractures, holds significant influence in hydrogeology (Figure 8c). Areas with higher lineament density serve as potential pathways for groundwater flow, facilitating movement and recharge while impacting aquifer formation and groundwater availability [84].

3.1.4. Anthropogenic Factor

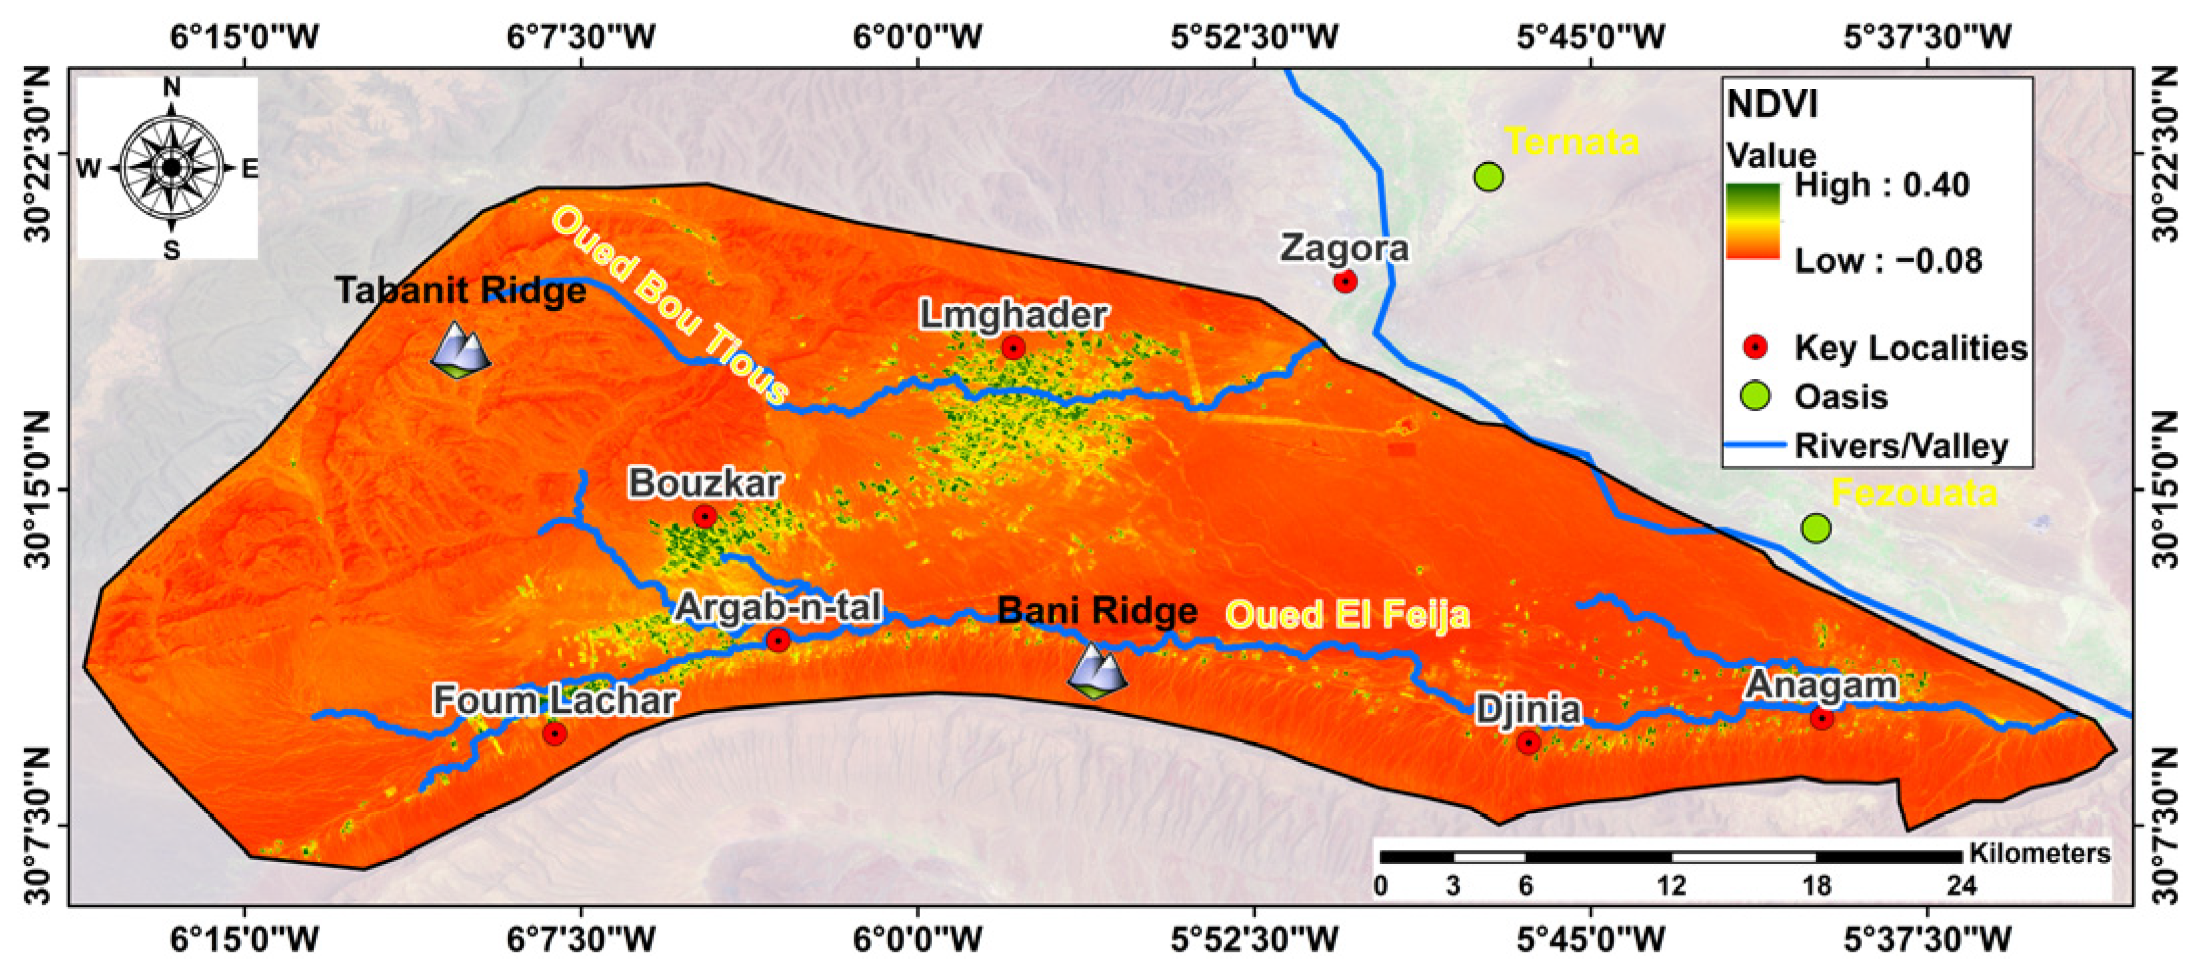
Land use land cover (LULC) is a good indicator of hydrological processes, including runoff generation and water distribution. Different LULC classes influence runoff characteristics in a watershed [85]. Variations in LULC classes significantly influence surface hydrology and watershed response. In this study, the NDVI was employed to classify LULC types, owing to its proven effectiveness in differentiating vegetation cover (Figure 9). The study area encompasses three primary LULC categories: bare land, rangeland, and cultivated land. Bare lands are the most dominant class, accounting for approximately 65.53% of the total area. These zones are primarily composed of mountainous formations, sandy plains, and reg surfaces characterized by scattered small black rocks. Rangelands occupy 31.17%, typically found near ephemeral streambeds, where sparse vegetation supports grazing activities, particularly for goats and camels. The remaining 3.3% of the area is classified as cultivated land, representing localized zones of agricultural activity (Figure 9).

3.2. Variable Relationships and Multicollinearity

The correlation matrix provides a detailed view of the relationships between the variables (Figure 10), highlighting both strong and weak associations. Elevation exhibits strong positive correlations with soil permeability (0.73), geomorphology (0.74), and slope (0.81), indicating that these variables tend to vary together. Geomorphology and slope are also highly correlated with each other (0.86), suggesting a strong relationship between these two features. The NDVI shows moderate negative correlations with elevation (−0.33) and soil permeability (−0.38), reflecting an inverse relationship. Distance from main streams displays weak to moderate correlations with most variables, with the strongest being a positive correlation with elevation (0.25). The TWI has negative correlations with several variables, such as elevation (−0.39) and geomorphology (−0.41), while curvature exhibits weak correlations across the board, indicating its relative independence from other variables.
The VIF analysis complements the correlation matrix by quantifying the extent of multicollinearity among the variables (Figure 10). Slope has the highest VIF value (5.92), indicating moderate multicollinearity, likely due to its strong correlations with elevation and geomorphology. Elevation (VIF = 4.43) and geomorphology (VIF = 4.17) also show moderate multicollinearity, consistent with their high correlations in the matrix. Soil permeability (VIF = 2.48) and rainfall (VIF = 2.08) exhibit lower but still noticeable multicollinearity. By contrast, variables such as NDVI (VIF = 1.32), distance from main streams (VIF = 1.28), TWI (VIF = 1.46), lineament density (VIF = 1.60), and curvature (VIF = 1.16) have VIF values well below the threshold of 10, indicating minimal multicollinearity and confirming their independence.

3.3. Groundwater Suitability Predictions Using ML Algorithms

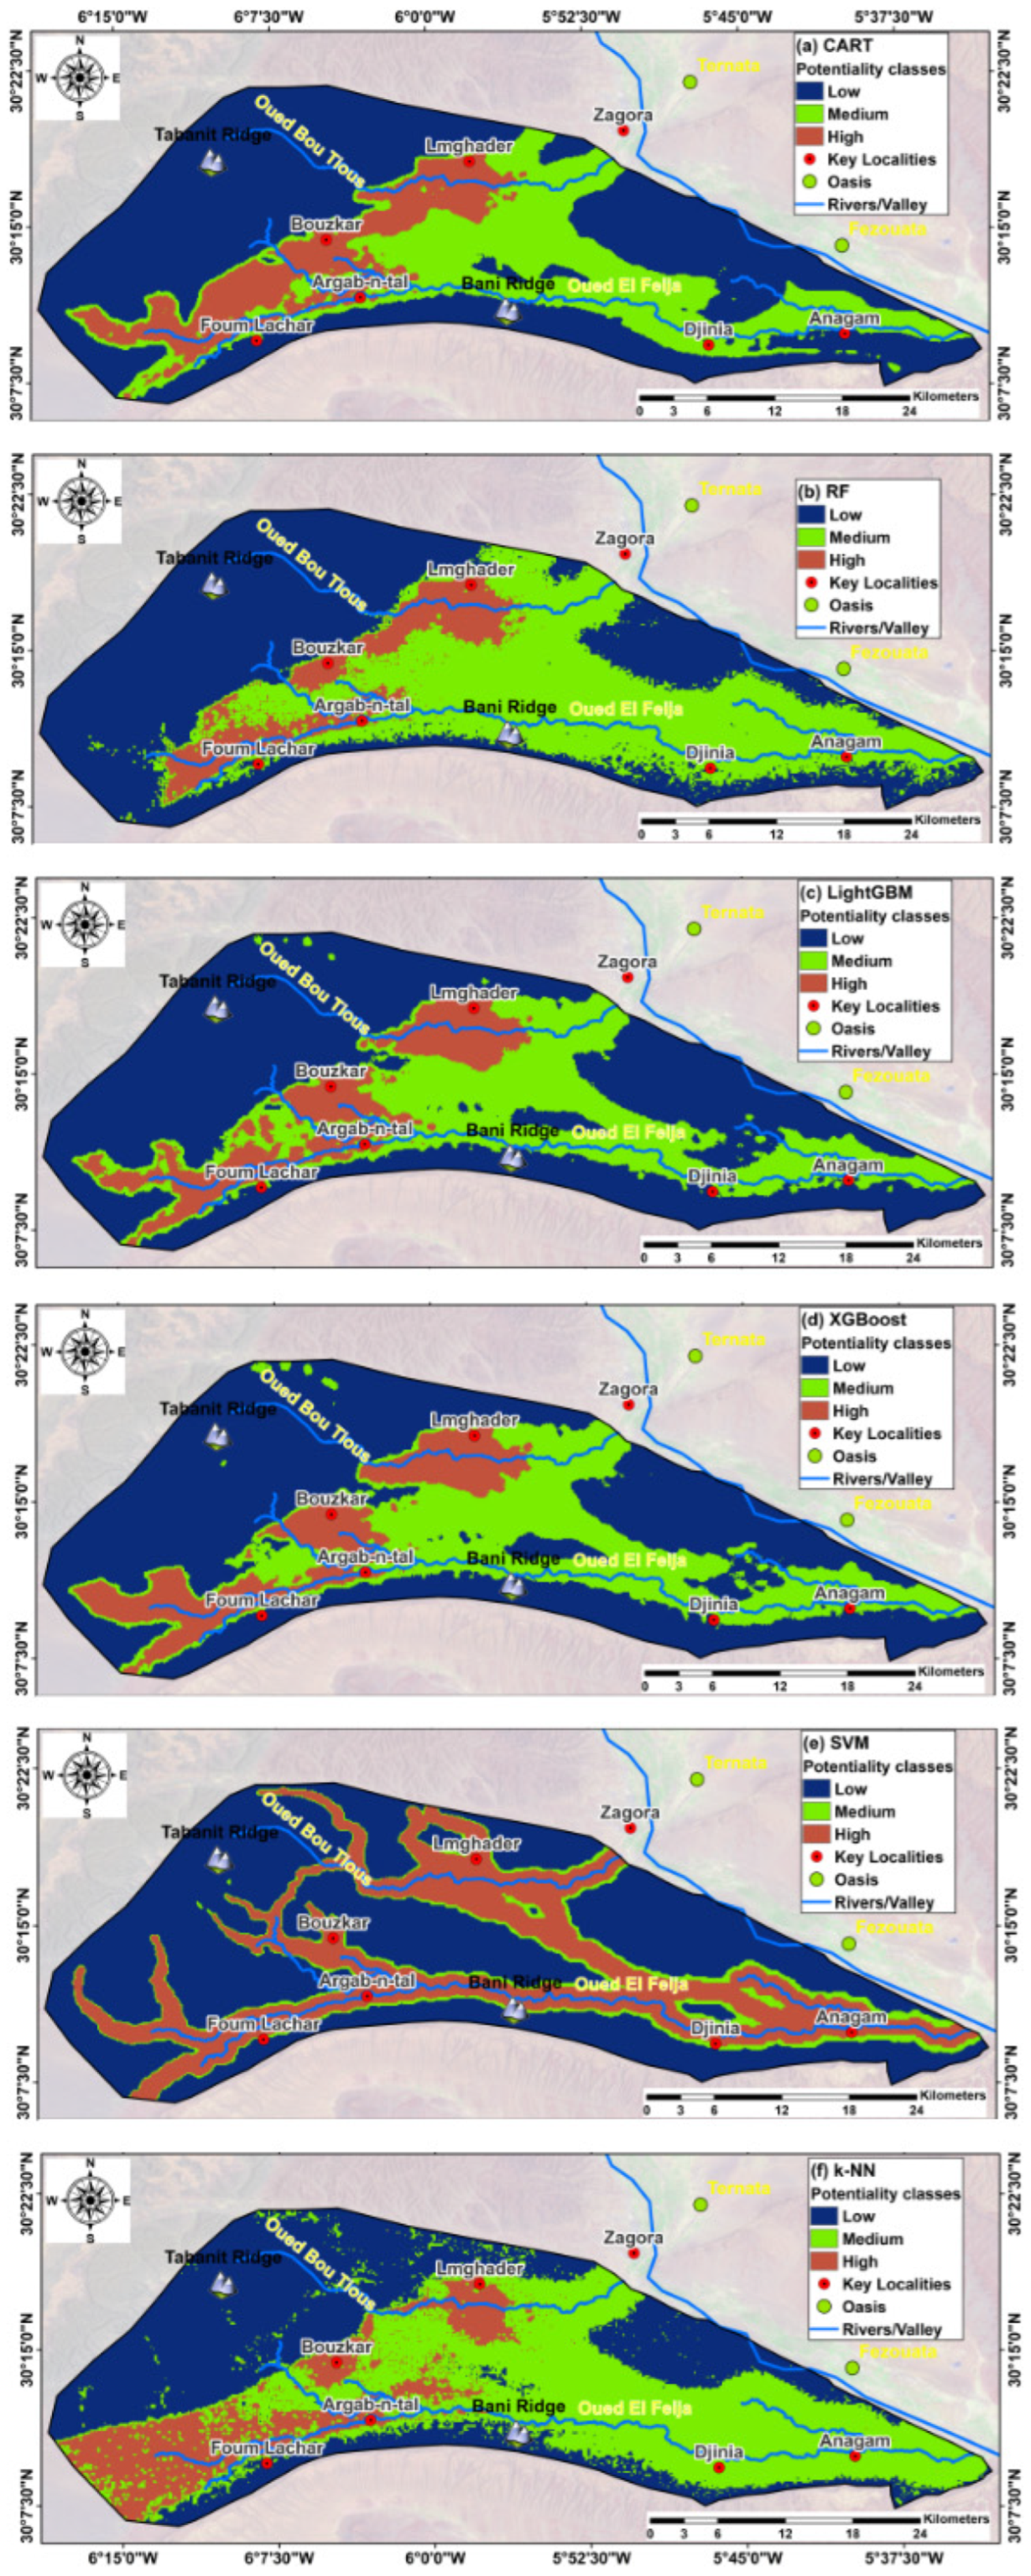
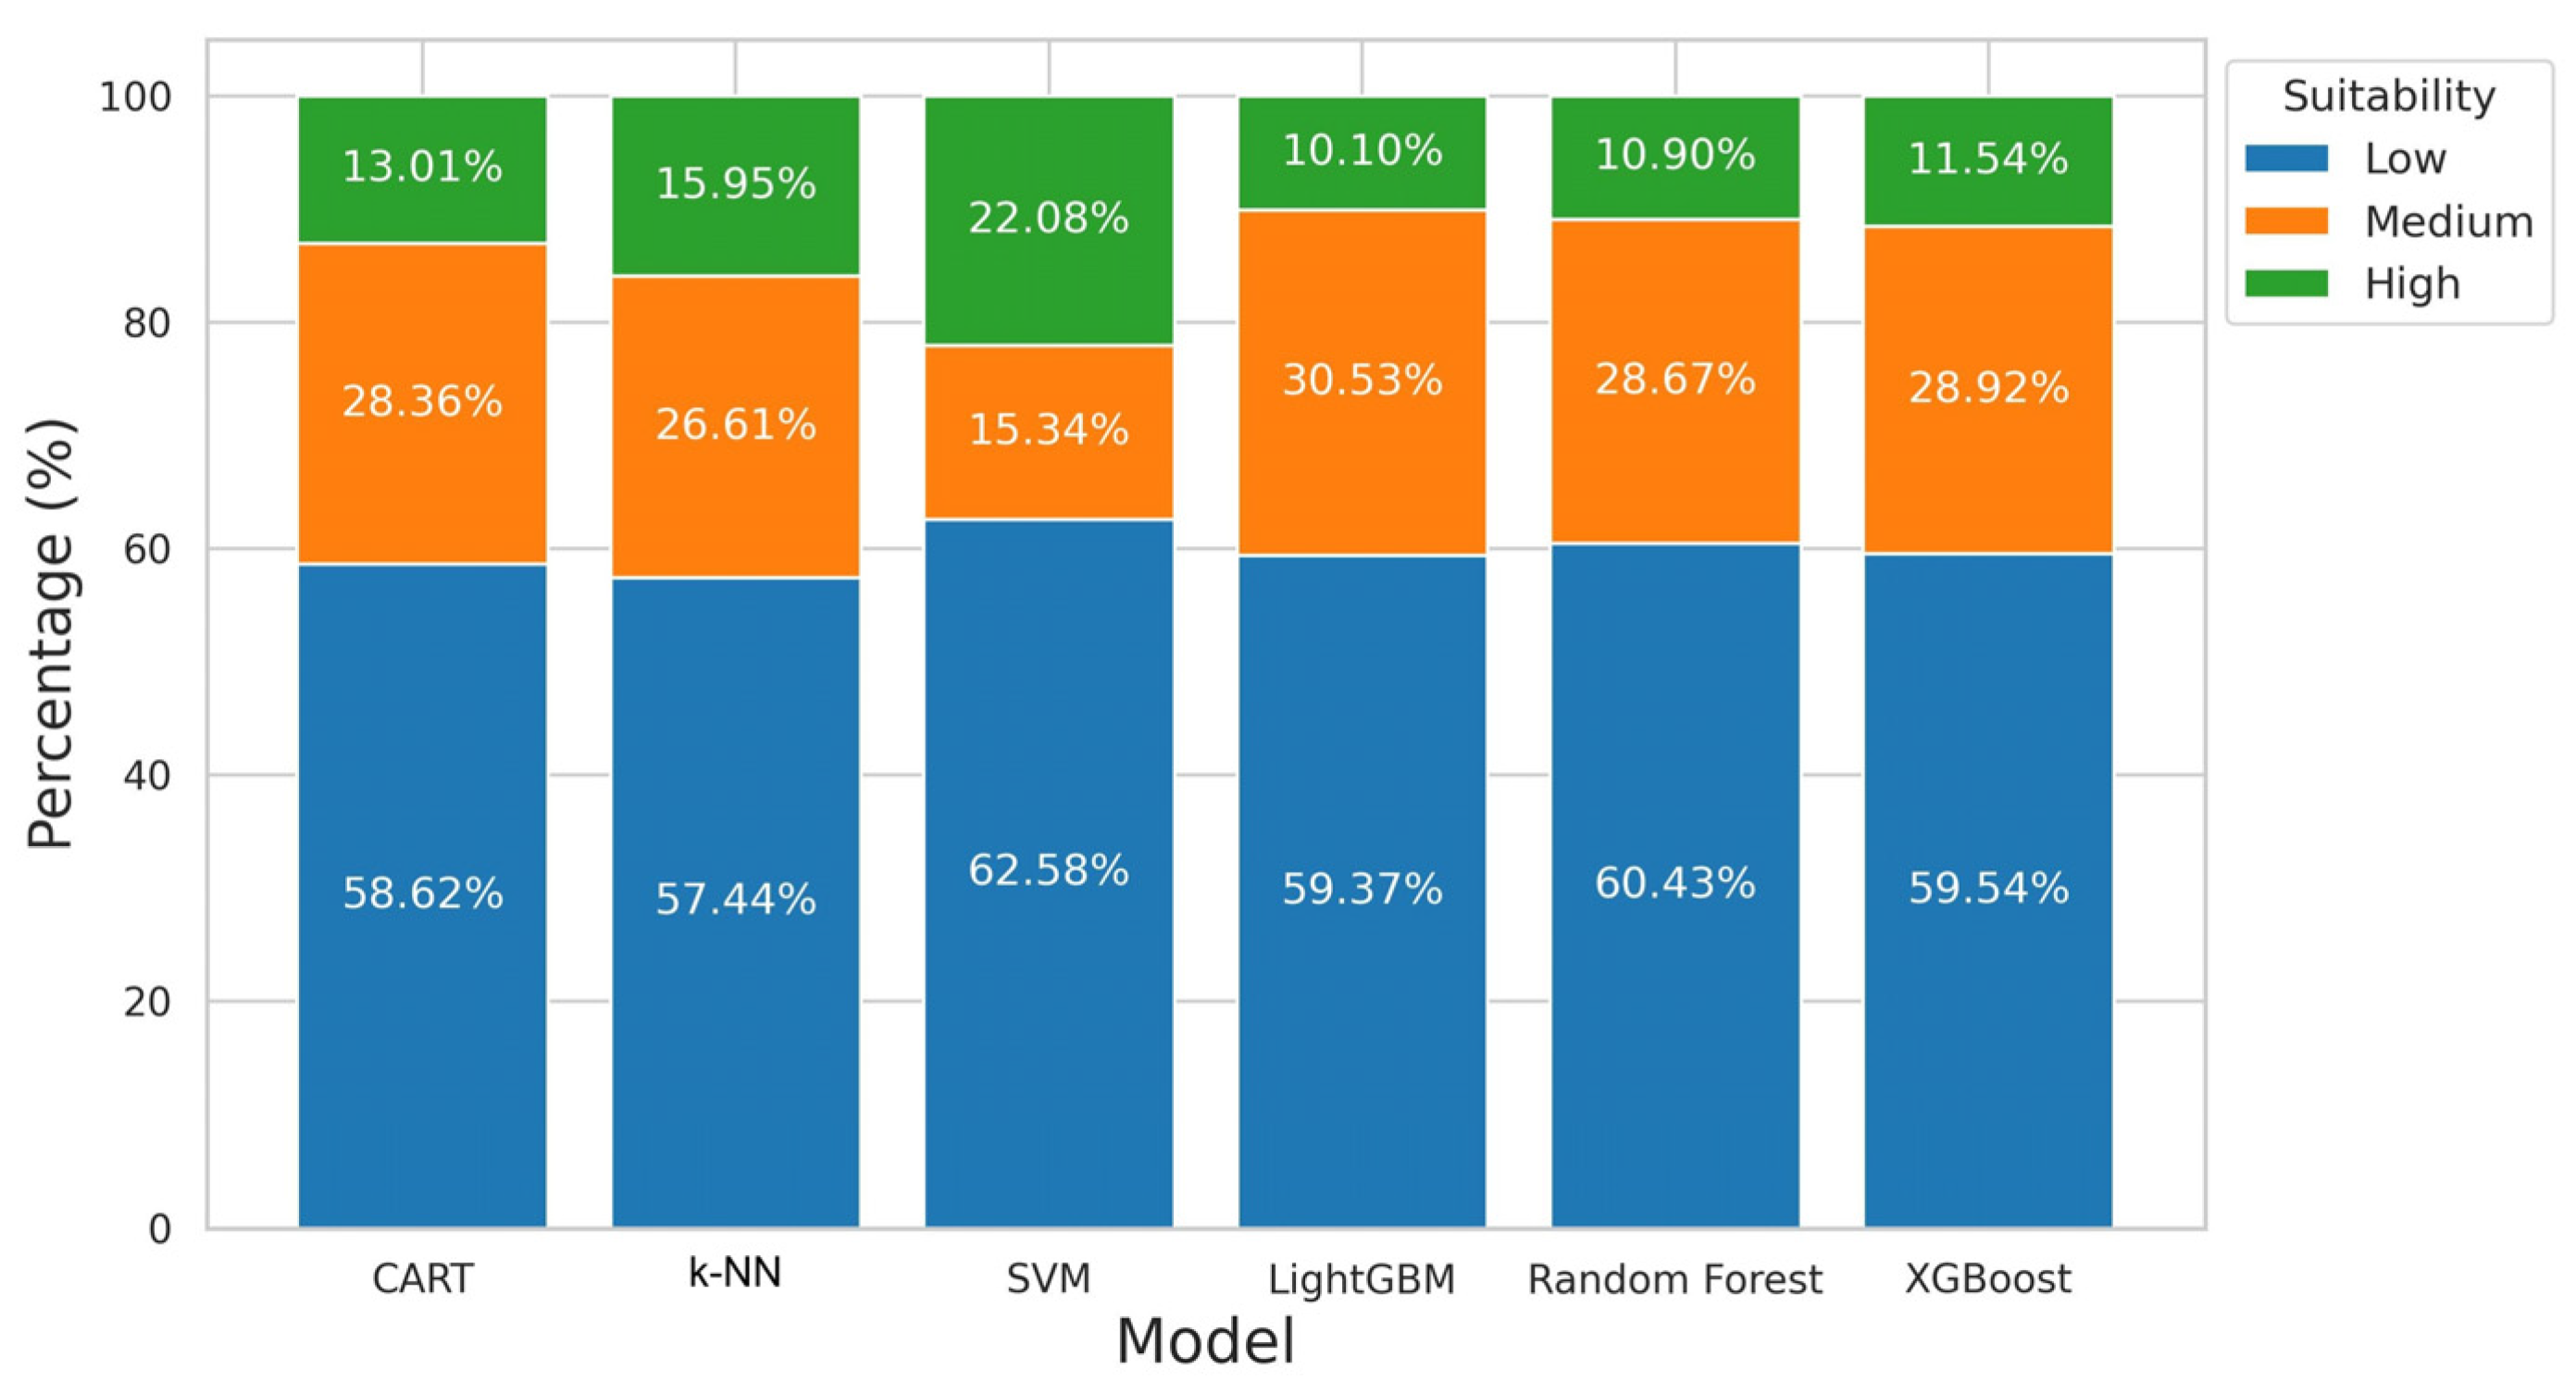
Figure 11 and Figure 12 illustrate the spatial distribution of groundwater potential zones as predicted by the six machine learning algorithms: CART, random forest, LightGBM, XGBoost, SVM, and k-NN. While all algorithms classify the study area into low, medium, and high suitability classes, the spatial patterns reveal distinct modeling behaviors. CART predicts 58.62% of the area as low suitability, 28.36% as medium, and 13.01% as high suitability. RF classifies 60.43% of the area as low suitability, 28.67% as medium, and 10.90% as high suitability, while LightGBM assigns 59.37% to low suitability, 30.53% to medium, and 10.10% to high suitability.
These three models generate relatively homogeneous predictions, with high suitability zones predominantly concentrated in the central and western sectors of the plain. These regions—corresponding to Mghader and Bouzkar—align with field observations confirming active agricultural use (See Figure 1), particularly watermelon cultivation, indicating strong agreement between model outputs and ground-truth data. XGBoost predicts 59.54% of the area as low suitability, 28.92% as medium, and 11.54% as high suitability, showing a slightly more dispersed pattern of high-suitability zones. By contrast, k-NN classifies 57.44% of the area as low, 26.61% as medium, and 15.95% as high suitability, while SVM predicts the highest proportion of high suitability (22.08%), with 62.58% low and 15.34% medium suitability. Both k-NN and especially SVM produce more fragmented outputs. The SVM model delineates elongated high-suitability corridors aligned with valley and stream networks, likely capturing narrow recharge pathways due to its kernel-based classification mechanics. Similarly, k-NN identifies several localized high-potential patches, reflecting its reliance on neighborhood-based classifications. These inter-model differences underscore the importance of algorithm selection when mapping hydrogeological variability and emphasize the value of combining spatial predictions with field verification for effective groundwater management and planning All algorithms generally predict the majority of the area as low suitability, followed by medium and high suitability, with variations in their specific distributions (Figure 11).
The feature importance table highlights the relative significance of various features across the different algorithms (Table 4). Distance from main streams is the most critical feature for CART (42.86%) and XGBoost (53.55%), while elevation stands out as the top feature for k-NN (57.43%) and SVM (46.16%). The NDVI is highly important for RF (19.50%) and LightGBM (19.97%), whereas distance from main streams is a key feature for k-NN (38.85%) and SVM (53.84%). LightGBM and RF show balanced importance across multiple features, such as slope (12.93% and 7.07%, respectively) and rainfall (13.60% and 10.62%). By contrast, features like geomorphology and lineament density have minimal or no importance in most algorithms. Overall, the table reveals that feature importance varies significantly across the algorithms, with soil permeability, elevation, NDVI, and distance from main streams being the most influential depending on the algorithm used.

3.4. SHAP-Based Sensitivity Analysis

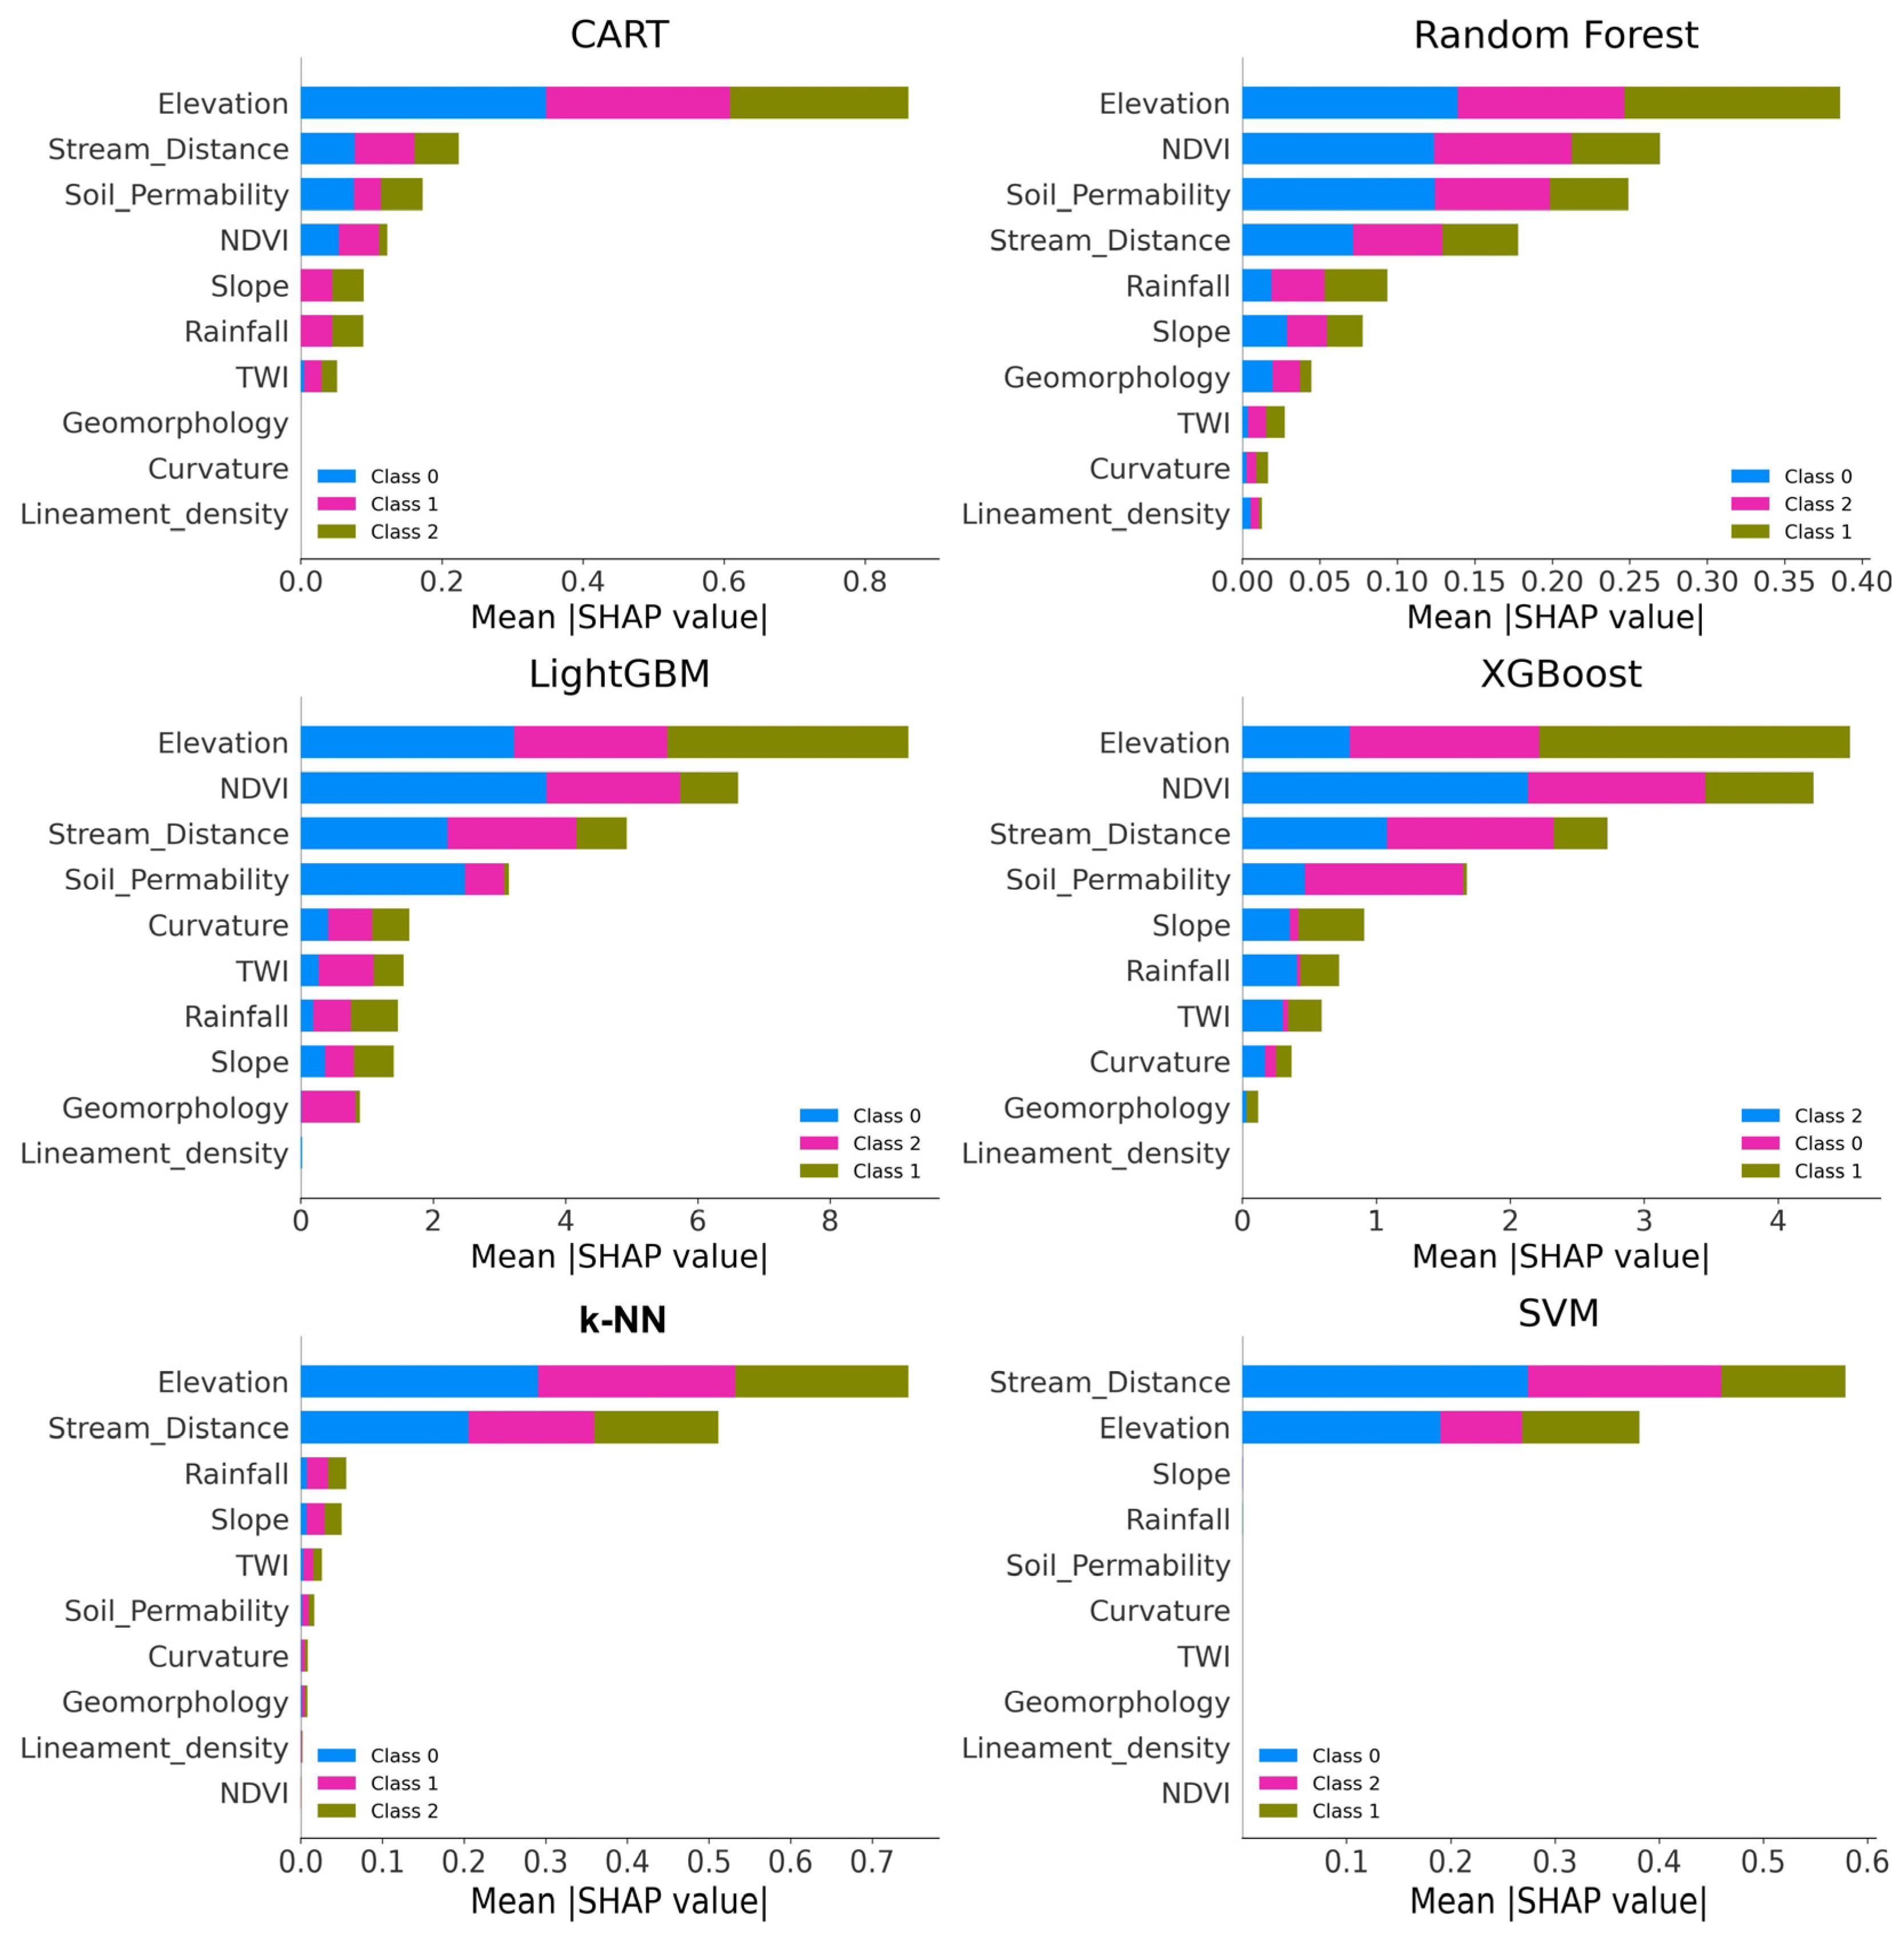
The SHAP-based global sensitivity analysis across the six ML algorithms reveals that elevation and stream distance are consistently the most influential features for predicting groundwater recharge potential (Figure 13), consistent with recent groundwater potential mapping studies [86,87,88]. Elevation modulates hydrologic processes by influencing precipitation distribution, surface runoff, and infiltration opportunities, a pattern well-supported in the hydrogeological literature. Stream proximity likewise enhances recharge potential, as near-stream zones often serve as critical conduit systems for aquifer replenishment. Additionally, NDVI and soil permeability exhibit strong importance indicating their effectiveness in capturing localized vegetation vigor and soil infiltration capacities. Conversely, geomorphology and lineament density consistently ranked lowest across all algorithms, suggesting limited predictive value in this dataset (Figure 13).

3.5. Real-World Implications: Where Is Groundwater Recharge Most Likely to Occur?

Based on the combined results of the feature importance rankings and SHAP sensitivity analysis, groundwater recharge in the Middle Draa Valley (MDV) is most likely to occur in distinct hydro-ecological settings, with the Feija Plain emerging as a key recharge zone. Areas adjacent to ephemeral streams and wadis, particularly in alluvial fans and low-lying sectors of the Feija Plain, serve as natural infiltration corridors where surface runoff accumulates during flash flood events. These zones are often characterized by vegetated corridors, where moisture availability supports vegetation growth, further indicating localized recharge potential. Moderate elevation zones (Figure 6a), especially at the interface between the Tabanit Group foothills and Jbel Bani (Figure 4), also promote surface water retention and infiltration. Additionally, permeable soils, including sandy and loamy textures common in the downstream Feija Plain (Figure 8a), enhance vertical water percolation into the aquifer. Lastly, vegetated areas with moderate NDVI values (Figure 9), found both along ephemeral streams and in the cultivated area reflect favorable infiltration conditions. Together, these patterns delineate the Feija Plain and its associated stream networks as high-priority zones for managed aquifer recharge interventions.

3.6. Evaluating Algorithms Performance

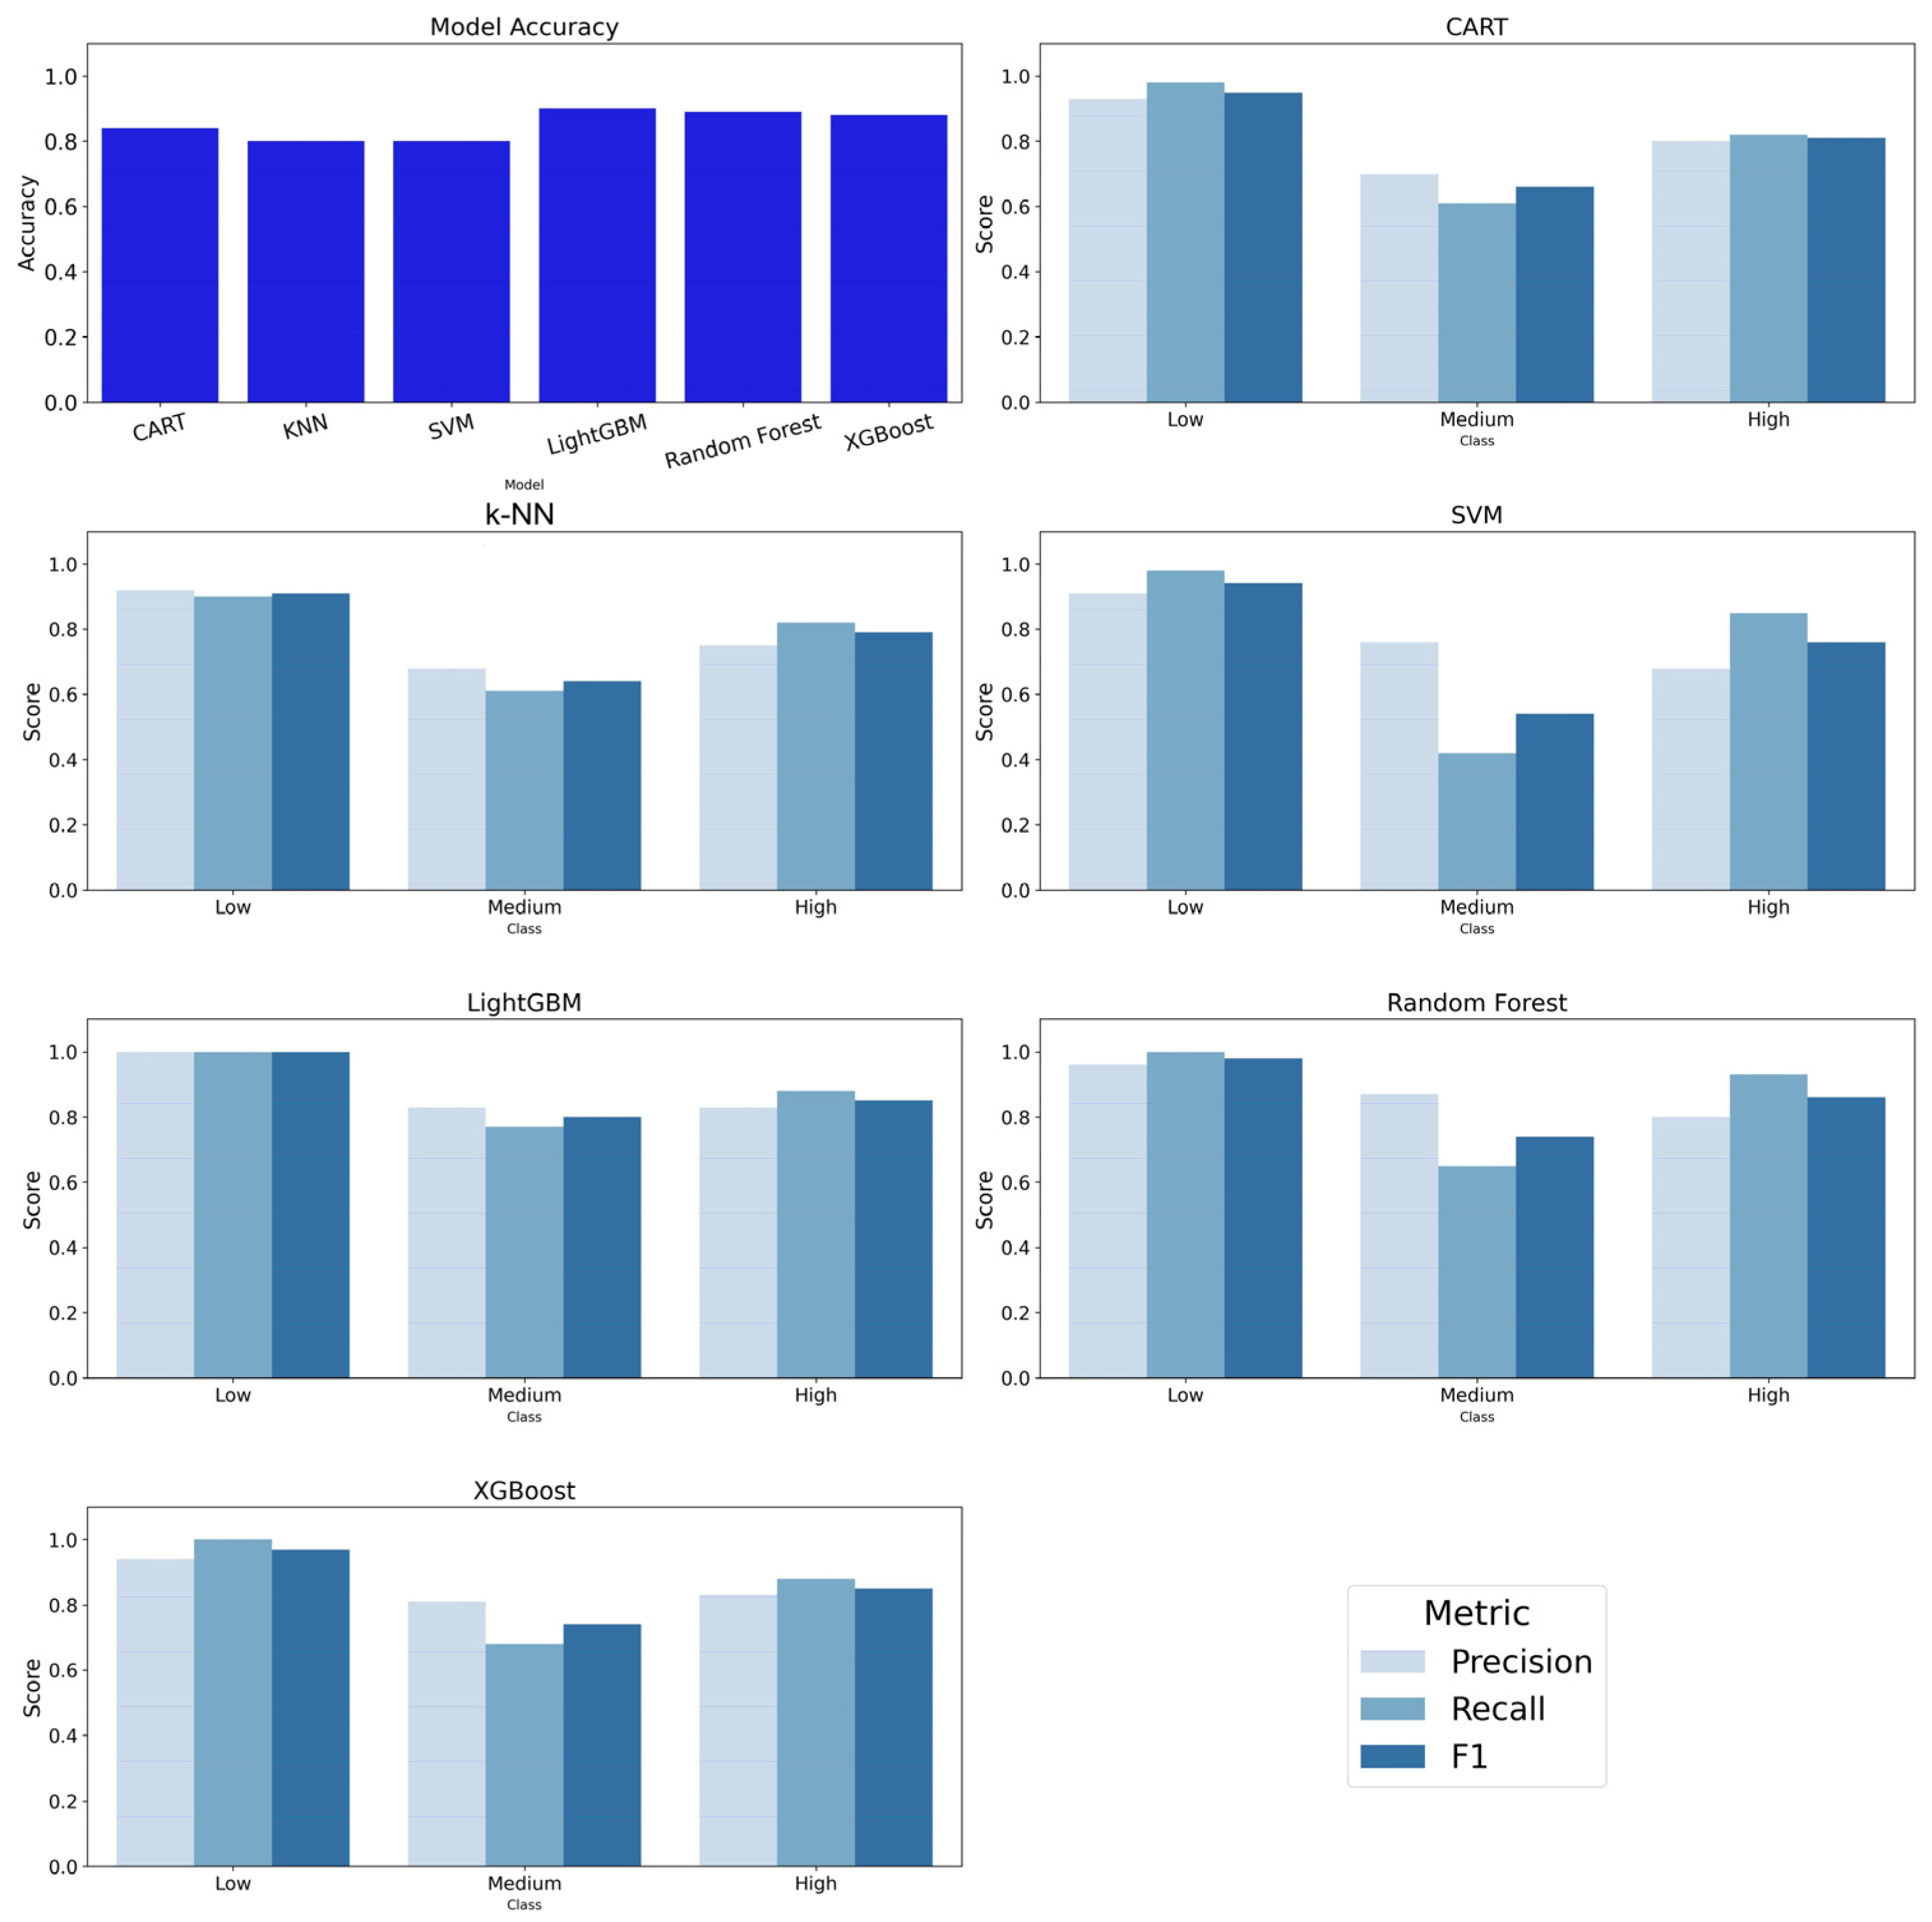
The ML algorithms were evaluated for their classification performance based on multiple metrics, including accuracy, macro-average AUC, weighted-average AUC, precision, recall, and F1-score. The algorithms were tested on a dataset with three classification levels: low, medium, and high. The results demonstrate significant variations in algorithm performance, with tree-based ensemble methods generally outperforming simpler algorithms like CART, k-NN, and SVM (Figure 13 and Figure 14, Table 5).
Among the algorithms, LightGBM achieved the highest accuracy of 0.90, making it the most precise classifier in this study. It also maintained high macro-average and weighted-average AUC scores of 0.96 and 0.97, respectively, indicating strong overall classification capability. RF followed closely with an accuracy of 0.89 and the highest AUC scores (0.97 for both macro and weighted averages), demonstrating excellent performance across all classes. XGBoost, another powerful ensemble algorithm, attained an accuracy of 0.88, slightly lower than LightGBM and RF, with macro and weighted AUC values of 0.95 and 0.96, respectively (Figure 14 and Figure 15, Table 4).
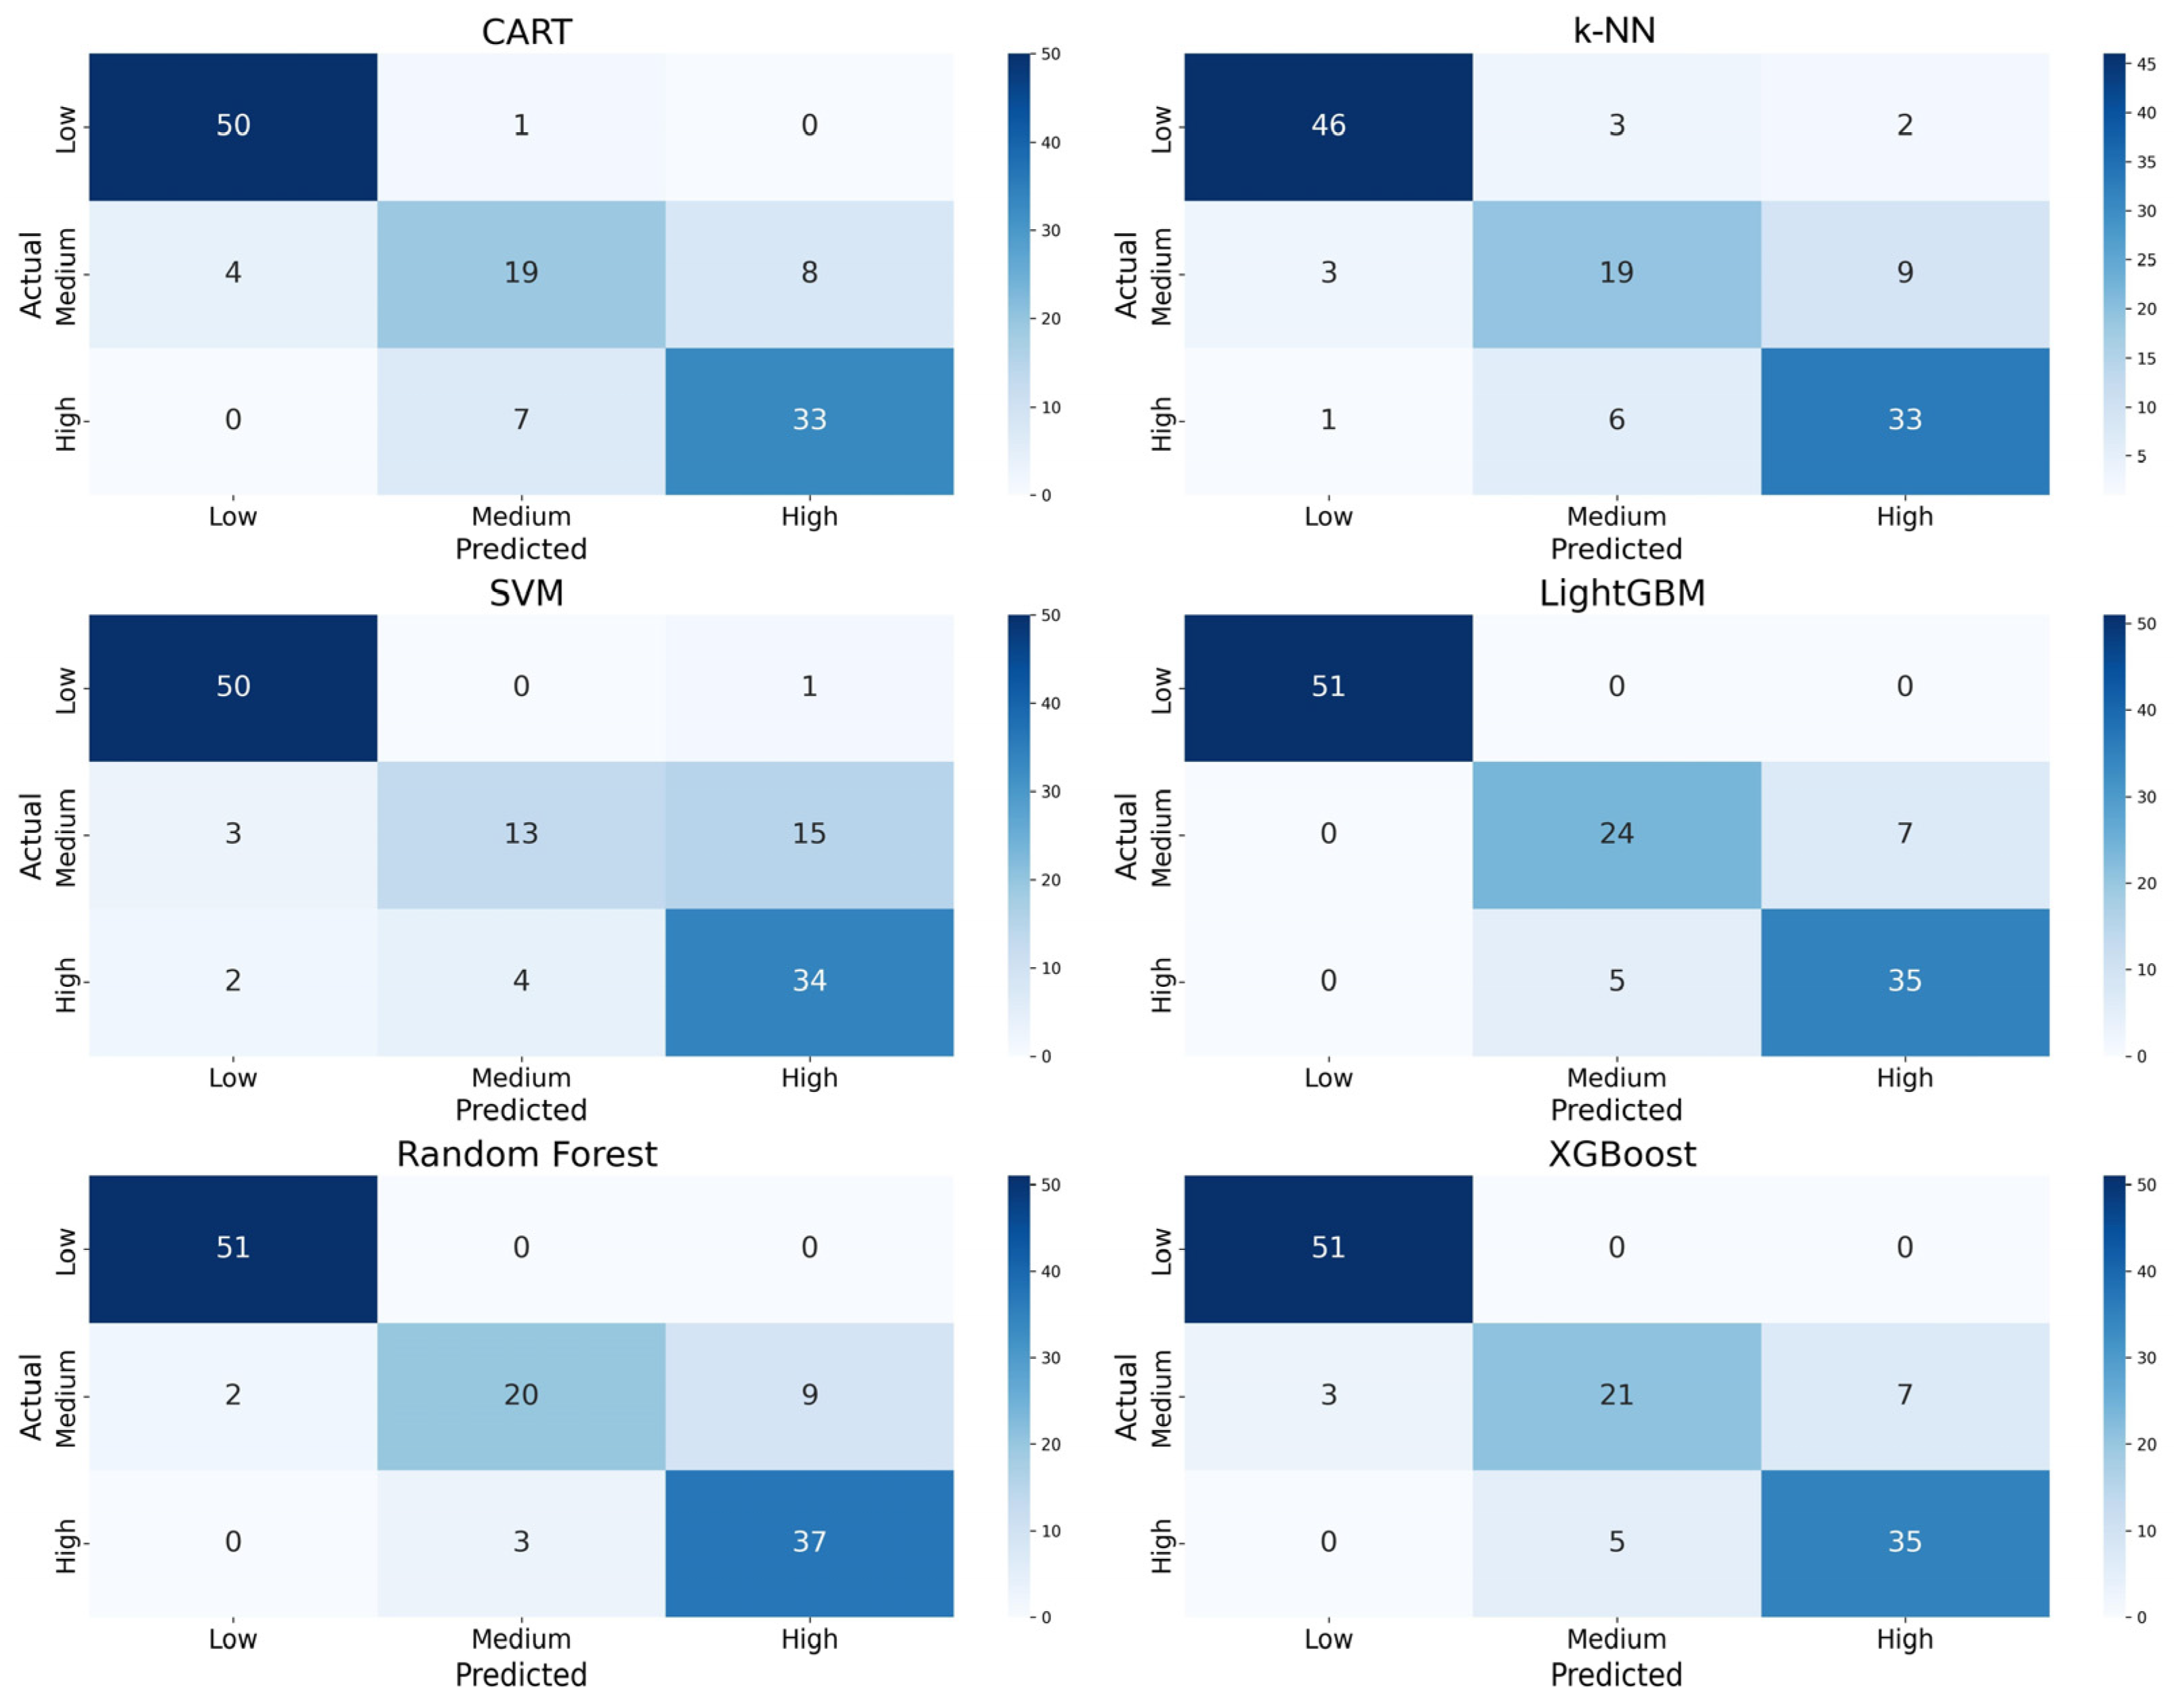
For individual class performance, LightGBM exhibited strong recall across all categories, achieving a perfect recall of 1.00 for the low class, 0.77 for the medium class, and 0.88 for the high class. RF performed well in the low and high classes but struggled slightly with the medium category, achieving a recall of 0.65. XGBoost followed a similar trend, with strong performance in the low and high classes but slightly weaker classification in the medium category (recall = 0.68). The confusion matrices of these algorithms show that misclassification was primarily concentrated in the medium category, which was the most difficult to differentiate. On the other hand, CART, k-NN, and SVM showed lower performance across multiple metrics. CART achieved an accuracy of 0.84, with macro and weighted AUC values of 0.86 and 0.88, respectively. It had a recall of 0.61 for the medium class, indicating difficulty in correctly classifying this category. k-NN and SVM performed even worse, with both algorithms reaching an accuracy of 0.80. k-NN achieved a macro AUC of 0.92 and a weighted AUC of 0.93, while SVM had slightly lower scores at 0.90 and 0.91, respectively. The medium class posed the biggest challenge for these algorithms as well, with SVM showing the lowest recall of 0.42 for this category, highlighting a significant number of misclassifications (Figure 16).

4. Discussion

This study demonstrates the effectiveness of integrating remote sensing, field-based observations, and machine learning (ML) techniques to delineate groundwater recharge zones in the Middle Draa Valley (MDV), a region experiencing increasing hydrological stress [89]. Among the models tested, ensemble learning algorithms—particularly LightGBM, random forest (RF), and XGBoost—emerged as the most effective classifiers. These algorithms excel at capturing complex feature interactions while reducing overfitting through boosting and bagging techniques [42,44]. LightGBM outperformed all other models, achieving high accuracy, strong AUC scores, and balanced recall across all recharge classes. It particularly excelled in correctly classifying the medium recharge class, outperforming both RF and XGBoost, while maintaining high precision for the low and high classes—making it the most reliable model in this context. Although RF demonstrated slightly lower overall accuracy than LightGBM, it achieved the highest AUC values, indicating high confidence in its predictions. However, its lower recall for the medium class (0.65) suggests a limitation in discriminating this transitional category. XGBoost showed strong predictive performance for the low and high classes but moderate results for the medium class. The key distinction among these models lies in their ability to generalize across all recharge categories, with LightGBM offering the best overall trade-off.
By contrast, simpler algorithms, such as CART, k-NN, and SVM, underperformed. CART, as a single decision tree, lacked the ensemble strength needed to manage feature variability, resulting in lower accuracy and AUC values. k-NN and SVM, both non-ensemble methods, struggled particularly with the medium class; SVM performed especially poorly. These results highlight the limitations of simpler models in delineating complex and nonlinear decision boundaries. Overall, LightGBM proved to be the optimal algorithm, with RF and XGBoost providing robust alternatives.
To situate our findings within a broader context, we compare our results with recent studies conducted in other arid and semi-arid environments. Notably, Halder et al. (2024) [90] applied four ensemble ML techniques—RF, adaptive boosting (AdaBoost), Extreme Gradient Boosting (XGBoost), and voting ensemble (VE)—to delineate groundwater potential zones in the drought-prone Bankura district of West Bengal, India. Their study concluded that RF and XGBoost slightly outperformed all other algorithms, underscoring the dominance of tree-based algorithms in groundwater prediction tasks. In Upper Egypt’s Eastern Desert, Morgan et al. (2023) [91] developed a groundwater potential map using RF. They achieved outstanding performance, accuracy of 97%, demonstrating the effectiveness of RF in hyper-arid regions. Also, a recent peer-reviewed study by Elhassouny (2024) [92] employed ML prediction algorithms (RF, XGBoost, and AdaBoost) to simulate spatiotemporal groundwater recharge in Morocco. The results indicated that RF and XGBoost outperformed other algorithms, showing the highest accuracy for both temporal and spatial recharge prediction.
One of the key findings was the consistent identification of high groundwater recharge potential zones near ephemeral streams, in areas with permeable soils and favorable topography. These zones align well with hydrological expectations [93,94], reinforcing the relevance of the selected conditioning factors. However, despite their natural suitability, the lack of appropriate floodwater harvesting infrastructure—such as recharge basins or infiltration trenches—remains a critical obstacle to exploiting intense but infrequent rainfall events. Based on our results, we recommend prioritizing the installation of small-scale managed aquifer recharge structures in high-potential zones. Such interventions could substantially enhance aquifer replenishment and mitigate surface runoff losses, especially following extreme events like those of 2014, 2024, and 2025.
To mitigate groundwater depletion, this study recommends targeted interventions, such as the construction of rainwater harvesting infrastructure in high-recharge potential zones. These findings provide concrete pathways for integrating GeoAI-driven predictive mapping into the implementation of Morocco’s National Water Strategy 2050. In arid regions with sparse hydrometeorological monitoring, the combination of machine learning and remote sensing offers a cost-effective, spatially explicit decision-support framework for sustainable water management.
However, this study is subject to several limitations. A major constraint is the spatial resolution of the DEM used, which is limited to 30 m. The absence of high-resolution DEM data restricts the precision of the topographic analyses essential for identifying optimal sites for recharge infrastructure. For future implementation projects, the use of finer-resolution DEMs and satellite imagery would significantly enhance the accuracy of terrain modeling and site selection. Additionally, the lack of detailed soil permeability datasets for arid regions of Morocco hinders broader research efforts; producing such maps requires significant time and resources. Similarly, the absence of high-resolution sand horizon data limits the ability to evaluate sub-surface conditions and to determine where infiltration structures would be most effective. Finally, the limited number of meteorological stations within the study area remains a critical gap, reducing the ability to validate satellite-derived climatic data and constraining the accuracy of rainfall-based hydrological modeling.

5. Conclusions

This study demonstrates the effectiveness of integrating machine learning (ML) algorithms with remote sensing (RS) data and field-based observations to delineate groundwater recharge zones in the water-stressed Middle Draa Valley. By evaluating six ML algorithms and incorporating ten environmental and anthropogenic factors, we successfully identified key areas with high recharge potential, particularly near ephemeral streams, alluvial fans, and zones with permeable soils. Among the models tested, LightGBM achieved the highest predictive accuracy, followed closely by RF and XGBoost, confirming the robustness of ensemble learning methods for GWRZ classification. A feature importance analysis revealed that elevation, stream distance, and soil permeability were the most influential variables shaping recharge potential. This is especially relevant in the Feija Plain, where ongoing aquifer depletion underscores the urgent need to align land use planning and cropping systems with hydro-ecological realities.
To mitigate further groundwater depletion and to improve aquifer sustainability, this study recommends the implementation of small-scale managed aquifer recharge infrastructure in the high-recharge zones identified by our models. These targeted interventions can significantly enhance floodwater capture, reduce runoff losses, and support long-term water security in oasis environments. Looking ahead, future research should focus on integrating ML models with expert-based decision frameworks, like the Analytical Hierarchy Process (AHP), and fuzzy logic to improve interpretability and to facilitate stakeholder-driven planning. Moreover, applying deep learning models could further enhance spatial pattern recognition and dynamic recharge prediction under climate variability scenarios.
In the longer term, the methods developed in this study offer a replicable framework for other arid and semi-arid regions facing similar challenges. the approach can support adaptive water management strategies and help achieve the Sustainable Development Goals related to water availability, agricultural resilience, and ecosystem protection.

Author Contributions

Conceptualization, A.M., M.B. and Y.M.Y.; data curation, M.B.; formal analysis, A.E., M.M.H., N.K., B.Đ., E.G. and Y.M.Y.; funding acquisition, B.Đ.; investigation, A.M. and M.B.; methodology, A.M., A.E. and E.G.; project administration, B.Đ. and K.A.E.-N.; resources, A.E. and K.A.E.-N.; software, A.M. and J.A.K.; supervision, N.K., K.A.E.-N. and Y.M.Y.; validation, A.M., M.B. and J.A.K.; visualization, A.E., M.M.H., N.K. and E.G.; writing—original draft, A.M., A.E., M.B. and J.A.K.; writing—review and editing, M.M.H., N.K., J.A.K., B.Đ., E.G. and Y.M.Y. All authors have read and agreed to the published version of the manuscript.

Funding

Funding is provided within the scientific project “Hydrological and geodetic analysis of the watercourse-second part”, UNIN-TEH-25-1-3, from 2025, by University North, Croatia.

Data Availability Statement

The datasets generated during and/or analyzed during the current study are available from the corresponding author upon reasonable request.

Acknowledgments

The authors would like to acknowledge the Deanship of Graduate Studies and Scientific Research, Taif University, for funding this work. The authors would like to thank the USGS EarthExplorer for providing the Landsat and DEM datasets.

Conflicts of Interest

The authors have no conflicts of interest to declare that are relevant to the content of this article.

References

  1. Arafa, N.A.; El-Said Salem, Z.; Abdeldayem, A.L.; Ghorab, M.A.; Moustafa, Y.M.; Soliman, S.A.; Farag, M.H.; Purohit, S.; Elhag, M.; Youssef, Y.M. Advancing Deltaic Aquifer Vulnerability Mapping to Seawater Intrusion and Human Impacts in Eastern Nile Delta: Insights from Machine Learning and Hydrochemical Perspective. Earth Syst. Environ. 2024, 1–26. [Google Scholar] [CrossRef]
  2. El-Said Salem, Z.; Arafa, N.A.; Abdeldayem, A.L.; Youssef, Y.M. Machine Learning-Enhanced GALDIT Modeling for the Nile Delta Aquifer Vulnerability Assessment in the Mediterranean Region. Groundw. Sustain. Dev. 2025, 28, 101403. [Google Scholar] [CrossRef]
  3. Khouz, A.; Trindade, J.; El Bchari, F.; Santos, P.P.; Reis, E.; Moumane, A.; Ezzahra El Ghazali, F.; Jadoud, M.; Bougadir, B. Integrating GALDIT and GIS for Assessing Sea Water Intrusion Susceptibility in the Akermoud Coastal Water Table, Morocco: Implications for Sustainability. In Advances in Geospatial Technologies; Batchi, M., Moumane, A., Eds.; IGI Global: Hershey, PA, USA, 2024; pp. 35–72. ISBN 979-8-3693-9651-3. [Google Scholar]
  4. Henao Casas, J.D.; Fernández Escalante, E.; Ayuga, F. Alleviating Drought and Water Scarcity in the Mediterranean Region through Managed Aquifer Recharge. Hydrogeol. J. 2022, 30, 1685–1699. [Google Scholar] [CrossRef]
  5. Youssef, Y.M.; Gemail, K.S.; Sugita, M.; AlBarqawy, M.; Teama, M.A.; Koch, M.; Saada, S.A. Natural and Anthropogenic Coastal Environmental Hazards: An Integrated Remote Sensing, GIS, and Geophysical-Based Approach. Surv. Geophys. 2021, 42, 1109–1141. [Google Scholar] [CrossRef]
  6. Bouchaou, L.; El Alfy, M.; Shanafield, M.; Siffeddine, A.; Sharp, J. Groundwater in Arid and Semi-Arid Areas. Geosciences 2024, 14, 332. [Google Scholar] [CrossRef]
  7. Bahouq, T.; Moumane, A.; Touhami, N. Monitoring Agricultural Dynamics and Its Impact on Water Resources Using GIS and Remote Sensing Data: A Case Study in the Ben Mansour-Mnasra Region, Kenitra, Morocco. In Advances in Geospatial Technologies; Batchi, M., Moumane, A., Eds.; IGI Global: Hershey, PA, USA, 2024; pp. 183–210. ISBN 979-8-3693-9651-3. [Google Scholar]
  8. Moumane, A.; Bahouq, T.; Ghazi, A. Integrating GIS, Remote Sensing, and Analytic Hierarchical Process (AHP) for Mapping of Groundwater-Recharge Potential Zones in Kenitra Province, Morocco: Toward Sustainable Development Goals Achievement. Euro-Mediterr. J. Environ. Integr. 2025, 10, 831–851. [Google Scholar] [CrossRef]
  9. Embaby, A.; Youssef, Y.M.; Abu El-Magd, S.A. Delineation of Lineaments for Groundwater Prospecting in Hard Rocks: Inferences from Remote Sensing and Geophysical Data. Environ. Earth Sci. 2024, 83, 62. [Google Scholar] [CrossRef]
  10. Ahmed, M.; Aqnouy, M.; Stitou El Messari, J. Sustainability of Morocco’s Groundwater Resources in Response to Natural and Anthropogenic Forces. J. Hydrol. 2021, 603, 126866. [Google Scholar] [CrossRef]
  11. Alcalá, F.J.; Martínez-Valderrama, J.; Robles-Marín, P.; Guerrera, F.; Martín-Martín, M.; Raffaelli, G.; De León, J.T.; Asebriy, L. A Hydrological–Economic Model for Sustainable Groundwater Use in Sparse-Data Drylands: Application to the Amtoudi Oasis in Southern Morocco, Northern Sahara. Sci. Total Environ. 2015, 537, 309–322. [Google Scholar] [CrossRef]
  12. Echogdali, F.Z.; Boutaleb, S.; Bendarma, A.; Saidi, M.E.; Aadraoui, M.; Abioui, M.; Ouchchen, M.; Abdelrahman, K.; Fnais, M.S.; Sajinkumar, K.S. Application of Analytical Hierarchy Process and Geophysical Method for Groundwater Potential Mapping in the Tata Basin, Morocco. Water 2022, 14, 2393. [Google Scholar] [CrossRef]
  13. Boudellah, A.; Moustaine, R.E.; Gharmali, A.E.; Maliki, A.; Moutaouakil, S.; Bouriqi, A.; Khouz, A.; Boulanouar, M.; Ibouh, H.; Ghamizi, M.; et al. Groundwater Quality in Zagora Southeast of Morocco by Using Physicochemical Analysis and Geospatial Techniques. Environ. Monit. Assess. 2023, 195, 624. [Google Scholar] [CrossRef]
  14. Karmaoui, A.; Minucci, G.; Messouli, M.; Khebiza, M.Y.; Ifaadassan, I.; Babqiqi, A. Climate Change Impacts on Water Supply System of the Middle Draa Valley in South Morocco. In Climate Change, Food Security and Natural Resource Management; Behnassi, M., Pollmann, O., Gupta, H., Eds.; Springer International Publishing: Cham, Switzerland, 2019; pp. 163–178. ISBN 978-3-319-97090-5. [Google Scholar]
  15. Warner, N.; Lgourna, Z.; Bouchaou, L.; Boutaleb, S.; Tagma, T.; Hsaissoune, M.; Vengosh, A. Integration of Geochemical and Isotopic Tracers for Elucidating Water Sources and Salinization of Shallow Aquifers in the Sub-Saharan Drâa Basin, Morocco. Appl. Geochem. 2013, 34, 140–151. [Google Scholar] [CrossRef]
  16. Moumane, A.; Al Karkouri, J.; Benmansour, A.; El Ghazali, F.E.; Fico, J.; Karmaoui, A.; Batchi, M. Monitoring Long-Term Land Use, Land Cover Change, and Desertification in the Ternata Oasis, Middle Draa Valley, Morocco. Remote Sens. Appl. Soc. Environ. 2022, 26, 100745. [Google Scholar] [CrossRef]
  17. Rössler, M.; Kirscht, H.; Rademacher, C.; Platt, S.; Kemmerling, B.; Linstädter, A. II-5.4 Migration and Resource Management in the Drâa Valley, Southern Morocco. In Impacts of Global Change on the Hydrological Cycle in West and Northwest Africa; Springer: Berlin/Heidelberg, Germany, 2010. [Google Scholar]
  18. Karmaoui, A.; Moumane, A. Changes in the Environmental Vulnerability of Oasean System (Desert Oasis), Pilot Study in Middle Draa Valley, Morocco. Expert Opin. Environ. Biol. 2016, 5. [Google Scholar] [CrossRef]
  19. Johannsen, I.; Hengst, J.; Goll, A.; Höllermann, B.; Diekkrüger, B. Future of Water Supply and Demand in the Middle Drâa Valley, Morocco, under Climate and Land Use Change. Water 2016, 8, 313. [Google Scholar] [CrossRef]
  20. Akdim, M.; Akdim, H.; Sabiri, A.; Alami, A. Land-Use Change and Sustainability in the South-Eastern Oases of Morocco. BGSS 2023, 59, 95–109. [Google Scholar] [CrossRef]
  21. Moumane, A.; El Ghazali, F.E.; Al Karkouri, J.; Delorme, J.; Batchi, M.; Chafiki, D.; Karmaoui, A. Monitoring Spatiotemporal Variation of Groundwater Level and Salinity under Land Use Change Using Integrated Field Measurements, GIS, Geostatistical, and Remote-Sensing Approach: Case Study of the Feija Aquifer, Middle Draa Watershed, Moroccan Sahara. Environ. Monit. Assess. 2021, 193, 769. [Google Scholar] [CrossRef]
  22. Sfa, F.E.; Nemiche, M.; Rayd, H. A Generic Macroscopic Cellular Automata Model for Land Use Change: The Case of the Drâa Valley. Ecol. Complex. 2020, 43, 100851. [Google Scholar] [CrossRef]
  23. Lamqadem, A.A.; Saber, H.; Pradhan, B. Long-Term Monitoring of Transformation from Pastoral to Agricultural Land Use Using Time-Series Landsat Data in the Feija Basin (Southeast Morocco). Earth Syst. Environ. 2019, 3, 525–538. [Google Scholar] [CrossRef]
  24. Silva-Novoa Sánchez, L.M.; Bossenbroek, L.; Schilling, J.; Berger, E. Governance and Sustainability Challenges in the Water Policy of Morocco 1995–2020: Insights from the Middle Draa Valley. Water 2022, 14, 2932. [Google Scholar] [CrossRef]
  25. Silva-Novoa Sánchez, L.M.; Schilling, J.; Bossenbroek, L.; Ezzayyat, R.; Berger, E. Drivers of Conflict over Customary Land in the Middle Drâa Valley of Morocco. World Dev. 2025, 188, 106872. [Google Scholar] [CrossRef]
  26. Karmaoui, A.; Moumane, A.; Akchbab, J. Environmental Hazards Assessment at Pre-Saharan Local Scale: Case Study from the Draa Valley, Morocco. In Advances in Environmental Engineering and Green Technologies; Karmaoui, A., Ed.; IGI Global: Hershey, PA, USA, 2020; pp. 250–267. ISBN 978-1-5225-9771-1. [Google Scholar]
  27. Fico, J. Frontiers of Fortune: Mobilising Land, Water, and Collective Identity for Watermelon Production in Southeastern Morocco. J. N. Afr. Stud. 2024, 1–24. [Google Scholar] [CrossRef]
  28. Echogdali, F.Z.; Boutaleb, S.; Jauregui, J.; Elmouden, A. Cartography of Flooding Hazard in Semi-Arid Climate: The Case of Tata Valley (South-East of Morocco). J. Geogr. Nat. Disast. 2018, 8, 1000214. [Google Scholar] [CrossRef]
  29. Moumane, A.; Bahouq, T.; Karmaoui, A.; Laghfiri, D.; Yassine, M.; Karkouri, J.A.; Batchi, M.; Faouzi, M.; Boulakhbar, M.; Youssef, A.A. Lake Iriqui’s Remarkable Revival: Field Observations and a Google Earth Engine Analysis of Its Recovery After over Half a Century of Desiccation. Land 2025, 14, 104. [Google Scholar] [CrossRef]
  30. Al-Ruzouq, R.; Shanableh, A.; Mukherjee, S.; Khalil, M.A.; Gibril, M.B.; Jena, R.; Yilmaz, A.G.; Hammouri, N.A. Comparative Analysis of Machine Learning and Analytical Hierarchy Analysis for Artificial Groundwater Recharge Map Development. Environ. Earth Sci. 2023, 82, 580. [Google Scholar] [CrossRef]
  31. Arabameri, A.; Pal, S.C.; Rezaie, F.; Nalivan, O.A.; Chowdhuri, I.; Saha, A.; Lee, S.; Moayedi, H. Modeling Groundwater Potential Using Novel GIS-Based Machine-Learning Ensemble Techniques. J. Hydrol. Reg. Stud. 2021, 36, 100848. [Google Scholar] [CrossRef]
  32. Bai, Z.; Liu, Q.; Liu, Y. Groundwater Potential Mapping in Hubei Region of China Using Machine Learning, Ensemble Learning, Deep Learning and AutoML Methods. Nat. Resour. Res. 2022, 31, 2549–2569. [Google Scholar] [CrossRef]
  33. Fatah, K.K.; Mustafa, Y.T.; Hassan, I.O. Groundwater Potential Mapping in Arid and Semi-Arid Regions of Kurdistan Region of Iraq: A Geoinformatics-Based Machine Learning Approach. Groundw. Sustain. Dev. 2024, 27, 101337. [Google Scholar] [CrossRef]
  34. Jari, A.; Bachaoui, E.M.; Hajaj, S.; Khaddari, A.; Khandouch, Y.; El Harti, A.; Jellouli, A.; Namous, M. Investigating Machine Learning and Ensemble Learning Models in Groundwater Potential Mapping in Arid Region: Case Study from Tan-Tan Water-Scarce Region, Morocco. Front. Water 2023, 5, 1305998. [Google Scholar] [CrossRef]
  35. Kanji, S.; Das, S. Assessing Groundwater Potentialities and Replenishment Feasibility Using Machine Learning and MCDM Models Considering Hydro-Geological Aspects and Water Quality Constituents. Environ. Earth Sci. 2025, 84, 16. [Google Scholar] [CrossRef]
  36. Nugroho, J.T.; Lestari, A.I.; Gustiandi, B.; Sofan, P.; Suwarsono; Prasasti, I.; Rahmi, K.I.N.; Noviar, H.; Sari, N.M.; Manalu, R.J.; et al. Groundwater Potential Mapping Using Machine Learning Approach in West Java, Indonesia. Groundw. Sustain. Dev. 2024, 27, 101382. [Google Scholar] [CrossRef]
  37. Ragragui, H.; Aouragh, M.H.; El-Hmaidi, A.; Ouali, L.; Saouita, J.; Iallamen, Z.; Ousmana, H.; Jaddi, H.; El Ouali, A. Mapping and Modeling Groundwater Potential Using Machine Learning, Deep Learning and Ensemble Learning Models in the Saiss Basin (Fez-Meknes Region, Morocco). Groundw. Sustain. Dev. 2024, 26, 101281. [Google Scholar] [CrossRef]
  38. Roy, S.K.; Hasan, M.d.M.; Mondal, I.; Akhter, J.; Roy, S.K.; Talukder, S.; Islam, A.K.M.S.; Rahman, A.; Karuppannan, S. Empowered Machine Learning Algorithm to Identify Sustainable Groundwater Potential Zone Map in Jashore District, Bangladesh. Groundw. Sustain. Dev. 2024, 25, 101168. [Google Scholar] [CrossRef]
  39. Naghibi, S.A.; Pourghasemi, H.R.; Dixon, B. GIS-Based Groundwater Potential Mapping Using Boosted Regression Tree, Classification and Regression Tree, and Random Forest Machine Learning Models in Iran. Environ. Monit. Assess. 2016, 188, 44. [Google Scholar] [CrossRef] [PubMed]
  40. Mosavi, A.; Sajedi Hosseini, F.; Choubin, B.; Goodarzi, M.; Dineva, A.A.; Rafiei Sardooi, E. Ensemble Boosting and Bagging Based Machine Learning Models for Groundwater Potential Prediction. Water Resour. Manag. 2021, 35, 23–37. [Google Scholar] [CrossRef]
  41. Naghibi, S.A.; Ahmadi, K.; Daneshi, A. Application of Support Vector Machine, Random Forest, and Genetic Algorithm Optimized Random Forest Models in Groundwater Potential Mapping. Water Resour. Manag. 2017, 31, 2761–2775. [Google Scholar] [CrossRef]
  42. Guo, X.; Gui, X.; Xiong, H.; Hu, X.; Li, Y.; Cui, H.; Qiu, Y.; Ma, C. Critical Role of Climate Factors for Groundwater Potential Mapping in Arid Regions: Insights from Random Forest, XGBoost, and LightGBM Algorithms. J. Hydrol. 2023, 621, 129599. [Google Scholar] [CrossRef]
  43. Huang, Z.; Nya, E.L.; Rahman, M.A.; Mwamila, T.B.; Cao, V.; Gwenzi, W.; Noubactep, C. Integrated Water Resource Management: Rethinking the Contribution of Rainwater Harvesting. Sustainability 2021, 13, 8338. [Google Scholar] [CrossRef]
  44. Xiong, H.; Guo, X.; Wang, Y.; Xiong, R.; Gui, X.; Hu, X.; Li, Y.; Qiu, Y.; Tan, J.; Ma, C. Spatial Prediction of Groundwater Potential by Various Novel Boosting-Based Ensemble Learning Models in Mountainous Areas. Geocarto Int. 2023, 38, 2274870. [Google Scholar] [CrossRef]
  45. Liu, B.; Sun, Y.; Gao, L. Enhancing Groundwater Recharge Prediction: A Feature Selection-Based Deep Forest Model With Bayesian Optimisation. Hydrol. Process. 2024, 38, e15309. [Google Scholar] [CrossRef]
  46. Kamali Maskooni, E.; Naghibi, S.A.; Hashemi, H.; Berndtsson, R. Application of Advanced Machine Learning Algorithms to Assess Groundwater Potential Using Remote Sensing-Derived Data. Remote Sens. 2020, 12, 2742. [Google Scholar] [CrossRef]
  47. Lee, S.; Hong, S.-M.; Jung, H.-S. GIS-Based Groundwater Potential Mapping Using Artificial Neural Network and Support Vector Machine Models: The Case of Boryeong City in Korea. Geocarto Int. 2018, 33, 847–861. [Google Scholar] [CrossRef]
  48. Pourghasemi, H.R.; Sadhasivam, N.; Yousefi, S.; Tavangar, S.; Ghaffari Nazarlou, H.; Santosh, M. Using Machine Learning Algorithms to Map the Groundwater Recharge Potential Zones. J. Environ. Manag. 2020, 265, 110525. [Google Scholar] [CrossRef] [PubMed]
  49. Abdelmajid, S.; Mukhtar, A.; Baig, M.B.; Reed, M.R. Climate Change, Agricultural Policy and Food Security in Morocco. In Emerging Challenges to Food Production and Security in Asia, Middle East, and Africa; Behnassi, M., Barjees Baig, M., El Haiba, M., Reed, M.R., Eds.; Springer International Publishing: Cham, Switzerland, 2021; pp. 171–196. ISBN 978-3-030-72986-8. [Google Scholar]
  50. Abousserhane, Z.; Abbou, A.; Bouzakri, H. Experimental Performance Study of an Isolated PV Water Pumping System Used for Agricultural Irrigation in Zagora-Morocco Semi-Arid Area. In Digital Technologies and Applications; Motahhir, S., Bossoufi, B., Eds.; Lecture Notes in Networks and Systems; Springer Nature: Cham, Switzerland, 2023; Volume 669, pp. 660–671. ISBN 978-3-031-29859-2. [Google Scholar]
  51. Fico, J.; Kenti, A. Living on Luck the Story Behind Zagora’s Watermelons; Heinrich Böll Stiftung: Rabat, Maroc, 2023. [Google Scholar]
  52. Kaczmarek, N.; Mahjoubi, I.; Naimi, M.; Bossenbroek, L.; Moumane, A.; Znari, M.; Silva-Novoa Sánchez, L.M.; Frör, O.; Berger, E. Nature Conservation in the Draa Basin (Morocco): History, Present Situation, and Future Challenges. J. Nat. Conserv. 2025, 127038. [Google Scholar] [CrossRef]
  53. ABHDON. Etude D’élaboration du Contrat de Nappe de Feija. Mission 2.2 Identification des Usages et des Usagers des Ressources En Eau; Agence du bassin hydraulique de Draa Oued Noun: Guelmim, Morocco, 2021. [Google Scholar]
  54. ABHSMD, (Agence du Bassine Hydraulique de Souss Massa et de Draa). Etude Hydrologique de La Nappe de La Feija; Agence du Bassine Hydraulique de Souss Massa et de Draa: Agadir, Morocco, 2014. [Google Scholar]
  55. Klose, S. Regional Hydrogeology and Groundwater Budget Modeling in the Arid Middle Drâa Catchment (South-Morocco). Ph.D. Thesis, Universitäts- und Landesbibliothek Bonn, Bonn, Germany, 2013. [Google Scholar]
  56. Aboubakr, E.-Z.; Abdelhalim, T.; Ahmed, A.; Abdellah, A.; Abdelouhed, F.; Mariam, G.; Kamal, E. Hydrogeological Synthesis of Groundwater Resources: Case of the Feija Watershed (South-East of Morocco). Jeas 2021, 2, 85–94. [Google Scholar] [CrossRef]
  57. Gómez-Escalonilla, V.; Martínez-Santos, P.; Martín-Loeches, M. Preprocessing Approaches in Machine-Learning-Based Groundwater Potential Mapping: An Application to the Koulikoro and Bamako Regions, Mali. Hydrol. Earth Syst. Sci. 2022, 26, 221–243. [Google Scholar] [CrossRef]
  58. Moumane, A.; Enajar, A.A.; Ghazali, F.E.E.; Khouz, A.; Karmaoui, A.; Al Karkouri, J.; Batchi, M. GIS, Remote Sensing, and Analytical Hierarchy Process (AHP) Approach for Rainwater Harvesting Site Selection in Arid Regions: Feija Plain Case Study, Zagora (Morocco). Appl. Geomat. 2024, 16, 861–880. [Google Scholar] [CrossRef]
  59. Elmotawakkil, A.; Enneya, N. Advanced Machine Learning for Predicting Groundwater Decline and Drought in the Rabat–Salé–Kénitra Region, Morocco. J. Hydroinform. 2024, 26, 2980–3007. [Google Scholar] [CrossRef]
  60. Berk, R.A. Classification and Regression Trees (CART). In Statistical Learning from a Regression Perspective; Springer Series in Statistics; Springer New York: New York, NY, USA, 2008; pp. 1–65. ISBN 978-0-387-77500-5. [Google Scholar]
  61. Prinzie, A.; Van Den Poel, D. Random Forests for Multiclass Classification: Random MultiNomial Logit. Expert Syst. Appl. 2008, 34, 1721–1732. [Google Scholar] [CrossRef]
  62. Ke, G.; Meng, Q.; Finley, T.; Wang, T.; Chen, W.; Ma, W.; Ye, Q.; Liu, T.-Y. Lightgbm: A Highly Efficient Gradient Boosting Decision Tree. Adv. Neural Inf. Process. Syst. 2017, 30. [Google Scholar]
  63. Khan, A.A.; Chaudhari, O.; Chandra, R. A Review of Ensemble Learning and Data Augmentation Models for Class Imbalanced Problems: Combination, Implementation and Evaluation. Expert Syst. Appl. 2024, 244, 122778. [Google Scholar] [CrossRef]
  64. Cover, T.; Hart, P. Nearest Neighbor Pattern Classification. IEEE Trans. Inform. Theory 1967, 13, 21–27. [Google Scholar] [CrossRef]
  65. Cortes, C.; Vapnik, V. Support-Vector Networks. Mach. Learn. 1995, 20, 273–297. [Google Scholar] [CrossRef]
  66. SHAP Documentation Welcome to the SHAP Documentation—SHAP Latest Documentation. Available online: https://shap.readthedocs.io/en/latest/ (accessed on 14 July 2025).
  67. Armanuos, A.M.; Elshaarawy, M.K. Estimating Saltwater Wedge Length in Sloping Coastal Aquifers Using Explainable Machine Learning Models. Earth Sci. Inf. 2025, 18, 405. [Google Scholar] [CrossRef]
  68. Dahal, K.; Sharma, S.; Shakya, A.; Talchabhadel, R.; Adhikari, S.; Pokharel, A.; Sheng, Z.; Pradhan, A.M.S.; Kumar, S. Identification of Groundwater Potential Zones in Data-Scarce Mountainous Region Using Explainable Machine Learning. J. Hydrol. 2023, 627, 130417. [Google Scholar] [CrossRef]
  69. Shelar, R.S.; Nandgude, S.B.; Pande, C.B.; Costache, R.; El-Hiti, G.A.; Tolche, A.D.; Son, C.T.; Yadav, K.K. Unlocking the Hidden Potential: Groundwater Zone Mapping Using AHP, Remote Sensing and GIS Techniques. Geomat. Nat. Hazards Risk 2023, 14, 2264458. [Google Scholar] [CrossRef]
  70. Lindle, J.; Villholth, K.G.; Ebrahim, G.Y.; Sorensen, J.P.R.; Taylor, R.G.; Jensen, K.H. Groundwater Recharge Influenced by Ephemeral River Flow and Land Use in the Semiarid Limpopo Province of South Africa. Hydrogeol. J. 2023, 31, 2291–2306. [Google Scholar] [CrossRef]
  71. Raja Shekar, P.; Mathew, A. Assessing Groundwater Potential Zones and Artificial Recharge Sites in the Monsoon-Fed Murredu River Basin, India: An Integrated Approach Using GIS, AHP, and Fuzzy-AHP. Groundw. Sustain. Dev. 2023, 23, 100994. [Google Scholar] [CrossRef]
  72. Karmakar, M.; Ghosh, D. A GIS-Based Approach for Identification of Optimum Runoff Harvesting Sites and Storage Estimation: A Study from Subarnarekha-Kangsabati Interfluve, India. Appl. Geomat. 2022, 14, 253–266. [Google Scholar] [CrossRef]
  73. Alikhanov, B.; Juliev, M.; Alikhanova, S.; Mondal, I. Assessment of Influencing Factor Method for Delineation of Groundwater Potential Zones with Geospatial Techniques. Case Study of Bostanlik District, Uzbekistan. Groundw. Sustain. Dev. 2021, 12, 100548. [Google Scholar] [CrossRef]
  74. Selvam, S.; Dar, F.A.; Magesh, N.S.; Singaraja, C.; Venkatramanan, S.; Chung, S.Y. Application of Remote Sensing and GIS for Delineating Groundwater Recharge Potential Zones of Kovilpatti Municipality, Tamil Nadu Using IF Technique. Earth Sci. Inform. 2016, 9, 137–150. [Google Scholar] [CrossRef]
  75. Maqsoom, A.; Aslam, B.; Khalid, N.; Ullah, F.; Anysz, H.; Almaliki, A.H.; Almaliki, A.A.; Hussein, E.E. Delineating Groundwater Recharge Potential through Remote Sensing and Geographical Information Systems. Water 2022, 14, 1824. [Google Scholar] [CrossRef]
  76. Danso, S.Y.; Ma, Y. Geospatial Techniques for Groundwater Potential Zones Delineation in a Coastal Municipality, Ghana. Egypt. J. Remote Sens. Space Sci. 2023, 26, 75–84. [Google Scholar] [CrossRef]
  77. Jaafarzadeh, M.S.; Tahmasebipour, N.; Haghizadeh, A.; Pourghasemi, H.R.; Rouhani, H. Groundwater Recharge Potential Zonation Using an Ensemble of Machine Learning and Bivariate Statistical Models. Sci. Rep. 2021, 11, 5587. [Google Scholar] [CrossRef] [PubMed]
  78. Donselaar, M.E.; Bhatt, A.G.; Ghosh, A.K. On the Relation between Fluvio-Deltaic Flood Basin Geomorphology and the Wide-Spread Occurrence of Arsenic Pollution in Shallow Aquifers. Sci. Total Environ. 2017, 574, 901–913. [Google Scholar] [CrossRef]
  79. Letz, O.; Siebner, H.; Avrahamov, N.; Egozi, R.; Eshel, G.; Dahan, O. The Impact of Geomorphology on Groundwater Recharge in a Semi-Arid Mountainous Area. J. Hydrol. 2021, 603, 127029. [Google Scholar] [CrossRef]
  80. Blackburn, J.; Comte, J.-C.; Foster, G.; Gibbins, C. Hydrogeological Controls on the Flow Regime of an Ephemeral Temperate Stream Flowing across an Alluvial Fan. J. Hydrol. 2021, 595, 125994. [Google Scholar] [CrossRef]
  81. Achu, A.L.; Thomas, J.; Reghunath, R. Multi-Criteria Decision Analysis for Delineation of Groundwater Potential Zones in a Tropical River Basin Using Remote Sensing, GIS and Analytical Hierarchy Process (AHP). Groundw. Sustain. Dev. 2020, 10, 100365. [Google Scholar] [CrossRef]
  82. Ghosh, A.; Adhikary, P.P.; Bera, B.; Bhunia, G.S.; Shit, P.K. Assessment of Groundwater Potential Zone Using MCDA and AHP Techniques: Case Study from a Tropical River Basin of India. Appl. Water Sci. 2022, 12, 37. [Google Scholar] [CrossRef]
  83. Mishra, A.K.; Upadhyay, A.; Srivastava, A.; Rai, S.C. Probabilistic Groundwater Recharge Zonation in Hard Rock Terrain Using Geospatial Techniques in Veniar Watershed, South India. Ecohydrol. Hydrobiol. 2020, 20, 456–471. [Google Scholar] [CrossRef]
  84. Baghel, S.; Tripathi, M.P.; Khalkho, D.; Al-Ansari, N.; Kumar, A.; Elbeltagi, A. Delineation of Suitable Sites for Groundwater Recharge Based on Groundwater Potential with RS, GIS, and AHP Approach for Mand Catchment of Mahanadi Basin. Sci. Rep. 2023, 13, 9860. [Google Scholar] [CrossRef]
  85. Jena, S.; Panda, R.K.; Ramadas, M.; Mohanty, B.P.; Pattanaik, S.K. Delineation of Groundwater Storage and Recharge Potential Zones Using RS-GIS-AHP: Application in Arable Land Expansion. Remote Sens. Appl. Soc. Environ. 2020, 19, 100354. [Google Scholar] [CrossRef]
  86. Hosseini, F.S.; Jafari, A.; Zandi, I.; Alesheikh, A.A.; Rezaie, F. Groundwater Potential Mapping Using Optimized Decision Tree-Based Ensemble Learning Model with Local and Global Explainability. Water 2025, 17, 1520. [Google Scholar] [CrossRef]
  87. Anand, V.; Rajput, V.D.; Minkina, T.; Mandzhieva, S.; Sharma, A.; Kumar, D.; Kumar, S. Evaluating Groundwater Potential with the Synergistic Use of Geospatial Methods and Advanced Machine Learning Approaches. Discov. Cities 2025, 2, 56. [Google Scholar] [CrossRef]
  88. Prasad, P.; Loveson, V.J.; Kotha, M.; Yadav, R. Application of Machine Learning Techniques in Groundwater Potential Mapping along the West Coast of India. GIScience Remote Sens. 2020, 57, 735–752. [Google Scholar] [CrossRef]
  89. Amiha, R.; Kabbachi, B.; Ait Haddou, M.; Hamma, K.; Bouchriti, Y.; Gougueni, H. Climate Vulnerability and Adaptation Strategies in the Zagora Oasis, Southern Morocco: A Time Series Analysis and Projection to 2050. Theor. Appl. Climatol. 2024, 155, 9767–9781. [Google Scholar] [CrossRef]
  90. Halder, K.; Srivastava, A.K.; Ghosh, A.; Nabik, R.; Pan, S.; Chatterjee, U.; Bisai, D.; Pal, S.C.; Zeng, W.; Ewert, F.; et al. Application of Bagging and Boosting Ensemble Machine Learning Techniques for Groundwater Potential Mapping in a Drought-Prone Agriculture Region of Eastern India. Environ Sci. Eur. 2024, 36, 155. [Google Scholar] [CrossRef]
  91. Morgan, H.; Madani, A.; Hussien, H.M.; Nassar, T. Using an Ensemble Machine Learning Model to Delineate Groundwater Potential Zones in Desert Fringes of East Esna-Idfu Area, Nile Valley, Upper Egypt. Geosci. Lett. 2023, 10, 9. [Google Scholar] [CrossRef]
  92. Elhassouny, A. Machine Learning Models for Predicting Spatiotemporal Dynamics of Groundwater Recharge. Renew. Energy Sustain. Dev. 2024, 10, 319–344. [Google Scholar] [CrossRef]
  93. Halder, S.; Banerjee, S.; Youssef, Y.M.; Chandel, A.; Alarifi, N.; Bhandari, G.; Abd-Elmaboud, M.E. Ground–Surface Water Assessment for Agricultural Land Prioritization in the Upper Kansai Basin, India: An Integrated SWAT-VIKOR Framework Approach. Water 2025, 17, 880. [Google Scholar] [CrossRef]
  94. Rehman, A.; Xue, L.; Islam, F.; Ahmed, N.; Qaysi, S.; Liu, S.; Alarifi, N.; Youssef, Y.M.; Abd-Elmaboud, M.E. Unveiling Groundwater Potential in Hangu District, Pakistan: A GIS-Driven Bivariate Modeling and Remote Sensing Approach for Achieving SDGs. Water 2024, 16, 3317. [Google Scholar] [CrossRef]
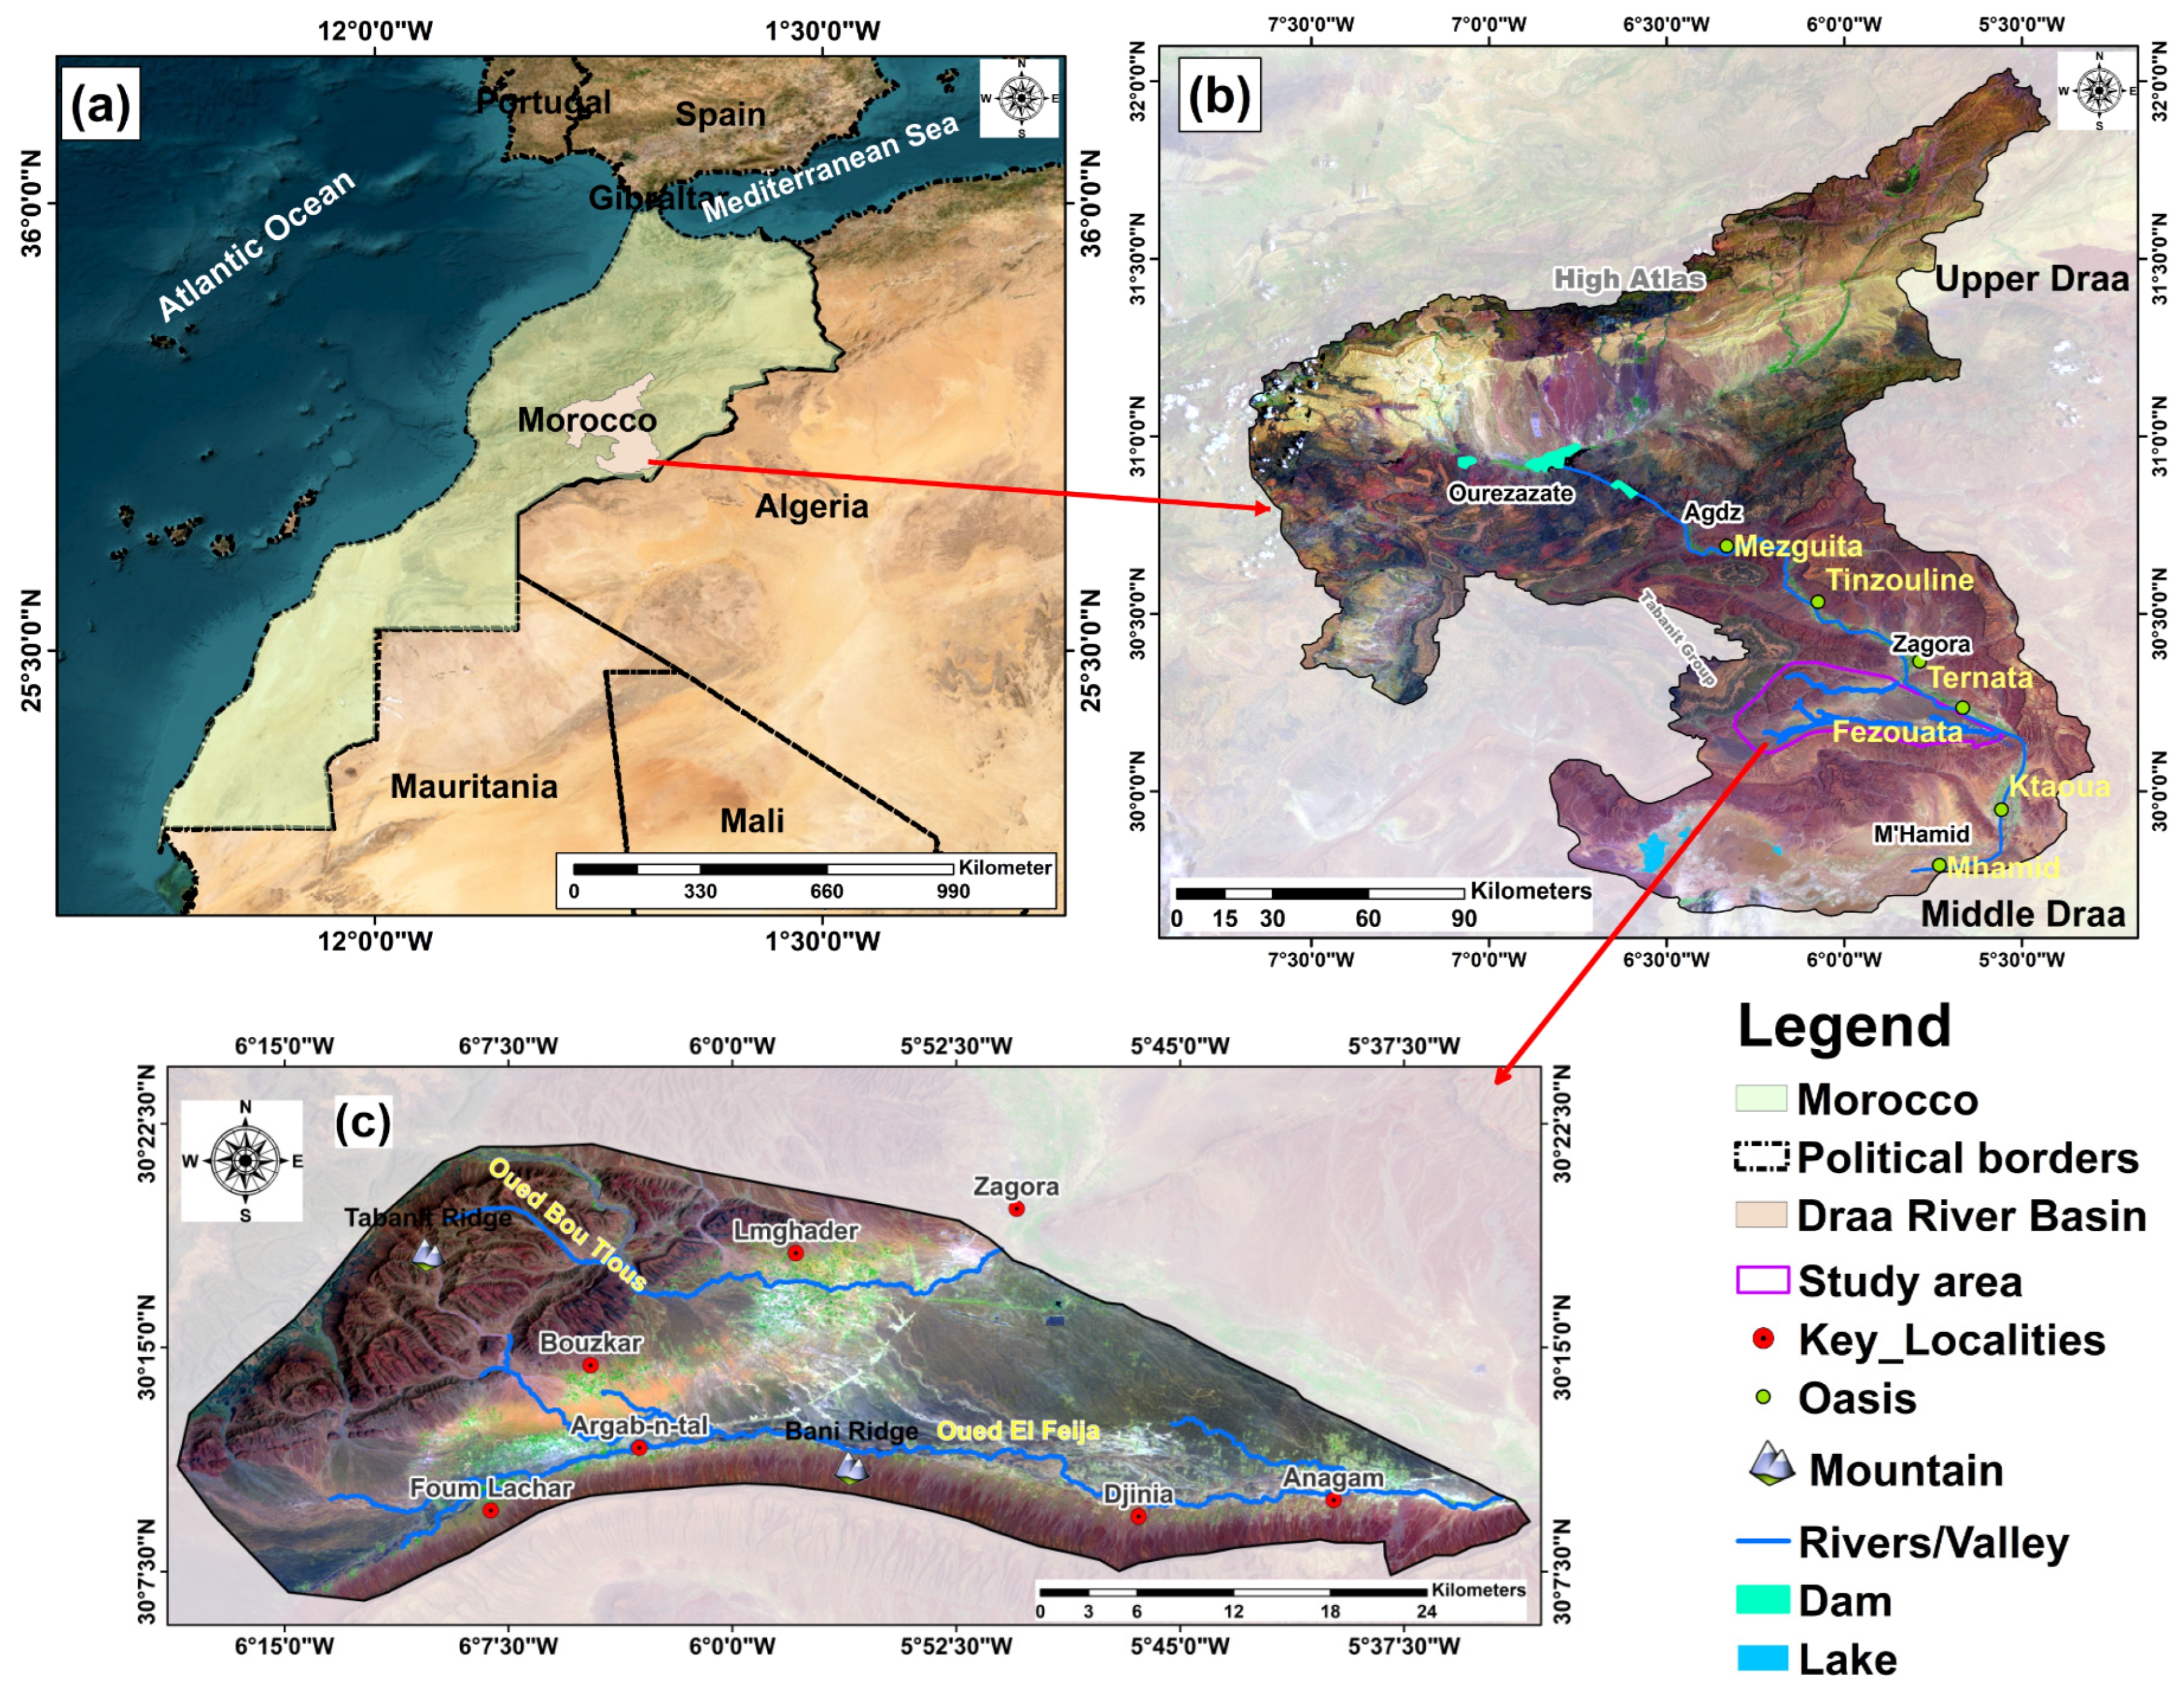
Figure 1. Geographical location of the study area: (a) the Draa river basin situated within the national context of Morocco; (b) location of the Middle Draa Valley (MDV) within the broader Feija Plain over false-color Landsat-8 (RGB; 752) imagery; (c) delineation of the specific study area within the Feija Plain.
Water 17 02336 g001
Figure 2. Field-based observations within and around the study area: (a) severely degraded palm grove within Ternata Oasis near the study area; (b) field measurement of piezometric levels in wells and their GPS locations; (c) storage basin utilizing groundwater for irrigation; (d) butane gas-powered groundwater extraction system in the arid Feija Plain, featuring a modified diesel engine driving a mechanical pump. Multiple red butane gas cylinders serve as the primary energy source, highlighting extensive groundwater extraction by local farmers.
Water 17 02336 g002
Figure 3. (a) Decline of piezometric levels over the years in the study area; (b) Feija aquifer balance over the years; (c) crop area in 2018; (d) evolution of water consumption for each crop in 2014 and 2018 according to ABHDON [53].
Water 17 02336 g003
Figure 4. Geological cross-section from Jbel Bani to the Tabanit Group across the Feija Basin. This north–south cross-section illustrates the geological structure of the Feija Basin, showing key formations including the Middle Cambrian Tabanit Group, the Ordovician Bani Group, the Fezouata Shale Formations (Upper and Lower), Quaternary deposits of Oued Feija, and the Cambrian sandstone ridges of the Tabanit Group.
Water 17 02336 g004
Figure 5. Flowchart of the key steps in the study workflow.
Water 17 02336 g005
Figure 6. Spatial distribution of topographical factors for groundwater potential zone mapping: (a) elevation, (b) slope, and (c) curvature.
Water 17 02336 g006
Figure 7. Spatial distribution of hydrogeological factors for groundwater potential zone mapping: (a) distance from main streams (DfMS), (b) topographic wetness index (TWI), and (c) rainfall.
Water 17 02336 g007
Figure 8. Spatial distribution of geological factors for groundwater potential zone mapping: (a) soil permeability, (b) geomorphology, and (c) lineament density.
Water 17 02336 g008
Figure 9. Spatial distribution of the normalized difference vegetation index (NDVI) as anthropogenic-related factors for groundwater potential zone mapping.
Water 17 02336 g009
Figure 10. Pearson correlation and multicollinearity analysis of groundwater influencing factors.
Water 17 02336 g010
Figure 11. Prediction maps generated by the six applied ML algorithms: (a) CART, (b) RF, (c) LightGBM, (d) XGBoost, (e) SVM, and (f) k-NN.
Water 17 02336 g011
Figure 12. Comparison of groundwater suitability classes across ML algorithms.
Water 17 02336 g012
Figure 13. Global feature sensitivity across the ML algorithms using SHAP.
Water 17 02336 g013
Figure 14. Confusion matrices for each ML algorithm.
Water 17 02336 g014
Figure 15. Accuracy metrics for each class across the applied ML algorithms.
Water 17 02336 g015
Figure 16. ROC-AUC Curve for Each ML Algorithm.
Water 17 02336 g016
Table 1. Details and references of the used dataset.
DataScaleSourceDerived Layer by Authors
Soil sampling30 × 30 mSoil permeability mapping was carried out based on field observations, soil sampling, and subsequent laboratory analyses of soil texture. Soil permeability
Rainfall0.5° × 0.5°NASA Prediction of Worldwide Energy Resources and the weather station in ZagoraRainfall
Digital Elevation Model (DEM)30 × 30 mUSGS EarthExplorer
https://earthexplorer.usgs.gov/ (accessed on 10 January 2025)
Slope, Lineament density, Curvature, TWI, Elevation,
Distance from main streams
Satellite images30 × 30 mLandsat 8 LC08_L1TP_200039_20230401_20230411_02_T1
from USGS EarthExplorer
https://earthexplorer.usgs.gov/ (accessed on 10 January 2025)
NDVI
Topographic maps1:100,000Ministère de l’Agriculture et de la Réforme Agraire—Direction de la Conservation Foncière et des Travaux Topographiques. (1972). Carte du Maroc 1:100,000—Feuille NH-29-XVIII-2 (El Gloa’) [Carte topographique]. Division de la Carte, Rabat.Topographic and geological maps, supplemented by field observations, were used as base layers for the development of original geomorphological and main stream distance layers by the authors.
1:100,000Ministère de l’Agriculture et de la Mise en Valeur Agricole. (1968). Carte du Maroc 1:100,000—Feuille NH-30-XIII-1 (Zagora) [Carte topographique]. Direction de la Conservation Foncière, du Cadastre et de la Cartographie, Division de la Cartographie. Édition dressée, dessinée et publiée à Rabat.
Geological map1:200,000Ministère de l’Énergie et des Mines—Direction de la Géologie. (1989). Carte géologique du Maroc: Zagora—Coude du Dra—Hamada du Dra (p.p.) (Échelle 1:200,000) [Carte géologique]. Éditions du Service Géologique du Maroc, Notes et Mémoires n° 273. Maquette achevée en 1986. Cartographie et impression: Robertson Group, Royaume-Uni.
Table 2. GIS techniques are utilized to generate various layers.
LayerMethodology
Distances from main streams To calculate distances from main streams in ArcGIS, the Euclidean Distance tool was used. This tool calculates the straight-line distance from each cell in the raster to the nearest stream. The main streams were digitized from the topographic map and are in a vector format (e.g., shapefile or feature class). The tool is located in:
Spatial Analyst Tools > Distance > Euclidean Distance
TWI TWI is calculated using Formula (1):
TWI = ln( n t a n α ) (1)
where n denotes the upslope contributing area for a given point, and α is the slope angle at that location. To derive the TWI values, data from a DEM is processed using standard hydrological tools—specifically, flow accumulation and slope analysis—to quantify both contributing area and gradient.
Soil Permeability LayerSoil permeability classes were delineated utilizing laboratory data digitized within ArcMap 10.8, initially represented as polygons, and subsequently transformed into raster format.
NDVINDVI is calculated using Formula (2):
NDVI ( N I R + R e d ) ( N I R R e d ) (2)
The resulting values range from −1 to +1, where higher values are associated with denser
and healthier vegetation cover. In this study, the NDVI maps were derived using Band 5 (NIR) and Band 4 (Red) from multispectral satellite imagery. The calculation was performed in ArcGIS 10.8 using the Raster Calculator tool, accessible via:
Spatial Analyst Tools > Map Algebra > Raster Calculator
Slope, Aspect, Elevation, and Curvature LayersSlope, aspect, and elevation layers were derived in ArcGIS 10.8 through the analysis of a DEM. Slope was generated using the Slope tool, aspect was derived with the Aspect tool, determining the direction in which each cell faces based on the steepest downhill descent. Elevation data, representing the height above a specified datum, was obtained directly from the DEM.
Additionally, curvature was computed using the curvature tool found in the Spatial Analyst Toolbox within ArcGIS software. This tool analyzes the change in slope at each cell to determine concave and convex areas of the terrain, providing insights into its shape and form.
Table 3. ML algorithms and their applications in groundwater recharge studies.
AlgorithmGeneral DefinitionApplication in Groundwater Recharge Studies
CART The CART algorithm constructs a hierarchical tree structure by recursively partitioning the dataset into subsets according to the values of input features. This results in a tree-like algorithm that can be used for both classification and regression tasks [60].The CART algorithm is particularly useful for developing interpretable models, as it recursively splits the dataset based on key features, such as rainfall, soil permeability, and slope. This enables the effective classification and prediction of groundwater recharge potential zones [31,39].
RF RF is an ensemble-based learning algorithm that builds a collection of decision trees during the training process. For classification tasks, it outputs the most frequent class among the trees; while, for regression, it returns the average prediction of all individual trees [61].RF is widely employed in groundwater recharge mapping owing to its capacity to model complex, non-linear interactions among diverse features, such as land use, geological formations, and topographic variables. By aggregating the outputs of multiple decision trees, RF enhances predictive accuracy and model robustness [38,40,41].
LightGBMLightGBM is a gradient boosting framework optimized for speed and scalability. It incorporates techniques such as Gradient-Based One-Side Sampling and Exclusive Feature Bundling to efficiently manage large-scale datasets while maintaining high predictive performance [62].Particularly well-suited for large-scale groundwater recharge assessments due to its high computational efficiency and scalability. Its ability to manage high-dimensional datasets makes it effective for integrating diverse variables, such as rainfall, soil characteristics, and land cover, in predicting groundwater recharge potential [42,43,44].
XGBoostA scalable and efficient implementation of gradient boosting that uses parallel processing, tree pruning, and regularization to improve performance and avoid overfitting [63].A powerful tool for groundwater recharge mapping, as it can model complex, non-linear relationships between features like slope, geology, and land use, while avoiding overfitting [45].
k-NN k-NN algorithm is a non-parametric, instance-based method applicable to both classification and regression tasks. It operates by identifying the k most similar data points within the feature space and assigning a class label or value based on the majority vote (for classification) or the mean (for regression) of those neighbors [64].Used to classify or predict groundwater recharge potential by comparing the similarity of a location’s features (e.g., rainfall, soil type, slope) to the k-nearest labeled data points in the dataset [34,46].
SVM SVM is a supervised learning technique designed to identify the optimal hyperplane that best separates different classes in a high-dimensional feature space. It achieves this by maximizing the margin between the nearest data points from each class, known as support vectors [65].SVM is effective in capturing non-linear relationships among groundwater-related variables, such as topography and vegetation cover. It determines the optimal decision boundary that best separates zones of high and low groundwater recharge potential [37,47,48].
Table 4. Feature importance scores across the applied ML algorithms.
FeatureCART (%)RF (%)LightGBM (%)XGBoost (%)k-NN (%)SVM (%)
NDVI4.4919.5019.979.8100
Stream_Distance13.5113.0917.167.6238.8553.84
Soil_Permeability42.8615.874.0253.5500
Rainfall5.5710.6213.602.431.610
TWI2.813.5510.022.060.040
Geomorphology01.360.588.6000
Lineament_density01.750.05000
Curvature0.712.735.181.4200
Slope4.917.0712.932.822.060
Elevation25.1524.4716.4911.6857.4346.16
Table 5. Comparison of ML algorithms for classification.
MetricLightGBMRFXGBoostCARTk-NNSVM
Accuracy0.900.890.880.840.800.80
Macro-Average AUC0.960.970.950.860.920.90
Weighted-Average AUC0.970.970.960.880.930.91
Macro F1-score0.880.860.850.810.780.75
Weighted F1-score0.900.880.870.830.800.78
Disclaimer/Publisher’s Note: The statements, opinions and data contained in all publications are solely those of the individual author(s) and contributor(s) and not of MDPI and/or the editor(s). MDPI and/or the editor(s) disclaim responsibility for any injury to people or property resulting from any ideas, methods, instructions or products referred to in the content.