Article

Assessing the Relationship Between Groundwater Availability, Access, and Contamination Risk in Arizona’s Drinking Water Sources

by
Simone A. Williams
1,2,*,
Adriana A. Zuniga-Teran
3,4,
Sharon B. Megdal
2,
David M. Quanrud
5 and
Gary Christopherson
3
1
Arid Lands Resource Sciences, The University of Arizona, Tucson, AZ 85721, USA
2
Water Resources Research Center, The University of Arizona, Tucson, AZ 85721, USA
3
School of Geography, Development & Environment, The University of Arizona, Tucson, AZ 85721, USA
4
The Udall Center for Studies in Public Policy, The University of Arizona, Tucson, AZ 85721, USA
5
School of Natural Resources and the Environment, The University of Arizona, Tucson, AZ 85721, USA
*
Author to whom correspondence should be addressed.
Water 2025, 17(7), 1097; https://doi.org/10.3390/w17071097
Submission received: 11 February 2025 / Revised: 27 March 2025 / Accepted: 27 March 2025 / Published: 6 April 2025

Abstract

:
Groundwater is a critical drinking water source in arid regions globally, where reliance on groundwater is highest. However, disparities in groundwater availability, access, and quality pose challenges to water security. This case study employs geostatistical tools, multivariate regression, and clustering analysis to examine the intersection of groundwater level changes (availability), socioeconomic and regulatory factors (access), and nitrate and arsenic contamination (quality) across 1881 groundwater-supplied drinking water service areas in Arizona. Groundwater availability declined over 20-year and 10-year periods, particularly outside designated management areas, with mean annual decline rates ranging from −15.97 to −0.003 m/year. In contrast, increases (0.003 to 13.41 m/year) were concentrated in urban and managed areas. Karst aquifers show long-term resilience but short-term vulnerability. Non-designated areas exhibit mixed effects, reflecting variable management effectiveness. Disparities in groundwater access emerge along various socioeconomic and regulatory lines. Communities with higher Black populations are twice as likely (OR = 2.01, p < 0.001) to experience groundwater declines, while Hispanic/Latino communities have lower depletion risks (OR = 0.92, p < 0.001). Tribal oversight significantly reduces groundwater decline risk (OR = 0.62, p < 0.001), whereas state–primacy areas show mixed effects. Higher female populations correlate with increased groundwater declines, while older populations (65+) experience greater stability. Married-family households and institutional housing are associated with greater declines. Migrant worker housing shows protective effects in long-term models. Rising groundwater levels are associated with higher nitrate and arsenic detection, reinforcing recharge-driven contaminant mobilization. Nitrate exceedance (OR = 1.05) responds more to short-term groundwater changes, while arsenic exceedance persists over longer timescales (OR = 1.01–1.05), reflecting their distinct hydrogeochemical behaviors. Community water systems show higher pollutant detection rates than domestic well areas, suggesting monitoring and infrastructure differences influence contamination patterns. Tribal primacy areas experience lower groundwater declines but show mixed effects on water quality, with reduced nitrate exceedance probabilities; yet they show variable arsenic contamination patterns, suggesting that governance influences availability and contamination dynamics. These findings advance groundwater sustainability research by quantifying disparities across multiple timescales and socio-hydrogeological drivers of groundwater vulnerability. The results underscore the need for expanded managed aquifer recharge, targeted regulatory interventions, and strengthened Tribal water governance to reduce inequities in availability, access, and contamination risk to support equitable and sustainable groundwater management.

1. Introduction

Although the availability of safe drinking water is essential to human well-being, 2.2 billion people worldwide lacked access to safe drinking water in 2022 [1]. There is a well-established relationship between water resource development and economic development [2]. Countries with the capacity to invest in water infrastructure and management not only achieve higher development levels but also provide safer drinking water, enhancing their populations’ quality of life. However, challenges remain, even in developed countries like the United States. The crises in Flint, Michigan, and Newark, New Jersey, highlight persistent inequities in water safety and availability [3,4,5]. Additionally, hundreds of rural communities across the U.S. face water quality issues, inadequate infrastructure, and unreliable service [6,7,8,9].
Low-income and minority communities in the U.S. often face disproportionate risks from drinking water contamination. Systems serving areas with higher material deprivation, lower median incomes, and larger populations of Hispanic, Native American, and other non-white residents frequently show elevated levels of contaminants like arsenic, nitrate, and lead [3,10,11,12,13,14]. These disparities are particularly pronounced in small rural water systems and Tribal communities—Indigenous nations in the U.S. with self-governing authority—where limited resources, aging infrastructure, and historical contamination contribute to persistent environmental injustices [15,16,17].
The concept of water security, encompassing availability, quality, safety, reliability, access, and sustainability, has been widely used to examine these challenges [18]. Scott, et al. [19] define water security as “the sustainable availability of adequate quantities and qualities of water for resilient societies and ecosystems in the face of uncertain global change”. The international community has advanced water security through initiatives like the UN Sustainable Development Goals (SDGs), particularly Goal 6, which aims to ensure universal access to water and sanitation by 2030 [1].
Groundwater is crucial for achieving water security due to its wide accessibility, large storage capacity, and resilience to climate variability [1,20,21,22,23]. It supports domestic, agricultural, industrial, and municipal needs, especially in arid regions where it often serves as the primary water source [2,24]. In areas where groundwater levels are stable, even the most dispersed and economically disadvantaged communities can benefit from reliable water access through shallow aquifers [1].
However, rapid urbanization, intensive agriculture, industrialization, and other changes in land use have accelerated groundwater extraction and have altered recharge patterns, with negative implications for watershed sustainability [24,25]. Excessive pumping depletes aquifers, causing land subsidence, loss of riparian vegetation, species loss, and reduced soil moisture, which, in turn, increases irrigation demands, compounding groundwater scarcity [26]. The interplay between groundwater quantity and quality is critical, as overexploitation can degrade water quality, posing risks to both human and ecosystem health [24].
This study builds on previous research that mapped groundwater vulnerability in Arizona [27] and assessed equity in groundwater vulnerability and risk [28]. Building on this work, we examine how groundwater availability, access, and contamination risk interact through a case study of Arizona. By integrating spatial and temporal models with equity-focused variables, the analysis explores how hydrogeological conditions, service area characteristics, and policy factors shape groundwater vulnerability. The results show significant relationships between groundwater availability, access, and quality across regulatory frameworks, infrastructure types, environmental settings, and community socioeconomic contexts, with implications for sustainable groundwater management.

1.1. Groundwater Sustainability Through a Trivalent Framework

This study employs an integrated framework to explore the connections between groundwater availability, access, and contamination risk, providing a comprehensive approach to understanding groundwater sustainability. Availability refers to the physical condition and quantity of groundwater shaped by factors such as aquifer depletion and recharge rates. Access encompasses the socioeconomic, regulatory, and infrastructural factors that influence communities’ ability to obtain and use groundwater for drinking and other essential purposes. Contamination risk (quality) focuses on the presence of harmful contaminants, such as nitrate and arsenic, which impact groundwater safety and usability. These trivalent dimensions are interconnected, and this study explores how groundwater level changes, socioeconomic factors, and contamination risks converge within Arizona’s groundwater-dependent drinking water systems. This analysis highlights the complex interplay between factors influencing groundwater sustainability.
Assessing groundwater resources and progress toward water security remains challenging. Various modeling approaches, including physical, conceptual, numerical, statistical, and hybrid models, are used to evaluate groundwater availability, access, and quality [26,27,29,30,31,32,33,34]. In addition, indices have been developed to enhance assessment efforts and track global progress. For instance, the SDGs include water-related indicators such as Indicator 6.1.1, which monitors the proportion of the population using safely managed drinking water services and emphasizes the importance of access, availability, and reliability [1]. However, global indices are often inadequate for local-scale assessments, prompting interdisciplinary researchers to create comparative frameworks such as the Water Poverty Index, the Arab Water Sustainability Index (AWSI), and the European Sustainable Water Management Index [1].
Despite their utility, most indices remain qualitative and do not adequately account for the impacts of aridification and groundwater overexploitation. Empirical assessments of groundwater availability are further complicated by inconsistent and incomplete data, hindering the ability to track trends over time. In Arizona, a state often recognized for its groundwater management efforts [35], research has primarily focused on regulated areas that have more reliable and cohesive data. In contrast, unregulated regions rely on indirect indicators, such as streamflow reduction or vegetation decline [25,26], making groundwater depletion more difficult to quantify. The continued decline in groundwater levels poses a growing risk to freshwater resources and could threaten the achievement of SDGs, increasing the likelihood of a future water crisis.

1.2. Background—Groundwater Dynamics Through an Equity Lens

Groundwater resources are deeply interconnected with surface water and human systems, making equity a critical factor in groundwater sustainability. Hydrologically, groundwater and surface water interact through natural recharge and discharge processes, while socially, access to groundwater sources is shaped by infrastructure, pumping, and regulatory frameworks [25]. Aquifers are naturally replenished through rainfall and percolation, but recharge is influenced by soil composition, geomorphology, land use, and aquifer material [24]. In arid and semi-arid regions like Arizona, where natural recharge is low, managed aquifer recharge programs play a crucial role in increasing groundwater storage, particularly in areas supplied by the Central Arizona Project, which diverts surface water from the Colorado River [25].
Effective groundwater governance is essential for sustainability and equitable access. Scholars highlight four key governance factors: (1) access to information, (2) institutional setting, (3) civil society participation, and (4) policy frameworks, all of which influence groundwater equity [36,37]. For instance, Arizona’s managed aquifer recharge programs, regulated by the Arizona Water Banking Authority, help mitigate overdrafts in areas served by the Central Arizona Project. However, regulation alone is insufficient in regions with minimal natural recharge. Unregulated areas remain due to continued groundwater extraction with minimal monitoring and enforcement, jeopardizing availability, access, and long-term sustainability [26]. Even with regulated pumping and managed recharge, long-term monitoring, and early warning systems are crucial for preventing resource depletion [2,24]. Thus, regulation alone is insufficient—it must be complemented by environmental, socioeconomic, and political considerations to ensure groundwater sustainability [24].
Arizona’s groundwater governance faces structural gaps that affect availability, access, and quality. Weak regulatory oversight and the lack of integration between land use policies and groundwater management further exacerbate sustainability challenges [28,38]. Fragmented policies fail to integrate groundwater-surface water connections and provide differential protection of karst and alluvial aquifers. While policies primarily focus on alluvial aquifers in urban areas, karst systems—which cover nearly half of Arizona—lack tailored protections despite their heightened vulnerability to contamination from land use changes and climate impacts [28,39,40]. The differential treatment of these aquifers highlights broader governance deficiencies, particularly in rural and Indigenous communities that depend on karst systems [26].
Groundwater access and equity are also influenced by aquifer levels, as shallow aquifers tend to be more accessible to economically disadvantaged populations with limited technological resources [2]. However, limited hydrogeological characterization, inadequate groundwater infrastructure and maintenance, and insufficient technical capacity—alongside broader socioeconomic and governance challenges—impede the sustainable use of local groundwater resources [1]. While the Groundwater Management Act (GMA) has advanced groundwater security, it falls short in addressing unregulated pumping, rising water demands, and critical hydrological linkages [26,41,42]. Effective management requires strategies that account for the distinct hydrogeological dynamics of these aquifer types [28].
Sociodemographic factors play a critical role in shaping groundwater access and quality, with contamination risks disproportionately affecting low-income and minority communities. Pace and colleagues [5] found that relative to community water system users, households relying on domestic wells experience heightened risks from arsenic, nitrate, and hexavalent chromium contamination, with racial and economic disparities in water quality outcomes. Similarly, Balazs and colleagues (2012) documented that nitrate contamination disproportionately affects renters, lower-income households, and smaller water systems in California’s San Joaquin Valley [13]. Additional studies across the U.S. consistently link groundwater contamination risks to race, income, and service infrastructure across various spatial and temporal scales, reinforcing broader environmental justice concerns [3,7,10,11,43,44,45,46,47,48,49].
Groundwater access is influenced by aquifer depth, infrastructure reliability, service costs, and regulatory oversight, especially in rural areas [1,9]. Rural communities—both in Arizona and nationally—face heightened vulnerabilities due to small, under-resourced water systems that struggle with monitoring, reporting, and compliance [4,10,12,50]. In these areas, while shallow aquifers are more accessible, private domestic wells, which often serve low-income populations, remain largely unregulated, increasing the risk of undetected contamination [5,28,51].
Research consistently shows that small water systems serving vulnerable populations experience more frequent water quality violations, raising significant environmental justice concerns [5,13,14]. In Arizona, groundwater contamination risks are influenced by socio-hydrogeological factors, such as aquifer type, water system type, groundwater policies, and socioeconomic conditions. Rural domestic wells and Tribal systems show the highest vulnerabilities [28]. Studies in Arizona and California reveal that water quality violations are more common in low-income communities and smaller systems serving renters and communities of color [14,28]. Additionally, communities with higher proportions of institutionalized groups, and migrant workers face elevated contamination levels, underscoring persistent disparities in groundwater safety [5,28].
Communities outside designated groundwater management areas face greater risks due to weak regulations that allow over-extraction. Declining water levels, inadequate infrastructure, and high water costs create additional burdens for low-income and Indigenous populations [26,52,53]. Contamination from agricultural runoff and legacy pollutants further exacerbates risks in these vulnerable communities [5,43,54,55,56].
Legacies of inequity in groundwater access and quality reflect long-standing disparities in water governance, infrastructure investment, and regulatory enforcement. Municipal expansion and selective annexation determine who receives regulated water services, leaving many disadvantaged communities without access to safe drinking water. These inequities stem from multiple factors, including the quality of infrastructure (whether natural, built, or managerial), the costs associated with extending and maintaining water services to marginalized areas, and poorly enforced regulations (building codes and public health) [9,11,49,57,58,59,60,61,62,63]. Together, these factors affect both the quality of water resources and the reliability of water service delivery and cost (low ability to pay for the service) [9]. Empirical research highlights that disparities in drinking water safety arise from the interaction of natural, built, sociopolitical, and environmental systems, disproportionately affecting low-income, rural, and communities of color [5,36,64]. Despite clear evidence of equity issues in groundwater quality and quantity across the Western U.S., no study has comprehensively examined the intersection of groundwater availability, access, and contamination risk from a multidimensional equity perspective.

1.3. Research Questions and Hypothesis

This study expands prior research [5,9,27,28], by applying a trivalent framework—integrating groundwater availability, access, and contamination risk—to examine the interconnections among these dimensions in Arizona’s drinking water systems. Specifically, it investigates how access factors—such as aquifer type, policy designations, and socioeconomic conditions—and water quality indicators (nitrate and arsenic contamination) influence groundwater availability, and how these relationships vary across different regulatory, hydrogeological, spatial, and temporal contexts. We hypothesize that groundwater availability, measured by changes in groundwater levels, is shaped by access factors and water quality, with greater declines expected in areas with unregulated water supplies, weaker regulatory oversight, vulnerable aquifers, and disadvantaged communities. These influences are expected to vary spatially across different regions and temporally over time due to changes in groundwater management practices, climate conditions, and land use. By exploring the interactions among these dimensions, this research offers an equity-based perspective on groundwater sustainability and the factors driving disparities in safe drinking water availability, access, and quality.

2. Material and Methods
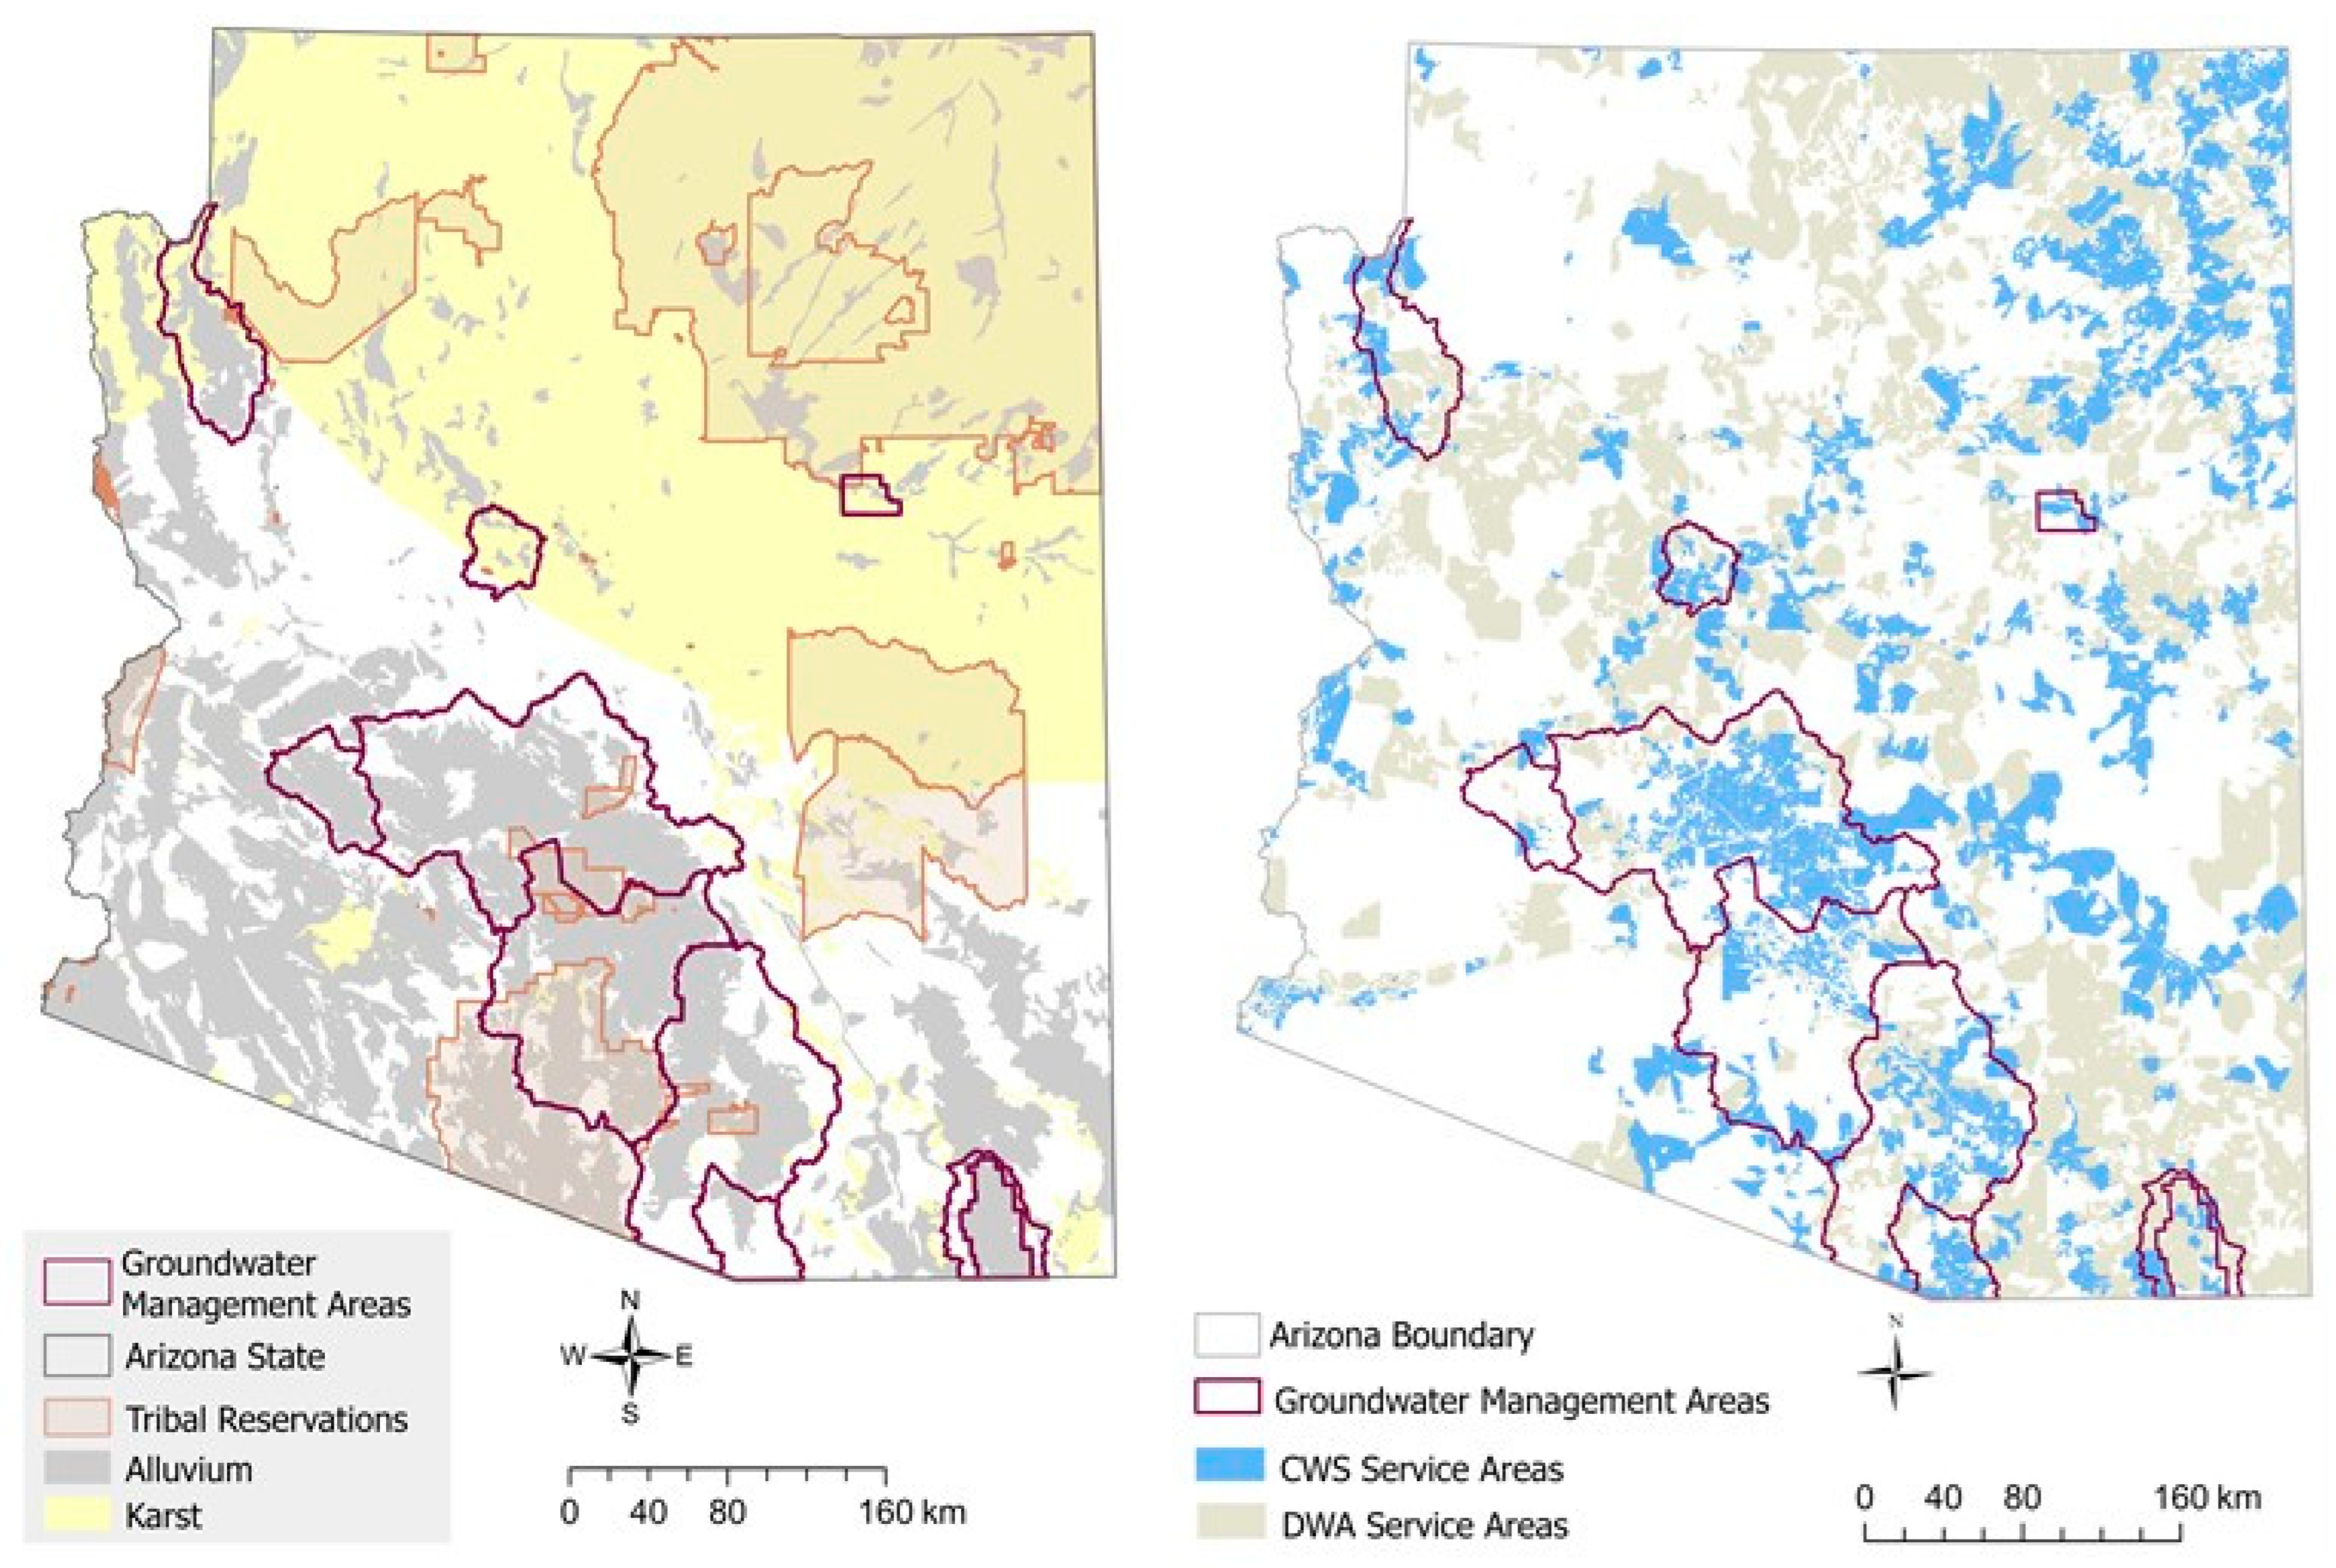
Figure 1 presents the Groundwater Vulnerability Assessment Trivalent Framework, outlining the stepwise methodology. It integrates raw data, preprocessing, and key variable stratification into groundwater availability, access, and quality. These elements inform statistical and sensitivity analyses of groundwater levels, regulatory and socioeconomic influences, and contamination risk. Later sections provide details on each component.

2.1. Study Area

Arizona, located in the southwestern United States, spans approximately 113,990 mi2 (or 295,232 km2) and features diverse hydrogeological conditions, including extensive alluvial plains and complex karst systems. Groundwater is a critical drinking water source for both urban and rural populations, delivered through community water systems (CWS) or domestic water areas (DWAs) representing an areal cluster of individual private wells and managed through varied regulatory frameworks across state and Tribal jurisdictions.
The 1980 Groundwater Management Act (GMA) established Active Management Areas (AMAs) to regulate groundwater in regions with significant depletion. AMAs cover over 80% of Arizona’s population and are governed by strict regulations to balance annual groundwater withdrawals with natural or artificial recharge. In comparison, Irrigation Non-Expansion Areas (INAs) and the remaining regions, referred to as “Non-Designated Areas” (NDAs), have minimal or no regulatory oversight, leading to disparities in groundwater availability and access, particularly in rural and underserved regions [42,65,66]. Groundwater governance also differs between state and Tribal jurisdictions. Tribal lands, such as the Navajo Nation, manage water under sovereign authority. While the Safe Drinking Water Act (SDWA) applies to public water systems on Tribal lands, enforcement and infrastructure support vary, contributing to gaps in monitoring, regulation, and water access. These issues are compounded by unresolved water rights and underfunded systems. See Figure 2.
Groundwater availability, reflected in water level changes, varies across aquifer types. Alluvial aquifers in regulated urban areas face stricter oversight, while karst systems in rural and Tribal regions are more vulnerable to contamination and depletion due to their complex hydrogeology and limited regulation [28]. Arizona faces growing water security challenges due to groundwater depletion, rising demand, and contamination threats. Climate change, rapid urbanization, and agricultural intensification exacerbate these risks, impacting both human and ecosystem health [20,67,68,69]. Despite recent efforts to address governance gaps such as rural groundwater management [70], Arizona’s groundwater governance, primarily focused on quantity, lacks integrated approaches to address availability, quality, and access disparities [26]. This highlights the need for comprehensive policies that address the dynamic interplay between availability, access, and contamination risk to ensure sustainable and equitable groundwater management.

2.2. Data Input and Sources

This study utilizes multiple data sources to assess groundwater availability, access, and contamination risk, integrating information on hydrogeological characteristics, water supply systems, community demographics, and water quality indicators. Table 1 summarizes the data categories and their respective sources.

2.3. Measures for Assessing Groundwater Availability, Access, and Quality

This study employs a spatial ecological design to examine the relationship between groundwater access and quality while accounting for policy, service area characteristics, and socioeconomic attributes. The design facilitates robust statistical analyses that mitigate spatial dependence, data aggregation biases, and spatial correlation effects, ensuring the findings are contextually specific and reliable. Measures for evaluating access, vulnerability, and equity were selected based on prior research in environmental equity and groundwater risk, as well as insights from a companion study focused on groundwater quality [26,27,28].
Water access varies by hydrogeology, socioeconomic factors, and regulatory frameworks. Socioeconomic factors, including housing, population demographics, and institutional facilities, served as proxies for community resilience, following established methodologies [3,7,11,46]. Hydrogeological variables, such as aquifer type and well location, were selected for their known associations with contaminant behavior and recharge dynamics [8,10,81,82,83,84,85,86]. Dominant aquifer properties (karst versus alluvial) were derived from USGS datasets to assess water access variability across the study area.
Service areas were delineated using spatial data on exempt domestic wells, water system boundaries, residential parcels, building footprints, and census block groups [5,26,28,49,87]. Water systems in these areas were categorized as either community water systems (CWS), regulated under the Safe Drinking Water Act (SDWA), or domestic well areas (DWAs), which primarily rely on unregulated private domestic wells [3,5,10]. Of the 1881 mapped service areas, 55.3% were designated as CWS and 44.7% were designated as DWAs. Additionally, equity considerations included regulatory distinctions between designated and undesignated groundwater management areas, as well as Tribal and State jurisdictions. These distinctions align with research on regulatory frameworks and environmental justice outcomes [3,4,5,11,17,49,62,88,89].
Groundwater availability trends in subbasins containing drinking water sources were evaluated using rates of water level change as proxies for available quantities. Groundwater level changes over 20-year (2001–2020) and 10-year (2011–2020) periods were calculated using ADWR index well data. All groundwater level changes are reported in feet per year (ft/year), with metric equivalents in meters per year (m/year) provided in parentheses. The long-term period captures the cumulative impacts of Arizona’s groundwater management policies, prolonged drought conditions, and evolving water conservation practices. The short-term period reflects recent developments, including the implementation of the 2019 Drought Contingency Plan, increased groundwater reliance due to Colorado River shortages, and the expansion of groundwater pumping in unregulated areas. This temporal framework allows for the identification of both long-term trends and more recent shifts in groundwater dynamics.
Two contaminants, arsenic and nitrate, were used as primary water quality indicators due to their prevalence, toxicity, and regulation under drinking water standards. These contaminants present significant health risks, originating from natural sources and human activities, respectively. Data were sourced from agency databases, Freedom of Information Act (FOIA) requests, and published literature. Compliance monitoring data for CWS were obtained from the EPA, while private well data were provided by the Arizona Department of Environmental Quality (ADEQ), the U.S. Geological Survey (USGS), and previous studies [90]. The dataset encompasses 27,334 arsenic observations and 47,783 nitrate observations collected between 1998 and 2019 across state and Tribal water systems in Arizona. To handle non-detection observations, multiple imputation methods and sensitivity analyses were employed [3,11]. Using the Amelia package in R, contaminant concentrations below detection limits were replaced with values based on the EPA’s MDL or MRL divided by the square root of two, ensuring that imputed values remained within defined bounds [46,91]. In cases where both MDL and MRL were provided, we prioritized MDL to minimize potential bias, as MRLs can overestimate contaminant levels. Studies have shown that MRL-based imputation may introduce conservative bias. Sensitivity analyses in our study confirmed that imputation choices did not significantly affect the results. Records below the MDL accounted for 97.8% of arsenic and 54.5% of nitrate observations, highlighting the challenges of measuring contaminants at low concentrations. Water quality variables were analyzed as continuous measures of contaminant concentrations (ValueImp1) and binary indicators for detection (Detect) and regulatory exceedance (MCLExceeded). This dual framework enables a comprehensive evaluation of both contamination extent and its regulatory implications across groundwater systems.

2.4. Statistical and Spatiotemporal Analysis

This study applies the methods used in Williams, et al. [28], utilizing areal apportionment and spatial overlay techniques to link demographic, socioeconomic, and hydrogeologic data to service areas while expanding the analysis to include groundwater availability and developing new models to examine the relationship between availability, access, and quality. We employed geostatistical tools, ANOVA, and multivariate regression models to analyze relationships between groundwater level changes and explanatory variables. These methods assessed mean differences and associations among groundwater level change, water quality indicators, policy frameworks, service area characteristics, and socioeconomic factors. Integrated datasets included groundwater levels, hydrogeologic attributes, water service boundaries, and regulatory designations, with all analyses conducted at the service area level.
The hypothesis posited that groundwater availability, measured by changes in groundwater levels, is influenced by access factors and water quality, with greater declines expected in areas with unregulated water supplies, weaker regulatory oversight, vulnerable aquifers, and disadvantaged communities. ANOVA and pairwise comparisons evaluated mean differences in groundwater level changes, while mixed-effects regression models estimated associations, incorporating interaction terms to examine combined effects of demographic, hydrogeologic, and policy variables [9,10]. The logistic regression models estimated prevalence ratios for binary outcomes [5,10,92]. Variables were stratified into subgroups based on water quality (continuous and binary for nitrate and arsenic detection and exceedance), hydrogeologic characteristics, and policy designations [5,10]. Regression models controlled for service area characteristics, aquifer types, and regulatory designations to explore associations with groundwater level changes.
Hierarchical and k-means clustering in ArcGIS grouped service areas by groundwater level change patterns and shared characteristics, identifying spatial clusters with significant declines and associated predictors. These clusters highlighted high-risk areas, offering insights for targeted policy and management interventions [46,93,94].
Sensitivity analyses assessed the robustness of findings by testing various groundwater level thresholds, comparing models, and stratifying by aquifer type, supply type, policy designation, and regulatory primacy [10]. Water quality variables were analyzed as continuous (measured concentrations) and binary (detection and regulatory exceedance), and two contaminants, nitrate and arsenic, were included to ensure robustness. These methods accounted for spatial and temporal variability, integrating predictors such as aquifer types, policy designations, and demographic characteristics [26,28].

3. Results

Understanding the relationship between groundwater availability, access, and quality is critical for ensuring the sustainability of Arizona’s drinking water resources. This study examines how changes in groundwater levels (availability) intersect with patterns of contaminant occurrence (quality) and socio-hydrogeological factors that influence water distribution (access). The findings identify areas at heightened risk of contamination and limited access by analyzing spatial and temporal variations in groundwater level fluctuations alongside hydrogeology, supply service area characteristics, and regulatory oversight. These insights support the development of targeted management strategies to promote equitable access to safe drinking water and ensure the long-term sustainability of groundwater resources.

3.1. Temporal Patterns in Rates of Groundwater Level Change

The distribution of groundwater availability in Arizona’s drinking water supply service areas exhibits significant variability over 20-year and 10-year periods (Figure 3). The 20-year groundwater level change map reveals widespread declines ranging from −52.40 to −0.01 ft/year (−15.97 to −0.003 m/year), particularly outside designated groundwater management areas (AMAs), highlighting long-term overuse and insufficient regulation. In contrast, positive changes (0.01 to 44.00 ft/year or 0.003 to 13.41 m/year) are localized, primarily within AMAs and urban centers, indicating the success of targeted recharge efforts and stricter management practices.
The 10-year groundwater level change map reflects similar patterns but shows fewer areas of decline, suggesting potential stabilization in groundwater levels due to improved management strategies and conservation efforts. Positive trends are more pronounced in managed regions, reinforcing the impact of recharge projects and policy interventions. However, the long-term map underscores cumulative impacts, with persistent declines in unmanaged areas and positive changes concentrated in AMAs and INAs with active groundwater management. Tribal reservations show limited improvements, with many areas experiencing declines or lacking data (represented in gray). The prevalence of no-data areas across Tribal lands and unmanaged regions presents a barrier to comprehensive assessment and sustainable groundwater management.

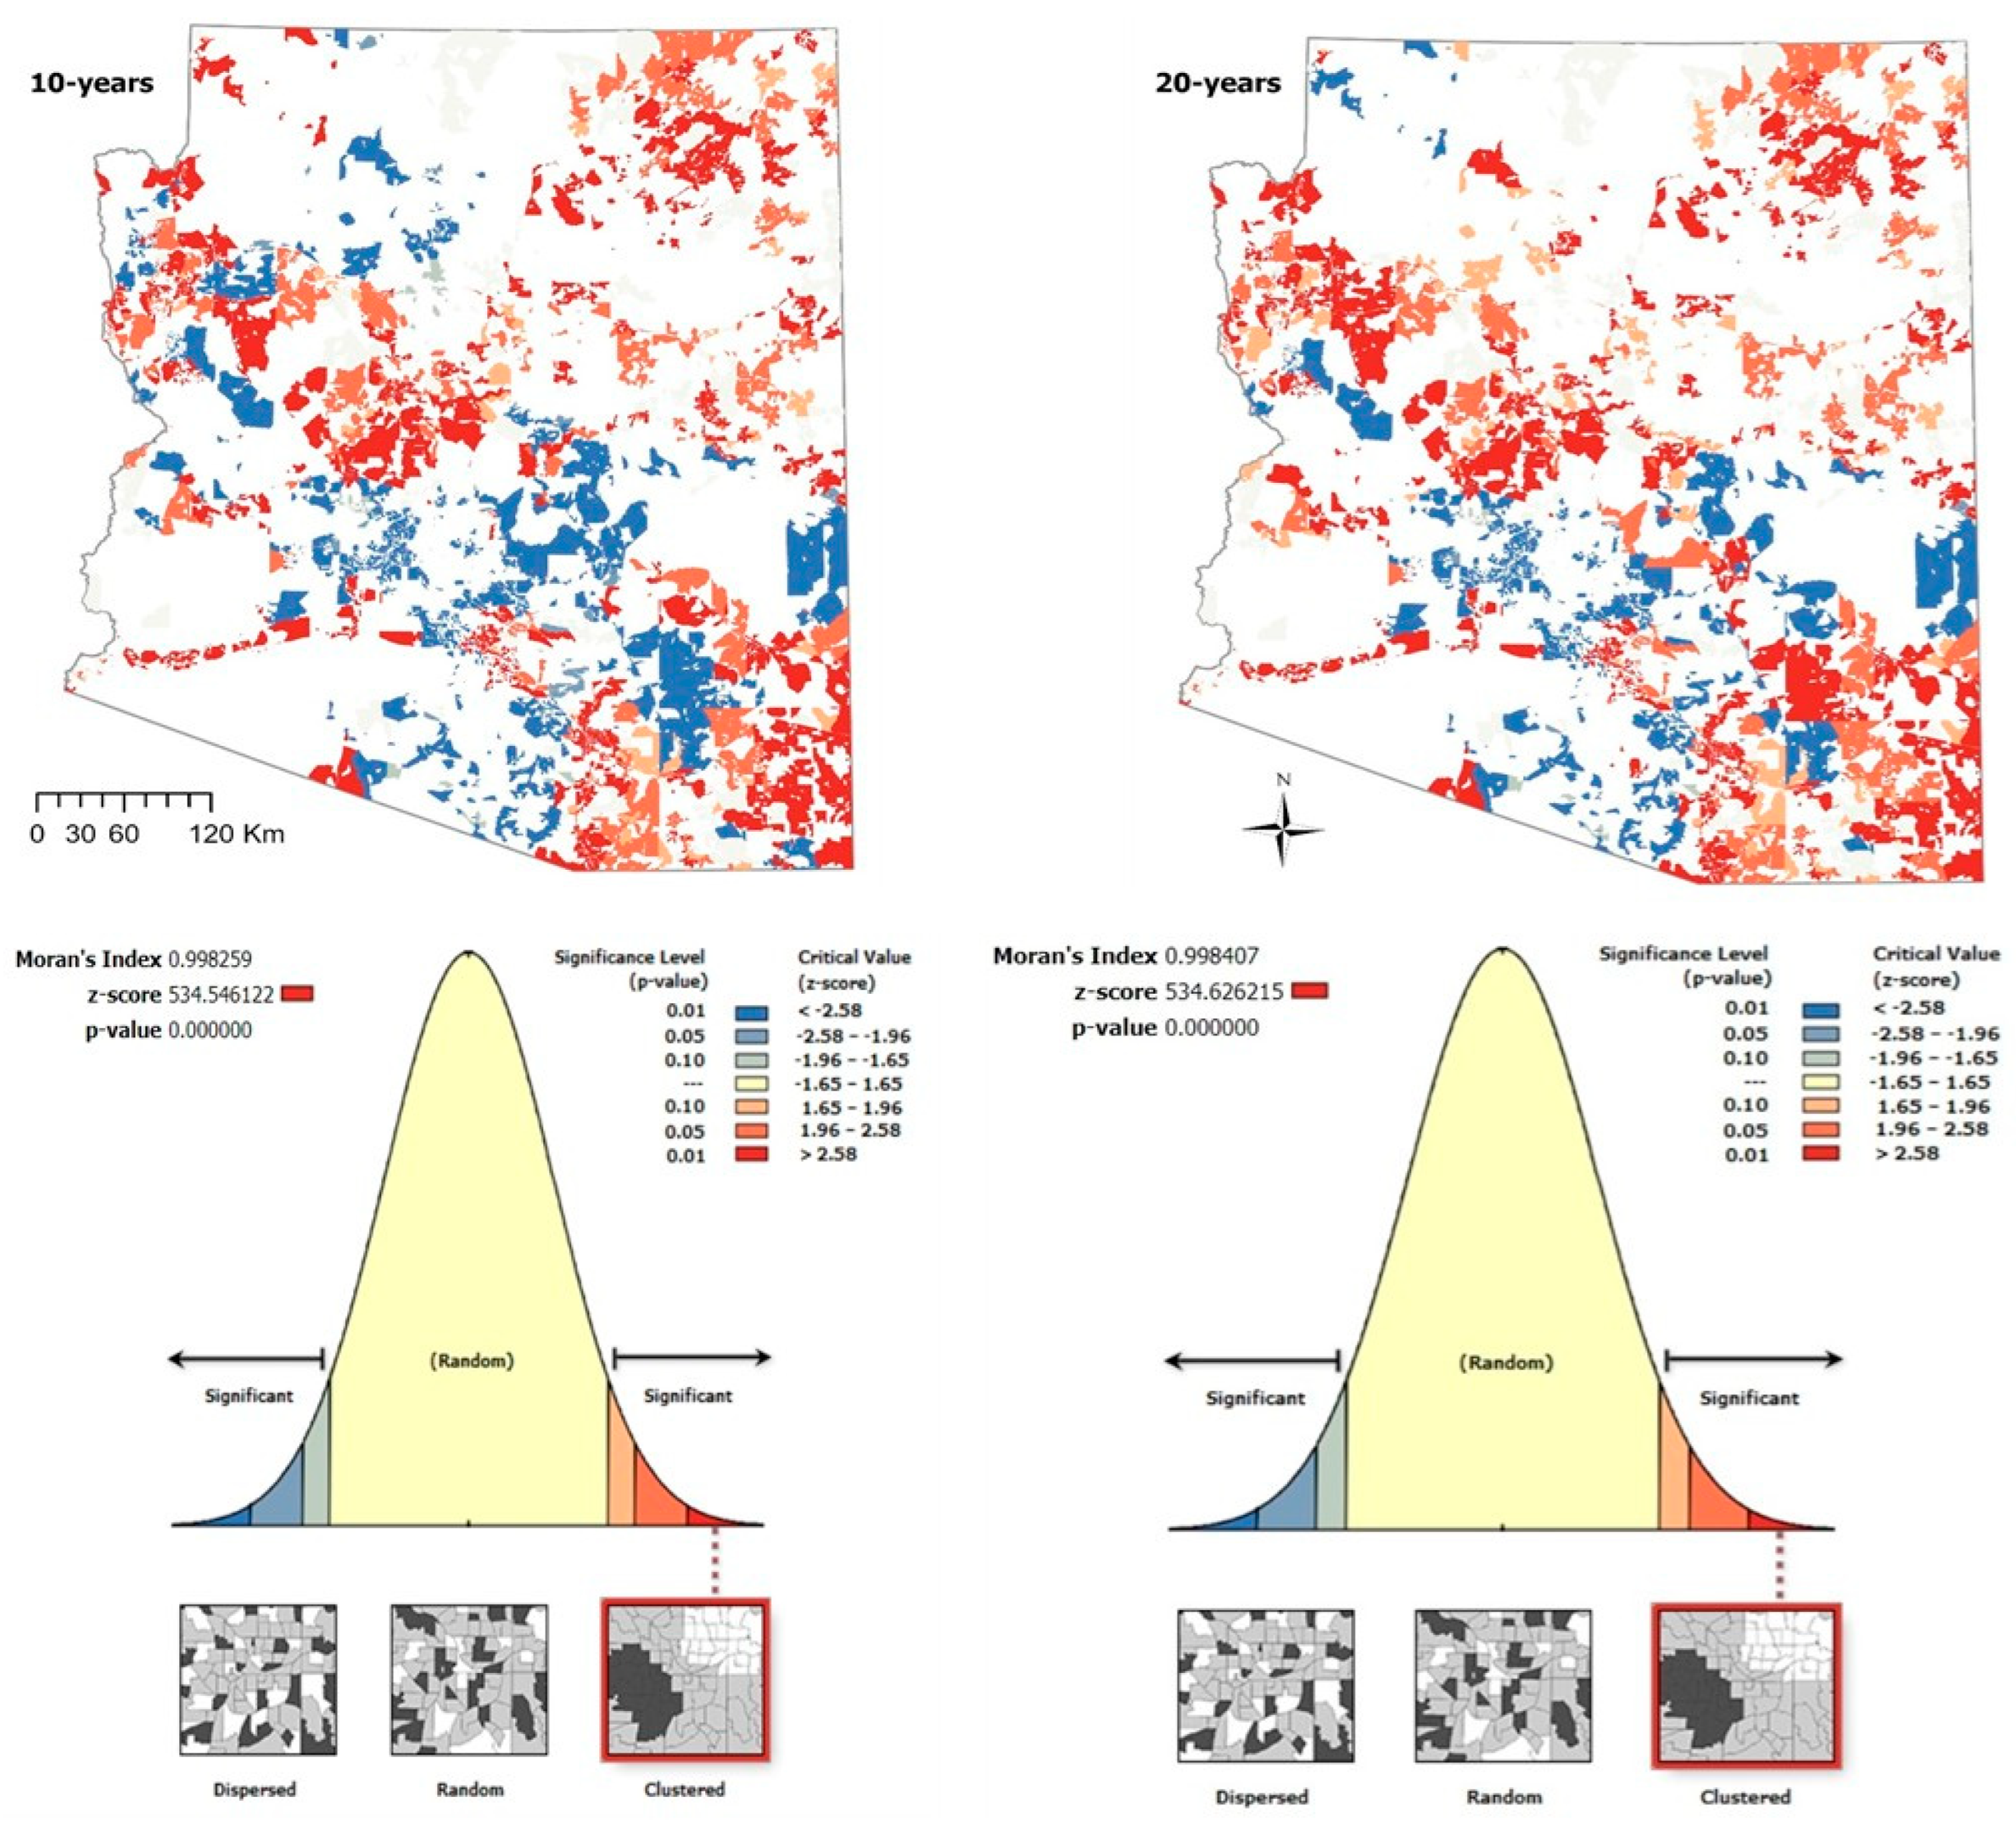
3.2. Spatial Distribution of Groundwater Level Changes

The spatial analysis of mean rates of groundwater level change (Figure 4) revealed significant clustering patterns. The spatial cluster analysis of groundwater level changes reveals distinct patterns over the long-term (2001–2020) and short-term (2011–2020) periods. In the 20-year analysis, extensive high-high clusters (red) indicate widespread groundwater declines, particularly in central Arizona (Pinal and Maricopa counties), southeastern Arizona, and parts of northern Arizona, reflecting long-term cumulative impacts of intensive groundwater use for agriculture, urbanization, and industrial activities. In contrast, the 10-year period shows a notable reduction in red clusters and an increase in low-low clusters (blue), especially within AMAs and regions benefiting from managed aquifer recharge projects. This shift suggests improvements in groundwater conditions in specific areas, potentially due to recent policy interventions, including the Drought Contingency Plan (2019) and expanded water conservation programs. Despite these improvements, persistent red clusters in rural and agricultural zones highlight areas of continued groundwater stress, particularly outside regulated AMAs.
Moran’s I results confirm statistically significant clustering (p < 0.01) in both periods, with the 10-year period showing more balanced clustering, suggesting divergent trends influenced by policy and environmental factors. The Getis-Ord Gi* statistic further identifies significant clusters, confirming areas of persistent decline and regions with improved conditions, reflecting the impact of groundwater management efforts and environmental changes across Arizona.

3.3. Groundwater Access and Pollution

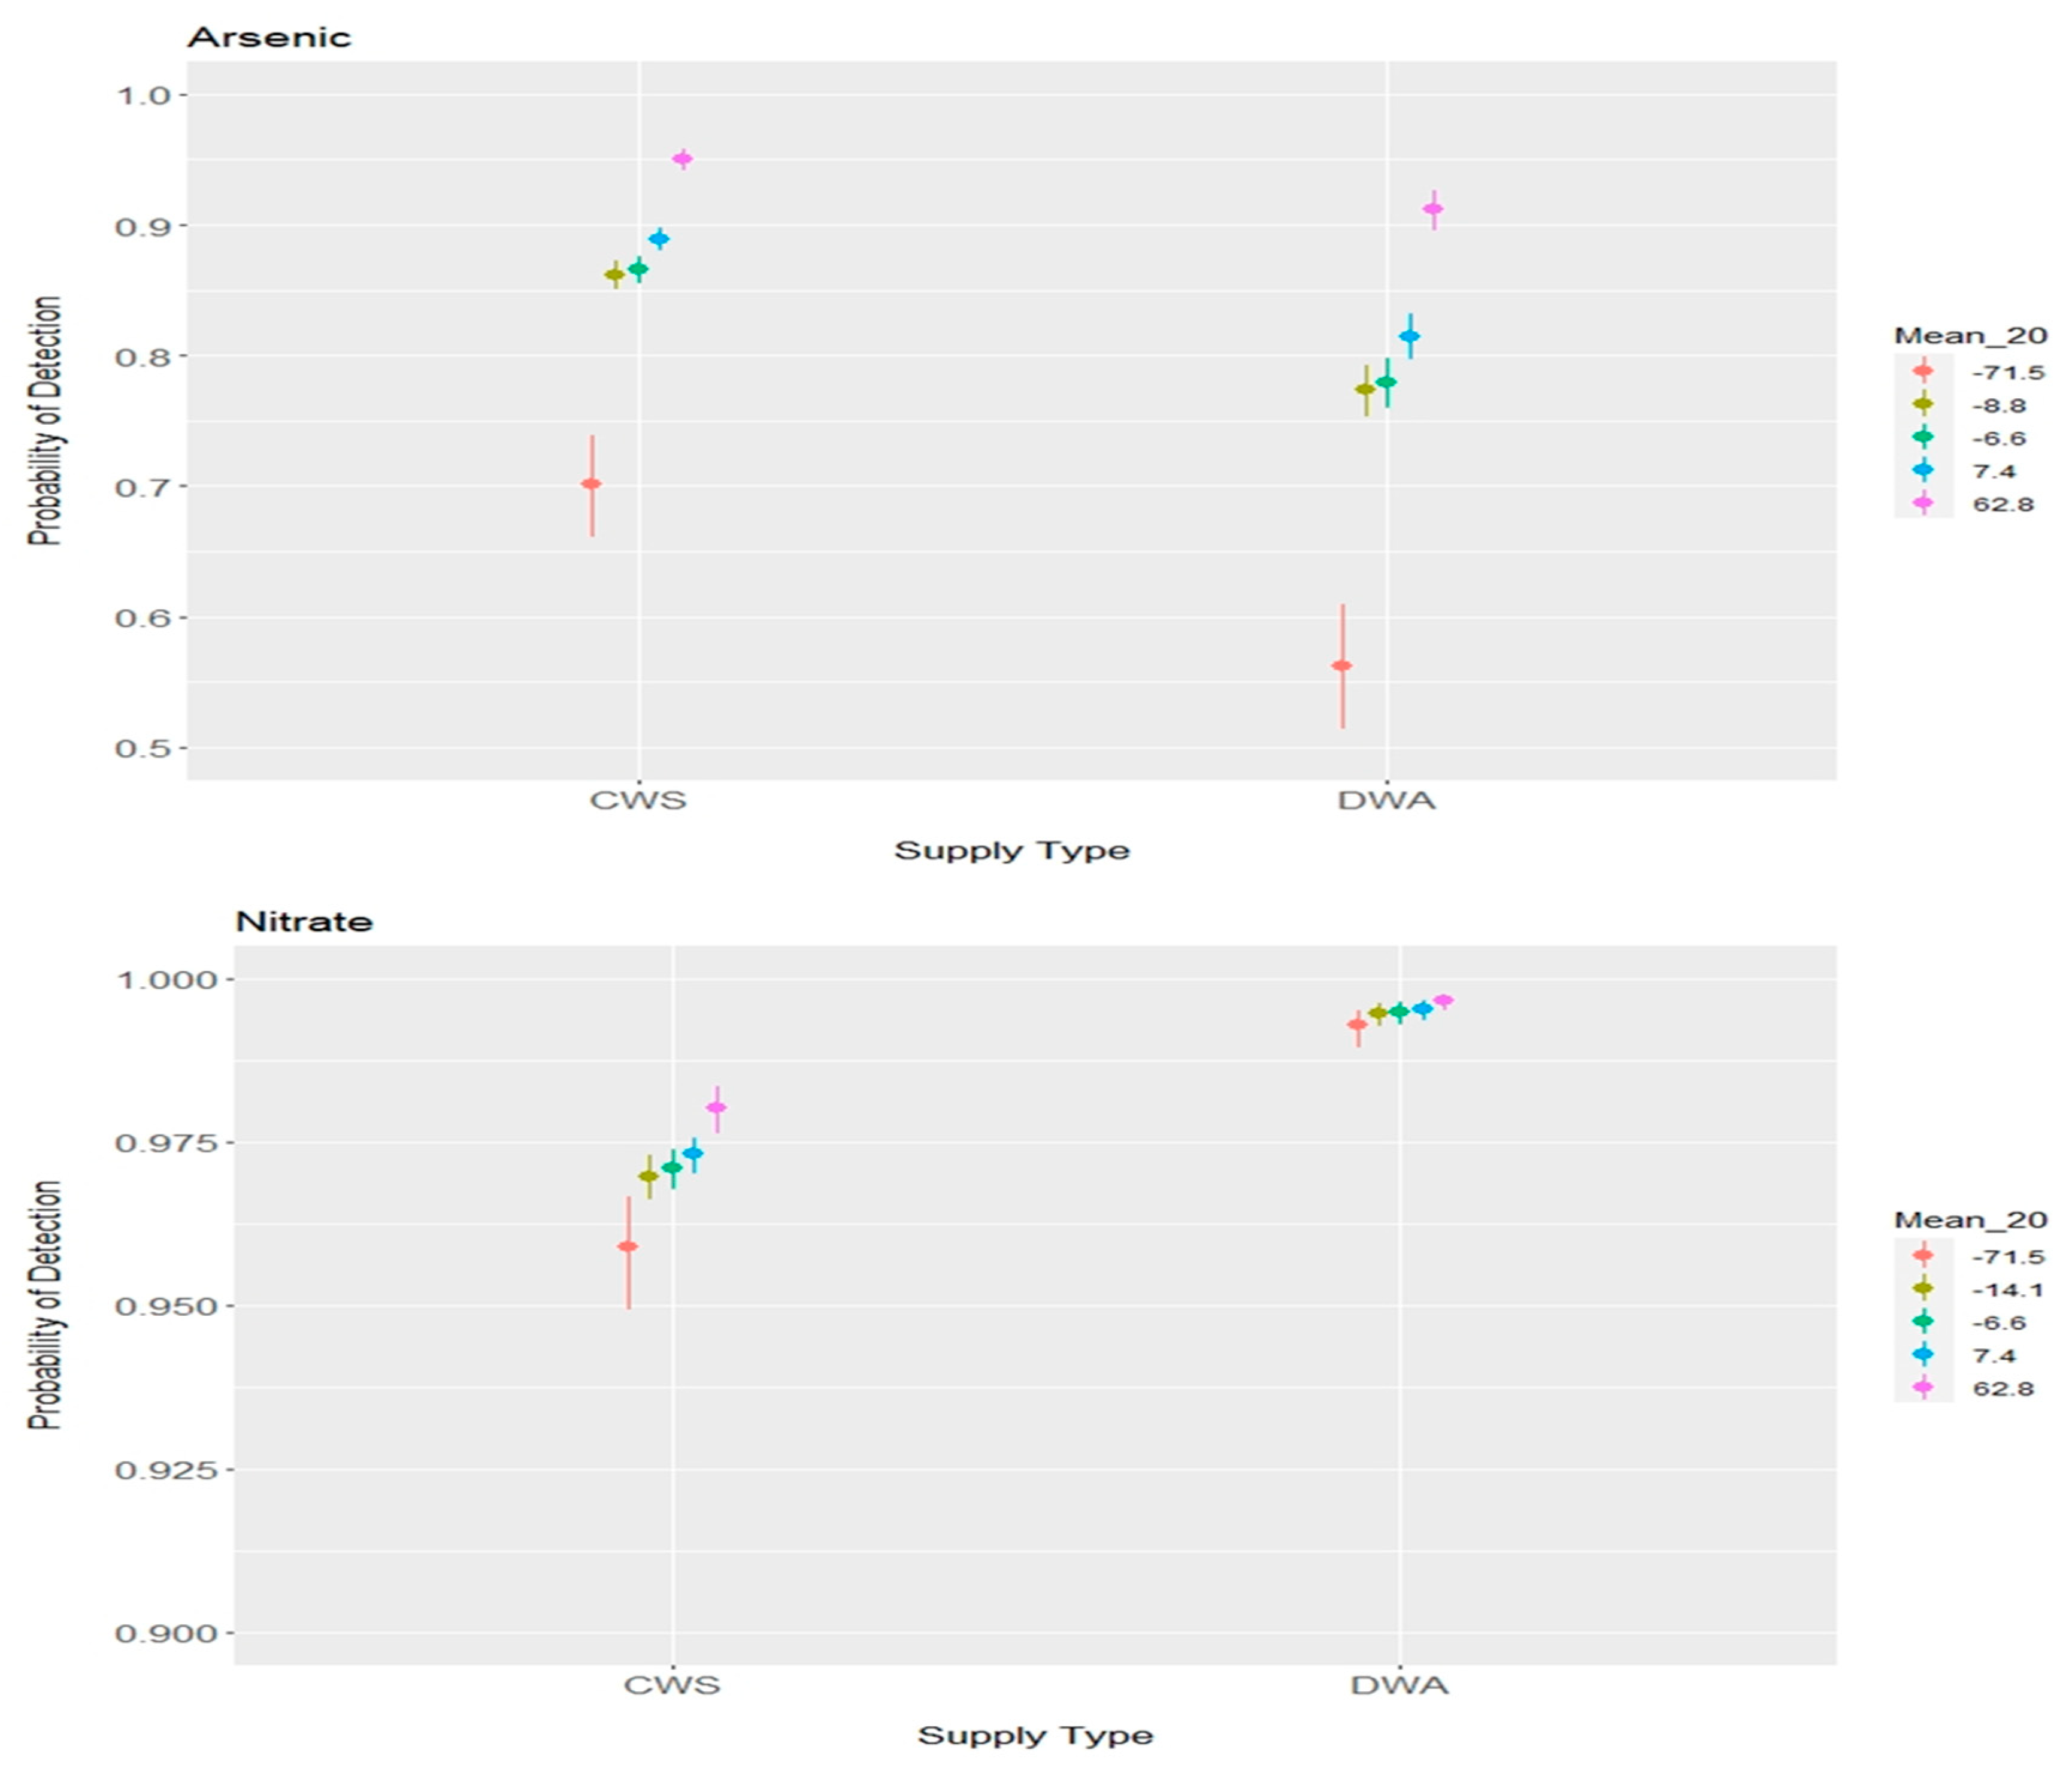
3.3.1. Groundwater Level Change and Contaminant Detection

Examination of the rates of change in groundwater levels with arsenic and nitrate detection across groundwater sources revealed notable disparities and significant associations with predictors (Appendix ATable A1 and Table A2). Specifically, areas experiencing higher rates of groundwater level recharge over 20 years (Mean_20) are linked to an increased probability of arsenic detection (β = 0.016 p < 0.001) and nitrate detection (β = 0.0044, p < 0.001). As shown in Figure 5, drinking water sources located in groundwater subbasins experiencing higher rates of decline in groundwater levels exhibited lower rates of arsenic and nitrate detection, while those with higher rates of groundwater level recovery tended to show higher arsenic and nitrate detections. Moreover, systems under Tribal primacy show a notably lower likelihood of arsenic and nitrate detection compared to State-regulated systems. Aquifer type also matters, with karst aquifer-dependent systems displaying a lower likelihood of arsenic detection than alluvial aquifers. Additionally, DWA sources exhibit a lower likelihood of arsenic detection and a higher likelihood of nitrate detection than CWS.

3.3.2. Temporal Changes in Groundwater Availability and MCL Exceedance

The decade spanning 2011 to 2020 witnessed a notable correlation between the rate of groundwater level change (Mean_10) and the probability of arsenic and nitrate MCL exceedances in groundwater sources of drinking water (Figure 6). Both arsenic and nitrate MCL exceedances are positively related to groundwater level changes. For arsenic, the relationship is linear, suggesting a steady increase in exceedance probability with rising groundwater levels. For nitrate, the relationship is exponential, indicating a rapid increase in exceedance probability as groundwater levels rise more significantly. These findings highlight a linkage between increased groundwater access and contamination risk in arid regions, pointing to the importance of considering groundwater level changes as a critical factor in assessing the risk of contaminant exceedances in drinking water supplies.

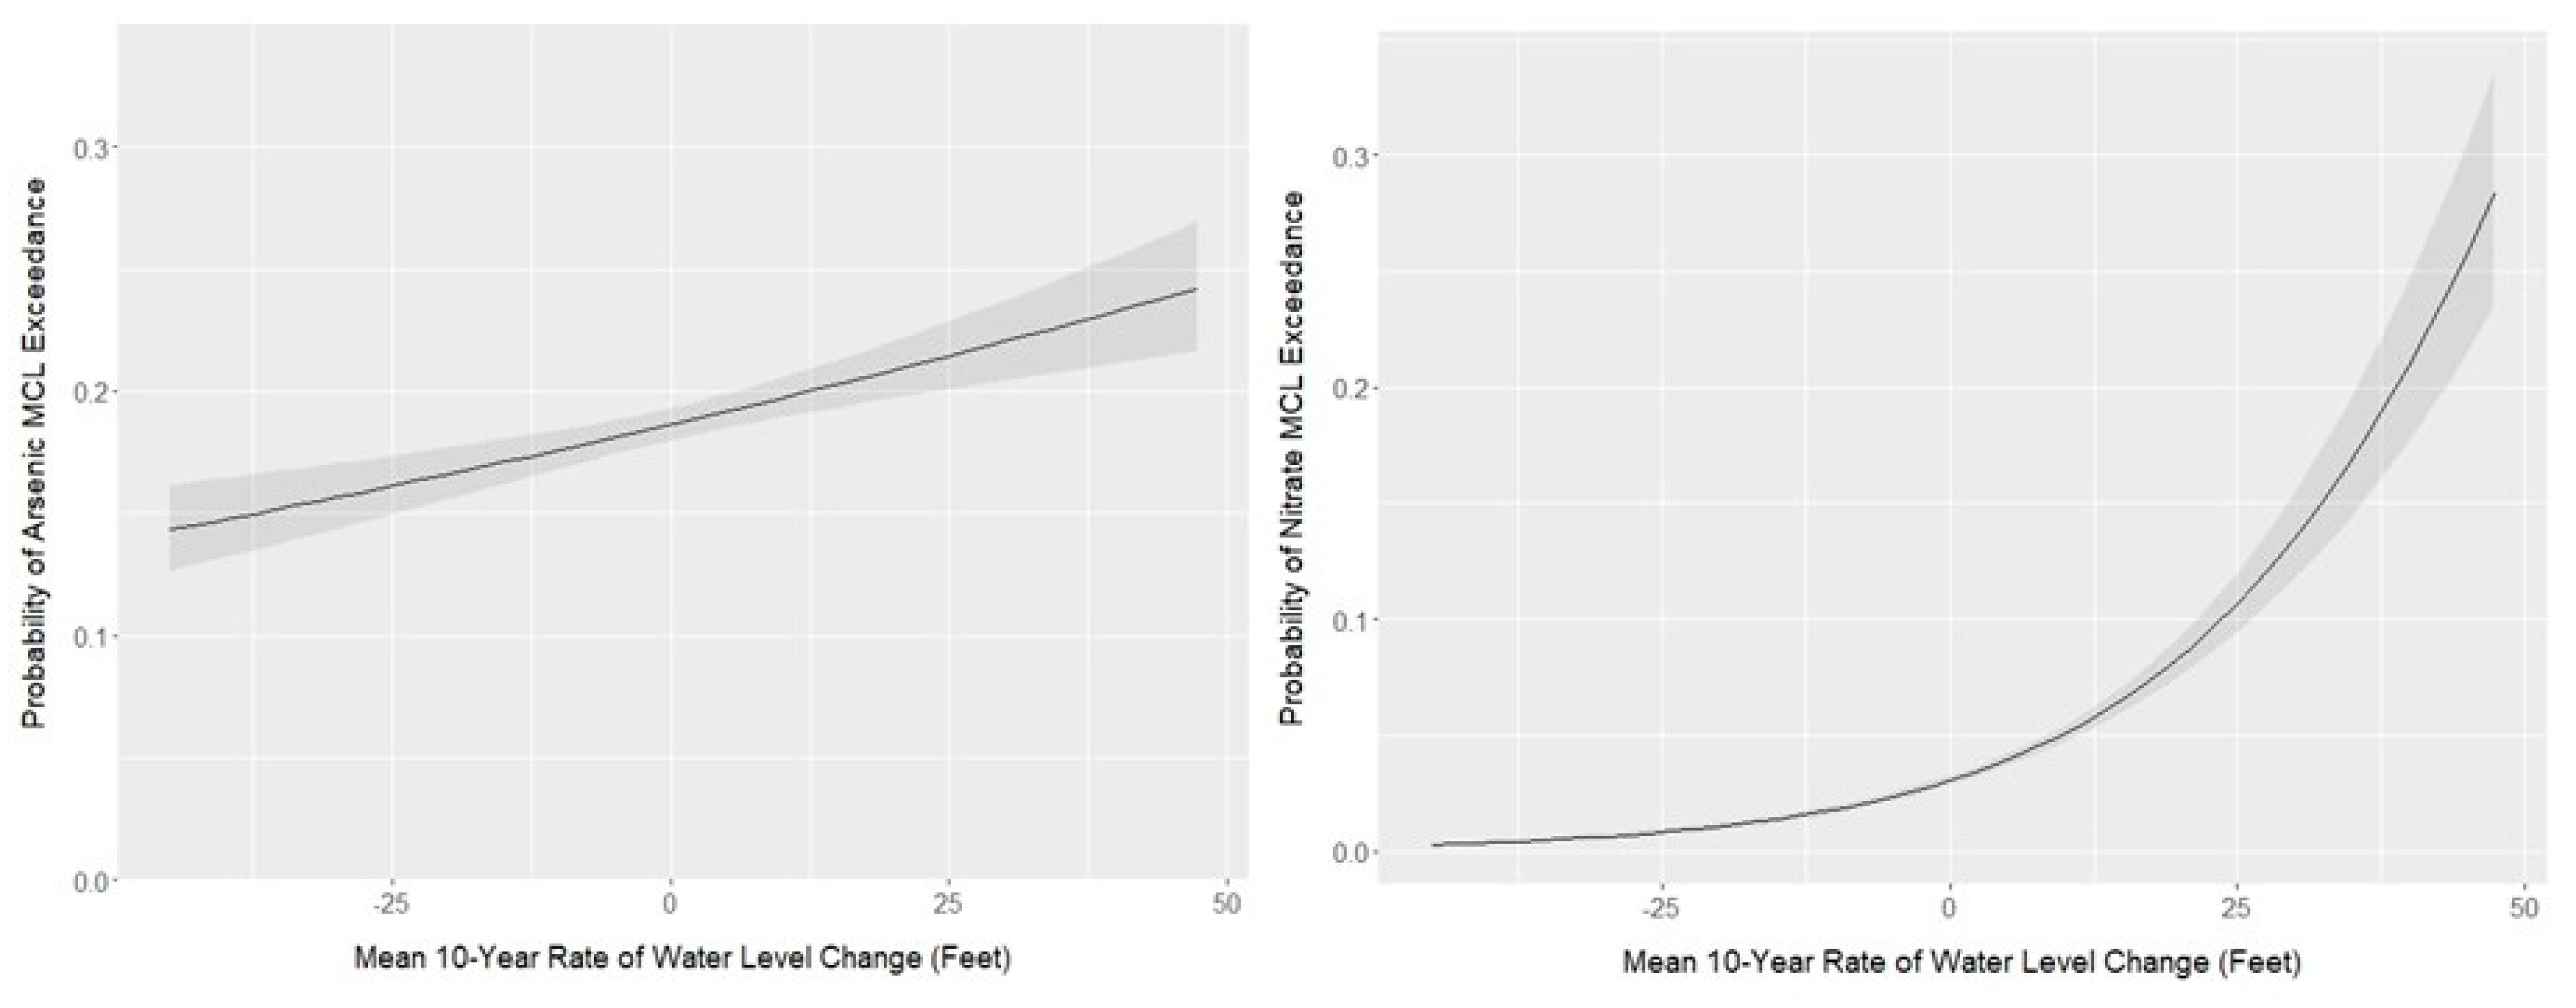
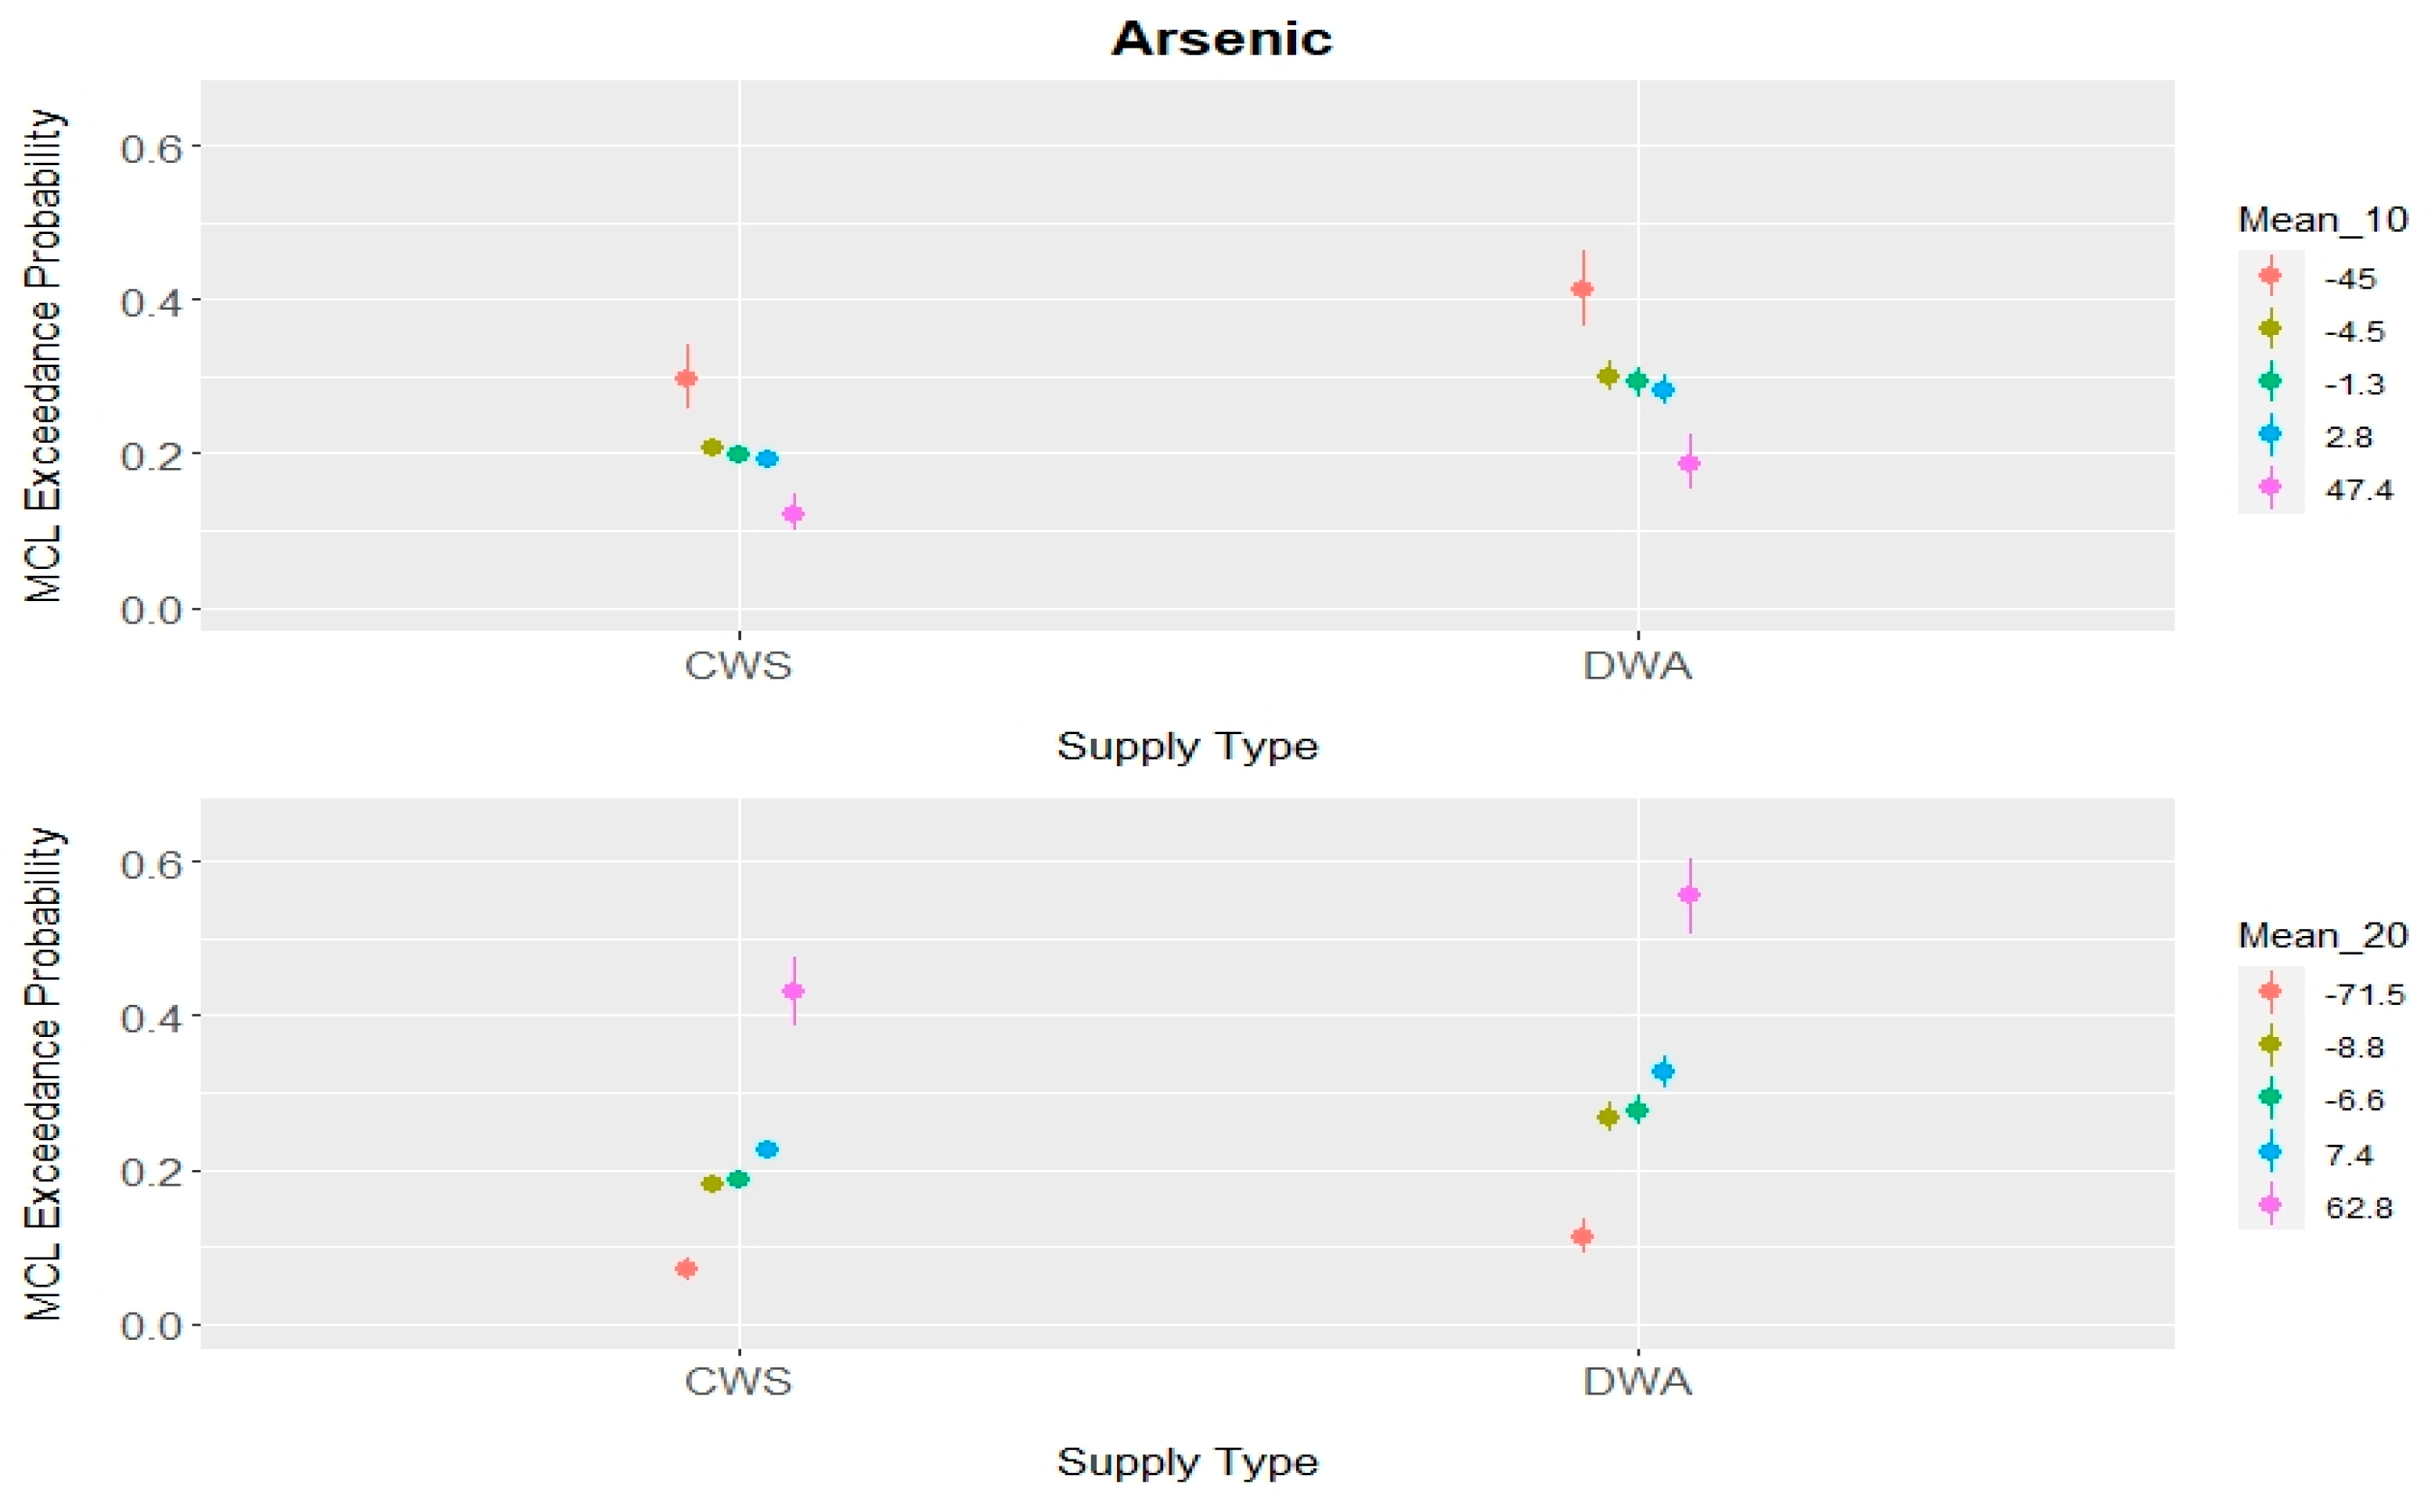
3.4. Temporal Associations: Groundwater Level Change and Arsenic MCL Exceedance

Figure 7 illustrates mean differences in arsenic MCL exceedances in groundwater sources, comparing CWS and DWA over 20-year (Mean_20) and 10-year (Mean_10) periods. Notably, DWA exhibits higher mean arsenic MCL exceedances than CWS across both periods. As changes in groundwater level increase, MCL exceedances also rise, with the highest exceedances observed in DWA, particularly at a mean change rate of 62.8 feet over 20 years and an average change rate of 47.4 feet over 10 years.
The temporal analysis of arsenic exceedances in groundwater over a 20-year period and a 10-year period reveals contrasting trends. Over the 20-year span, higher groundwater recharge rates were associated with increased arsenic exceedances, indicating a potential link between recharge events and arsenic contamination. In contrast, during the more recent 10-year period, higher recharge rates were correlated with lower nitrate exceedances. These findings suggest that temporal shifts in recharge dynamics, water policies, and land use practices may influence nitrate contamination patterns in groundwater.

3.5. Temporal Relationship Between Groundwater Availability and Predictors

The analysis of groundwater level changes over 20 years reveals notable relationships between water quality indicators, water policy variables, demographic factors, and housing characteristics. For Detect (arsenic presence) and MCLExceeded (regulatory exceedance), higher odds ratios were observed in the 20-year decline model compared to the 10-year model (Detect: OR = 0.92, 0.94; MCLExceeded: OR = 0.97, 0.98). These results indicate that arsenic detection and exceedance of MCLs are more strongly associated with groundwater declines in the longer-term model.
For arsenic, higher rates of annual groundwater level change from 2011 to 2020 were positively associated with MCL exceedance (Estimate = 0.007, p < 0.001, OR = 1.01). Similarly, higher rates of groundwater level change increased the likelihood of nitrate MCL exceedance (Estimate = 0.049, p < 0.001, OR = 1.05). Non-Designated Areas showed differing associations: positive for arsenic (Estimate = 0.101, p = 0.004, OR = 1.11) and negative for nitrate (Estimate = −0.733, p < 0.001, OR = 0.48).
Water policy variables, such as Non-designated Areas (NDAs) and Tribal jurisdictions, showed slightly higher detection probability in the 20-year model compared to the 10-year model (NDA: OR = 1.54, 1.52; PRIMACY(Tribal): OR = 0.62, 0.69), emphasizing their consistent influence on groundwater declines. In contrast, karst aquifers exhibited marginally lower detection probability in the 10-year model (OR = 1.18, 1.16), indicating a nuanced temporal dynamic in these regions.
The interaction between tribal governance and karst aquifers demonstrated reduced detection probability in the short-term mode (OR = 1.66, 1.49), highlighting the evolving impact of Tribal management in karst regions over time. Demographic and housing factors, including the percent of Black and Hispanic/Latino population in service areas, as well as housing types such as migrant worker housing and rental units, were consistently associated with detection probability across both periods, reflecting stable relationships with groundwater availability.

3.6. Main and Interaction Effects of Predictors on Groundwater Decline

This section examines the relationship between groundwater decline, water quality, and access. Logistic regression analysis identified significant associations between groundwater level changes in drinking water supply service areas and key water access and quality predictor variables (Appendix ATable A1 and Table A2).

3.6.1. Water Quality Variables

The regression models examining groundwater level (GWL) decline reveal distinct patterns between binary (detection and MCL exceedance) and continuous (measured concentrations) definitions of nitrate and arsenic contamination, highlighting variations in their associations and temporal effects.
Binary Variables: Nitrate and arsenic detection and MCL exceedance are significantly and negatively associated with the probability of GWL decline across both the 20-year and 10-year periods (Table 2), suggesting that areas with detectable contamination are less likely to experience declining groundwater levels. This negative association suggests that areas with stable or increasing groundwater levels are more likely to exhibit contaminant detection and exceedances, indicative of long-term recharge or stabilization processes that mobilize contaminants into aquifers. For nitrate detection, the 20-year model shows a weaker effect compared to the 10-year model, indicating more immediate stabilization effects in the shorter term. While significantly and negatively associated with GWL decline, the rate of nitrate MCL Exceedance over 20 years also has a slightly weaker influence than the 10-year rate of nitrate MCL Exceedance, pointing to more immediate interactions between nitrate contamination and groundwater dynamics, where recharge stabilizes water levels while mobilizing nitrates.
Similarly, arsenic detection demonstrates a stronger relationship with groundwater stabilization in the 20-year model (estimate = −0.086, p < 0.001, OR = 0.92) relative to the 10-year model (estimate = −0.059, p < 0.001, OR = 0.94). Arsenic MCL exceedance is associated with a reduced probability of groundwater declines, with odds ratios of 0.97 (estimate = −0.028, p < 0.001) and 0.98 (estimate = −0.023, p < 0.001) for the 20-year and 10-year models, respectively. These results suggest groundwater sources with detectable or elevated arsenic levels were less likely to experience significant GWL declines, potentially due to limited usage or reliance on these sources. A complementary reciprocal groundwater recharge model supports these findings, showing that areas with detectable nitrate and arsenic are more likely to have stable or rising groundwater levels, highlighting the role of recharge in both water level stabilization and contaminant mobilization within aquifers.
Continuous Variables: Measured nitrate and arsenic concentrations exhibit strong, positive associations with mean GWL decline (Table 3), suggesting that higher contaminant levels are more likely to occur in areas of intensive extraction or localized contamination hotspots. For nitrate concentration, the association with groundwater decline is stronger over the 20-year period than in the more recent 10-year period. A similar trend is observed for arsenic concentration, with a stronger effect in the 20-year model. The 20-year model showed an exceptionally high odds ratio, indicating a substantial long-term association between arsenic levels and GWL decline. The 10-year model also reflected a positive and statistically significant relationship, though the magnitude of the association was notably reduced compared to the longer period. These results suggest that areas with elevated arsenic levels likely experience persistent reliance on groundwater, particularly in regions with limited alternative water sources.

3.6.2. Water Policy

The analysis of groundwater management policies, regulatory oversight, aquifer type, and water supply type reveals significant differences in magnitude, direction, and temporal trends. Non-designated groundwater management areas are less likely to experience groundwater level declines than regulated areas, with the strongest protective effects observed in long-term models. However, these effects weaken in the 10-year models, suggesting increasing short-term groundwater decline pressures in non-designated areas over the last decade.
Tribal oversight strongly mitigates groundwater level declines, particularly over the long term, with significant protective effects observed for both nitrate and arsenic. The positive estimates and extremely high odds ratios indicate that service areas under tribal governance are substantially less likely to experience GWL declines than those under state oversight. However, in the short term, tribal oversight remains an important factor for mitigating nitrate-related groundwater issues, whereas its effect on arsenic becomes statistically insignificant. This suggests that the influence of tribal governance varies depending on the type of contaminant, the timeframe, and whether contamination sources are geogenic or anthropogenic.
Karst aquifers exhibit contrasting patterns in water availability and contamination risk compared to alluvial aquifers. Long-term models indicate greater stability in groundwater storage, as karst aquifers show a lower likelihood of groundwater level declines. However, in short-term models, they become more vulnerable to instability, particularly in arsenic-contaminated areas, where groundwater level declines are more pronounced. These trends may be influenced by recent extraction pressures, climate variability, or localized contamination dynamics.
Domestic well areas consistently show a higher probability of GWL declines than community water systems. The strongest association is observed in the long-term arsenic model, where groundwater declines are most pronounced. In short-term models, the risks persist but are slightly reduced, indicating ongoing yet moderated groundwater vulnerabilities in unregulated areas.

3.6.3. Service Area Socioeconomic Characteristics

Racial composition of drinking water service areas shows significant associations with groundwater availability, as reflected in groundwater level trends (Appendix ATable A1 and Table A2). Service areas with higher percentages of Black populations experience reduced groundwater availability across all models, with the strongest effects in the 20-year models. Although slightly weaker in the 10-year models, the association remains consistent, indicating persistent groundwater access challenges for these communities. Conversely, areas with higher Hispanic/Latino populations are associated with greater groundwater availability, as indicated by positive associations across all models. For Native American populations, the associations vary; while the 20-year nitrate model shows no significant relationship, the 10-year nitrate and arsenic models suggest moderate improvements in groundwater availability, possibly reflecting localized management efforts or contextual factors.
Gender and age characteristics show significant associations with water availability. Service areas with higher female populations are associated with reduced groundwater availability, with the strongest associations observed over 20 years. These associations remain significant but are slightly weaker in the 10-year models, indicating persistent but moderating groundwater challenges for these areas. Service areas with a higher percentage of children under five show weak positive associations with groundwater declines, suggesting minor but consistent effects on groundwater availability. In contrast, areas with a larger older population (over 65 years) consistently exhibit improved groundwater availability, with the strongest effects seen over longer periods.
Housing characteristics also display distinct relationships with groundwater availability. Higher percentages of married-couple households are associated with reduced groundwater levels across all models, with the strongest effects observed over 20 years. Conversely, renter-occupied housing is consistently associated with improved groundwater availability, showing the most pronounced effects in long-term arsenic models and short-term nitrate models.
Seasonal housing exhibits a stronger impact on changing groundwater levels over longer timescales (Appendix ATable A1 and Table A2), suggesting a cumulative effect of periodic high water demand. Institutional housing types, such as correctional facilities, show a consistent but diminishing probability of groundwater decline over time. Non-institutional student housing has the strongest association with groundwater declines across both models, reflecting significant concentrated water use. Similar trends in arsenic models are observed for seasonal and institutional housing types, reinforcing their role in shaping groundwater demand and availability.

3.6.4. Groundwater Sustainability: Interaction Dynamics and Asymmetrical Drivers

The sensitivity analysis reveals notable patterns of symmetry and asymmetry in how different factors influence groundwater level declines and stabilization. Symmetrical relationships indicate that variables driving groundwater depletion also affect recharge, reinforcing a reciprocal relationship between groundwater decline and recovery. For example, arsenic detection and regulatory exceedance consistently show inverse relationships—areas with elevated arsenic levels are less likely to experience groundwater declines and more likely to stabilize. This pattern suggests that recharge and stable aquifer conditions may mobilize contaminants, linking water quality to groundwater availability dynamics.
In contrast, asymmetrical relationships were observed for certain hydrogeological and policy-related variables. Karst aquifers showed a higher likelihood of groundwater declines but a lower likelihood of stabilization, likely due to rapid recharge and depletion cycles that increase vulnerability to extraction pressures while offering limited long-term storage stability. Similarly, the interaction between tribal primacy and karst aquifers revealed contrasting effects between the decline and stabilization models. This suggests that tribal management influences groundwater dynamics differently depending on whether the system is depleting or recovering, particularly in vulnerable aquifers.
Significant interaction effects were observed across the 20-year and 10-year models (Appendix ATable A1). The interaction between tribal primacy and karst aquifers showed a strong protective effect in both models, with greater significance in the 10-year period, indicating an increasing role of tribal governance in short-term groundwater management. Similarly, non-designated groundwater areas in rural regions showed protective effects against groundwater declines, though the effect was more pronounced over 10 years.
Several variables exhibited non-symmetrical effects, meaning their influence on groundwater declines did not mirror their effect on stabilization. Karst aquifers were positively associated with groundwater declines in the 20-year model but showed no significant effect in the 10-year model, possibly due to short-term variability in recharge dynamics. Migrant worker housing areas had a stronger protective effect in the 20-year model compared to the 10-year model, suggesting that long-term groundwater management practices may benefit transient worker communities more than short-term interventions.
Some variables were statistically significant but had limited practical impact, as indicated by odds ratios close to 1. In the continuous models, nitrate levels had minimal influence in the 10-year model but a much stronger effect over 20 years, reinforcing the cumulative impact of contamination and recharge processes on groundwater availability. Similarly, demographic factors such as younger populations and housing types like rental and non-institutional housing had minor effects, while group housing variables exhibited localized water use patterns without broader impacts on groundwater trends. In the binary models, nitrate and arsenic exceedance were statistically significant but had little influence on groundwater level changes. Other demographic factors, such as Native American population percentages and rural housing, were also statistically significant but had negligible effects, suggesting that while these variables contribute to groundwater dynamics, they are not primary drivers of availability shifts.

4. Discussion

Groundwater sustainability is shaped by three interconnected dimensions: availability, influenced by depletion and recharge; access, determined by socioeconomic, regulatory, and infrastructural factors; and quality, impacted by contaminants like nitrate and arsenic. This study examines how groundwater level changes, socioeconomic disparities, and contamination risks intersect in Arizona’s groundwater-dependent drinking water systems, highlighting the complex interplay of environmental, social, and policy factors. The findings reveal significant spatial and temporal disparities in groundwater availability, access, and quality, with implications for resource management and policymaking. The following section examines these results in the context of existing research, regulatory frameworks, and potential policy interventions.

4.1. Spatial and Temporal Shifts in Groundwater Availability

Temporal analysis of groundwater levels over 20-year (2001–2020) and 10-year (2011–2020) periods reveal evolving relationships between groundwater availability, access, and quality. Short-term models show stronger associations with water quality variables, such as nitrate and arsenic detection and exceedance, reflecting the effect of recent recharge and contamination dynamics. In contrast, long-term models indicate cumulative effects, where recharge stabilizes groundwater levels but mobilizes contaminants over time. These findings align with Schaider, et al. [3], who reported persistent nitrate contamination disparities in U.S. drinking water linked to agricultural intensification. However, unlike Schaider et al., our study suggests that Arizona’s long-term groundwater management practices have moderated some disparities, emphasizing sustained policy interventions.
The shift from high-high to low-low clusters (Figure 4) in the short term suggests stabilization due to management strategies, including the Groundwater Management Act, the Drought Contingency Plan, and expanded Managed Aquifer Recharge (MAR) projects. Similar improvements were noted by Tadych, et al. [25] following MAR implementation, though our findings highlight additional benefits of Arizona-specific regulations and variations across aquifer types, regulatory jurisdictions, and water supply systems.
Persistent declines in rural, Tribal, and unregulated areas expose policy gaps, especially outside AMAs where groundwater use is largely unregulated. Targeted interventions and adaptive management practices can mitigate these vulnerabilities. Equity concerns persist as marginalized communities face disproportionate risks related to groundwater access and quality, reinforcing Balazs and Ray’s [9] emphasis on equity-focused water governance. Our findings show that inequities endure despite broad regulatory efforts, particularly in unregulated areas.
In arid regions like Arizona, spatial and temporal variations in groundwater dynamics are also influenced by climate variability, extraction practices, land use changes, and human activities. Climate variability influences fluctuations in precipitation, affecting recharge rates and long-term water availability. Intensive extraction disrupts flow patterns, accelerates depletion, and reduces storage capacity. Urban expansion and agriculture modify recharge zones and increase demand, while mining contributes to groundwater loss through dewatering, aquifer compaction, and disrupted recharge. Mondal [24] reported similar climate-driven groundwater declines, but Arizona’s land use policies and water banking programs have mitigated some depletion risks, influencing regional groundwater trends.

4.2. Water Quality

The relationship between groundwater level changes and contaminant concentration, detection, and MCL exceedance reveals the dual impact of recharge processes on water levels and contamination. Consistent negative associations between contaminant detection, MCL exceedances, and groundwater decline suggest that recharge mobilizes nitrate and arsenic, stabilizing water levels while increasing contamination risks. These patterns align with Ward, et al. [54], who reported that recharge events enhance nitrate leaching in agricultural regions, leading to replenishment and heightened contamination.
Stronger associations in the 10-year models indicate more immediate interactions, likely driven by recent changes in land use, agricultural practices, or recharge infrastructure. This aligns with Orellana-Macías and Perles Roselló [56], who found that nitrate concentrations respond rapidly to land use changes, especially in intensive agricultural areas. In contrast, weaker associations in the 20-year models suggest nitrate contamination persists as a marker for groundwater stabilization over time, influenced by historical land management and prolonged agricultural activities.
Arsenic-related variables exhibit weaker associations compared to nitrate, particularly in the 10-year models. Minor associations for arsenic detection and exceedance imply that arsenic dynamics are less sensitive to recharge processes or short-term hydrological changes. This observation is supported by Hoover, et al. [16], who noted that arsenic mobilization often results from localized geochemical conditions, such as redox fluctuations and mineral interactions, rather than broad hydrological shifts.
For both nitrate and arsenic, stronger associations in the 10-year models highlight GWL changes’ sensitivity to short-term contamination patterns. The weakening of these associations in the 20-year models suggests broader influences, including regional management practices, climatic trends, and aquifer characteristics. Banerjee, et al. [86] emphasized that vulnerability assessments should integrate both short- and long-term hydrological and geochemical data to capture comprehensive risks. By incorporating both temporal scales and variable formats, this study provides a more comprehensive understanding of how groundwater availability interacts with quality and access, offering valuable insights for groundwater management and policy development.
Comparing continuous (As and NO3) and binary (Detect and MCLExceeded) water quality variables highlights key insights into GWL changes. Continuous models reveal larger effect sizes, reflecting the stronger influence of actual contaminant concentrations. This finding aligns with Nemčić-Jurec, et al. [48], who reported that continuous metrics offer detailed insights into groundwater quality dynamics compared to binary regulatory thresholds. In contrast, binary models provide simpler interpretations with smaller effect sizes, which are suitable for compliance assessments and broad patterns. These results support Pennino, et al. [47], who emphasized the complementary roles of continuous and binary metrics in environmental monitoring. These approaches underscore the role of recharge in contaminant mobilization and its stabilizing effect on groundwater levels.
The analysis also reveals that areas with rising groundwater levels show higher arsenic and nitrate detection rates due to the reintroduction of water via recharge. This process can cause desorption driven by changes in pH and redox conditions, as well as the presence of competing ions like sulfate (SO4) and chloride (Cl), which release arsenic from sediments into the water. Conversely, subbasins with declining groundwater levels exhibit lower arsenic and nitrate detection rates, potentially due to reduced mobilization under compacted aquifer conditions, limiting arsenic release.
Additionally, Community Water Systems (CWS) in Arizona show higher detection rates for arsenic and nitrate compared to Domestic Well Areas (DWA). This discrepancy may be attributed to stricter monitoring and testing requirements for CWS and differences in hydrological characteristics. Regulated extraction and structured groundwater management in designated areas further explain variations in detection rates.

4.3. Water Access

4.3.1. Policy

Policy variables such as GMADefinedNDA and PRIMACYTribal consistently influence groundwater level trends across both short- and long-term periods. Stronger long-term associations highlight the cumulative effects of governance, particularly through Tribal oversight. Interaction effects, like PRIMACYTribal: AquiferTypekarst, underscore evolving Tribal management strategies in karst aquifers, where improved recharge and governance reduce groundwater risks over time. This aligns with Balazs, et al. [13], who found governance structures significantly impact contamination risks, though our study reveals a more pronounced effect of Tribal governance in Arizona due to region-specific water rights and co-management policies.
Non-designated areas (GMADefinedNDA) show strong protective effects against GWL declines, particularly in the 20-year models for nitrate and arsenic, reflecting long-term management benefits. These findings are consistent with Megdal, et al. [41], highlighting the effectiveness of groundwater management in arid regions. However, weaker impacts in the 10-year models suggest that immediate regulatory interventions are needed to address short-term pressures, such as increased groundwater extraction—a trend also noted by Engel [42].
Tribal oversight (PRIMACYTribal) effectively mitigates GWL declines, with significant protective effects in long-term models. This supports Hoover, et al. [16], who reported that Tribal-led governance fosters groundwater resilience. However, the lack of significance in the 10-year arsenic model suggests emerging challenges linked to localized contamination or resource limitations, emphasizing the need for continued investment in Tribal infrastructure, as noted by Zuniga-Teran, et al. [38].
Karst aquifers (AquiferTypekarst) show temporal variability. Long-term models suggest resilience due to effective recharge processes, while short-term models reveal increased vulnerabilities, likely driven by extraction pressures or climate variability. Kalhor, et al. [33] similarly emphasized the susceptibility of karst systems to hydrological changes. Domestic Well Areas (SupplyTypeDWA) face persistent risks, reflecting challenges of unregulated groundwater use, underscoring the call for integrated policies to promote sustainable access by Johnson, et al. [51].

4.3.2. Community Socioeconomic Characteristics

Demographic and housing variables significantly impact groundwater level changes, shaping localized disparities in access. Transient populations and housing pressures contribute to spatial variability, extending Cid-Escobar et al.’s [1] findings on socio-technical barriers in rural groundwater access. Our results reveal compounded racial and socioeconomic disparities, particularly in marginalized communities.
Areas with higher Black populations face greater probabilities of groundwater level decline, reflecting systemic inequities in groundwater access, consistent with Switzer and Teodoro [7]. This trend has been more pronounced over the past 20 years, suggesting gradual improvements in governance or infrastructure. Conversely, Hispanic/Latino populations show protective effects, potentially due to cultural practices or infrastructure advantages, similar to Delpla, et al. [12]. Native American/Alaska Native populations also show strong protective effects in short-term models, indicating shifts in groundwater management practices, aligning with Hoover, et al. [16] on the benefits of Tribal water governance.
Gender and age dynamics further reveal disparities. Areas with higher female populations exhibit greater groundwater level declines, indicating reduced groundwater access, consistent with McDonald and Grineski [60]. This suggests that gender disparities in resource allocation and infrastructure access may contribute to groundwater availability challenges. In contrast, areas with higher proportions of older populations (65+ years) are associated with lower probabilities of groundwater level decline (p < 0.001, OR = 0.99 across models), suggesting relatively better groundwater availability. This trend may reflect lower extraction pressures, reduced water demand, or stable infrastructure in older communities. While these findings challenge assumptions about aging populations facing increased water insecurity, further research is needed to assess how governance and infrastructure adaptation influence groundwater sustainability for different demographic groups.
Housing characteristics significantly influence groundwater access and contamination risks, with distinct patterns by contaminant type and timeframe. Long-term trends show that agricultural groundwater reliance heightens nitrate contamination and depletion risks, supporting Fischer, et al. [50]. In contrast, arsenic models suggest natural recharge processes mitigate long-term risks, with weaker associations in short-term models suggesting these contamination dynamics evolve gradually.
Household structure also plays a role. Married-couple households experience reduced groundwater access over time, likely reflecting cumulative water demands. Conversely, renter-occupied housing areas benefit from improved access, possibly due to urban infrastructure efficiencies, as noted by Wallace and York [93]. Student housing has a significant long-term influence on groundwater availability, while seasonal and institutional housing show modest impacts.
These findings underscore the importance of integrating socioeconomic considerations into groundwater policies to address disparities and improve water-use practices, reinforcing, and echoing Mueller and Gasteyer’s [59] emphasis on environmental justice in water governance.

4.3.3. Implications of Interactions and Asymmetrical Drivers in Groundwater Dynamics

Understanding temporal dynamics and interaction effects in groundwater management is crucial for developing targeted, sustainable interventions that address diverse environmental and community needs. The interaction between Tribal oversight and karst aquifers (AquiferTypekarst) highlights the sustained effectiveness of Tribal water governance in mitigating groundwater depletion in karst aquifers, supporting findings by Hoover et al. [16]. Similarly, the interaction between non-designated groundwater management areas (GMADefinedNDA) and rural areas (Rural_pcnt) reveals localized regulatory impacts and evolving rural dynamics, consistent with Fischer, et al. [50]. Karst aquifers show stronger associations with Native populations in the 10-year nitrate model, underlining the need for targeted management strategies to address short-term contamination risks. This aligns with Zuniga-Teran, et al. [38], who identified groundwater vulnerabilities in Native communities. Tribal oversight in karst regions reinforces the importance of sustained, long-term management strategies for these sensitive aquifers.
In contrast, non-symmetric effects for karst aquifers suggest their influence on groundwater levels is more pronounced over longer timescales, likely due to slower hydrological or geophysical processes, consistent with Kalhor, et al. [33]. Housing-related variables show greater cumulative impacts over extended periods, while short-term effects are less significant. As discussed by Banerjee, et al. [86], symmetric effects often indicate stable groundwater access patterns, while asymmetry highlights unique vulnerabilities or localized dynamics.
The results highlight consistent statistical associations for several variables but with limited explanatory power for groundwater level changes. For example, while nitrate and arsenic exceedance variables were statistically significant, their odds ratios near 1 indicate minimal practical influence on groundwater dynamics, echoing Pennino, et al. [47], who noted such indicators often mark localized conditions rather than drive hydrological trends. Similarly, demographic variables such as Indian_Alaska_pcnt and housing-related factors like Rural_pcnt and group housing types demonstrated consistent statistical significance without notable impacts on GWL trends.
These findings illustrate the importance of distinguishing between statistical significance and practical implications in groundwater management. Variables with negligible practical effects may reflect sample size influences or underlying mechanisms not captured in the models. Nemčić-Jurec, et al. [48] stressed the importance of nuanced groundwater quality interpretations, noting statistical associations do not always equate to hydrological relevance. Future research should explore indirect or contextual effects and investigate potential drivers that may contribute to groundwater level changes beyond the observed statistical patterns. Understanding these nuances is critical for developing policies that address both ecological and hydrological processes comprehensively.

5. Conclusions

This study provides a comprehensive analysis of groundwater availability, access, and quality in Arizona’s groundwater-dependent drinking water systems. By examining groundwater level changes over both 20-year and 10-year periods, we identified persistent vulnerabilities shaped by infrastructural, environmental, socioeconomic, and policy factors. Our findings highlight that while long-term groundwater management strategies, such as the Groundwater Management Act and MAR projects, have contributed to stabilizing groundwater levels within designated groundwater management areas, significant challenges persist in rural, Tribal, and unregulated regions where oversight and resources are limited.
Groundwater availability is influenced by the cumulative effects of climate variability, land use changes, and extraction pressures, with adaptive management practices demonstrating the potential to mitigate depletion risks. Recharge plays a dual role—stabilizing groundwater levels while mobilizing contaminants like nitrate and arsenic, linking availability directly to water quality challenges. Stronger short-term associations between groundwater level changes and contamination risks reflect the immediate effects of land use and policy interventions, while long-term patterns highlight the influence of sustained governance and environmental conditions.
Access to groundwater is shaped by socioeconomic disparities, governance structures, and infrastructural factors. Tribal governance has emerged as a critical factor in mitigating groundwater declines, particularly in karst aquifers, demonstrating the effectiveness of localized management strategies. However, disparities persist, with marginalized communities facing disproportionate risks related to groundwater access and quality. These findings align with broader evidence that integrated, equity-focused, and data-driven policies are essential for sustainable groundwater governance.
To advance equitable and sustainable groundwater management, this study identifies five policy priorities. First, expand regulatory oversight beyond Active Management Areas to protect rural and non-designated areas where domestic wells and small systems remain vulnerable. Second, strengthen Tribal water governance through continued investment in infrastructure, technical capacity, and collaborative partnerships, reinforcing self-determined and resilient water management. Third, expand and tailor MAR programs—particularly in vulnerable aquifers like karst systems—using climate projections to enhance long-term effectiveness. Fourth, integrate equity into groundwater policy by leveraging socioeconomic data to guide planning and address the disproportionate risks faced by marginalized communities. Finally, invest in data-driven management through robust monitoring and accessible data-sharing platforms to support real-time, adaptive decision-making. These recommendations align with the study’s findings and emphasize the need for integrated, equity-focused, and evidence-based strategies across Arizona and other arid regions.
In conclusion, ensuring groundwater sustainability in Arizona and similar arid regions requires a holistic approach that integrates environmental management, equitable access, and water quality protection. Policy interventions must address regulatory gaps, particularly outside designated groundwater management areas, enhance support for Tribal and rural water governance, and promote adaptive strategies that consider both short- and long-term hydrological dynamics. By framing groundwater management within the interconnected dimensions of availability, access, and quality, this study offers actionable insights to inform more resilient and equitable water resource policies.

Author Contributions

Conceptualization, S.A.W.; methodology, S.A.W., D.M.Q., A.A.Z.-T. and G.C.; software, S.A.W.; validation, S.A.W., S.B.M., D.M.Q. and A.A.Z.-T.; formal analysis, S.A.W.; investigation, S.A.W.; resources, S.A.W., S.B.M. and D.M.Q.; data curation, S.A.W.; writing—original draft preparation, S.A.W. and A.A.Z.-T.; writing—review and editing, S.A.W., S.B.M., A.A.Z.-T., D.M.Q. and G.C.; visualization, S.A.W., G.C. and D.M.Q.; project administration, S.A.W.; funding acquisition, S.A.W., S.B.M. and D.M.Q. All authors have read and agreed to the published version of the manuscript.

Funding

This research was supported by a Babbitt Center for Land and Water Policy Dissertation Fellowship and fellowships from the University of Arizona Graduate College through the Arid Lands Resource Sciences Graduate Interdisciplinary Program.

Data Availability Statement

Processed data supporting the findings of this study are included in the article. Raw data are available from the corresponding author upon reasonable request. Access to some third-party datasets may require prior permission.

Acknowledgments

We extend our sincere gratitude to the Navajo Nation for sharing spatial data and well information for this study. We remain committed to upholding Tribal data sovereignty and privacy. In accordance with our agreement, the research findings will be shared to support their groundwater management initiatives. We also express our appreciation to Eric Scott for providing technical guidance in developing the software codes utilized in this analysis.

Conflicts of Interest

The authors confirm there are no conflicts of interest. The funding entities had no involvement in the study’s design, data collection, analysis, interpretation, manuscript preparation, or the decision to publish the findings.

Appendix A

Table A1. Logistic Regression Results for Nitrate Levels, Socioeconomic Predictors, and Interaction Terms.
Model: 20-Year GWL and NitrateModel: 10-Year GWL and Nitrate
VariablesEstimateStd ErrorStatisticp ValueLog OddsEstimateStd ErrorStatisticp ValueLog Odds
Water Quality
Nitrate (NO3)0.2280.01218.79<0.0011.260.1050.00715.499<0.0011.11
Race (%)
Black 0.6980.0323.5<0.0012.010.2370.01714.25<0.0011.27
Hispanic/Latino −0.0850.004−19.36<0.0010.92−0.0540.002−21.931<0.0010.95
Native American −0.0030.009−0.2850.7761.00−0.0970.005−18.844<0.0010.91
Gender and Age
Female 0.1220.0112.81<0.0011.130.0880.00516.453<0.0011.09
Age < 50.0320.0056.445<0.0011.030.0210.0037.384<0.0011.02
Age 65+ −0.0090.001−14.88<0.0010.99−0.0060.000−17.777<0.0010.99
Housing Type (%)
Rural 0.0470.00219.14<0.0011.050.0010.0010.4260.671.00
Married w/Children−0.1000.009−10.83<0.0010.91−0.0720.005−13.910<0.0010.93
Family Households 0.1650.00918.25<0.0011.180.0900.00517.691<0.0011.09
Migrant Workers −0.2540.049−5.202<0.0010.78−0.3560.027−13.010<0.0010.70
Rental Units −0.3850.025−15.15<0.0010.68−0.1020.014−7.174<0.0010.90
Fully Owned Homes −0.2060.006−35<0.0010.81−0.0760.003−23.011<0.0010.93
Renter−Occupied −0.1540.006−24.29<0.0010.86−0.0740.004−20.765<0.0010.93
Group Housing (%)
Seasonal Housing −0.0880.006−15.16<0.0010.92−0.0110.003−3.2430.0010.99
Non−Institutional Housing 0.0080.0023.4360.0011.01−0.0040.001−2.9510.0031.00
Correctional Facilities −0.0610.004−15.65<0.0010.94−0.0550.002−25.074<0.0010.95
Juvenile Facilities −0.0420.006−6.883<0.0010.96−0.0120.003−3.660<0.0010.99
Nursing Homes −0.0540.003−16.15<0.0010.95−0.0110.002−5.988<0.0010.99
Student Housing −0.1880.005−35.87<0.0010.83−0.0500.003−16.865<0.0010.95
Military Housing −0.0130.01−1.2610.2070.990.0040.0060.6380.5241.00
Variable Interaction Terms
Rural × BIPOC (%)0.0000.000−8.258<0.0011.000.0000.0000.4960.621.00
Karst × Native American (%)0.0700.0164.408<0.0011.070.1060.00911.796<0.0011.11
Tribal Primacy × Karst Aquifer−3.8981.436−2.7140.0070.02−6.6440.806−8.242<0.0010.00
NDA × Rural (%)−0.0560.003−16.28<0.0010.95−0.0360.002−18.573<0.0010.96
Response Variable: mean 20 yr water level decline rate − binary variable, 1 = decline.
Table A2. Logistic Regression Results for Arsenic Levels, Socioeconomic Predictors, and Interaction Terms.
Model: 20-Year GWL and ArsenicModel: 10-Year GWL and Arsenic
VariablesEstimateStd ErrorStatisticp ValueLog OddsEstimateStd ErrorStatisticp ValueLog Odds
Water Quality
Arsenic (As)91.6376.12914.951<0.0016E+3938.4943.9429.764<0.0015E+16
Race (%)
Black 0.630.03916.041<0.0011.880.3090.02512.232<0.0011.36
Hispanic/Latino −0.0850.005−16.05<0.0010.92−0.0290.003−8.399<0.0010.97
Native American −0.0640.006−11.37<0.0010.94−0.0310.004−8.565<0.0010.97
Gender and Age
Female 0.2390.01120.869<0.0011.270.0970.00713.206<0.0011.10
Age < 50.0540.015.309<0.0011.060.0090.0061.3140.1891.01
Age 65+ −0.0100.001−18.02<0.0010.99−0.0060.000−15.27<0.0010.99
Housing Type (%)
Rural −0.0150.003−4.814<0.0010.98−0.020.002−9.684<0.0010.98
Married w/Children−0.2160.01−21.34<0.0010.81−0.1190.007−18.363<0.0010.89
Family Households 0.1720.0117.111<0.0011.190.0930.00614.47<0.0011.10
Migrant Workers −0.5430.057−9.46<0.0010.58−0.7220.037−19.559<0.0010.49
Rental Units −0.3180.033−9.76<0.0010.73−0.1730.021−8.253<0.0010.84
Fully Owned Homes −0.1690.007−23.03<0.0010.84−0.0810.005−17.14<0.0010.92
Renter−Occupied −0.2400.008−30.45<0.0010.79−0.1320.005−26.09<0.0010.88
Group Housing (%)
Seasonal Housing −0.1610.008−21.02<0.0010.85−0.0560.005−11.35<0.0010.95
Non−Institutional Housing −0.0010.003−0.3490.7271.00−0.0070.002−4.095<0.0010.99
Correctional Facilities −0.0750.005−16.25<0.0010.93−0.0310.003−10.55<0.0010.97
Juvenile Facilities −0.0120.008−1.3990.1620.990.0190.0053.493<0.0011.02
Nursing Homes −0.0020.004−0.5640.5731.000.0010.0030.190.8491.00
Student Housing −0.0560.007−7.778<0.0010.95−0.0140.005−3.0540.0020.99
Military Housing 0.1190.0138.794<0.0011.130.0660.0097.614<0.0011.07
Variable Interaction Terms
Rural × BIPOC (%)0.0000.000−7.578<0.0011.000.0000.000−6.932<0.0011.00
Karst × Native American (%)−0.0140.008−1.8030.0710.990.0400.0057.968<0.0011.04
Tribal Primacy × Karst Aquifer−6.0870.582−10.46<0.0010.00−1.5680.374−4.188<0.0010.21
NDA × Rural (%)0.0130.0043.2630.0011.01−0.0010.003−0.5290.5971.00
Response Variable: mean 20 yr water level decline rate − binary variable, 1 = decline.

References

  1. Cid-Escobar, D.; Folch, A.; Ferrer, N.; Katuva, J.; Sanchez-Vila, X. An assessment tool to improve rural groundwater access: Integrating hydrogeological modelling with socio-technical factors. Sci. Total Environ. 2024, 912, 168864. [Google Scholar] [CrossRef]
  2. Ciampi, L.; Plumpton, H.J.; Osbahr, H.; Cornforth, R.J.; Petty, C. Building resilience through improving groundwater management for sustainable agricultural intensification in African Sahel. CABI Agric. Biosci. 2022, 3, 63. [Google Scholar] [CrossRef]
  3. Schaider, L.A.; Swetschinski, L.; Campbell, C.; Rudel, R.A. Environmental justice and drinking water quality: Are there socioeconomic disparities in nitrate levels in U.S. drinking water? Environ. Health 2019, 18, 3. [Google Scholar] [CrossRef]
  4. Allaire, M.; Wu, H.; Lall, U. National trends in drinking water quality violations. Proc. Natl. Acad. Sci. USA 2018, 115, 2078–2083. [Google Scholar] [CrossRef] [PubMed]
  5. Pace, C.; Balazs, C.; Bangia, K.; Depsky, N.; Renteria, A.; Morello-Frosch, R.; Cushing, L.J. Inequities in Drinking Water Quality Among Domestic Well Communities and Community Water Systems, California, 2011–2019. Am. J. Public Health 2022, 112, 88–97. [Google Scholar] [CrossRef] [PubMed]
  6. Thiros, S.A.; Paul, A.P.; Bexfield, L.M.; Anning, D.W. Water Quality in Basin-Fill Aquifers of the Southwestern United States: Arizona, California, Colorado, Nevada, New Mexico, and Utah, 1993–2009. U.S. Geol. Surv. Circ. 1358 2014. [Google Scholar] [CrossRef]
  7. Switzer, D.; Teodoro, M.P. The Color of Drinking Water. J. (Am. Water Work. Assoc.) 2017, 109, 40–45. [Google Scholar] [CrossRef]
  8. Vanderslice, J. Drinking Water Infrastructure and Environmental Disparities: Evidence and Methodological Considerations. Am. J. Public Health 2011, 101, S109–S114. [Google Scholar] [CrossRef]
  9. Balazs, C.L.; Ray, I. The drinking water disparities framework: On the origins and persistence of inequities in exposure. Am. J. Public Health 2014, 104, 603–611. [Google Scholar] [CrossRef]
  10. Spaur, M.; Lombard, M.A.; Ayotte, J.D.; Harvey, D.E.; Bostick, B.C.; Chillrud, S.N.; Navas-Acien, A.; Nigra, A.E. Associations between private well water and community water supply arsenic concentrations in the conterminous United States. Sci. Total Environ. 2021, 787, 147555. [Google Scholar] [CrossRef]
  11. Nigra, A.E.; Chen, Q.; Chillrud, S.N.; Wang, L.; Harvey, D.; Mailloux, B.; Factor-Litvak, P.; Navas-Acien, A. Inequalities in Public Water Arsenic Concentrations in Counties and Community Water Systems across the United States, 2006–2011. Environ. Health Perspect. 2020, 128, 127001. [Google Scholar] [CrossRef] [PubMed]
  12. Delpla, I.; Benmarhnia, T.; Lebel, A.; Levallois, P.; Rodriguez, M.J. Investigating social inequalities in exposure to drinking water contaminants in rural areas. Environ. Pollut. 2015, 207, 88–96. [Google Scholar]
  13. Balazs, C.L.; Morello-Frosch, R.; Hubbard, A.E.; Ray, I. Environmental justice implications of arsenic contamination in California’s San Joaquin Valley: A cross-sectional, cluster-design examining exposure and compliance in community drinking water systems. Environ. Health Glob. Access Sci. Sour. 2012, 11, 84. [Google Scholar] [CrossRef]
  14. Balazs, C.; Morello-Frosch, R.; Hubbard, A.; Ray, I. Social disparities in nitrate-contaminated drinking water in California’s San Joaquin Valley. Environ. Health Perspect. 2011, 119, 1272–1278. [Google Scholar] [CrossRef]
  15. Nigra, A.E.; Navas-Acien, A. Arsenic in US correctional facility drinking water, 2006–2011. Environ. Res. 2020, 188, 109768. [Google Scholar] [CrossRef] [PubMed]
  16. Hoover, J.; Gonzales, M.; Shuey, C.; Barney, Y.; Lewis, J. Elevated Arsenic and Uranium Concentrations in Unregulated Water Sources on the Navajo Nation, USA. Expos. Health 2017, 9, 113–124. [Google Scholar] [CrossRef]
  17. Foster, S.A.; Pennino, M.J.; Compton, J.E.; Leibowitz, S.G.; Kile, M.L. Arsenic Drinking Water Violations Decreased across the United States Following Revision of the Maximum Contaminant Level. Environ. Sci. Technol. 2019, 53, 11478–11485. [Google Scholar] [CrossRef] [PubMed]
  18. Gerlak, A.K.; House-Peters, L.; Varady, R.G.; Albrecht, T.; Zúñiga-Terán, A.; De Grenade, R.R.; Cook, C.; Scott, C.A. Water security: A review of place-based research. Environ. Sci. Policy 2018, 82, 79–89. [Google Scholar] [CrossRef]
  19. Scott, C.A.; Meza, F.J.; Varady, R.G.; Tiessen, H.; McEvoy, J.; Garfin, G.M.; Wilder, M.; Farfán, L.M.; Pablos, N.P.; Montaña, E. Water Security and Adaptive Management in the Arid Americas. Ann. Assoc. Am. Geogr. 2013, 103, 280–289. [Google Scholar] [CrossRef]
  20. Aslam, R.A.; Shrestha, S.; Pandey, V.P. Groundwater vulnerability to climate change: A review of the assessment methodology. Sci. Total Environ. 2018, 612, 853–875. [Google Scholar] [CrossRef]
  21. WHO/UNICEF. Progress on Sanitation and Drinking Water: 2015 Update and MDG Assessment; World Health Organization: Geneva, Switzerland, 2015. [Google Scholar]
  22. Kumar, D.M.; Shah, T. Groundwater Pollution and Contamination in India: The Emerging Challenge; International Water Management Institute: New Delhi, India, 2006. [Google Scholar]
  23. UN-Water. Groundwater: Making the Invisible Visible; United Nations Educational, Scientific and Cultural Organization: Paris, France, 2022; p. 246. [Google Scholar]
  24. Mondal, M. Risk of groundwater depletion in Jaipur district, India: A prediction of groundwater for 2028 using artificial neural network. Rend. Lincei. Sci. Fis. E Nat. 2024, 35, 971–984. [Google Scholar] [CrossRef]
  25. Tadych, D.E.; Ford, M.; Colby, B.G.; Condon, L.E. Historical patterns of well drilling and groundwater depth in Arizona considering groundwater regulation and surface water access. JAWRA J. Am. Water Resour. Assoc. 2024, 60, 1193–1208. [Google Scholar] [CrossRef]
  26. Williams, S.A. Enhancing Assessment of Groundwater Vulnerability and Contamination Risk in Arid Lands. Ph.D. Thesis, The University of Arizona, Tucson, AZ, USA, 2024. [Google Scholar]
  27. Williams, S.A.; Megdal, S.B.; Zuniga-Teran, A.A.; Quanrud, D.M.; Christopherson, G. Mapping Groundwater Vulnerability in Arid Regions: A Comparative Risk Assessment Using Modified DRASTIC Models, Land Use, and Climate Change Factors. Land 2024, 14, 58. [Google Scholar] [CrossRef]
  28. Williams, S.A.; Megdal, S.B.; Zuniga-Teran, A.A.; Quanrud, D.M.; Christopherson, G. Equity Assessment of Groundwater Vulnerability and Risk in Drinking Water Supplies in Arid Regions. Water 2024, 16, 3520. [Google Scholar] [CrossRef]
  29. Tan, M.L.; Gassman, P.W.; Yang, X.; Haywood, J. A review of SWAT applications, performance and future needs for simulation of hydro-climatic extremes. Adv. Water Resour. 2020, 143, 103662. [Google Scholar] [CrossRef]
  30. Taghavi, N.; Niven, R.K.; Paull, D.J.; Kramer, M. Groundwater vulnerability assessment: A review including new statistical and hybrid methods. Sci. Total Environ. 2022, 822, 153486. [Google Scholar] [CrossRef]
  31. Mussa, K.R.; Mjemah, I.C.; Muzuka, A.N.N. A review on the state of knowledge, conceptual and theoretical contentions of major theories and principles governing groundwater flow modeling. Appl. Water Sci. 2020, 10, 146. [Google Scholar] [CrossRef]
  32. Machiwal, D.; Cloutier, V.; Güler, C.; Kazakis, N. A review of GIS-integrated statistical techniques for groundwater quality evaluation and protection. Environ. Earth Sci. 2018, 77, 681. [Google Scholar] [CrossRef]
  33. Kalhor, K.; Ghasemizadeh, R.; Rajic, L.; Alshawabkeh, A. Assessment of groundwater quality and remediation in karst aquifers: A review. Groundw. Sustain. Dev. 2019, 8, 104–121. [Google Scholar] [CrossRef]
  34. Chaudhry, A.K.; Kumar, K.; Alam, M.A. Groundwater flow and contaminant transport models–a short review. Desalin. Water Treat. 2021, 211, 80–91. [Google Scholar] [CrossRef]
  35. Megdal, S.B.; Gerlak, A.K.; Varady, R.G.; Huang, L.-Y. Groundwater Governance in the United States: Common Priorities and Challenges. Groundwater 2015, 53, 677–684. [Google Scholar] [CrossRef]
  36. Williams, S.A.; Eden, S.; Megdal, S.B.; Joe-Gaddy, V. Diversity, Equity, Inclusion, and Justice in Water Dialogues: A Review and Conceptualization. J. Contemp. Water Res. Educ. 2023, 177, 113–139. [Google Scholar] [CrossRef]
  37. Varady, R.G.; Zuniga-Teran, A.A.; Gerlak, A.K.; Megdal, S.B. Modes and approaches of groundwater governance: A survey of lessons learned from selected cases across the globe. Water 2016, 8, 417. [Google Scholar] [CrossRef]
  38. Zuniga-Teran, A.A.; Mussetta, P.C.; Lutz Ley, A.N.; Díaz-Caravantes, R.E.; Gerlak, A.K. Analyzing water policy impacts on vulnerability: Cases across the rural-urban continuum in the arid Americas. Environ. Dev. 2021, 38, 100552. [Google Scholar] [CrossRef]
  39. Weary, D.J.; Doctor, D.H. Karst in the United States: A Digital Map Compilation and Database. 2014–1156; U.S. Geological Survey: Reston, VA, USA, 2014; p. 23. [Google Scholar]
  40. Elshall, A.S.; Arik, A.D.; El-Kadi, A.I.; Pierce, S.; Ye, M.; Burnett, K.M.; Wada, C.A.; Bremer, L.L.; Chun, G. Groundwater sustainability: A review of the interactions between science and policy. Environ. Res. Lett. 2020, 15, 093004. [Google Scholar] [CrossRef]
  41. Megdal, S.B.; Dillon, P.; Seasholes, K. Water banks: Using managed aquifer recharge to meet water policy objectives. Water 2014, 6, 1500–1514. [Google Scholar] [CrossRef]
  42. Engel, K.H.; Loiseleur, E.; Drilhon, E. Arizona’s Groundwater Management Act at Forty: Tackling Unfinished Business. Arizona J. Environ. Law Policy 2020, 10, 187. [Google Scholar]
  43. Zheng, Y.; Flanagan, S.V. The case for universal screening of private well water quality in the US and testing requirements to achieve it: Evidence from arsenic. Environ. Health Perspect. 2017, 125, 085002. [Google Scholar] [CrossRef]
  44. Schaider, L.A.; Rudel, R.A.; Ackerman, J.M.; Dunagan, S.C.; Brody, J.G. Pharmaceuticals, perfluorosurfactants, and other organic wastewater compounds in public drinking water wells in a shallow sand and gravel aquifer. Sci. Total Environ. 2014, 468–469, 384–393. [Google Scholar] [CrossRef]
  45. Nigra, A.E.; Sanchez, T.R.; Nachman, K.E.; Harvey, D.E.; Chillrud, S.N.; Graziano, J.H.; Navas-Acien, A. The effect of the Environmental Protection Agency maximum contaminant level on arsenic exposure in the USA from 2003 to 2014: An analysis of the National Health and Nutrition Examination Survey (NHANES). Lancet Public Health 2017, 2, e513–e521. [Google Scholar] [CrossRef]
  46. Ravalli, F.; Yu, Y.; Bostick, B.C.; Chillrud, S.N.; Schilling, K.; Basu, A.; Navas-Acien, A.; Nigra, A.E. Sociodemographic inequalities in uranium and other metals in community water systems across the USA, 2006–2011: A cross-sectional study. Lancet Planet. Health 2022, 6, e320–e330. [Google Scholar] [CrossRef]
  47. Pennino, M.J.; Compton, J.E.; Leibowitz, S.G. Trends in Drinking Water Nitrate Violations Across the United States. Environ. Sci. Technol. 2017, 51, 13450–13460. [Google Scholar] [CrossRef] [PubMed]
  48. Nemčić-Jurec, J.; Ruk, D.; Oreščanin, V.; Kovač, I.; Ujević Bošnjak, M.; Kinsela, A.S. Groundwater contamination in public water supply wells: Risk assessment, evaluation of trends and impact of rainfall on groundwater quality. Appl. Water Sci. 2022, 12, 172. [Google Scholar] [CrossRef]
  49. Konisky, D.M.; Reenock, C.; Conley, S. Environmental injustice in Clean Water Act enforcement: Racial and income disparities in inspection time. Environ. Res. Lett. 2021, 16, 084020. [Google Scholar] [CrossRef]
  50. Fischer, C.; Aubron, C.; Trouvé, A.; Sekhar, M.; Ruiz, L. Groundwater irrigation reduces overall poverty but increases socioeconomic vulnerability in a semiarid region of southern India. Sci. Rep. 2022, 12, 8850. [Google Scholar] [CrossRef]
  51. Johnson, T.D.; Belitz, K.; Lombard, M.A. Estimating domestic well locations and populations served in the contiguous U.S. for years 2000 and 2010. Sci. Total Environ. 2019, 687, 1261–1273. [Google Scholar] [CrossRef]
  52. McGreal, B.; Eden, S. Arizona Groundwater Management: Past, Present and Future. 2021. Available online: https://wrrc.arizona.edu/publications/arroyo/arroyo-2021-arizona-groundwater-management-past-present-and-future (accessed on 12 March 2024).
  53. GWAICC. Issue Brief: Exempt Wells. 2020. Available online: https://www.azwater.gov//sites/default/files/2022-08/ISSUE%20BRIEF%20-%20Exempt%20Wells%20-%20Final.pdf (accessed on 30 June 2024).
  54. Ward, M.H.; Jones, R.R.; Brender, J.D.; De Kok, T.M.; Weyer, P.J.; Nolan, B.T.; Villanueva, C.M.; Van Breda, S.G. Drinking water nitrate and human health: An updated review. Int. J. Environ. Res. Public Health 2018, 15, 1557. [Google Scholar] [CrossRef]
  55. Bayabil, H.K.; Teshome, F.T.; Li, Y.C. Emerging Contaminants in Soil and Water. Front. Environ. Sci. 2022, 10, 873499. [Google Scholar] [CrossRef]
  56. Orellana-Macías, J.M.; Perles Roselló, M.J. Assessment of Risk and Social Impact on Groundwater Pollution by Nitrates. Implementation in the Gallocanta Groundwater Body (NE Spain). Water 2022, 14, 202. [Google Scholar] [CrossRef]
  57. Schneider, F.; Buser, T.; Graefe, O. Scales of justice in water governance: Hydropower controversies in Switzerland. Water Policy 2014, 16, 137–154. [Google Scholar] [CrossRef]
  58. Neal, M.J.; Lukasiewicz, A.; Syme, G.J. Why justice matters in water governance: Some ideas for a ‘water justice framework’. Water Policy 2014, 16, 1–18. [Google Scholar] [CrossRef]
  59. Mueller, J.T.; Gasteyer, S. The widespread and unjust drinking water and clean water crisis in the United States. Nat. Commun. 2021, 12, 3544. [Google Scholar] [CrossRef] [PubMed]
  60. McDonald, Y.J.; Grineski, S.E. Disparities in access to residential plumbing: A binational comparison of environmental injustice in El Paso and Ciudad Juárez. Popul. Environ. 2012, 34, 194–216. [Google Scholar] [CrossRef]
  61. Jaffee, D.; Case, R.A. Draining us dry: Scarcity discourses in contention over bottled water extraction. Local Environ. 2018, 23, 485–501. [Google Scholar] [CrossRef]
  62. Cory, D.C.; Rahman, T. Environmental justice and enforcement of the safe drinking water act: The Arizona arsenic experience. Ecol. Econ. 2009, 68, 1825–1837. [Google Scholar] [CrossRef]
  63. Balazs, C.L. Just Water? Social Disparities and Drinking Water Quality in California’s San Joaquin Valley. Ph.D. Thesis, University of California, Berkeley, CA, USA, 2011. [Google Scholar]
  64. Zwarteveen, M.Z.; Boelens, R. Defining, researching and struggling for water justice: Some conceptual building blocks for research and action. Water Int. 2014, 39, 143–158. [Google Scholar] [CrossRef]
  65. Ferris, K.; Porter, S. The Elusive Concept of an Assured Water Supply: The Role of the CAGRD and Replenishment; Kyl Center for Water Policy at Morrison Institute, Arizona State University: Tempe, AZ, USA, 2019. [Google Scholar]
  66. GWAICC. Issue Brief: AMA Management Structure. 2021. Available online: www.azwater.gov//sites/default/files/2022-08/Issue%20-%20Management%20Structure-01052021_Final.pdf (accessed on 20 March 2021).
  67. Al Atawneh, D.; Cartwright, N.; Bertone, E. Climate change and its impact on the projected values of groundwater recharge: A review. J. Hydrol. 2021, 601, 126602. [Google Scholar] [CrossRef]
  68. Wilder, M.; Liverman, D.; Bellante, L.; Osborne, T. Southwest climate gap: Poverty and environmental justice in the US Southwest. Local Environ. 2016, 21, 1332–1353. [Google Scholar] [CrossRef]
  69. Silber-Coats, N.; Eden, S. Arizona Water Banking, Recharge, and Recovery. 2017. Available online: https://wrrc.arizona.edu/publications/arroyo/arroyo-2017-arizona-water-banking-recharge-and-recovery (accessed on 2 March 2022).
  70. GWPC. Rural Groundwater Committee Principles, Objectives, and Proposals. 2023. Available online: https://www.azwater.gov/sites/default/files/2023-07/20230712_Rural_GW_Committee_Proposals_All.pdf (accessed on 2 March 2022).
  71. ADWR. Statewide Groundwater Level Changes in Arizona Water Years 1997 to 2017, 2007 to 2017 and 2016 to 2017; ADWR: Phoenix, AZ, USA, 2020. [Google Scholar]
  72. ADWR. Statewide Groundwater Level Changes in Arizona Water Years 2017 to 2018, 2008 to 2018, and 1998 to 2018; ADWR: Phoenix, AZ, USA, 2021. [Google Scholar]
  73. ADWR. Statewide Groundwater Level Changes in Arizona Water Years 2019 to 2020, 2010 to 2020, and 1990 to 2020; ADWR: Phoenix, AZ, USA, 2023. [Google Scholar]
  74. EPA, Six-Year Review 2 Contaminant Occurrence Data (1998–2005). Available online: https://www.epa.gov/dwsixyearreview/six-year-review-2-contaminant-occurrence-data-1998-2005 (accessed on 1 January 2024).
  75. EPA, Six-Year Review 3 Compliance Monitoring Data (2006–2011). Available online: https://www.epa.gov/dwsixyearreview/six-year-review-3-compliance-monitoring-data-2006-2011 (accessed on 1 January 2024).
  76. EPA. Six-Year Review 4 Compliance Monitoring Data for Arizona (2012–2019). Data Obtained via FOIA Request EPA-2023-002267. Available online: https://www.epa.gov/dwsixyearreview/six-year-review-4-compliance-monitoring-data-2012-2019 (accessed on 18 May 2023).
  77. ADWR. Annual Water Supply and Demand Dashboard. Available online: https://www.azwater.gov/ama/ama-data (accessed on 1 August 2024).
  78. ADWR. GIS Data and Maps Datasets. Available online: https://www.azwater.gov/gis-data-and-maps (accessed on 15 January 2024).
  79. U.S. Census Bureau. 2020 Decennial Census of Population and Housing. Available online: https://www.census.gov/programs-surveys/decennial-census/decade/2020.html (accessed on 15 January 2024).
  80. ADEQ. Water Quality Databases. Available online: https://waterdata.azdeq.gov/AZWQDB/Pages/Public/ (accessed on 15 February 2024).
  81. Smerdon, B.D. A synopsis of climate change effects on groundwater recharge. J. Hydrol. 2017, 555, 125–128. [Google Scholar] [CrossRef]
  82. Owuor, S.O.; Butterbach-Bahl, K.; Guzha, A.C.; Rufino, M.C.; Pelster, D.E.; Díaz-Pinés, E.; Breuer, L. Groundwater recharge rates and surface runoff response to land use and land cover changes in semi-arid environments. Ecol. Process. 2016, 5, 16. [Google Scholar] [CrossRef]
  83. Machiwal, D.; Jha, M.K.; Singh, V.P.; Mohan, C. Assessment and mapping of groundwater vulnerability to pollution: Current status and challenges. Earth Sci. Rev. 2018, 185, 901–927. [Google Scholar]
  84. Fakhreddine, S.; Prommer, H.; Scanlon, B.R.; Ying, S.C.; Nicot, J.-P. Mobilization of arsenic and other naturally occurring contaminants during managed aquifer recharge: A critical review. Environ. Sci. Technol. 2021, 55, 2208–2223. [Google Scholar]
  85. Becker, B.; Reichel, F.; Bachmann, D.; Schinke, R. High groundwater levels: Processes, consequences, and management. WIREs Water 2022, 9, e1605. [Google Scholar] [CrossRef]
  86. Banerjee, A.; Creedon, L.; Jones, N.; Gill, L.; Gharbia, S. Dynamic Groundwater Contamination Vulnerability Assessment Techniques: A Systematic Review. Hydrology 2023, 10, 182. [Google Scholar] [CrossRef]
  87. Statman-Weil, Z.; Nanus, L.; Wilkinson, N. Disparities in community water system compliance with the Safe Drinking Water Act. Appl. Geogr. 2020, 121, 102264. [Google Scholar] [CrossRef]
  88. Hoover, J.H.; Coker, E.; Barney, Y.; Shuey, C.; Lewis, J. Spatial clustering of metal and metalloid mixtures in unregulated water sources on the Navajo Nation—Arizona, New Mexico, and Utah, USA. Sci. Total Environ. 2018, 633, 1667–1678. [Google Scholar] [CrossRef]
  89. USEPA. Providing Safe Drinking Water in America: 2013 National Public Water Systems Compliance Report; US Environmental Protection Agency Office of Enforcement and Compliance Assurance: Washington, DC, USA, 2015. [Google Scholar]
  90. Baker, P.; Friel, S.; Kay, A.; Baum, F.; Strazdins, L.; Mackean, T. What Enables and Constrains the Inclusion of the Social Determinants of Health Inequities in Government Policy Agendas? A Narrative Review. Int. J. Health Policy Manag. 2017, 7, 101–111. [Google Scholar] [CrossRef]
  91. Hu, X.C.; Tokranov, A.K.; Liddie, J.; Zhang, X.; Grandjean, P.; Hart, J.E.; Laden, F.; Sun, Q.; Yeung, L.W.Y.; Sunderland, E.M. Tap Water Contributions to Plasma Concentrations of Poly- and Perfluoroalkyl Substances (PFAS) in a Nationwide Prospective Cohort of U.S. Women. Environ. Health Perspect. 2019, 127, 067006. [Google Scholar] [CrossRef]
  92. USEPA. EPA Annual Environmental Justice Progress Report FY 2020; Environmental Protection Agency: Washington, DC, USA, 2020; p. 52, EPA Publication Number: 230R20002. [Google Scholar]
  93. Wallace, K.J.; York, J.M. A systems change framework for evaluating academic equity and inclusion in an Ecology and Evolution Graduate Program. Ecol. Evol. 2020, 10, 10922–10929. [Google Scholar] [CrossRef]
  94. Wallace, M.; Sharfstein, J.M.; Kaminsky, J.; Lessler, J. Comparison of US county-level public health performance rankings with county cluster and national rankings: Assessment based on prevalence rates of smoking and obesity and motor vehicle crash death rates. JAMA Netw. Open 2019, 2, e186816. [Google Scholar]
Figure 1. Flowchart of trivalent framework applied in this study.
Water 17 01097 g001
Figure 2. Map of study area. The map shows binary delineations of aquifer type, regulatory jurisdiction (Tribal reservations versus the State), designated management areas, and supply type (CWS—community water system; DWA—domestic well area).
Water 17 01097 g002
Figure 3. Groundwater level change patterns. Mean annual groundwater level change over 20 years (left) and 10 years (right) in ft/year. Note: 1 ft/year = 0.3048 m/year.
Water 17 01097 g003
Figure 4. Spatial clusters of mean groundwater decline rates in Arizona (2001–2020). This figure shows spatial clusters of groundwater level changes over 10-year (2011–2020) and 20-year (2001–2020) periods in Arizona, based on Moran’s Index of spatial autocorrelation analysis. High-high (red) and low-low (blue) clusters indicate significant groundwater decline and recovery, respectively. Moran’s I is a unitless measure of spatial clustering relative to a random distribution. The shaded illustrations at the bottom use light and dark tones to show how similar values are distributed across space. Spatial pattern types: Dispersed (left) shows values spread apart, Random (middle) shows no pattern, and Clustered (right) shows similar values grouped together.
Water 17 01097 g004
Figure 5. Mean difference in arsenic and nitrate detection relative to groundwater level change. This figure illustrates the probability of arsenic (top) and nitrate (bottom) detection in different water supplies as a function of the mean annual rate of groundwater level change (ft/year) over 20 years (Mean_20). Each colored point represents a different rate, with the bar showing the range of probability for each rate. The x-axis denotes the supply type, while the y-axis shows the probability of detection. Note: 1 ft/year = 0.3048 m/year.
Water 17 01097 g005
Figure 6. Comparison of mean rates of change in groundwater levels and MCL exceedances. This graph shows that the probability of MCL exceedance for arsenic (left) and nitrate (right) increases with the mean annual rate of groundwater level change over 10 years (Mean_10) (ft/year). The shaded ribbons/error bars represent the 95% confidence intervals of predictions. Note: 1 ft/year = 0.3048 m/year.
Water 17 01097 g006
Figure 7. Mean annual rates of groundwater level change (ft/yr) and arsenic MCL exceedances. This figure shows the mean annual groundwater level change (ft/yr) over 20 years (bottom) and 10 years (top), along with arsenic MCL exceedance probabilities in community water systems (CWS) and domestic well areas (DWAs). For reference, 1 ft/yr = 0.3048 m/yr. Mean_20 and Mean_10 represent groundwater level change over 20-year and 10-year periods, respectively.
Water 17 01097 g007
Table 1. Summary of data sources.
CategoryDescriptionData Sources
AvailabilityChanges in groundwater levels in subbasins are used as indicators of water access variability over time.Arizona Department of Water Resources (ADWR) [71,72,73]
AccessWater supply type, service area boundaries, locations of public and private wells, and regulatory compliance data.ADWR, Environmental Protection Agency (EPA) including a Freedom of Information Act request [74,75,76,77,78], Navajo Nation data via direct request
Population demographic and socioeconomic data to evaluate the communities that rely on different water supply systems.U.S. Census Bureau [79]
Policy Attributes: aquifer types, policy designations, and SDWA jurisdictions. ADWR, U.S. Geological Survey (USGS), EPA
QualityNitrate (NO3) and arsenic (As) concentrations in groundwater; derived detection and exceedance variables.Arizona Department of Environmental Quality (ADEQ), EPA, USGS [74,75,76,80]
Auxiliary DataInfrastructure-related data, including building footprints, residential parcels, and pipeline networks.County governments, online platforms, and direct records requests.
Table 2. Regression results for groundwater decline models with binary water quality predictors.
Model: 20-Year GWL Model: 10-Year GWL
Variablesest.Std ErrorStatisticp ValueLog Oddsest.Std ErrorStatisticp ValueLog Odds
Nitrate (binary)
Detect−0.0750.006−11.67<0.0010.93−0.1140.007−15.458<0.0010.89
MCL Exceeded−0.0890.009−9.919<0.0010.91−0.1020.010−9.817<0.0010.90
Water Policy
GMA Designation (NDA) 0.3000.00743.109<0.0011.350.1780.00822.100<0.0011.20
SDWA Primacy (Tribal)−0.1730.017−10.289<0.0010.84−0.1120.02−5.725<0.0010.89
Aquifer Type (Karst) 0.1210.00620.829<0.0011.13−0.0030.007−0.5070.6121.00
Supply Type (DWA) 0.0330.0065.758<0.0011.030.0140.0072.1800.0291.01
Arsenic (binary)
Detect−0.0860.006−13.954<0.0010.92−0.0590.007−8.832<0.0010.94
MCL Exceeded−0.0280.006−4.931<0.0010.97−0.0230.006−3.766<0.0010.98
Water Policy
GMA Designation (NDA) 0.4310.00851.122<0.0011.540.4180.00945.877<0.0011.52
SDWA Primacy (Tribal)−0.4840.008−57.086<0.0010.62−0.3670.009−40.059<0.0010.69
Aquifer Type (Karst) 0.1630.00722.692<0.0011.180.1480.00819.075<0.0011.16
Supply Type (DWA) 0.0140.0071.8950.0581.01−0.0240.008−2.9960.0030.98
Response Variable: mean annual rate of water level decline over 20 yrs and 10 yrs − binary variable, 1 = decline.
Table 3. The regression results for groundwater decline models with continuous water quality predictors.
Model: 20-Year GWL Model: 10-Year GWL
Variablesest.Std ErrorStatisticp ValueLog Oddsest.Std ErrorStatisticp ValueLog Odds
Water Quality
Nitrate (NO3)0.2280.01218.792<0.0011.260.1050.00715.499<0.0011.11
Water Policy
GMA Designation (NDA) −5.9890.286−20.96<0.0010.00−1.7700.160−11.035<0.0010.17
SDWA Primacy (Tribal)6.6210.6849.684<0.001751.016.0120.38415.664<0.001408.10
Aquifer Type (Karst) −7.1710.236−30.407<0.0010.000.2430.1321.8390.0661.28
Supply Type (DWA) −3.1510.229−13.774<0.0010.04−0.8850.128−6.889<0.0010.41
Water Quality
Arsenic (As)91.6376.12914.951<0.0016.27E+3938.4943.9429.764<0.0015.22E+16
Water Policy
GMA Designation (NDA) −10.460.330−31.702<0.0010.00−4.1690.212−19.642<0.0010.02
SDWA Primacy (Tribal)8.1030.33024.536<0.0013305.440.1390.2120.6530.5141.15
Aquifer Type (Karst) −1.4650.281−5.215<0.0010.232.3900.18113.223<0.00110.91
Supply Type (DWA) −5.4350.286−18.985<0.0010.00−4.9510.184−26.889<0.0010.01
Response Variable: mean annual rate of water level decline over 20 years − continuous variable.
Disclaimer/Publisher’s Note: The statements, opinions and data contained in all publications are solely those of the individual author(s) and contributor(s) and not of MDPI and/or the editor(s). MDPI and/or the editor(s) disclaim responsibility for any injury to people or property resulting from any ideas, methods, instructions or products referred to in the content.

