Article

Hydrological Conditions and Dominant Phytoplankton Species in the Middle and Upper Reaches of the Yarlung Zangbo River, Tibetan Plateau

1
Heilongjiang River Fisheries Research Institute of Chinese Academy of Fishery Sciences, Heilongjiang River Basin Fisheries Resources and Environment Scientific Observation and Experiment Station of the Ministry of Agriculture and Rural Affairs, Harbin 150070, China
2
College of Fisheries and Life Science, Dalian Ocean University, Dalian 116023, China
3
College of Fisheries and Life Sciences, Shanghai Ocean University, Shanghai 201306, China
*
Author to whom correspondence should be addressed.
These authors contributed equally to this work.
Water 2025, 17(9), 1346; https://doi.org/10.3390/w17091346
Submission received: 5 March 2025 / Revised: 24 April 2025 / Accepted: 27 April 2025 / Published: 30 April 2025
(This article belongs to the Section Biodiversity and Functionality of Aquatic Ecosystems)

Abstract

:
To investigate the structure of phytoplankton communities and the ecological niches of dominant species in the middle and upper reaches of the Yarlung Zangbo River, we collected samples at 14 sites in April (spring) and September (autumn) 2023. A total of 198 phytoplankton species were identified belonging to 6 classes, 13 orders, 24 families, and 53 genera. The community structure was dominated by diatoms, green algae, and cyanobacteria. In April, 163 species of phytoplankton from four phyla were identified, with abundance ranging from 2.94 × 10⁵ to 2.32 × 10⁶ cells/m3 and an average of 1.28 × 10⁶ cells/m3. In September, the abundance of phytoplankton ranged from 1.52 × 10⁵ to 1.58 × 10⁶ cells/m3, with an average value of 6.76 × 10⁵ cells/m3. Sixteen species were classified as dominant (Y > 0.02), among which four showed dominance in both sampling periods, with their dominance level and niche width differing with the season. Water temperature increased with decreasing altitude. At <3500 m in September, Ankistrodesmus falcatus and Oocystis borgei became dominant. Cymbella cistula, Amphora ovalis, and Navicula cryptocephala occupy broad ecological niches and can represent indicator species for water quality. Water temperature, pH, and salinity were identified as primary factors influencing the ecological niche differentiation of dominant phytoplankton species. The interspecific niche overlap was higher in September than in April and greater at >4500 m compared to other elevation ranges (>4500 m; 4000–4500 m; 3500–<4000 m; <3500 m). The effect of elevation on the community structure was greater than that of season. This is the first study to characterize the association of ecological niches of phytoplankton in the upper reaches of the Yarlung Zangbo River with physicochemical environmental parameters. This provides baseline information for the conservation of biodiversity and management of aquatic ecosystems in the rivers of the Tibetan Plateau.

1. Introduction

The complex geographical environment of the Tibetan Plateau exerts profound influences on the global climate [1]. The Yarlung Zangbo River flows through the Southern Tibetan Plateau, its region of highest biodiversity. The area has a fragile ecosystem, and the phytoplankton community will reflect environmental factors, providing valuable information for monitoring climate change [2,3].
Phytoplankton, composed of diatoms, green algae, euglenoids, and other eukaryotic microorganisms, is a vital component of river and lake ecosystems [4,5]. As primary producers, phytoplankton convert solar energy into chemical energy through photosynthesis, providing food for aquatic organisms [6]. Their biological characteristics are crucial to maintaining water quality and the balance of the aquatic ecosystem. The species community composition responds rapidly to hydrological changes, making it an important indicator of environmental quality [7,8]. Factors such as water temperature, dissolved oxygen, and pH in riverine environments can influence the phytoplankton community structure. Cooler temperatures in higher-altitude sections promote the growth of cold-adapted diatoms, and altitudinal gradients also drive the spatial distribution of communities through differences in temperature and dissolved oxygen [9]. Dominant species within phytoplankton communities influence the survival and reproduction of other organisms through competition, predation, and symbiotic relationships, influencing biodiversity [10,11].
Ecological niche refers to the way in which a species utilizes resources within its habitat and interacts with other organisms, and it is crucial to understanding interspecific relationships, community structure, species diversity, and succession processes. The concept was introduced by Grinnell in 1917 and has been subsequently expanded and developed [12]. The niche width reflects the range of resources a species can utilize and its adaptability to environmental conditions. A broad niche indicates that the species can survive in a variety of environments. Niche overlap defines the similarity in resource use among species, reflecting potential competitive relationships [13,14]. Identifying niche width and overlap helps elucidate the processes by which species coexist within ecosystems. The ability of broad- and narrow-niche species to adapt to changing conditions will differ, while the degree of niche overlap quantifies competitive interactions among species [15]. A deeper understanding of the dynamics of these factors can aid in predicting species’ response to environmental change and in developing conservation measures [16].
The Yarlung Zangbo River, originating from the Jima Yangzong Glacier on the northern slopes of the Himalayas, drains a watershed flowing through the Gangdise and Nyainqentanglha Mountains and the Himalayan Range with a length of approximately 2057 km within China [17]. From the source to Zhongba County for the upper reaches, 268 km long, 4600 to 4800 m above sea level, the river valley is mostly a wide valley basin; for Zhongba County to Pai Town, Mailing County, for the middle reaches, 1293 km long, more than 2900 m above sea level, the river valley is wide and narrow, with predominantly wide valleys [18]. The terrain of the basin is high in the west and low in the east, with a narrow east–west shape, a maximum length of about 1450 km from east to west and a width of about 290 km from north to south, and an average elevation of more than 4000 m above sea level [19].The climate of the upper reaches is cold, with an annual mean temperature of 0–3 °C, with an annual precipitation < 300 mm, and replenishment primarily relying on snow and glacial meltwater [20]. The middle reaches have a temperate plateau climate with more abundant water resources, an annual precipitation of 300–600 mm, and a pronounced rainy season [21]. The Yarlung Zangbo River Basin, with its unique natural environment and special ecosystems, has nurtured a wealth of rare wildlife and plants, and it is an area of high biodiversity and a focus of global biodiversity conservation research [22].
Studies of phytoplankton in the Yarlung Zangbo River have primarily focused on the middle reach and its associated tributaries [2,23,24,25,26], with no available reports of phytoplankton in the upper reaches. Our study analyzes the dominant phytoplankton species in the middle and upper reaches of the Yarlung Zangbo River, assessing their niche width and relative resource occupancy, as well as variations with location and season. The findings will provide a basis for biodiversity conservation and aquatic ecosystem management on the Tibetan Plateau.

2. Materials and Methods

2.1. Study Area and Sampling Points

We established 14 sampling points (S1–S14) along the middle and upper reaches of the river: S1 to S8 were located at an elevation above 4500 m, S9 and S10 at 4000–4500 m, S11 and S12 at 3500–<4000 m, and S13 and S14 below 3500 m (Figure 1). Given that the upstream is less well studied, more sampling points were set up for detailed analyses; whereas the midstream already has a certain research base, so only fewer sampling points were set up for comparison. Phytoplankton samples were collected once in April 2023 and again September 2023, with a simultaneous assay of the water’s physicochemical parameters.

2.2. Sample Collection

According to standard methods for studying freshwater plankton [27], samples were collected using a No. 25 plankton net for qualitative (“qualitative” refers to determining the presence or absence of a species or taxon, rather than focusing on its number or abundance.) sampling by submerging the net opening into the water surface and slowly dragging it in a “∞” pattern for approximately three minutes.
For quantitative sampling, a water collector was used at each sampling point to collect 20 L of river water into a container bucket. Water collectors and containers were rinsed three times with river water before collection to avoid contamination. The container bucket was gently stirred for at least 1 min to mix the collected water well to ensure an even distribution of phytoplankton, and 1 L of the water sample was extracted using a 1 L volumetric flask. The sample was immediately fixed in 15 mL of Luger’s solution and transported to the laboratory. After settling for 48 h, the supernatant was siphoned off and the final sample concentrated to 50 mL. Species were identified by standard methods using an Olympus CX33 biological microscope (Olympus Corporation, Tokyo, Japan) at 10 × 40 magnification. A 0.1 mL sample was transferred to a counting chamber, and the organisms were counted three times. Water temperature, pH, dissolved oxygen, conductivity, and total dissolved solids were measured using the YSI Pro Quatro 1020 multi-parameter (YSI Incorporated, Yellow Springs, OH, USA) water quality meter. Multiple samples were taken for each measurement.

2.3. Data Processing and Analysis

2.3.1. Biodiversity Indices

In this study, the Shannon–Wiener diversity index (H′) [28], Pielou evenness index (J) [29] and Margalef richness index (D) [30,31,32] were employed to analyze the phytoplankton community diversity in the upper reaches of the Yarlung Zangbo River. The formulae used are
H = n i S P i log 2 P i  
J = H log 2 S
D = S 1 ln N
In the formulae, H′ represents the diversity index, used to measure the degree of species diversity. S denotes the total number of species at a given sampling site, ni represents the number of individuals of the ith phytoplankton species, and Pi is the proportion of the ith phytoplankton species within the community. J indicates the evenness index, reflecting the uniformity of species distribution. D represents the richness index, used to assess the abundance of species, where N denotes the total number of individuals of phytoplankton across all stations.

2.3.2. Dominant Species

Dominant species were identified using the McNaughton Dominance Index (Y) [33] according to the following formula:
Y = F i × n i / N
in which ni represents the number of individuals of the phytoplankton species i, and N is the total number of individuals of all phytoplankton species. Fi denotes the frequency of occurrence of a given phytoplankton species i across all sampling points at a given time. Species with a Y value greater than 0.02 were considered dominant species, and those with a Y value greater than 0.1 were classified as absolute dominant species.

2.3.3. Niche Width

Niche width (Bi) was calculated using the weighted modified Levins index by Colwell et al. [14].
B i = 1 r j = 1 r P i j 2
in which Bi represents the niche width of species i, Pij is the proportion of individuals of species i in sampling site j relative to the total number of individuals of that species, pi = Nij/Ni, i denotes the species, j represents the sampled site, Nij is the number of individuals of species i utilizing sample site j, Ni is the total number of individuals of species i, and r is the total number of sampled sites.

2.3.4. Niche Overlap and Relative Resource Occupancy

The niche overlap index (Oik) was calculated using Pianka’s index [34].
O i k = j = 1 N ( P i j × P k j ) / j = 1 N P i j 2 × j = 1 N P k j 2
O i k = k = 1 O i k i = 1 O i k
In the formula, Oik represents the overlap value, and Pij and Pkj denote the proportion of individuals of species i and species k, where k and i differ at site j relative to the total number of individuals of each species present. The range of Oik is 0–1, indicating the overlap of the resource utilization curves of species i and k. If i = k and ΔOik > 0, it indicates that the species is developing its occupation of the resource, indicating that it is in an expanding stage; ΔOik < 0 indicates decreasing resource use, suggesting that the species may be in recession. When ΔOik = 0, occupation of the resource by a plankton species is unchanged, indicating that it is stable. Observing the value of ΔOik, reveals the dynamic trends of a given plankton species in its ecosystem.

2.3.5. Data Processing

Data collation and preliminary processing were carried out through Microsoft Excel 2019 to ensure the accuracy and completeness of the dataset. A One-Way Analysis of Variance (ANOVA) was performed using IBM SPSS Statistics 2020 software to assess whether there was a significant difference in the means between the different groups. A non-metric multidimensional scaling analysis (NMDS), similarity percentage analysis (SIMPER), and permutational multivariate analysis of variance (PERMANOVA) were completed using the R language (4.2.3) vegan ggplot2 package. The map of the study area was created using ArcGIS 10.2 software, and a redundancy analysis (RDA) was performed using CANOCO 5 software. In the study of the relationship between dominant phytoplankton species and physical and chemical factors in the water column using CANOCO 5 software, the linear model was shown to be effective in describing the relationship between species distributions and environmental variables when the maximum gradient length (MGL) derived from the analysis was less than 3. Therefore, RDA was chosen as the modeling method. An RDA ordination plot can intuitively show the association between species composition and environmental factors, and it provides a clear visual representation for understanding the interactions between the two [35].

3. Results

3.1. Dominant Species

A total of 198 species of phytoplankton were identified in the middle and upper reaches of the Yarlung Zangbo River: 6 classes, 13 orders, 24 families, and 53 genera. Bacillariophyta comprised 33 genera with 173 species, accounting for 87.37% of the total; Chlorophyta included 8 genera with 11 species, making up 5.56%; and cyanobacteria consisted of 9 genera with 10 species, representing 5.05%. The classes Cryptophyta and Euglenophyta had fewer species, contributing 0.51% and 1.52%, respectively. The phytoplankton community in both sampling periods exhibited a diatom–green algae–cyanobacteria characteristic (Table 1).
In April, 163 species of phytoplankton of four phyla were identified, with an abundance ranging from 2.94 × 10⁵ to 2.32 × 10⁶ cells/m3 and an average of 1.28 × 10⁶ cells/m3. The highest abundance was observed at site S13 and the lowest at site S9. In September, the phytoplankton abundance ranged from 1.52 × 10⁵ to 1.58 × 10⁶ cells/m3, with an average value of 6.76 × 10⁵ cells/m3. The highest abundance was recorded at site S6 and lowest at S12. In April, the ranges of the Shannon–Wiener diversity index (H’), Pielou evenness index (J), and Margalef richness index (D) were 4.5–5.47, 0.77–0.97, and 7.13–15.22, respectively, with mean values of 5.11, 0.89, and 11.13, respectively. In September, the ranges for these indices were 3.76–4.98, 0.85–1.00, and 4.66–10.13, respectively, with mean values of 4.45, 0.93, and 7.14, respectively.
Sixteen dominant species of two phyla were identified, with Bacillariophyta being the primary dominant algae in both April and September. In April, Chlorella vulgaris was the primary dominant genus (Y = 0.059), while, in September, Cymbella tumida showed the greatest dominance (Y = 0.065). April and September each had 10 dominant species, with Ulnaria acus, C. tumida, Cymbella cistula, and Caloneis silicula being common to both sampling times (Table 2). These dominant species were present in both April and September, but Chlorella remained the dominant genus in spring. Forty-five dominant species were identified across the four elevation zones, with the number decreasing as the elevation increased. Above 4500 m, 18 dominant species were identified, including U. acus, C. cistula, C. silicula, Amphora ovalis, and Diploneis oblongella common to both sampling times. At 4000–4500 m, 24 dominant species were identified, with U. acus having the highest occurrence (Y = 0.25) and identified as the absolute dominant species (Y > 0.1) at all four elevation zones. At 3500–<4000 m, 23 dominant species were identified, with Diatoma tenue and C. cistula common to both sampling times. At elevation <3500 m, 24 dominant species were identified, with Epithema adnata an absolute dominant species (Y > 0.1) (Figure 2).

3.2. Niche Width

3.2.1. Seasonal Variation in Niche Width

The niche widths of the 16 dominant species in the middle and upper reaches of the Yarlung Zangbo River ranged from 1.0 to 8.346, with C. cistula having the broadest niche (Bi = 8.346) and U. acus the narrowest (Bi = 1) among species common to both April and September (Table 3). The niche width of the dominant species can be categorized as broad-niche (Bi > 5), which included C. cistula in April and Navicula cryptocephala and A. ovalis in September; medium-niche (Bi ≥ 3 to ≤ 5), which only occurred in April with Tabellaria flocculosa, Cymbella affinis, and C. silicula; and narrow-niche (Bi < 3), comprising Ulnaria acus, Fragilaria capucina, C. tumida, Cymbopleura austriaca, Chlorella vulgaris, and Phacotus lenticularis in April and U. acus, C. tumida, Cymbella cistula, Diploneis oblongella, C. silicula, Navicula radiosa, Nitzschia linearis, and E. adnata in September, with a greater number of narrow-niche species present in September than in April. The number of broad-niche dominant species was higher in September than in April, with no medium-niche dominant species identified in September.

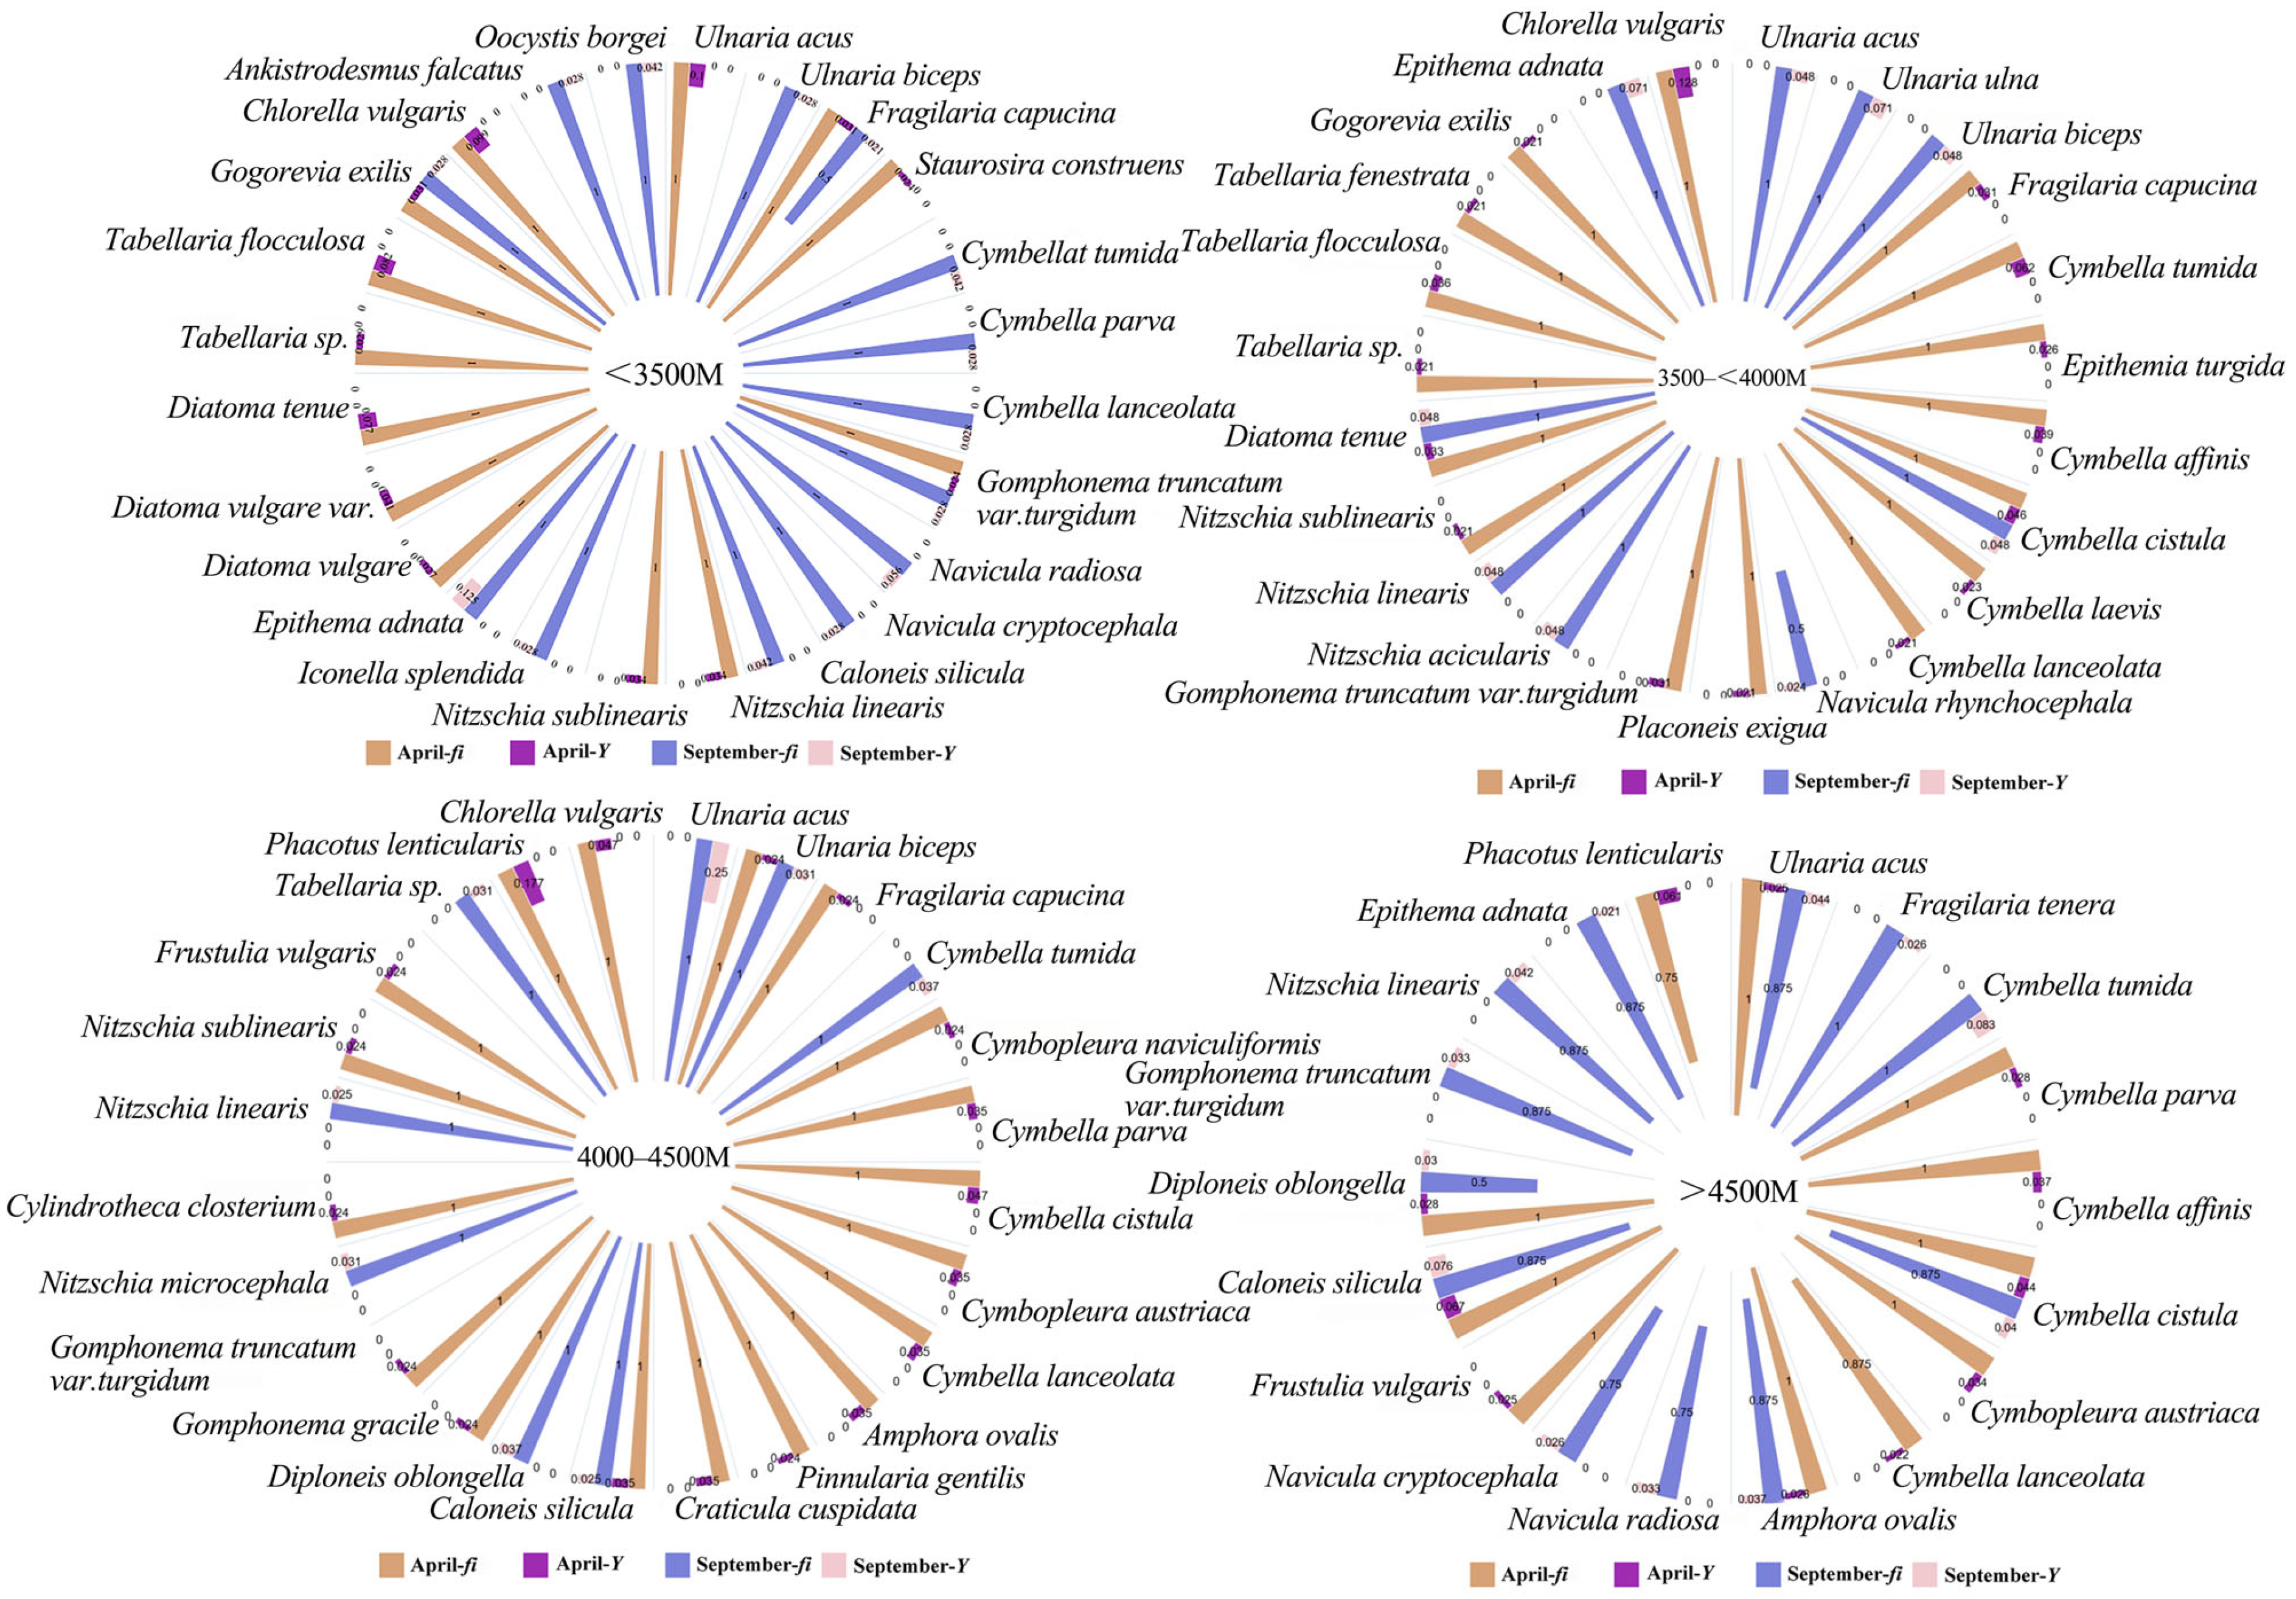
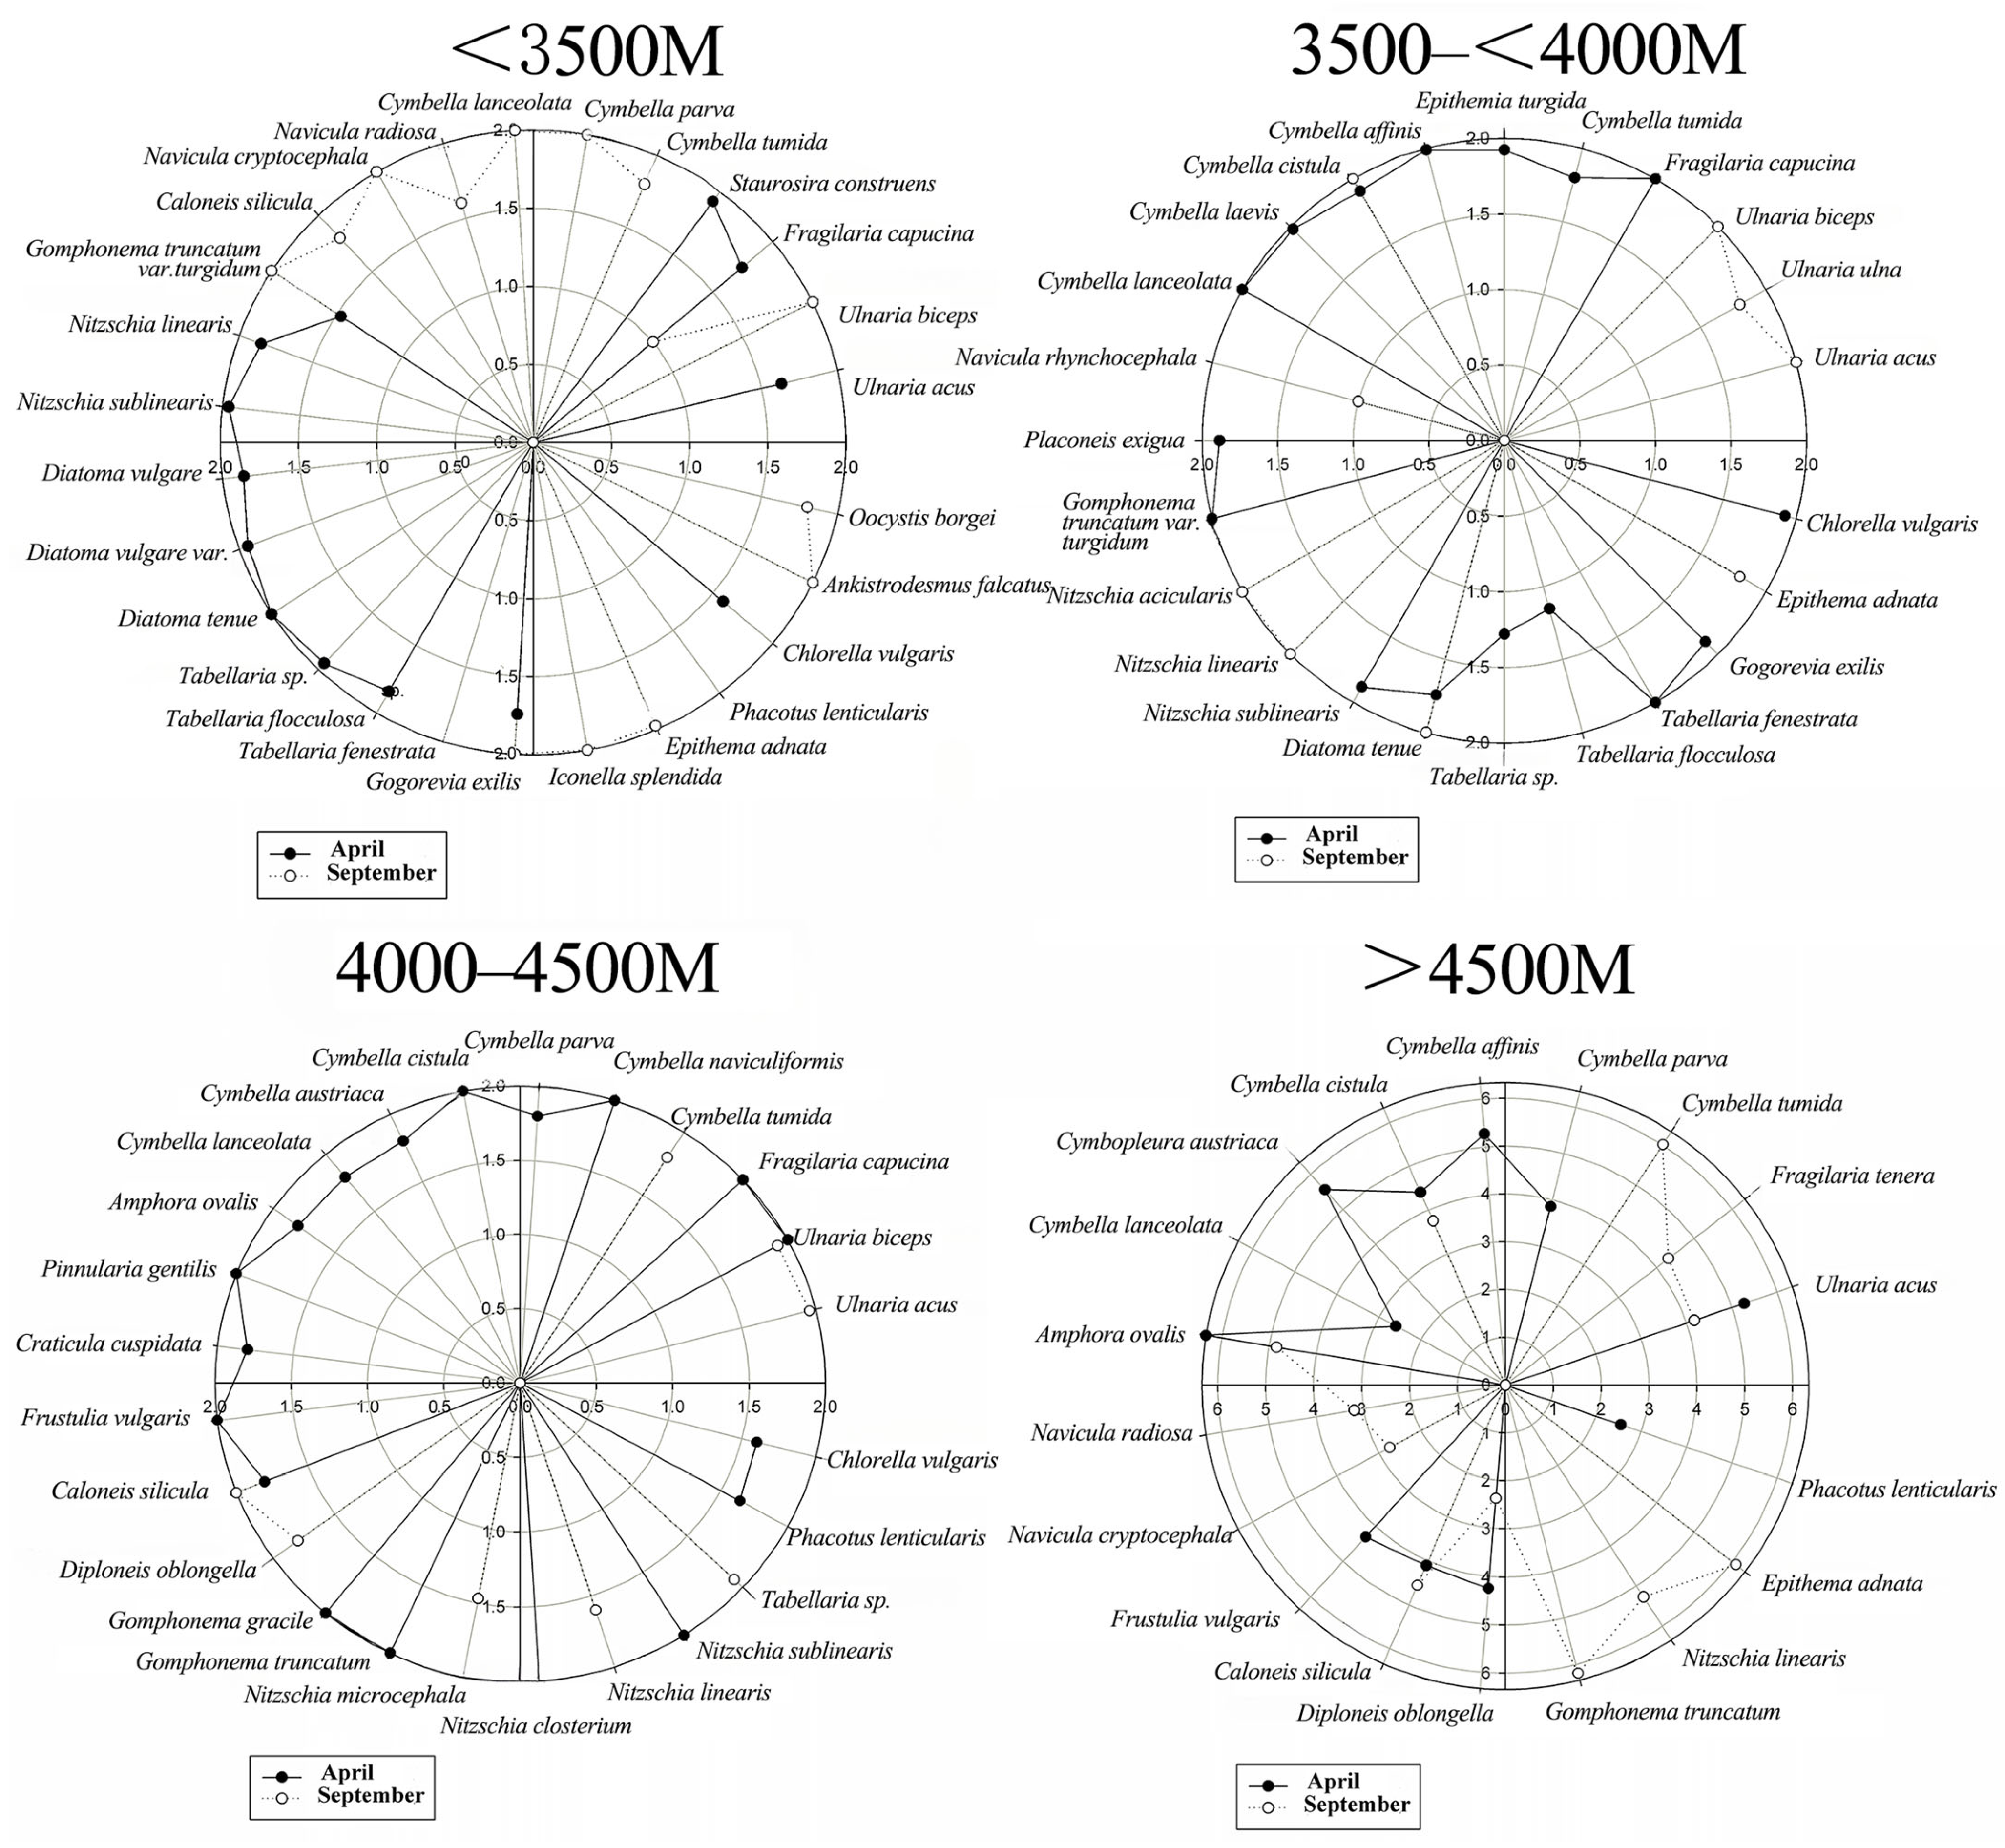
3.2.2. Niche Width Relative to Elevation

The niche width of dominant phytoplankton species varied with elevation in the middle and upper reaches of the Yarlung Zangbo River (Figure 3). At >4500 m, A. ovalis in April showed the greatest width and D. oblongella in September the narrowest. At 4000–4500 m, Ulnaria biceps occupied the greatest width in both April and September. At 3500–<4000 m, the niche widths were 1.0–2.0, with the largest and smallest values at both sampling times observed in diatoms, including Navicula rhynchocephala in September and Cymbella lanceolata in April. These are narrow ecological niches. At elevations below 3500 m, the niche widths were also 1.0–2.0, with Ankistrodesmus falcatus being the only green alga among the dominant species with a broad niche width in September. At >4500 m, all broad- and medium-niche dominant species were diatoms, while the narrow-niche dominant species were diatoms, with the exception of P. lenticularis, the only green alga occupying a narrow niche in April. At elevations of 4500 m and below, all dominant species showed a narrow niche width at both sampling times.

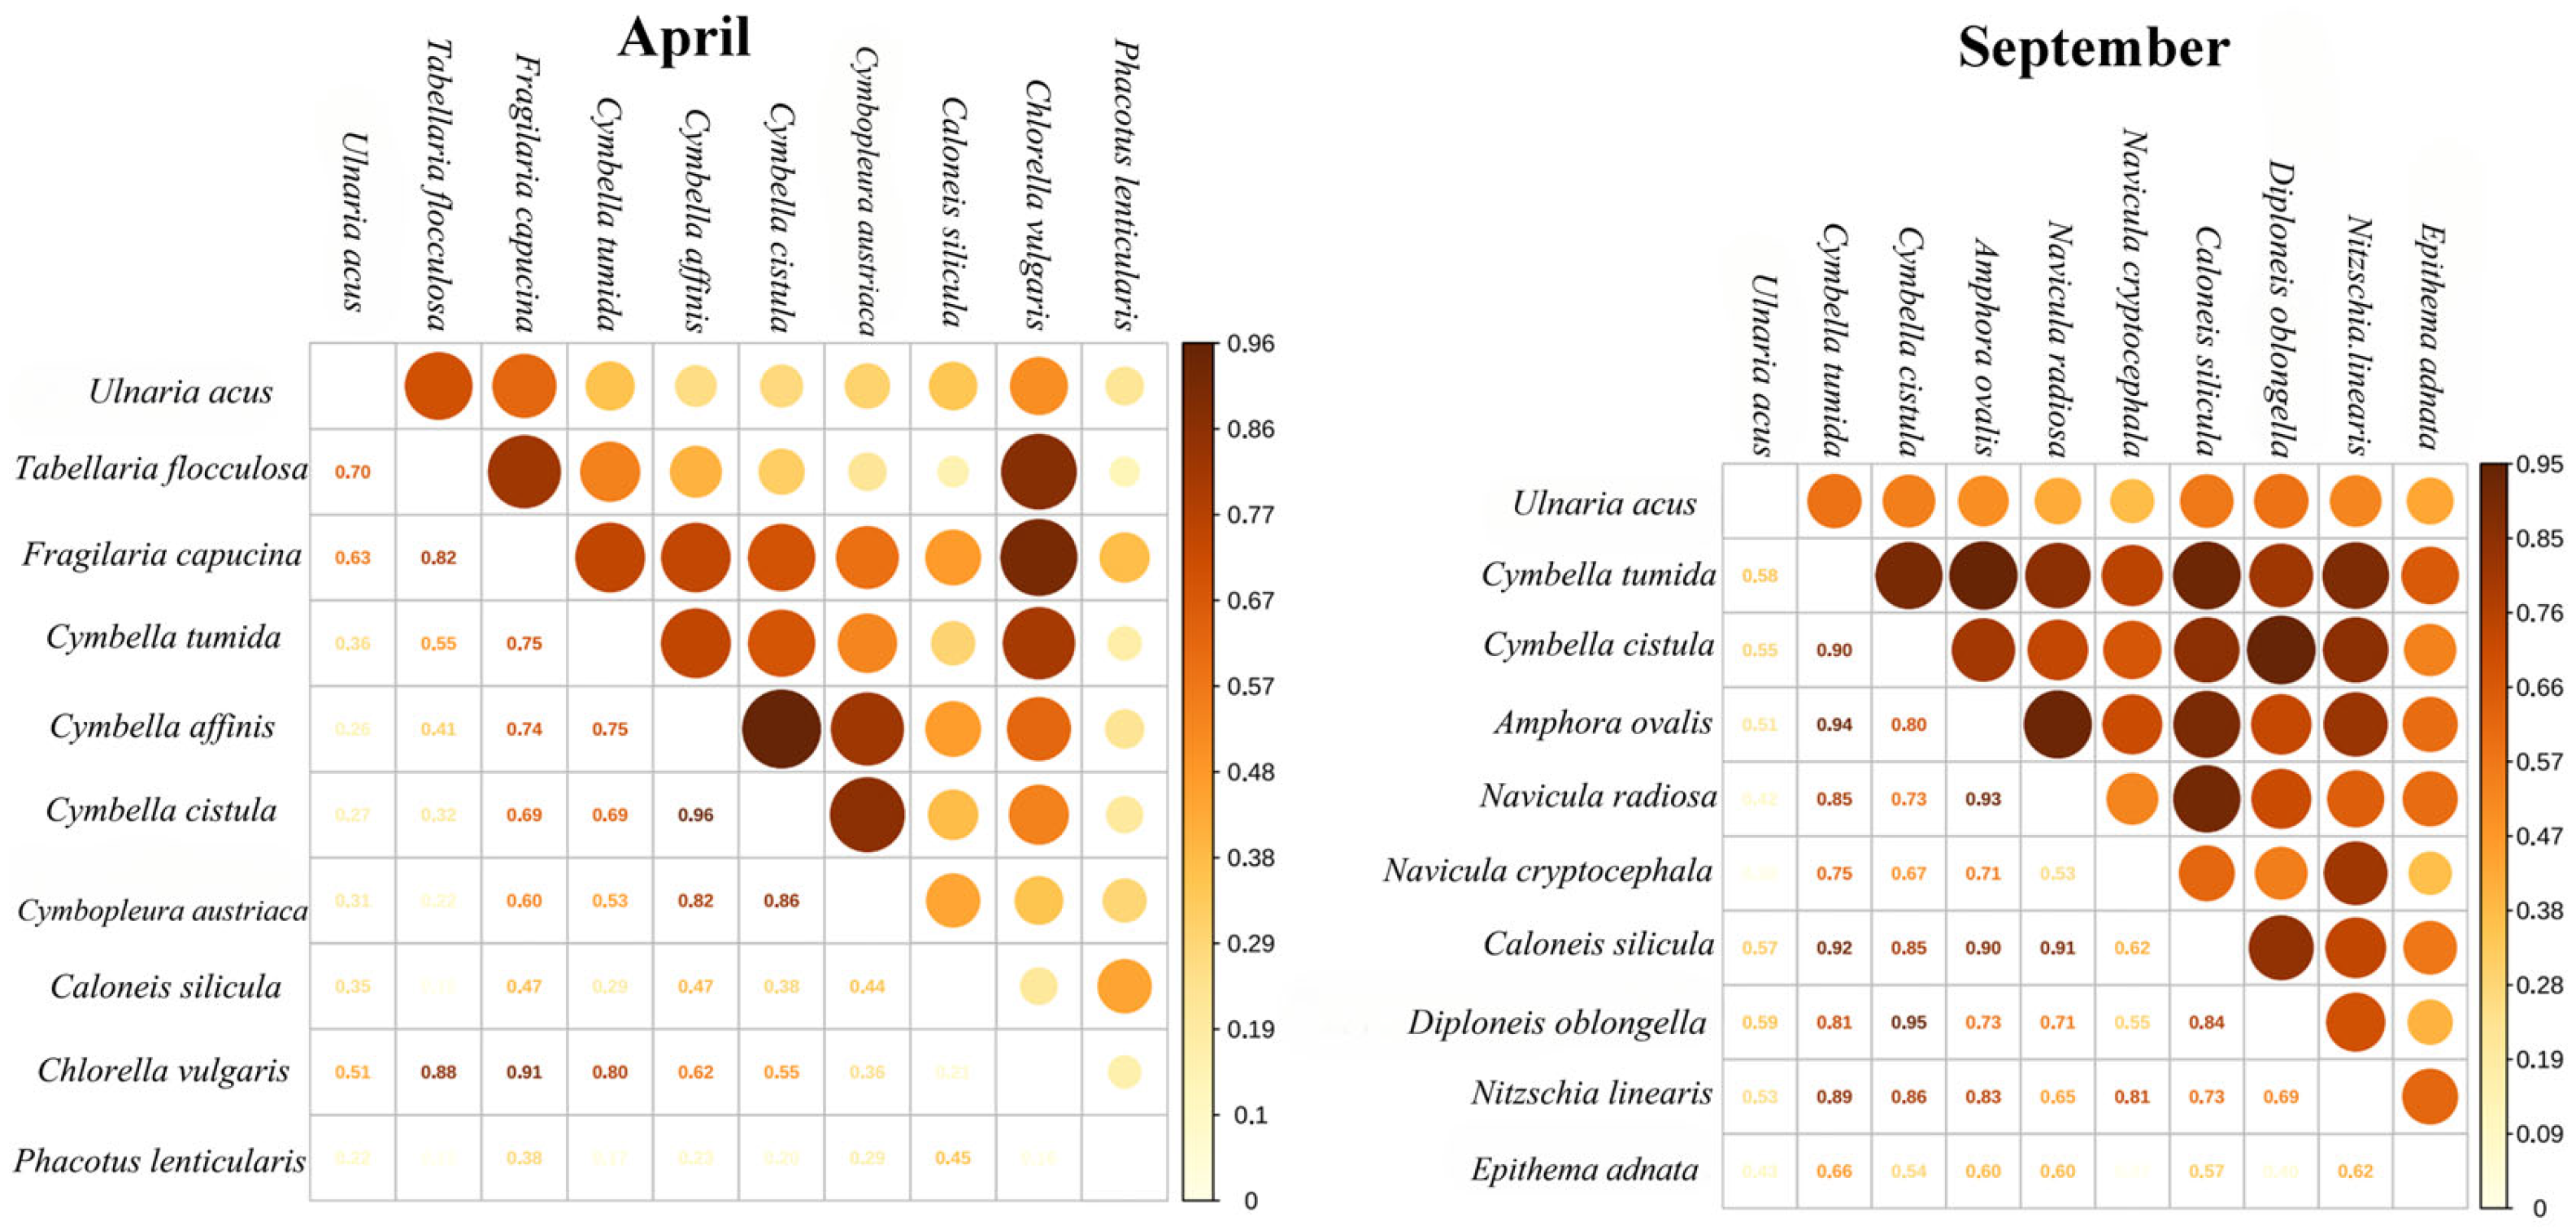
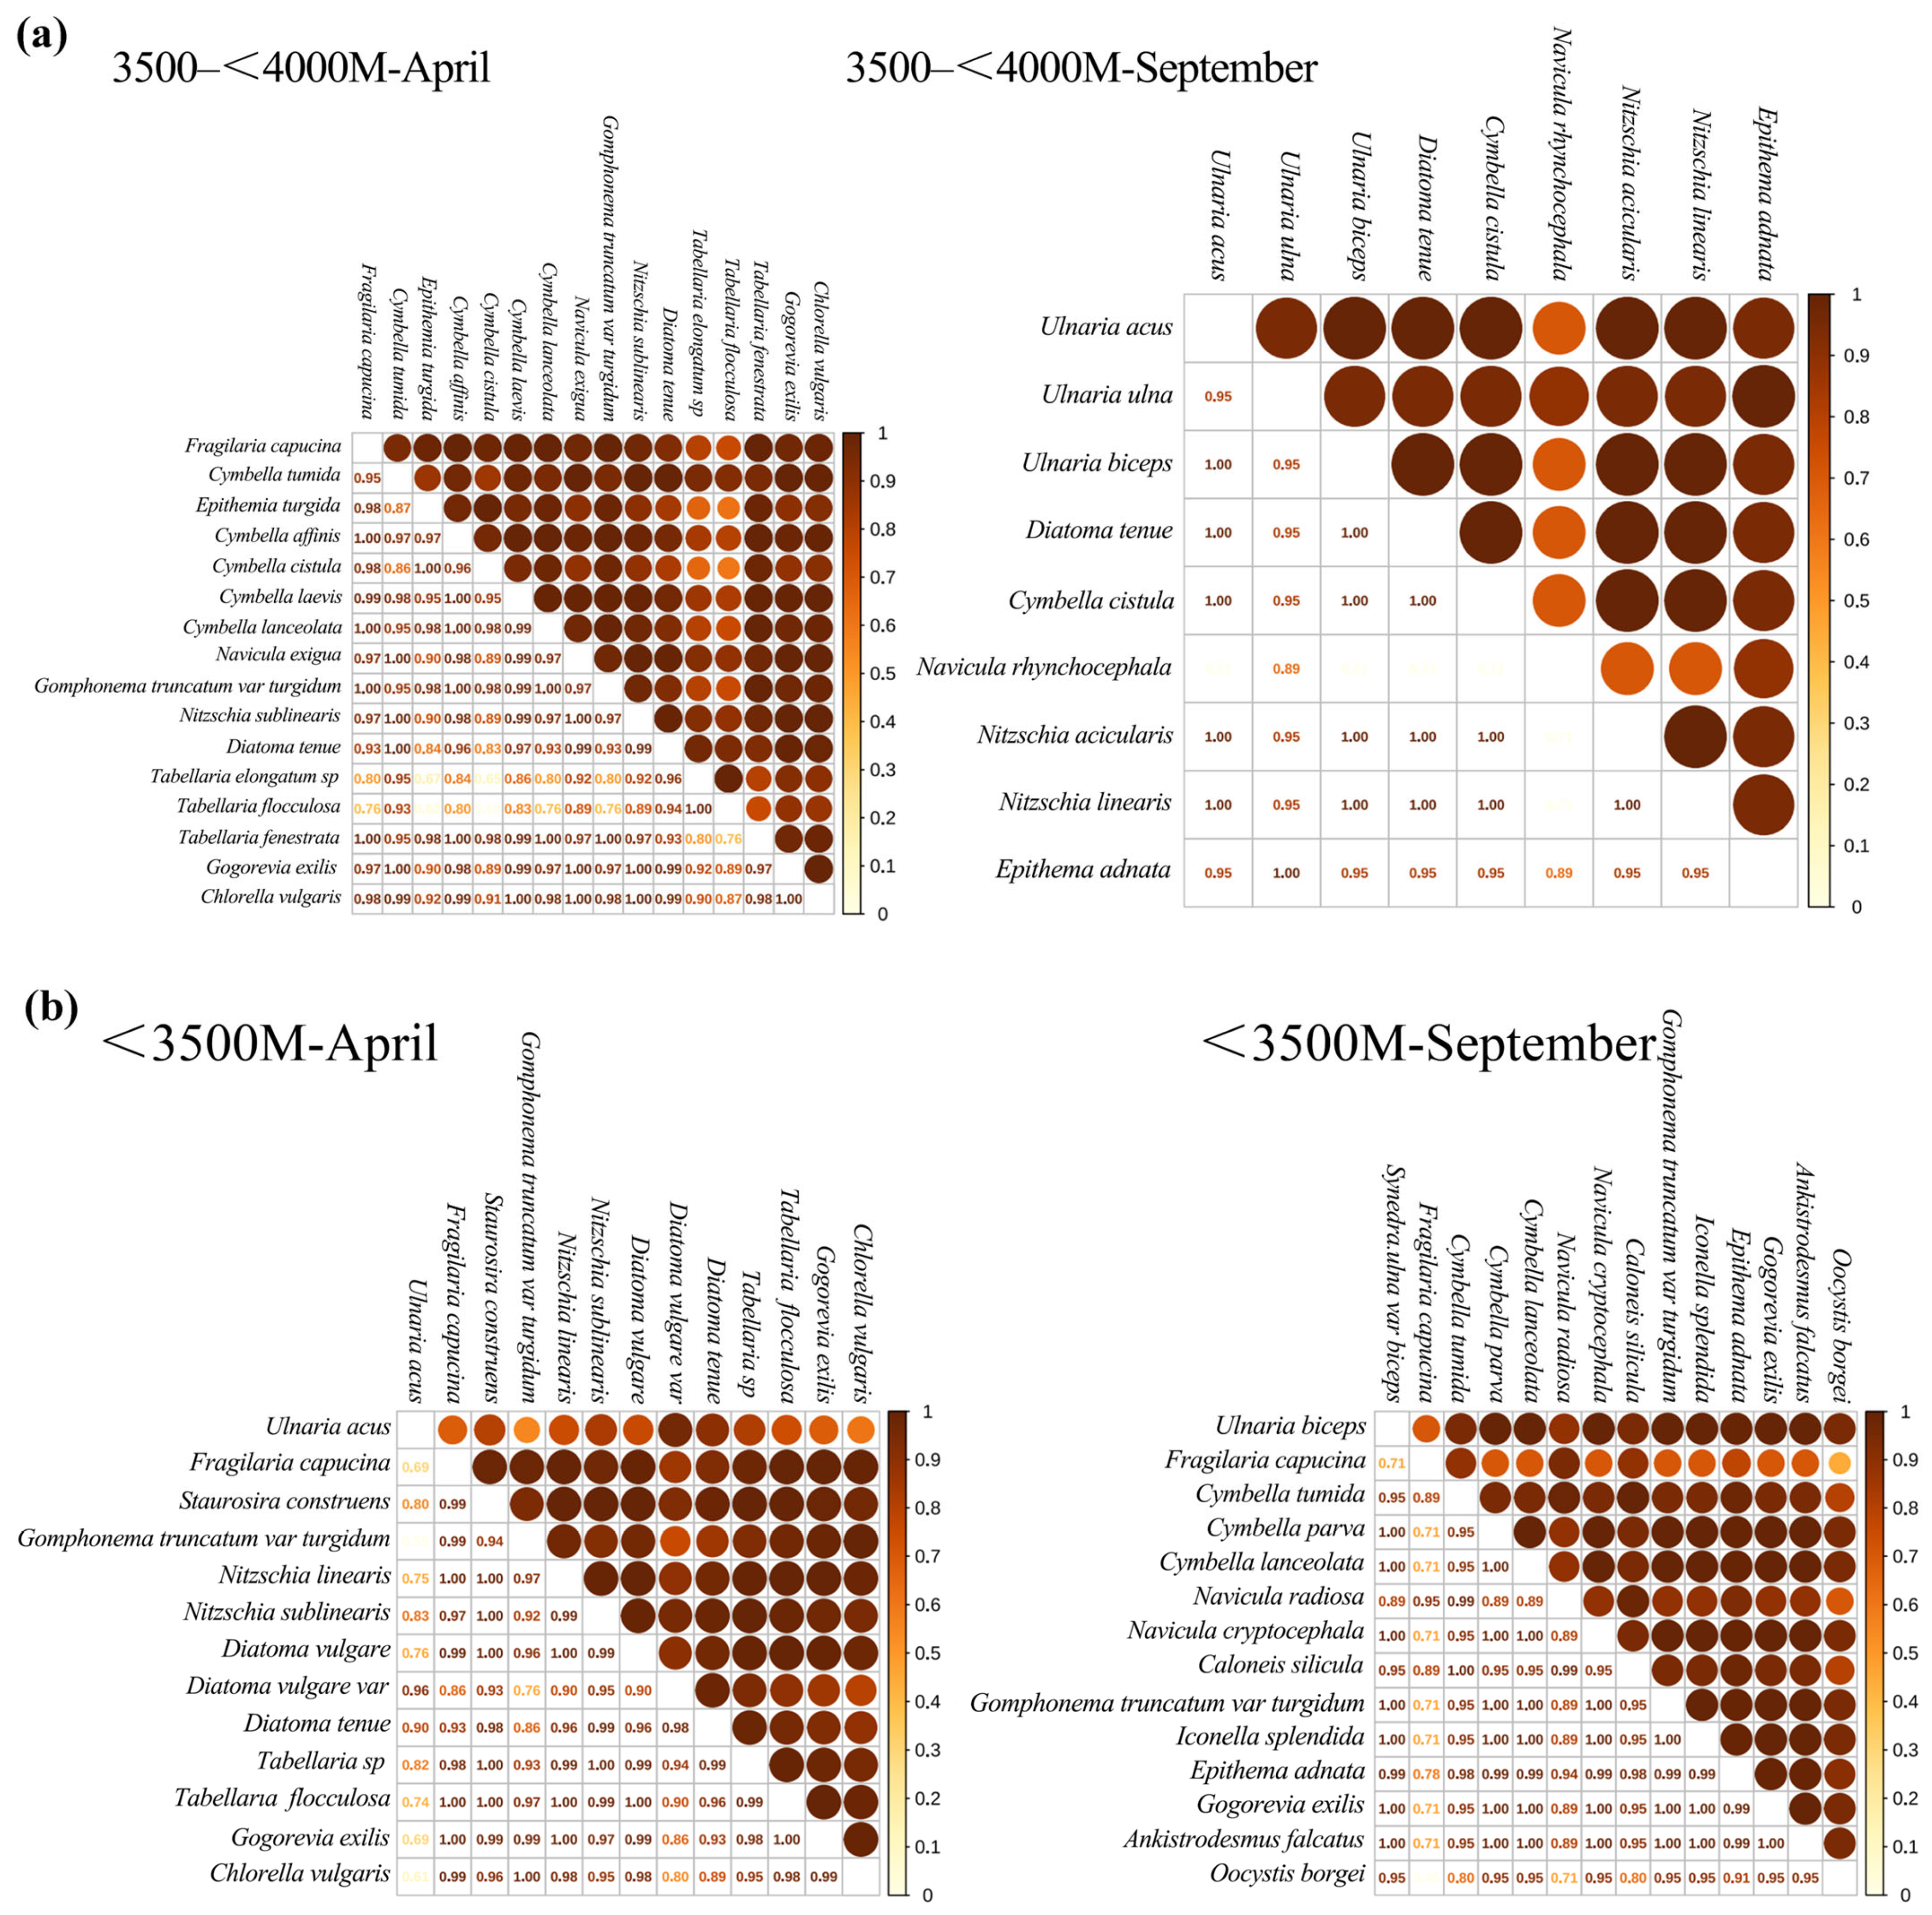
3.2.3. Niche Overlap Relative to Season

The niche overlap values of the 16 dominant species in the middle and upper reaches of the Yarlung Zangbo River in April and September ranged from 0.13 to 0.96, with no significant difference (p > 0.05). The degree of niche overlap in dominant species in September (mean 0.56) was slightly higher than in April (mean 0.40), with overall levels low (Figure 4). In April, 15 (33.33%) of all possible pairs of species showed a high niche overlap (Oik > 0.6). Seventeen pairs (37.78%) exhibited a moderate overlap (Oik > 0.3 to ≤0.6), and thirteen pairs (28.89%) had a low overlap (Oik 0 to ≤0.3). In September, 30 pairs of species exhibited a high niche overlap, accounting for 66.67% of all potential pairs, and 15 pairs (33.33%) showed a moderate overlap. Species pairs with an Oik > 0.6 included C. tumida/C. cistula (0.90) and N. linearis/E. adnata (0.62).

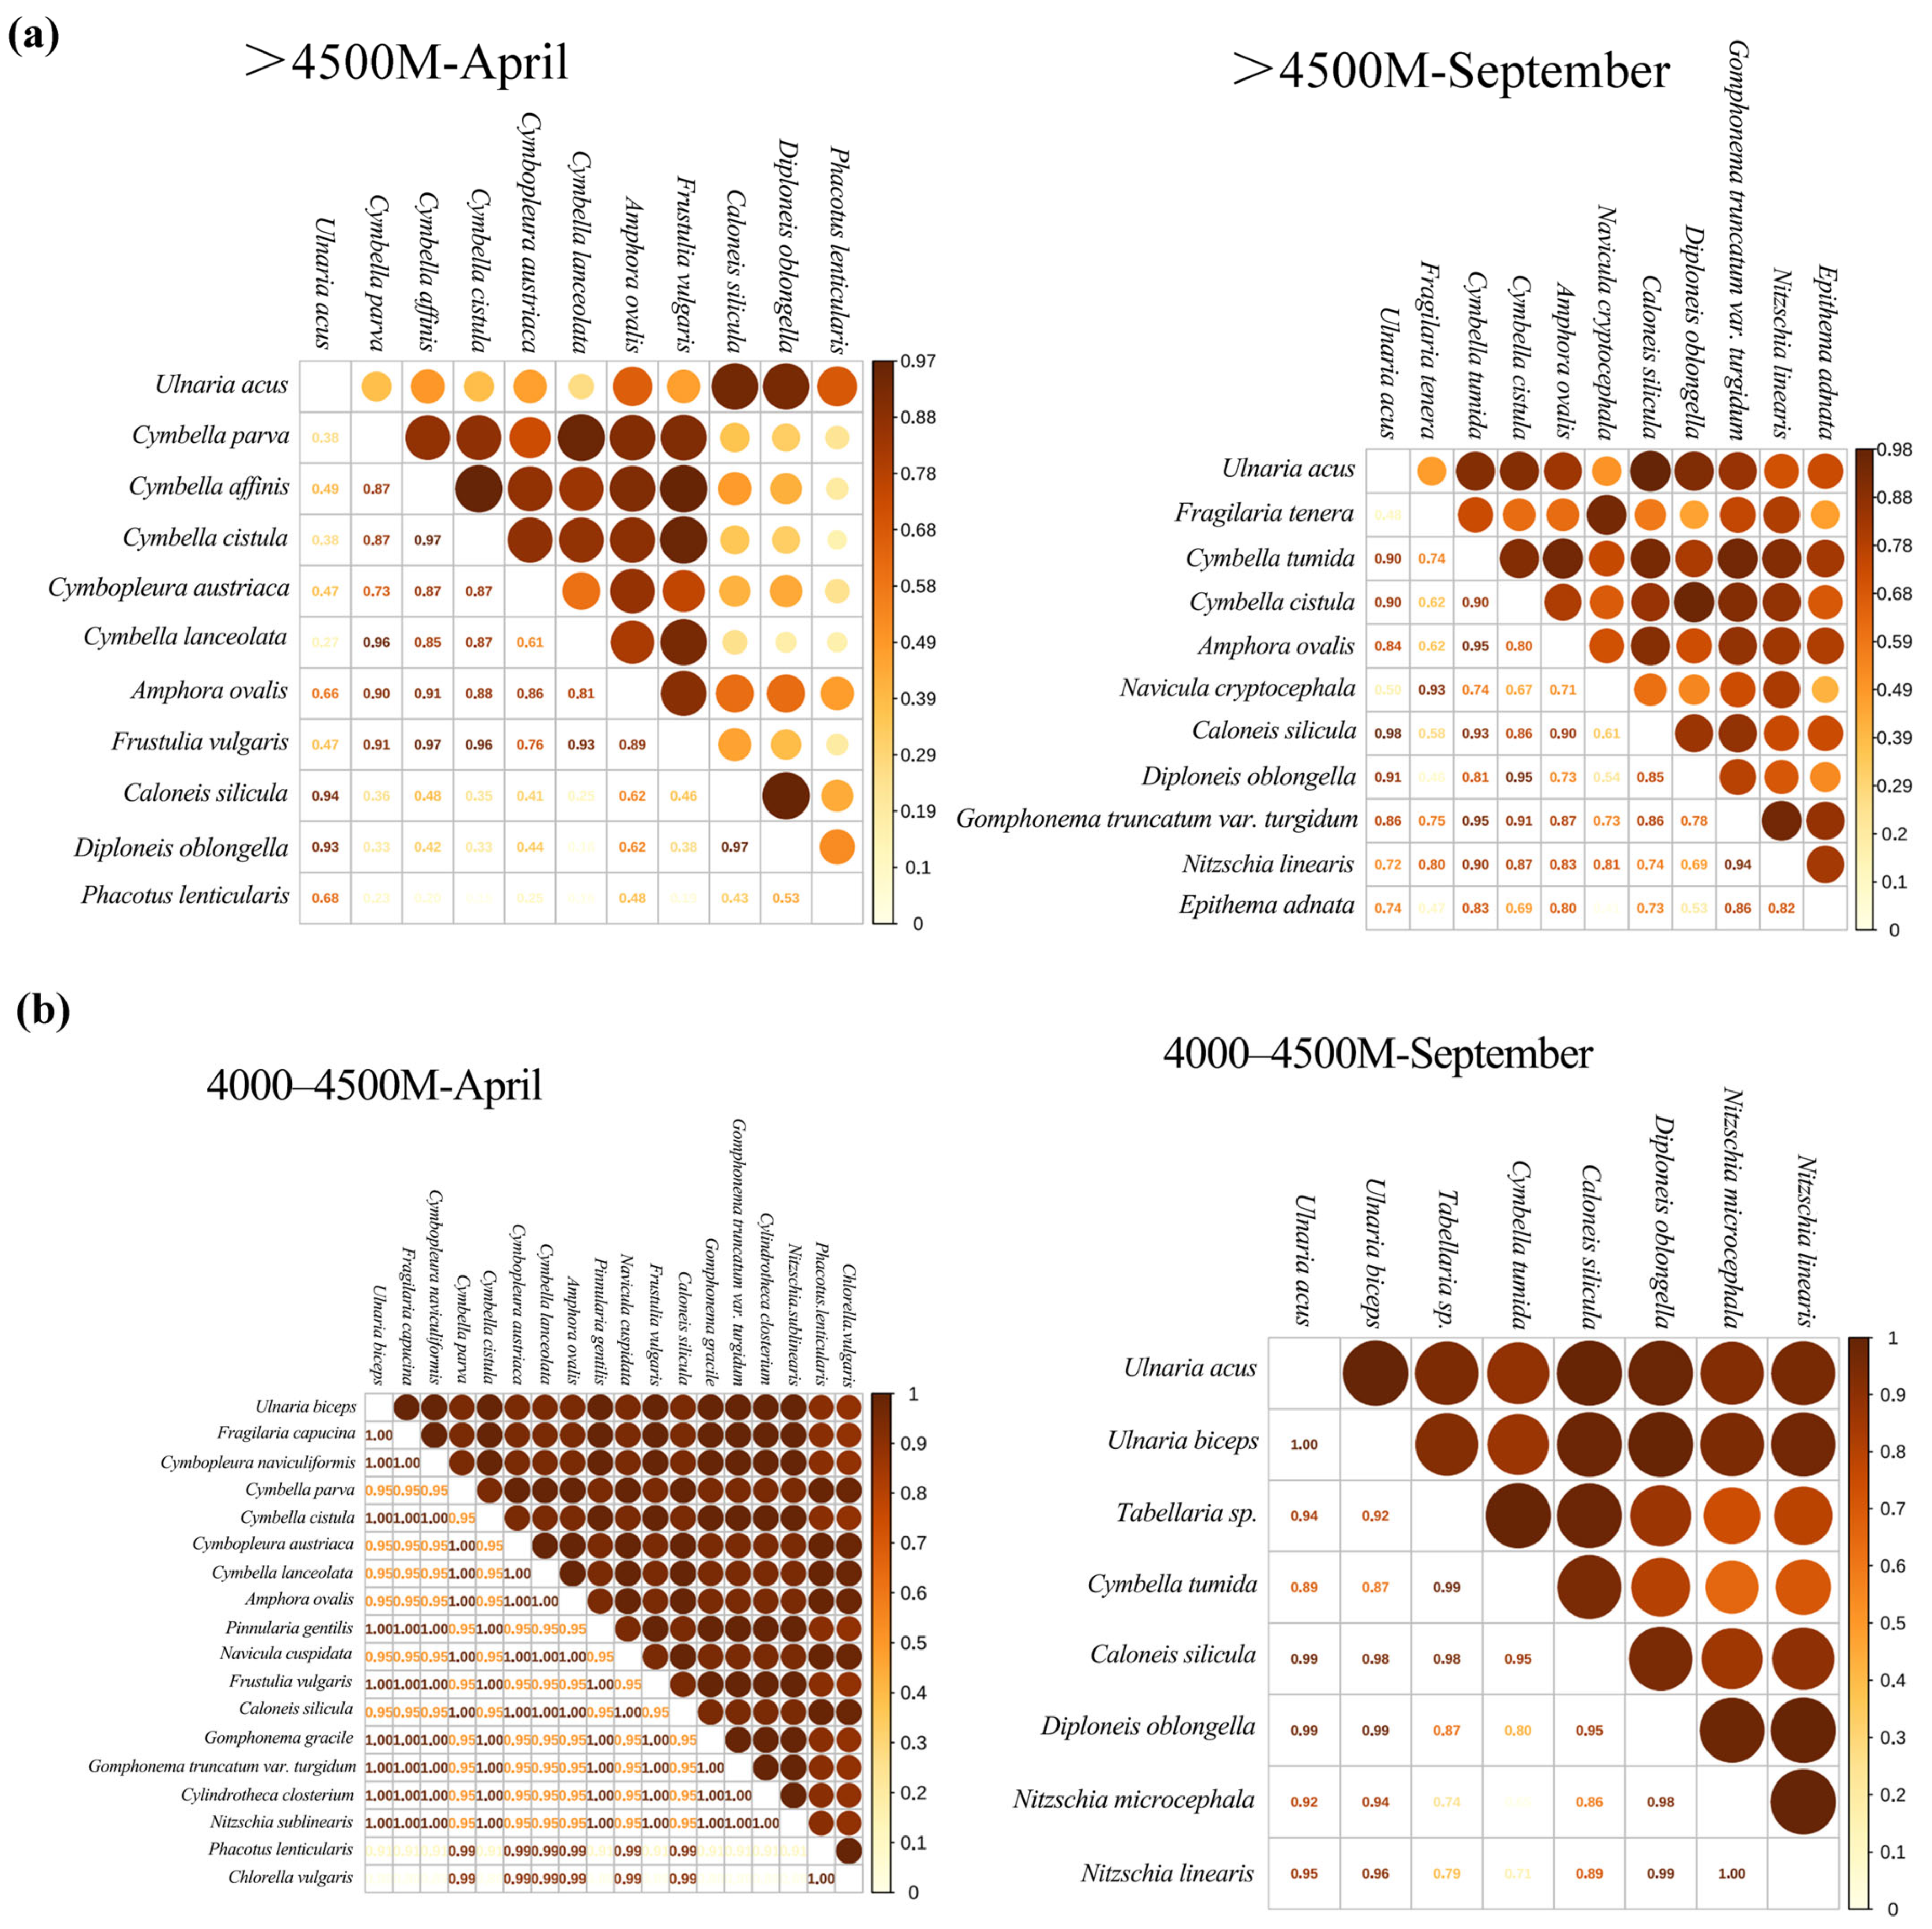
3.2.4. Niche Overlap Relative to Elevation Asl

This study analyzed the niche overlap of dominant phytoplankton species at different elevations. At elevations above 4500 m, the niche overlap of dominant species was 0.15–0.98, with the greatest overlap occurring in September between U. acus and C. silicula (0.98) and the lowest in April between Frustulia vulgaris and Cymbella affinis and Phacotus lenticularis and C. cistula (0.15) (Figure 5a). The April sampling revealed 27 pairs of species with a high niche overlap (Oik > 0.6), 49.09% of 55 possible pairs. In September, there were 48 pairs with a high niche overlap, 87.27% of possible pairs. At an elevation >4000 to 4500 m, the niche overlap values among possible pairs of dominant species in both sampling periods was 0.65–1.00, indicating a high overall resource overlap (Figure 5b).
At 3500–<4000 m asl, the niche overlap values among pairs of dominant species was 0.60–1.00 in both sampling periods, indicating a high niche overlap. The least overlap was observed between T. flocculosa and C. cistula (0.60) in April (Figure 6a). At <3500 m, the niche overlap values of dominant species were 0.45–1.00 in both April and September, with most possible pairs showing high overlap values. The smallest overlap was between Oocystis borgei and F. capucina (0.45) in September and between Gomphonema truncatum var. turgidum and U. acus (0.55) in April (Figure 6b).

3.2.5. Seasonal Relative Resource Occupancy

The calculated seasonal ΔOik of the 16 dominant species based on niche width (Table 4) ranged from −0.956 to 0.369, indicating little variation. Among the common dominant species, Ulnaria acus was in recession in both seasons (ΔOik < 0), while Cymbella tumida and Cymbella istula were expanding in both seasons (ΔOik > 0), indicating significant development potential and competitiveness. Caloneis silicula declined in spring and expanded in autumn. In April, P. lenticularis showed the largest negative ΔOik of the year, indicating a recession trend and the smallest development space.
Divided by elevation gradient, the proportion of in-recession dominant species was >4500 m (44%), <3500 m (29.17%), 3500–<4000 m (26.09%), 4000–4500 m (25%). Overall, the proportion of in-development dominant species exceeded that of in-recession species. The proportion of in-development dominant species in September showed an increasing (values greater than 0) trend across all elevations (Table 5).

3.3. Ecological Niche Differentiation

3.3.1. Environmental Factors

The water temperature of the study area ranged from 6.0 to 17.5 °C, pH values from 7.90 to 9.01, dissolved oxygen from 6.10 to 13.90 mg/L, conductivity from 137.50 to 406.00 μS/cm, salinity from 0.07 to 0.19 ppt, and total dissolved solids from 68.70 to 202.00 mg/L (Table 6 and Table 7). We observed significant differences in water temperature, conductivity, and total dissolved solids in April and September (p < 0.05). Significant differences in pH, conductivity, and total dissolved solids were found in April and September at elevations >4000 m (p < 0.05), and significant differences in conductivity, salinity, and total dissolved solids between 3500–<4000 m and <3500 m (p < 0.05). Water temperature decreased with elevation in both sampling periods, with significant differences observed between elevation >4500 m and lower zones (p < 0.05). Dissolved oxygen, conductivity, salinity, and total dissolved solids at 3500–<4000 m and <3500 m exhibited significant differences in September (p < 0.05).

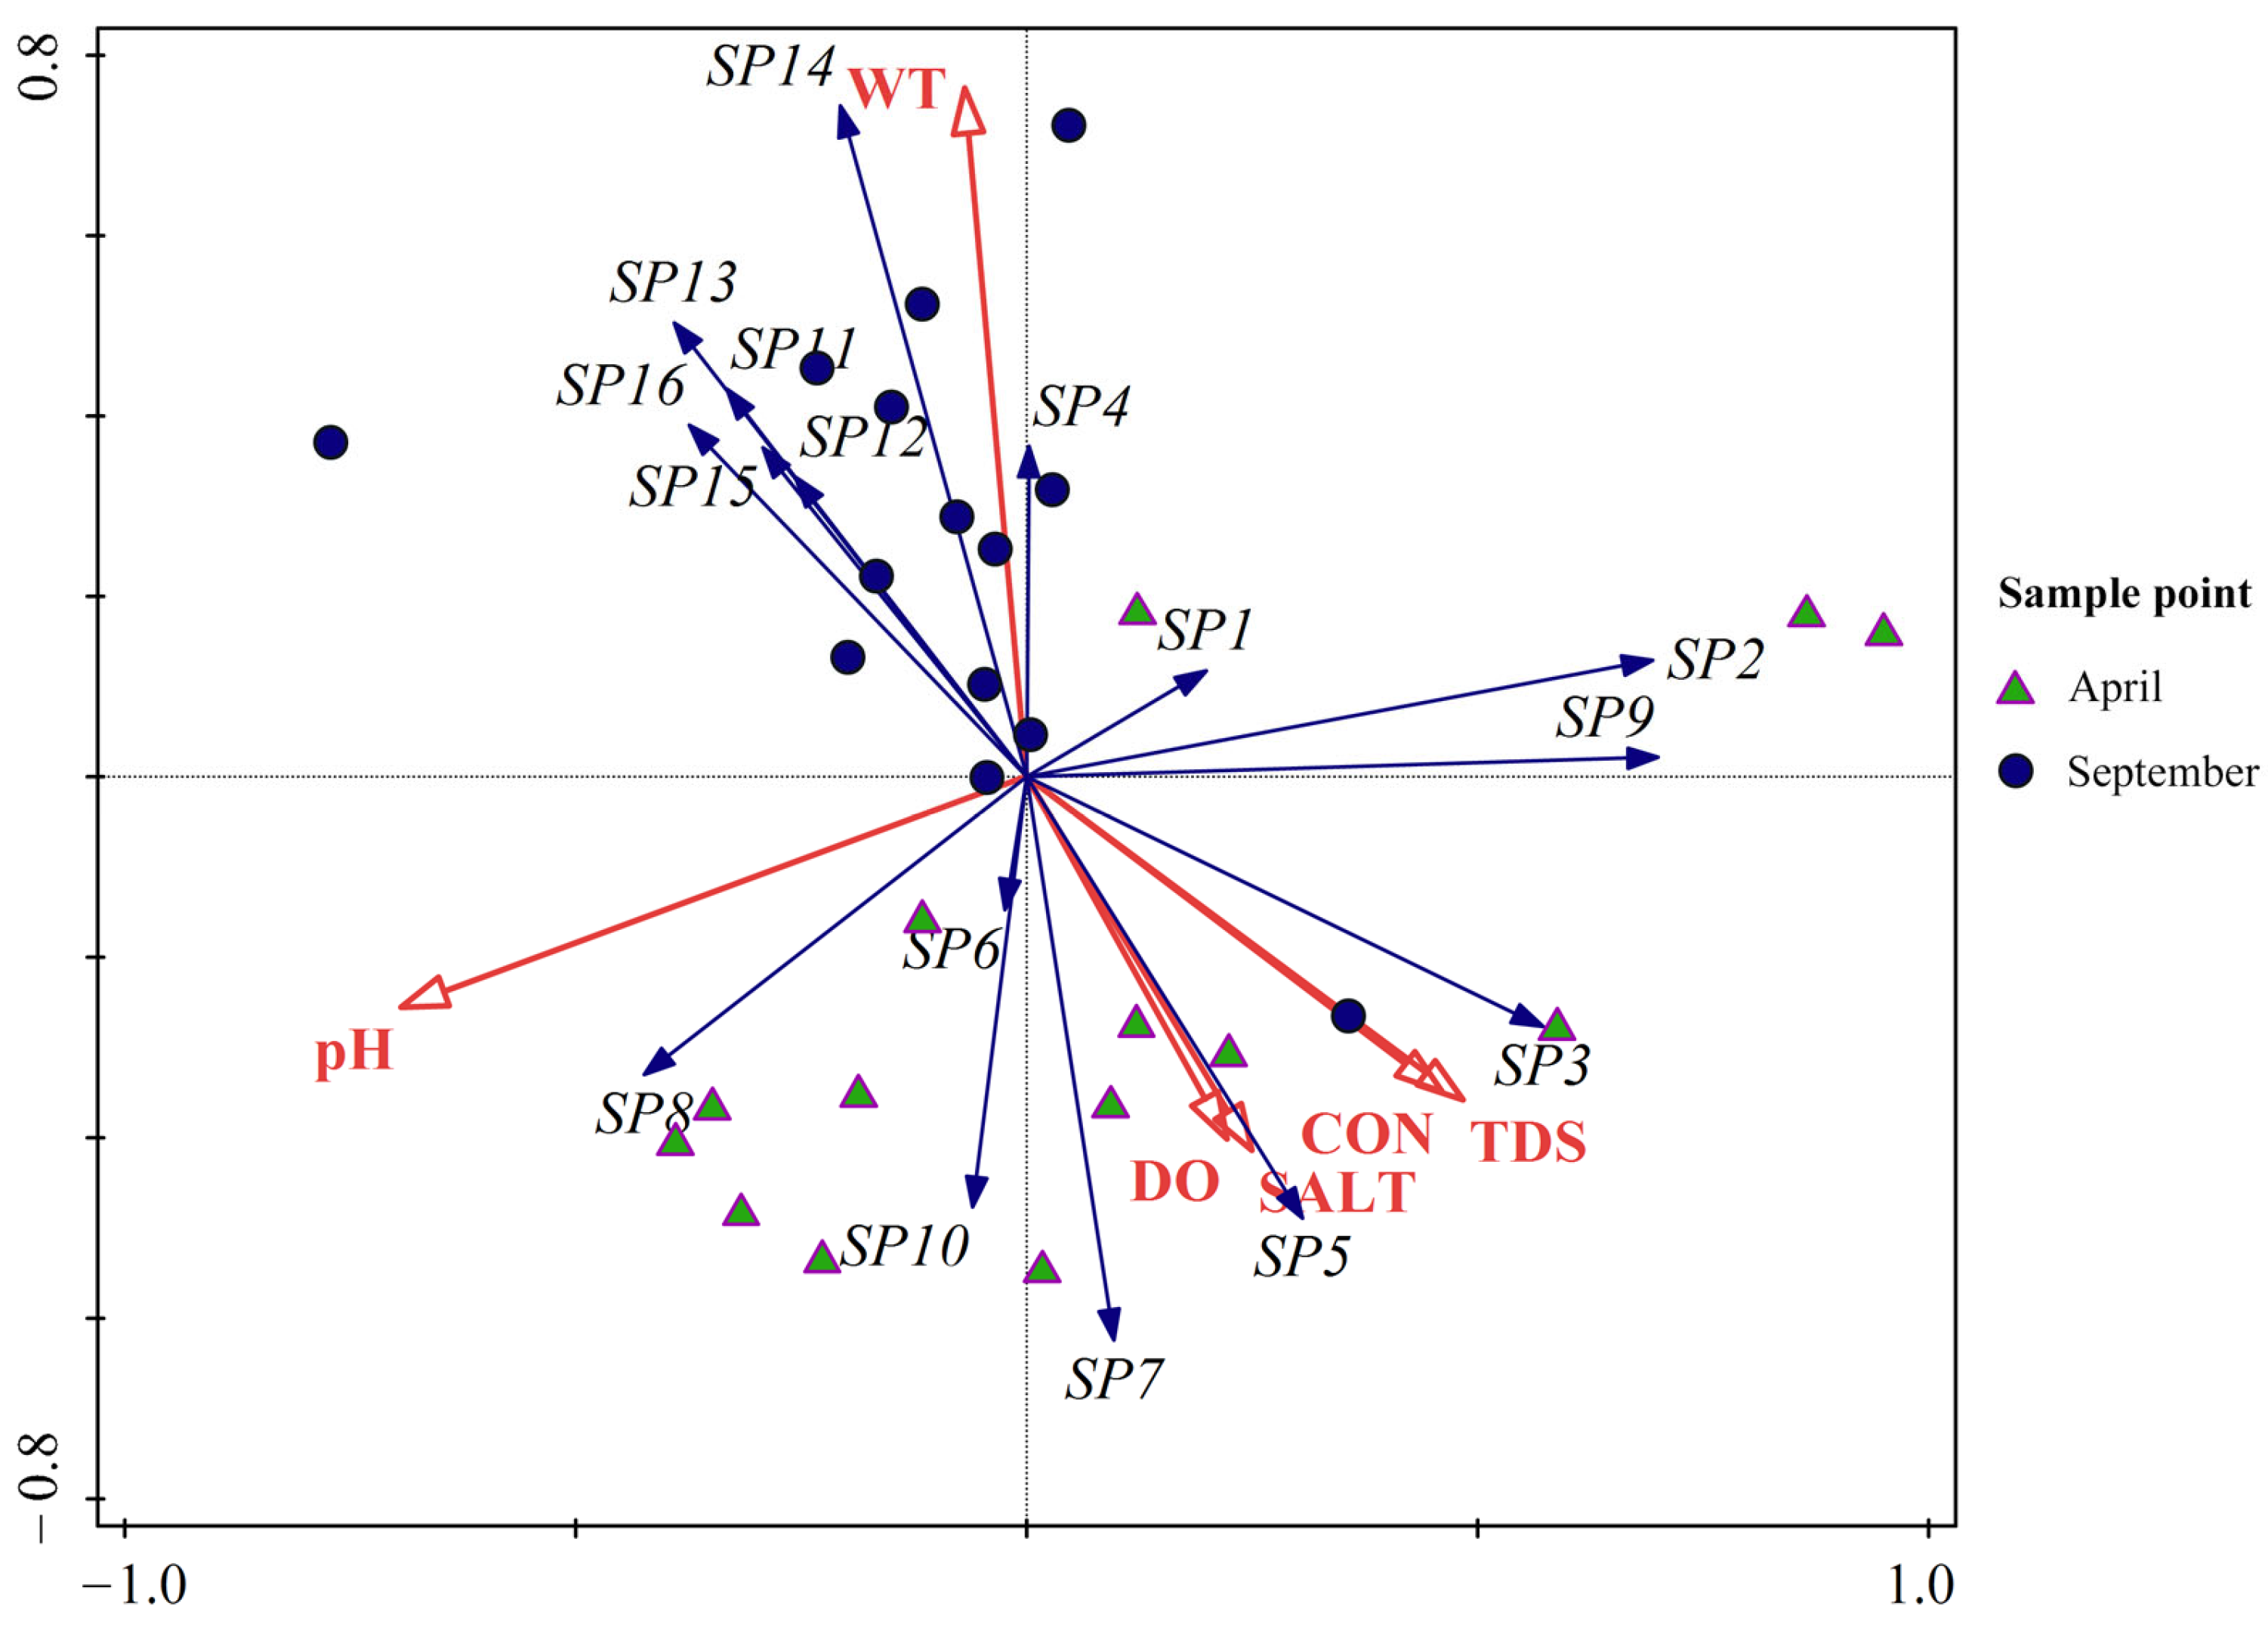
3.3.2. Redundancy Analysis and Ordination Plot

A Detrended Correspondence Analysis of the dominant phytoplankton species showed a maximum gradient length of less than three (2.93), prompting the selection of redundancy analysis to examine the relationship between the dominance of phytoplankton species and the water’s physicochemical factors (Figure 7). Water temperature and pH showed the greatest influence on the relative presence of phytoplankton species, cumulatively explaining 36.8% of the community variation. The first axis explained 17.66% of the variation, with the cumulative explained variance of the first two axes being 27.87%. The presence of C. tumida and E. adnata was positively correlated with water temperature but negatively correlated with dissolved oxygen, salinity, conductivity, and total dissolved solids. The quantity of F. capucina and C. affinis was positively correlated with conductivity and total dissolved solids and negatively correlated with water temperature. Caloneis silicula, C.cistula, and P. lenticularis were positively correlated with pH. Water temperature (p = 0.041), pH (p = 0.02), and salinity (p = 0.026) significantly affected the dominance of phytoplankton species (p < 0.05).

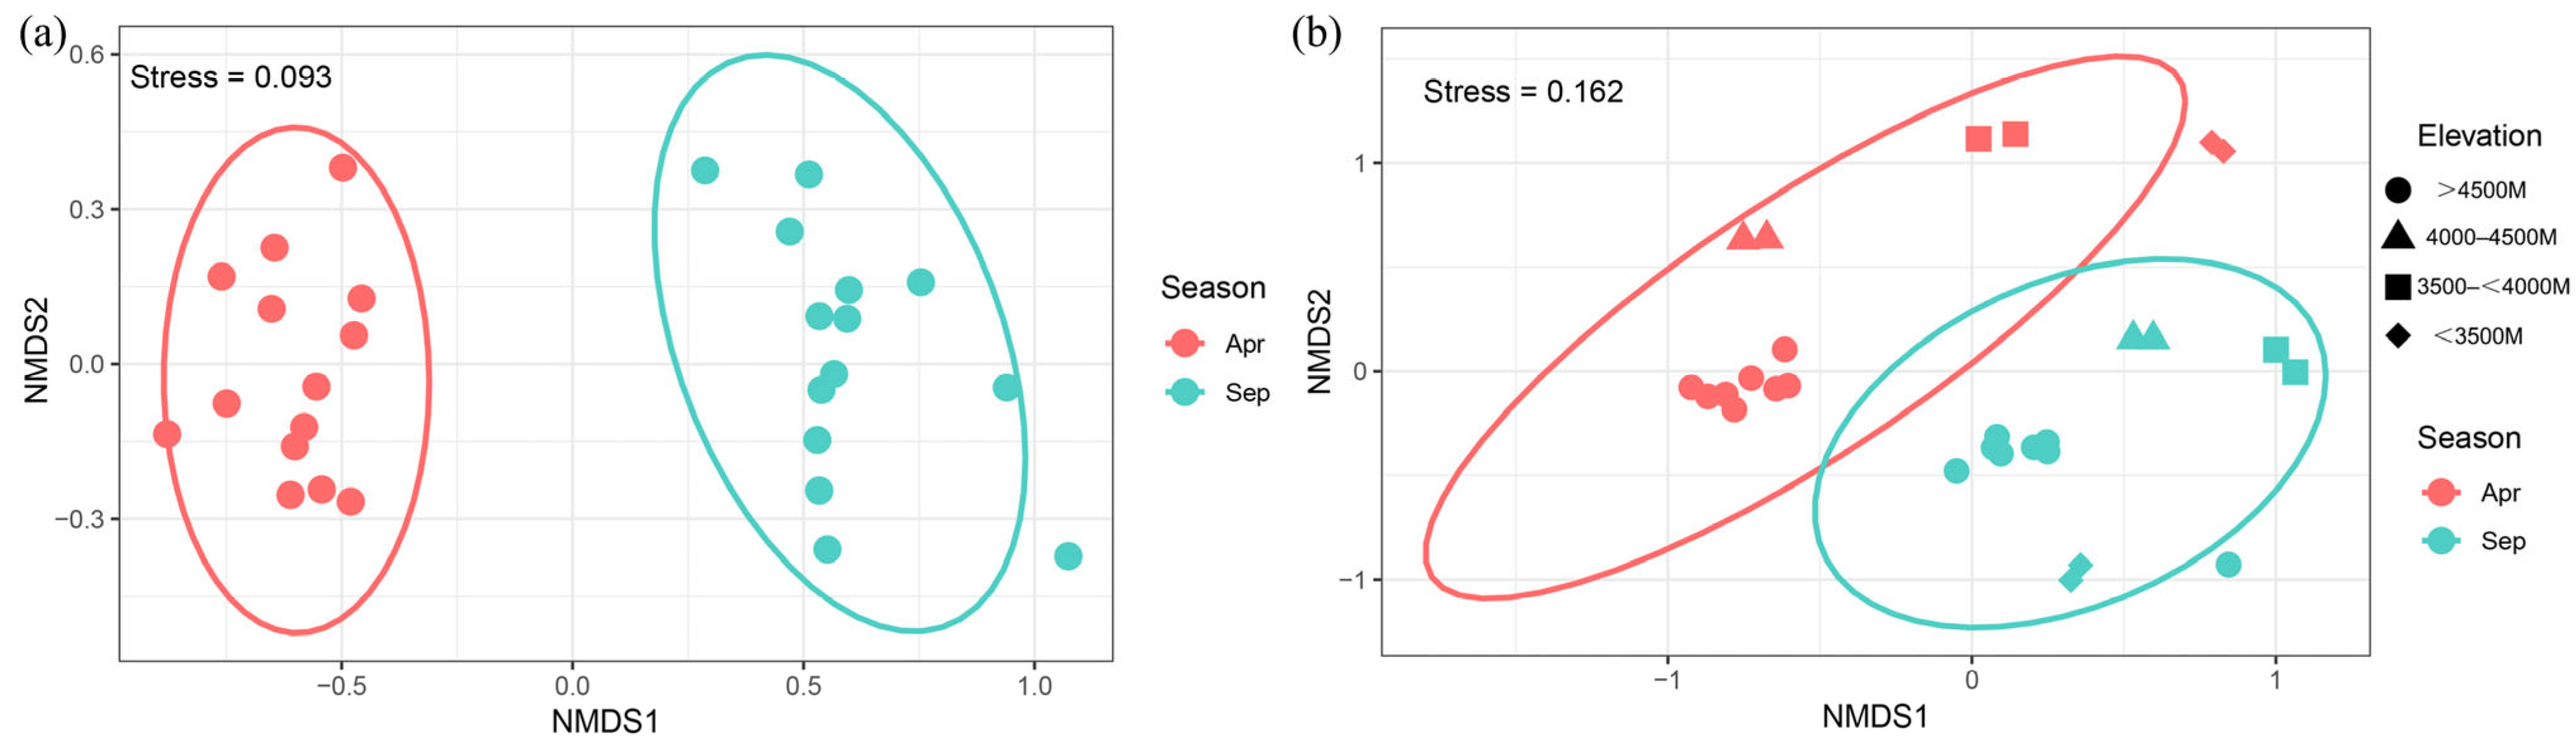
3.3.3. NMDS Analysis

From the two sampling periods, there was a significant difference in the community structure of dominant phytoplankton species between April and September (Figure 8a). The SIMPER analysis showed that Epithema adnata, Phacotus lenticularis, Chlorella vulgaris, Nitzschia acicularis, and Cymbopleura austriaca were the top five species contributing the most to the seasonal variation, with a cumulative contribution of 40.87% (p < 0.001). The PERMANOVA test showed that the effect of sampling period on the community structure of dominant phytoplankton species was highly significant (R2 = 0.605, p = 0.001), explaining 60.5% of the community variation. From the different sampling elevations, elevation also significantly influenced the community structure, with Ulnaria acus as the core dominant species at low elevations, contributing 13.26%; elevation and season together explained about 49% of the community variation, and in April, elevation alone explained up to 64.7% of the community variation (p = 0.001) (Figure 8b).

4. Discussion

4.1. Phytoplankton Community Characteristics and Dominant Species

Bacillariophyta was dominant in all sampling sites of the Yarlung Zangbo River at both sampling times, presenting a community structure characterized by diatoms, Chlorophyta, and cyanobacteria. In April, the phytoplankton species and abundance were highest in S12 and lowest in S9. In September, the phytoplankton abundance was highest in S6 and lowest in S12, with species dominance varying with elevation, consistent with the findings of Liu Yang et al. [36] The water temperature of the study area is low (8.58 ± 0.74), with a minimal seasonal fluctuation, providing suitable conditions for cold-tolerant diatoms. The presence of Euglenophyta and Cryptophyta in only the September survey may be related to their temperature preference [37]. In April, C. vulgaris was the only dominant green alga (Y = 0.059), likely due to its adaptation to low-temperature conditions [38]. Cymbella tumida was the dominant species in September (Y = 0.065). The phytoplankton community structure was significantly influenced by elevation, with diatoms maintaining dominance across regions. (Elevation zones set in the text). At lower elevations, warmer water fosters the presence of cyanobacteria and green algae, especially below 3500 m, where A. falcatus and O. borgei were the dominant species [39]. In contrast to lowland areas, the species composition of the phytoplankton community in the present study area was similar but relatively less diverse, with lowland areas not only containing more taxa such as Cryptophytes but also having a more significant biomass, abundance, and seasonal variations [7,10].

4.2. Niche Width and Overlap of Dominant Species

Niche width measures a species’ ability to adapt to its environment and reflects its flexibility in utilizing resources under varying conditions [40]. We found U. acus, C. tumida, C. cistula, and C. silicula to be dominant species across seasons and elevation zones. Cymbella cistula in April (Bi = 8.35) and A. ovalis (Bi = 5.76) and N. cryptocephala in September (Bi = 7) demonstrated significantly broader resource adaptation than other dominant species in the studied area. Conversely, C. vulgaris (Bi =2), P. lenticularis (Bi = 1), and F. capucina (Bi = 1) in April and E. adnata (Bi = 1) in September showed niche width values < 3, indicating their reliance on a narrow range of habitat conditions and their vulnerability to ecosystem change. This aligns with studies in Bohai Bay (Western Bohai Sea, China) finding that the shift from diatom dominance to dinoflagellate dominance was influenced by environmental change [41].
The niche overlap index measures the degree of similarity in resource utilization between two species, serving as a critical indicator for assessing interspecies competition [42]. We found a greater niche overlap among dominant phytoplankton species in the study area in September than in April. In April, 28.89% of species pairs exhibited a low niche overlap (Oik ≤ 0.3), while, in September, the proportion was 33.33%. Notably, the niche overlap value between C. affinis and C. cistula was as high as 0.96 in April, and the Cymbopleura austriaca/C. cistula and C. tumida/A. ovalis overlap exceeded 0.9 in September, reflecting high similarity in resource utilization.
The water of the Yarlung Zangbo River is rich in silicon, providing favorable conditions for the presence and proliferation of diatoms [12]. The smallest niche overlap in April was between T. flocculosa and P. lenticularis (Oik = 0.13), while in September, it was between N. cryptocephala and E. adnata (Oik = 0.37). With respect to elevation, in September the lowest overlap was observed between Phacotus lenticularis and Cymbella cistula (Oik = 0.15) at >4500 m and between Oocystis borgei and Fragilaria capucina (Oik = 0.45) <3500 m. We found O. borgei to exhibit the most unique niche adaptation, with a greater tolerance for warmer water. Cymbella cistula and Cymbella tumida were expanding dominant species at both sampling times. September showed a higher number of expanding dominant species than observed in April, possibly influenced by the low water temperature, weak solar radiation, and shorter daylight hours in spring inhibiting growth and reproduction [43]. Studies have shown that changes in water temperature not only affect species at different times of the year but also affect them differently depending on their geographical location and altitude [44]. Similarly, solar radiation and sunshine duration vary with altitude, which may alter the ecological dynamics observed at different altitudes [45,46].

4.3. Factors Influencing Phytoplankton Community Structure

Environmental factors determine the distribution of dominant species within aquatic communities, with water temperature, pH, and salinity being the primary drivers of ecological niche differentiation among dominant phytoplankton species in the middle and upper reaches of the Yarlung Zangbo River. The RDA ordination plot elucidated the interaction of species with environmental factors and reflected differences in species life habits Navicula cryptocephala, Diploneis oblongella, and A. ovalis are plotted in close proximity, indicating similar ecological adaptations and resource utilization patterns. Tabellaria flocculosa and A. ovalis are well separated, suggesting differences in survival strategies and in their vulnerability to environmental alterations. The occurrence of E. adnata was positively correlated with water temperature, while F. capucina and C. affinis thrived in colder environments. The occurrence of Caloneis silicula, C. cistula, and P. lenticularis was positively correlated with pH values. A variation in pH can alter the chemical properties of water, affecting nutrient availability and influencing the proliferation of phytoplankton [47]. Epithema adnata was negatively correlated with dissolved oxygen, salinity, conductivity, and total dissolved solids, whereas F. capucina and C. affinis were positively correlated with conductivity and total dissolved solids. On the ordination plot, most phytoplankton cluster in the high-temperature, low-salinity area, while F. capucina and C. affinis are located in the low-temperature area, demonstrating a clear ecological niche differentiation. Seven dominant species were positively correlated with water temperature, showing the ability to maintain a stable nutrient absorption and cell division in low-temperature environments. The proliferation of less cold-tolerant species was limited [48]. In addition, parameters such as nutrients (nitrogen and phosphorus), turbidity, and light irradiance were not fully measured in the study. These factors may also have important effects on phytoplankton growth and community structure. Nutrients are key to phytoplankton biomass production and can significantly influence species composition. Turbidity affects light penetration and photosynthetic efficiency, while light irradiance directly affects photosynthetic rate [49]. Future studies should include measurements of these parameters to better understand their effects on phytoplankton communities.

5. Conclusions

The phytoplankton community in the middle and upper reaches of the Yarlung Zangbo River is composed mainly of diatoms, with the species distribution significantly affected by elevation and seasonal changes. In particular, some species at >3500 m become dominant in September, reflecting the key role of elevation in species distribution. Water temperature, pH, and salinity are the main factors driving niche differentiation, and species with broad ecological niches can serve as indicators of water quality. Although resource utilization patterns vary, and ecosystem community structures remain relatively stable, the ecological niche overlap between dominant species is higher in autumn and increases with elevation asl. Future research should focus on the long-term monitoring of environmental variables and their interactions on the impact of phytoplankton communities and the exploration of other influencing factors, to understand the ecological dynamics of the region.

Author Contributions

Conceptualization, L.L.; methodology, W.X. and L.L.; software, W.X., S.L. and H.J.; validation, W.X., S.L., H.J. and Z.Z.; formal analysis, S.L., W.L., Y.Z. and L.P.; investigation, S.L., H.J. and L.L.; data curation, W.X., S.L., W.L. and L.P.; writing—original draft preparation, W.X. and S.L.; writing—review and editing, W.X., S.L., H.J. and W.L.; visualization, W.X. and S.L.; supervision, L.L.; project administration, L.L.; funding acquisition, L.L. All authors have read and agreed to the published version of the manuscript.

Funding

This research was funded by the Heilongjiang Province Postdoctoral Research Launch Gold Project (LBH-Q21200), agricultural invasive species key investigation and monitoring project; the Central Public Interest Scientific Institution Basal Research Fund, CAFS (2023TD07); and the Evaluation of Fish Proliferation and Release Effect in Heilongjiang Province.

Data Availability Statement

Restrictions apply to the availability of these data. Data was obtained from Heilongjiang River Fisheries Research Institute of Chinese Academy of Fishery Sciences and are available from the Correspondence author with the permission of Heilongjiang River Fisheries Research Institute of Chinese Academy of Fishery Sciences.

Acknowledgments

We extend our gratitude to the crews involved in the survey for their efforts in collecting the data.

Conflicts of Interest

The authors declare no conflicts of interest.

References

  1. Yao, T.D.; Chen, F.H.; Cui, P.; Ma, Y.M.; Xu, B.Q.; Zhu, L.P.; Zhang, F.; Wang, W.C.; Ai, L.K.; Yang, X.X. From the Tibetan Plateau to the third pole and the extended third pole. Bull. Chin. Acad. Sci. 2017, 32, 924–931. [Google Scholar]
  2. Li, X.; Zhang, P.; Yang, Q.; Liu, H.; Chao, X.; Yang, S.; Ba, S. Distribution patterns and driving factors of the phytoplankton community in the middle reaches of the Yarlung Zangbo River. Sustainability 2023, 15, 7162. [Google Scholar] [CrossRef]
  3. Dong, Z.B.; Hu, G.Y.; Qian, G.Q.; Lu, J.F.; Zhang, Z.C.; Luo, W.Y.; Lv, P. High-altitude aeolian research on the Tibetan Plateau. Rev. Geophys. 2017, 55, 864–901. [Google Scholar] [CrossRef]
  4. Jiang, Y.; Xu, H.L.; Zhu, M.Z. Use of planktonic protists for assessing water quality in Jiaozhou Bay, northern China. Protistology 2012, 7, 34–41. [Google Scholar]
  5. Filker, S.; Sommaruga, R.; Vila, I.; Stoeck, T. Microbial eukaryote plankton communities of high-mountain lakes from three continents exhibit strong biogeographic patterns. Mol. Ecol. 2016, 25, 2286–2301. [Google Scholar] [CrossRef] [PubMed]
  6. Interlandi, S.J.; Kilham, S.S. Limiting Resources and the Regulation of Diversity in Phytoplankton Communities. Ecology 2001, 82, 1270–1282. [Google Scholar] [CrossRef]
  7. Zhang, X.X. Spatial-Temporal Evolutional Laws of the Key Hydrological Elements in Yarlung Zangbo River Basin. Ph.D. Thesis, Beijing Forestry University, Beijing, China, 2011. [Google Scholar]
  8. Zhang, Y.; Sun, J.Y.; Li, W. Spatial-Temporal Change Trends and Driving Factors of NDVI in the Riparian Vegetation at Different Altitudinal Gradients in the Yarlung Zangbo River Basin. Biodivers. Sci. 2024, 32, 23432. [Google Scholar] [CrossRef]
  9. Ma, T.; Wan, Y.; Wu, P.; Wang, J. Effects of Environmental Factors on Phytoplankton Growth and Community Structure. Adv. Environ. Prot. 2024, 14, 459–466. [Google Scholar] [CrossRef]
  10. Li, X.; Pan, C.; An, R.; Ba, S. Niche and interspecific association of dominant phytoplankton species in different hydrological periods in the middle and lower reaches of Lhasa River, Tibet, China. J. Lake Sci. 2023, 35, 118–130. [Google Scholar]
  11. Pastore, A.I.; Allesina, S.; Kraft, N.J.B. The evolution of niche overlap and competitive differences. Nat. Ecol. Evol. 2021, 5, 330–337. [Google Scholar] [CrossRef]
  12. Slobodchikoff, C.N.; Schulz, W.C. Measures of niche overlap. Ecology 1980, 61, 1051–1055. [Google Scholar] [CrossRef]
  13. Hutchinson, G.E. Concluding remarks. Cold Spring Harb. Symp. Quant. Biol. 1957, 22, 415–427. [Google Scholar] [CrossRef]
  14. Colwell, R.K.; Futuyma, D.J. On the measurement of niche breadth and overlap. Ecology 1971, 52, 567–576. [Google Scholar] [CrossRef]
  15. Pei, G.F.; Cao, J.X.; Liu, G.X. Diversity of phytoplankton community in different reaches of Niyang River. Resour. Environ. Yangtze Basin 2012, 21, 24–29. [Google Scholar]
  16. Liu, H.P.; Ye, S.W.; Yang, X.F.; Zhang, L.S.; Zhong, G.H.; Li, Z.J. Spatial-temporal dynamics of aquatic organism community and their relationships to environment in Niyang River, Tibet: 1. Phytoplankton. J. Lake Sci. 2013, 25, 695–706. [Google Scholar]
  17. Huo, J.J.; Qu, X.; Zhu, D.J.; Yuan, Z.; Tang, Y.Z. Impacts of Climate Change on Blue and Green Water Resources in the Middle and Upper Yarlung Zangbo River, China. Atmosphere 2021, 12, 1280. [Google Scholar] [CrossRef]
  18. Li, L.; Jin, H.Y.; Zhang, Z.P.; Wu, S.; Wang, N.M.; Jin, X.; Ma, B. Distribution and Feeding Habit Difference of Oxygymnocypris stewarti in the Yarlung Zangbo River System. Wetl. Sci. 2022, 20, 704–708. [Google Scholar]
  19. Comprehensive Scientific Expedition to the Tibetan Plateau, Chinese Academy of Sciences. Rivers and Lakes of Tibet; Science Press: Beijing, China, 1984. [Google Scholar]
  20. Huang, Z.; Lin, B.; Sun, J.; Luozhu, N.; Da, P.; Dawa, J. Suspended Sediment Transport Responses to Increasing Human Activities in a High-Altitude River: A Case Study in a Typical Sub-Catchment of the Yarlung Tsangpo River. Water 2020, 12, 952. [Google Scholar] [CrossRef]
  21. Liu, W.; Jiang, H.; Zhang, J.; Xu, Z. Driving Forces of Nitrogen Cycling and the Climate Feedback Loops in the Yarlung Tsangpo River Basin, the Highest-Altitude Large River Basin in the World. J. Hydrol. 2022, 610, 127974. [Google Scholar] [CrossRef]
  22. Jiang, Z.G. Exploring the distribution patterns and conservation approaches of biodiversity on the Qinghai-Tibetan Plateau. Biodivers. Sci. 2018, 26, 107–110. [Google Scholar]
  23. Ba, S.; Yang, X.L.; Huang, X.; Gui, Q. Phytoplankton community characteristics and water quality evaluation in the lower reaches of Lhasa River in spring and summer. Res. Plateau Sci. 2017, 1, 25–38. [Google Scholar]
  24. Jun, S.; Wang, D.B.; Zhou, J.H.; Bai, X.Y.; Bai, K. Community structures of phytoplankton and its relationship with environmental factors in the Lhasa River. Acta Ecol. Sin. 2019, 39, 787–798. [Google Scholar]
  25. Zhang, R.; Xu, Z.X.; Liu, X.W.; Liu, J.T.; Bai, J.R. Spatiotemporal Characteristics of Land Use/Cover Change for the Yarlung Zangbo River Basin from 1980 to 2015. China Rural Water Hydropower 2019, 3, 106–111. [Google Scholar]
  26. Guan, Z.H.; Chen, C.Y. Tibetan Rivers and Lakes; Science Press: Beijing, China, 1984. [Google Scholar]
  27. Zhang, Z.S.; Huang, X.F. Research Methods of Freshwater Plankton; Science Press: Beijing, China, 1991. [Google Scholar]
  28. Shannon, C.E. A mathematical theory of communication. Bell Syst. Tech. J. 1948, 27, 379–423. [Google Scholar] [CrossRef]
  29. Pielou, E.C. The measurement of diversity in different types of biological collections. J. Theor. Biol. 1966, 13, 131–144. [Google Scholar] [CrossRef]
  30. Izaguirre, I.; O’Farrell, I.; Unrein, F.; Sinistro, R.; Afonso, M.D.; Tell, G. Algal Assemblages Across a Wetland, from a Shallow Lake to Relictual Oxbow Lakes (Lower Paraná River, South America). Hydrobiologia 2004, 511, 25–36. [Google Scholar] [CrossRef]
  31. Cai, H.Y.; Wang, K.; Huang, S.J.; Jiao, N.Z.; Chen, F. Distinct patterns of picocyanobacterial communities in winter and summer in the Chesapeake Bay. Appl. Environ. Microbiol. 2010, 76, 2955–2960. [Google Scholar] [CrossRef]
  32. Resende, P.; Azeiteiro, M.U.; Gonçalves, F.; Pereira, J.M. Distribution and ecological preferences of diatoms and dinoflagellates in the west Iberian Coastal zone (North Portugal). Acta Oecologica 2007, 32, 224–235. [Google Scholar] [CrossRef]
  33. McNaughton, S.J. Relationships among Functional Properties of Californian Grassland. Nature 1967, 216, 168–169. [Google Scholar] [CrossRef]
  34. Pianka, E.R. The structure of Lizard communities. Annu. Rev. Ecol. Syst. 1973, 4, 53–74. [Google Scholar] [CrossRef]
  35. Capblancq, T.; Forester, B. Redundancy Analysis (RDA): A Swiss Army knife for landscape genomics. Methods Ecol. Evol. 2021, 12, 2298–2309. [Google Scholar] [CrossRef]
  36. Liu, Y.; An, R.Z.; Yang, H.; Zhang, Y.Q.; Chen, J.L.; Ma, W.Q.; Ba, S. Spatio-temporal distribution characteristics and driving factors of phytoplankton community in Lhalu Wetland, Tibet, China. J. Lake Sci. 2024, 36, 403–417. [Google Scholar]
  37. Ta, S.; Zhang, C.; Wang, W.L. Periphytic Algal Community Structure and Relationship to Environmental Factors in the Lower Reaches of Lhasa River. Hydroecol. Aquat. Biol. 2023, 47, 1168–1177. [Google Scholar]
  38. Gong, D.D.; Liu, D.F.; Zhang, J.L.; Yang, Z.J.; Zhu, X.M.; Tan, Q.R. Influence of Periodic Temperature Disturbance on the Succession of Algal Community Structure. Environ. Sci. 2016, 37, 2149–2157. [Google Scholar]
  39. Li, Y.X.; Yang, S.Q.; Ye, Q.Y.; Wan, K.M.; Deng, Y.T.; Zhao, T.; Dong, P.C.; Zhou, L.; Wang, J.N.; Wu, Z.X. Characteristics of Phytoplankton Community Structure in Lakes of Wetlands Dominated by Different Aquatic Plants and Its Driving Factors. Environ. Sci. 2024, 45, 5811–5821. [Google Scholar]
  40. Feinsinger, P.; Spears, E.E.; Poole, R.W. A Simple Measure of Niche Breadth. Ecology 1981, 62, 27–32. [Google Scholar] [CrossRef]
  41. Melo-Merino, S.M.; Reyes-Bonilla, H.; Lira-Noriega, A. Ecological Niche Models and Species Distribution Models in Marine Environments: A Literature Review and Spatial Analysis of Evidence. Ecol. Model. 2020, 415, 108837. [Google Scholar] [CrossRef]
  42. Song, Y.Y.; Guo, Y.; Liu, H.; Zhang, G.; Zhang, X.; Thangaraj, S.; Sun, J. Water Quality Shifts the Dominant Phytoplankton Group from Diatoms to Dinoflagellates in the Coastal Ecosystem of the Bohai Bay. Mar. Pollut. Bull. 2022, 183, 114078. [Google Scholar] [CrossRef]
  43. Kling, J.D.; Lee, M.D.; Xu, F.; Phan, M.D.; Wang, X.; Qu, P. Transient Exposure to Novel High Temperatures Reshapes Coastal Phytoplankton Communities. ISME J. 2020, 14, 413–424. [Google Scholar] [CrossRef]
  44. Xu, T.T.; Zhao, W.; He, Z.Q.; Liu, Y.L.; Yu, H.X.; Chai, F.Y.; Wang, H.C. Correlation Analysis of Water Ecological Environment Factors in Sturgeon Intensive Culture. Adv. Mar. Sci. 2022, 9, 39–53. [Google Scholar]
  45. Luan, Q.S.; Sun, J.; Song, S.Q.; Shen, Z.L.; Yu, Z.M. Canonical Correspondence Analysis of Summer Phytoplankton Community and Its Environment in the Yangtze River Estuary, China. Chin. J. Plant Ecol. 2007, 31, 445–450. [Google Scholar]
  46. De Baar, H.J.W.; Boyd, P.W.; Coale, K.H.; Landry, M.R.; Tsuda, A.; Assmy, P.; Bakker, D.C.E.; Bozec, Y.; Barber, R.T.; Brzezinski, M.A.; et al. Synthesis of iron fertilization experiments: From the Iron Age in the Age of Enlightenment. J. Geophys. Res. Ocean. 2005, 110, C09S16. [Google Scholar] [CrossRef]
  47. Qu, N.; Deng, J.M.; Zhang, Z.; Cai, Y.J.; Gong, Z.J.; Li, M. Community Structure of Phytoplankton and Environmental Impact Factors in Lake Hongze from 2015 to 2020. Environ. Sci. 2022, 43, 3097–3105. [Google Scholar]
  48. Wei, Z.; Chai, Y.; Luo, J.; Guo, K.; Tan, F.; Yang, D.; He, Y. Long Lake Phytoplankton Dominant Species Seasonal Succession and Ecological Niche Analysis. Aquat. Sci. 2020, 44, 612–621. [Google Scholar]
  49. Luo, D.; Li, Z.; Zhao, M.M.; Hu, Q.; Zhou, R.; Rong, J.; Li, L. Combined effects of light and nutrient supply on primary producers in subtropical shallow lakes: A microcosm study. Acta Ecol. Sin. 2024, 44, 10639–10649. [Google Scholar] [CrossRef]
Figure 1. Sampling sites in the middle and upper reaches of the Yarlung Zangbo River.
Water 17 01346 g001
Figure 2. Occurrence frequency (fi) and dominance (Y) of phytoplankton species relative to elevation in the Yarlung Zangbo River.
Water 17 01346 g002
Figure 3. Niche width (Bi) of dominant phytoplankton species relative to elevation asl in the middle and upper reaches of the Yarlung Zangbo River.
Water 17 01346 g003
Figure 4. Niche overlap (Oik) of dominant species of phytoplankton in the middle and upper reaches of the Yarlung Zangbo River relative to season. Notes: The color and size of the circles in the figure indicate the degree of ecotope overlap. Color: light yellow to dark brown, the darker the color the higher the overlap. Size: the larger the circle, the higher the overlap value.
Water 17 01346 g004
Figure 5. (a) Niche overlap values (Oik) of dominant species of phytoplankton community in the upper and middle reaches of the Yarlung Zangbo River at an elevation greater than 4500 m. (b) Niche overlap values (Oik) of dominant species of phytoplankton community in the upper and middle reaches of the Yarlung Zangbo River at >4000 to 4500 m. Notes: The color and size of the circles in the figure indicate the degree of ecotope overlap. Color: light yellow to dark brown, the darker the color the higher the overlap. Size: the larger the circle, the higher the overlap value.
Water 17 01346 g005
Figure 6. (a) Niche overlap values (Oik) of dominant species of phytoplankton community in the upper and middle reaches of the Yarlung Zangbo River at 3500–4000 m. (b) Niche overlap values (Oik) of dominant species of phytoplankton community in the upper and middle reaches of the Yarlung Zangbo River at 3500 m (Oik). Notes: The color and size of the circles in the figure indicate the degree of ecotope overlap. Color: light yellow to dark brown, the darker the color the higher the overlap. Size: the larger the circle, the higher the overlap value.
Water 17 01346 g006
Figure 7. Redundancy analysis ordination diagram of predominant phytoplankton species. WT = water temperature; DO = dissolved oxygen; CON = conductivity; SALT = salinity; TDS = total dissolved solids. SP1: Ulnaria acus; SP2: Tabellaria flocculosa; SP3: Fragilaria capucina; SP4: Cymbella tumida; SP5: Cymbella affinis; SP6: Cymbella cistula; SP7: Cymbopleura austriaca; SP8: Caloneis silicula; SP9: Chlorella vulgaris; SP10: Phacotus lenticularis; SP11: Navicula radiosa; SP12: Navicula cryptocephala; SP13: Nitzschia acicularis; SP14: Epithema adnata; SP15: Diploneis oblongella; SP16: Amphora ovalis.
Water 17 01346 g007
Figure 8. NMDS analysis ordination diagram of predominant phytoplankton species. (a) NMDS analyses ordination diagram of predominant phytoplankton species during different sampling periods. (b) NMDS analyses ordination diagram of predominant phytoplankton species during different elevations.
Water 17 01346 g008
Table 1. Seasonal phytoplankton community structure by percent proportion in the middle and upper reaches of the Yarlung Zangbo River.
April %September %
Bacillariophyta87.0693.80
Chlorophyta11.723.96
Cyanobacteria1.221.60
Euglenophyta-0.32
Cryptophyta-0.32
Table 2. Occurrence frequency (fi) and dominance (Y) of phytoplankton species with respect to season in the Yarlung Zangbo River.
Dominant SpeciesAprilSeptember
fiYfiY
Ulnaria acus0.8570.0340.7860.063
Tabellaria flocculosa0.7140.021//
Fragilaria capucina10.025//
Cymbella tumida0.9290.0230.9290.065
Cymbella affinis0.8570.026//
Cymbella cistula10.0370.8570.033
Cymbopleura austriaca10.024//
Amphora ovalis//0.7860.027
Diploneis oblongella//0.50.025
Caloneis silicula10.0410.8570.06
Navicula radiosa//0.5710.02
Navicula cryptocephala//0.7140.021
Nitzschia linearis//0.8570.036
Epithema adnata//0.9290.031
Chlorella vulgaris10.059//
Phacotus lenticularis0.7860.043//
Notes: “/” indicates that the species is not dominant in this month.
Table 3. Niche width (Bi) of dominant phytoplankton species relative to season in the middle and upper reaches of the Yarlung Zangbo River.
Dominant SpeciesBi
AprilSeptember
Ulnaria acus1.000 1.000
Tabellaria flocculosa3.226 /
Fragilaria capucina1.000 /
Cymbella tumida1.000 2.000
Cymbella affinis4.907 /
Cymbella cistula8.346 2.000
Cymbopleura austriaca1.000 /
Amphora ovalis/5.765
Diploneis oblongella/1.000
Caloneis silicula3.240 1.000
Navicula radiosa/1.000
Navicula cryptocephala/7.000
Nitzschia linearis/1.000
Epithema adnata/1.000
Chlorella vulgaris2.000 /
Phacotus lenticularis1.000 /
Notes: “/” indicates that the species is not dominant in this month.
Table 4. Development and recession (negative values) of dominant species in the sampling periods in the middle and upper reaches of the Yarlung Zangbo River.
Dominant SpeciesAprilSeptember
Ulnaria acus−0.173−0.266
Tabellaria flocculosa−0.046-
Fragilaria capucina0.369-
Cymbella tumida0.1200.152
Cymbella cistula0.1270.106
Cymbella affinis0.167-
Cymbopleura austriaca0.014-
Amphora ovalis-0.120
Navicula radiosa-0.023
Navicula cryptocephala-−0.130
Caloneis silicula−0.3620.116
Diploneis oblongella-0.013
Nitzschia acicularis-0.065
Epithema adnata-−0.227
Chlorella vulgaris0.126-
Phacotus lenticularis−0.956-
Notes: - indicates species not dominant at the sampling time. Negative values represent a declining trend in the species, and positive values represent a developing trend in the species.
Table 5. Expansion and decline of dominant species with respect to elevation in the middle and upper reaches of the Yarlung Zangbo River.
Species>4500 m4000–4500 m3500–<4000 m<3500 m
AprilSeptemberAprilSeptemberAprilSeptemberAprilAutumn
Ulnaria acus−0.0590.016/0.048/0.024−0.184/
Fragilaria tenera/−0.161//////
Ulnaria ulna/////0.022//
Ulnaria biceps//0.0040.047/0.024/0.030
Fragilaria capucina//0.004/0.019/0.020−0.204
Staurosira construens//////0.037/
Cymbella tumida/0.124/−0.0220.022//0.014
Epithemia turgida////−0.039///
Cymbopleura naviculiformis//0.004/////
Cymbella parva0.087/0.003////0.030
Cymbella affinis0.165///0.029///
Cymbella cistula0.1020.0630.004/−0.0480.024//
Cymbopleura austriaca0.040/0.003/////
Cymbella laevis////0.032///
Cymbella lanceolata−0.023/0.003/0.019//0.030
Amphora ovalis0.2660.0470.003/////
Pinnularia gentilis//0.004/////
Navicula rhynchocephala/////−0.188//
Navicula radiosa///////−0.029
Navicula cryptocephala/−0.132/////0.030
Placoneis exigua////0.031///
Craticula cuspidata//0.003/////
Frustulia vulgaris0.149/0.004/////
Caloneis silicula−0.1240.0440.0030.036///0.014
Diploneis oblongella−0.150−0.057/0.029////
Gomphonema gracile//0.004/////
Gomphonema truncatum var. turgidum /0.1060.004/0.019/−0.0310.030
Nitzschia microcephala///−0.045////
Cylindrotheca closterium//0.004/////
Nitzschia acicularis/////0.024//
Nitzschia linearis/0.056/−0.012/0.0240.033/
Nitzschia sublinearis//0.004/0.031/0.035/
Diatoma vulgare// ///0.034/
Diatoma vulgare var.//////−0.038/
Diatoma tenue////0.0130.0240.016/
Tabellaria sp.///−0.022−0.088/0.036/
Tabellaria flocculosa////−0.123/0.032/
Tabellaria fenestrata////0.019///
Gogorevia exilis////0.031/0.0200.030
Iconella splendida///////0.030
Epithema adnata/−0.106///0.022/0.037
Phacotus lenticularis−0.452/−0.025/////
Chlorella vulgaris//−0.033/0.034/−0.007/
Ankistrodesmus falcatus///////0.030
Oocystis borgei///////−0.069
Notes: “/” indicates that the species was not dominant during the sampling period at this elevation. Negative values represent a declining trend in the species, and positive values represent a developing trend in the species.
Table 6. Mean of selected environmental factors relative to season in the middle and upper reaches of the Yarlung Zangbo River.
Sampling
Period
Water Temperature
(°C)
pHDissolved Oxygen
(mg/L)
Conductivity
(μs/cm)
Salinity
(ppt)
Total Dissolved Solids
(mg/L)
April8.58 ± 0.74 a8.40 ± 0.137.66 ± 0.27291.96 ± 19.99 a0.13 ± 0.01144.26 ± 9.79 a
September13.71 ± 0.78 b8.42 ± 0.057.09 ± 0.53232.36 ± 18.89 b0.11 ± 0.01113.86 ± 9.20 b
Note: Different superscripts letters indicate significant differences (p < 0.05).
Table 7. Selected water quality factors with respect to elevation in middle and upper reaches of the Yarlung Zangbo River.
>4500 m4000–4500 m3500–<4000 m<3500 m
AprilSeptemberAprilSeptemberAprilSeptemberAprilSeptember
WT (°C)6.92 ± 0.85 e11.91 ± 0.82 de9.55 ± 1.05 bcd15.25 ± 0.15 cd11.60 ± 0.70 bcd15.60 ± 1.50 abc11.20 ± 0.60 ab17.50 ± 0.80 a
pH8.69 ± 0.09 a8.47 ± 0.07 bc8.01 ± 0.40 ab8.41 ± 0.01 c8.44 ± 0.11 ab8.38 ± 0.15 ab7.62 ± 0.13 ab8.30 ± 0.07 ab
DO (mg/L)7.83 ± 0.43 ab6.43 ± 0.11 b6.95 ± 0.15 ab10.15 ± 3.75 ab7.65 ± 0.55 b6.80 ± 0.30 a7.75 ± 0.85 b6.95 ± 0.15 b
CON (μs/cm)253.47 ± 20.96 cd194.29 ± 8.56 a405.00 ± 1.00 a340.00 ± 2.00 bcd360.00 ± 2.00 d326.00 ± 43.00 ab265.00 ± 0.05 abc183.35 ± 0.15 d
SALT (ppt)0.01 ± 0.01 bc0.09 ± 0.003 a0.19 ± 0.01 b0.15 ± 0.001 bc0.15 ± 0.02 c0.16 ± 0.02 ab0.12 ± 0.01 ab0.09 ± 0.01 c
TDS (mg/L)125.21 ± 10.09 cde94.63 ± 3.75 a198.50 ± 3.50 a165.00 ± 1.00 bcd180.00 ± 1.00 de162.00 ± 20.00 ab130.50 ± 1.50 abc91.55 ± 0.45 e
Notes: Different superscripts letters within a row indicate significant differences (p < 0.05). WT = water temperature, DO = dissolved solids, CON = conductivity, SALT = salinity, TDS = total dissolved solids.
Disclaimer/Publisher’s Note: The statements, opinions and data contained in all publications are solely those of the individual author(s) and contributor(s) and not of MDPI and/or the editor(s). MDPI and/or the editor(s) disclaim responsibility for any injury to people or property resulting from any ideas, methods, instructions or products referred to in the content.

