Abstract
Microcystins (MCs) are produced by cyanobacteria blooms in eutrophic water and can cause acute and chronic toxicity and even mortality to animals and humans. Previous MC removal strategies concernedonly highly contaminated water, in which the concentration of the pollutant was considerably larger than that in the natural world. In this study, we developed a composite of TiO2-coated magnetic carbon microtube (C-TiO2-Fe3O4) and used it as a photocatalyst to efficiently remove microcystin-LR (MC-LR) from water under visible light from water. And the huge surface of the carbon microtube dramatically boosted the adsorbability and charge mobility, which lowered the recombination rate of electron–hole pairs, and hence systematically enhanced photocatalytic activity. The combination of adsorption and photodegradation endowed the composite with a better performance in the removal of trace amounts of MC-LR than the C-TiO2. It was found that increasing the contact time and catalyst dosage, acidic environment, and lower initial MC-LR concentration had positive effects on MC-LR removal. The optimum reaction conditions of C-TiO2-Fe3O4 was a reaction time of 12.68 min, a catalyst dosage of 0.39 g·L−1, and a pH of 7.72. The C-TiO2-Fe3O4 (surface area normalized apparent reaction rate constants K/SBET = 1.2 × 10⁻⁴) presented a higher reaction rate than C-TiO2 (K/SBET = 8.4 × 10⁻⁵). Moreover, the stable removal capability of C-TiO2-Fe3O4 was confirmed over multiple cycles. Finally, the ecological safety performance was also evaluated after visible light illumination. This work paves the way for the development of more efficient and easily separable purifiers for the removal of pollutants and toxins from contaminated water.
1. Introduction
Microcystins (MCs), which is a kind of cyclic heptapeptide, are the most common cyanotoxins in eutrophic water, particularly their derivatives known as microcystin-LR (MC-LR) [1]. These toxins can damage the nervous system or liver and thus cause acute and chronic toxicity and even death in humans and animals [2]. Various methods have been used to remove MCs, but traditional water treatment processes (e.g., adsorption, flocculation, and advanced oxidation processes) have proven to be less effective in removing these toxins due to their chemical stability and tolerance to pH. Among the methods, adsorption has the advantages of simple operation, low cost, and high efficiency [3]. However, adsorbent regeneration and the secondary pollution are the challenges in using activated carbon [4], zeolite [5], graphene [6], fly ash [7], clay minerals [8], and so on. Advanced oxidation processes (AOPs) are a reasonable choice for the removal of organic pollutants in water, especially the heterogeneous photocatalysis degradation mediated by titanium dioxide (TiO2) [9]. TiO2 has been inspired in water purification with high photocatalytic efficiency and chemical stability [10]. However, the application of TiO2 is limited by its low quantum efficiency, poor adsorptive capacity, narrow light absorption range, and difficulty in separating from water.
Over the last decade, various methods have been developed to suppress the recombination of photogenerated electron–hole pairs in TiO2. TiO2 nanoparticles were also loaded on carbon nanotubes (CNTs) to improve the removal of organic pollutants. Chen et al. [11] found that the microwave-induced preparation of CNTs presented high removal efficiency of methyl orange, methyl parathion, sodium dodecyl benzene sulfonate, and bisphenol A. Carbon microtubes (CMTs) have a tubular structure similar to CNTs and better electrochemical performance and stability than that of CNTs. The CMT also makes up for problems such as a small diameter, surface defects, and the serious agglomeration of CNTs. Biomass has been widely used as raw material to prepare CMTs, such as loofah sponge [12], cattail fibers [13], waste wood [14], and corncob [15]. Corncob presents a certain adsorption capacity for heavy metals and organics in sewage water [16,17]. The micron-sized tubular structure of corncob displayed good protection and stability for TiO2, making TiO2 distribute more uniformly with enhanced degradation efficiency. Therefore, the CMT prepared by corncob may be a superior carrier for TiO2, which also could be used to realize the resource utilization of agricultural waste.
An additional filtration step was required to remove the catalyst in traditional TiO2 water treatment [18]. In order to address this issue, magnetic separation has been developed into one of the most effective methods for separating and recovering TiO2 nanoparticles from water [19]. Fe3O4 is one of the most widely used magnetic catalysts [20]. Jiao et al. [21] prepared core–shell Fe3O4 @ SiO2/TiO2, which could be quickly recovered under an external magnetic field. Another TiO2-@ignocellulosic biomass @ Fe3O4 composites, showed high magnetic response, adsorption capacity, and charge mobility, thus reducing the recombination of electron–hole pairs and enhancing the photocatalytic performance [22]. So Fe3O4 could be used to enhance the photocatalytic performance and recovery rate of TiO2.
In this study, a new type of magnetic photocatalyst that TiO2 and Fe3O4 were loaded on the CMT was prepared by corncob powder (C-TiO2-Fe3O4) for the degradation of MC-LR under visible light. The prepared photocatalysts were characterized by thermal gravimetric analyzer (TGA), X-ray diffraction (XRD), scanning electron microscope (SEM), Fourier transform infrared spectrometer (FTIR), Brunauer–Emmett–Teller (BET), and photocatalytic performance. The effect of pH, catalyst dosage, initial MC-LR concentration, and reaction time on the MC-LR degradation was studied. The response surface methodology (RSM) was used to optimize operating conditions of the catalytic process, and the mechanism of C-TiO2-Fe3O4 that photodegrades MC-LR was studied.
2. Materials and Methods
2.1. Material
Corncob powder within 300 mesh size was purchased from Lianyungang Surui Straw Processing Plant, China. Nitric acid (HNO3, CAS: 7697-37-2) was purchased from Shanghai Sinopharm Group Chemical Reagent Co., Ltd., Shanghai, China. Tetrabutyl titanate (CAS: 5593-70-4), FeCl3 (CAS: 7705-08-0), FeSO4 (CAS: 10028-22-5), methanol (CAS: 67-56-1), ethanol (CAS: 64-17-5), acetonitrile (CAS: 75-05-8), acetic acid (CAS: 64-19-7), trifluoroacetic acid (CAS: 76-05-1), isopropanol (CAS: 67-63-0), hydroquinone (CAS: 123-31-9), sodium oxalate (CAS: 62-76-0), silicon dioxide (SiO2, CAS: 14808-60-7), humic acid (HA, CAS: 1415-93-6), fulvic acid (FA, CAS: 479-66-3), sodium hydroxide (NaOH, CAS: 1310-73-2), and hydrochloric acid (HCl, CAS: 7647-01-0) were purchased from Shanghai Aladdin Biochemical Technology Co., Ltd., Shanghai, China. MC-LR and microcystin-RR (MC-RR, CAS: 111755-37-4) were purchased from Shanghai Yuanye Biotechnology Co., Ltd., Shanghai, China. Polystyrene with particle size of 70 μm (PS-70 μm) was purchased from Jiangsu Zhichuan Technology Co., Ltd., Nantong, China.
2.2. Preparation of Photocatalysts
2.2.1. Preparation of CMT
The pretreatment of corncob powder was performed according to the method in our previous work [23]. Corncob powder (8 g) was mixed with 1 mL of 4 wt.% CTAB solution and 1 mL of 2 wt.% Ni(NO3)2 solution to form a paste. The paste was then dried at 100 °C in an oven to yield a dry corncob paste. Meanwhile, an adhesion agent was prepared by adding 3 mL of 10 wt.% ethylene glycol to 7 mL of 66 wt.% phenolic resin ethanol solution. Five grams of the dry corncob paste was then added to 5 mL adhesion agent followed by thorough mixing to yield a ‘wet cake’ and calcined by heating for 3 h in a 160 °C oven. The product was marked as CC.
The corncob (10 g) was first mixed with 200 mL of 0.1 mol L−1 HNO3 and stirred with 24 h. After being washed with water three times, the product was dried at 100 °C in an oven to obtain the acidified corncob powder. Then, the acidified corncob powder (8 g) was mixed with 1 mL of 4 wt.% CTAB solution and 1 mL of 2 wt.% Ni(NO3)2 solution to form a paste, respectively. The paste was then dried at 100 °C in an oven to yield a dry corncob paste. Meanwhile, an adhesion agent was prepared by adding 3 mL of 10 wt.% ethylene glycol to 7 mL 66 wt.% phenolic resin ethanol solution. Five grams of the dry corncob paste was then added to 5 mL adhesion agent followed by thorough mixing to yield a ‘wet cake’ and dried by heating for 3 h in a 160 °C oven. The product was marked as AC.
The mixture solution of AC with 0.01 mol·L−1 mixed with cetyltrimethyl ammonium bromide with a solid–liquid ratio of 1:1 was fully stirred and then dried in an oven at 60 °C for 6 h and calcined at 600 °C, 700 °C, and 800 °C for 3 h with increasing rate of 5 °C min−1 in high-purity nitrogen in a muffle furnace. The corncob-based microtube (CMT) was then synthesized, collected, and marked as CMT 600, CMT 700, and CMT 800, respectively.
2.2.2. Preparation of C-TiO2
0.01 mol of tetrabutyl titanate was added into 30 mL ethanol solution, and, then, 3 mL of 10% nitric acid was dropwise added. Then, 3 g of CMT was added and stirred for 1 h. The mixture was dried in an oven at 80 °C for 12 h and heated to 500 °C, 700 °C, and 900 °C for 3 h in the muffle furnace to obtain a double-layer photocatalyst C-TiO2 with a loading ratio of 4%.
After determining the optimum temperature, 1 wt.%, 2 wt.%, and 8 wt.% C-TiO2 were obtained by changing the amount of tetrabutyl titanate to 0.0025, 0.005, 0.02 mol at the optimum temperature for 3 h.
2.2.3. Preparation of C-TiO2-Fe3O4
A total of 0.46 g C-TiO2 (900 °C, 2 wt.%) was added to 30 mL of deionized water for ultrasonication for 30 min; then, 0.002 mol of FeCl3·6H2O and 0.001 mol of FeSO4·7H2O were added. The pH was adjusted to 10 with 0.1 M of NaOH, and, then, the mixture was stirred for 30 min. The obtained mixture was ultrasonicated for 30 min and then put into a hydrothermal reactor. The mixture was calcined at 150 °C for 12 h in the muffle furnace with increasing rate of 5 °C min−1 and then washed with deionized water. The C-TiO2-Fe3O4 was obtained after being dried at 60 °C for 6 h in the oven.
2.3. Photocatalytic Process
The prepared photocatalyst with concentration of 0.2 g·L−1 was added to 10 mL of MC-LR with concentration of 500 μg·L−1 and put into the photocatalytic reactor (Figure S1 in Supplement Information, SI). First, the photocatalytic system was stirred for 30 min at a speed of 500 rpm in the dark, and, then the 200 W xenon lamp was turned on for 30 min. The samples were taken every 5 min. After filtration by 0.22 μm filter membrane, the concentration of MC-LR was analyzed by high-performance liquid chromatography (HPLC, HITACHI, Chromaster, Japan). The samples were separated on a C18 column (Waters, 150 × 4.6 mm). The mobile phase was acetonitrile and 0.1% trifluoroacetic acid micro-pure water. The volume ratio was eluted from the initial 70:30 to 60:40, and the wavelength was set to 238 nm. The total operation time was 15 min (flow rate: 1 mL·min−1). The degradation rate of MC-LR was determined by the following equation:
where C0 and Ct represent the initial concentration and residual concentration of MC-LR (μg·L−1), respectively. The identification of MC-LR and its intermediates were carried out in positive ion model using high performance liquid chromatography-mass spectrum (HPLC-MS, Agilent HPLC 1260, Santa Clara, CA, USA) under the above conditions.
The effects of reaction time, pH, dosage, and initial MC-LR concentration on the adsorption and photocatalytic degradation of MC-LR were studied. The effect of HA, FA, MC-RR, SiO2, and PS-70 μm in natural water on the photocatalytic degradation of MC-LR by C-TiO2 and C-TiO2-Fe3O4 were investigated, and the reaction mechanism of photocatalytic process was studied by quenching experiment using isopropanol, p-benzoquinone, and sodium oxalate.
Finally, the stability of C-TiO2 and C-TiO2-Fe3O4 in the photocatalytic process was evaluated by reusing the catalyst five times. After each operation, C-TiO2 and C-TiO2-Fe3O4 were recovered by centrifugation and magnetic separation, respectively.
2.4. Characterization Methods
The thermal stability and composition of photocatalyst were studied by TGA of catalyst, which was tested by NETZSCH TG 209 with temperature range from room temperature to 800 °C with heating rate of 2 °C min−1. The phase of the prepared photocatalyst was tested by XRD with D/max 2550 X-ray diffractometer (Riguaku Smartlab, Tokyo, Japan) with Cu Kα (λ = 0.15406 nm) and diffraction angle from 3° to 70°. The microstructure of catalyst was analyzed by SEM with Hitachi, Japan, model SU 8010 with working voltage of 3 kV. Surface hydroxyl content of catalyst was determined by Boehm titration [24]: 0.5 g photocatalyst was dispersed in a mixture solution of 100 mL of ethanol and NaCl with fully stirred at 25 °C for 4 h. The pH value of the obtained suspension was adjusted to 4.0 with 0.1 M HCl or NaOH standard solution, and, then, it was further titrated from 4.0 to 9.0 with 0.1 M NaOH standard solution. The surface hydroxyl content was calculated as follows:
where D (×1020·g−1) was the content of hydroxyl on the surface of the sample, C was the concentration of NaOH standard solution (mol·L−1), V was the volume of NaOH solution (mL) consumed when the pH value was adjusted from 4.0 to 9.0, NA was the Avogadro constant, and W was the mass of the samples (g).
The isopropanol (IPA), sodium oxalate (SO), and p-benzoquinone (BQ) were used to quench the radicals of hydroxyl radical (·OH), photogenerated holes (h+), and superoxide radical (·O2−) in the photocatalytic reaction system. The generation of ·OH and ·O2− was detected by electron spin-resonance spectroscopy (ESR, Brucker EMXplus ER-4119-HS, Munich, Germany). The ESR of X-band at 9 GHz was obtained on a high-sensitivity vertical mode cavity. The conditions were as follows: the central field is 3510 G; scan width is 100 G; modulation frequency is 100 kHz; and microwave power is 20 mW. Reliable signal-to-noise ratio was obtained after 5–10 scans. 5, 5-dimethyl-1-pyrrolin-N-oxide (DMPO) was used as the radical trapping agent. After adding 100 μL of DMPO to photocatalyst, the catalytic reaction began for 60 min to prepare the sample. The sample was placed in a cylindrical quartz reaction unit to measure the ESR of C-TiO2-Fe3O4.
The specific surface area of the photocatalyst was tested by BET (AUTOSORB-IQ-MP, US). All data were analyzed by Quantachrome ASiQWin (version 3.01). Functional groups of catalyst was analyzed by FTIR (Thermo Scientific Nicolet 6700, Waltham, MA, USA). The sample was dried at 100 °C for 10 h before analysis, and the wave number range was 400–4000 cm−1. UV-3600 spectrophotometer (Shimadzu, Kyoto, Japan) was employed for UV–VIS diffuse reflection spectroscopy (DRS) at wavelengths of 200–900 nm. The concentration of leached metal ions of the photocatalyst after the degradation was measured by inductively coupled plasma atomic emission spectroscop (ICP-AES, Optima 2000, PerkinElmer Co., Ltd., USA). Then, RSM was used to optimize the operating conditions (Tables S1 and S2).
2.5. Ecological Safety Method
The rotifers were collected from the Wenruitang River (Wenzhou University, Wenzhou, China) in the school. The frozen concentrated chlorella nutrient solution was provided by the light macroalgae species. The rotifers were purified and expanded, and they were fed with the concentrated chlorella nutrient solution. Feed 1 mL of nutrient solution per liter, feed once a day, change the seawater every three days, change the water by 30%, and carry out stable continuous culture under laboratory conditions.
The experiment was divided into 6 groups, which were blank control group (CK group) only fed with concentrated algae solution, and 5 different concentration treatment groups (100 μg/L group, 200 μg/L group, 300 μg/L group, 400 μg/L group, and 500 μg/L group) of MC-LR after photocatalytic treatment by C-TiO2-Fe3O4 with 100 μg/L, 200 μg/L, 300 μg/L, 400 μg/L, and 500 μg/L, respectively. Each group was set up with 3 parallels experiment. The culture container was a 2 L conical glass bottle with a water temperature of 23–25 °C, and the whole process was cultured in indoor natural light.
The 5 mL of rotifer culture solution from each conical flask was drawn each 24 h, and methanol solution for fixation was added. Then, the number of adults and larvae in the culture solution was counted and repeated 3 times.
2.6. Statistical Analysis
Statistical analysis was carried out using the SPSS 17.0 package. One-way analysis of variance (ANOVA) with a multiple post hoc (Tukey) test (significance level is 0.05) was used to check the significant difference among the different treatments. All data were shown as the mean of 3 replicates.
3. Results
3.1. Characterization
3.1.1. Chemical Composition Analysis
The thermal stability of corncob can be analyzed by TGA (Figure S2a). The mass of corncob powder decreased by 8% from room temperature to 150 °C, indicating that the adsorbed water content in corncob powder was 8%. And, then, the quality of corncob powder began to decline slowly to 190 °C, representing that the organic matter in corncob powder began to ash, and rapidly decreased to 33% in the range of 230–400 °C. In the subsequent temperature, the mass of corncob powder gradually tends to be stable and then stabilizes at about 23%, indicating that the content of organic matter in corncob powder was about 69%, and the remaining 23% was the inorganic matter that could not be ashed. According to the differential thermal analysis (DTG) curve (Figure S2b), there were two endothermic peaks in the range from room temperature to 300 °C and then four exothermic peaks with the increase in temperature to 800 °C, indicating that the ashing was an endothermic and then exothermic process. This result showed that corncob powder could remove 8% of the adsorbed water above 150 °C, and ash 69% of the organic matter above 450 °C.
The XRD patterns of the fabricated composites are shown in Figure 1a. The CC presented the amorphous phase of carbon. As SiO2 could not react with nitric acid, the SiO2 crystal was retained and increased significantly after the acidification in AC. There were sharp SiO2 characteristic diffraction peaks in the XRD, which were corresponding to 2θ = 20.86° (d100), 26.64° (d011), 50.14° (d211), and 59.96° (d121) (JCPDF # 74-1811), respectively. According to the TGA and DTG results, the corncob powder was stable when the temperature was above 500 °C. Therefore, 600 °C, 700 °C, and 800 °C were selected for CMT preparation.

Figure 1.
(a) XRD patterns of CC, AC, CC 800, CMT 600, CMT 700, CMT 800, TiO2, C-TiO2 (900 °C, 2 wt.%), and C-TiO2-Fe3O4. (b) Nitrogen adsorption–desorption isotherms and (c) corresponding pore size distribution curves of CC, AC, CC 800, CMT, TiO2, and C-TiO2 (900 °C, 2 wt.%). (d) Nitrogen adsorption–desorption isotherms of C-TiO2 with different calcination temperature and mass percentage. (e) FTIR patterns of TiO2, C-TiO2, and C-TiO2-Fe3O4. (f) DRS patterns of TiO2, Fe3O4, C-TiO2, and C-TiO2-Fe3O4 (Notes: CC 800 was the corncob calcined by 800 °C).
The characteristic diffraction peak of SiO2 was retained in C-TiO2 and C-TiO2-Fe3O4. C-TiO2 contained the characteristic diffraction peak of TiO2 that 2θ = 25.30° (d101), 37.79° (d004), 48.04° (d200), 53.89° (d105), and 62.11° (d213) (JCPDF # 86-1157), and C-TiO2-Fe3O4 contained the characteristic diffraction peak of Fe3O4 that 2θ = 35.43° (d311), 43.05° (d400), and 56.94° (d222) (JCPDF # 19-629). However, the main peak was shifted to higher 2θ when the CMT was loaded with TiO2 or Fe3O4, indicating that the crystal interplanar distance of SiO2 was reduced. In addition, the decrease in diffraction peak intensity may be due to the dilution of the crystal structure of SiO2 by doping with TiO2 or Fe3O4. The results showed that TiO2-Fe3O4 were successfully loaded on the CMT, respectively.
3.1.2. Brunauer–Emmett–Teller Analysis
Figure 1b,c show the nitrogen adsorption–desorption isotherms and pore size distribution curves of fabricated materials. The specific surface area, average pore size, and total pore volume were calculated (Table S3). The specific surface areas of CC and AC samples were comparable at 0.73 and 1.63 m2∙g−1, respectively. The specific surface areas of CC800 and CMT were 225.18 and 286.95 m2∙g−1, which increased rapidly under high-temperature calcination, thus providing more sites for photocatalytic materials. The specific surface area decreased with the TiO2 ratio increase from 1 wt.% to 8 wt.% (Figure 1d), which suggested that the destruction of pore structures were induced by excess TiO2, which could also be evidenced by the decrease in pore volume. Among them, C-TiO2 (900, 1 wt.%) and C-TiO2 (900, 2 wt.%) had a high specific surface area, which were 349.52 and 320.96 m2∙g−1, respectively. After loading with Fe3O4, the specific surface area of C-TiO2-Fe3O4 was reduced to 224.62 m2∙g−1.
3.1.3. Analysis of Surface Functional Groups
The surface functional groups of the prepared catalyst were analyzed by FTIR spectra (Figure 1f and Figure S3). For all samples, the wavenumber of 1632 cm−1 corresponded to the bending vibration spectrum of H2O [25], and the peak at 3436 cm−1 indicated the bending and stretching vibrations of the hydroxyl group (-OH) [26]. According to the FTIR spectra of TiO2, the absorption peaks at a wavenumber of 600–1000 cm−1 corresponded to Ti-O-Ti bands [27]. All samples displayed absorption bands of around 710 cm−1 except TiO2, which is a peak of carbon substance. The absorption bands in the range of 875–1035 cm−1 was related to the C-O stretching and ·OH deformation of the aliphatic carbon chains. The absorption band in the range of 1400–1425 cm−1 can be ascribed to the C-C/C=C skeletal vibrations. The C=O stretching vibration absorption peak of AC appeared at 1635 cm−1, which was caused by O-H bending vibration after the acidification of CC. C-TiO2-Fe3O4 has an absorption peak at 619 cm−1, which is the stretching vibration of Fe-O in the octahedral cell of Fe3O4. FTIR spectra confirmed the presence of TiO2, Fe3O4, and carbon substance in photocatalysts.
3.1.4. DRS Analysis
A DRS device was used to determine the reflectance spectra to obtain the optical response of the C-TiO2-Fe3O4 (Figure 1f). The bandgap of the samples was calculated by Equation (3):
where Eg is the bandgap energy (eV), h is the plank constant, c is the light velocity (m s−1), and λ is the wavelength (nm). The DRS spectra of TiO2, Fe3O4, C-TiO2, and C-TiO2-Fe3O4 are presented in Figure 1f. The DRS spectra of the nanocomposite indicated significant absorptions of C-TiO2 and C-TiO2-Fe3O4 at 420 nm and 385 nm, respectively. The bandgap energies of C-TiO2 and C-TiO2-Fe3O4 were 2.02 and 2.37 eV, respectively. According to the results, the bandgap energy of C-TiO2-Fe3O4 was lower than that of TiO2 (3.52 eV), which shows a red shift in the spectra following the C-TiO2-Fe3O4 formation, extending the range of UV light to UV–VIS light [25]. Moreover, the electron–hole recombination in the C-TiO2-Fe3O4 was prevented, causing an increase in the electron density. Therefore, the visible light absorption of C-TiO2-Fe3O4 is improved.
3.1.5. Micromorphology Analysis
The surface morphology of CC, AC, and CMT prepared at different temperatures was analyzed. CC had a micron tubular structure with smooth inner walls (Figure 2a). After acidification, the tubular structure of AC became rough (Figure 2b) due to the organic matter that was oxidized and dehydrated. The surface folds of CC 800 were increased after high-temperature treatment (Figure 2c). However, the tubular structure was not completely destroyed, which indicates that acidification and calcination had little damage on the tubular microstructure of corncob powder. The surface of the CMT (Figure 2d–f) became rougher with the increase in temperature. Therefore, the CMT prepared at 800 °C was selected to load TiO2 and TiO2-Fe3O4 for subsequent adsorption and catalysis process.
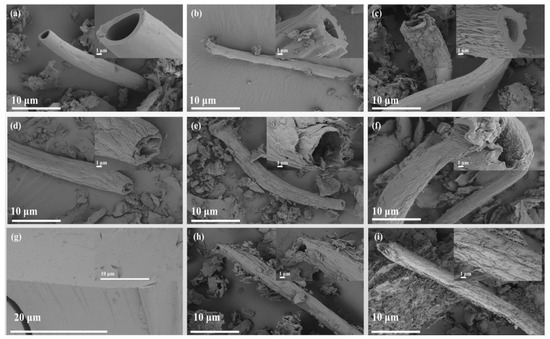
Figure 2.
SEM patterns of CC (a), AC (b), CC 800 (c), CMT 600 (d), CMT 700 (e), CMT 800 (f), TiO2 (g), C-TiO2 with calcination temperature of 900 °C and mass percentage of 2 wt.% (h) and C-TiO2-Fe3O4 (i).
There were many spherical particles present on the surface of the CMT, indicating that C-TiO2 and C-TiO2-Fe3O4 were successfully loaded on the CMT. When loaded with 4 wt.% TiO2, the surface of C-TiO2 became much rougher with the increase in temperature (Figure S4a–c), which was consistent with the morphological changes in CMTs prepared at different temperatures. When the preparation temperature was maintained at 900 °C, the spherical particles on the surface of C-TiO2 increased with the increase in the loading of TiO2 (1–8 wt.%). It can be seen that the particles covered the surface of the CMT with the loading of 4 wt.% (Figure S4c) and 8 wt.% (Figure S4f) but may reduce the specific surface area of C-TiO2. However, there were less spherical particles on the surface of C-TiO2 loaded with 1 wt.% (Figure S4d), which had no effect on the specific surface area of the CMT. Pure TiO2 (Figure 2g) showed a smooth crystalline surface. At the same time, spherical particles and strip-like aggregates could be seen on the surface of C-TiO2-Fe3O4 that was loaded with TiO2 and magnetic Fe3O4 (Figure 2i and Figure S5).
3.1.6. Determination of Surface Hydroxyl Content
The surface hydroxyl content played an important role as active sites in the photocatalytic reaction. During the photocatalytic degradation, oxygen and organics were adsorbed at the active sites first. At the same time, photogenerated holes reacted with OH- ions to generate hydroxyl radicals with strong oxidability. Therefore, the surface hydroxyl content of the catalyst directly affected the photocatalytic efficiency [28]. It can be seen that the surface hydroxyl content of AC increased greatly after acidification treatment (Table S4), and that of the CMT further increased to 2.7692 × 10²⁰ ·g−1. When the CMT was loaded with TiO2, the surface hydroxyl content increased greatly from 0.9632 × 10²⁰ ·g−1 of pure TiO2 to 4.214 × 10²⁰ ·g−1 of C-TiO2 to 3.2508 × 10²⁰ ·g−1 of C-TiO2-Fe3O4. It can be speculated that the C-TiO2 may present the best photocatalytic performance due to the highest surface hydroxyl content of the catalyst.
3.2. Effect of Prepared Composites on MC-LR Degradation
The effect of prepared composites on MC-LR degradation is shown in Figure 3. MC-LR concentration remained unchanged without photocatalysts, so MC-LR could not be degraded under xenon lamp alone. In total, 7.5% of MC-LR was adsorbed by CC. The adsorption capacity of MC-LR could be further enhanced to 18% and 25% by AC and the CMT, respectively. Holes were generated after treatment by acidification and carbonization, and the increased specific surface area of the corncob resulted in enhanced adsorption performance [29]. Wu et al. [30] used ZnCl2 to modify corncob, which obtained the dye adsorption rate of 95%. Chen et al. [31] used KOH for the chemical dehydration and carbonization of corncob, which showed that the removal rate of Cu2+ in simulated wastewater could reach 99.62% by the treated corncob. At the same time, the adsorption equilibrium of MC-LR was achieved after stirring for 30 min under dark conditions, and there was no significant change in the MC-LR concentration within 30 min irradiation, indicating that CC, AC, and CMTs had no photocatalytic activity.
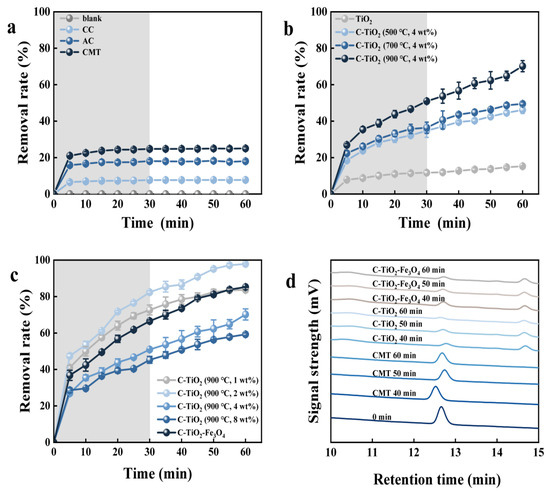
Figure 3.
Effect of different treatment methods of corncob powder (a) and C-TiO2 with different calcination temperatures (b) and mass percentages (c) on MC-LR degradation. The HPLC chromatogram of MC-LR in the photocatalytic degradation progress (d). Notes: grey background represents adsorption treatment in dark conditions before photocatalysis degradation process.
The xenon lamp excited a short wavelength light that could not stimulate the photoactivity of TiO2 that MC-LR concentration was adsorbed by 15% using pure TiO2 and remained unchanged after the light was turned on. The adsorption of MC-LR by C-TiO2 and C-TiO2-Fe3O4 was most obvious in the first 30 min (the linear plots of MC-LR adsorption by Freundlich and Langmuir adsorption models and the kinetic linear equations by C-TiO2 and C-TiO2-Fe3O4, respectively, can be seen in Figures S7 and S8 and Tables S6 and S7 [32,33]), and 30 min was selected as the dark treatment time for subsequent experiments. After 30 min irradiation, the MC-LR degradation rate of C-TiO2 (900 °C, 4 wt.%) was 70.1%, much higher than 46.1% of C-TiO2 (500 °C, 4 wt.%) and 49.5% of C-TiO2 (700 °C, 4 wt.%). When the TiO2 loading was further increased to 4 wt.% and 8 wt.%, the degradation rate decreased to 70.2% and 59.3%, respectively, which might be due to the excessive TiO2 particles that inhibited the absorption and light excitation by the prepared composite, which was also confirmed in SEM. The C-TiO2 (900 °C, 2 wt.%) with the best adsorption rate and photocatalytic performance could degrade 92.4% of MC-LR, which was used in the subsequent experiments.
Compared with TiO2, the visible light photocatalytic efficiency of C-TiO2 was enhanced by the hybridization between the CMT and TiO2. This was mainly due to the CMT that could be used as a photosensitizer or electron acceptor of TiO2, which has further increased the visible light response, surface area, and pore volume of C-TiO2 [34]. Compared with C-TiO2, the adsorption rate of MC-LR by C-TiO2-Fe3O4 decreased by 16%, and the photocatalytic rate decreased by 12% within 30 min, because the combination of TiO2 and Fe3O4 brought unfavorable heterojunction that increased the recombination of electron/hole charges [35].
The HPLC chromatogram of the MC-LR removed by the CMT, C-TiO2, and C-TiO2-Fe3O4 is shown in Figure 3d. The peak intensities of MC-LR were decreased with the increase in retention time (RT), indicating that the content of MC-LR decreased continuously. Only the characteristic peak of MC-LR appeared in the HPLC chromatogram of MC-LR removed by the CMT, while other peaks appeared in C-TiO2 and C-TiO2-Fe3O4, indicating that intermediate by-products were produced in the process of photocatalytic degradation. Some peaks representing different by-products were observed: RT = 10.6, 14.1, and 14.7 min. The reduction in peak intensities showed that intermediate products were further degraded, which corresponds to the decrease in the degradation efficiency of MC-LR in the subsequent stage of photocatalysis, because MC-LR competed with its intermediate product for active sites.
The main intake routes of microcystins are through skin contact and daily drinking water. The non-carcinogenic potential risks of MC-LR content in two different intake pathways before and after the photocatalytic degradation of C-TiO2 and C-TiO2-Fe3O4 were calculated to evaluate the health risk reduction rate of the two materials. This is because there was a lack of data to support the carcinogenicity of MC-LR that was still in the preliminary exploration. The noncarcinogenic risk assessment was performed according to the USEPA health risk assessment model. The non-carcinogenic risk was the ratio of long-term daily intake (CDI) to the reference dose (RfD), which was expressed by the risk index (HI) and calculated according to Equations (S1)–(S4). The TDI (0.04 μg·(kg·d)−1) of MC-LR recommended by the World Health Organization (WHO) was used as RfD [36,37]. The HI of MC-LR after degradation via human drinking water and skin was reduced by 92.4% and 99.24% by C-TiO2, respectively (Figure S6 and Table S5). The HI of MC-LR after degradation via human drinking water and skin was reduced by 80.4% and 98.04% by C-TiO2-Fe3O4, respectively. Therefore, C-TiO2 and C-TiO2-Fe3O4 can effectively reduce the health risk of MC-LR through drinking water or skin exposure. The HI value through drinking water was much higher than that through skin, indicating that drinking water containing MC-LR would increase the non-carcinogenic risk for humans. At the same time, it was found that children had the highest HI value and women had the lowest HI value. This may be due to the poor physical resistance of children and the difficulty in resisting the risk of various pollutants. Therefore, the HI value of children was much higher than that of adults under the same dose exposure conditions.
3.3. Photodegradation Dynamics
The Langmuir–Hinshelwood model (L-H model) was used to describe the relationship between the concentration of organics and chemical reaction rate in heterogeneous catalysis. The reactant molecules are first adsorbed on the active sites on the surface of the catalyst, then, the surface chemical reaction is carried out, and the final product is desorbed. The reaction mechanism was based on adsorption–surface reaction–desorption. The L-H model is given in Equation (3) [38].
where t is the reaction time (min), C0 is the initial MC-LR concentration (mg·L−1), Ct is the MC-LR concentration at time of t (mg·L−1), K is the reaction rate constant (min−1), Ka is the catalyst surface rate constant (mg·L−1·min), Kr is the adsorption equilibrium constant (mg·L−1), and r is the reaction rate in the reaction system.
The degradation kinetics of C-TiO2 and C-TiO2-Fe3O4 are shown in Figure S9. With the increase in the initial MC-LR concentration, the first-order kinetic reaction rate K decreased gradually. As the initial MC-LR concentration increased from 500 to 1000 μg·L−1, the K value of C-TiO2 decreased from 0.027 min−1 to 0.022 min−1, and that of C-TiO2-Fe3O4 decreased from 0.027 min−1 to 0.019 min−1. However, the surface area normalized apparent reaction rate constants (K/SBET) were calculated to present the effect of internal structure [39]. The K/SBET of C-TiO2-Fe3O4 (1.2 × 10⁻⁴) were much higher than that of C-TiO2 (8.4 × 10⁻⁵) in the 500 μg L−1 MC-LR, which proved that C-TiO2-Fe3O4 has a higher reaction rate than C-TiO2, which may have resulted from the smaller surface area of C-TiO2-Fe3O4.
3.4. Influence of Parameters on MC-LR Degradation
The parameters of pH, catalyst dosage, initial MC-LR concentration, and reaction time were selected for the single-factor experiment of C-TiO2 and C-TiO2-Fe3O4. The removal rate of MC-LR by C-TiO2 and C-TiO2-Fe3O4 increased in the acidic condition, which could reach 100% after 30 min of illumination with a pH less than 7 (Figure 4a,b). Lawton et al. [40] confirmed that the acidic condition was most conducive to the photocatalytic degradation of MC-LR when the pH > 2.1, which might be related to the change in surface charge of the photocatalyst, the hydrophobicity, and the net charge of MC-LR. Feng et al. [41] found that the surface hydroxyl groups of TiO2 were protonated when the pH = 4, which could be charged with electronegative MC-LR that benefitted the photocatalytic performance of TiO2.
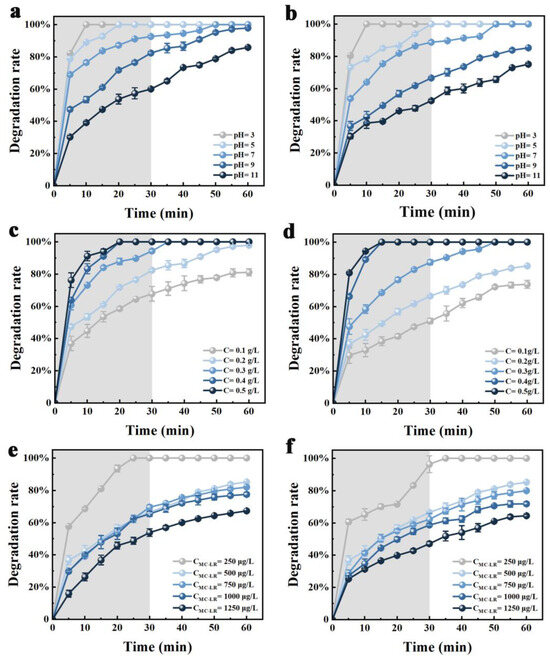
Figure 4.
Effect of different pH (a,b), catalyst dosage (c,d), and initial MC-LR concentration (e,f) on MC-LR degradation by C-TiO2 and C-TiO2-Fe3O4, respectively. Notes: grey background represents adsorption treatment in dark conditions before photocatalysis degradation process.
The MC-LR degradation rate was increased with the catalyst dosage (Figure 4c,d). The degradation rate of MC-LR by C-TiO2 and C-TiO2-Fe3O4 could reach 100% after 30 min of irradiation when the dosage was more than 0.3 g·L−1, which was reduced by 16% and 11% with the dosage reduced to 0.1 g·L−1, respectively. This is because the increase in catalyst dosage led to more active substances (such as h+, e+, ·OH, and ·O2−) formed. A shading effect could result from too much TiO2, and the photon energy will not be fully utilized, which will result in a lower degradation rate [42].
With the increase in the initial MC-LR concentration, the MC-LR degradation rate decreased gradually, and there was competitive adsorption on the surface of C-TiO2 and C-TiO2-Fe3O4 in high MC-LR concentrations (Figure 4e,f). When the initial MC-LR concentration was 250 μg·L−1, MC-LR rapidly degraded, which may be due to the rich surface active sites of C-TiO2 and C-TiO2-Fe3O4 [43]. When the initial MC-LR concentration was in the range of 500–1000 μg·L−1, the MC-LR degradation rate was from 77.5% to 85.2% by C-TiO2 and from 71.5% to 81.3% by C-TiO2-Fe3O4. Until the initial MC-LR concentration reached 1250 μg·L−1, the MC-LR degradation rate by the C-TiO2 and C-TiO2-Fe3O4 was reduced to 67.2% and 64.4%, respectively. With the increase in MC-LR concentration, the proportion of oxidized MC-LR to total MC-LR decreased due to the limitation active sites. The MC-LR degradation rate increased with the increase in reaction time. The degradation rate of MC-LR was increased from 82.6% to 99.1% after 30 min when the pH was 9, the initial MC-LR concentration was 500 μg·L−1, and the dosage of C-TiO2 was 0.2 g·L−1. Rahimi et al. [27] found that the degradation rate of 20 mg·L−1 of acid orange dye was increased from 0% to 94% when illumination time increased to 150 min. This is due to the increase of reaction timeincreases the possibility of interaction between MC-LR and electron–hole pairs [44]. In summary, C-TiO2 and C-TiO2-Fe3O4 had the same single-factor effect. The addition of Fe3O4 could not change the excellent photocatalytic performance of C-TiO2, but it did improve its recovery rate.
3.5. Study on Interaction Between Parameters
The pH, catalyst dosage, and reaction time were selected for RSM analysis, which had great influence on MC-LR photocatalytic degradation. Based on the Box–Behnken model (Tables S1 and S2), the influence of the interaction between different variables on MC-LR degradation is shown in Figure 5.
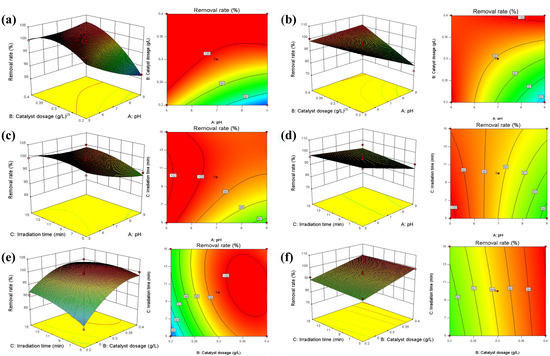
Figure 5.
Effect of interaction between different variables on MC-LR degradation by C-TiO2 (a,c,e) and C-TiO2-Fe3O4 (b,d,f). Notes: The deeper the red is, the higher the representative value is. The deeper the blue is, the lower the representative value is.
The MC-LR degradation rate by C-TiO2 and C-TiO2-Fe3O4 was enhanced with increasing the catalyst dosage and decreasing the pH (Figure 5a,b). The results showed that the interaction between the catalyst dosage and pH was significant (C-TiO2: p = 0.007 < 0.05; C-TiO2-Fe3O4: p = 0.0007 < 0.05). MC-LR removal by C-TiO2 and C-TiO2-Fe3O4 was enhanced due to the decrease in pH value and the increase in reaction time (Figure 5c,d). The results showed that the p value of the interaction between reaction time and initial pH was not significant (C-TiO2: p = 0.1591 > 0.05; C-TiO2-Fe3O4: p = 0.1391 > 0.05). The increase in reaction time and catalyst dosage promoted the degradation of MC-LR by C-TiO2 and C-TiO2-Fe3O4 (Figure 5e,f). The results showed that the p value of the interaction between catalyst dosage and contact time was not significant (C-TiO2: p = 0.1659 > 0.05; C-TiO2-Fe3O4: p = 0.7587 > 0.05).
The RSM showed that the optimum conditions for C-TiO2 were a reaction time of 11.06 min, a catalyst dosage of 0.34 g·L−1, and a pH of 7.69; the optimum conditions for C-TiO2-Fe3O4 were a reaction time of 12.68 min, a catalyst dosage of 0.39 g·L−1, and a pH of 7.72. The optimum conditions were validated when the MC-LR removal rate by C-TiO2 and C-TiO2-Fe3O4 could reach above 99% (Figure S10).
3.6. Effects of Natural Water Bodies
The representative natural organic matter (NOM) in surface water mainly includes HA and FA [45]. With the increase in HA and FA dosage, the degradation rate of MC-LR decreased (Figure S11). However, the MC-LR degradation rate was less affected when the concentration of HA and FA was less than 8 mg·L−1. When the concentration of HA increased to 10 mg·L−1, the MC-LR degradation rate by C-TiO2 and C-TiO2-Fe3O4 decreased by 24% and 31.5%, respectively, while the degradation rates decresed by 32.9% and45.6% with an FA of 10 mg·L−1, respectively. Therefore, the inhibitory effect of FA was more obvious than that of HA. It was confirmed that, when NOM reaches a certain concentration, the photocatalytic degradation of organic pollutants was inhibited due to the competition of HA and FA for the surface active sites of the photocatalysts [46]. In addition, the dissolved HA and FA also reduced the visible light transmitted to the surface of the photocatalysts [47]. At the same time, HA and FA were reactive oxygen species (ROS) free radical scavengers that could effectively stop the photocatalytic process [48].
In this study, MC-RR was added to simulate the MC-LR degradation in the presence of multiple toxins (Figure S11e,f). The degradation of MC-LR by C-TiO2 and C-TiO2-Fe3O4 was enhanced by 0.9% and 0.4% when MC-RR concentration was 100 μg·L−1, respectively, which might be due to the synergistic removal effect of MC-LR and MC-RR in the low MC-RR concentration. The MC-LR degradation rate by C-TiO2 and C-TiO2-Fe3O4 decreased to 81.8% and 77.1% with the increase in MC-RR concentration to 400 μg·L−1, respectively, and to 79.3% and 58.8% when the MC-RR concentration increased to 500 μg·L−1, respectively. This indicated that the presence of high MC-RR concentration inhibited the removal of MC-LR by C-TiO2 and C-TiO2-Fe3O4 compared with the degradation process without MC-RR. This might be related to the competitive reaction between MC-RR and MC-LR.
Then, SiO2 and general purpose polystyrene with a particle size of 70 μm (PS-70 μm) were added to simulate the effect of particles presented in natural waters on the photocatalysis of C-TiO2 and C-TiO2-Fe3O4 (Figure S12). SiO2 can reduce the MC-LR degradation rate of C-TiO2 from 97.5% to 72.5% and that of C-TiO2-Fe3O4 from 85.4% to 40.6%. The relative inhibition value of PS-70 μm was lower, which decreased to 80.9% for C-TiO2 and 62.8% for C-TiO2-Fe3O4. The reason for it is that the presence of particles in the water will have a scattering and shielding effect on light, reducing the light energy utilization of C-TiO2 and C-TiO2-Fe3O4 and thereby affecting the degradation rate of the target degradation product [49]. On the other hand, PS had a small particle size and could be photodegraded, so its shading effect was lower than that of SiO2 [50].
In summary, NOM, MC-RR, and particles in natural water could inhibit the MC-LR degradation by C-TiO2 and C-TiO2-Fe3O4. In the low NOM concentrations (<10 mg·L−1), the MC-LR degradation rate by C-TiO2 and C-TiO2-Fe3O4 was less affected. Synergistic degradation between MC-LR and MC-RR occurred in the C-TiO2 and C-TiO2-Fe3O4 photocatalytic system in low MC-RR concentrations, but the inhibition effect occurred in the high MC-RR concentration. The addition of particles also inhibited the photocatalytic effect of C-TiO2 and C-TiO2-Fe3O4.
3.7. Quenching Experiment
The formation of active substances such as hydroxyl radical (·OH), electron hole (h+), and superoxide anion radical (·O2−) plays an important role in the photocatalytic process. Therefore, the main radical species of the C-TiO2 and C-TiO2-Fe3O4 photocatalytic degradation of MC-LR were determined by the active species quenching experiment (Figure 6a,b). IPA (0.01 mol·L−1), SO (0.01 mol·L−1), and BQ (0.01 mol·L−1) were used as quenchers of ·OH, h+, and ·O2−, respectively.
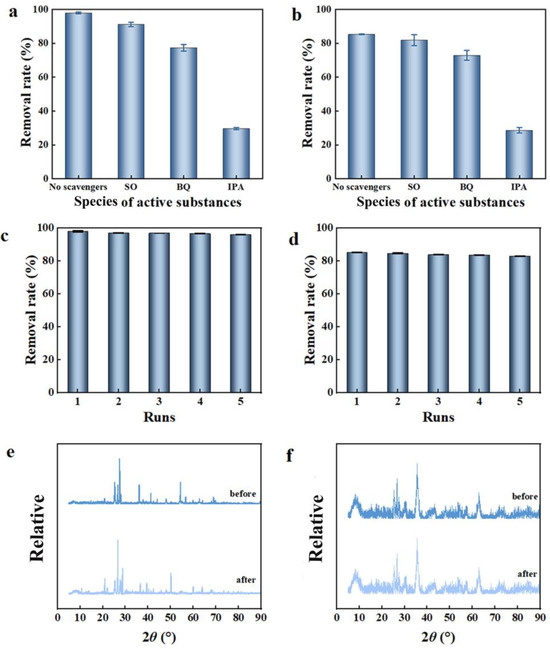
Figure 6.
Active substance quenching experiments: (a) C-TiO2 and (b) C-TiO2-Fe3O4; stability of C-TiO2 (c) and C-TiO2-Fe3O4 (d); XRD patterns of (e) C-TiO2 and (f) C-TiO2-Fe3O4 before and after photocatalytic degradation.
After adding IPA, the MC-LR degradation rate decreased from 97.85% to 29.69% by C-TiO2 and from 85.22% to 28.59% by C-TiO2-Fe3O4, respectively. After adding SO and BQ, the MC-LR degradation rate was slightly decreased trend. DMPO was further used as an electron-trapping agent for radicals of C-TiO2-Fe3O4 in the ESR test. There is a quadruple peak with an intensity ratio of 1:2:2:1 (Figure S13), which is strong evidence for ·HO, and there is also a characteristic peak of ·O2− with weaker intensity than that of ·HO. Therefore, the results showed that ·OH may be the main active substance for MC-LR photocatalytic degradation by C-TiO2-Fe3O4, not h+ and ·O2−. Moreover, a CMT with high adsorption capacity could make MC-LR molecules closer to the surface of the catalyst and improve the reaction rate of generated ·OH and MC-LR.
3.8. Catalyst Stability and Reusability
The stability of MC-LR degradation by C-TiO2 and C-TiO2-Fe3O4 was evaluated by repeating experiments. It was found that both two catalysts showed stable activity (Figure 6c,d). After the fifth operation, the MC-LR degradation rate by C-TiO2 decreased slightly from 85.23% to 84.32% and from 97.87% to 96.11% by C-TiO2-Fe3O4. In addition, XRD patterns showed the similar structures of C-TiO2 and C-TiO2-Fe3O4 before and after photocatalytic degradation (Figure 6e,f). The peak positions of C-TiO2 and C-TiO2-Fe3O4 were identical, and only slight shifts in peak intensities were observed, which further demonstrated that C-TiO2 and C-TiO2-Fe3O4 possessed reusable and sustainable removal performance in multiple removal processes. The XRD peak shifts may be related to the following two reasons: after being adsorbed on the surface of the photocatalyst, the water molecules formed hydrogen bonds with the surface hydroxyl groups, which would cause a certain degree of relaxation of the surface lattice, or the catalyst surface may form some carbon-containing intermediate products in the photocatalytic process. These intermediate products would change the structure of the catalyst surface, which would eventually lead to a slight shift in the XRD peak position. In addition, the ICP-AES analysis of the recovered catalysts after five cycles showed that the loss of metal elements from the catalyst was negligible (Figure S14a). Thus, the slight changes after the degradation of MC-LR indicated that both catalysts showed good stability. Due to the magnetic response of C-TiO2-Fe3O4, it could be easily recovered by an external magnetic field, which showed the advantages of a high recovery rate in practical application (Figure S14b). The above results showed that C-TiO2 and C-TiO2-Fe3O4 presented good stability, and no photocorrosion occurred during the MC-LR degradation by C-TiO2-Fe3O4, which has broad application prospects in water treatment.
3.9. MC-LR Intermediates and Potential Pathways
The reaction intermediates of MC-LR were analyzed by HPLC-MS. The possible intermediates, oxidative groups, and bond energy sites were studied. After 20 min and 30 min of light irradiation, at least 28 intermediate products can be identified in the total ion chromatogram (TIC), as shown in Figures S15 and S16. Among them, 13 intermediates were produced by the hydrolysis of peptide bonds, while the other 15 intermediates were typical photocatalytic oxidation products. So the possible degradation pathways of MC-LR in the C-TiO2-Fe3O4 photocatalytic procedure were proposed (Figure 7).
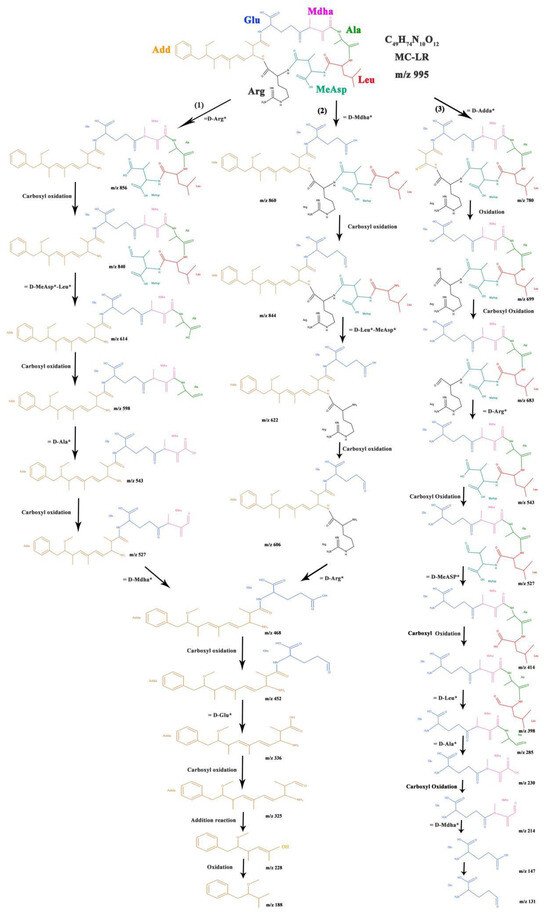
Figure 7.
The possible degradation pathway of MC-LR during the photocatalytic degradation process by C-TiO2-Fe3O4. Notes: * represent free radical group and different color represent different amino acid group.
The hydrolysis of the MC-LR peptide bond was rapid. First, the intermediate product m/z = 856 was produced by the loss of the D-Arg fragment (Path 1), and, then, it was hydrolyzed by the peptide bond connecting Ala and D-MeAsp-Leu to form product m/z = 618. The main hydrolysate m/z = 618 contained residues of Glu, Mdha, and Ala. The conjugated diene in the Adda side chain was pronged to oxidative hydroxylation but remained intact in the products of m/z = 468 and 452. This is because the photocatalytic system preferentially hydrolyzes the peptide bond, followed by carboxyl oxidation. The product m/z = 860 contains the hydroxylated benzene ring of Adda (Path 2). The products m/z = 622 and m/z = 468 were produced by the continuous catalytic hydrolysis of peptide bonds connecting D-Leu-MeAsp with Arg and D-Arg with Glu.
The oxidation products in the photocatalytic process, such as m/z = 844, 840, 325, and 228 were also detected without the hydrolysis of peptide bonds. The product of m/z = 1029 was produced by the dihydroxylation of the unsaturated bond of Adda by ·OH attack [51]. However, dihydroxylation is not important for the degradation of MC-LR in this studied system. The product of m/z = 683 was not hydrolyzed by peptide bonds but was an oxidation product formed by the hydroxyl carbonylation of the Arg in the product of m/z = 699 (Path 3). Most of the oxidation products, such as m/z = 844 and 699, were not similar to the oxidation products produced by typical photocatalysis, so the degradation of this system involves alternating degradation pathways. The intermediate product fragments that did not appear in the ·OH-dominated MC-LR degradation process can help explain the key role of catalytic hydrolysis in the effective utilization of visible light irradiation by C-TiO2-Fe3O4. The final products of m/z = 336 and 147 produced by the hydrolysis of peptide bonds in MC-LR were more difficult to remove than MC-LR. This indicates that the catalyst preferentially interacts with the complete ring structure of MC-LR, which is composed of seven amino acids connected by peptide bonds. The first 20 min of C-TiO2-Fe3O4 photocatalysis is mainly through hydrolysis to open the macrocycle, and with further decomposition in 10 min, resulting in a significant increase in small molecular fragments in 30 min. Opening the ring structure of MC-LR by photocatalysis can significantly reduce its toxicity. Therefore, the selectivity of the cyclic structure in the first 20 min of C-TiO2-Fe3O4 raises good application prospects for the photocatalytic system.
3.10. Mechanism
The photocatalytic activity is affected by many factors such as the surface basic site, band gap, oxidation potential of the photogenerated holes, and separation efficiency of photogenerated electrons and holes [52]. Wang et al. [51] have shown that the carbon microtube has much larger interlayer spacing than that of commercial graphite, which might facilitate ion transport. Therefore, the higher photocatalytic rate of C-TiO2 and C-TiO2-Fe3O4 might be due to the higher mass transfer rate of carbon microtubes. In the C-TiO2-Fe3O4 system, the surface basic site was determined to be 3.251 × 10²⁰ ·g−1, which is smaller than that of C-TiO2 (4.214 × 10²⁰ ·g−1), so C-TiO2 could provide more active sites for the photocatalytic reaction process.
Furthermore, the conduction (ECB) and valence band (EVB) position of the photocatalyst could be calculated through the following equation [53]:
where X is the Mulliken’s electronegativities, Ee is the energy of free electrons on the hydrogen scale (≈4.5 eV), and Eg is the band gap.
Chen et al. [54] estimated the EVB of TiO2-Fe3O4 to be 2.78 eV, which is 0.12 eV lower than that of TiO2 (2.9 eV) [55]. The EVB of a photocatalyst can promote the reaction of the generated holes with OH− and produce active ·OH radicals. This may be the reason for the high activity of C-TiO2 and C-TiO2-Fe3O4. The difference between the EVB potential of C-TiO2 and C-TiO2-Fe3O4 is 0.525 eV, indicating that the activity of C-TiO2 is higher than that of C-TiO2-Fe3O4. Among other wide band gap photocatalysts with good photocatalytic performance, such as In(OH)3 (EVB~4.2 eV) and CaSb2O5(OH)2 (EVB~4.1 eV) [32], the difference between In(OH)3 and CaSb2O5(OH)2 in EVB is much larger. On the other hand, the Fe2+ generated by Fe3O4 can consume the electrons generated by photoexcitation and reduce the recombination of e−/h+ pairs [33,56]. Under the acidic condition in water, Fenton-like catalytic activity also contributes to the degradation of pollutants [57,58]. Moreover, the incorporation of carbon materials can improve the regeneration of Fe3O4 nanoparticles. According to the classic photocatalytic theory, it is reasonable to believe that the loading of Fe3O4 reduces the separation efficiency of electron–hole pairs due to the lower photocatalytic rate of C-TiO2-Fe3O4.
Based on the above discussion, the possible mechanism of the photocatalytic degradation of MC-LR by C-TiO2 and C-TiO2-Fe3O4 was proposed, as shown in the abstract figure. When exposed to the simulated sunlight, the valence band electrons of TiO2 and TiO2-Fe3O4 can be excited into the conduction band. The electrons in the uppermost valence band of TiO2 or TiO2-Fe3O4 can be excited to the conduction band. The electrons in the upper valence band will jump to the conduction band of TiO2 or TiO2-Fe3O4. However, the holes in the valence band will quickly participate in the MC-LR degradation. As a result, the combination of electrons and holes will be reduced. Therefore, the improvement of photocatalytic performance could be attributed to the ability of the carbon microtube to hinder the recombination of electron–hole pairs. The loading of Fe3O4 would also reduce the recombination of electron–hole pairs, thus enhancing the photocatalytic efficiency of C-TiO2-Fe3O4.
3.11. Ecological Safety
The effect of the solution after photocatalytic MC-LR by C-TiO2-Fe3O4 on the population density of rotifers is shown in Figure 8a. The results presented that the population density of each experimental group was basically unchanged. When cultured for 1 d, there was a significant difference between the CK group and 100 μg/L group (p > 0.05), and the population density was similar. When cultured for 3 days, there was no significant difference between the CK group and the 100 μg/L group, 200 μg/L group, 300 μg/L group, 400 μg/L group, and 500 μg/L group (p > 0.05), and the average population density of the five concentration treatment groups was slightly higher than that of the CK group. When cultured for 7 days, there was still no significant difference between the CK group and the five treatment groups (p > 0.05). The overall population density was not less than 35 ind./mL within 7 days of sampling.
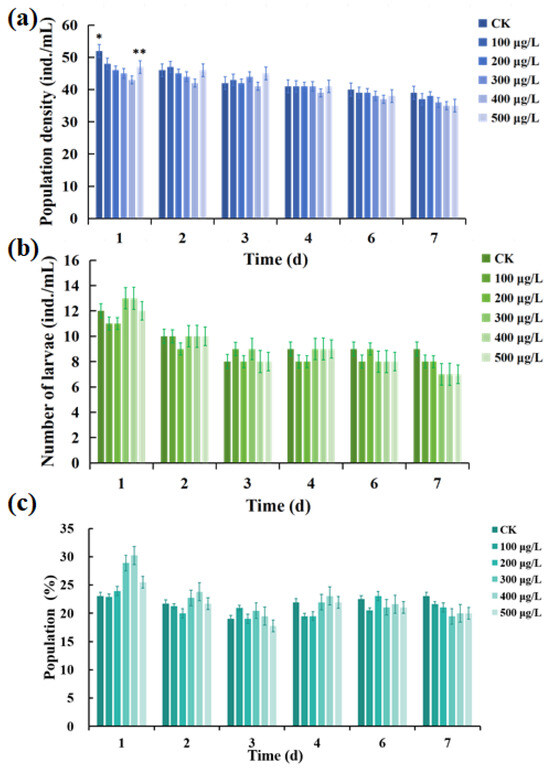
Figure 8.
Effect of the MC-LR solution exposure after photocatalytic by C-TiO2-Fe3O4 on population density (a), number of larvae (b), and population fertility (c) of rotifer. Notes: * represent p < 0.05, and ** represent p < 0.01.
Figure 8b shows that there was no significant difference in the number of births of rotifers within 7 days compared with the CK group (p > 0.05). By calculating the ratio of the number of offspring to the number of survivals, the rate of birth (population fertility) can be obtained as shown in Figure 8c. On the first day, the number of births decreased with the increase in concentration in the five treatment groups, indicating that the high concentration showed a stronger inhibitory effect on the number of births of rotifers, while the inhibitory effect at low concentration was weak, but it showed no significant difference compared with the CK group (p > 0.05). At 3 d and 7 d, the birth rate did not show significant changes between the groups and tended to be stable at about 19%.
The population density and reproductive capacity of rotifers in each treatment group at sampling time points did not show significant differences from the CK group, which proved that the photocatalytic degradation products of MC-LR by C-TiO2-Fe3O4 had no ecological toxicity effect on rotifers and would not affect their reproduction.
4. Conclusions
In this study, C-TiO2-Fe3O4 was prepared from corncob to the photodegradation of MC-LR. SEM and XRD confirmed that TiO2-Fe3O4 was successfully loaded on the CMT. RSM results showed that the optimum conditions were as follows: a reaction time of 12.68 min, a catalyst dosage of 0.39 g·L−1, and a pH of 7.72 for C-TiO2-Fe3O4. The radial of ·OH was the main active species in its photocatalytic reaction that could attack the conjugated double bond of the Adda moiety of MC-LR first. The results showed that C-TiO2-Fe3O4 with high surface area normalized apparent reaction rate constants and photocatalytic efficiency could be used to effectively degrade MC-LR in polluted water, and it can be easily recovered and reused by applying external magnetic field. The photocatalytic degradation products of MC-LR by C-TiO2-Fe3O4 had no ecological toxicity effect on rotifers. So the C-TiO2-Fe3O4 was an efficient and safety recyclable magnetic photocatalyst that could photodegrade MC-LR under visible light.
Supplementary Materials
The following supporting information can be downloaded at https://www.mdpi.com/article/10.3390/w17091342/s1, Figure S1: Photocatalytic reactor; Figure S2: TGA (a) and DTG (b) pattern of CC; Figure S3: FTIR pattern of CC, AC, and CMT; Figure S4: SEM pattern of TiO2 (500 °C, 4 wt.%, (a)), C-TiO2 (700 °C, 4 wt.%, (b)), C-TiO2 (900 °C, 4 wt.%, (c)), C-TiO2 (900 °C, 1 wt.%, (d)), C-TiO2 (900 °C, 2 wt.%, (e)), and C-TiO2 (900 °C, 8 wt.%, (f)); Figure S5: EDS of C-TiO2-Fe3O4; Figure S6: Non-carcinogenic risk indexes (HI) of MC-LR solution before and after degradation by C-TiO2 and C-TiO2-Fe3O4 through: (a) drinking and (b) skin; Figure S7: Fitting curve of Freundlich and Langmuir models for C-TiO2 (a) and C-TiO2-Fe3O4 (b); Figure S8: The first-order kinetic fitting curve (a) and the second-order kinetic fitting curve (b) of C-TiO2 adsorption. First-order kinetic fitting curve (c) and second-order kinetic fitting curve (d) of C-TiO2-Fe3O4 adsorption; Figure S9: L-H model fitting curve of C-TiO2 (a) and C-TiO2-Fe3O4 (b). Initial MC-LR concentrations was 500, 750, and 1000 μg·L−1, and usage of C-TiO2 and C-TiO2-Fe3O4 was 0.2 g·L−1; Figure S10: Validation results of the optimum conditions; Figure S11: Effect on MC-LR degradation of FA (a), HA (c), MC-RR (e) by C-TiO2, FA (b), HA (d), and MC-RR (f) by C-TiO2-Fe3O4 in natural water; Figure S12: Effect on MC-LR degradation of (a) SiO2, (c) PS by C-TiO2, (b) SiO2, and (d) PS by C-TiO2-Fe3O4 in natural water; Figure S13: ESR spectra of C-TiO2-Fe3O4; Figure S14: (a) The concentration of dissolved metal ions from C-TiO2-Fe3O4 before and after five reaction cycles, (b) magnetic properties of C-TiO2-Fe3O4; Figure S15: LC-MS spectrum of the MC-LR solution with 20 min photocatalytic process by C-TiO2-Fe3O4: (a) TIC, (b–j) TIC-MS; Figure S16: LC-MS spectrum of the MC-LR solution with 30 min photocatalytic process by C-TiO2-Fe3O4: (a) TIC, (b–f) TIC-MS; Table S1: Experimental design; Table S2: Experimental operation; Table S3: Pore size characteristics of prepared materials; Table S4: The surface hydroxyl content of the samples; Table S5: Meaning, reference value, and unit of each symbol in the formula; Table S6: Freundlich and Langmuir model parameters for C-TiO2 and C-TiO2-Fe3O4; and Table S7: Parameters related to pseudo-first and second order kinetic models. References [32,33] are cited in the Supplementary Materials.
Author Contributions
X.Z.: Methodology, software, and writing—original draft preparation; T.X.: software and writing—original draft preparation; J.Z.: Data curation and methodology; Y.M.: Data curation and methodology; G.C.: Data curation and methodology; Z.J.: Data curation and methodology; W.Q.: Supervision and reviewing. All authors have read and agreed to the published version of the manuscript.
Funding
This research was funded by the Wenzhou Basic Public Welfare Scientific Research Project (S20240005), the National Natural Science Foundation of China Youth Science Foundation (32401464), and the Zhejiang Province Science Foundation Youth Fund (LQN25C030002).
Data Availability Statement
The datasets used and/or analyzed during the current study are available from the corresponding author upon reasonable request.
Conflicts of Interest
The authors declare no conflicts of interest.
References
- Yang, L.; Chen, C.; Hu, Y.; Wei, F.; Cui, J.; Zhao, Y.; Xu, X.; Chen, X.; Sun, D. Three—Dimensional bacterial cellulose/polydopamine/TiO2 nanocomposite membrane with enhanced adsorption and photocatalytic degradation for dyes under ultraviolet visible irradiation. J. Colloid Interface Sci. 2020, 562, 21–28. [Google Scholar] [PubMed]
- Sharma, V.K.; Triantis, T.M.; Antoniou, M.G.; He, X.X.; Pelaez, M.; Han, C.S.; Song, W.H.; O’Shea, K.E.; de la Cruz, A.A.; Kaloudis, T.; et al. Destruction of microcystins by conventional and advanced oxidation processes: A review. Sep. Purif. Technol. 2012, 91, 3–17. [Google Scholar]
- Sutar, S.; Patil, P.; Jadhav, J. Recent advances in biochar technology for textile dyes wastewater remediation: A review. Environ. Res. 2022, 209, 112841. [Google Scholar] [CrossRef]
- Nemr, A.; Shoaib, A.; Sikaily, A.; Mohamed, A.; Hassan, A. Evaluation of cationic methylene blue dye removal by high surface area mesoporous activated carbon derived from ulva lactuca. Environ. Process. 2021, 8, 311–332. [Google Scholar] [CrossRef]
- Belachew, N.; Hinsene, H. Preparation of zeolite 4A for adsorptive removal of methylene blue: Optimization, kinetics, isotherm, and mechanism study. Silicon 2021, 14, 1629–1641. [Google Scholar] [CrossRef]
- Mandal, P.; Saha, M. Photodegradation behaviour of nitrogen—Containing graphene derivatives towards pollutant dyes and real-timeassessment on aquatic weed. Biointerface Res. Appl. Chem. 2022, 12, 4357–4373. [Google Scholar]
- Onder, A.; Ilgin, P.; Ozay, H.; Ozay, O. Preparation of composite hydrogels containing fly ash as low-cost adsorbent material and its use in dye adsorption. Int. J. Environ. Sci. Technol. 2021, 19, 7031–7048. [Google Scholar] [CrossRef]
- Zhang, H.; He, Q.D.; Zhao, W.T.; Guo, F.; Han, L.; Wang, W. Superior dyes removal by a recyclable magnetic silicate @ Fe3O4 adsorbent synthesized from abundant natural mixed clay. Chem. Eng. Res. Des. 2021, 175, 272–282. [Google Scholar]
- Woottikrai, C.; Arisa, S.; Pimluck, K.; Chimupala, Y. Direct dye wastewater photocatalysis using immobilized titanium dioxide on fixed substrate. Chemosphere 2022, 286, 131762. [Google Scholar]
- Fujishima, A.; Honda, K. Electrochemical photolysis of water at a semiconductor electrode. Nature 1972, 238, 37–38. [Google Scholar]
- Chen, J.; Xue, S.; Song, Y.; Shen, M.; Zhang, Z.; Yuan, T.; Tian, F.; Dionysiou, D. Microwave-induced carbon nanotubes catalytic degradation of organic pollutants in aqueous solution. J. Hazard. Mater. 2016, 310, 226–234. [Google Scholar] [CrossRef] [PubMed]
- Zhu k Liu, C.C.; Xia, W.; Wang, Y.; He, H.; Lei, L.; Ai, Y.; Chen, W.; Liu, X. Non—Radical pathway dominated degradation of organic pollutants by nitrogen—Doped microtube porous graphitic carbon derived from biomass for activating peroxymonosulfate: Performance, mechanism and environmental application. J. Colloid Interface Sci. 2022, 625, 890–902. [Google Scholar] [CrossRef] [PubMed]
- Zhang, X.Y.; Song, L.L.; Tong, L.; Zeng, M.; Wang, Y. Surface bonding of CoP to biomass derived carbon microtube: Site—Specific growth and high—Efficiency catalysis. Chem. Eng. J. 2022, 440, 135884. [Google Scholar] [CrossRef]
- Luo, H.; Si, R.; Li, C.; Zhang, J.; Li, P.; Tao, Y.; Zhao, X.; Chen, H.; Jiang, J. Facile fabrication of carbon microtube arrays from waste wood for use as self-supporting supercapacitor electrodes. Mater. Chem. Front. 2022, 6, 379–389. [Google Scholar] [CrossRef]
- Wang, H.; Guo, W.; Liu, B.; Wu, Q.; Luo, H.; Zhao, Q.; Si, Q.; Sseguya, F.; Ren, N. Edge—Nitrogenated biochar for efficient peroxydisulfate activation: An electron transfer mechanism. Water Res. 2019, 160, 405–414. [Google Scholar] [CrossRef]
- Li, Y.X.; Shang, H.R.; Cao, Y.N.; Yang, C.H.; Feng, Y.J.; Yu, Y.L. High performance removal of sulfamethoxazole using large specific area of biochar derived from corncob xylose residue. Biochar 2022, 4, 11. [Google Scholar] [CrossRef]
- Zhang, N.; Gao, Y.; Sheng, K.J.; Xu, X.; Jing, W.; Bao, T.; Wang, S. Ferric iron loaded porphyrinic zirconium MOFs on corncob for the enhancement of diuretics extraction. Chemosphere 2022, 301, 134694. [Google Scholar] [CrossRef]
- Ebrahimi, A.; Jafari, N.; Ebrahimpour, K.; Karimi, M.; Rostamnia, S.; Behnami, A.; Ghanbari, A.; Mohammadi, A.; Rahimi, B.; Abdolahneja, A. . A novel ternary heterogeneous TiO2/BiVO4/NaY—Zeolite nanocomposite for photocatalytic degradation of microcystin—Leucine arginine (MC—LR) under visible light. Ecotoxicol. Environ. Saf. 2021, 210, 111862. [Google Scholar] [CrossRef]
- Amali, H.; Chanaka, N.; Shannon, W.; Perez, F.; Pittman, C.; Mlsna, T. Iron/titanium oxide-biochar (Fe2TiO5/BC): A versatile adsorbent/photocatalyst for aqueous Cr(VI), Pb2+, F- and methylene blue. J. Colloid Interface Sci. 2022, 614, 603–616. [Google Scholar]
- Ridha, D.; Yang, B.; Hafiz, M.; Zhang, J.; Ali, J.; Zhao, X. Sustainable and easy recoverable magnetic TiO2-Lignocellulosic Biomass@Fe3O4 for solar photocatalytic water remediation. J. Clean. Prod. 2019, 233, 841–847. [Google Scholar]
- Jiao, Y.R.; Gong, Y.; Zhang, Y. Fe3O4@SiO2/TiO2 composite preparation and characterization of adsorption. Non—Met. Mines 2020, 43, 91–94. [Google Scholar]
- Liang, Y.; He, X.; Chen, L. Preparation and characterization of TiO2—Graphene@Fe3O4 magnetic composite and its application in the removal of trace amounts of microcystin—LR. J. Adv. Res. 2014, 4, 56883–56891. [Google Scholar] [CrossRef]
- Xia, T.; Ma, Z.; Ai, M.; Qian, K.; Zhu, S.; Rong, M.; Zhang, P.; Ye, Y.; Qin, W. Photocatalyst-coated carbon microtube electrodes: Preparation and characterization of their properties and photocatalytic degradation of methylene blue. Chemosphere 2021, 267, 128927. [Google Scholar] [CrossRef]
- Sears, G.W. Determination of specific surface area of colloidal silica by titration with sodium hydroxide. Anal. Chem. 1956, 28, 1981–1983. [Google Scholar] [CrossRef]
- Rahimi, J.N.; Abdolahnejad, A.; Farrokhzadeh, H.; Farrokhzadeh, H.; Ebrahimi, A. Application of efficient photocatalytic process using a novel BiVO/TiO2—NaY zeolite composite for removal of acid orange 10 dye in aqueous solutions: Modeling by response surface methodology (RSM). J. Environ. Chem. Eng. 2019, 7, 103253. [Google Scholar] [CrossRef]
- Zangeneh, H.; Farhadian, M.; Zinatizadeh, A.A. N (Urea) and CN (L—Asparagine) doped TiO2—CuO nanocomposites: Fabrication, characterization and photodegradation of direct red 16. J. Environ. Chem. Eng. 2020, 8, 103639. [Google Scholar] [CrossRef]
- Rahimi, E.A. Photocatalytic process for total arsenic removal using an innovative BiVO4/TiO2/LED system from aqueous solution: Optimization by response surface methodology (RSM). J. Taiwan Inst. Chem. Eng. 2019, 101, 64–79. [Google Scholar] [CrossRef]
- Echigo, T.; Hatta, T.; Nemoto, S.; Takizawa, S. X—Ray photoelectron spectroscopic study on the goethites with variations in crystallinity and morphology: Their effects on surface hydroxyl concentration. Phys. Chem. Miner. 2012, 39, 769–778. [Google Scholar] [CrossRef]
- Jing, Z.Q.; Wang, Y.; Qin, F.; Tang, Y.; Chen, Z.; Huang, Y. Adsorption characteristics of chromium (VI) by corncob. Appl. Chem. Ind. 2018, 47, 1114–1118. [Google Scholar]
- Wu, C.; Gao, Y.J.; Liu, N. Study on adsorption processing of industrial dye wastewater with corncob. Food Sci. 2007, 8, 188–191. [Google Scholar]
- Chen, H.Y.; Yan, S.D.; Jie, W.; Tang, D. Treatment of copper—Containing wastewater by modified concobs. Ind. Water Wastewater 2013, 44, 54–57. [Google Scholar]
- Chen, J.; Li, M.M.; Liu, Z.G.; Jiang, H.; Jin, H.; Lian, L. Removal of tetracycline by Fe3O4@TiO2 core—Shell microsphere combined with adsorption—Photocatalysis. Chem. Res. Appl. 2022, 34, 1803–1812. [Google Scholar]
- Chen, Y.C.; Hu, B.Q. Treatment of mercury containing wastewater by corncob powder. Chongqing Environ. Sci. 1997, 41–45. [Google Scholar]
- Tahir, F.; Abdul, R.; Fahed, J.; Hafeez, A.; Rashid, N.; Amjad, U.; Rehman, M.; Faisal, A.; Rehman, F. Integrating adsorption and photocatalysis: A cost effective strategy for textile wastewater treatment using hybrid biochar—TiO2 composite. J. Hazard. Mater. 2020, 390, 121623. [Google Scholar]
- Salamat, S.; Habibollah, Y.; Nader, B. Synthesis of magnetic coreeshell Fe3O4@TiO2 nanoparticles from electric arc furnace dust for photocatalytic degradation of steel mill wastewater. RSC Adv. 2017, 7, 19391–19405. [Google Scholar] [CrossRef]
- WHO. Cyanobacterial Toxins: Microcystin-LR: Guidelines for Drinking Water Quality; WHO: Geneva, Switzerland, 1998; pp. 95–110. [Google Scholar]
- Yang, X.Y.; Zhang, J.P.; Guo, L.; Zhao, H.; Zhang, Y.; Chen, J. Solvent impregnated resin prepared using ionic liquid Cyphos IL 104 for Cr(VI) removal. Trans. Nonferrous Met. Soc. China 2012, 22, 3126–3130. [Google Scholar] [CrossRef]
- Gerischer, H. Hotocatalysis in aqueous solution with small TiO2 particles and the dependence the quantum yield on particle intensity. Electrochim. Acta 1995, 40, 1277–1281. [Google Scholar] [CrossRef]
- Zhang, J.; Xin, B.; Shan, C.; Zhang, W.; Dionysiou, D.; Pan, B. . Roles of oxygen-containing functional groups of O-doped g-C3N4 in catalytic ozonation: Quantitative relationship and first-principles investigation. Appiled Catal. B-Environ. 2021, 292, 120155. [Google Scholar] [CrossRef]
- Lawton, L.A.; Robertson, P.K.; Cornish, B.J.; Marr, L.; Jaspars, M. Processes influencing surface interaction and photocatalytic destruction of microcystins on titanium dioxide photocatalysts. J. Catal. 2003, 213, 109–113. [Google Scholar] [CrossRef]
- Feng, X.G.; Rong, F. Photocatalytic degradation of trace—Level of microcystin—LR by nanofilm of titanium dioxide. Chin. Sci. Bull. 2006, 51, 1191–1198. [Google Scholar] [CrossRef]
- Triantis, T.M.; Fotiou, T.; Kaloudis, T.; Kontos, A.G.; Falaras, P.; Dionysiou, D.; Pelaez, M.; Hiskia, A. Photocatalytic degradation and mineralization of microcystin—LR under UV—A, solar and visible light using nanostructured nitrogen doped TiO2. J. Hazard. Mater. 2012, 211, 196–202. [Google Scholar] [CrossRef] [PubMed]
- Ling, Y.C.; Yuan, R.; Qiu, J.; Qiu, J.; Liu, F.; Zhu, J. Enhanced removal of sulfamethoxazole by a novel composite of TiO2 nanocrystals in situ wrapped—Bi2O4 microrods under simulated solar irradiation. Chem. Eng. J. 2020, 384, 123278. [Google Scholar] [CrossRef]
- Omrani, N.; Nezamzadeh-Ejhieh, A. Photodegradation of sulfasalazine over Cu2O—BiVO4—WO3 nano—Composite: Characterization and experimental design. Int. J. Hydrogen Energy 2020, 45, 19144–19162. [Google Scholar] [CrossRef]
- Tian, J.; Wu, C.; Yu, H.; Gao, S.; Li, G.; Cui, F.; Qu, F. Applying ultraviolet/persulfate (UV/PS) pre—Oxidation for controlling ultrafiltration membrane fouling by natural organic matter (NOM) in surface water. Water Res. 2018, 132, 190–199. [Google Scholar] [CrossRef]
- Wenk, J.; Aeschbacher, M.; Sander, M.; von Gunten, U.; Canonica, S. Photosensitizing and inhibitory effects of ozonated dissolved organic matter on triplet—Induced contaminant transformation. Environ. Sci. Technol. 2015, 49, 8541–8549. [Google Scholar] [CrossRef]
- Zhang, D.; Yan, S.; Song, W. Photochemically induced formation of reactive oxygen species (ROS) from effluent organic matter. Environ. Sci. Technol. 2014, 48, 12645–12653. [Google Scholar] [CrossRef]
- Deligiannakis, Y.; Konstantinou, K.I. Effect of Humic and Fulvic Acids on the Photocatalytic Degradation of N, N-diethyl-m-toluamide (DEET) Using TiO2 Suspensions and Simulated Solar Light. In Functions of Natural Organic Matter in Changing Environment; Springer: Dordrecht, The Netherlands, 2013; pp. 633–636. [Google Scholar]
- Du, Y.H.; Wang, X.Y.; Fan, Z.B.; Song, W.; Cui, Z.; Han, Z.; Xue, B.; Liu, X. Fabrication rGO/MoS2—CN for photocatalytic degradation of sulfonamides under visible light. Environ. Chem. 2022, 41, 3012–3021. [Google Scholar]
- Wang, L.L.; Kaeppler, A.; Fischer, D.; Simmchen, J. Photocatalytic TiO2 icromotors for removal of microplastics and suspended matter. Acs Appl. Mater. Interfaces 2019, 11, 32937–32944. [Google Scholar] [CrossRef]
- Wang, X.; Wang, X.J.; Zhao, J.F.; Song, J.; Zhou, L.; Wang, J.; Tong, X.; Chen, Y. . An alternative to in situ photocatalytic degradation of microcystin-LR by worm-like N, P co-doped TiO2/expanded graphite by carbon layer (NPT-EGC) floating composites. Appl. Catal. B Environ. 2017, 206, 479–489. [Google Scholar] [CrossRef]
- Zhu, S.; Xu, T.; Fu, H.; Zhao, J.; Zhu, Y. . Synergetic effect of Bi2WO6 photocatalyst with C60 and enhanced photoactivity under visible irradiation. Environ. Sci. Technol. 2017, 41, 6234–6239. [Google Scholar] [CrossRef]
- Xu, Y.; Schoonen, M. The absolute energy positions of conduction and valence bands of selected semiconducting minerals. Am. Mineral. 2000, 85, 543–556. [Google Scholar] [CrossRef]
- Yan, T.; Long, J.; Shi, X.; Wang, D.; Li, Z.; Wang, X. . Efficient photocatalytic degradation of volatile organic compounds by porous indium hydroxide nanocrystals. Environ. Sci. Technol. 2010, 44, 1380–1385. [Google Scholar] [CrossRef] [PubMed]
- Sun, M.; Li, D.; Zheng, Y.; Zhang, W.; Shao, Y.; Chen, Y.; Li, W.; Fu, X. Microwave hydrothermal synthesis of calcium antimony oxide hydroxide with high photocatalytic activity toward benzene. Environ. Sci. Technol. 2009, 43, 7877–7882. [Google Scholar] [CrossRef] [PubMed]
- Yu, Y.; Yan, L.; Cheng, J.; Jing, C. Mechanistic insights into TiO2 thickness in Fe3O4@TiO2-GO composites for enrofloxacin photodegradation. Chem. Eng. J. 2017, 325, 647–654. [Google Scholar] [CrossRef]
- Sun, C.; Yang, S.; Gao, Z.; Yang, S.; Yilihamu, A.; Ma, Q.; Zhao, R.; Xue, F. Fe3O4/TiO2/reduced graphene oxide composites as highly efficient Fenton-like catalyst for the decoloration of methylene blue. Mater. Chem. Phys. 2019, 223, 751–757. [Google Scholar] [CrossRef]
- Yang, N.; Liu, Y.; Zhu, J.; Wang, Z.; Li, J. Study on the efficacy and mechanism of Fe-TiO2 visible heterogeneous Fenton catalytic degradation of atrazine. Chemosphere 2020, 252, 126333. [Google Scholar] [CrossRef]
Disclaimer/Publisher’s Note: The statements, opinions and data contained in all publications are solely those of the individual author(s) and contributor(s) and not of MDPI and/or the editor(s). MDPI and/or the editor(s) disclaim responsibility for any injury to people or property resulting from any ideas, methods, instructions or products referred to in the content. |
© 2025 by the authors. Licensee MDPI, Basel, Switzerland. This article is an open access article distributed under the terms and conditions of the Creative Commons Attribution (CC BY) license (https://creativecommons.org/licenses/by/4.0/).