Article

An Experimental Study on the Behavior of Fish in Response to Turbidity Changes—A Case Study of Korean Fishes

1
Department of Hydro Science and Engineering Research, Korea Institute of Civil Engineering and Building Technology, Goyang-si 10223, Republic of Korea
2
Department of Civil Engineering, Kyungsung University, 309 Suyeong-ro, Nam-gu, Busan 48434, Republic of Korea
*
Author to whom correspondence should be addressed.
Water 2025, 17(9), 1340; https://doi.org/10.3390/w17091340
Submission received: 26 March 2025 / Revised: 26 April 2025 / Accepted: 27 April 2025 / Published: 29 April 2025

Abstract

:
Climate change-induced heavy rainfall during summer months can further increase suspended solid loads in rivers, elevating turbidity. Such elevated turbidity can compromise fish gill tissue integrity and impair oxygen uptake, potentially leading to fatal impacts in aquatic ecosystems. Therefore, this study aims to examine fish migratory behaviors and physiological responses to varying turbidity levels through experimental trials to generate baseline data for assessing fish habitat suitability. The experimental design comprised two primary components: an investigation of turbidity avoidance behaviors and an analysis of habitat compatibility through extended exposure to turbid conditions. This study focused on dominant freshwater fish species native to South Korea, Zacco platypus, Pseudopungtungia nigra, and Zacco koreanus. Fish condition in response to turbidity was monitored over a 15-day period, during which locomotor activity and water quality parameters were recorded. In the control group tank with no turbidity, all species exhibited unrestricted swimming patterns without depth preference. However, in moderate and high turbidity treatments, all demonstrated preferential utilization of middle- and lower-depth strata. In addition, the highest number of fish mortality occurred in high-turbidity zones because of respiratory impediments from elevated suspended solid concentrations. These findings provide valuable insights into fish mobility and habitat utilization patterns in rivers experiencing sudden turbidity events, such as those associated with weir operations.

1. Introduction

Persistent suspended solids in riverine systems can become a significant pollutant, potentially inducing lethal effects on aquatic ecosystems, particularly fish populations. Annual summer flooding events generate substantial suspended sediment loads, contributing significantly to elevated turbidity levels in aquatic ecosystems [1].
Suspended sediment generation stems from natural disasters, such as flooding and typhoons, and anthropogenic activities, including hydraulic infrastructure development within riverine systems [2,3]. The ecological impact of turbidity caused by suspended sediments varies according to concentration, frequency, and duration. Large-scale river engineering projects and hydraulic structure operations can significantly alter aquatic environments by resuspending riverbed sediments. In addition, land use patterns in riparian zones also influence suspended solid concentrations. Research by Ryu et al. [4] demonstrated that suspended solid values vary depending on land use patterns, with river development, engineering projects, and agricultural activities contributing to annual turbidity increases. However, there is a notable lack of data regarding management strategies for increased suspended sediments and river turbidity and their effects on aquatic ecosystems.
Kim et al. [5] documented that suspended solid discharge per unit area under varying precipitation conditions exceeded control river values by factors of 4–200. A comprehensive study of 132 rivers in Korea revealed that species diversity indices declined sharply to below 1.0 when suspended solid concentrations exceeded 15–20 mg/L [6]. Within Korea, research emphasis has primarily focused on marine ecosystems, with limited studies on freshwater ecosystems. In addition, research on freshwater fish focused mainly on fish fauna and fish communities [1].
Globally, suspended sediment research has expanded beyond water quality parameters to encompass aquatic ecosystem degradation, mainly focusing on fish and benthic communities [7,8]. Studies examining the physiological and ecological responses of sediment-sensitive species, such as trout and salmon, provide fundamental data for establishing water quality standards based on turbidity [9]. In the United States, comprehensive management frameworks address biochemical impacts on fish (ranging from effects on cells and proteins to morphological changes), establish water quality standards for aquatic ecosystems, and propose mitigation strategies for turbidity effects across ecological contexts [9].
Because suspended solid concentrations are composed of suspended soil particles, sand, organic matter, and planktonic organisms, they significantly influence aquatic ecosystem functions. Elevated concentrations can impair fish gill function, thereby reducing respiratory efficiency. Consequently, increased turbidity decreases water transparency, potentially affecting predator–prey dynamics and foraging success. Meanwhile, sediment accumulation on substrates can degrade spawning substrate quality, reducing reproductive success and population recruitment. Furthermore, suspended solids often transport nutrient loads, contributing to eutrophication processes, which can lead to oxygen depletion and create favorable conditions for pathogenic microorganisms. These mechanisms demonstrate that suspended solid concentration significantly impacts fish health and habitat quality, making it a crucial consideration in water management and environmental protection strategies [10].
Recent research has documented fish’s behavioral and physiological responses to suspended solid exposure. High concentrations can alter migration patterns, reproductive success, and trophic interactions, potentially causing adverse long-term population dynamics [11]. Experimental studies with zebrafish have demonstrated that suspended solid exposure induces functional and structural gill damage, compromising physiological processes, including oxygen uptake [12]. Research on the Yangtze River system has highlighted the critical role of suspended particulate matter (SPM) in river ecosystems, emphasizing the influence of both anthropogenic and natural factors on concentration patterns [13].
Extensive experimental research has documented the diverse impacts of suspended solid concentrations on fish ecosystems, particularly in the context of fish management and conservation. A significant body of literature has established a causal relationship between suspended solids exposure and fish tissue damage. Notable research on adult zebrafish demonstrated that prolonged exposure to elevated total suspended solids (TSS) induces structural deterioration of gill tissue, resulting in compromised respiratory function [12]. Further investigations have examined the multifaceted effects of suspended solid concentrations on fish physiology, behavior, and intergenerational outcomes. A comprehensive review documented behavioral modifications in fish exposed to varying suspended solid concentrations [11]. The research established that fish demonstrate avoidance responses at high suspended solid concentrations, significantly influencing habitat selection and feeding patterns. These findings provide crucial data for assessing long-term implications for fish habitat utilization and population dynamics.
The current study aims to evaluate fish responses to turbidity variations and generate data for habitat suitability assessment. In Korean riverine systems, sudden turbidity increases can result from weir and dam operations. This investigation focuses on native fish species in Korea, analyzing behavioral responses to turbidity and physiological conditions under prolonged exposure. The experimental design incorporates open waterway and indoor tank systems to examine immediate behavioral responses and long-term survival under varying turbidity conditions.

2. Fish Behavior Experiment

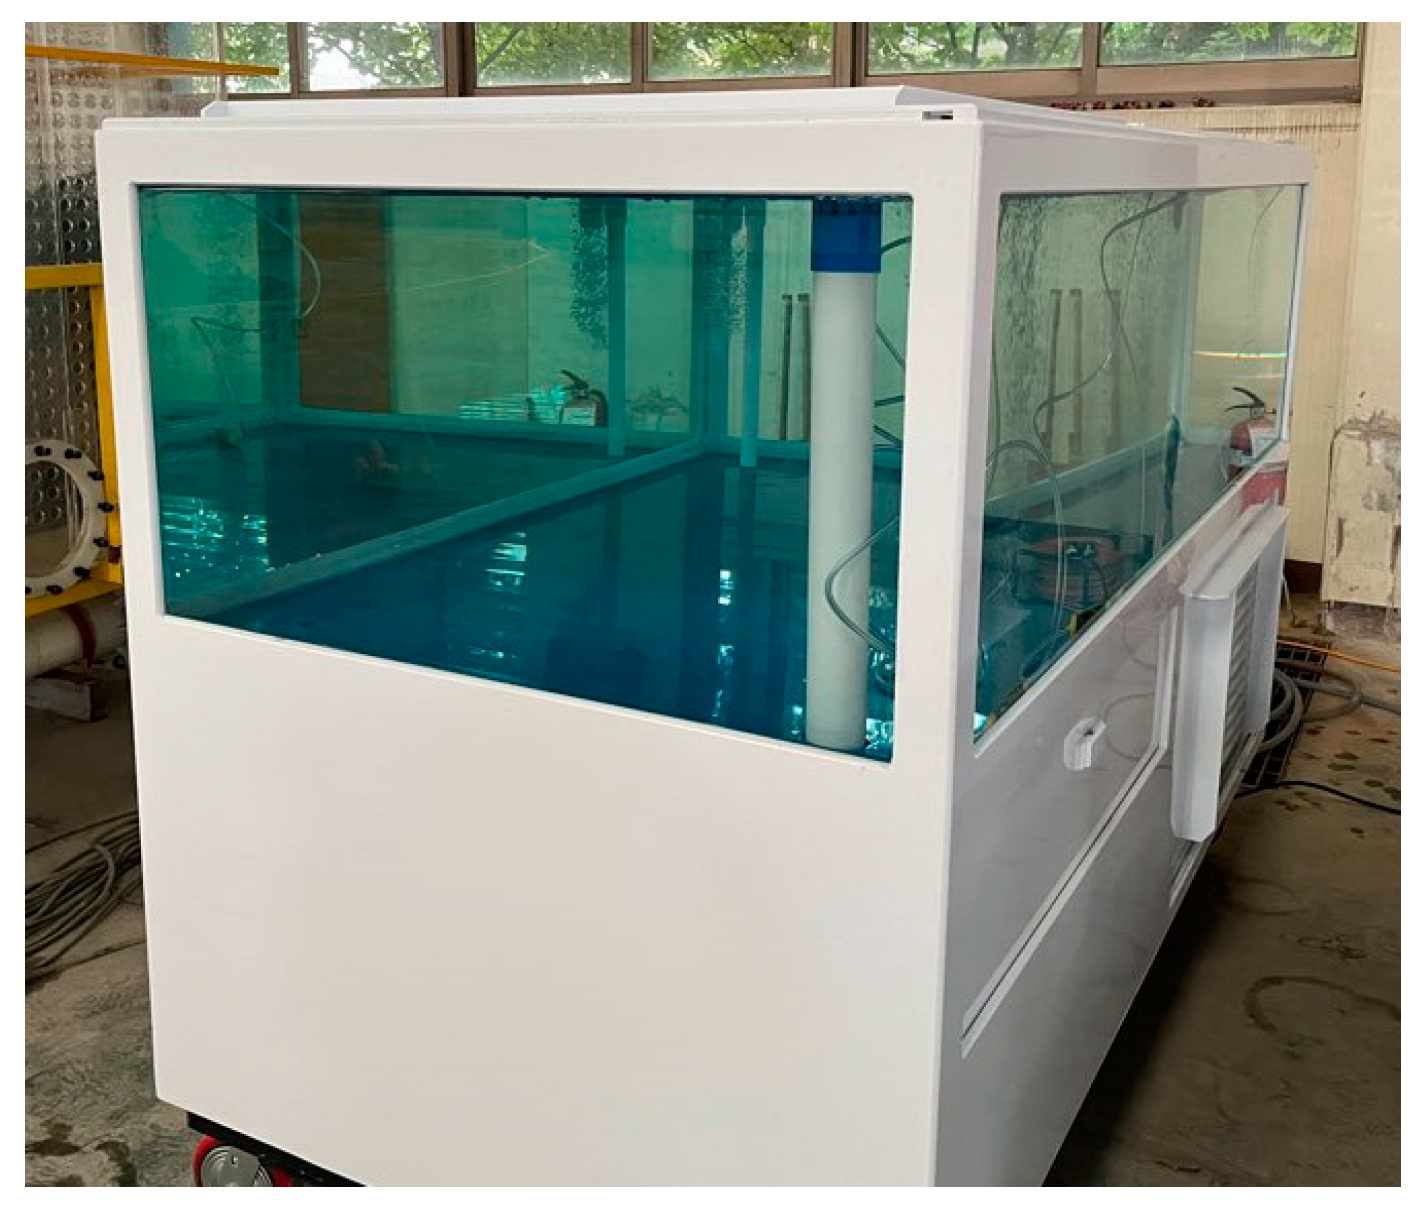
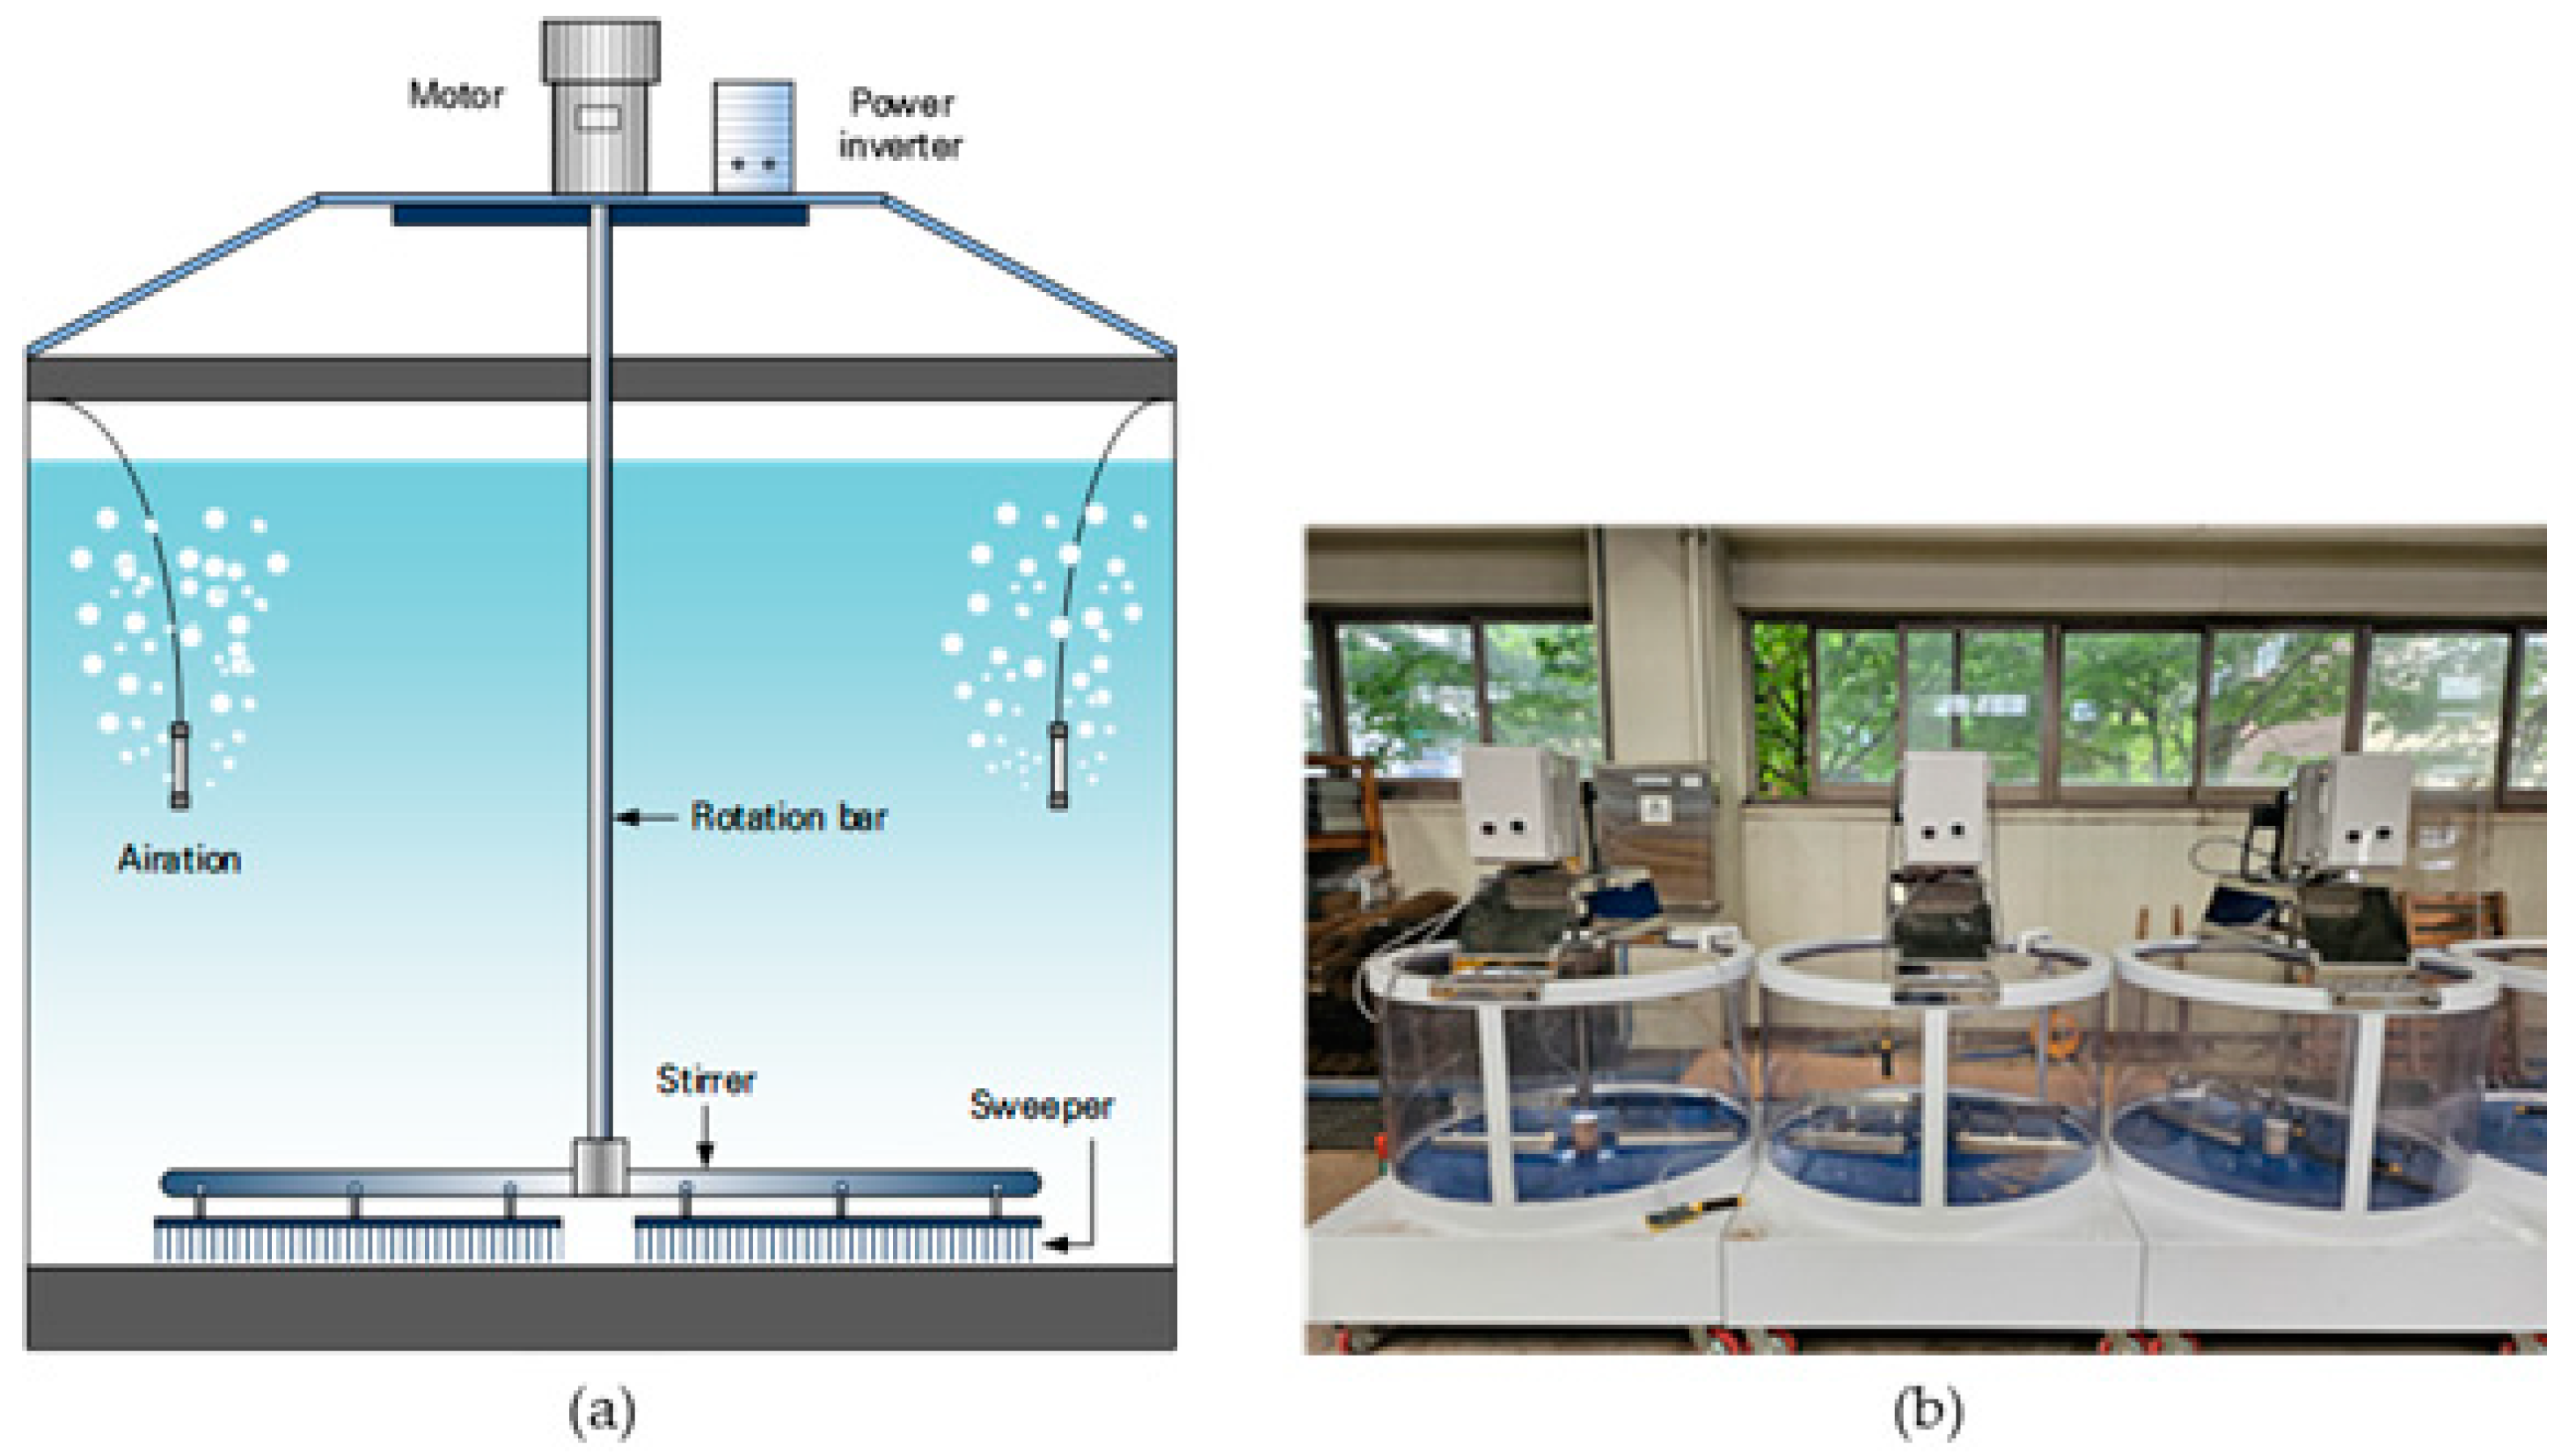
2.1. Fish Behavior Experiment Setup

An experimental investigation was conducted to analyze how fish behavioral responses to suspended sediments, with particular emphasis on avoidance behaviors during hydraulic structure operations such as weir releases. The experimental design involved a segmented waterway featuring distinct zones of turbid water, clear water, and mixing interfaces to evaluate fish movement patterns. This design specifically addressed the capability of fish to navigate toward zones of reduced turbidity when encountering suspended sediments. The experimental apparatus was installed at the Andong River Experiment Center (Figure 1, Figure 2 and Figure 3). The primary experimental waterway consisted of a channel measuring 50 m in length, 2 m in width, and 1.2 m in height. Suspended sediment generation was achieved using a stainless-steel mixing unit with specifications of 900 mm diameter, 360 mm height, 40 kg in weight, 250 L capacity, and 42 rpm/min operating speed. Instrumentation included a turbidimeter(WQC-30,TOA-DKK, Kanagawa, Japan) for water quality monitoring and standard video cameras(C3WN, EZVIZ, Seoul, Korea). Yellow soil powder (325 mesh) was utilized as the suspended sediment source material—the experimental subjects comprised fish species indigenous to the Nakdonggang River system.

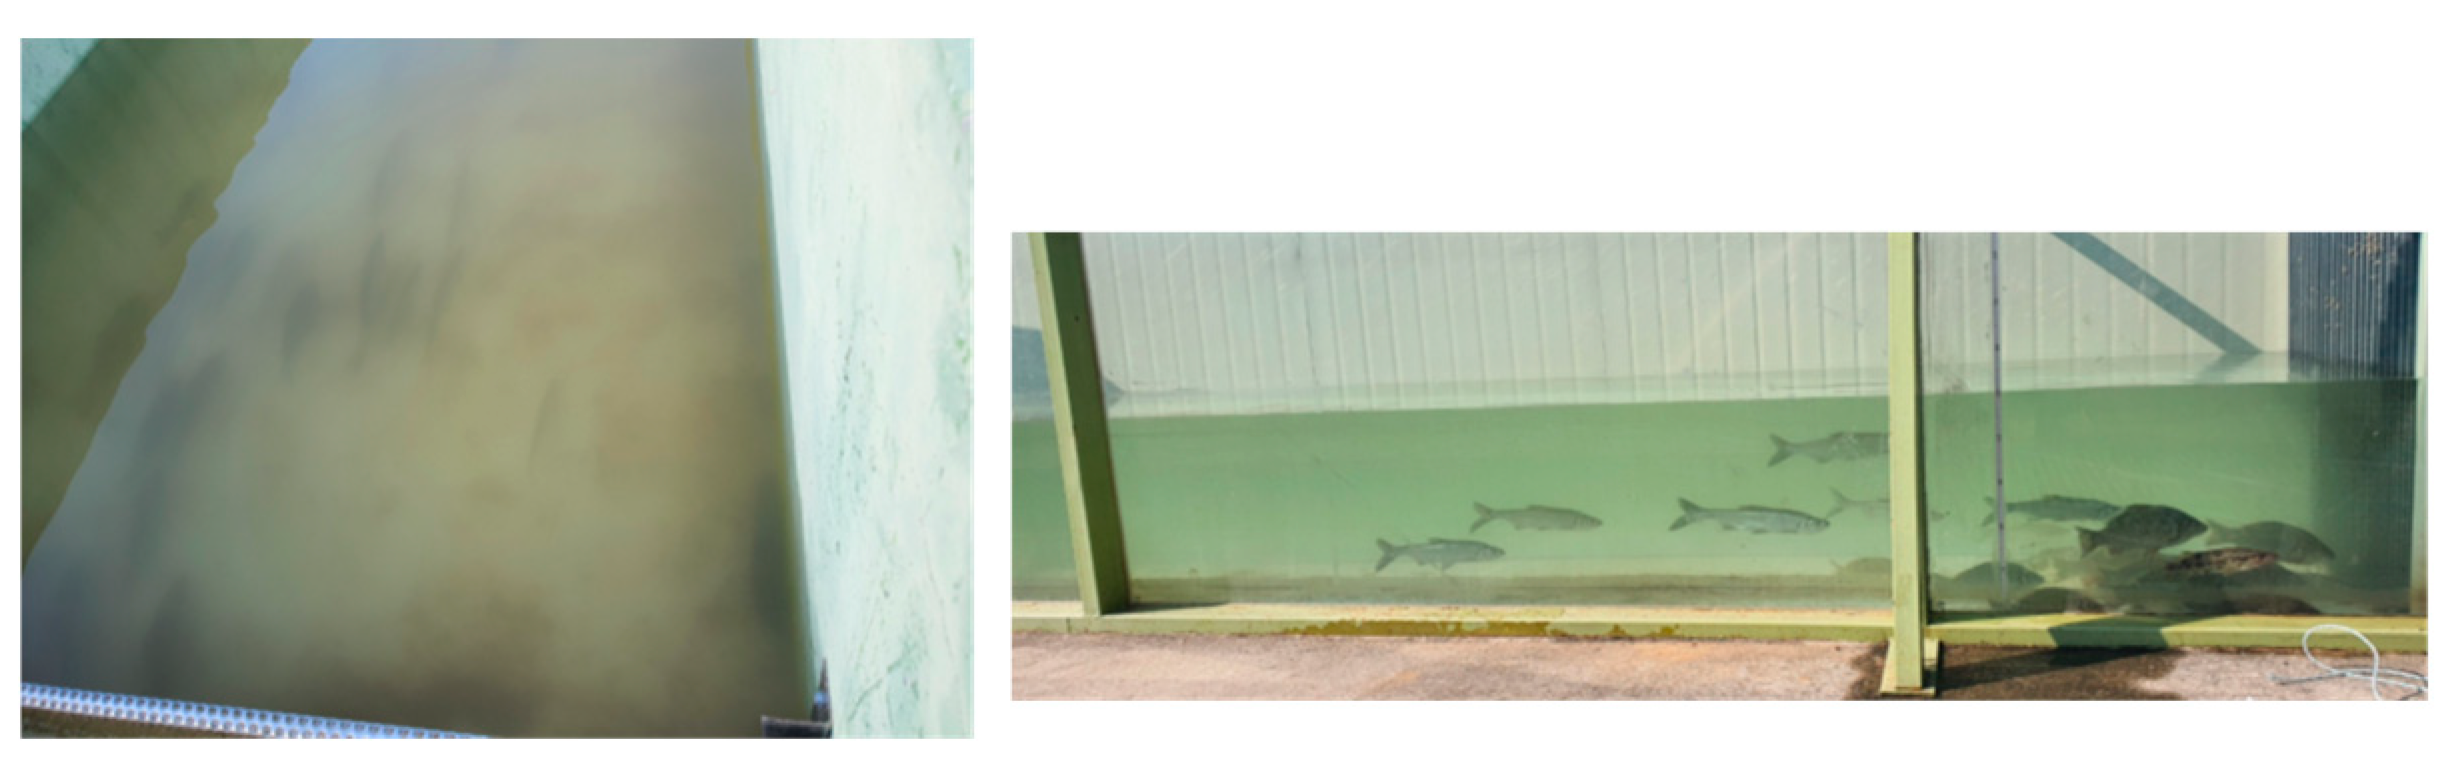
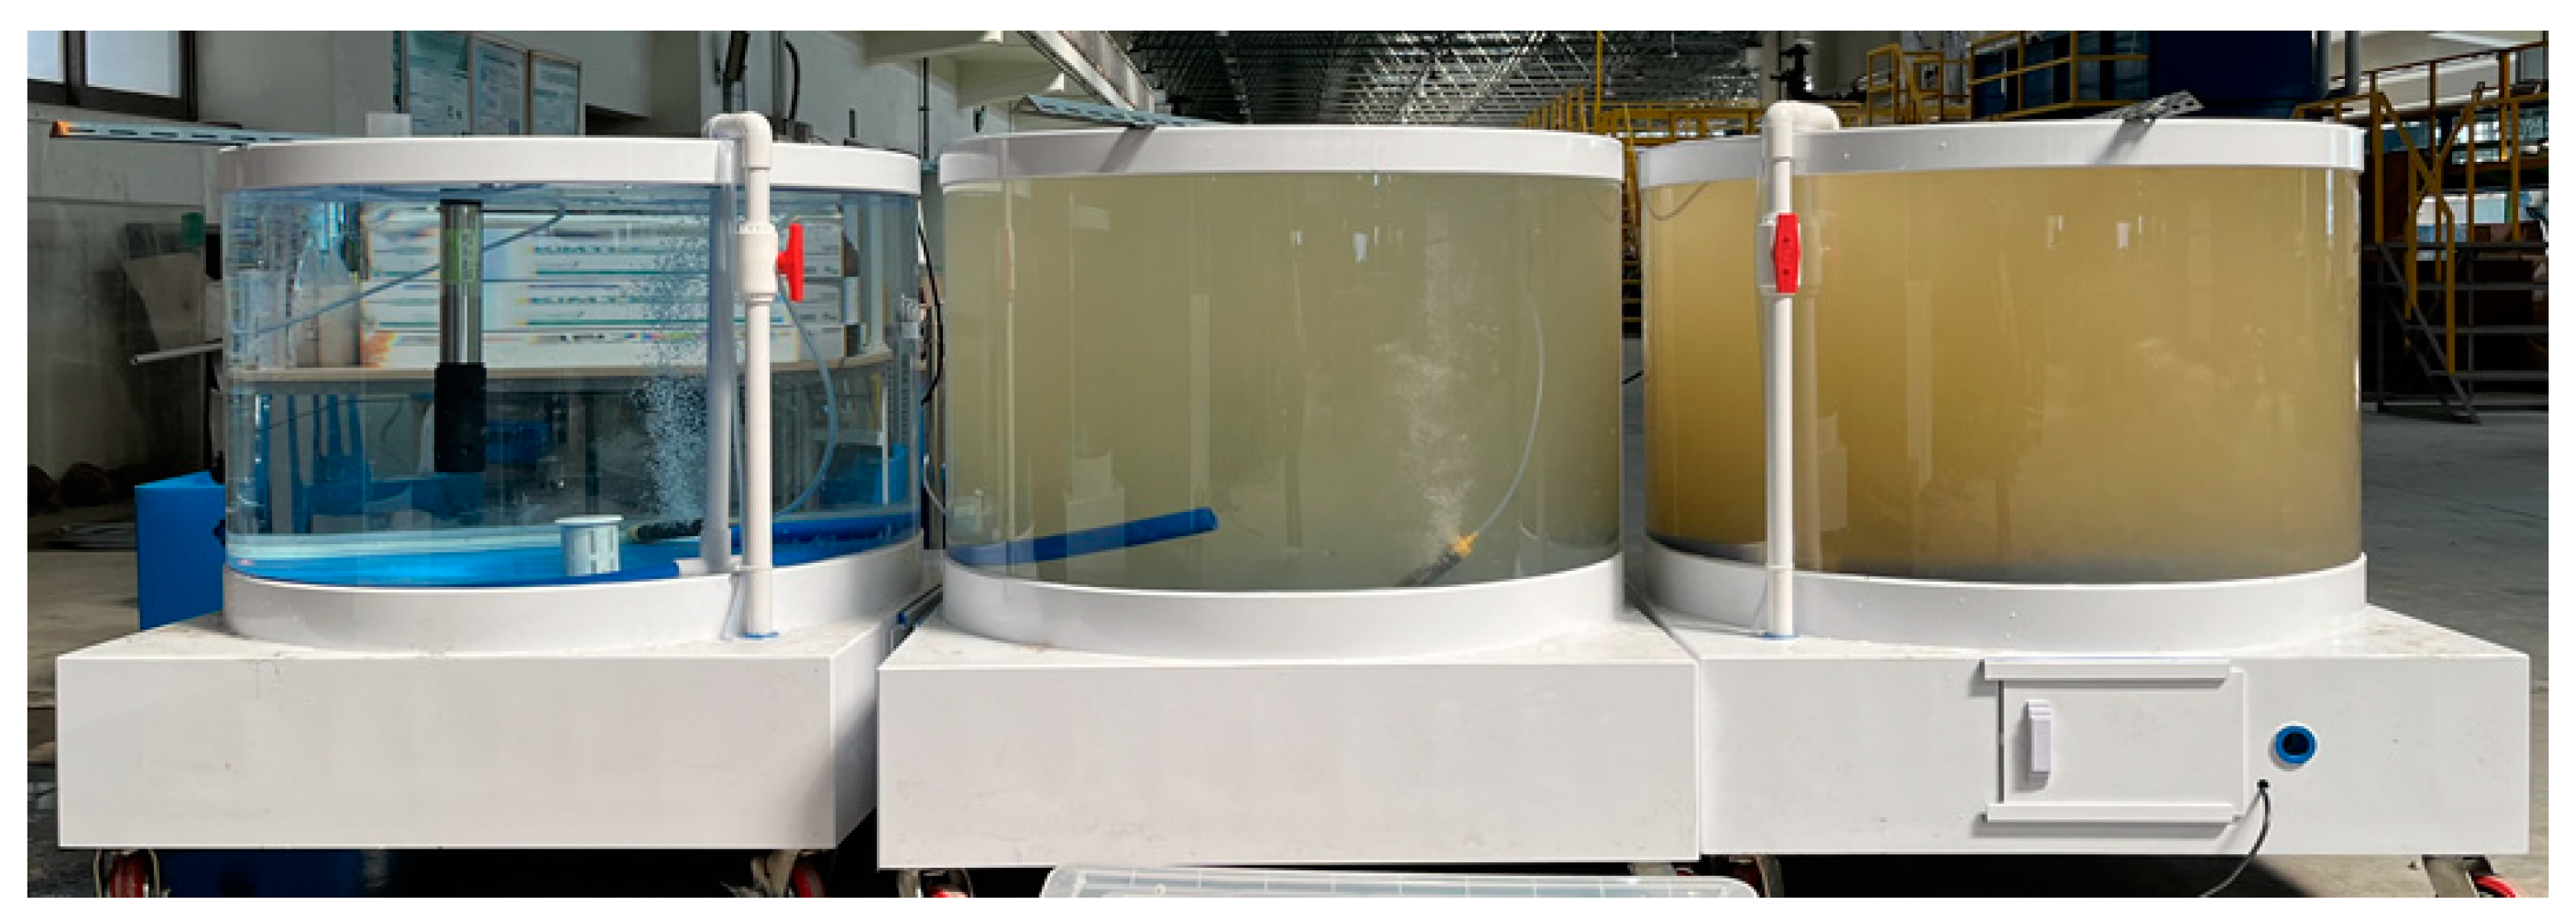
2.2. Experiment on Fish Behavior Under Turbidity Conditions (Aquarium Systems)

The experimental design was predicated on the hypothesis that fish would exhibit avoidance behavior when suspended solid concentrations exceeded certain thresholds in upstream regions. The investigation incorporated qualitative and quantitative analytical approaches to examine fish behavioral responses to suspended sediment introduction. Qualitative analysis focused on directional movement patterns, including upstream or downstream migration responses to suspended sediment exposure. The quantitative study examined the proportion of fish exhibiting behavioral responses to suspended sediment introduction. Experimental parameters were established using turbidity baseline data from the Nakdonggang River (Table 1). Hydraulic conditions for fish behavior were determined by analyzing migration characteristics data for 115 fish species, as documented in the Ministry of Environment’s Guidelines on the Investigation and Evaluation of Aquatic Ecosystem Continuity [14]. The review established operational parameters of 2–33 cm for minimum floating depth and 70–490 cm/s for maximum floating speed. The experimental protocol for examining fish migration responses to suspended sediment exposure was designed to assess behavioral reactions across varying suspended solid concentrations (Figure 4). The methodology incorporated a five-minute suspended solid exposure period to observe immediate behavioral responses. Experimental conditions were stratified across three flow velocity levels and a gradient of suspended solid concentrations from low to high (Table 2).
The experimental subjects comprised seven fish species native to the local river system: Zacco platypus, Pseudopungtungia nigra, Zacco koreanus, Carassius carassius, Rhynchocypris oxycephala, Cyprinus rubrofuscus, and Tanakia lanceolata. The fish used in the experiment were mature individuals over 10 cm in length, captured from Andong Dam. Field collection methodology introduced inherent variability in specimen size and abundance across species. Behavioral responses were quantified through digital image analysis protocols. As an initial investigation into suspended sediment effects on fish behavior, the experimental design required multiple iterations to optimize hydrodynamic parameters, including suspended solid concentrations and flow velocities. The recirculating flow design resulted in progressive concentration increases across successive trials, necessitating periodic water replacement to maintain experimental conditions. Specimen welfare monitoring constituted a critical component of the experimental protocol, with continuous assessment of mobility patterns and behavioral responses as key indicators of fish condition (Figure 5).
Initial observations in control conditions (turbidity ≤ 10 NTU) revealed species-specific variations in upstream swimming behavior under flowing conditions. Iterative testing demonstrated consistent upstream migration patterns at turbidity levels below 20 NTU. While behavioral responses to suspended sediments were observable across multiple trials, precise concentration-dependent effects proved challenging to quantify. The experimental protocol prioritized specimen conditioning, with a two-day acclimation period preceding experimental trials. Specimens were sourced from Andong and Imha Lakes. Experimental parameters were standardized with yellow soil powder at 1000 g, and the sediment supply device was maintained at a water level of 25 cm, volume of 159 m3, and valve aperture of 60°. Flow conditions were established at a velocity of 0.13 m/s with a water level of 50 cm. Specimen placement protocols included positioning at the experimental waterway’s suspended sediment inlet or downstream sections. Specimens were positioned within the sediment introduction zone to evaluate avoidance behaviors and downstream migration patterns in response to suspended sediment introduction. Two distinct behavioral patterns emerged following the introduction of suspended sediment. The primary response involved vertical migration to deeper water strata, followed by upstream movement after suspended sediment concentrations diminished.
As illustrated in Figure 6, specimens exhibited preferential movement toward reduced suspended sediment concentration zones, followed by upstream migration after sediment concentration reduction, rather than immediate upstream avoidance behavior (Table 3).

3. Experiment on Fish Conditions at Different Levels of Suspended Solids Concentration

The experimental tank system incorporated sophisticated mechanisms for suspended solid concentration control. This tank was engineered to regulate experimental parameters precisely, including flow dynamics, temperature, and oxygen concentration. An automated suspended solid addition and removal system maintained consistent particle concentrations throughout the experimental period. The tank’s circulation system was designed to ensure homogenous particle distribution throughout the water column (Figure 7).
The suspended solid generator is a device that enables controlled production and injection of particles at varying concentrations, with capabilities for precise regulation of particle size distribution and concentration levels. The system allowed for steady-state maintenance and gradual modification of suspended solid concentrations as experimental protocols required. The experimental tank utilized a circular design with dimensions of 1000 cm in diameter and 600 cm in height. This system was equipped with integrated bubble generation and water circulation mechanisms. A variable control valve modulated circulation intensity to accommodate the unrestricted swimming behavior of smaller fish specimens.
Water quality monitoring devices are instruments used to measure and monitor various critical physicochemical parameters, including suspended solid concentration, turbidity, pH, temperature, and dissolved oxygen. Real-time data acquisition systems enabled continuous monitoring of water quality parameters throughout the experimental period: turbidimetric measurements, directly and indirectly, quantified suspended solids concentration in real time.
The behavioral monitoring system integrated video capture technology with analytical software to quantify fish behavioral patterns, including movement trajectories, avoidance responses, and feeding activities. This system facilitated quantitative analysis of stress responses and avoidance behaviors through real-time computational processing.
Water quality parameters were monitored using a turbidimeter(WQC-30,TOA-DKK, Japan) multi-parameter analysis system capable of simultaneously measuring six parameters: pH, temperature, turbidity, electrical conductivity, salinity, and dissolved oxygen. The instrument’s proprietary software enabled continuous data logging and analysis. Turbidity and auxiliary water quality parameters were monitored to evaluate turbidity-induced migration responses while maintaining consistency in other environmental variables.
The experimental design focused on three native fish species inhabiting middle to upper water strata in Korean rivers—Zacco platypus, Pseudopungtungia nigra, and Zacco koreanus—to evaluate migration patterns, avoidance behaviors, and mortality rates in response to turbidity variations (Figure 8).
The methodological framework, illustrated in Figure 2, comprised three experimental cases (Cases 1–3) with four turbidity variation protocols (Types 1–4). Selected specimens ranged from 5 to 10 cm long and underwent a 24 h acclimation in temperature-controlled tanks. Given the specimens’ sensitivity to thermal and environmental perturbations, acclimation tanks maintained optimal temperatures between 15 °C and 20 °C to minimize stress-induced mortality. Turbidity was generated using fine-particle yellow soil powder (325 mesh) (Figure 9).
Case 1, utilizing Zacco platypus, implemented turbidity conditions of ±100 NTU (Type 1-1), ±200 NTU (Type 1-2), ±300 NTU (Type 1-3), and a maximum turbidity of ±880 NTU (Type 1-4). Case 2 replicated these conditions using Pseudopungtungia nigra specimens. Both Cases 1 and 2 revealed limitations in turbidity maintenance because of the absence of suspension maintenance systems, necessitating periodic tank flushing to restore target turbidity levels (Figure 10, Figure 11 and Figure 12).
Case 3 incorporated a newly developed turbidity maintenance agitation system to achieve consistent suspended solid concentrations. This protocol utilized Zacco koreanus specimens with turbidity levels of ±150 NTU (Type 1), ±300 NTU (Type 2), and ±700 NTU (Type 3). Types 1–3 maintained experimental durations exceeding 10 days, while Type 4 extended beyond 20 days with reduced water volume to examine prolonged exposure effects at elevated turbidity levels.
Video monitoring systems documented fish movement patterns and feeding behaviors in all experimental tanks. Water quality parameters, including turbidity, pH, dissolved oxygen, and temperature, were recorded at five-minute intervals to identify potential confounding factors in mortality events.

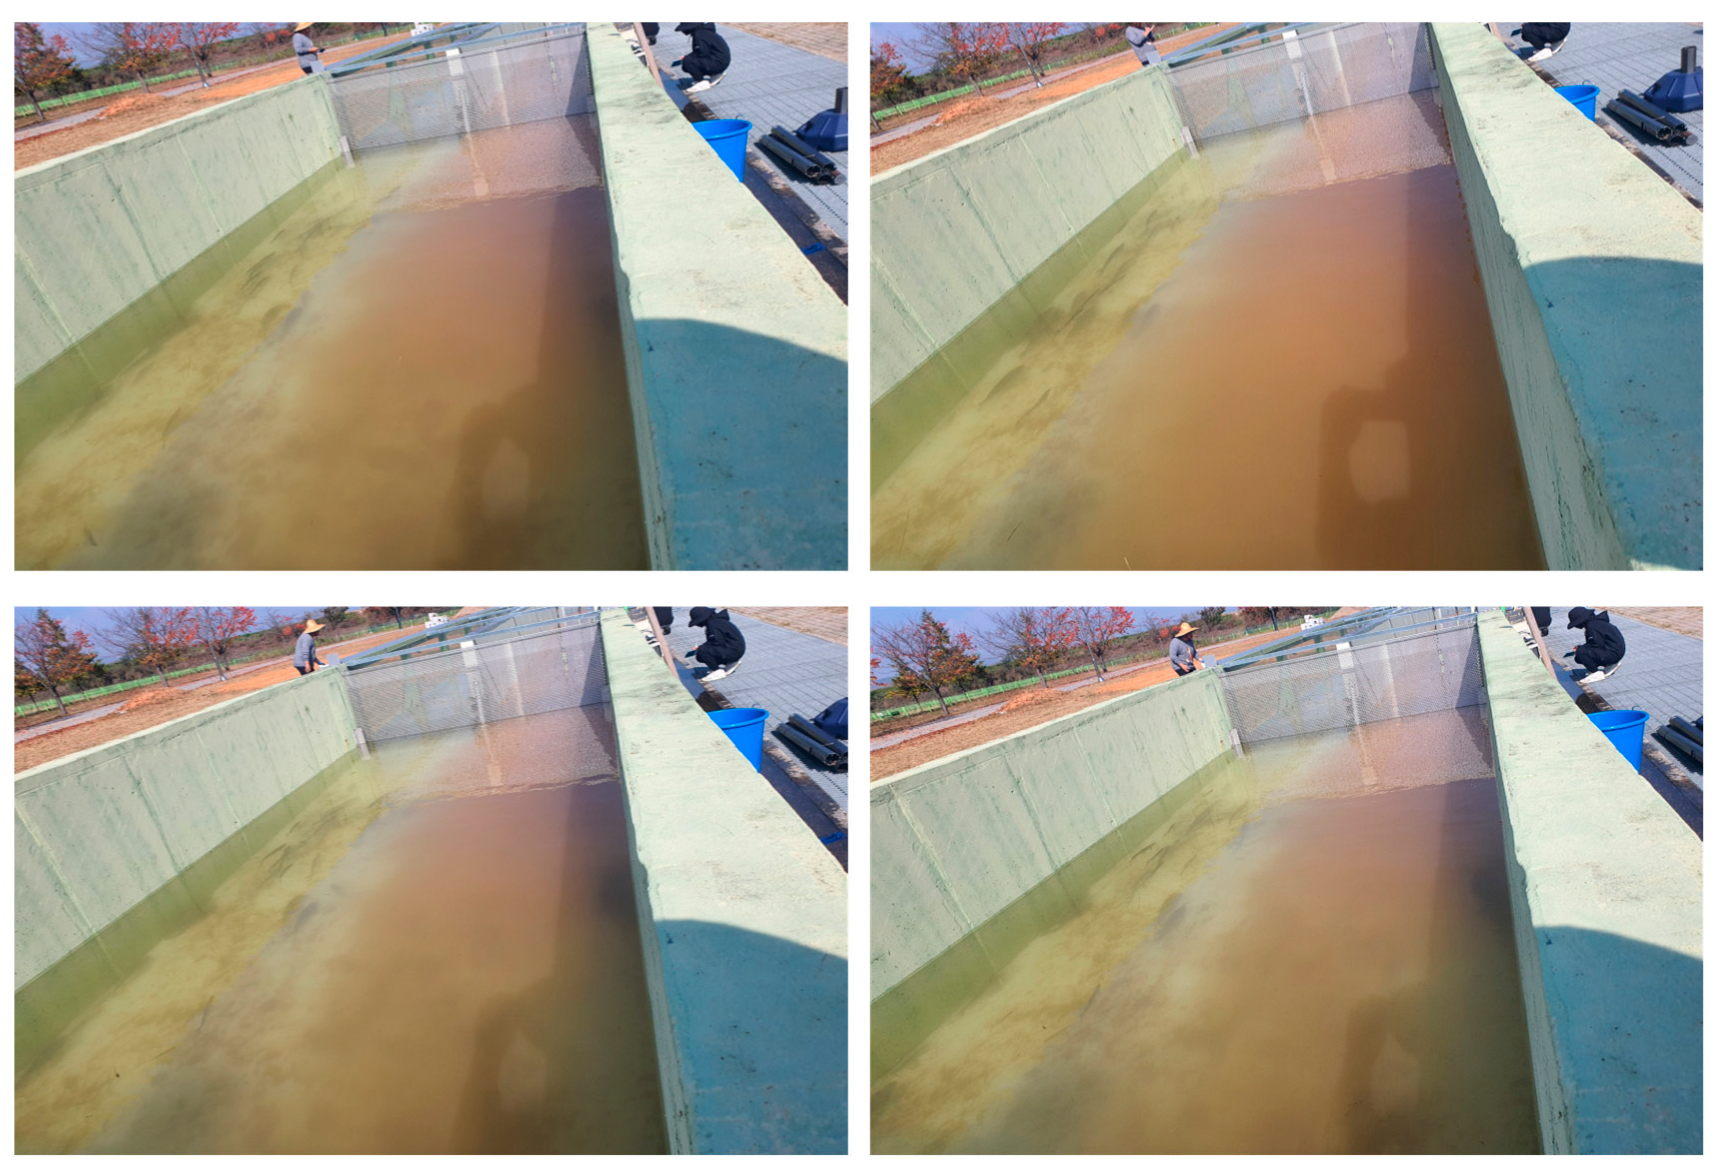
3.1. Analysis of Water Quality Changes

Long-term monitoring of water quality parameters—including turbidity, temperature, pH, and dissolved oxygen—was conducted throughout the experimental period. The water quality analysis protocol was designed to isolate turbidity effects while maintaining continuous assessment of specimen conditions. Given the potential influence of multiple environmental variables on fish physiology and behavior, comprehensive parameter monitoring was essential to differentiate turbidity-specific impacts from other environmental factors. The graphical representation illustrates the temporal variation in measured parameters across the experimental duration (Figure 13).

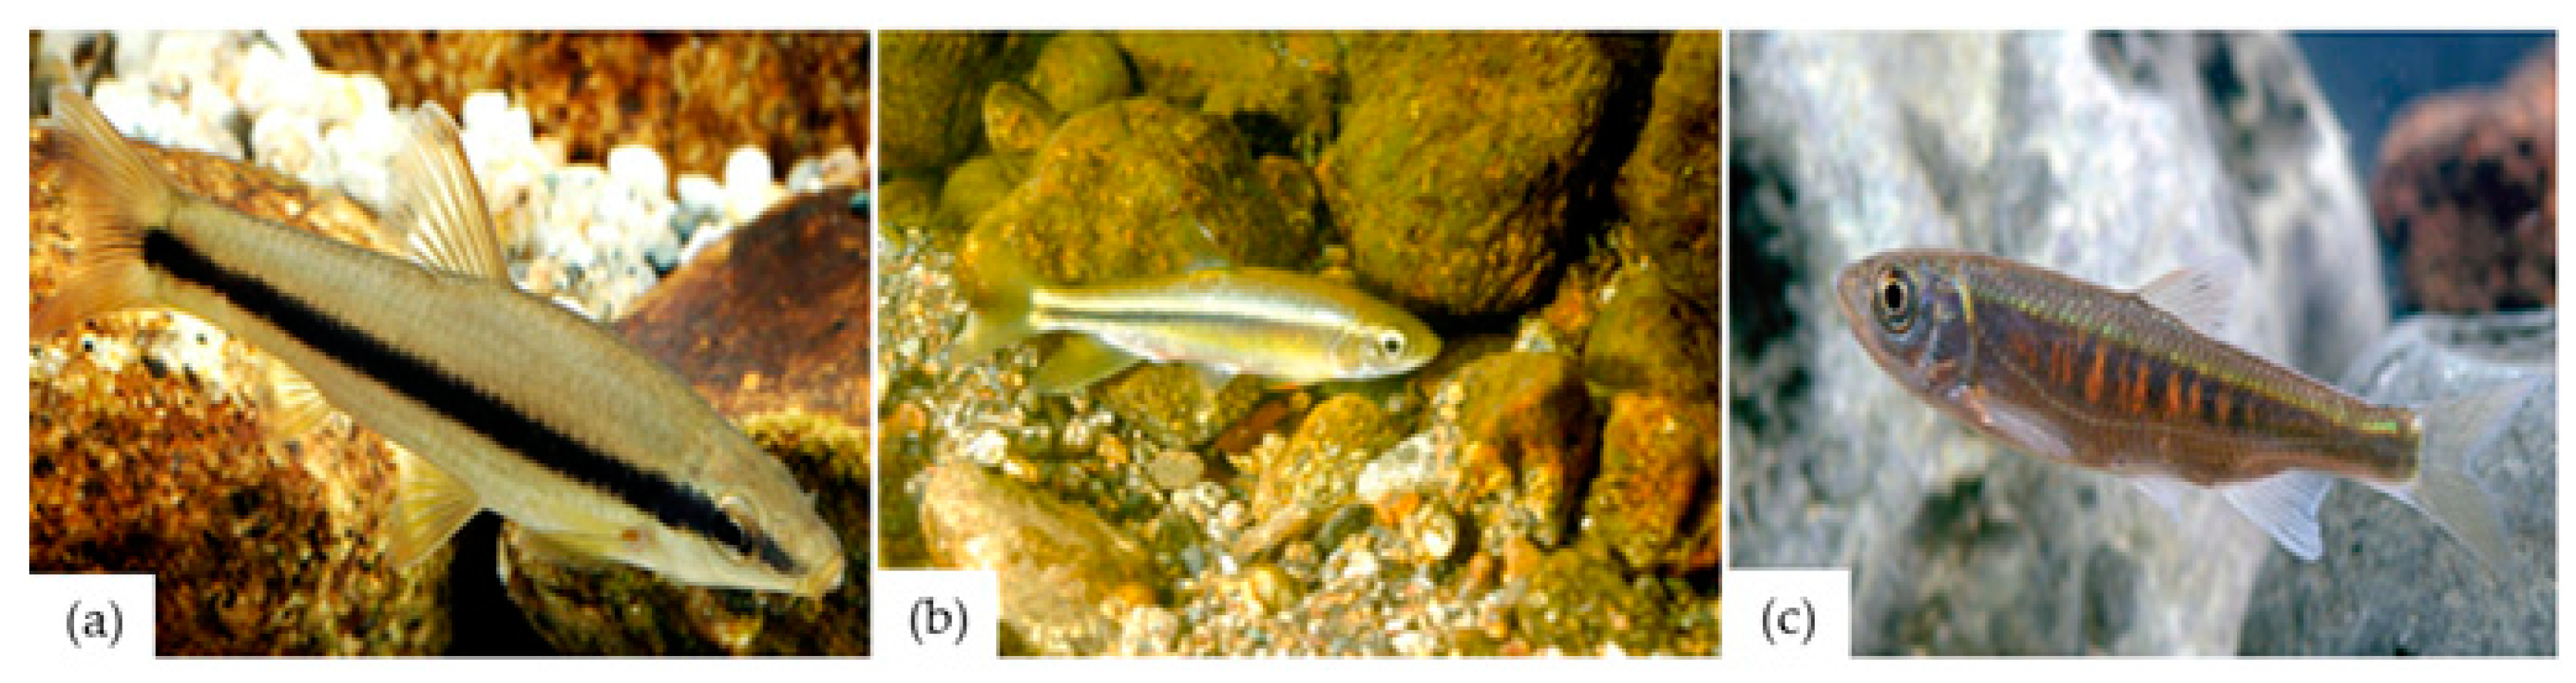
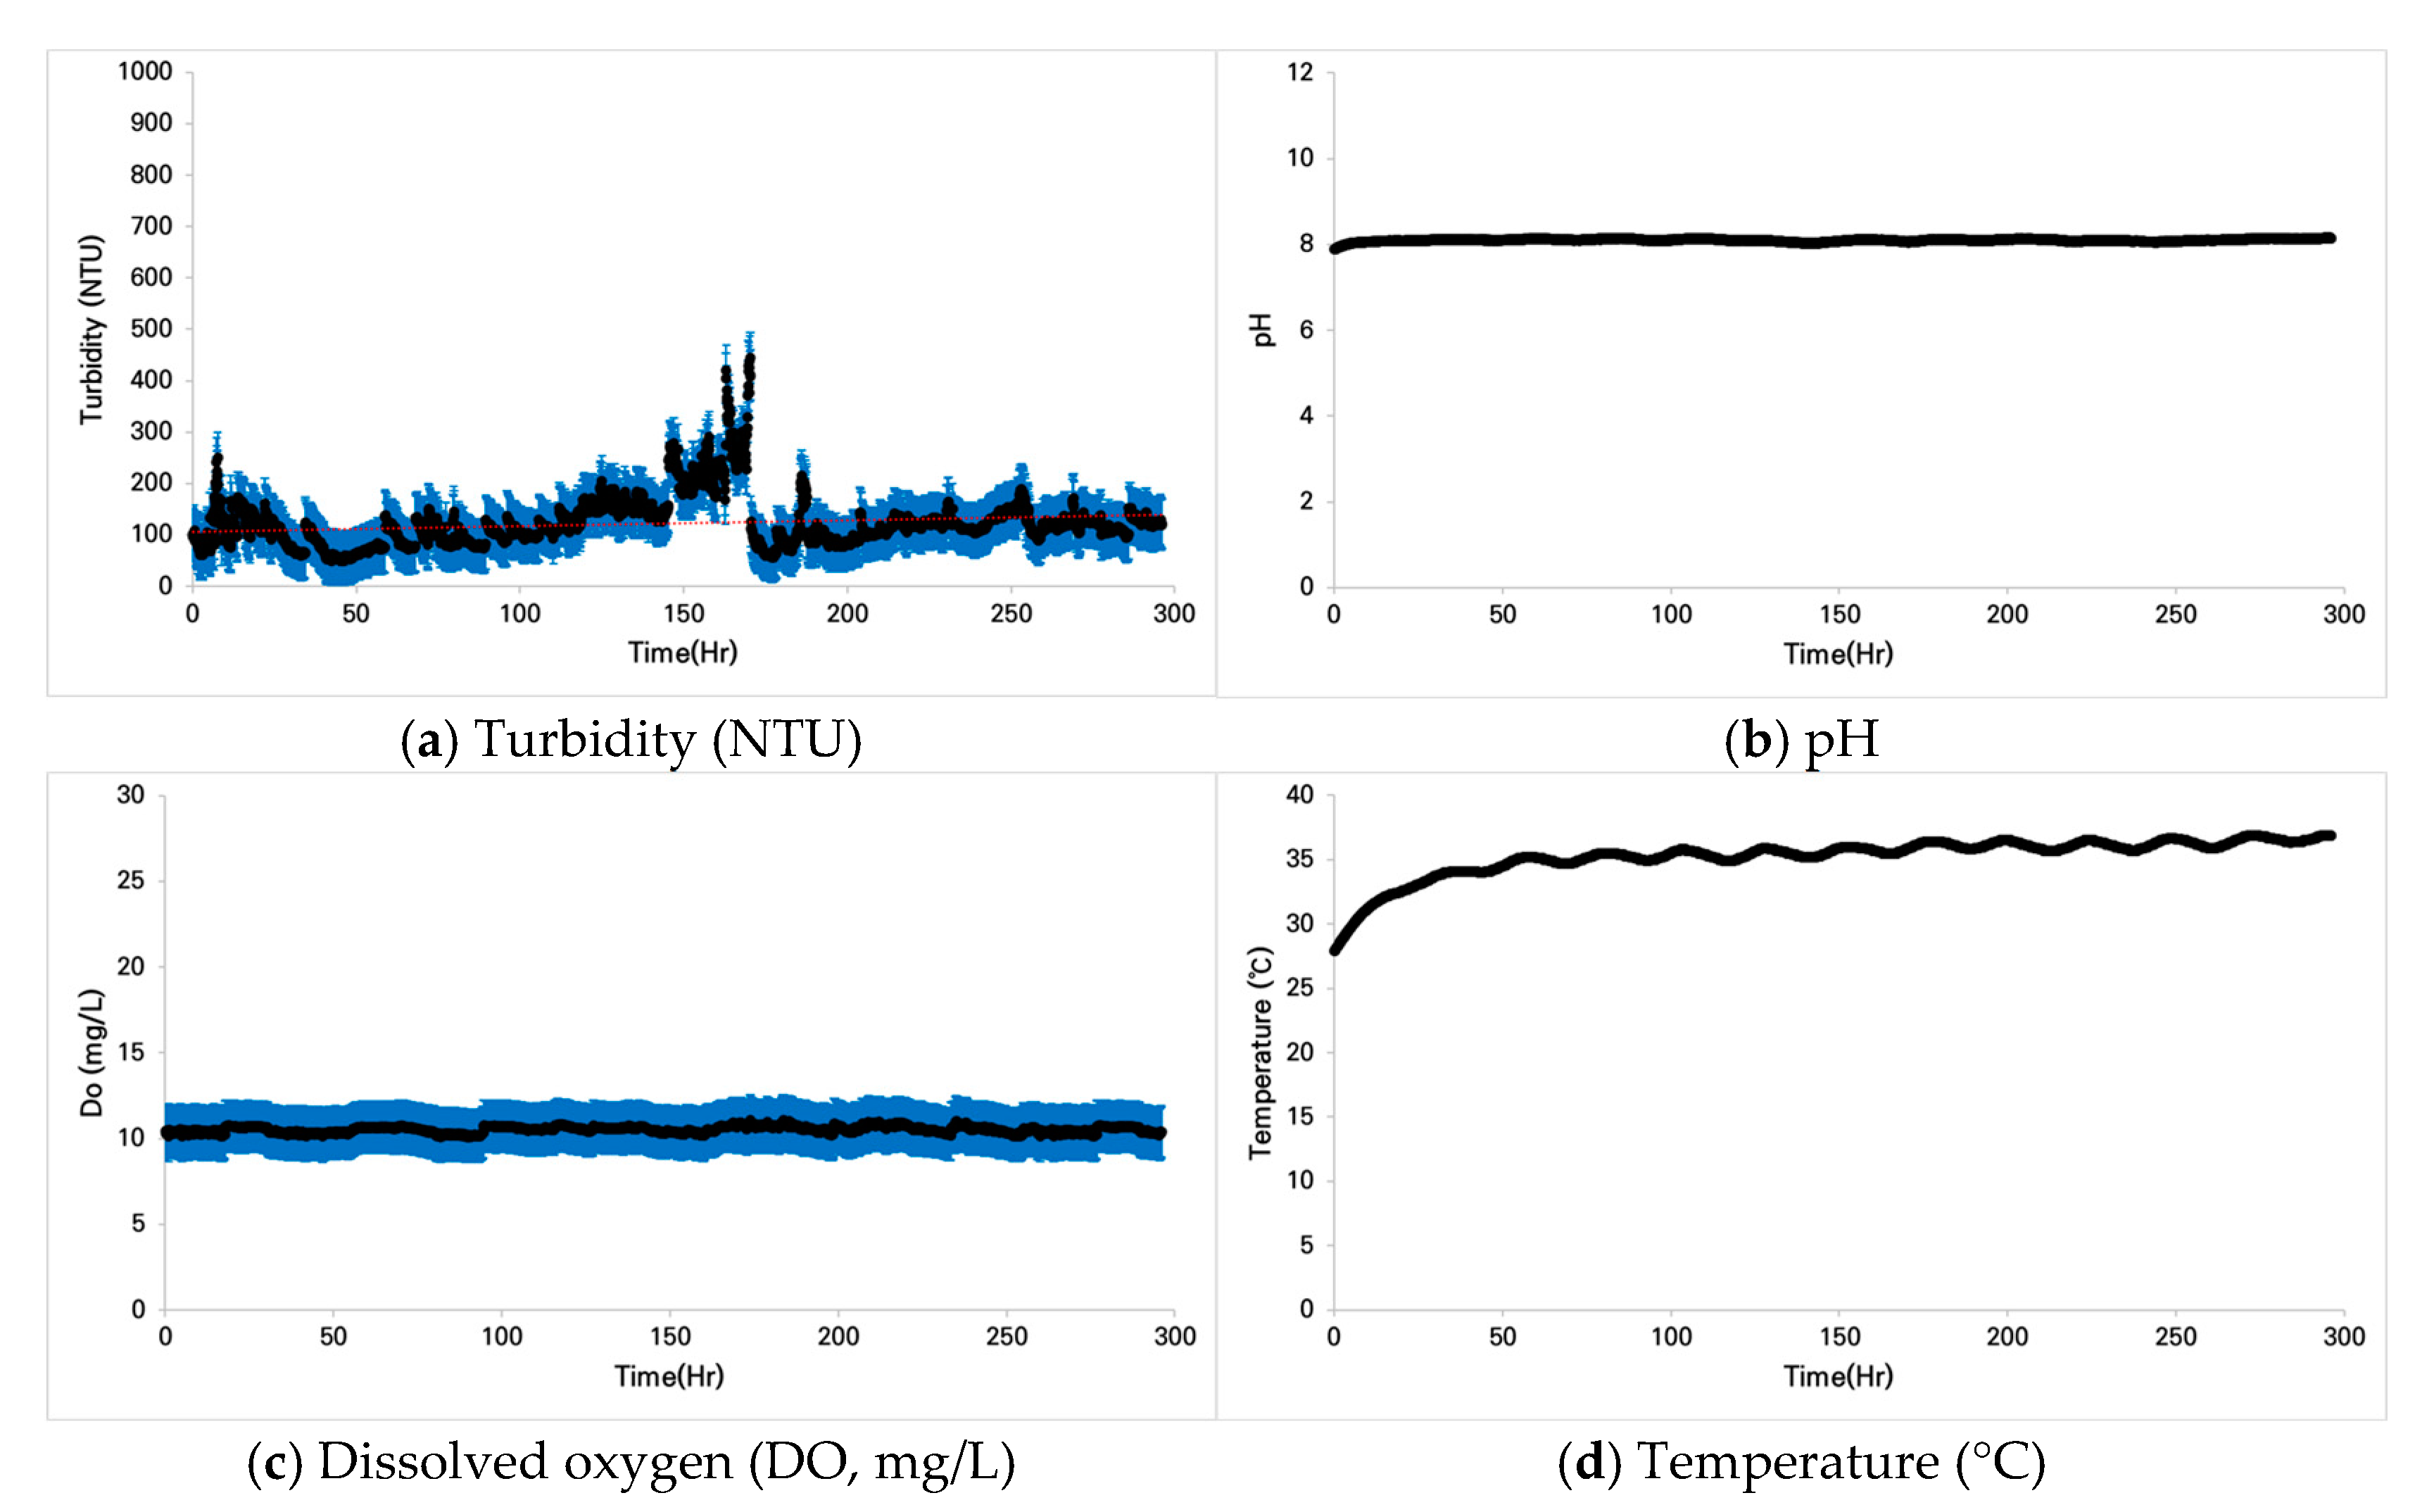
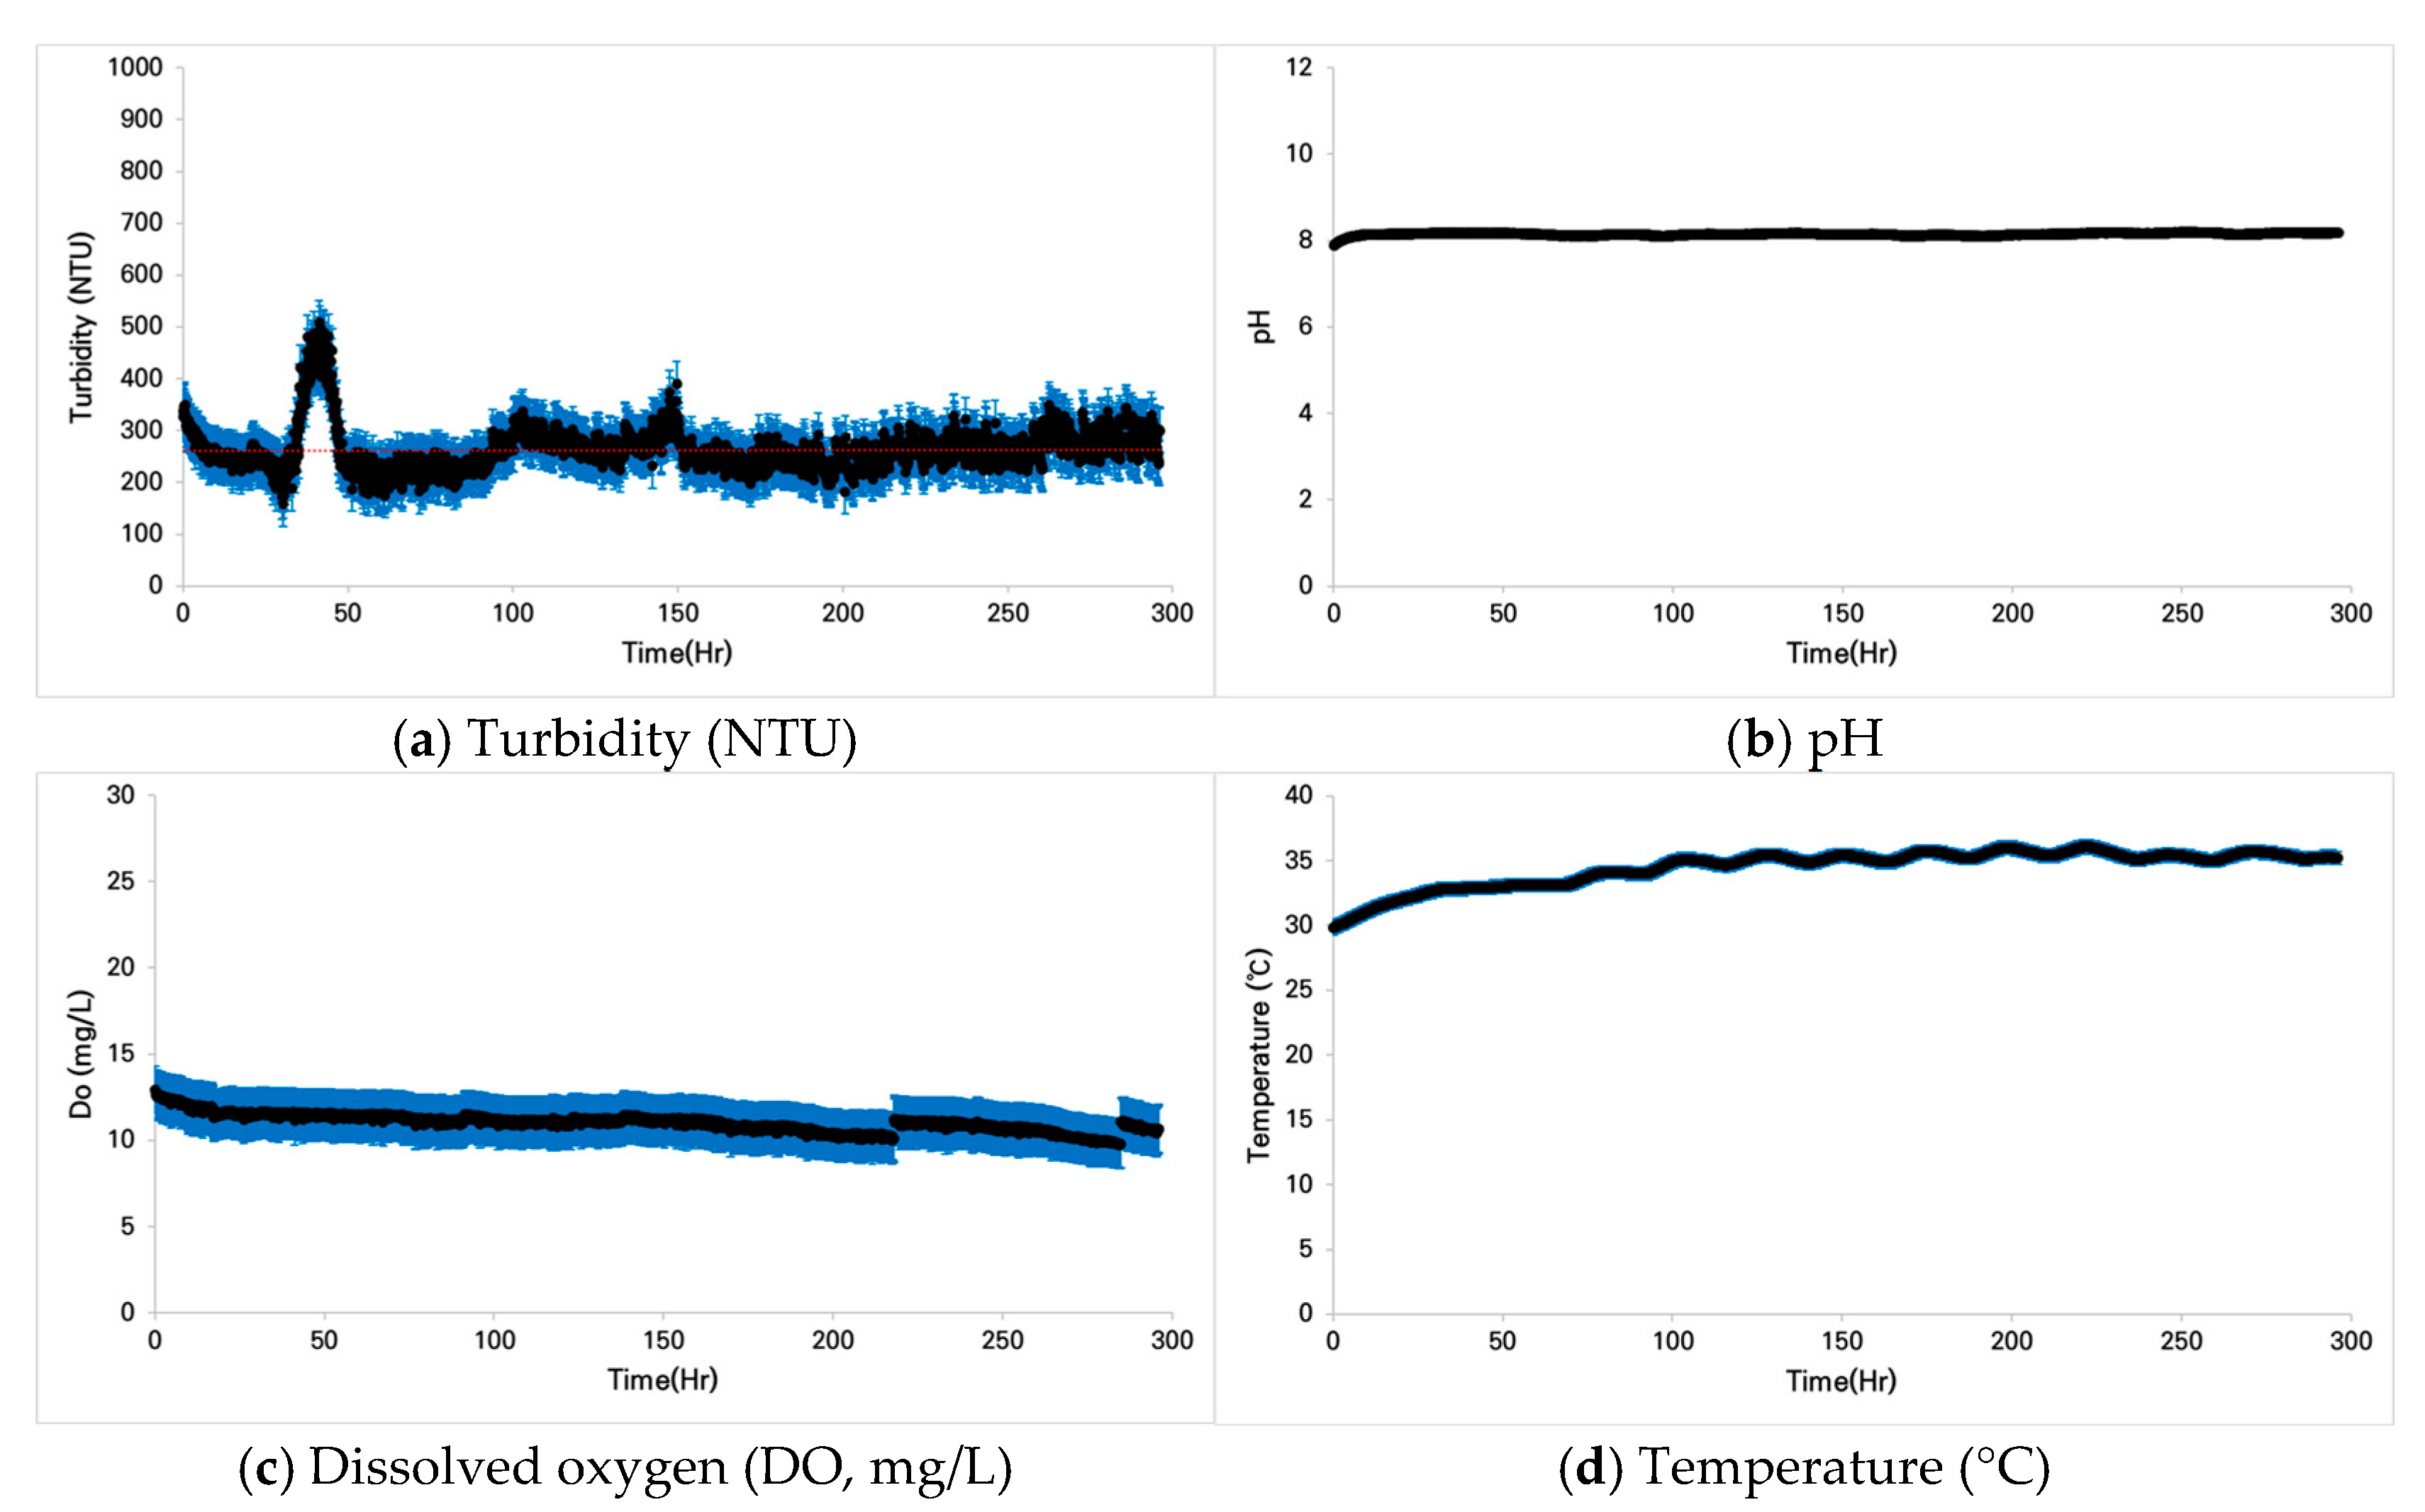
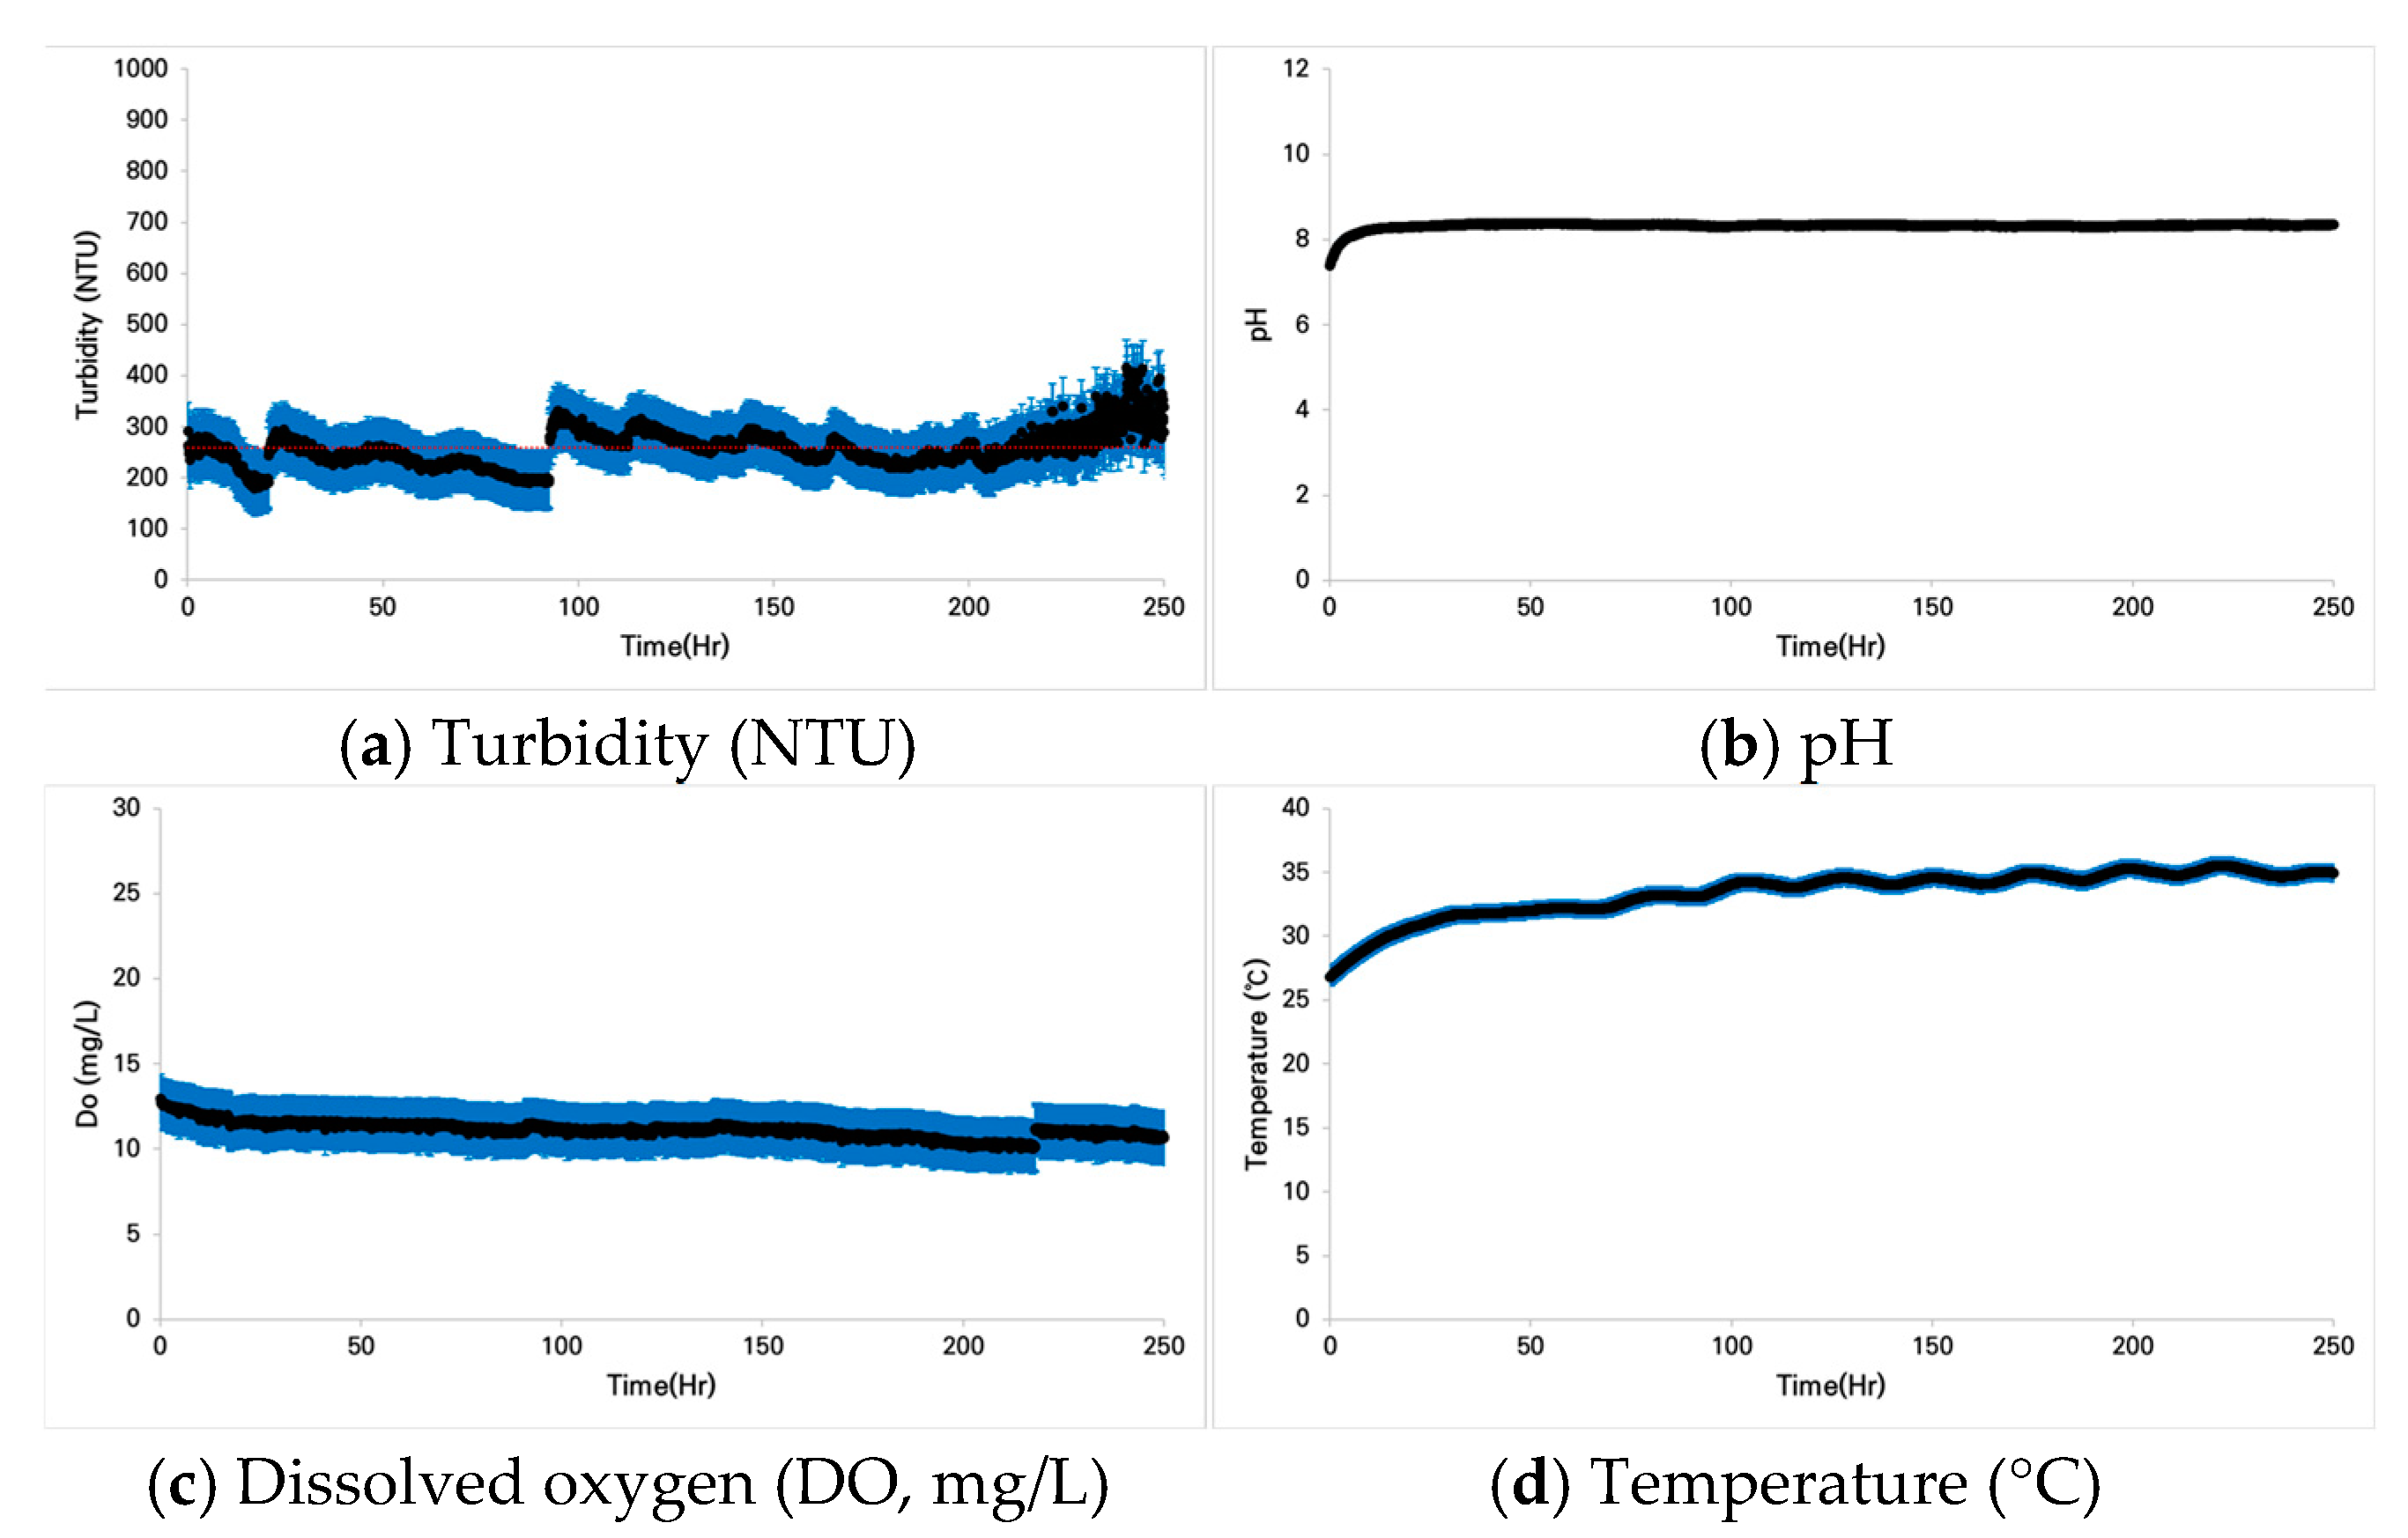
3.1.1. Case 1: Zacco platypus

In Case 1, Type 1 experiments were initiated at a target turbidity of ±100 NTU. However, the gravitational settling of yellow soil particles and particle aggregation processes resulted in progressive turbidity decline, necessitating periodic tank flushing. The mean turbidity value was maintained at 122 NTU, with temporary peaks reaching 400 NTU following flushing events. The pH remained relatively stable at approximately 8, approaching neutral conditions. Dissolved oxygen concentrations ranged from 10 to 11 mg/L. Ambient summer conditions resulted in water temperatures between 30 °C and 35 °C (Figure 14).
In Type 2, the initial NTU was around ±200 NTU, but the average was measured at 199 NTU, with a pH level of around 8. Dissolved oxygen tended to drop from an initial 13 mg/L to 10 mg/L, likely attributable to sustained water temperatures exceeding 35 °C (Figure 15).
For Type 3, the initial turbidity was around ±300 NTU, but it averaged 262 NTU. The pH level was approximately 8. Similar to Type 2, dissolved oxygen tended to decline to 13 mg/L, with the water temperature maintained at 35 °C or higher (Figure 16).
In Type 4, the initial NTU was ±880. However, despite continuous flushing, the average NTU was 439. The pH level was approximately 8, and the dissolved oxygen level exceeded 15 mg/L. This increase is likely due to the influence of the oxygen generator, as the water temperature dropped below 30 °C, unlike the previous experiments, and the water volume was relatively low (Figure 17).

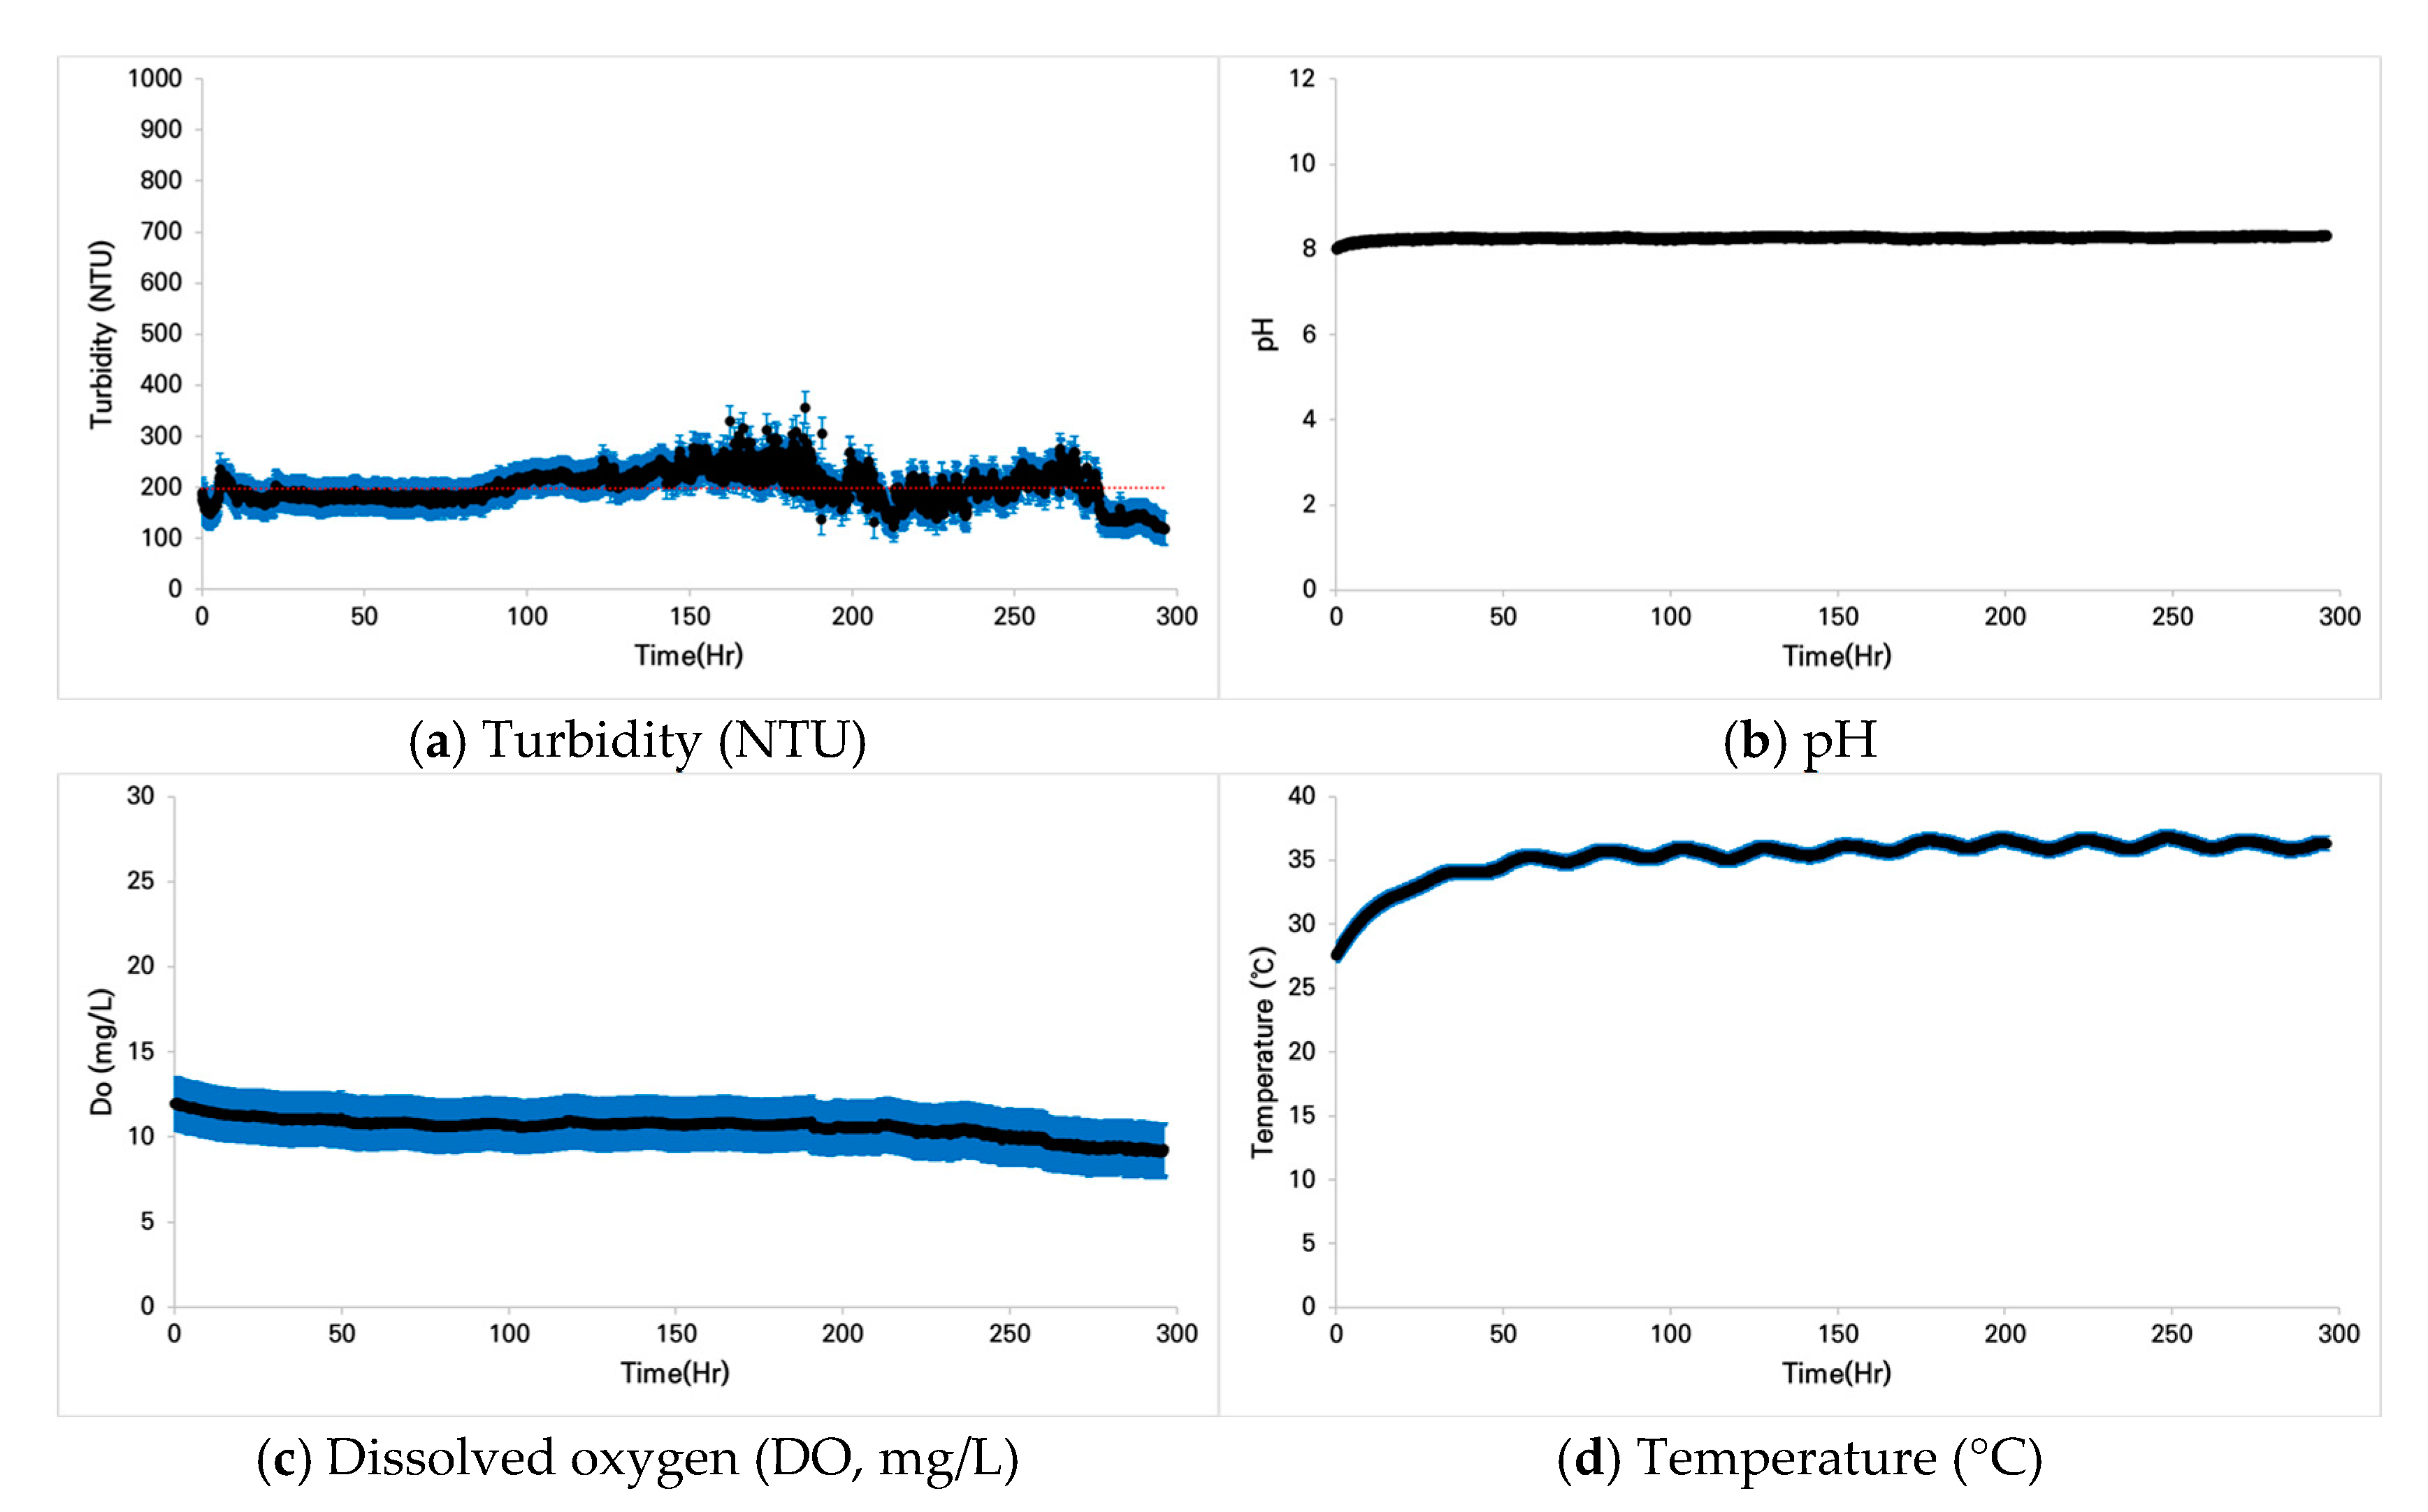
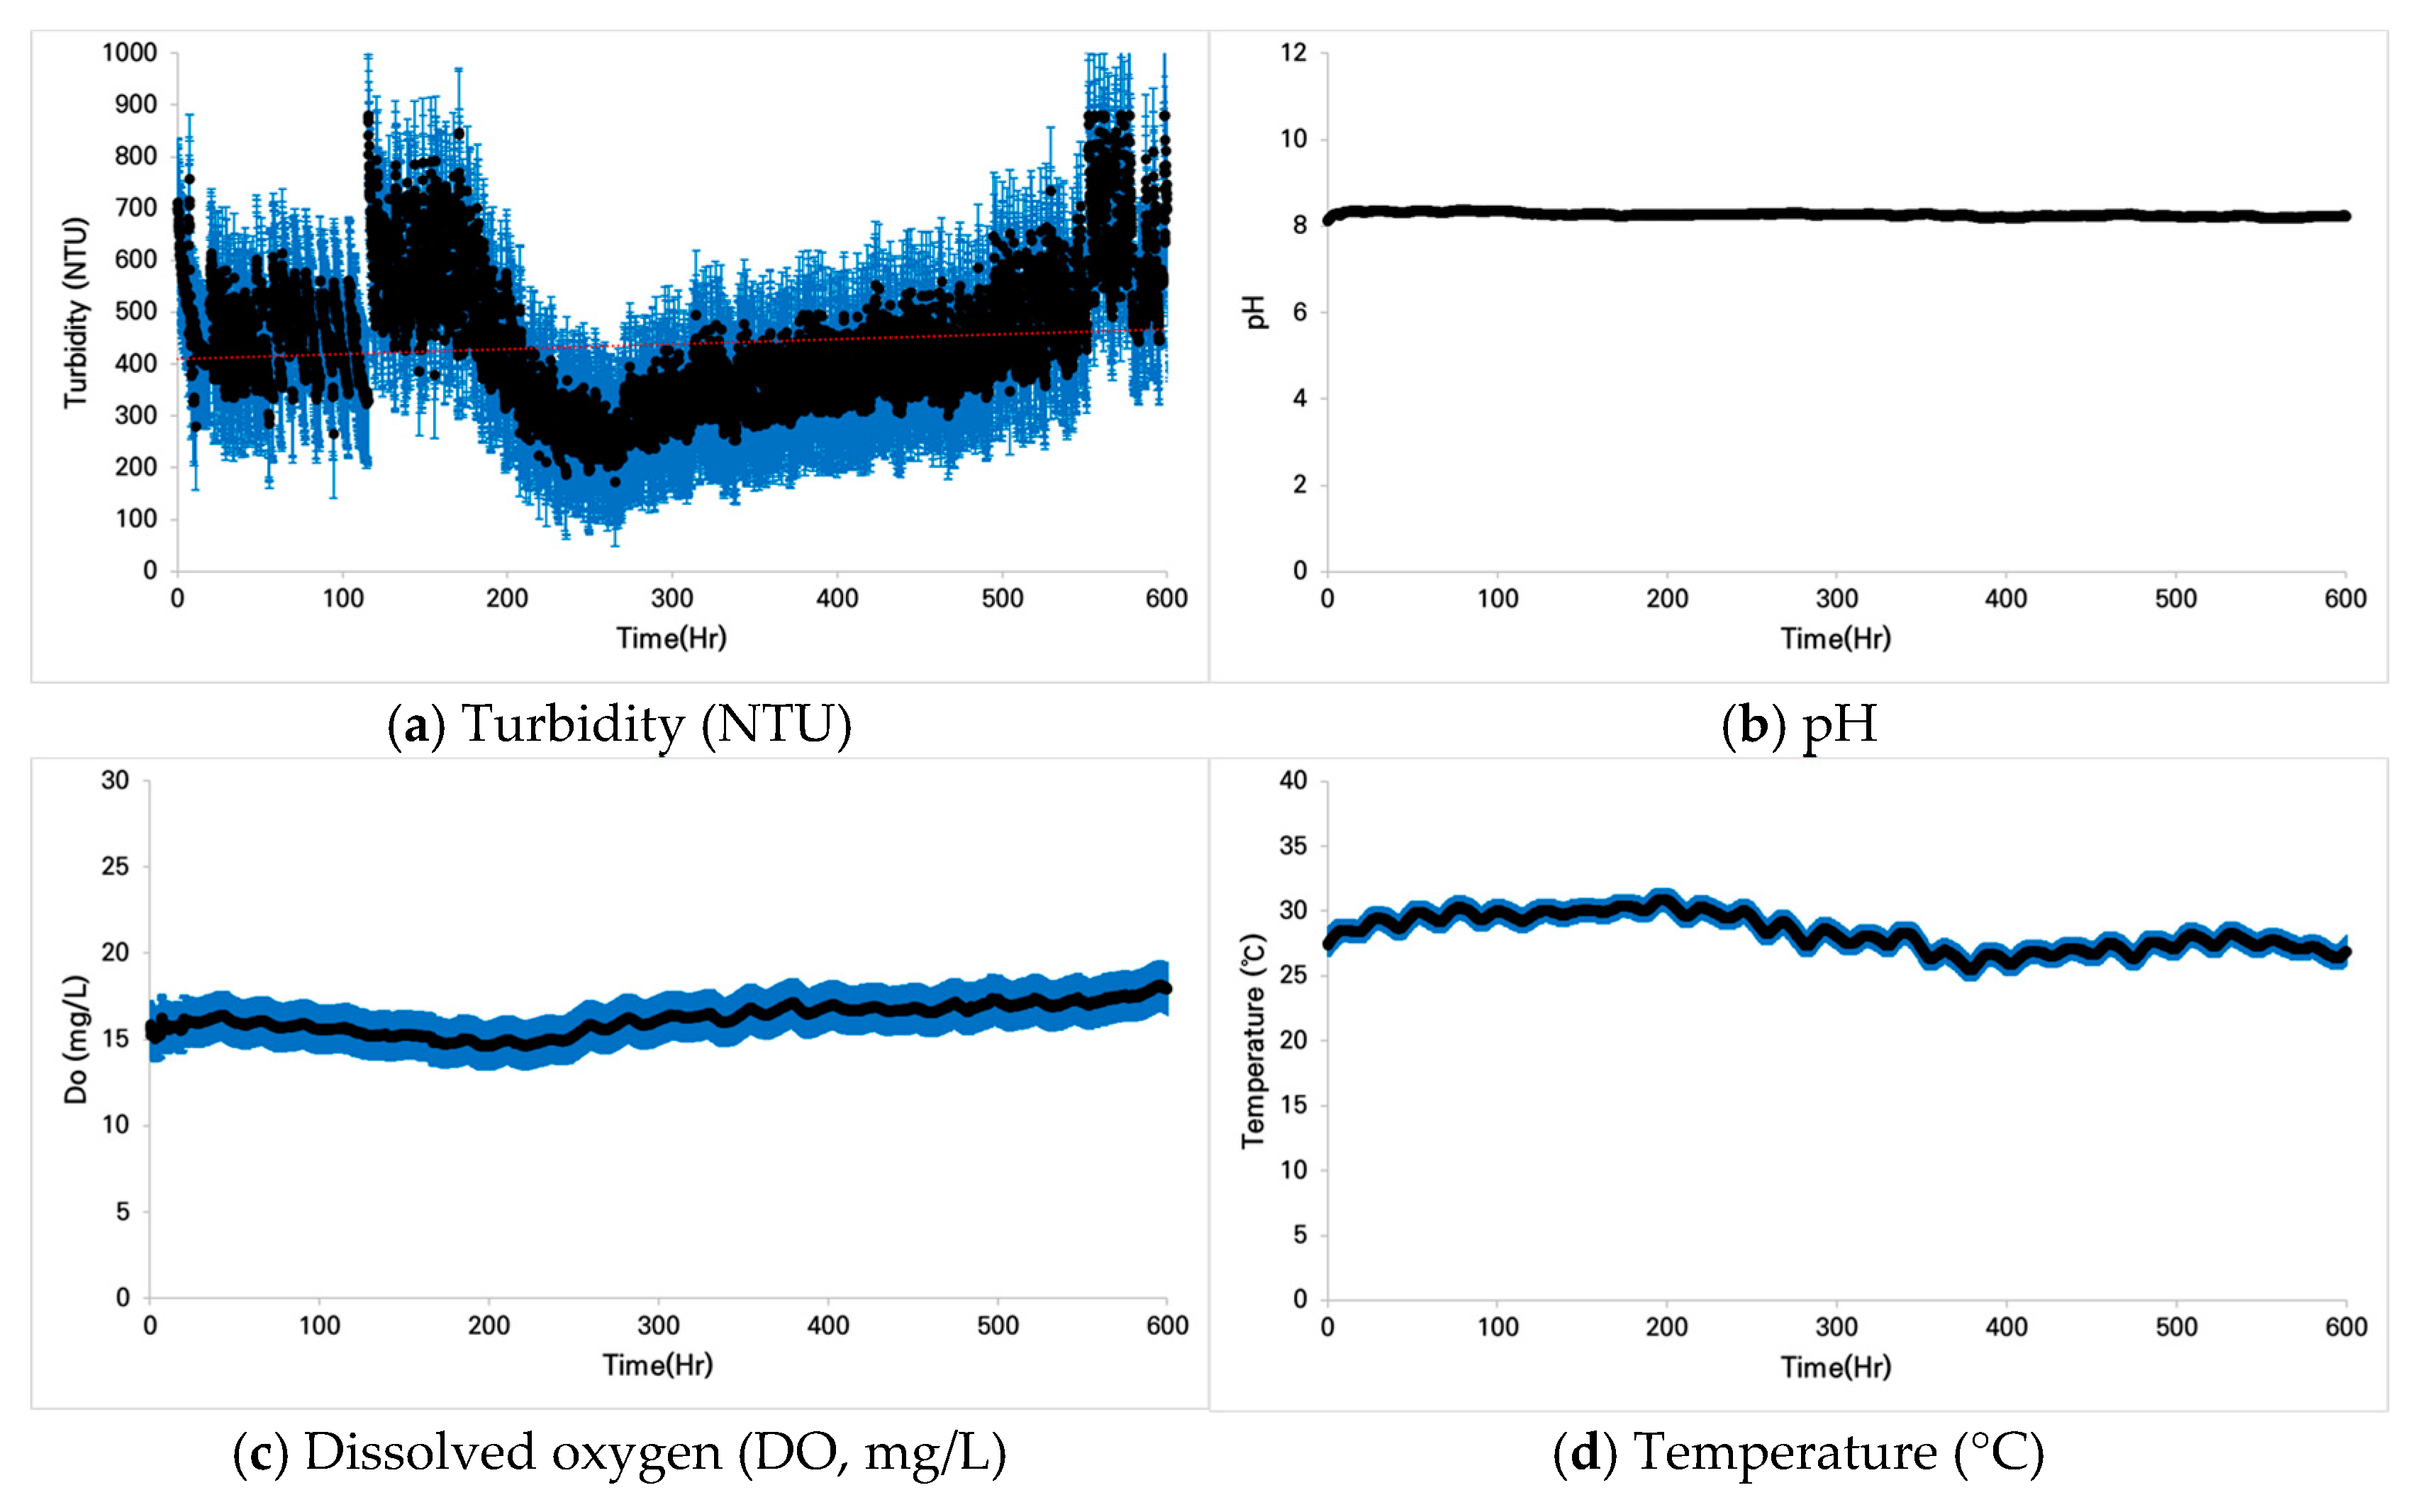
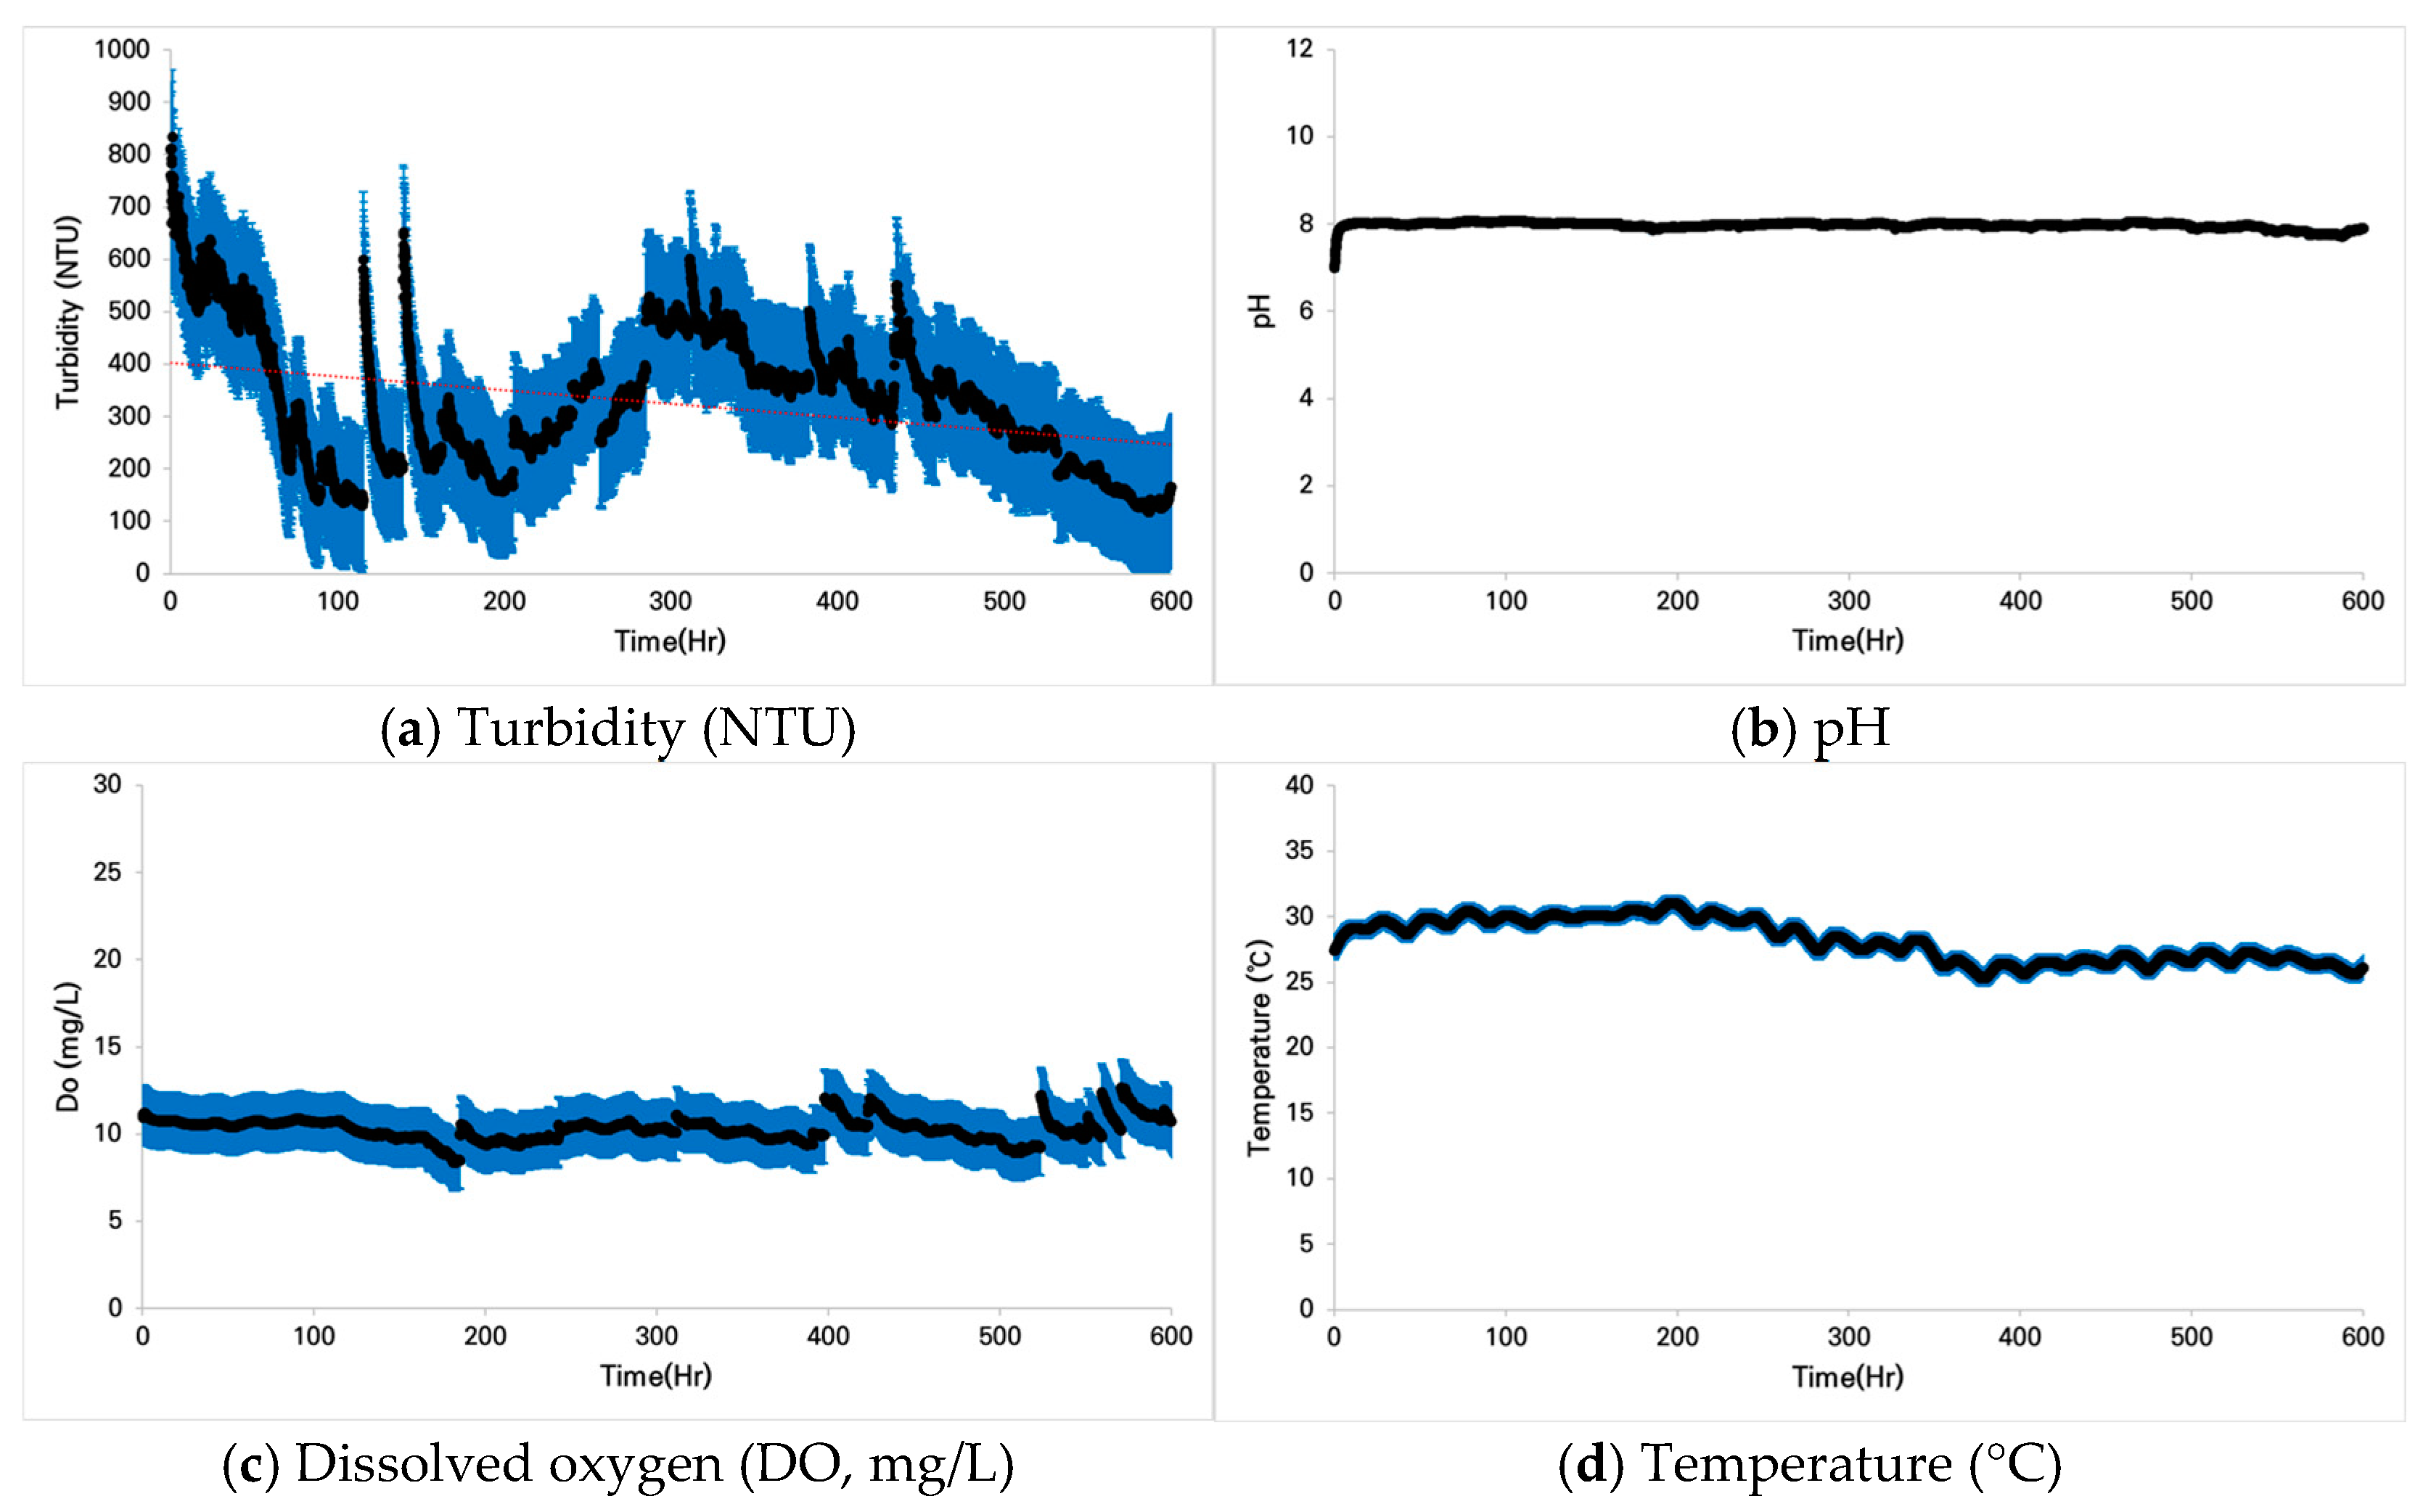
3.1.2. Case 2: Pseudopungtungia nigra

For water quality changes in Type 1, the experiment was conducted by setting the turbidity at approximately ±100 NTU. Consistent with Case 1 observations, gravitational settling processes resulted in progressive turbidity decline. The mean turbidity value stabilized at 101 NTU, with transient peaks reaching 346 NTU following flushing events. The pH remained stable at approximately 8, maintaining near-neutral conditions. Dissolved oxygen concentrations ranged from 10 to 11 mg/L, with water temperatures fluctuating between 30 °C and 35 °C (Figure 18).
Type 2 experiments were initiated at a target turbidity of ±200 NTU, achieving a mean turbidity value of 169 NTU. The pH remained stable at approximately 8. Dissolved oxygen concentrations exhibited complex dynamics, with initial values of approximately 16 mg/L followed by alternating decline and elevation patterns, likely attributable to oxygen saturation effects from periodic flushing protocols. The water temperature was stable at approximately 33 °C (Figure 19).
For Type 3, the initial measurement was around ±300 NTU, but it averaged 260 NTU, with a pH level of approximately 8. Similar to previous experiment results, dissolved oxygen tended to decline to 13 mg/L, and the water temperature was 35 °C or higher (Figure 20).
Type 4 experiments initiated at a target turbidity of ±880 NTU achieved a mean turbidity value of 322 NTU despite implementing continuous flushing protocols. The pH remained stable at approximately 8. Dissolved oxygen concentrations declined to below 13 mg/L, with water temperatures at or below 30 °C (Figure 21).

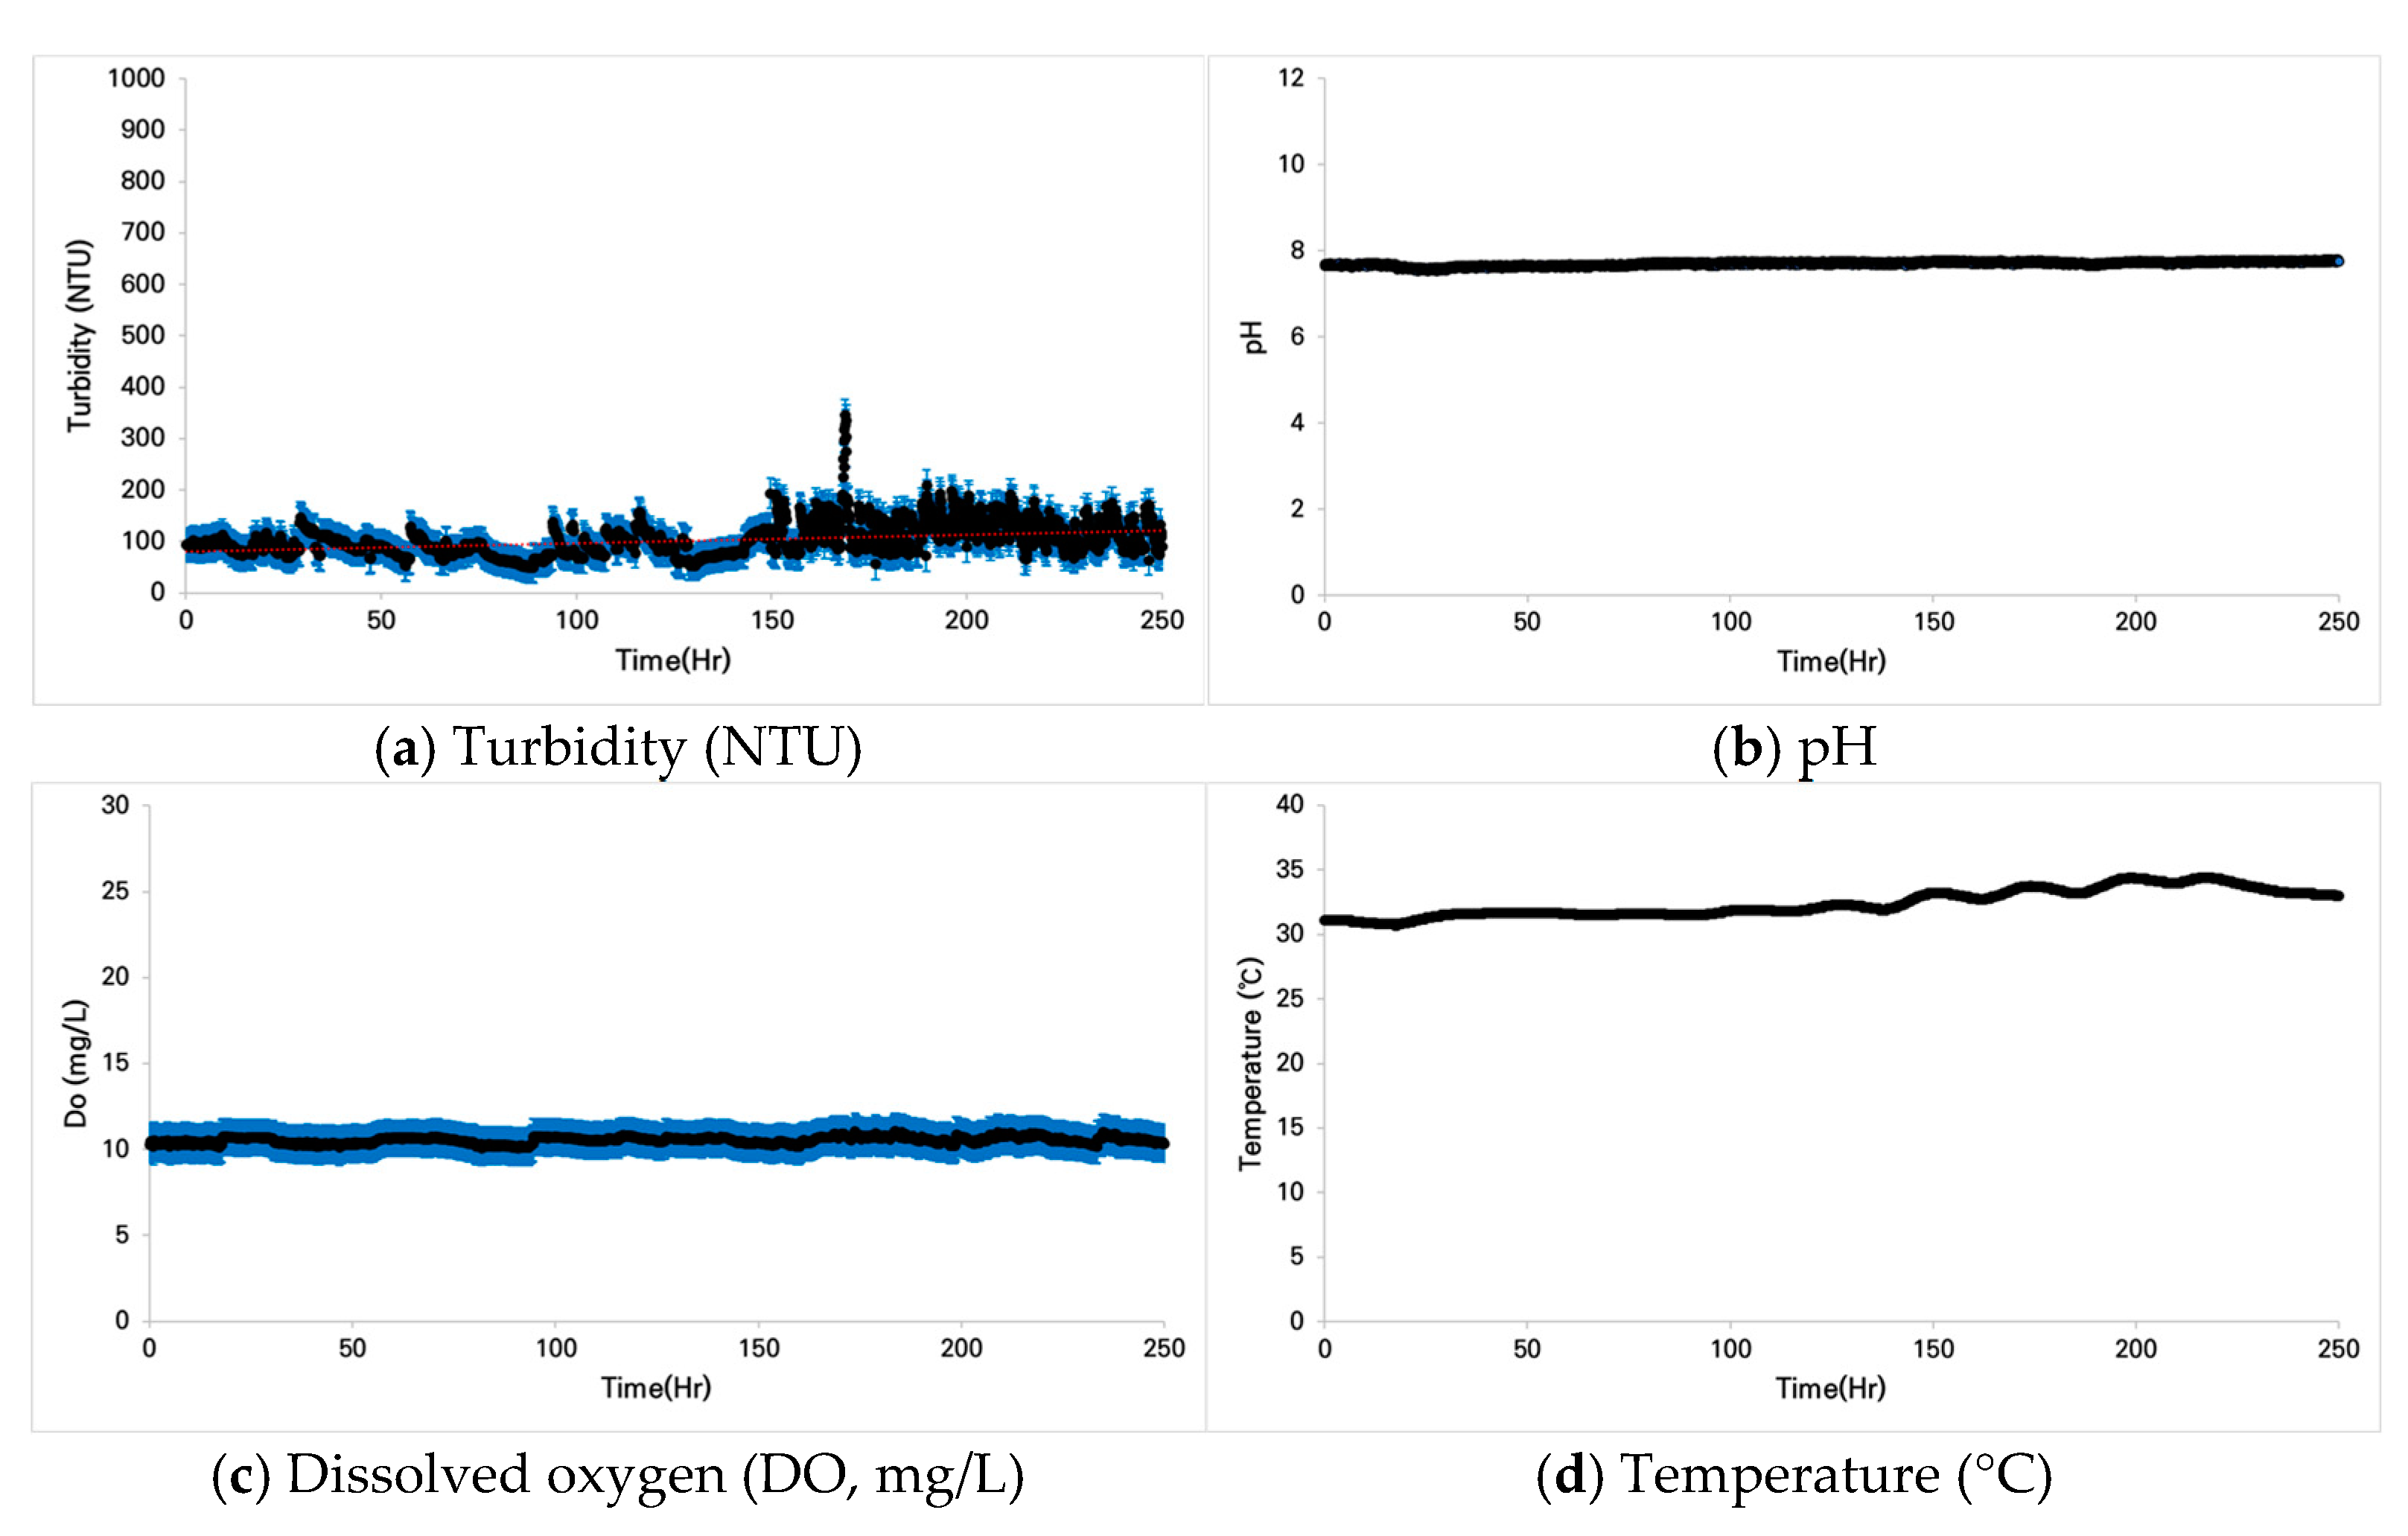
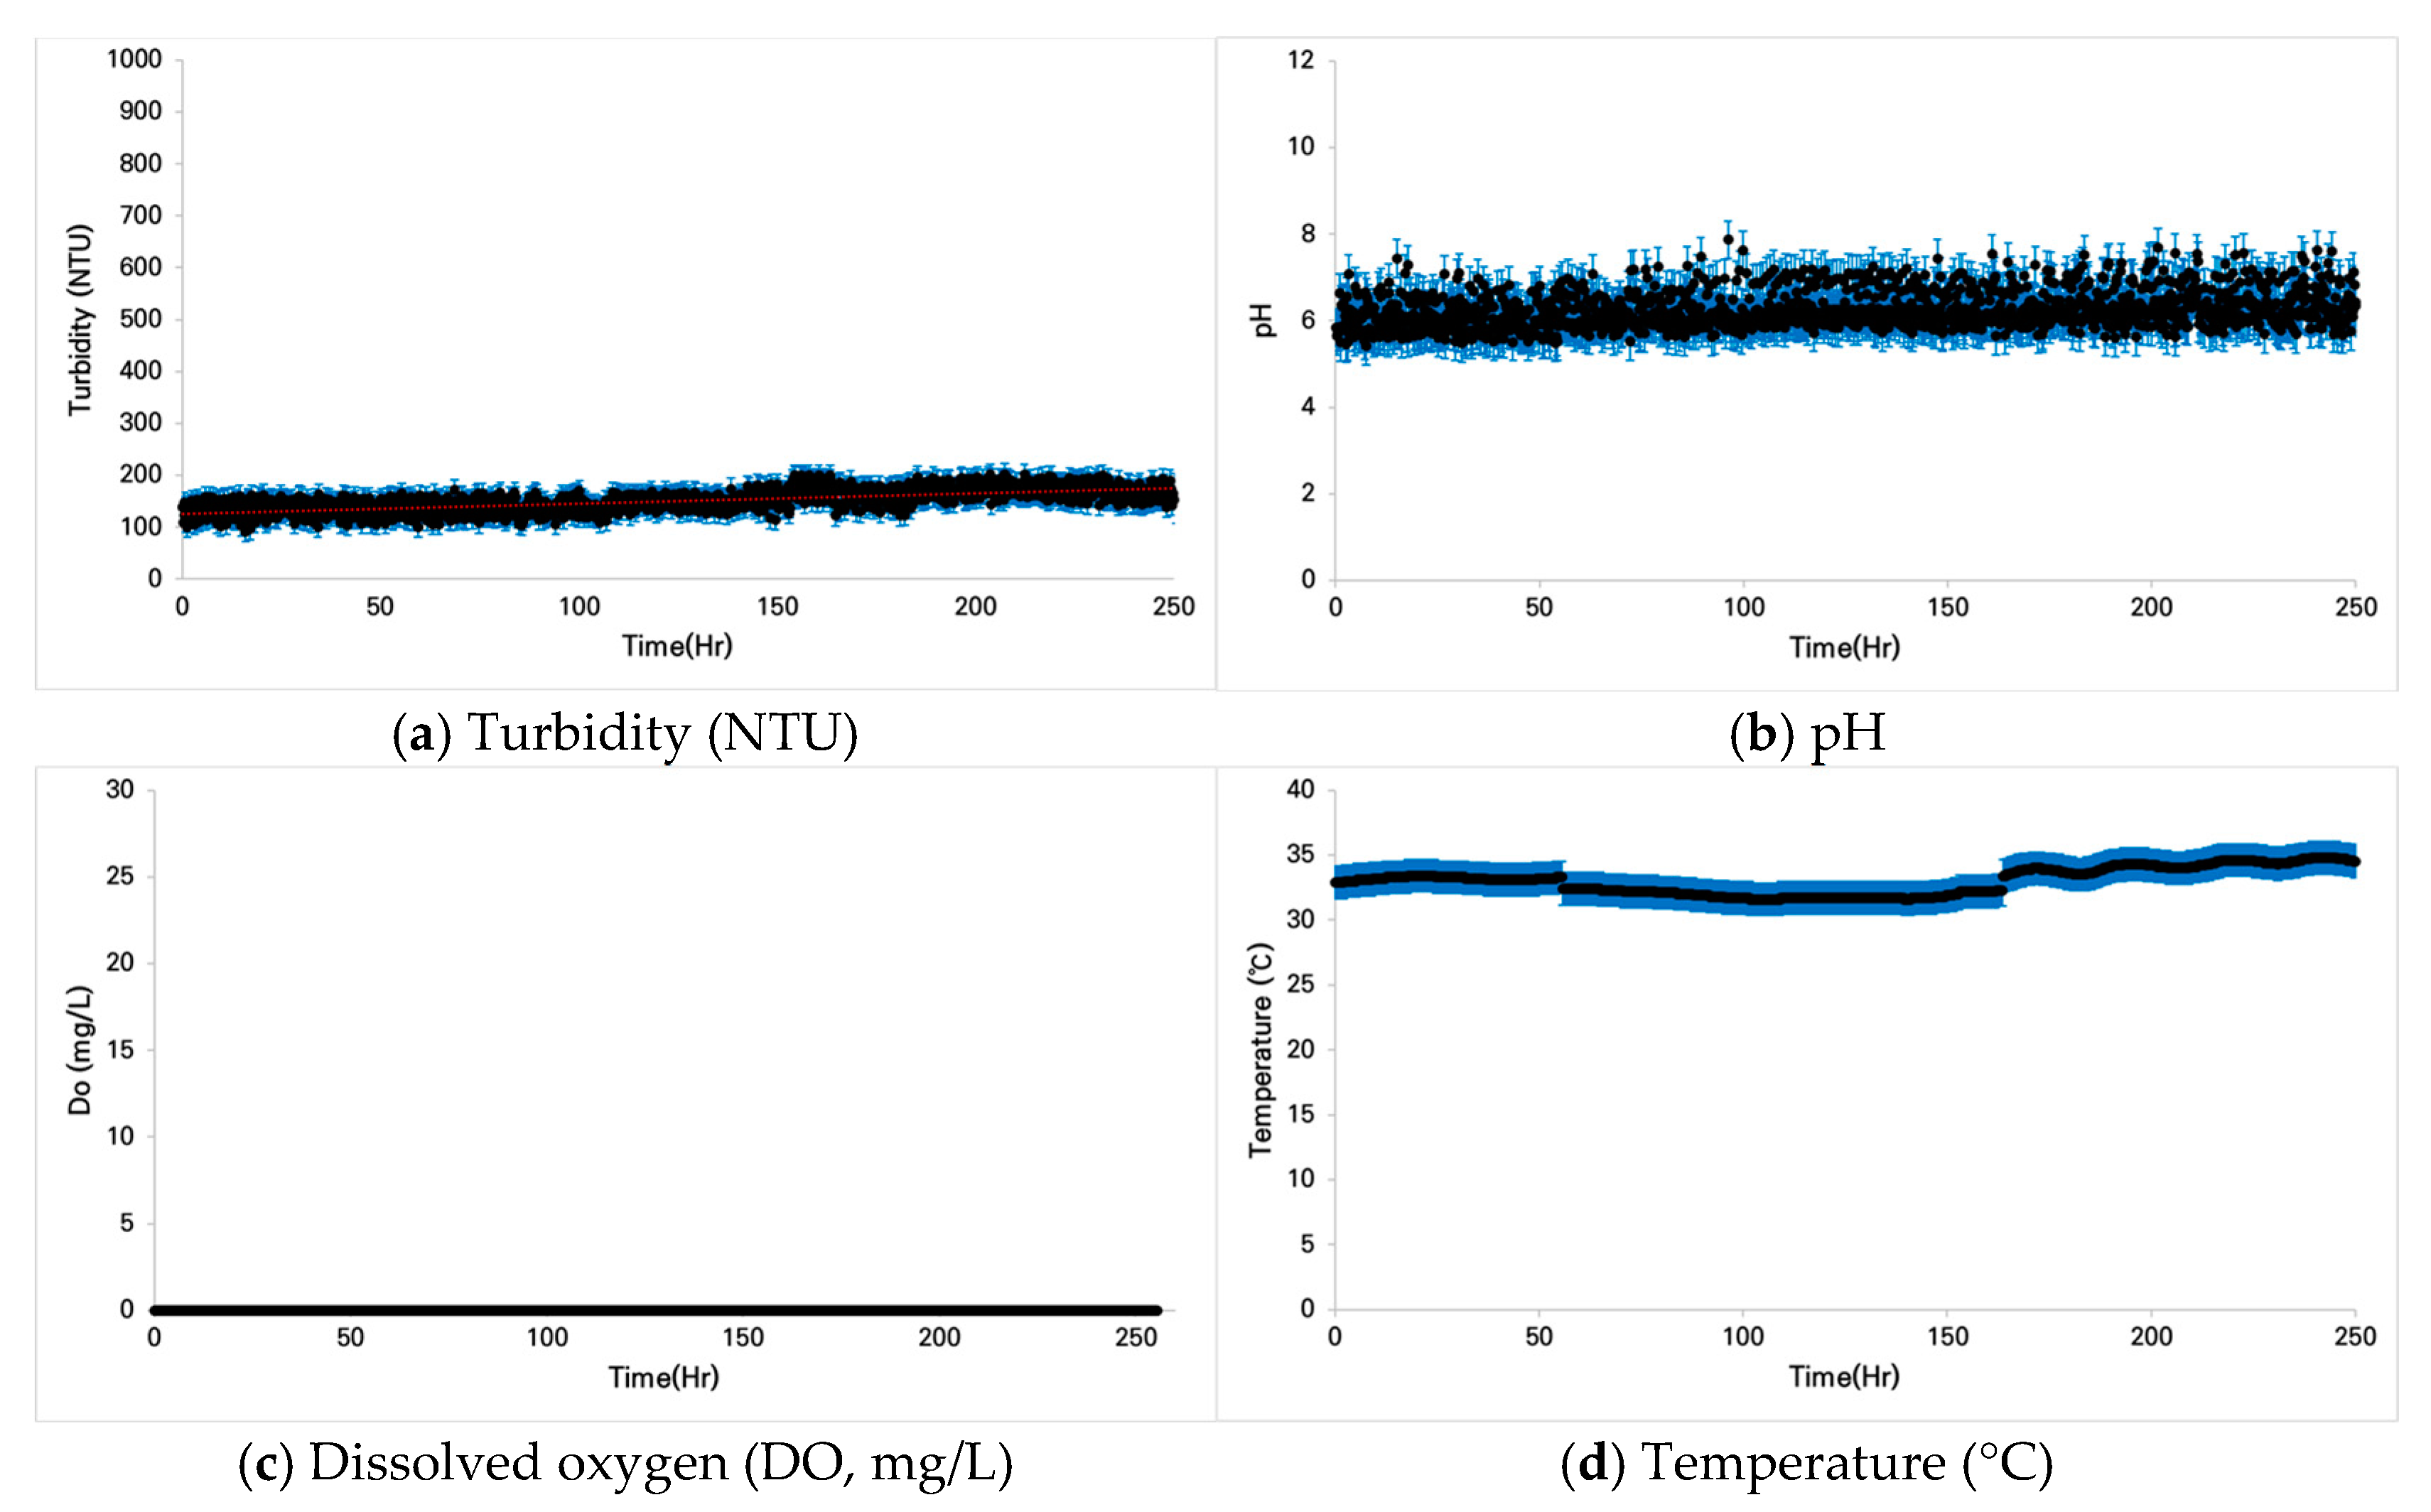
3.1.3. Case 3: Zacco koreanus

Type 1 experiments were initiated at a target turbidity of ±150 NTU, achieving a mean turbidity value of 146 NTU with enhanced stability in suspended solid concentrations. The pH fluctuated between 6 and 8. Water temperatures ranged from 33 °C to 35 °C. Dissolved oxygen measurements were not obtained because of instrument malfunction (Figure 22).
Type 2 experiments initiated at a target turbidity of ±300 NTU achieved a mean turbidity value of 297 NTU, demonstrating enhanced stability in suspended solid concentrations. The pH fluctuated between 6 and 8, with water temperatures ranging from 33 °C to 35 °C (Figure 23).
For Type 3, turbidity was initially set to ±700 NTU, but it continuously increased, averaging 723 NTU during the experiment. The pH ranged from approximately 5 to 11. Unlike other experimental tanks, this one showed significant fluctuations, which seemed to be influenced by the amount of turbidity. Dissolved oxygen levels were consistently around 13 to 14 mg/L, while the water temperature ranged from 33 °C to 34 °C (Figure 24).

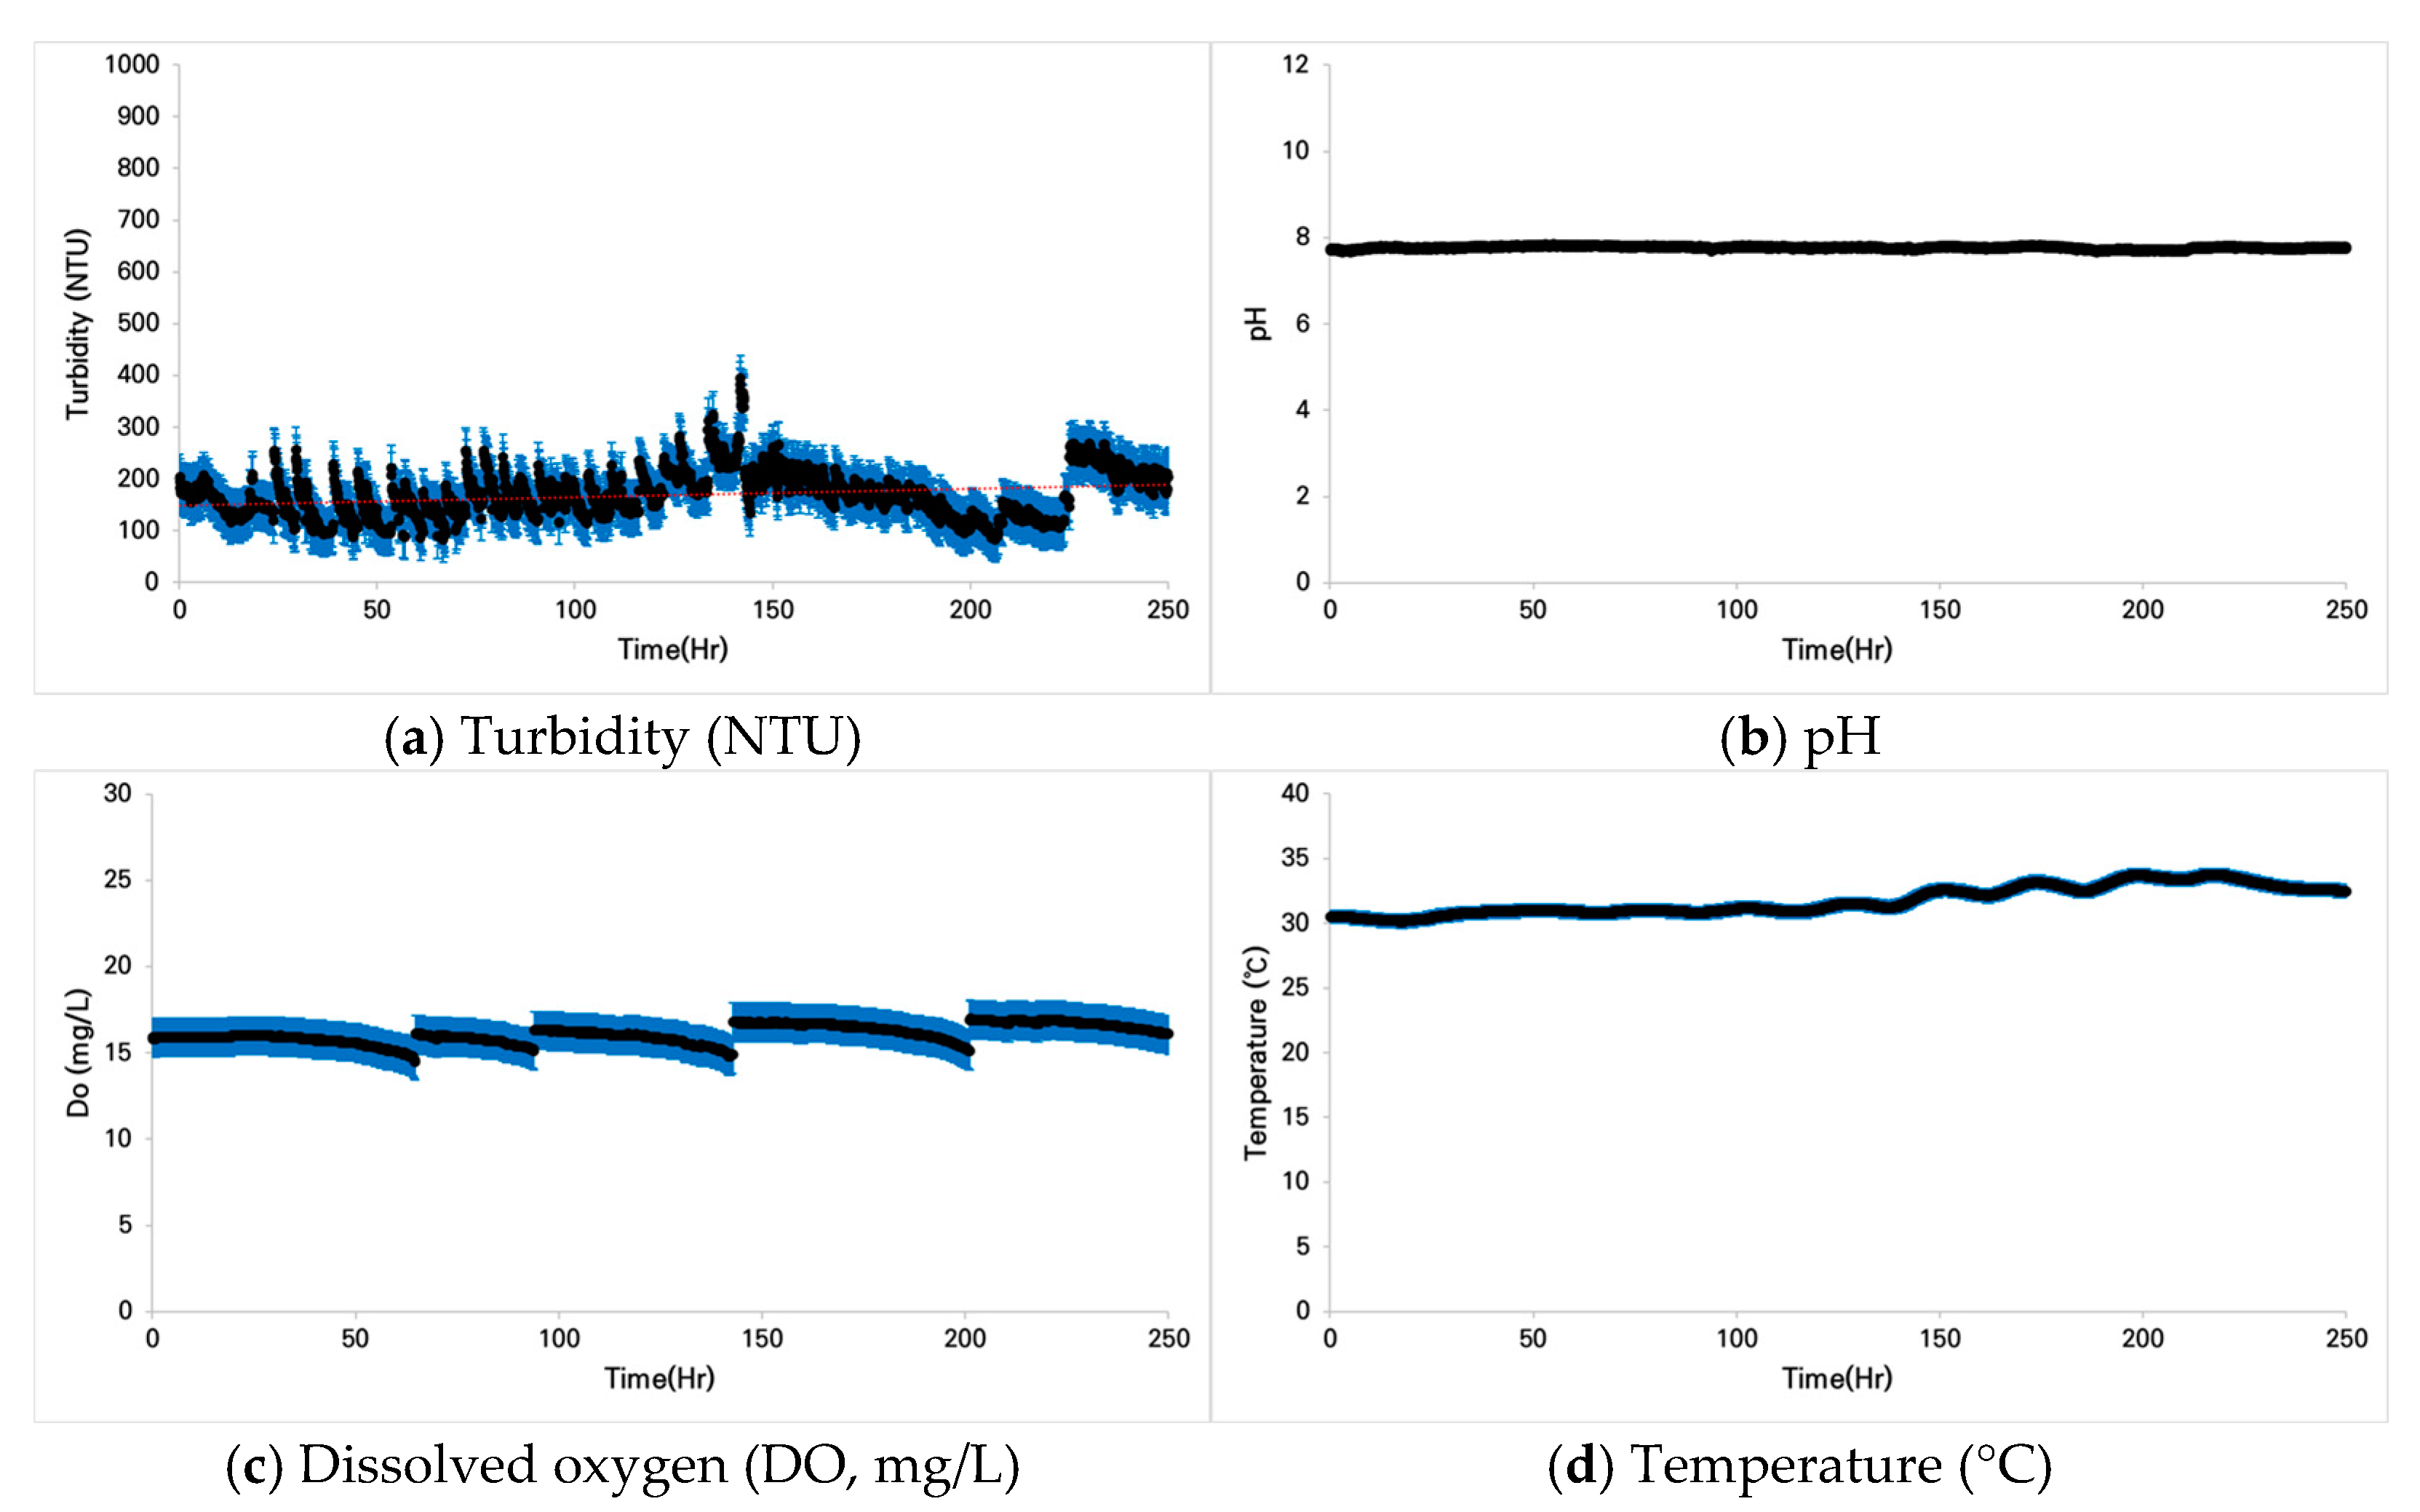
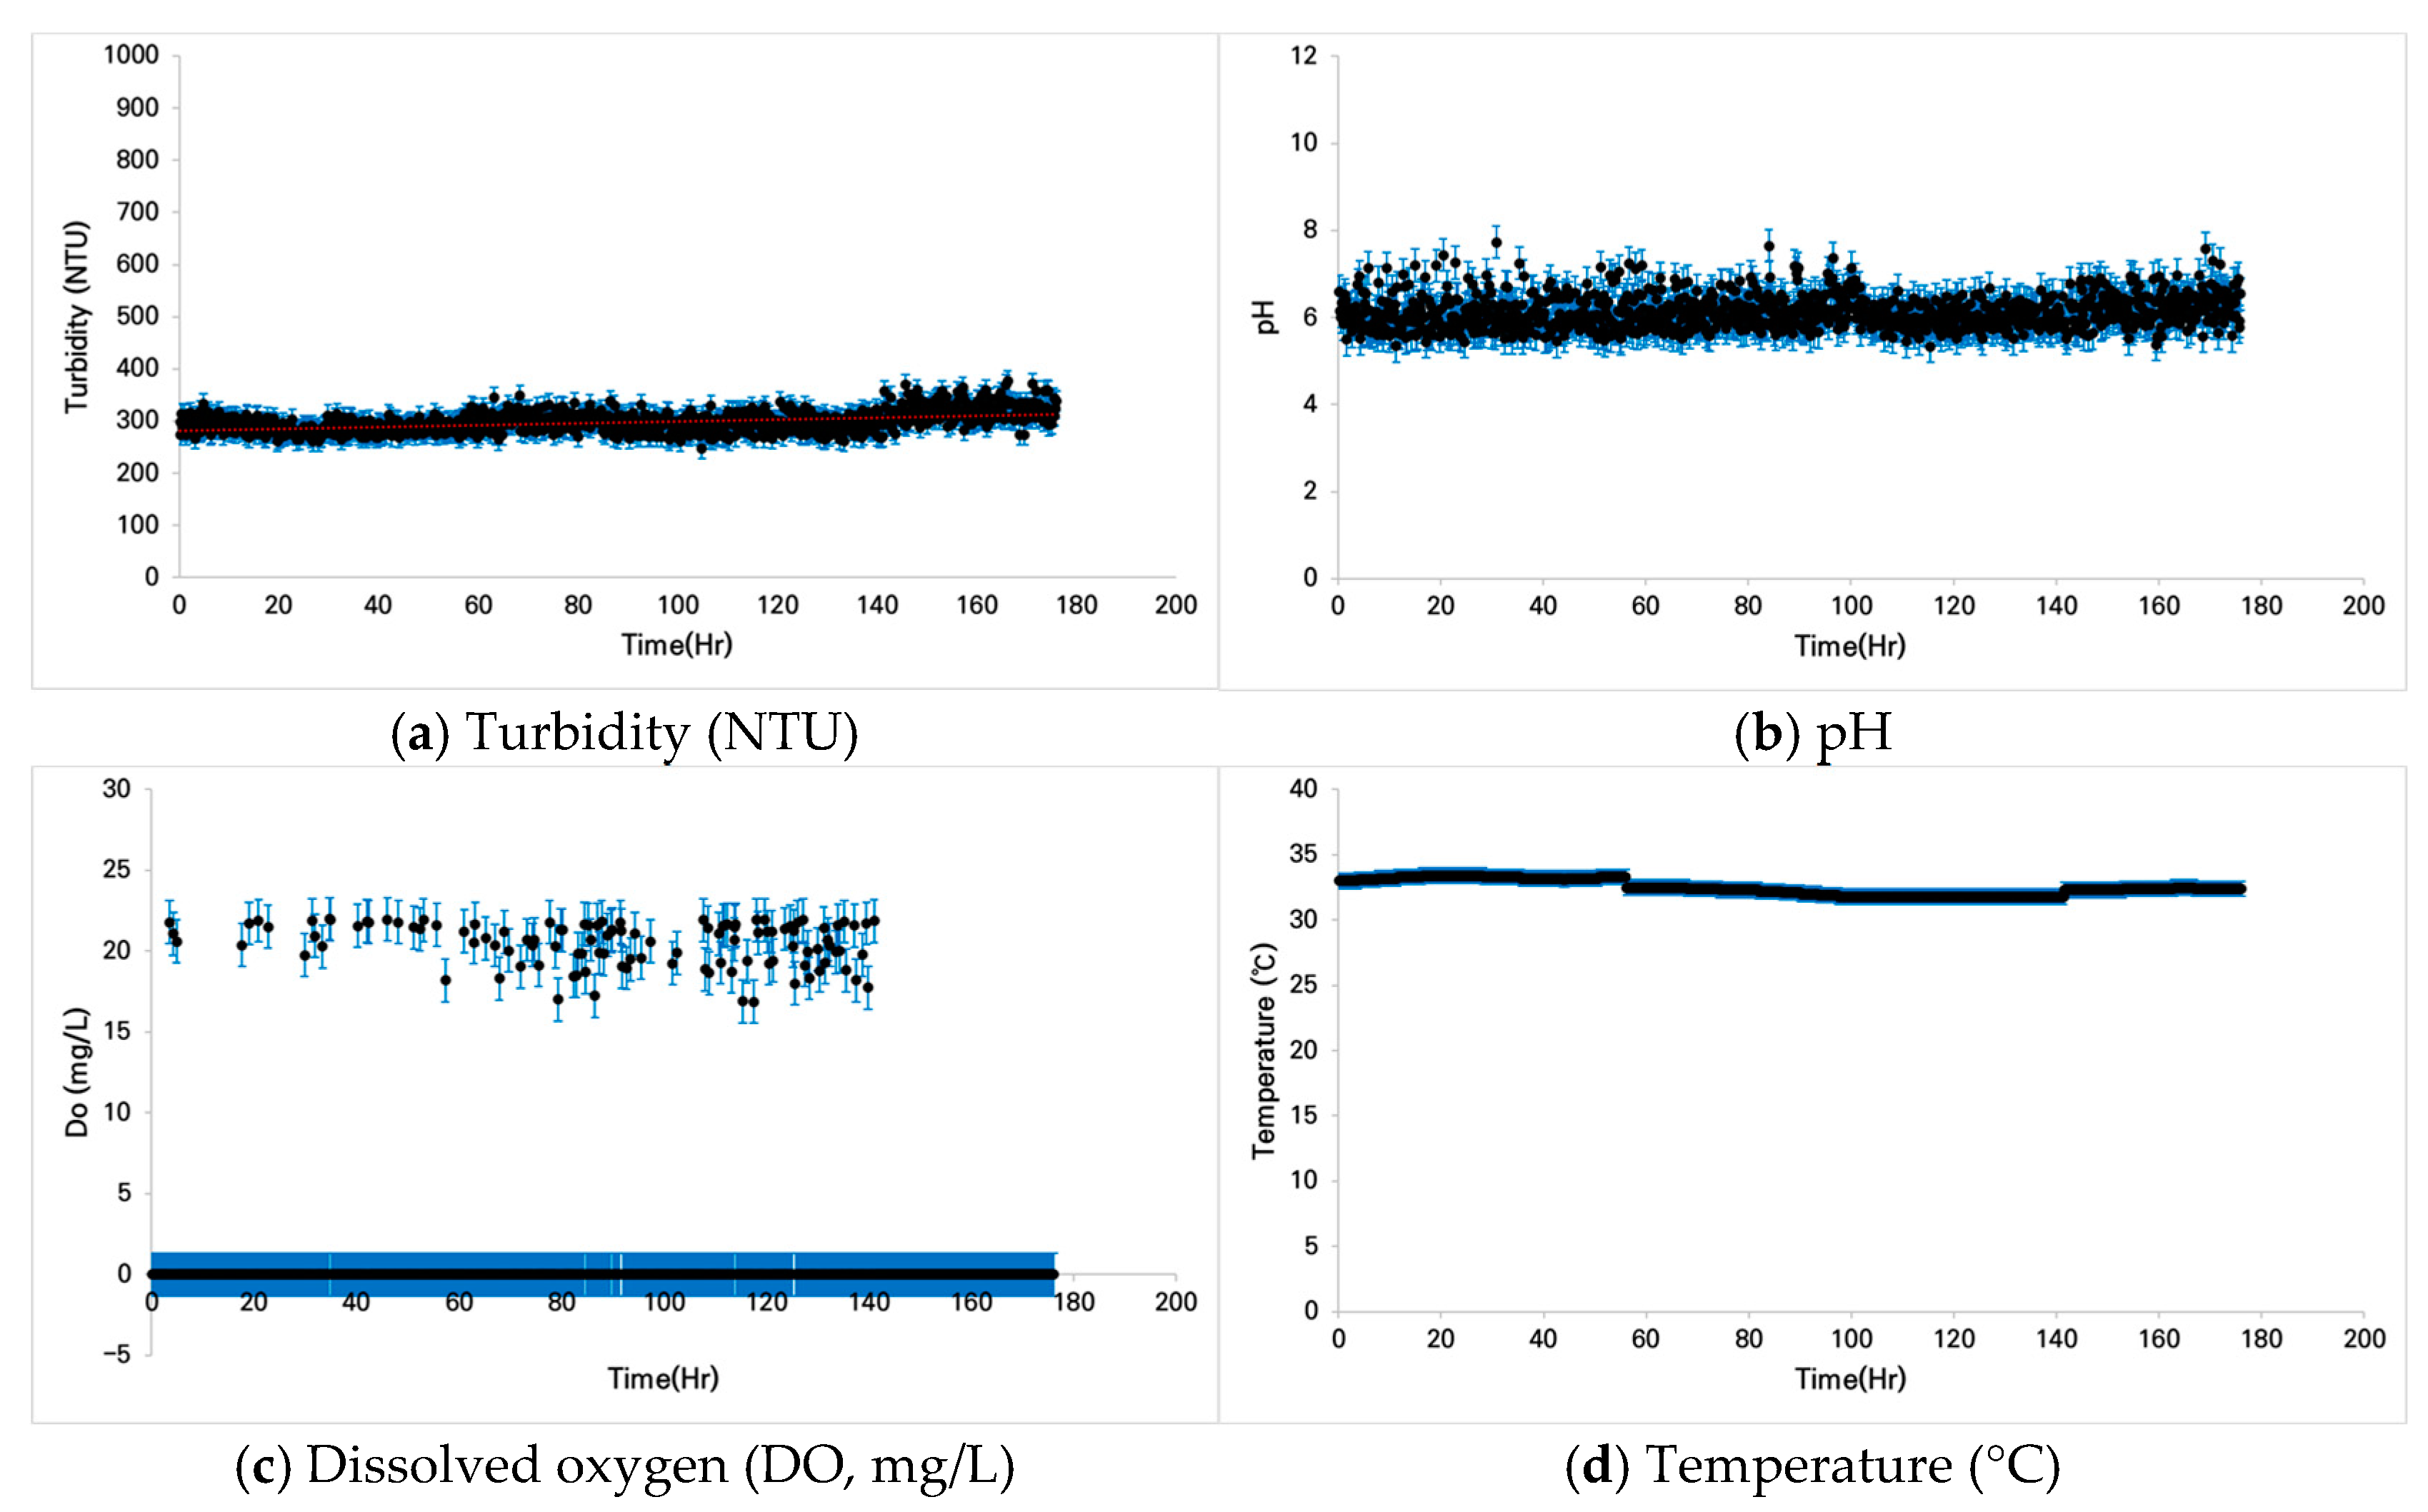
3.2. Fish Conditions Under Prolonged Turbidity

3.2.1. Case 1: Zacco platypus

Initial turbidity introduction induced surface aggregation behavior among specimens. However, particle settlement enabled unrestricted swimming patterns throughout the water column after three days. Feeding behavior, assessed at three-day intervals, demonstrated consistent patterns across all turbidity treatments (Types 1–4). Mortality rates exhibited concentration-dependent variation: Type 1 recorded complete survival (33/33 specimens), Type 2 showed 18% mortality (6/33 specimens), and Type 3 demonstrated 39% mortality (13/33 specimens). Type 4, despite substantially elevated turbidity levels, recorded only 15% mortality (5/33 specimens). The relatively high survival rate in Type 4 conditions was attributed to extensive particle settlement and elevated dissolved oxygen concentrations approaching 15 mg/L despite reduced water volume and high initial turbidity (Figure 25).

3.2.2. Case 2: Pseudopungtungia nigra

Pseudopungtungia nigra specimens exhibited behavioral patterns similar to Zacco platypus, demonstrating initial surface aggregation following turbidity introduction. Feeding behavior remained consistent across turbidity treatments. Mortality rates showed concentration-dependent patterns: Type 1 exhibited 9% mortality (3/33 specimens), Type 2 demonstrated 15% mortality (5/33 specimens), and Type 3 recorded 73% mortality (24/33 specimens). Type 4, despite higher initial turbidity levels, showed reduced mortality at 55% (18/33 specimens) compared to Type 3. The attenuated impact in Type 4 conditions was attributed to enhanced particle aggregation and settlement processes, as documented in Figure 26.

3.2.3. Case 3: Zacco koreanus

Zacco koreanus specimens initially exhibited surface aggregation behavior following turbidity introduction. However, implementing a turbidity maintenance agitation system achieved homogeneous particle distribution throughout the water column, facilitating normal swimming and feeding behaviors. Mortality rates demonstrated a moderate concentration dependence: Type 1 exhibited 10% mortality (3/30 specimens), Type 2 showed 17% mortality (5/30 specimens), and Type 3, despite maximum turbidity levels, demonstrated 23% mortality (7/30 specimens). The relatively high survival rate under elevated turbidity conditions was attributed to stable dissolved oxygen concentrations maintained throughout the experimental period (Figure 27).

4. Experiment Analysis and Discussion

Experimental design parameters were informed by historical water quality data and turbidity duration patterns associated with dam discharge events. Water quality data were obtained from the water environment information system’s real-time monitoring network, specifically focusing on Andong Dam downstream measurements from 2014 to 2024. As illustrated in Figure 10, maximum turbidity values downstream of Andong Dam reached 749 NTU in July 2016 and 540 NTU in July 2017, representing decadal peaks. While these elevated turbidity events correlate with climate change-induced precipitation patterns, including localized and extreme rainfall events, the primary driver was identified as dam discharge operations. Corresponding discharge data from the Korea Water Resources Corporation Water Information Portal indicated flow rates of 1675 m3/s coincident with the 749 NTU turbidity event in July 2016 and 1011 m3/s during the 540 NTU event in July 2017. Temporal analysis of maximum turbidity events revealed sustained elevated turbidity periods exceeding 10 days during July 2016 and July 2017 (Figure 28).
The experimental design focused on evaluating the ecological impacts of dam discharge-induced turbidity variations on aquatic ecosystems. Previous research by Boubée et al. [15] demonstrated species-specific variations in suspended solid avoidance responses across six fish species, with distinct threshold concentrations eliciting 50% avoidance behaviors. Building on this foundational research, the current investigation examined suspended sediment responses among dominant fish species indigenous to the Nakdonggang River and Andong Lake systems.
The impact of suspended solids on fish behavior demonstrates significant variation based on particle concentration, size distribution, exposure duration, and species-specific characteristics. Primary behavioral modifications manifest as avoidance responses, exemplified by salmonid movement toward areas of reduced turbidity [11]. The current investigation documented preferential migration toward clear-flowing water under elevated suspended solid concentrations. However, under high-concentration conditions that impaired environmental assessment capabilities, specimens exhibited vertical migration to lower depths characterized by reduced concentrations and minimized movement patterns.
Elevated suspended solid concentrations reduce water transparency, potentially compromising prey detection capabilities and predator–prey dynamics, subsequently affecting feeding efficiency and growth rates. Such complex ecological interactions warrant extended field observations in high-turbidity riverine systems rather than laboratory assessment. Acute exposure to elevated suspended solid concentrations can induce gill tissue damage and respiratory dysfunction. Suspended solid accumulation on gill surfaces reduces oxygen absorption efficiency, potentially leading to respiratory distress and physiological stress responses. These conditions can modify habitat preferences, with specimens typically selecting low-turbidity zones, potentially inducing long-term shifts in species distribution patterns and ecosystem dynamics [12,16,17].
Chronic suspended solid exposure can alter behavioral patterns, affecting social interactions, reproductive behaviors, and migration patterns. Elevated turbidity may suppress or delay reproductive activities, impacting population dynamics. These behavioral modifications emphasize the critical role of suspended solid concentrations in maintaining fish ecological health and provide a scientific foundation for water quality management and conservation policy development [12,17,18,19,20].
The current study documented behavioral responses to suspended solid concentrations while monitoring physiological conditions under increasing concentrations. Fish mortality under elevated suspended solid conditions correlates with physiological and ecological stress responses. The study in rice paddy ecosystems demonstrated gastropod mortality due to turbidity-induced gill damage, respiratory dysfunction, and oxygen depletion. While the present study maximized experimental duration, definitive conclusions regarding immune system compromise and infection susceptibility remain constrained. In addition, the monitoring period precluded the determination of mortality causation through chronic exposure effects and stress hormone elevation.
Experimental findings suggest direct gill tissue damage from elevated suspended solid concentrations. Particle deposition on gill surfaces impairs respiratory function, with fine, angular particles potentially inducing tissue laceration and inflammation, leading to respiratory failure and mortality. Increased suspended solid loads can reduce dissolved oxygen concentrations, potentially inducing hypoxic stress. The observed concentration-dependent mortality patterns appear primarily attributable to gill tissue damage and respiratory dysfunction. Additionally, the experiment has a limitation in that it is difficult to fully replicate the environmental conditions of actual rivers, such as maintaining turbidity, temperature, dissolved oxygen (DO), and other related factors.

5. Conclusions

The study methodology prioritized experimental validation, acknowledging the inherent variability in biological response patterns and the challenges of generalizing experimental findings. While laboratory conditions cannot perfectly replicate natural habitat parameters, the experimental design maintained optimal water quality conditions and temperature regimes over extended periods, with continuous monitoring of specimen adaptation status. These methodological considerations enhance the validity of the experimental outcomes.
The behavioral analysis revealed preferential movement toward reduced turbidity zones. However, under conditions of widespread turbidity elevation, specimens exhibited delayed migration to areas of minimized impact, such as riverbed zones, following turbidity reduction. This migration pattern suggests an adaptive response to minimize turbidity-induced physiological stress. Long-term exposure experiments demonstrated high survival rates at 100 NTU, approximating typical flood conditions. However, mortality rates increased significantly under elevated turbidity conditions (500–1000 NTU).
These findings have significant implications for understanding acute fish mortality risks associated with unexpected high turbidity events, whether induced by river engineering projects or flood events. The research emphasizes the importance of considering upstream sediment transport dynamics during flood-stage operation of hydraulic structures, given the potential impacts on downstream fish populations. The experimental data provide foundational insights into fish mobility patterns and habitat utilization in riverine systems subject to rapid turbidity fluctuations, particularly in contexts of weir operations. Future research will aim to investigate the linkage between water quality impacts caused by increased turbidity during river structure operations and fish management.

Author Contributions

Conceptualization, D.-H.N.; methodology, N.-J.L. and J.-G.K.; investigation, S.-J.K.; data curation, D.-H.N.; writing—review and editing, D.-H.N. and J.-G.K.; visualization, S.-J.K.; supervision, J.-G.K.; project administration, N.-J.L. and J.-G.K.; funding acquisition, N.-J.L. All authors have read and agreed to the published version of the manuscript.

Funding

This research was supported by the Korea Environmental Industry and Technology Institute (KEITI) through the Aquatic Ecosystem Conservation Research Program, funded by the Korea Ministry of Environment (MOE), grant number 2020003050002.

Data Availability Statement

The data used to support the findings of this study are included within the article.

Conflicts of Interest

The authors declare no conflicts of interest.

References

  1. Kang, J.-K.; Lee, N.-J.; Nam, D.-H. Monitoring of the Mobility of Fish on Turbidity Changes. Korean. J. Ecol. Environ. 2023, 10, 201–207. [Google Scholar] [CrossRef]
  2. Bash, J.; Berman, C.; Bolton, S. Effects of Turbidity and Suspended Solids on Salmonids. Available online: https://www.wsdot.wa.gov/research/reports/fullreports/526.1.pdf (accessed on 25 January 2020).
  3. Park, J.-K.; Park, J.-H.; Na, S.-I.; Beak, S.-C. Estimation of suspended solid concentration variation in Daechung Reservoir using satellite imagery. In Proceedings of the Korea Water Resources Association Conference, Republic of Korea, Seoul, Republic of Korea, 19–20 May 2011; Volume 5, p. 203. [Google Scholar]
  4. Ryu, T.-H.; Kim, Y.-P.; Kim, J.-K.; An, K.-G. Analysis of ecological health using a water quality and fish in Bocheong stream. Korean J. Ecol. Environ. 2010, 43, 255–262. [Google Scholar]
  5. Kim, J.-K.; Choi, J.-S.; Jang, Y.S.; Lee, K.Y.; Kim, B.C. Effects of turbid water on fish community: Case studies of the Daegi stream and Bong-san stream. Korean J. Ecol. Environ. 2007, 40, 459–467. [Google Scholar]
  6. Choi, J.-S.; Kim, J.-K. Ichthyofauna and fish community in Hongcheon river, Korea. Korean J. Environ. Biol. 2004, 22, 446–455. [Google Scholar]
  7. Abrahams, M.V.; Kattenfeld, M.G. The role of turbidity as a constraint on predator-prey interactions in aquatic environments. Behav. Ecol. Sociobiol. 1997, 40, 169–174. [Google Scholar] [CrossRef]
  8. Utne-Palm, A.C. The effect of prey mobility, prey contrast, turbidity and spectral composition on the reaction distance of Gobiusculus flavescens to its planktonic prey. J. Fish Biol. 2005, 54, 1244–1258. [Google Scholar] [CrossRef]
  9. Moon, S.-D.; Kang, S.-K.; Lee, C.-H.; Sung, C.-G.; An, K.-G.; Choi, T.S. Effect on early life stage of three freshwater fish (Carassius auratus, Cyprinus carpio, Oryzias latipes) exposed to suspended solids. Korean J. Ecol. Environ. 2014, 47, 82–90. [Google Scholar] [CrossRef]
  10. Lee, K.S. The effects of suspended solids on the mortality and the glycogen content of abalone, Haliotis discus hannai. J. Korean Soc. Mar. Environ. Saf. 2008, 14, 183–187. [Google Scholar]
  11. Kjelland, M.E.; Woodley, C.M.; Swannack, T.M.; Smith, D.L. A review of the potential effects of suspended sediment on fishes: Potential dredging-related physiological, behavioral, and transgenerational implications. Environ. Syst. Decis. 2015, 35, 334–350. [Google Scholar] [CrossRef]
  12. Montoya, X.C.; Thompson, W.A.; Smith, C.M.; Wilson, J.M.; Vijayan, M.M. Exposure to total suspended solids (TSS) impacts gill structure and function in adult zebrafish. Bull. Environ. Contam. Toxicol. 2024, 113, 14. [Google Scholar] [CrossRef] [PubMed]
  13. Fan, J.; Yang, J.; Cheng, F.; Zhang, S. The source, distribution, and environmental effects of suspended particulate matter in the Yangtze River System. Water 2023, 15, 3429. [Google Scholar] [CrossRef]
  14. National Institute of Environmental Research. Ministry of Environment’s Guidelines on the Investigation and Evaluation of Aquatic Ecosystem Continuity. Available online: https://www.law.go.kr/LSW/admRulInfoP.do?admRulSeq=2100000220502 (accessed on 3 January 2025).
  15. Boubee, J.A.T.; Dean, T.L.; West, D.W.; Barrier, R.F.G. Avoidance of suspended sediment by the juvenile migratory stage of six New Zealand native fish species. N. Z. J. Mar. Freshw. Res. 1997, 31, 61–69. [Google Scholar] [CrossRef]
  16. Choi, J.S. Fish fauna and community in Cheongpyeong reservoir. Korean J. Limnol. 2005, 38, 63–72. [Google Scholar]
  17. Débora, M.S.S.; Mércia Regina, S.M.; Denise Carla, S.M.; Iolanda Karoline, B.S.R.; Jakeline Priscila, L.S.; Sildiane, M.C.; Paulo, C.M. Histological Changes in Gills of Two Fish Species as Indicators of Water Quality in Jansen Lagoon (São Luís, Maranhão State, Brazil). Int. J. Environ. Res. Public Health 2014, 11, 12927–12937. [Google Scholar] [CrossRef] [PubMed]
  18. Banasiak, R.; Verhoeven, R. Quantification of the erosion resistance of undisturbed and remoulded cohesive sediments. In The Interactions Between Sediments and Water; Kronvang, B., Faganeli, J., Ogrinc, N., Eds.; Springer: Dordrecht, The Netherlands, 2006; pp. 17–27. ISBN 978-1-4020-5477-8. [Google Scholar] [CrossRef]
  19. Han, S.-C.; Lee, H.-Y.; Seo, E.-W.; Shim, J.-H.; Lee, J.-E. The influence of muddy water in Imha Reservoir on the ichthyofauna and fish growth. J. Life Sci. 2007, 17, 1104–1110. [Google Scholar] [CrossRef]
  20. Newcombe, C.P.; MacDonald, D.D. Effects of suspended sediments on aquatic ecosystems. N. Am. J. Fish. Manag. 1991, 11, 72–82. [Google Scholar] [CrossRef]
Figure 1. An experimental water channel is used to understand the fish behavior following changes in turbidity.
Water 17 01340 g001
Figure 2. Conceptual diagram of the experimental waterway.
Water 17 01340 g002
Figure 3. Location of the River Experiment Center.
Water 17 01340 g003
Figure 4. Turbidity measurement locations.
Water 17 01340 g004
Figure 5. Monitoring of fish migration in the waterway.
Water 17 01340 g005
Figure 6. Fish migration in response to turbidity.
Water 17 01340 g006
Figure 7. A complete view of the experimental tank.
Water 17 01340 g007
Figure 8. The study used fish species: (a) Zacco platypus, (b) Pseudopungtungia nigra, and (c) Zacco koreanus.
Water 17 01340 g008
Figure 9. Experimental fish tank.
Water 17 01340 g009
Figure 10. Experiment methods and procedures.
Water 17 01340 g010
Figure 11. The control group and low-turbidity and high-turbidity tanks.
Water 17 01340 g011
Figure 12. Long-term fish conditions experimental tank: (a) Schematic Diagram of the Experimental Tank, (b) Tubidity Maintenance Sytstem.
Water 17 01340 g012
Figure 13. Monitoring of fish conditions over time.
Water 17 01340 g013
Figure 14. Type 1 water quality measurement results (Zacco platypus): (a) turbidity (NTU), (b) pH, (c) dissolved oxygen (DO), and (d) temperature, The red dotted line represents the trend line, and the blue line indicates the measurement error range.
Water 17 01340 g014
Figure 15. Type 2 water quality measurement results (Zacco platypus): (a) turbidity (NTU), (b) pH, (c) dissolved oxygen (DO), and (d) temperature, The red dotted line represents the trend line, and the blue line indicates the measurement error range.
Water 17 01340 g015
Figure 16. Type 3 water quality measurement results (Zacco platypus): (a) turbidity (NTU), (b) pH, (c) dissolved oxygen (DO), and (d) temperature, The red dotted line represents the trend line, and the blue line indicates the measurement error range.
Water 17 01340 g016
Figure 17. Type 4 water quality measurement results (Zacco platypus): (a) turbidity (NTU), (b) pH, (c) dissolved oxygen (DO), and (d) temperature, The red dotted line represents the trend line, and the blue line indicates the measurement error range.
Water 17 01340 g017
Figure 18. Type 1 water quality measurement results (Pseudopungtungia nigra): (a) turbidity (NTU), (b) pH, (c) dissolved oxygen (DO), and (d) temperature, The red dotted line represents the trend line, and the blue line indicates the measurement error range.
Water 17 01340 g018
Figure 19. Type 2 water quality measurement results (Pseudopungtungia nigra): (a) turbidity (NTU), (b) pH, (c) dissolved oxygen (DO), and (d) temperature, The red dotted line represents the trend line, and the blue line indicates the measurement error range.
Water 17 01340 g019
Figure 20. Type 3 water quality measurement results (Pseudopungtungia nigra): (a) turbidity (NTU), (b) pH, (c) dissolved oxygen (DO), and (d) temperature, The red dotted line represents the trend line, and the blue line indicates the measurement error range.
Water 17 01340 g020
Figure 21. Type 4 water quality measurement results (Pseudopungtungia nigra): (a) turbidity (NTU), (b) pH, (c) dissolved oxygen (DO), and (d) temperature, The red dotted line represents the trend line, and the blue line indicates the measurement error range.
Water 17 01340 g021
Figure 22. Type 1 water quality measurement results (Zacco koreanus): (a) turbidity (NTU), (b) pH, (c) dissolved oxygen (DO), and (d) temperature, The red dotted line represents the trend line, and the blue line indicates the measurement error range.
Water 17 01340 g022
Figure 23. Type 2 water quality measurement results (Zacco koreanus): (a) turbidity (NTU), (b) pH, (c) dissolved oxygen (DO), and (d) temperature, The red dotted line represents the trend line, and the blue line indicates the measurement error range.
Water 17 01340 g023
Figure 24. Type 3 water quality measurement results (Zacco koreanus): (a) turbidity (NTU), (b) pH, (c) dissolved oxygen (DO), and (d) temperature, The red dotted line represents the trend line, and the blue line indicates the measurement error range.
Water 17 01340 g024
Figure 25. Case 1: fish migration due to turbidity (Zacco platypus).
Water 17 01340 g025
Figure 26. Case 2: fish migration due to turbidity (Pseudopungtungia nigra).
Water 17 01340 g026
Figure 27. Case 3: fish migration due to turbidity (Zacco koreanus).
Water 17 01340 g027
Figure 28. Turbidity changes downstream of Andong Dam from 2014 to 2024.
Water 17 01340 g028
Table 1. Reference data for turbidity conditions in the experimental waterway: Nakdonggang River Measurement Points, January 2018–August 2021 (approximately 3 years).
TurbidityAndong 1Andong 2Andong 3Andong 4Andong 5
Maximum Value9.223.523.226.447.1
Mean2.35.77.07.89.5
Minimum Value0.41.31.91.92.7
Table 2. Experimental conditions.
ClassificationWaterway ConditionsTurbidity Conditions in the WaterwayNote
CASE 1Water depth (55 cm)
Flow velocity (0.25 m/s)
Flow rate (0.35 cm/s)
0–5 NTU (no sediment supply, Blank), ~25 NTU, ~50 NTU
~75 NTU, ~100 NTU, 120 NTU (river during rainfall), ≥120 NTU
Fish behavior confirmation
Low concentration confirmation required first
(turbidity conditions that fish respond to)
If high concentration is required
CASE 2Flow velocity change-Considering sediment travel time
Table 3. Turbidimeter measurement data.
Time (s)Turbidity (NTU)
Site 1Site 2Site 3
Case 1Case 2Case 3Case 4Case 5Case 1Case 2Case 3Case 4Case 5Case 1Case 2Case 3Case 4Case 5
07.07.715.39.410.67.07.715.39.415.37.07.715.39.410.6
207.48.119.210.410.46.58.216.69.316.6
4017.52243.111.223.87.27.617.28.917.2
6054.822.350.141.044.85.76.730.39.630.3
8044.935.656.448.952.96.89.632.09.332.0 15.3 10.6
10039.026.545.763.051.151.052.834.88.634.8 7.717.0 13.3
12023.924.947.363.553.969.650.731.68.831.6 9.616.6 9.5
14027.318.649.062.655.856.449.831.39.431.33.86.716.8 1.2
16024.620.553.565.452.849.545.932.823.332.84.16.614.9 1.5
18017.520.550.862.554.346.542.134.840.734.84.57.914.6 1.7
20016.423.218.066.250.042.845.930.061.530.03.7717.09.41.8
2205.69.217.260.935.744.143.116.784.216.73.86.816.310.32.0
2406.17.516.228.624.038.339.816.888.216.83.58.220.79.52.3
2605.07.217.719.118.59.69.916.885.216.83.56.715.610.52.4
2804.17.617.710.816.75.07.115.586.215.53.06.917.28.12.5
300 10.716.8 84.2 7.72.6
320 10.311.9 67.1 9.52.8
340 10.19.4 46.4 8.43.0
360 10.0 30.8 8.3
380 9.5 16.4 7.5
400 10.2 11.7 6.1
420 9.8 9.9 6.7
Disclaimer/Publisher’s Note: The statements, opinions and data contained in all publications are solely those of the individual author(s) and contributor(s) and not of MDPI and/or the editor(s). MDPI and/or the editor(s) disclaim responsibility for any injury to people or property resulting from any ideas, methods, instructions or products referred to in the content.

