
Geoinformation and Analytical Support for the Development of Promising Aquifers for Pasture Water Supply in Southern Kazakhstan

 , , , , , and
Abstract
1. Introduction
2. Materials and Methods
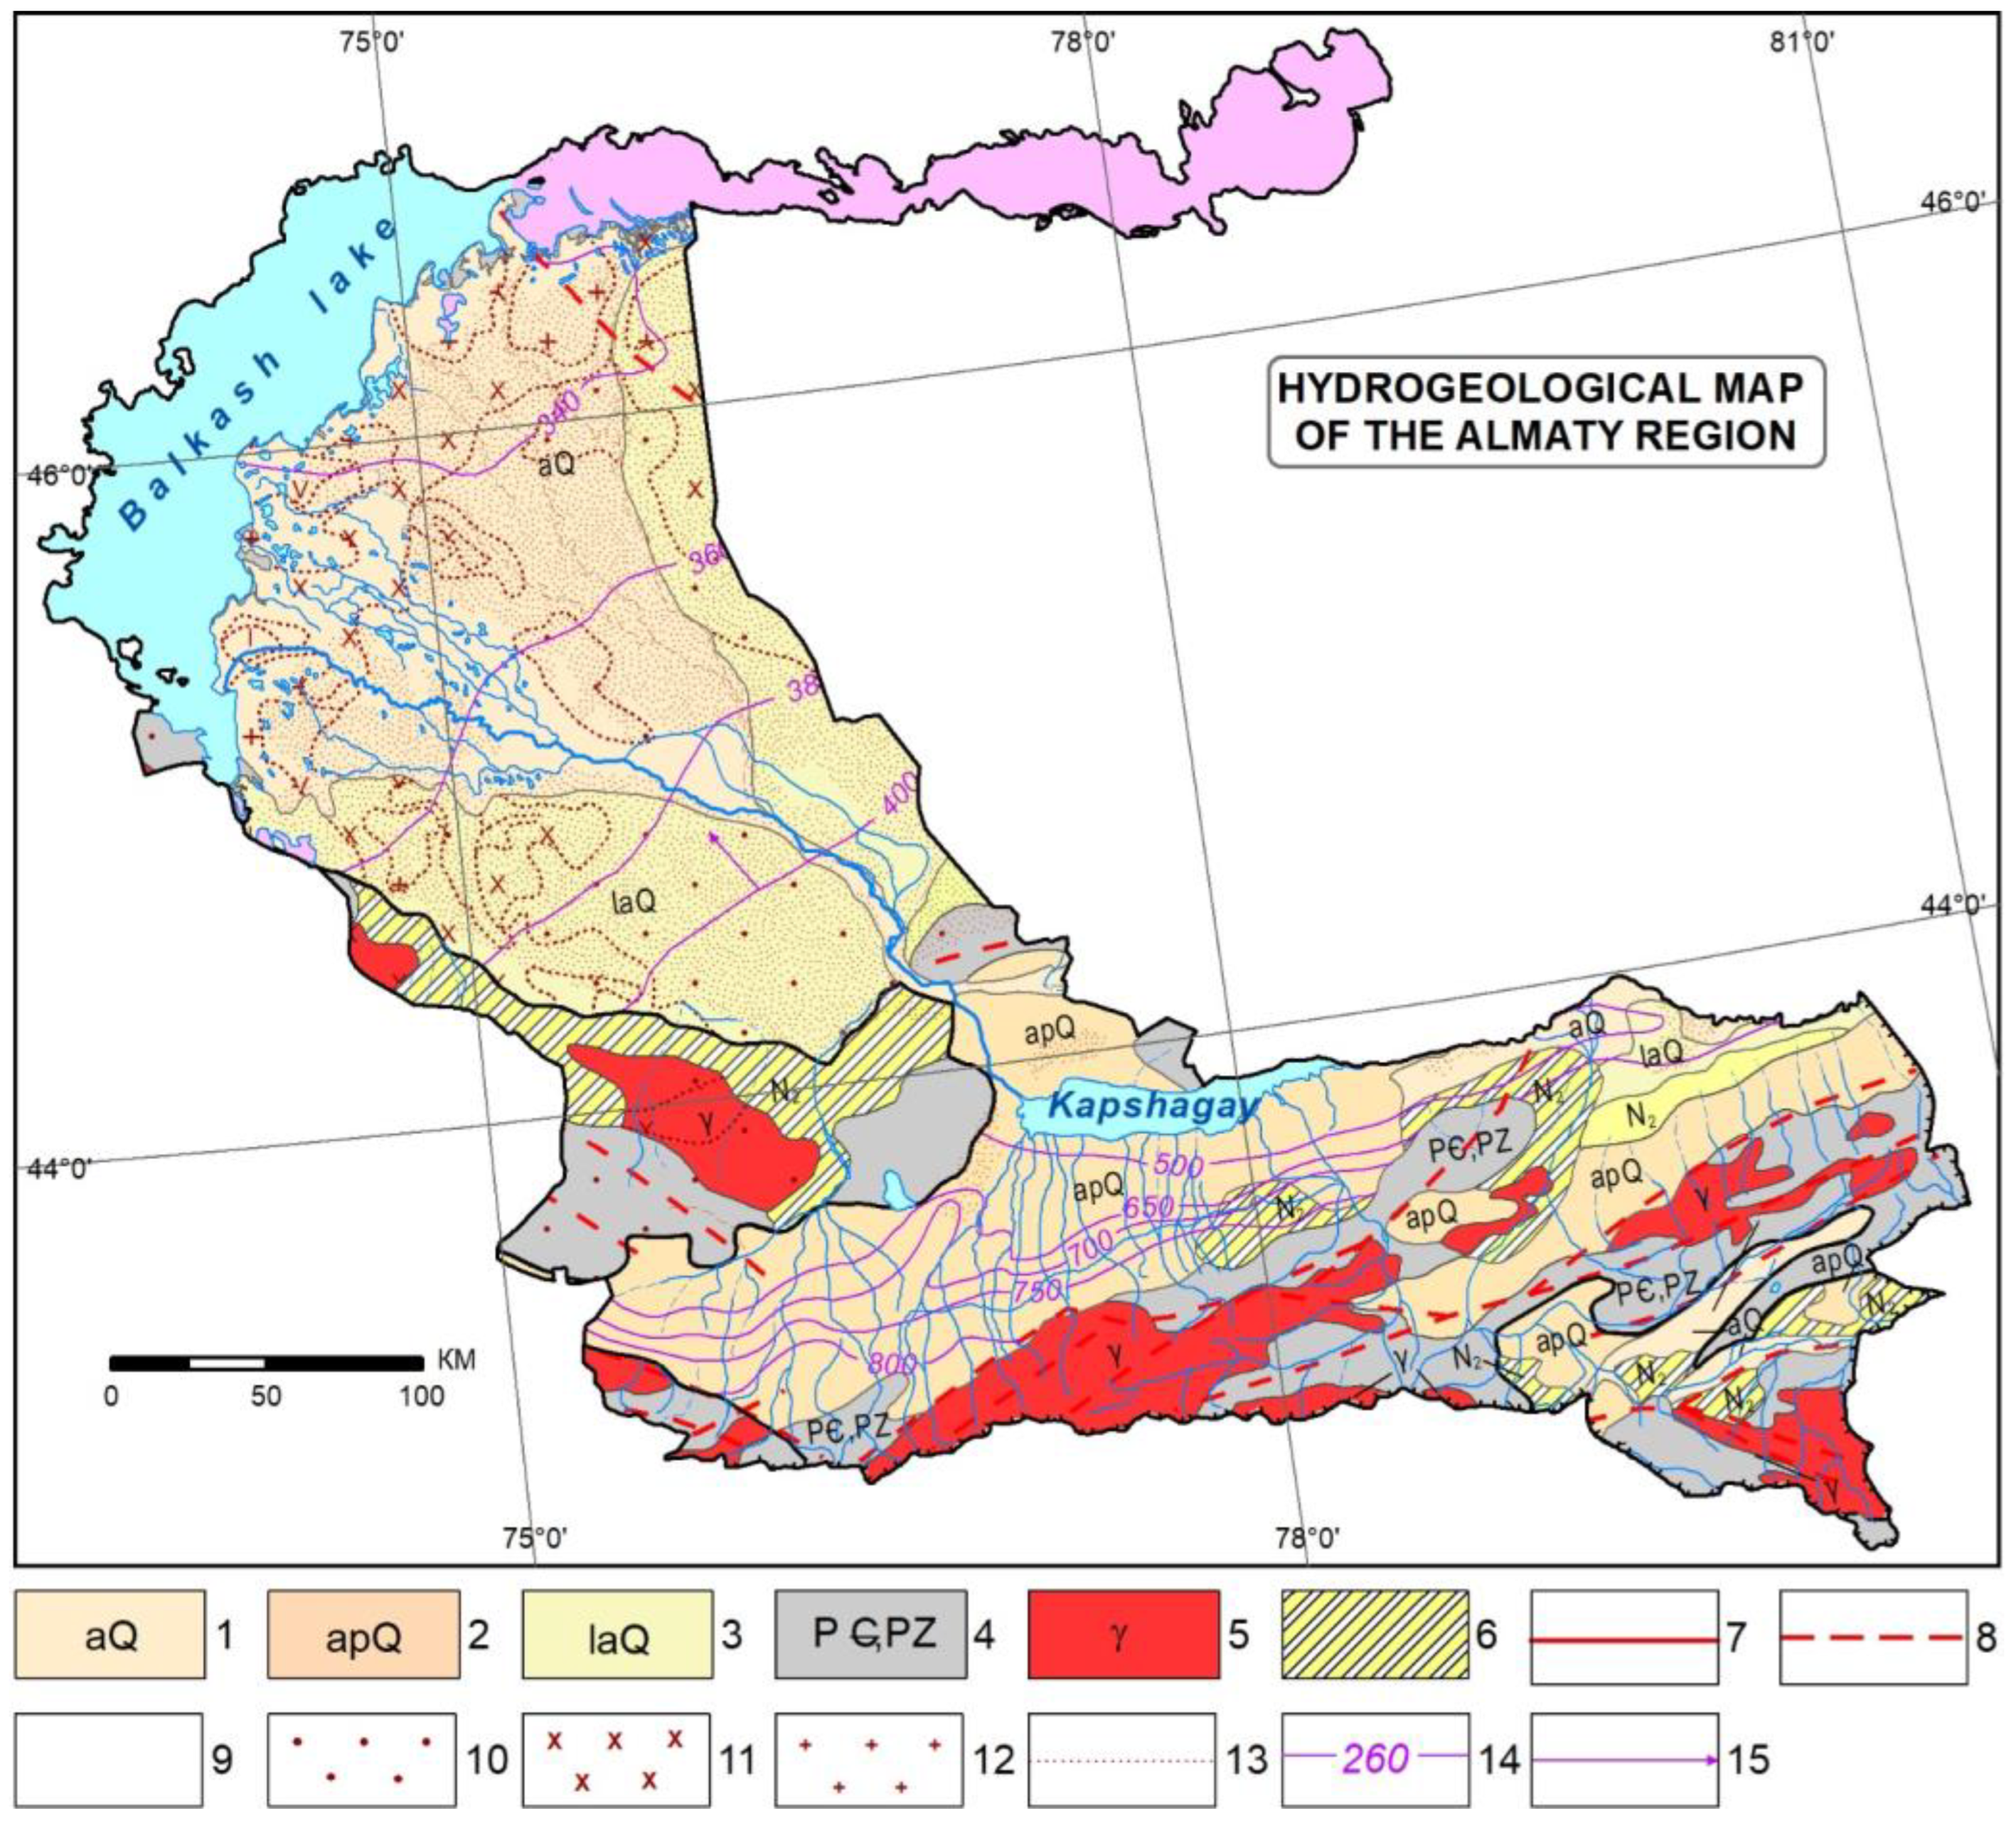
2.1. Almaty Region
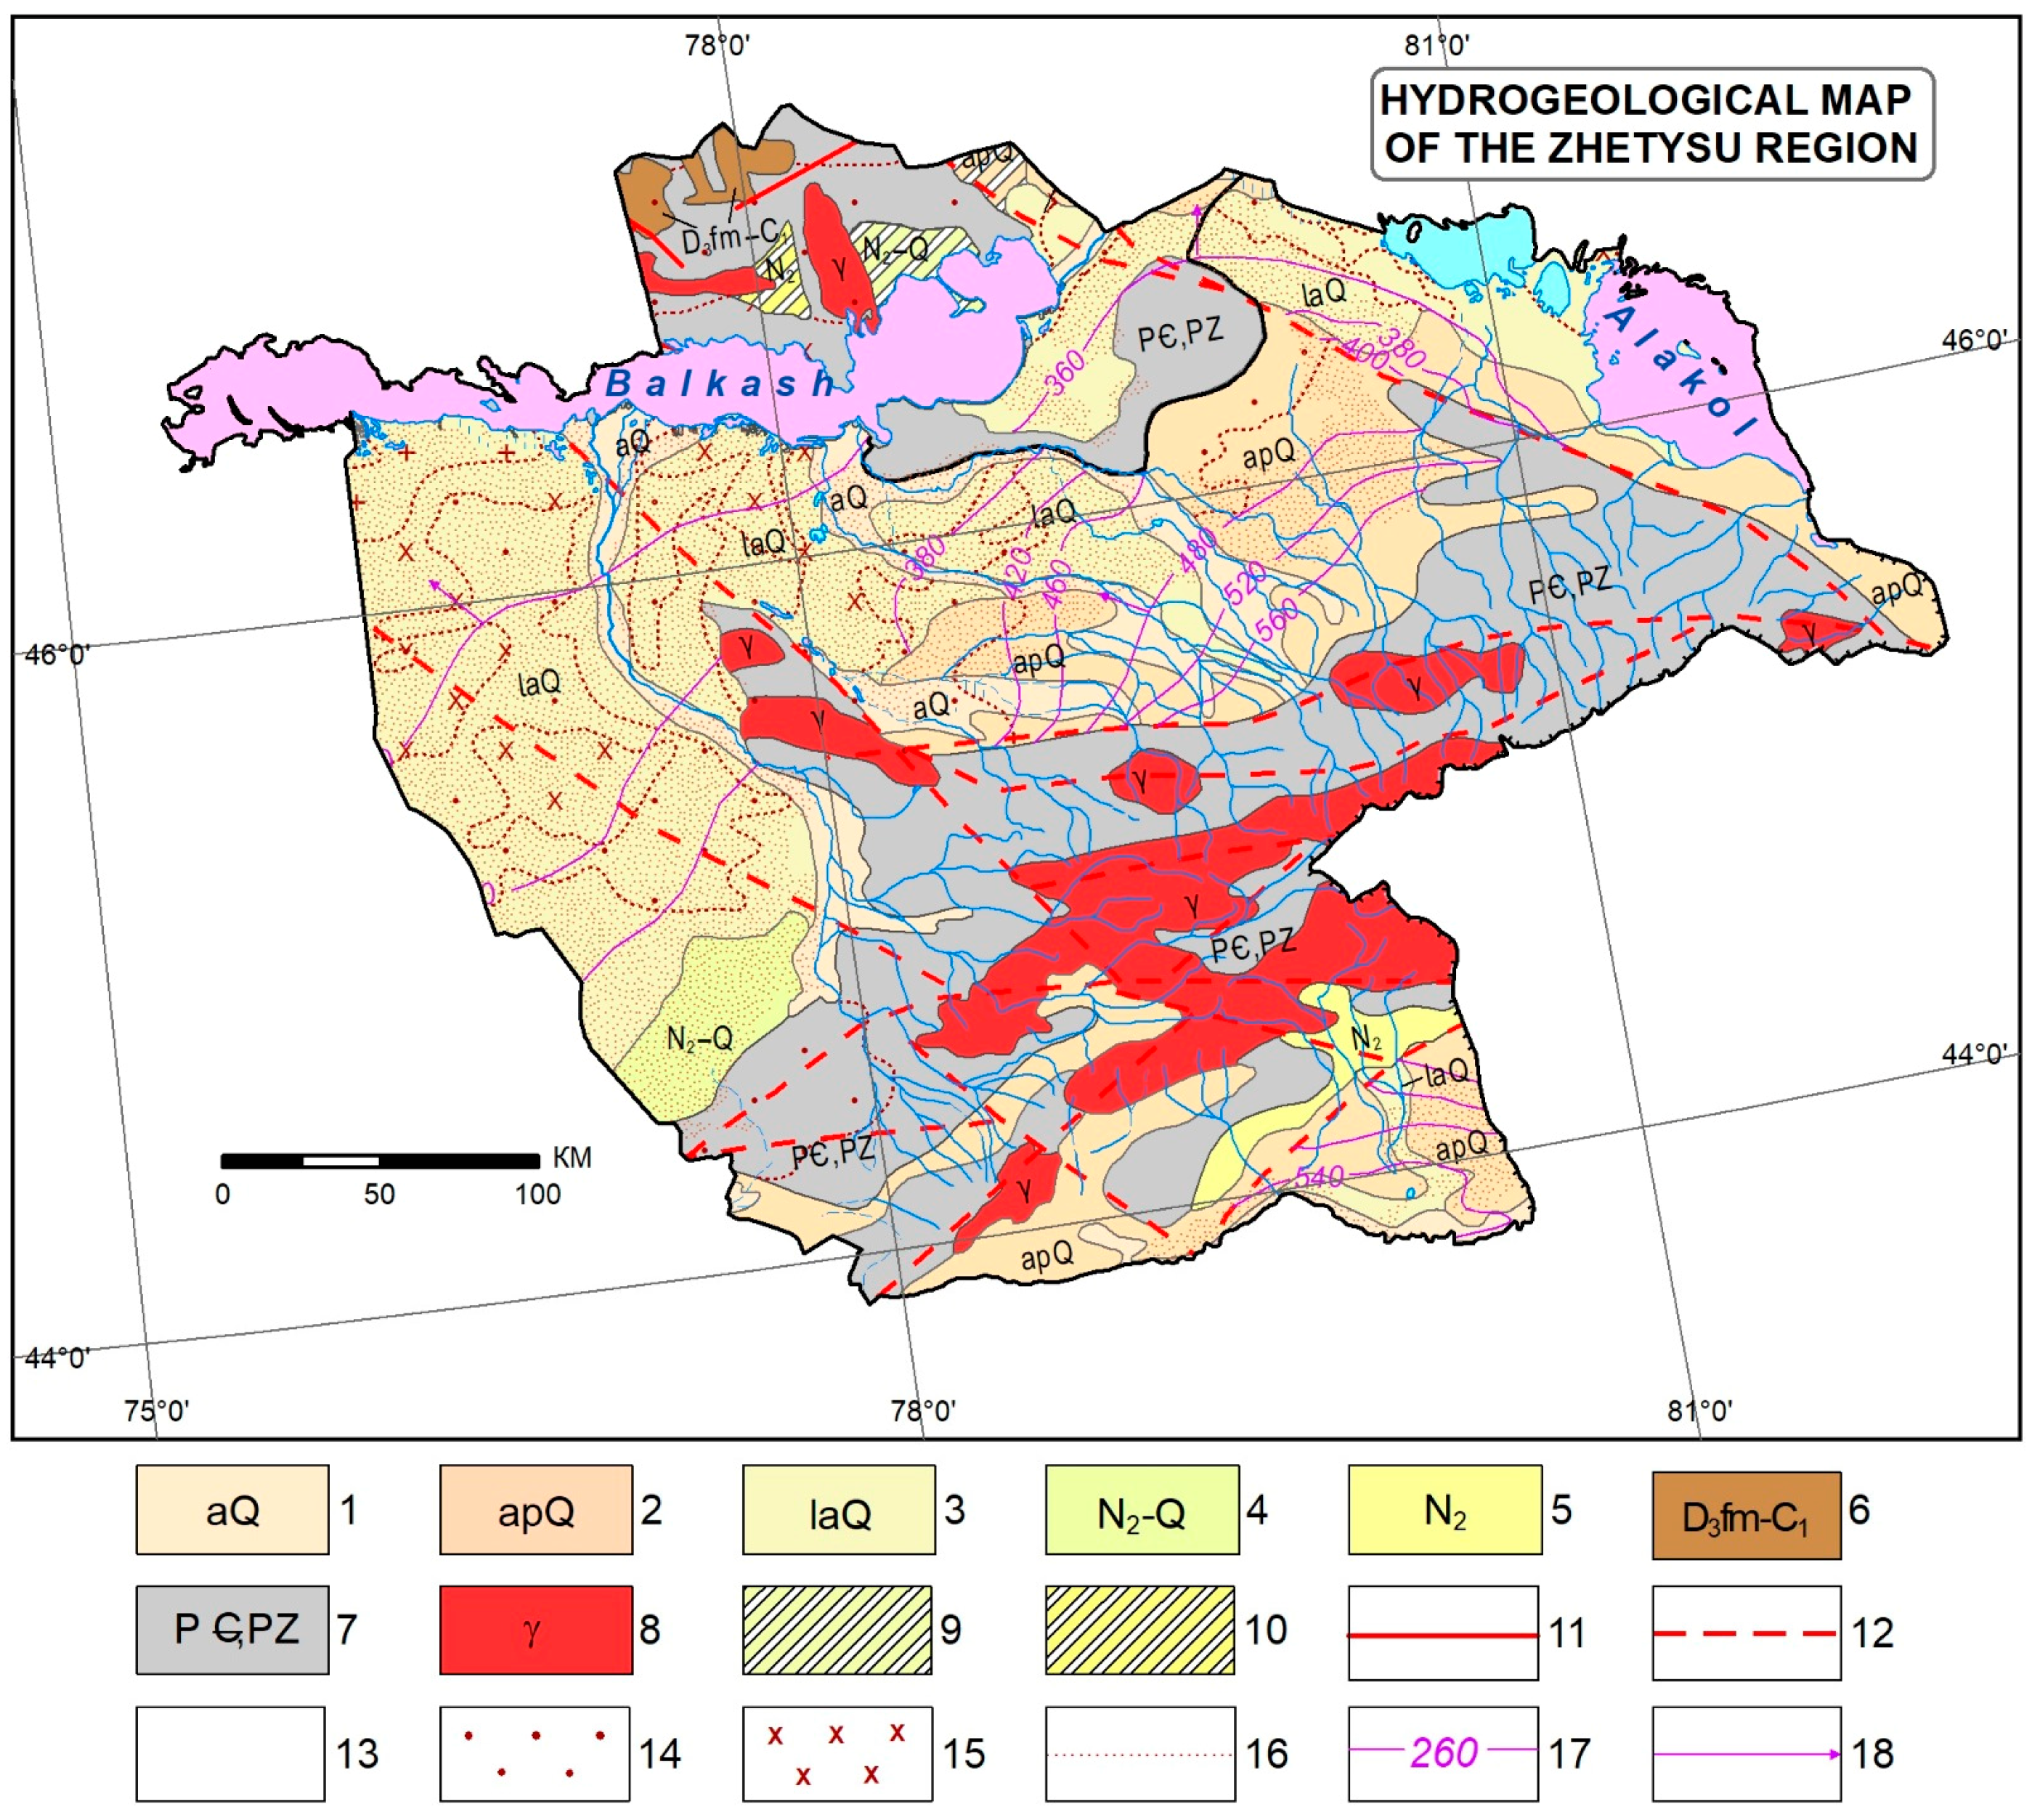
2.2. Zhetysu Region
2.3. Information Gathering
2.4. Regional Expedition Surveys
3. Results and Discussion
3.1. Hydrogeology of Almaty and Zhetysu Regions
- Up to 1 g/L—17,160.80 thousand m3/day
- 1–3 g/L—3073.60 thousand m3/day
- 3–10 g/L—913.8 thousand m3/day
- ≤1 g/L: 21,963.3 thousand m3/day
- 1–3 g/L: 5330.9 thousand m3/day
- 3–10 g/L: 1393.9 thousand m3/day
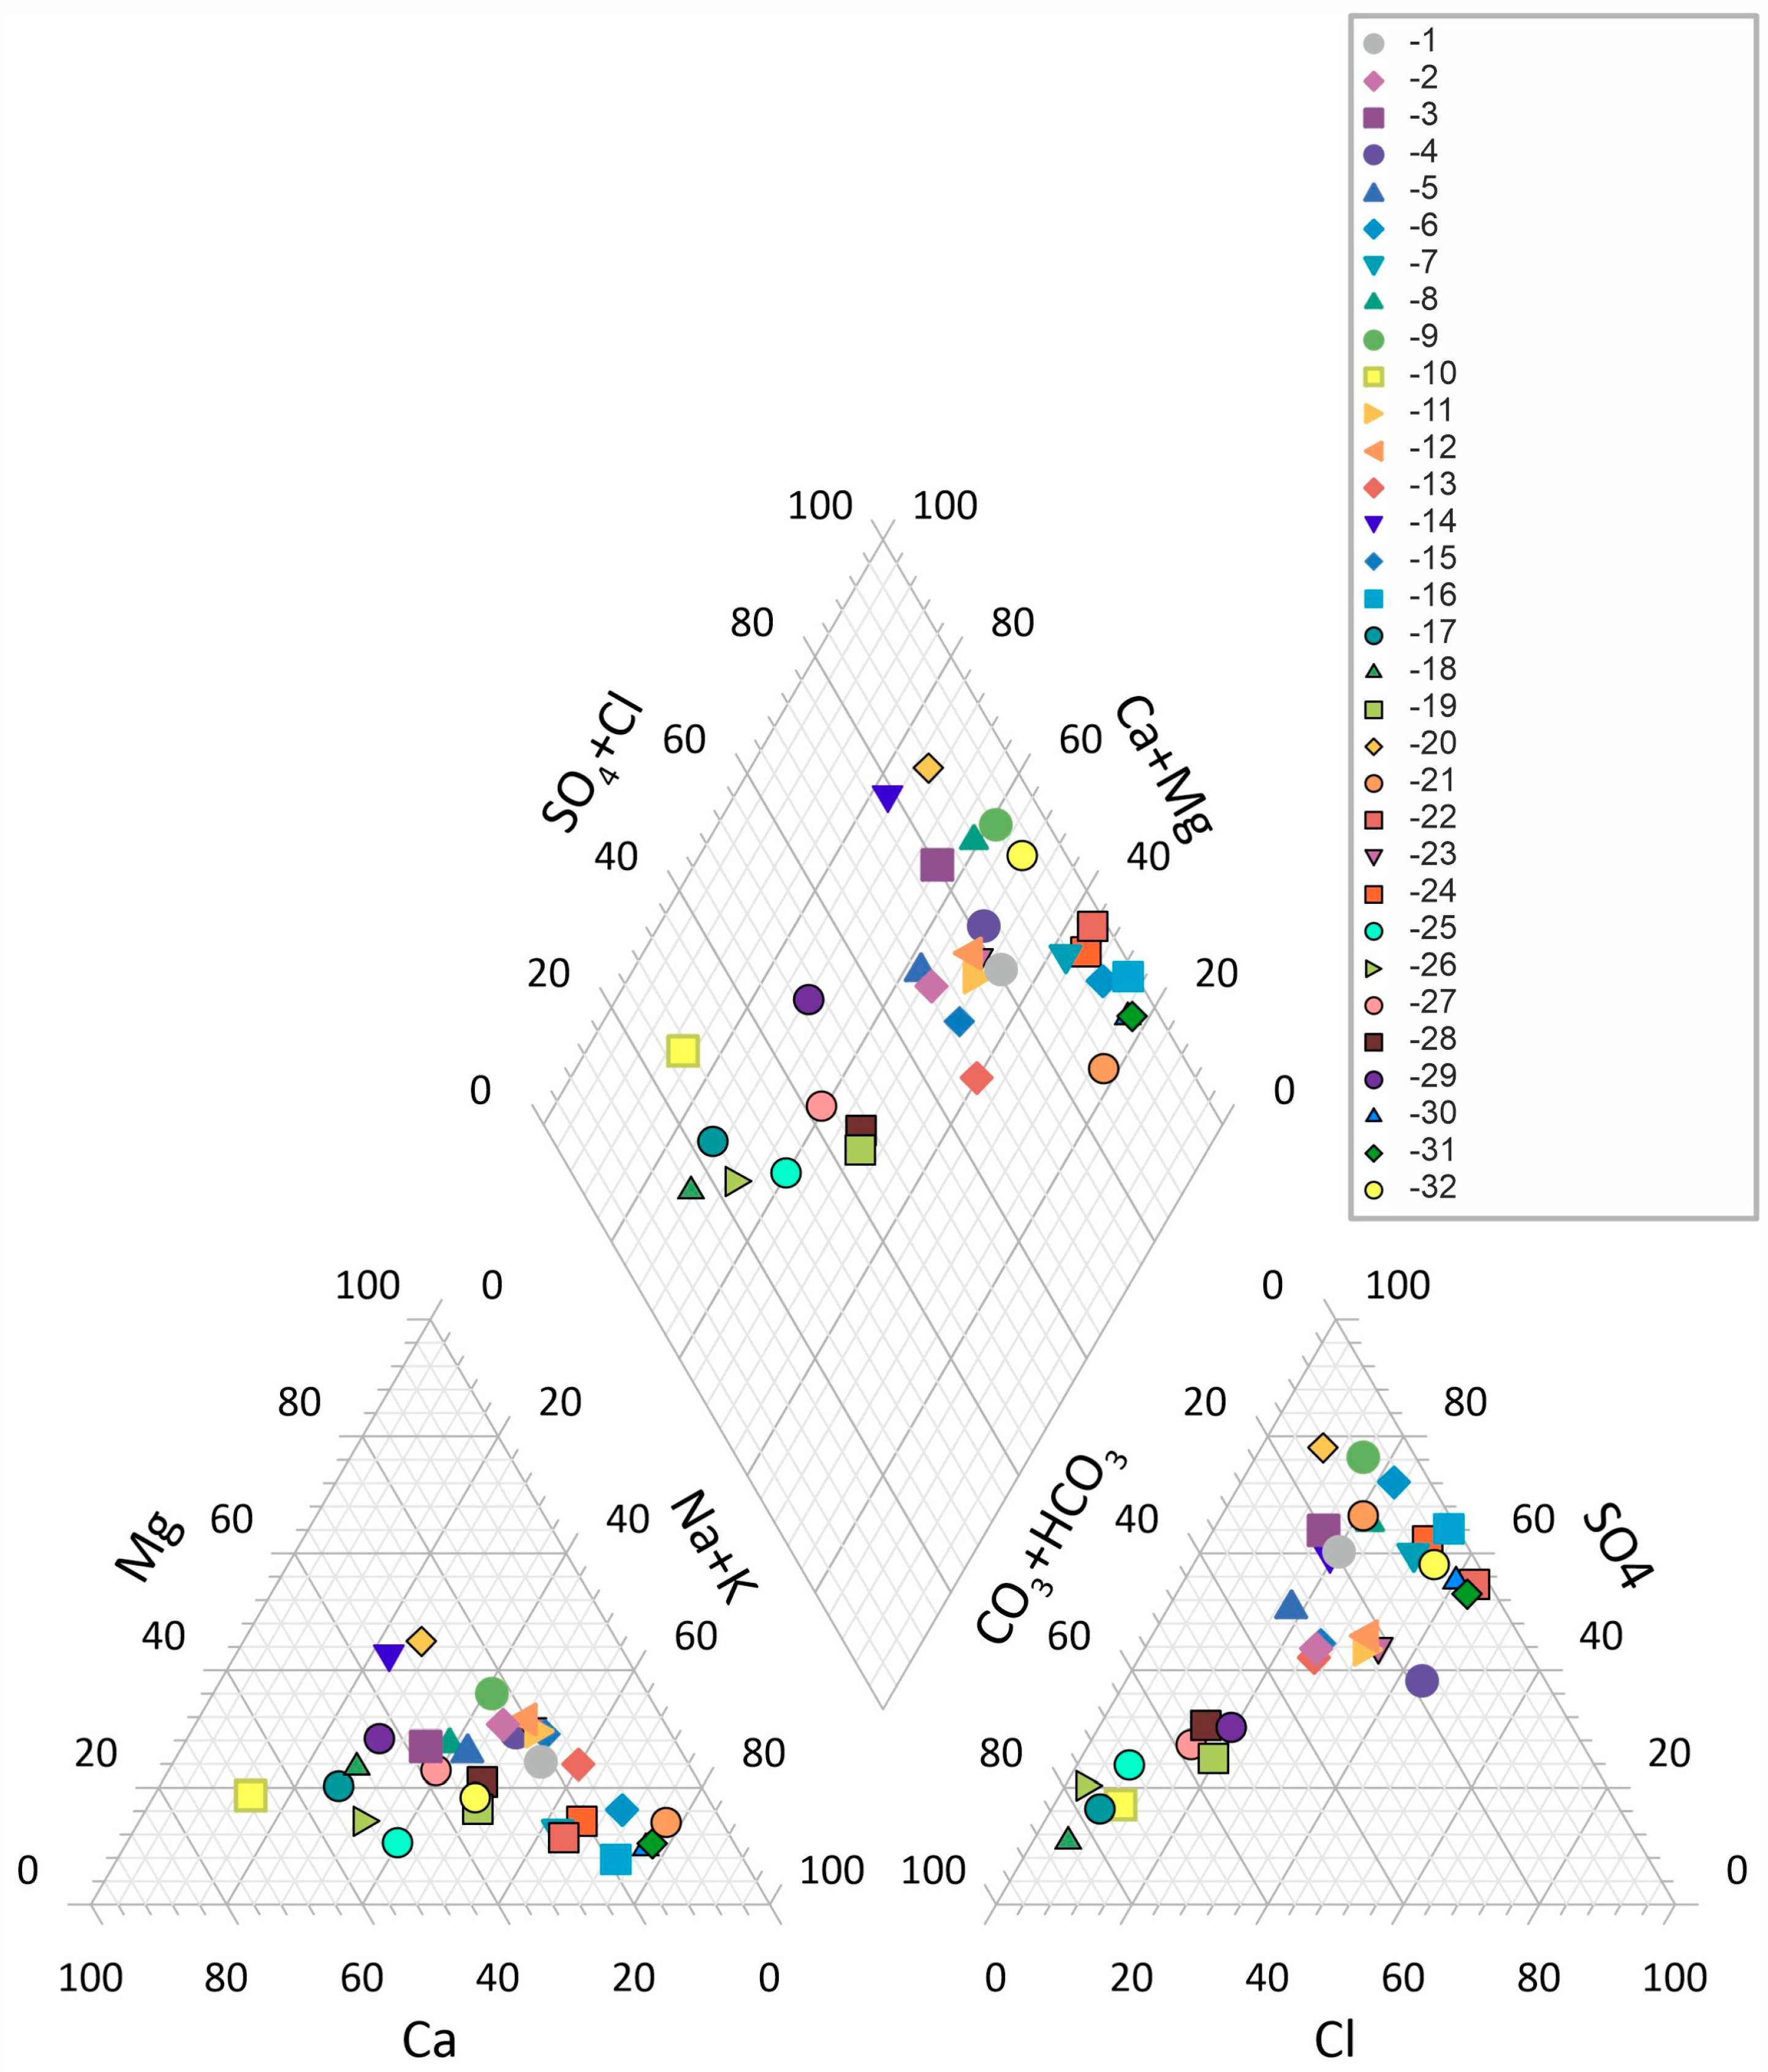
3.2. Chemical Analytical Studies of Groundwater Samples
3.3. Justification and Evaluation of Promising Aquifer Horizons for Development in Pasture Areas
4. Conclusions
Author Contributions
Funding
Data Availability Statement
Conflicts of Interest
Abbreviations
| UN | United Nations |
| GIS | Geographic Information System |
| SDG | Sustainable Development Goal |
Appendix A

| “Administrative Region” | “Number of Objects” | “Number of Water Samples Collected” | ||
|---|---|---|---|---|
| Well | Boreholes | Spring | ||
| Almaty | 16 | 15 | 1 | 32 |
| Zhetysu | 12 | 11 | - | 23 |
| TOTAL | 28 | 26 | 1 | 55 |
| Region | Almaty Region and Zhetysu Region | ||
|---|---|---|---|
| Population size | Average annual number by region (base) thousand people | 2024 year | 4108.0 |
| 2030 year | 5045.0 | ||
| Change in rural population by 2030, thousand people | 720.2 | ||
| Rural population share, % | 2024 year | 38.0 | |
| 2030 year | 37.0 | ||
| Number of rural population without access to drinking water in 2024 year, people | 16,525.0 | ||
| Need for water | Water requirement (standard), m3/day | 2024 year | 1,195,342.0 |
| 2030 year | 1,401,550.0 | ||
| Changes in rural population needs by 2030, thousand people. | 33,768.0 | ||
| Deficit of water demand of rural population in 2024, m3/day | 2644.0 | ||
| Water supply | Operating reserves for domestic and drinking water supply, m3/day | 5,828,060.0 | |
| Availability, m3/day | 2024 year | 4,632,718.0 | |
| 2030 year | 4,426,510.0 | ||
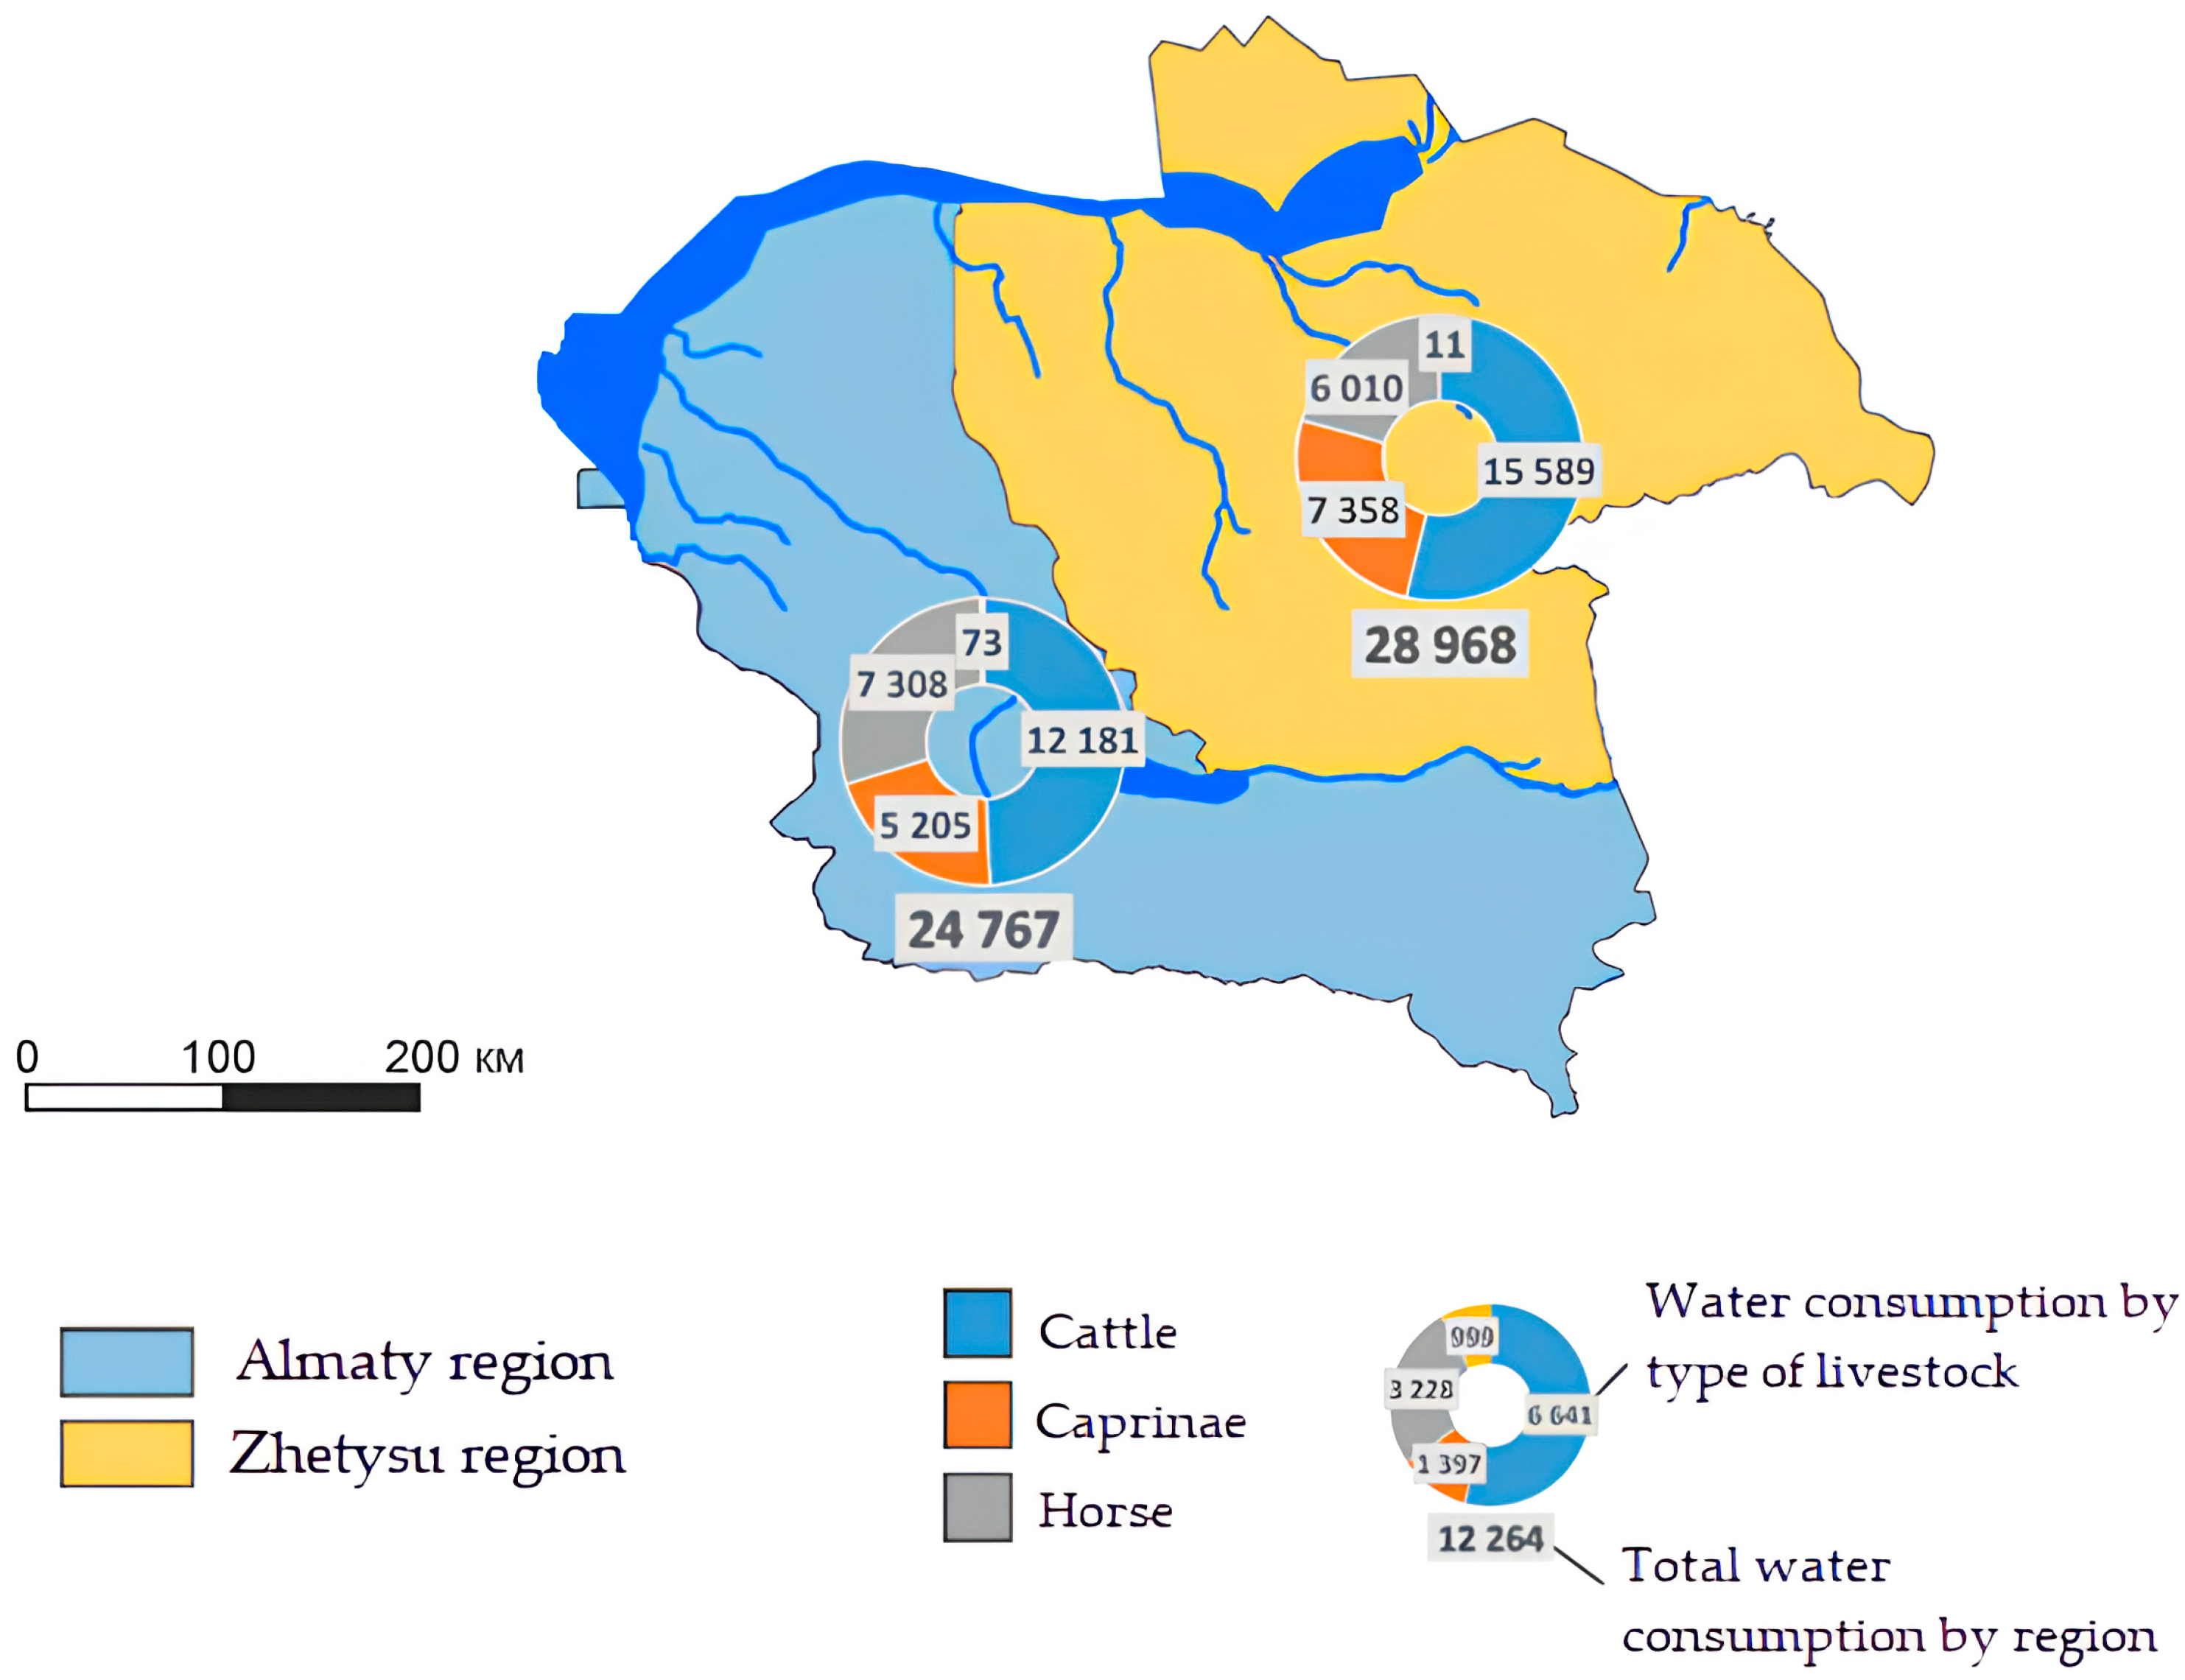
| Area | Almaty Region | Zhetysu Region | |
|---|---|---|---|
| Total area, ha | 7,349,165 | 5,962,616 | |
| Pasture territories, ha | 3,091,816 | 4,920,000 | |
| Number of livestock | Cattle | 304,517 | 389,732 |
| Small cattle | 867,467 | 1,226,267 | |
| Horses | 162,398 | 133,557 | |
| Camel | 2096 | 327 | |
| Total number of livestock | 2,592,102 | 1,749,883 | |
| Water consumption by type of livestock, thousand liters/day | Cattle | 12,180.68 | 15,589.28 |
| Small cattle | 5204.80 | 7357.60 | |
| Horses | 7307.91 | 6010.07 | |
| Camel | 73.36 | 11.45 | |
| Total water consumption, thousand m3/year | 9039.86 | 10,573.46 | |
| Sampling Location | Well Chundzha 1 | Boreholes Chundzha 2 | Well Chundzha 3 | Well Shelek 1 | Well Shelek 2 | Well Shelek 3 | Well Kyrbaltabay 1 | ||||||||||||||
|---|---|---|---|---|---|---|---|---|---|---|---|---|---|---|---|---|---|---|---|---|---|
| Date of sampling | 19.10.2024 | 19.10.2024 | 19.10.2024 | 20.10.2024 | 20.10.2024 | 20.10.2024 | 22.10.2024 | ||||||||||||||
| The coordinates of sampling points | 43°35′30.31”N 79°25′52.32”E | 43°31′3.50”N 79°29′46.42”E | 43°32′19.19”N 79°34′8.13”E | 43°35′1.84”N 78° 6′2.11”E | 43°35′13.11”N 78° 5′19.33”E | 43°33′46.66”N 78° 5′59.13”E | 43°36′38.87”N 77°27′55.83”E | ||||||||||||||
| pH | 7.1 | 7.4 | 7.5 | 7.5 | 7.6 | 7.5 | 7.9 | ||||||||||||||
| Dry residue, mg/dm3 | 179 | 260 | 220 | 333 | 321 | 394 | 118 | ||||||||||||||
| Cations, mg/dm3 | Na | 29.9 | 15.8 | 31.6 | 60.2 | 69 | 50.9 | 12.7 | |||||||||||||
| K | 0.9 | 3 | 1.3 | 1.5 | 1.8 | 1.8 | 1.5 | ||||||||||||||
| Ca2+ | 33 | 72.1 | 44 | 51.1 | 41 | 69.1 | 24 | ||||||||||||||
| Mg2+ | 4.3 | 12.2 | 7.3 | 18.8 | 16.4 | 27.4 | 5.5 | ||||||||||||||
| NH4+ | <0.05 | <0.05 | <0.05 | <0.05 | <0.05 | <0.05 | <0.05 | ||||||||||||||
| Fe sum | <0.1 | <0.1 | <0.1 | <0.1 | <0.1 | <0.1 | <0.1 | ||||||||||||||
| Anions, mg/dm3 | CO3− | <8.0 | <8.0 | <8.0 | <8.0 | <8.0 | <8.0 | <8.0 | |||||||||||||
| HCO3− | 128.1 | 216.6 | 195.3 | 216.6 | 189.2 | 219.7 | 106.8 | ||||||||||||||
| Cl− | 5 | 10 | 3 | 29 | 28 | 42 | 4 | ||||||||||||||
| SO42− | 35 | 40 | 41 | 81 | 85 | 104 | 18 | ||||||||||||||
| NO3− | 6 | 12 | 4 | 7 | 7 | 13 | 3 | ||||||||||||||
| NO2− | <0.01 | <0.01 | <0.01 | <0.01 | <0.01 | <0.01 | <0.01 | ||||||||||||||
| F, mg/dm3 | 0.2 | 0.2 | 0.2 | 0.7 | 0.8 | 0.8 | 1.1 | ||||||||||||||
| Mineralization, mg/dm3 | 255 | 390 | 338 | 473 | 445 | 536 | 183 | ||||||||||||||
| Hardness | total | 2 | 4.6 | 2.8 | 4.1 | 3.4 | 5.7 | 1.7 | |||||||||||||
| carbonates | 2 | 3.6 | 2.8 | 3.6 | 3.1 | 3.6 | 1.7 | ||||||||||||||
| SiO2 | 12.3 | 8 | 10.1 | 7 | 7 | 7.2 | |||||||||||||||
| Petroleum products, mg/dm3 | 0.006 | 0.009 | 0.007 | 0.006 | 0.006 | - | 6.5 | ||||||||||||||
| Cd, mg/dm3 | 0.0005 | 0.0007 | 0.0005 | 0.0008 | 0.0007 | 0.0007 | 0.006 | ||||||||||||||
| Pb, mg/dm3 | - | - | - | - | - | - | 0.0009 | ||||||||||||||
| Cu, mg/dm3 | 0.0015 | 0.0065 | - | 0.003 | - | 0.0044 | 0.016 | ||||||||||||||
| Zn, mg/dm3 | 0.0017 | 0.0044 | 0.0011 | 0.0022 | 0.0017 | 0.0003 | 0.011 | ||||||||||||||
| Sampling Location | Well Kyrbaltabay 2 | Well Kyrbaltabay 3 | Boreholes, Sorbulak 1 (Western Part) | Well, Sorbulak 2 (Western Part) | Boreholes, Sorbulak 3 (Western Part) | Boreholes, Sorbulak 4 (Western Part) | |||||||||||||||
| Date of sampling | 22.10.2024 | 11.10.2024 | 08.10.2024 | 08.10.2024 | 08.10.2024 | 08.10.2024 | |||||||||||||||
| The coordinates of sampling points | 43°38′22.61″ N 77°26′7.64″ E | 43°39′56.50″ N 77°25′57.80″ E | 43°37′48.08″ N 76°31′16.21″ E | 43°37′37.65″ N 76°26′53.09″ E | 43°39′7.64″ N 76°26′7.08″ E | 43°39′5.53″ N 76°24′48.25″ E | |||||||||||||||
| pH | 7.9 | 8.1 | 7.4 | 7.8 | 7.4 | 7.9 | |||||||||||||||
| Dry residue, mg/dm3 | 96 | 121 | 933 | 547 | 913 | 508 | |||||||||||||||
| Cations, mg/dm3 | Na | 11.5 | 23.7 | 189.7 | 118 | 92.5 | 113.1 | ||||||||||||||
| K | 1.1 | 0.8 | 2.1 | 1.8 | 1.6 | 1.5 | |||||||||||||||
| Ca2+ | 19 | 15 | 79.1 | 42 | 124.1 | 35 | |||||||||||||||
| Mg2+ | 5.5 | 4.3 | 62 | 37.1 | 90.6 | 33.4 | |||||||||||||||
| NH4+ | <0.05 | <0.05 | <0.05 | <0.05 | <0.05 | <0.05 | |||||||||||||||
| Fe sum | <0.1 | <0.1 | <0.1 | <0.1 | <0.1 | <0.1 | |||||||||||||||
| Anions, mg/dm3 | CO3− | <8.0 | <8.0 | <8.0 | <8.0 | <8.0 | <8.0 | ||||||||||||||
| HCO3− | 88.5 | 76.3 | 173.9 | 115.9 | 207.5 | 158.6 | |||||||||||||||
| Cl− | 2 | 14 | 158 | 76 | 111 | 50 | |||||||||||||||
| SO42− | 9 | 27 | 287 | 179 | 448 | 186 | |||||||||||||||
| NO3− | 2 | 3 | 147 | 82 | <0.2 | 50 | |||||||||||||||
| NO2− | <0.01 | <0.01 | <0.01 | <0.01 | 17 | <0.01 | |||||||||||||||
| F, mg/dm3 | 1.3 | 1.4 | 5 | 4.4 | 2 | 5 | |||||||||||||||
| Mineralization, mg/dm3 | 146 | 172 | 1110.00 | 661 | 1102.00 | 638 | |||||||||||||||
| Hardness | total | 1.4 | 1.1 | 9.1 | 5.2 | 13.7 | 4.5 | ||||||||||||||
| carbonates | 1.4 | 1.1 | 2.9 | 1.9 | 3.4 | 2.6 | |||||||||||||||
| SiO2 | 6.1 | 6.5 | 6.2 | 5.1 | 7.3 | 5.7 | |||||||||||||||
| Petroleum products, mg/dm3 | 0.006 | 0.007 | - | - | - | - | |||||||||||||||
| Cd, mg/dm3 | 0.0007 | 0.0008 | - | - | - | - | |||||||||||||||
| Pb, mg/dm3 | 0.01 | 0.01 | - | 0.019 | 0.018 | 0.018 | |||||||||||||||
| Cu, mg/dm3 | 0.0096 | 0.0074 | 0.03 | 0.013 | 0.035 | 0.035 | |||||||||||||||
| Zn, mg/dm3 | 0.0011 | 0.0006 | 0.02 | 0.0034 | 0.004 | 0.004 | |||||||||||||||
| Sampling Location | Well Kurtov 1 | Boreholes Kurtov 2 | Boreholes Kurtov 3 | West Well Kanshengel 1 | West Well Kanshengel 2 | East Boreholes Kanshengel 1 | |||||||||||||||
| Date of sampling | 08.10.2024 | 08.10.2024 | 08.10.2024 | 09.10.2024 | 09.10.2024 | 09.10.2024 | |||||||||||||||
| The coordinates of sampling points | 43°52′47.93″ N 76°14′44.71″ E | 43°51′2.31″ N 76°14′48.85″ E | 43°51′55.75″ N 76°13′1.48″ E | 44°15′6.68″ N 75°31′28.62″ E | 44°15′51.99″ N 75°31′28.62″ E | 44°29′32.81″ N 75°43′55.81″ E | |||||||||||||||
| pH | 7.6 | 7.5 | 7.6 | 7.5 | 7.5 | 7.6 | |||||||||||||||
| Dry residue, mg/dm3 | 3651.00 | 5899.00 | 2428.00 | 4287.00 | 1966.00 | 830 | |||||||||||||||
| Cations, mg/dm3 | Na | 950.6 | 1561.00 | 580.2 | 1107.00 | 337.6 | 182.7 | ||||||||||||||
| K | 4 | 25.2 | 6.8 | 5.4 | 5.5 | 8.4 | |||||||||||||||
| Ca2+ | 260.3 | 266.3 | 204.2 | 370.4 | 214.2 | 61.1 | |||||||||||||||
| Mg2+ | 110.7 | 193.3 | 59.6 | 105.8 | 69.3 | 57.2 | |||||||||||||||
| NH4+ | <0.05 | <0.05 | <0.05 | <0.05 | 0.5 | 1.3 | |||||||||||||||
| Fe sum | <0.1 | <0.1 | <0.1 | <0.1 | <0.1 | <0.1 | |||||||||||||||
| Anions, mg/dm3 | CO3− | <8.0 | <8.0 | <8.0 | <8.0 | <8.0 | <8.0 | ||||||||||||||
| HCO3− | 189.2 | 305.1 | 213.6 | 88.5 | 134.2 | 207.5 | |||||||||||||||
| Cl− | 574 | 493 | 352 | 1007.00 | 360 | 144 | |||||||||||||||
| SO42− | 1772.00 | 3286.00 | 1115.00 | 1823.00 | 950 | 303 | |||||||||||||||
| NO3− | 191 | 463 | 158 | 90 | 120 | 44 | |||||||||||||||
| NO2− | <0.01 | <0.01 | <0.01 | <0.01 | <0.01 | <0.01 | |||||||||||||||
| F, mg/dm3 | 2.9 | 4.9 | 2.7 | 2.5 | 1.8 | 2.8 | |||||||||||||||
| Mineralization, mg/dm3 | 4062.00 | 6605.00 | 2701.00 | 4609.00 | 2199.00 | 1018.00 | |||||||||||||||
| Hardness | total | 22.1 | 29.2 | 15.1 | 27.2 | 16.4 | 7.8 | ||||||||||||||
| carbonates | 3.1 | 5 | 3.5 | 1.5 | 2.2 | 3.4 | |||||||||||||||
| SiO2 | 7.3 | 7.5 | 9.1 | 9.1 | 5.5 | 5.9 | |||||||||||||||
| Petroleum products, mg/dm3 | - | - | - | - | - | - | |||||||||||||||
| Cd, mg/dm3 | - | - | - | - | - | - | |||||||||||||||
| Pb, mg/dm3 | - | - | - | - | - | - | |||||||||||||||
| Cu, mg/dm3 | 0.043 | 0.052 | 0.035 | 0.045 | 0.015 | 0.021 | |||||||||||||||
| Zn, mg/dm3 | 0.008 | 0.01 | 0.0098 | 0.0097 | 0.02 | 0.02 | |||||||||||||||
| Sampling Location | East Boreholes Kanshengel 2 | East Boreholes Kanshengel 3 | Spring, Western Part City of Konayev 1 | Well, Western Part City of Konayev 2 (Shoshkaly) | West Well, Western Part City of Konayev 3 | Boreholes Mialy 1 | |||||||||||||||
| Date of sampling | 09.10.2024 | 09.10.2024 | 10.10.2024 | 10.10.2024 | 10.10.2024 | 10.10.2024 | |||||||||||||||
| The coordinates of sampling points | 44°32′59.68″ N 75°41′17.63″ E | 44°27′52.15″ N 75°40′26.85″ E | 43°51′39.20″ N 77° 0′10.92″ E | 43°54′36.45″ N 76°58′11.11″ E | 43°56′21.35″ N 76°58′16.69″ E | 44°31′6.73″ N 76°47′48.60″ E | |||||||||||||||
| pH | 7.6 | 7.8 | 7.6 | 7.4 | 7.6 | 7.4 | |||||||||||||||
| Dry residue, mg/dm3 | 969 | 873 | 4983.00 | 8474.00 | 4626.00 | 1923.00 | |||||||||||||||
| Cations, mg/dm3 | Na | 194.4 | 223.6 | 1462.70 | 2639.00 | 1438.00 | 209.6 | ||||||||||||||
| K | 9.5 | 10.3 | 6.8 | 10.5 | 6.7 | 145.8 | |||||||||||||||
| Ca2+ | 75.1 | 54.1 | 324.3 | 400.4 | 196.2 | 220.2 | |||||||||||||||
| Mg2+ | 69.9 | 48.6 | 82.7 | 177.5 | 103.4 | 109.4 | |||||||||||||||
| NH4+ | <0.05 | 0.1 | <0.05 | <0.05 | <0.05 | <0.05 | |||||||||||||||
| Fe sum | <0.1 | <0.1 | <0.1 | <0.1 | <0.1 | <0.1 | |||||||||||||||
| Anions, mg/dm3 | CO3− | <8.0 | <8.0 | <8.0 | <8.0 | <8.0 | <8.0 | ||||||||||||||
| HCO3− | 225.8 | 292.9 | 54.9 | 384.4 | 183.1 | 238 | |||||||||||||||
| Cl− | 158 | 121 | 1011.00 | 1510.00 | 1045.00 | 253 | |||||||||||||||
| SO42− | 357 | 303 | 2544.00 | 3580.00 | 1880.00 | 997 | |||||||||||||||
| NO3− | 38 | 27 | <0.2 | 709 | 130 | <0.2 | |||||||||||||||
| NO2− | <0.01 | <0.01 | <0.01 | <0.01 | <0.01 | 29 | |||||||||||||||
| F, mg/dm3 | 3.9 | 4 | 3.4 | 3.6 | 4.2 | 1.6 | |||||||||||||||
| Mineralization, mg/dm3 | 1138.00 | 1090.00 | 5498.00 | 9422.00 | 4992.00 | 2210.00 | |||||||||||||||
| Hardness | total | 9.5 | 6.7 | 23 | 34.6 | 18.3 | 20 | ||||||||||||||
| carbonates | 3.7 | 4.8 | 0.9 | 6.3 | 3 | 3.9 | |||||||||||||||
| SiO2 | 6.5 | 5.9 | 8.3 | 7.8 | 5.7 | 6.1 | |||||||||||||||
| Petroleum products, mg/dm3 | - | - | - | - | 0.008 | - | |||||||||||||||
| Cd, mg/dm3 | - | - | - | - | - | - | |||||||||||||||
| Pb, mg/dm3 | - | - | - | - | - | - | |||||||||||||||
| Cu, mg/dm3 | 0.022 | 0.018 | 0.043 | 0.054 | 0.039 | 0.026 | |||||||||||||||
| Zn, mg/dm3 | 0.01 | 0.0054 | 0.009 | 0.02 | 0.093 | 0.0098 | |||||||||||||||
| Sampling Location | Boreholes Mialy 2 | Well Mialy 3 | Well Birlik 1 | Boreholes Birlik 2 | Boreholes Birlik 3 | ||||||||||||||||
| Date of sampling | 10.10.2024 | 10.10.2024 | 11.10.2024 | 11.10.2024 | 11.10.2024 | ||||||||||||||||
| The coordinates of sampling points | 44°34′11.58″ N 76°54′1.38″ E | 44°39′41.59″ N 76°51′26.04″ E | 44°39′54.76″ N 76°47′45.39″ E | 44°49′21.00″ N 76°40′24.65″ E | 44°49′56.88″ N 76°37′53.48″ E | ||||||||||||||||
| pH | 7.8 | 7.8 | 7.5 | 7.7 | 7.7 | ||||||||||||||||
| Dry residue, mg/dm3 | 1719.00 | 2951.00 | 2171.00 | 529 | 811 | ||||||||||||||||
| Cations, mg/dm3 | Na | 259 | 926.8 | 226.1 | 94.6 | 119.6 | |||||||||||||||
| K | 5.6 | 5.1 | 8.2 | 3.3 | 4.2 | ||||||||||||||||
| Ca2+ | 128.1 | 86.1 | 220.2 | 62.1 | 110.1 | ||||||||||||||||
| Mg2+ | 121.6 | 88.8 | 209.2 | 32.2 | 48.6 | ||||||||||||||||
| NH4+ | <0.05 | <0.05 | <0.05 | <0.05 | <0.05 | ||||||||||||||||
| Fe sum | <0.1 | <0.1 | <0.1 | <0.1 | <0.1 | ||||||||||||||||
| Anions, mg/dm3 | CO3− | <8.0 | <8.0 | <8.0 | <8.0 | <8.0 | |||||||||||||||
| HCO3− | 134.2 | 384.4 | 289.8 | 173.9 | 167.8 | ||||||||||||||||
| Cl− | 160 | 366 | 107 | 51 | 75 | ||||||||||||||||
| SO42− | 1044.00 | 1580.00 | 1397.00 | 227 | 428 | ||||||||||||||||
| NO3− | <0.2 | <0.2 | 24 | 13 | 10 | ||||||||||||||||
| NO2− | <0.01 | <0.01 | <0.01 | <0.01 | <0.01 | ||||||||||||||||
| F, mg/dm3 | 1.5 | 3 | 0.5 | 1.2 | 0.7 | ||||||||||||||||
| Mineralization, mg/dm3 | 1860.00 | 3446.00 | 2490.00 | 666 | 973 | ||||||||||||||||
| Hardness | total | 16.4 | 11.6 | 28.2 | 5.8 | 9.5 | |||||||||||||||
| carbonates | 2.2 | 6.3 | 4.8 | 2.9 | 2.8 | ||||||||||||||||
| SiO2 | 5.6 | 6.3 | 8 | 8 | 9.1 | ||||||||||||||||
| Petroleum products, mg/dm3 | - | - | 0.007 | - | 0.006 | ||||||||||||||||
| Cd, mg/dm3 | - | - | - | - | - | ||||||||||||||||
| Pb, mg/dm3 | - | - | - | 0.018 | - | ||||||||||||||||
| Cu, mg/dm3 | 0.032 | 0.034 | 0.035 | 0.015 | 0.021 | ||||||||||||||||
| Zn, mg/dm3 | 0.0063 | 0.0061 | 0.01 | 0.0049 | 0.0052 | ||||||||||||||||
| Sampling Location | Boreholes Bakanas 1 | Boreholes Bakanas 2 | Drinking Water Standards | ||||||||||||||||||
| Date of sampling | 11.10.2024 | 11.10.2024 | Kazakhstan | WHO | |||||||||||||||||
| The coordinates of sampling points | 44°53′45.71″ N 76°32′36.92″ E | 44°58′6.10″ N 76°29′26.51″ E | - | - | |||||||||||||||||
| pH | 7.6 | 7.6 | 6.0–9.0 | 6.2–8.5 | |||||||||||||||||
| Dry residue, mg/dm3 | 1026.00 | 827 | - | ||||||||||||||||||
| Cations, mg/dm3 | Na | 219.8 | 154 | 200 | 200 | ||||||||||||||||
| K | 8.6 | 5.6 | - | ||||||||||||||||||
| Ca2+ | 78.1 | 72.1 | - | 200 | |||||||||||||||||
| Mg2+ | 53.5 | 56.5 | - | 50 | |||||||||||||||||
| NH4+ | <0.05 | <0.05 | 2.0 | 0.50 | |||||||||||||||||
| Fe sum | <0.1 | <0.1 | 0.3 | 0.3 | |||||||||||||||||
| Anions, mg/dm3 | CO3− | <8.0 | <8.0 | - | |||||||||||||||||
| HCO3− | 207.5 | 280.7 | - | ||||||||||||||||||
| Cl− | 101 | 105 | 350 | 250 | |||||||||||||||||
| SO42− | 509 | 312 | 500 | 250 | |||||||||||||||||
| NO3− | 45 | 50 | 45 | 50 | |||||||||||||||||
| NO2− | <0.01 | <0.01 | 3.0 | 0.50 | |||||||||||||||||
| F, mg/dm3 | 1 | 1 | 1.5 | 1.5 | |||||||||||||||||
| Mineralization, mg/dm3 | 1232.00 | 1044.00 | 1000.00 | ||||||||||||||||||
| Hardness, moll | total | 8.3 | 8.3 | 7.0 | |||||||||||||||||
| carbonates | 3.4 | 4.6 | |||||||||||||||||||
| SiO2 | 8.1 | 7.4 | 10 | ||||||||||||||||||
| Petroleum products, mg/dm3 | - | - | 0.10 | ||||||||||||||||||
| Cd, mg/dm3 | - | - | 0.001 | - | |||||||||||||||||
| Pb, mg/dm3 | - | - | 0.03 | 0.01 | |||||||||||||||||
| Cu, mg/dm3 | 0.019 | 0.02 | 1.0 | 1.0 | |||||||||||||||||
| Zn, mg/dm3 | 0.008 | 0.0066 | 5.0 | 5.0 | |||||||||||||||||
| Sampling Location | Boreholes in Kyzylagash 3 | Boreholes in Kyzylagash 1 | Boreholes in Usharal 3 | Boreholes in Usharal 2 | Boreholes in Usharal 1 | Well in Kyzylagash 2 | |||||||||||||||
|---|---|---|---|---|---|---|---|---|---|---|---|---|---|---|---|---|---|---|---|---|---|
| Date of sampling | 12.10.2024 | 12.10.2024 | 12.10.2024 | 12.10.2024 | 12.10.2024 | 12.10.2024 | |||||||||||||||
| The coordinates of sampling points | 45°22′58.50″ N 78°33′33.40″ E | 45°19′24.86″ N 78°35′29.68″ E | 45°27′16.51″ N 78° 1′31.75″ E | 45°30′42.53″ N 78° 3′52.30″ E | 45°31′56.10″ N 78° 0′30.01″ E | 45°24′2.51″ N 78°36′7.19″ E | |||||||||||||||
| pH | 7.9 | 7.8 | 7.7 | 7.6 | 7.7 | 7.8 | |||||||||||||||
| Dry residue, mg/dm3 | 466 | 513 | 1790.00 | 1198.00 | 496 | 390 | |||||||||||||||
| Cations, mg/dm3 | Na | 95.8 | 98.4 | 521 | 293 | 90.2 | 63 | ||||||||||||||
| K | 1.3 | 3.6 | 5.4 | 2.3 | 2.2 | 2.1 | |||||||||||||||
| Ca2+ | 46 | 66.1 | 88.1 | 92.1 | 58.1 | 58.1 | |||||||||||||||
| Mg2+ | 19.5 | 30.4 | 68.1 | 40.1 | 29.8 | 25.5 | |||||||||||||||
| NH4+ | <0.05 | <0.05 | 3.2 | <0.05 | <0.05 | <0.05 | |||||||||||||||
| Fe sum | <0.1 | <0.1 | <0.1 | <0.1 | <0.1 | <0.1 | |||||||||||||||
| Anions, mg/dm3 | CO3− | <8.0 | <8.0 | <8.0 | <8.0 | <8.0 | <8.0 | ||||||||||||||
| HCO3− | 204.4 | 347.8 | 405.8 | 363.1 | 213.6 | 262.4 | |||||||||||||||
| Cl− | 17 | 34 | 179 | 98 | 51 | 16 | |||||||||||||||
| SO42− | 165 | 150 | 829 | 555 | 174 | 113 | |||||||||||||||
| NO3− | 17 | <0.2 | 30 | 35 | 25 | 5 | |||||||||||||||
| NO2− | <0.01 | <0.01 | <0.01 | <0.01 | <0.01 | <0.01 | |||||||||||||||
| F, mg/dm3 | 2.6 | 1.7 | 5.7 | 5 | 2 | 0.9 | |||||||||||||||
| Mineralization, mg/dm3 | 576 | 738 | 2143.00 | 1490.00 | 652 | 551 | |||||||||||||||
| Hardness | total | 3.9 | 5.8 | 10 | 7.9 | 5.4 | 5 | ||||||||||||||
| carbonates | 3.4 | 5.7 | 6.7 | 6 | 3.5 | 4.3 | |||||||||||||||
| SiO2 | 7.2 | 5.6 | 7.6 | 6.4 | 6.6 | 4.9 | |||||||||||||||
| Petroleum products, mg/dm3 | - | 0.013 | - | - | 0.018 | - | |||||||||||||||
| Cd, mg/dm3 | - | - | - | - | - | - | |||||||||||||||
| Pb, mg/dm3 | 0.015 | 0.017 | - | - | 0.018 | 0.016 | |||||||||||||||
| Cu, mg/dm3 | 0.012 | 0.01 | 0.025 | 0.021 | 0.014 | 0.01 | |||||||||||||||
| Zn, mg/dm3 | 0.0036 | 0.003 | 0.0066 | 0.0045 | 0.0059 | 0.003 | |||||||||||||||
| Sampling Location | Well in Usharal 4 | Boreholes in Lepsy 1 | Boreholes in Lepsy 2 | Boreholes in Lepsy 3 | Boreholes in Lepsy 4 | Well Kyzyltu 1 | Well Kyzyltu 2 | ||||||||||||||
| Date of sampling | 12.10.2024 | 13.10.2024 | 13.10.2024 | 13.10.2024 | 13.10.2024 | 14.10.2024 | 14.10.2024 | ||||||||||||||
| The coordinates of sampling points | 45°30′24.12″ N 78° 5′56.96″ E | 45°58′34.62″ N 78°49′9.94″ E | 46° 9′35.56″ N 78°56′42.84″ E | 46° 6′53.18″ N 78°56′34.95″ E | 46° 7′5.60″ N 78°54′57.78″ E | 45°32′16.97″ N 79°15′48.45″ E | 45°31′50.11″ N 79°16′26.58″ E | ||||||||||||||
| pH | 8.1 | 7.9 | 8 | 8 | 8 | 8.1 | 8 | ||||||||||||||
| Dry residue, mg/dm3 | 225 | 498 | 618 | 895 | 625 | 139 | 279 | ||||||||||||||
| Cations, mg/dm3 | Na | 16.1 | 49.2 | 100.7 | 181.8 | 114.8 | 17.9 | 98.4 | |||||||||||||
| K | 0.6 | 12.3 | 10.5 | 19.3 | 9 | 1.6 | 1.1 | ||||||||||||||
| Ca2+ | 24 | 28 | 45 | 56.1 | 34 | 24 | 12 | ||||||||||||||
| Mg2+ | 29.2 | 59.6 | 69.9 | 93 | 76.6 | 8.5 | 1.2 | ||||||||||||||
| NH4+ | <0.05 | <0.05 | 0.3 | 1.5 | <0.05 | <0.05 | <0.05 | ||||||||||||||
| Fe sum | <0.1 | <0.1 | <0.1 | <0.1 | <0.1 | <0.1 | <0.1 | ||||||||||||||
| Anions, mg/dm3 | CO3− | <8.0 | <8.0 | <8.0 | <8.0 | <8.0 | <8.0 | <8.0 | |||||||||||||
| HCO3− | 109.8 | 353.9 | 445.4 | 610.2 | 421 | 109.8 | 122 | ||||||||||||||
| Cl− | 35 | 16 | 24 | 61 | 60 | 5 | 25 | ||||||||||||||
| SO42− | 57 | 63 | 164 | 230 | 161 | 28 | 89 | ||||||||||||||
| NO3− | <0.2 | 42 | 27 | 22 | 18 | 5 | 2 | ||||||||||||||
| NO2− | <0.01 | <0.01 | <0.01 | <0.01 | <0.01 | <0.01 | <0.01 | ||||||||||||||
| F, mg/dm3 | 0.3 | 2.6 | 5.8 | 4.2 | - | 0.6 | 1.7 | ||||||||||||||
| Mineralization, mg/dm3 | 282 | 633 | 899 | 1285.00 | 900 | 207 | 360 | ||||||||||||||
| Hardness | total | 3.6 | 6.3 | 8 | 10.5 | 8 | 1.9 | 0.7 | |||||||||||||
| carbonates | 1.8 | 5.8 | 7.3 | 10 | 6.9 | 1.8 | 0.7 | ||||||||||||||
| SiO2 | 2 | 5.9 | 5.9 | 6.3 | 6 | 6.1 | 8 | ||||||||||||||
| Petroleum products, mg/dm3 | 0.015 | 0.005 | - | 0.013 | - | - | - | ||||||||||||||
| Cd, mg/dm3 | 0.0008 | - | - | - | - | 0.0007 | 0.0009 | ||||||||||||||
| Pb, mg/dm3 | 0.015 | 0.017 | - | - | - | 0.013 | 0.01 | ||||||||||||||
| Cu, mg/dm3 | 0.0049 | 0.009 | 0.015 | 0.019 | 0.014 | 0.0035 | - | ||||||||||||||
| Zn, mg/dm3 | 0.0025 | 0.0052 | 0.02 | 0.0064 | 0.0054 | 0.0018 | 0.0017 | ||||||||||||||
| Sampling Location | Well Kopa 1 | Well Kopa 2 | Well Zhanalyk | Well Aksu | Well Onim 1 | Well Onim 2 | Boreholes Koilyk 1 | ||||||||||||||
| Date of sampling | 14.10.2024 | 14.10.2024 | 15.10.2024 | 15.10.2024 | 15.10.2024 | 15.10.2024 | 16.10.2024 | ||||||||||||||
| The coordinates of sampling points | 45°31′16.57″ N 79°11′12.58″ E | 45°34′25.87″ N 79° 9′41.06″ E | 45°41′37.79″ N 79°32′55.54″ E | 45°38′18.88″ N 79°26′6.89″ E | 45°35′55.35″ N 79°23′41.43″ E | 45°36′42.88″ N 79°21′50.48″ E | 45°52′16.10″ N 80°20′35.65″ E | ||||||||||||||
| pH | 8.3 | 8.2 | 8.3 | 8.2 | 8.1 | 8.2 | 7.7 | ||||||||||||||
| Dry residue, mg/dm3 | 125 | 134 | 127 | 115 | 107 | 109 | 252 | ||||||||||||||
| Cations. mg/dm3 | Na | 17.9 | 24.9 | 24.9 | 19.7 | 9.4 | 14.5 | 7.7 | |||||||||||||
| K | 1.5 | 1.2 | 1.5 | 1.4 | 1.5 | 1.4 | 6.9 | ||||||||||||||
| Ca2+ | 20 | 16 | 14 | 23 | 20 | 17 | 68.1 | ||||||||||||||
| Mg2+ | 9.1 | 10.9 | 4.9 | 3 | 8.5 | 7.9 | 8.5 | ||||||||||||||
| NH4+ | <0.05 | <0.05 | <0.05 | <0.05 | <0.05 | <0.05 | 9.6 | ||||||||||||||
| Fe sum | <0.1 | <0.1 | <0.1 | <0.1 | <0.1 | <0.1 | <0.1 | ||||||||||||||
| Anions, mg/dm3 | CO3− | <8.0 | <8.0 | <8.0 | <8.0 | <8.0 | <8.0 | <8.0 | |||||||||||||
| HCO3− | 109.8 | 115.9 | 97.6 | 97.6 | 103.7 | 103.7 | 289.8 | ||||||||||||||
| Cl− | 5 | 5 | 3 | 4 | 2 | 3 | 3 | ||||||||||||||
| SO42− | 19 | 23 | 16 | 14 | 8 | 9 | 3 | ||||||||||||||
| NO3− | 2 | 2 | 3 | 3 | 3 | 5 | 2 | ||||||||||||||
| NO2− | <0.01 | <0.01 | <0.01 | <0.01 | <0.01 | <0.01 | <0.01 | ||||||||||||||
| F, mg/dm3 | 0.8 | 0.9 | 1.4 | 1.5 | 1.5 | 1.4 | 1.6 | ||||||||||||||
| Mineralization, mg/dm3 | 191 | 206 | 173 | 173 | 163 | 169 | 408 | ||||||||||||||
| Hardness | total | 1.8 | 1.7 | 1.1 | 1.4 | 1.7 | 1.5 | 4.1 | |||||||||||||
| carbonates | 1.8 | 1.7 | 1.1 | 1.4 | 1.7 | 1.5 | 4.1 | ||||||||||||||
| SiO2 | 6 | 5.8 | 6.4 | 5.9 | 5.6 | 5.8 | 8.1 | ||||||||||||||
| Petroleum products, mg/dm3 | 0.005 | - | - | - | - | - | 0.071 | ||||||||||||||
| Cd, mg/dm3 | - | 0.0009 | 0.0007 | 0.0009 | 0.0008 | 0.0009 | 0.001 | ||||||||||||||
| Pb, mg/dm3 | 0.014 | 0.012 | 0.01 | 0.012 | 0.012 | 0.012 | 0.018 | ||||||||||||||
| Cu, mg/dm3 | 0.0055 | 0.0008 | - | - | 0.001 | 0.0002 | 0.012 | ||||||||||||||
| Zn, mg/dm3 | 0.0023 | 0.0018 | 0.0018 | 0.0019 | 0.003 | 0.0014 | 0.0033 | ||||||||||||||
| Sampling Location | Boreholes Koilyk 2 | Well Koilyk 3 | Well Koilyk 4 | Drinking Water Standards | |||||||||||||||||
| Date of sampling | 16.10.2024 | 16.10.2024 | 16.10.2024 | Kazakhstan | WHO | ||||||||||||||||
| The coordinates of sampling points | 45°54′38.24″ N 80°17′35.48″ E | 46° 0′57.02″ N 80° 3′50.62″ E | 46° 1′45.04″ N 80° 2′59.56″ E | ||||||||||||||||||
| pH | 7.9 | 8.1 | 8.1 | 6.0–9.0 | 6.2–8.5 | ||||||||||||||||
| Dry residue, mg/dm3 | 1666.00 | 299 | 395 | - | |||||||||||||||||
| Cations, mg/dm3 | Na | 203.8 | 69.1 | 125.6 | 200 | 200 | |||||||||||||||
| K | 12.8 | 2.8 | 0.6 | ||||||||||||||||||
| Ca2+ | 140.1 | 24 | 28 | 200 | 200 | ||||||||||||||||
| Mg2+ | 198.2 | 9.7 | 8.5 | 50 | 50 | ||||||||||||||||
| NH4+ | <0.05 | <0.05 | <0.05 | 0.50 | 0.50 | ||||||||||||||||
| Fe sum | <0.1 | <0.1 | <0.1 | 0.3 | 0.3 | ||||||||||||||||
| Anions, mg/dm3 | CO3− | <8.0 | <8.0 | <8.0 | |||||||||||||||||
| HCO3− | 619.3 | 109.8 | 256.3 | ||||||||||||||||||
| Cl− | 266 | 34 | 19 | 250 | 250 | ||||||||||||||||
| SO42− | 374 | 126 | 102 | 250 | 250 | ||||||||||||||||
| NO3− | 275 | <0.2 | 10 | 50 | 50 | ||||||||||||||||
| NO2− | 22 | <0.01 | <0.01 | 0.50 | 0.50 | ||||||||||||||||
| F, mg/dm3 | 2.4 | 0.5 | 1.5 | 1.5 | 1.5 | ||||||||||||||||
| Mineralization, mg/dm3 | 2119.00 | 379 | 559 | 1000.00 | |||||||||||||||||
| Hardness | total | 23.3 | 2 | 2.1 | |||||||||||||||||
| carbonates | 10.2 | 1.8 | 2.1 | ||||||||||||||||||
| SiO2 | 4.9 | 3.2 | 7.4 | 10 | |||||||||||||||||
| Petroleum products. mg/dm3 | - | 0.072 | - | 0.10 | |||||||||||||||||
| Cd, mg/dm3 | - | 0.0009 | 0.0009 | 0.001 | - | ||||||||||||||||
| Pb, mg/dm3 | - | 0.013 | 0.014 | 0.03 | 0.01 | ||||||||||||||||
| Cu, mg/dm3 | 0.035 | 0.0032 | 0.0043 | 1.0 | 1.0 | ||||||||||||||||
| Zn, mg/dm3 | 0.0085 | 0.0018 | 0.0021 | 5.0 | 5.0 | ||||||||||||||||
References
- Amparo-Salcedo, M.; Pérez-Gimeno, A.; Navarro-Pedreño, J. Water Security Under Climate Change: Challenges and Solutions Across 43 Countries. Water 2025, 17, 633. [Google Scholar] [CrossRef]
- Zhou, J.-R.; Li, X.-Q.; Yu, X.; Zhao, T.-C.; Ruan, W.-X. Exploring the Ecological Security Evaluation of Water Resources in the Yangtze River Basin under the Background of Ecological Sustainable Development. Sci. Rep. 2024, 14, 15475. [Google Scholar] [CrossRef] [PubMed]
- Wolkeba, F.T.; Mekonnen, M.M.; Brauman, K.A.; Kumar, M. Indicator Metrics and Temporal Aggregations Introduce Ambiguities in Water Scarcity Estimates. Sci. Rep. 2024, 14, 15182. [Google Scholar] [CrossRef]
- Kirby, M.; Mainuddin, M. The Impact of Climate Change, Population Growth and Development on Sustainable Water Security in Bangladesh to 2100. Sci. Rep. 2022, 12, 22344. [Google Scholar] [CrossRef]
- Wang, Z.; Xue, Z.; Zhang, X.; Yan, H.; Liu, G. Adaptive Capacity to Climate Change in Pastoral Areas. Sustainability 2025, 17, 1337. [Google Scholar] [CrossRef]
- Yao, J.; Liu, H.; Huang, J.; Gao, Z.; Wang, G.; Li, D.; Yu, H.; Chen, X. Accelerated Dryland Expansion Regulates Future Variability in Dryland Gross Primary Production. Nat. Commun. 2020, 11, 1665. [Google Scholar] [CrossRef]
- Reynolds, J.F.; Smith, D.M.S.; Lambin, E.F.; Turner, B.L.; Mortimore, M.; Batterbury, S.P.J.; Downing, T.E.; Dowlatabadi, H.; Fernández, R.J.; Herrick, J.E.; et al. Global Desertification: Building a Science for Dryland Development. Science 2007, 316, 847–851. [Google Scholar] [CrossRef]
- The United Nations World Water Development Report 2022: Groundwater: Making the Invisible Visible. UNESCO. Available online: https:/www.unesco.org/reports/wwdr/2022/en (accessed on 24 April 2025).
- Gleeson, T.; Befus, K.M.; Jasechko, S.; Luijendijk, E.; Cardenas, M.B. The Global Volume and Distribution of Modern Groundwater. Nat. Geosci. 2016, 9, 161–167. [Google Scholar] [CrossRef]
- Zhong, Y.; Tian, B.; Kim, H.; Yuan, X.; Liu, X.; Zhu, E.; Wu, Y.; Wang, L.; Wang, L. Over 60% Precipitation Transformed into Terrestrial Water Storage in Global River Basins from 2002 to 2021. Commun. Earth Environ. 2025, 6, 53. [Google Scholar] [CrossRef]
- sekar, A.; Valliammai, A.; Nagarajan, M.; Sivakumar, S.D.; Baskar, M.; Sujitha, E. Conjunctive Use in Water Resource Management: Current Trends and Future Directions. Water Supply 2024, 24, 3881–3904. [Google Scholar] [CrossRef]
- Xie, J.; Liu, X.; Jasechko, S.; Berghuijs, W.R.; Wang, K.; Liu, C.; Reichstein, M.; Jung, M.; Koirala, S. Majority of Global River Flow Sustained by Groundwater. Nat. Geosci. 2024, 17, 770–777. [Google Scholar] [CrossRef]
- Sherwood Lollar, B.; Warr, O.; Higgins, P.M. The Hidden Hydrogeosphere: The Contribution of Deep Groundwater to the Planetary Water Cycle. Annu. Rev. Earth Planet. Sci. 2024, 52, 443–466. [Google Scholar] [CrossRef]
- Wada, Y.; van Beek, L.P.H.; Bierkens, M.F.P. Nonsustainable Groundwater Sustaining Irrigation: A Global Assessment. Water Resour. Res. 2012, 48. [Google Scholar] [CrossRef]
- Famiglietti, J.S. The Global Groundwater Crisis. Nat. Clim. Change 2014, 4, 945–948. [Google Scholar] [CrossRef]
- Siebert, S.; Burke, J.; Faures, J.M.; Frenken, K.; Hoogeveen, J.; Döll, P.; Portmann, F.T. Groundwater Use for Irrigation—A Global Inventory. Hydrol. Earth Syst. Sci. 2010, 14, 1863–1880. [Google Scholar] [CrossRef]
- Mukherjee, A.; Saha, D.; Harvey, C.F.; Taylor, R.G.; Ahmed, K.M.; Bhanja, S.N. Groundwater Systems of the Indian Sub-Continent. J. Hydrol. Reg. Stud. 2015, 4, 1–14. [Google Scholar] [CrossRef]
- Shah, T.; Roy, A.D.; Qureshi, A.S.; Wang, J. Sustaining Asia’s Groundwater Boom: An Overview of Issues and Evidence. In Natural Resources Forum; Blackwell Publishing Ltd.: Oxford, UK, 2003; Volume 27, pp. 130–141. [Google Scholar] [CrossRef]
- Villholth, K.G. Groundwater Irrigation for Smallholders in Sub-Saharan Africa—A Synthesis of Current Knowledge to Guide Sustainable Outcomes. Water Int. 2013, 38, 369–391. [Google Scholar] [CrossRef]
- Ding, K.; Zhao, X.; Cheng, J.; Yu, Y.; Luo, Y.; Couchot, J.; Zheng, K.; Lin, Y.; Wang, Y. GRACE/ML-Based Analysis of the Spatiotemporal Variations of Groundwater Storage in Africa. J. Hydrol. 2025, 647, 132336. [Google Scholar] [CrossRef]
- Pazola, A.; Shamsudduha, M.; French, J.; MacDonald, A.M.; Abiye, T.; Goni, I.B.; Taylor, R.G. High-Resolution Long-Term Average Groundwater Recharge in Africa Estimated Using Random Forest Regression and Residual Interpolation. Hydrol. Earth Syst. Sci. 2024, 28, 2949–2967. [Google Scholar] [CrossRef]
- Bellwood-Howard, I.; Thompson, J.; Shamsudduha, M.; Taylor, R.G.; Mosha, D.B.; Gebrezgi, G.; Tarimo, A.K.P.R.; Kashaigili, J.J.; Nazoumou, Y.; Tiékoura, O. A Multicriteria Analysis of Groundwater Development Pathways in Three River Basins in Sub-Saharan Africa. Environ. Sci. Policy 2022, 138, 26–43. [Google Scholar] [CrossRef]
- Milewski, A.; Lezzaik, K.; Rotz, R. Sensitivity Analysis of the Groundwater Risk Index in the Middle East and North Africa Region. Environ. Process. 2020, 7, 53–71. [Google Scholar] [CrossRef]
- Margat, J.; van der Gun, J. Groundwater around the World; CRC Press: Sacramento, CA, USA, 2013; ISBN 9780203772140. [Google Scholar]
- Döll, P.; Müller Schmied, H.; Schuh, C.; Portmann, F.T.; Eicker, A. Global-scale Assessment of Groundwater Depletion and Related Groundwater Abstractions: Combining Hydrological Modeling with Information from Well Observations and GRACE Satellites. Water Resour. Res. 2014, 50, 5698–5720. [Google Scholar] [CrossRef]
- Spaeth, K.E.; Weltz, M.A.; Nesbit, J.; Qi, J.; Rutherford, W.A.; Williams, C.J.; Toledo, D.; Newingham, B.A.; Iskakova, G.; Kussainova, M.; et al. Rangeland Resource Assessment in the Aqmola Region of Kazakhstan. Rangel. Ecol. Manag. 2025, 98, 389–398. [Google Scholar] [CrossRef]
- Bissenbayeva, S.; Salmurzauly, R.; Tokbergenova, A.; Zhengissova, N.; Xing, J. Assessment of Degraded Lands in the Ile-Balkhash Region, Kazakhstan. Front. Earth Sci. 2025, 12, 1453994. [Google Scholar] [CrossRef]
- Kolluru, V.; John, R.; Saraf, S.; Chen, J.; Hankerson, B.; Robinson, S.; Kussainova, M.; Jain, K. Gridded Livestock Density Database and Spatial Trends for Kazakhstan. Sci. Data 2023, 10, 839. [Google Scholar] [CrossRef] [PubMed]
- Baranowski, E.; Thevs, N.; Khalil, A.; Baibagyssov, A.; Iklassov, M.; Salmurzauli, R.; Nurtazin, S.; Beckmann, V. Pastoral Farming in the Ili Delta, Kazakhstan, under Decreasing Water Inflow: An Economic Assessment. Agriculture 2020, 10, 281. [Google Scholar] [CrossRef]
- Kamp, J.; Urazaliev, R.; Balmford, A.; Donald, P.F.; Green, R.E.; Lamb, A.J.; Phalan, B. Agricultural Development and the Conservation of Avian Biodiversity on the Eurasian Steppes: A Comparison of Land-sparing and Land-sharing Approaches. J. Appl. Ecol. 2015, 52, 1578–1587. [Google Scholar] [CrossRef]
- Ferret, C. Mobile Pastoralism a Century Apart: Continuity and Change in South-Eastern Kazakhstan, 1910 and 2012. Central Asian Surv. 2018, 37, 503–525. [Google Scholar] [CrossRef]
- Robinson, S.; Petrick, M. Land Access and Feeding Strategies in Post-Soviet Livestock Husbandry: Evidence from a Rangeland System in Kazakhstan. Agric. Syst. 2024, 219, 104011. [Google Scholar] [CrossRef]
- Robinson, S.; Milner-Gulland, E.; Alimaev, I. Rangeland Degradation in Kazakhstan during the Soviet Era: Re-Examining the Evidence. J. Arid. Environ. 2003, 53, 419–439. [Google Scholar] [CrossRef]
- Adenova, D.; Tazhiyev, S.; Sagin, J.; Absametov, M.; Murtazin, Y.; Trushel, L.; Miroshnichenko, O.; Zaryab, A. Groundwater Quality and Potential Health Risk in Zhambyl Region, Kazakhstan. Water 2023, 15, 482. [Google Scholar] [CrossRef]
- GOST 26449.1-85; Stationary Distillation Desalting Units. Methods of Saline Water Chemical Analysis. USSR National Committee on Standards: Moscow, Russia, 1985.
- ST RK 1015-2000; WATER Gravimetric Method for Determination of Sulfate Content in Natural and Waste Waters. Committee for Standardization, Metrology and Certification of the Ministry of Energy, Industry and Trade of the Republic of Kazakhstan (Gosstandart): Astana, Republic of Kazakhstan, 2000.
- GOST 33045-2014; WATER Methods for Determination of Nitrogen-Containing Substances. Standartinform: Moscow, Russia, 2014.
- ST RK ISO6332-2008; Water quality. Determination of Iron Content. Spectrometric Method Using 1,10-Phenanthroline. Committee for Standardization, Metrology and Certification of the Ministry of Energy, Industry and Trade of the Republic of Kazakhstan (Gosstandart): Astana, Republic of Kazakhstan, 2008.
- ST RK 2727-2015; Water Quality Method for Determination of Fluorides. Committee for Standardization, Metrology and Certification of the Ministry of Energy, Industry and Trade of the Republic of Kazakhstan (Gosstandart): Astana, Republic of Kazakhstan, 2015.
- ST RK ISO10523-2013; Water Quality. Determination of pH. Committee for Standardization, Metrology and Certification of the Ministry of Energy, Industry and Trade of the Republic of Kazakhstan (Gosstandart): Astana, Republic of Kazakhstan, 2013.
- GOST 23268.16-78; Drinking Medicinal, Medicinal-Table and Natural Table Mineral Water. Methods of Determination of Iodid-Ions. Methods of Saline Water Chemical Analysis. USSR National Committee on Standards: Moscow, Russia, 1978.
- The Concept of Development of the Agro-Industrial Complex of the Republic of Kazakhstan for 2021-2030. Resolution of the Government of the Republic of Kazakhstan Dated December 30, 2021 No. 960. Available online: https://adilet.zan.kz/rus/docs/P2100000960 (accessed on 24 April 2025).


| Component | Testing Methodologies | Component | Testing Methodologies |
|---|---|---|---|
| Sodium | GOST 26449.1-85, point 17.1 [35] | Carbonates | GOST 26449.1-85, point 7.1 |
| Potassium | GOST 26449.1-85, point 18.1 | Bicarbonates | GOST 26449.1-85, point 7.1 |
| Calcium | GOST 26449.1-85, point 11.1 | Chlorides | GOST 26449.1-85, point 9 |
| Magnesium | GOST 26449.1-85, point 12 | Sulfates | ST RK 1015-2000 [36] |
| Ammonium | GOST 33045-2014 [37] | Nitrates | GOST 33045-2014 |
| Iron (Fe2+) | ST RK ISO6332-2008 [38] | Nitrites | GOST 33045-2014 |
| Iron (Fe3+) | ST RK ISO6332-2008 | Fluorides | ST RK 2727-2015 [39] |
| pH | ST RK ISO10523-2013 [40] | Total hardness | GOST 26449.1-85, point 10 |
| Dry residue | GOST 26449.1-85 | SiO2 | GOST 26449.1-85, point 22 |
| Boron | Rules for the standardization and documentation of food product quality 14.1:2:4.36-95 | Iodides | GOST 23268.16-78 [41] |
| Cd, Pb, Cu, Zn, Petroleum products | Sanitary standards No 26 from 20.02.2023 | Bromides | GOST 23268.15-78 |
Disclaimer/Publisher’s Note: The statements, opinions and data contained in all publications are solely those of the individual author(s) and contributor(s) and not of MDPI and/or the editor(s). MDPI and/or the editor(s) disclaim responsibility for any injury to people or property resulting from any ideas, methods, instructions or products referred to in the content. |
© 2025 by the authors. Licensee MDPI, Basel, Switzerland. This article is an open access article distributed under the terms and conditions of the Creative Commons Attribution (CC BY) license (https://creativecommons.org/licenses/by/4.0/).
Share and Cite
Tazhiyev, S.; Murtazin, Y.; Sotnikov, Y.; Rakhimova, V.; Adenova, D.; Abdizhalel, M.; Yerezhep, D. Geoinformation and Analytical Support for the Development of Promising Aquifers for Pasture Water Supply in Southern Kazakhstan. Water 2025, 17, 1297. https://doi.org/10.3390/w17091297
Tazhiyev S, Murtazin Y, Sotnikov Y, Rakhimova V, Adenova D, Abdizhalel M, Yerezhep D. Geoinformation and Analytical Support for the Development of Promising Aquifers for Pasture Water Supply in Southern Kazakhstan. Water. 2025; 17(9):1297. https://doi.org/10.3390/w17091297
Chicago/Turabian StyleTazhiyev, Sultan, Yermek Murtazin, Yevgeniy Sotnikov, Valentina Rakhimova, Dinara Adenova, Makhabbat Abdizhalel, and Darkhan Yerezhep. 2025. "Geoinformation and Analytical Support for the Development of Promising Aquifers for Pasture Water Supply in Southern Kazakhstan" Water 17, no. 9: 1297. https://doi.org/10.3390/w17091297
APA StyleTazhiyev, S., Murtazin, Y., Sotnikov, Y., Rakhimova, V., Adenova, D., Abdizhalel, M., & Yerezhep, D. (2025). Geoinformation and Analytical Support for the Development of Promising Aquifers for Pasture Water Supply in Southern Kazakhstan. Water, 17(9), 1297. https://doi.org/10.3390/w17091297