Article

N-Doped Modified MoS2 for Piezoelectric–Photocatalytic Removal of Tetracycline: Simultaneous Improvement of Photocatalytic and Piezoelectric Properties

1
Key Laboratory of Urban Stormwater System and Water Environment, Ministry of Education, Beijing University of Civil Engineering and Architecture, Beijing 100044, China
2
College of Chemical Engineering, Beijing University of Chemical Technology, Beijing 100029, China
3
Shandong Province Research Institute of Coal Geology Planning and Exploration, Jinan 250104, China
4
Nanjing Institute of Environmental Sciences, Nanjing 210042, China
5
CAUPD (Beijing) Planning & Design Consultants Co., Ltd., Beijing 100044, China
*
Authors to whom correspondence should be addressed.
Water 2025, 17(9), 1296; https://doi.org/10.3390/w17091296
Submission received: 19 March 2025 / Revised: 23 April 2025 / Accepted: 23 April 2025 / Published: 26 April 2025
(This article belongs to the Section Urban Water Management)

Abstract

:
Piezoelectric and photocatalytic technologies use mechanical and light energy to decompose environmental contaminants, demonstrating a beneficial synergistic impact. This investigation employs a two-step hydrothermal-calcination technique to synthesize N-doped MoS2 photocatalytic materials. The ideal catalyst, N-MoS2-3, utilizing the synergistic effect of piezoelectric–photocatalysis processes, attained a TC degradation rate of 90.8% in 60 min. The kinetic constant (0.0374 min−1) is 1.75 times greater than the combined rates of single photocatalysis and piezoelectric catalysis, indicating a notable synergistic impact. The material has 80% degradation efficiency after five cycles, indicating its remarkable resilience. Mechanistic investigations reveal that nitrogen doping establishes an internal electric field by modulating the S-Mo-S charge distribution. Photogenerated electrons move to generate •O2, while holes accumulate internally. The ultrasound-induced piezoelectric polarization field interacts with the photogenerated electric field in reverse, thereby synergistically improving carrier separation efficiency and facilitating redox processes. This study emphasizes the viability of non-metal doping as a method for modifying the properties of two-dimensional materials, offering a novel approach to enhance the synergistic attributes of piezoelectric and photocatalytic processes. This technology possesses significant promise for environmental restoration through the utilization of solar and mechanical energy.

1. Introduction

Urbanization and population growth are increasing, resulting in greater discharge of antibiotics into the natural water environment via pharmaceutical wastewater [1,2,3]. Tetracycline antibiotics are widely utilized for the treatment of bacterial infections in both humans and animals, owing to their efficacy and cost-effectiveness [4,5,6,7]. Nonetheless, the residual tetracycline antibiotics present are non-biodegradable, persistent, and ecotoxic, making them threatening to life, health, and ecological equilibrium [8,9]. Consequently, it is essential to conduct quantitative analyses and eliminate antibiotic pollutants from natural aquatic ecosystems. Nonetheless, the total elimination of these antibiotics through conventional wastewater treatment facilities (WWTPs) continues to be a difficulty [10,11]. Consequently, there is an immediate necessity to devise effective and cost-efficient strategies for addressing TC contamination in aquatic ecosystems.
Although semiconductor photocatalysis is an effective method for addressing environmental pollution and energy shortages, its catalytic efficiency is significantly hindered by the rapid recombination of photogenerated electron–hole pairs [12]. Typically, a built-in electric field (BIEF) is formed by the spontaneous polarization of piezoelectric materials in response to external mechanical forces, regulating the transport direction of photogenerated carrier. In addition to solar energy, wind energy, tidal energy, acoustic energy, and other common mechanical force energy sources are classified as green energy [13]. The piezoelectric–photocatalytic synergistic system may efficiently integrate green mechanical energies with solar energy, hence offering a novel technical avenue for wastewater degradation [14,15].
As a two-dimensional material, molybdenum disulfide (MoS2) has garnered a lot of interest because of its exceptional catalytic activity, adjustable microstructure, and affordability [16,17]. MoS2 nanosheets consist of a layer of molybdenum atoms, which are connected to two layers of sulfur atoms through covalent bonds [18,19]. Under tensile stress, the molybdenum disulfide nanosheets with asymmetric centers generate a large piezoelectric potential and a large number of polarized charges, which can effectively degrade organic molecules [20,21,22]. Moreover, its narrow bandgap allows it to absorb visible light and generate electron–hole pairs when exposed to light. This unique structure and these excellent physicochemical properties have led to its widespread application in the field of catalysis. Nevertheless, the catalytic activity of MoS2 is still limited, and the surface migration of excited charges remains suboptimal, requiring further enhancement. Therefore, in order to improve its photocatalytic ability and piezoelectric properties, modification of MoS2 is necessary.
Non-metallic doping (e.g., sulfur, oxygen, phosphorus, nitrogen, etc.) can alter the band gap of MoS2 and is an effective way of improving carrier separation efficiency [23,24,25,26,27]. It demonstrates that non-metallic doping can influence the lattice structure and enhance the material’s piezoelectric coefficient (d33) [28,29,30,31]. Up to now, there have been fewer publications on the improvement of piezoelectric–catalytic performance through nitrogen doping. Consequently, it is scientifically important to examine the relation between nitrogen doping and piezoelectric–catalytic efficiency.
This study employs a two-step hydrothermal–calcination method to prepare N-doped MoS2 piezoelectric–photocatalytic materials, and enhances piezoelectric and photocatalytic functions through structural and electronic modulation. Under the conditions of piezoelectric–photocatalysis coupling, efficient tetracycline degradation was achieved (90.8% degradation within 60 min). Subsequently, material characterization confirmed the enhanced electron–hole separation and charge transfer properties in the N-MoS2-3 material. Mechanism analysis indicates that the synergistic effect arises from the built-in electric field induced by charge redistribution, which, together with the piezoelectric field, drives the separation of charge carriers. This work provides an effective solution for further developing piezoelectric–photocatalytic technology, promoting light-induced electron–hole separation, and simultaneously utilizing mechanical and light energy.

2. Experimental Section

2.1. Materials

All chemicals used were of analytical grade and employed without further purification (Supplementary Text S1).

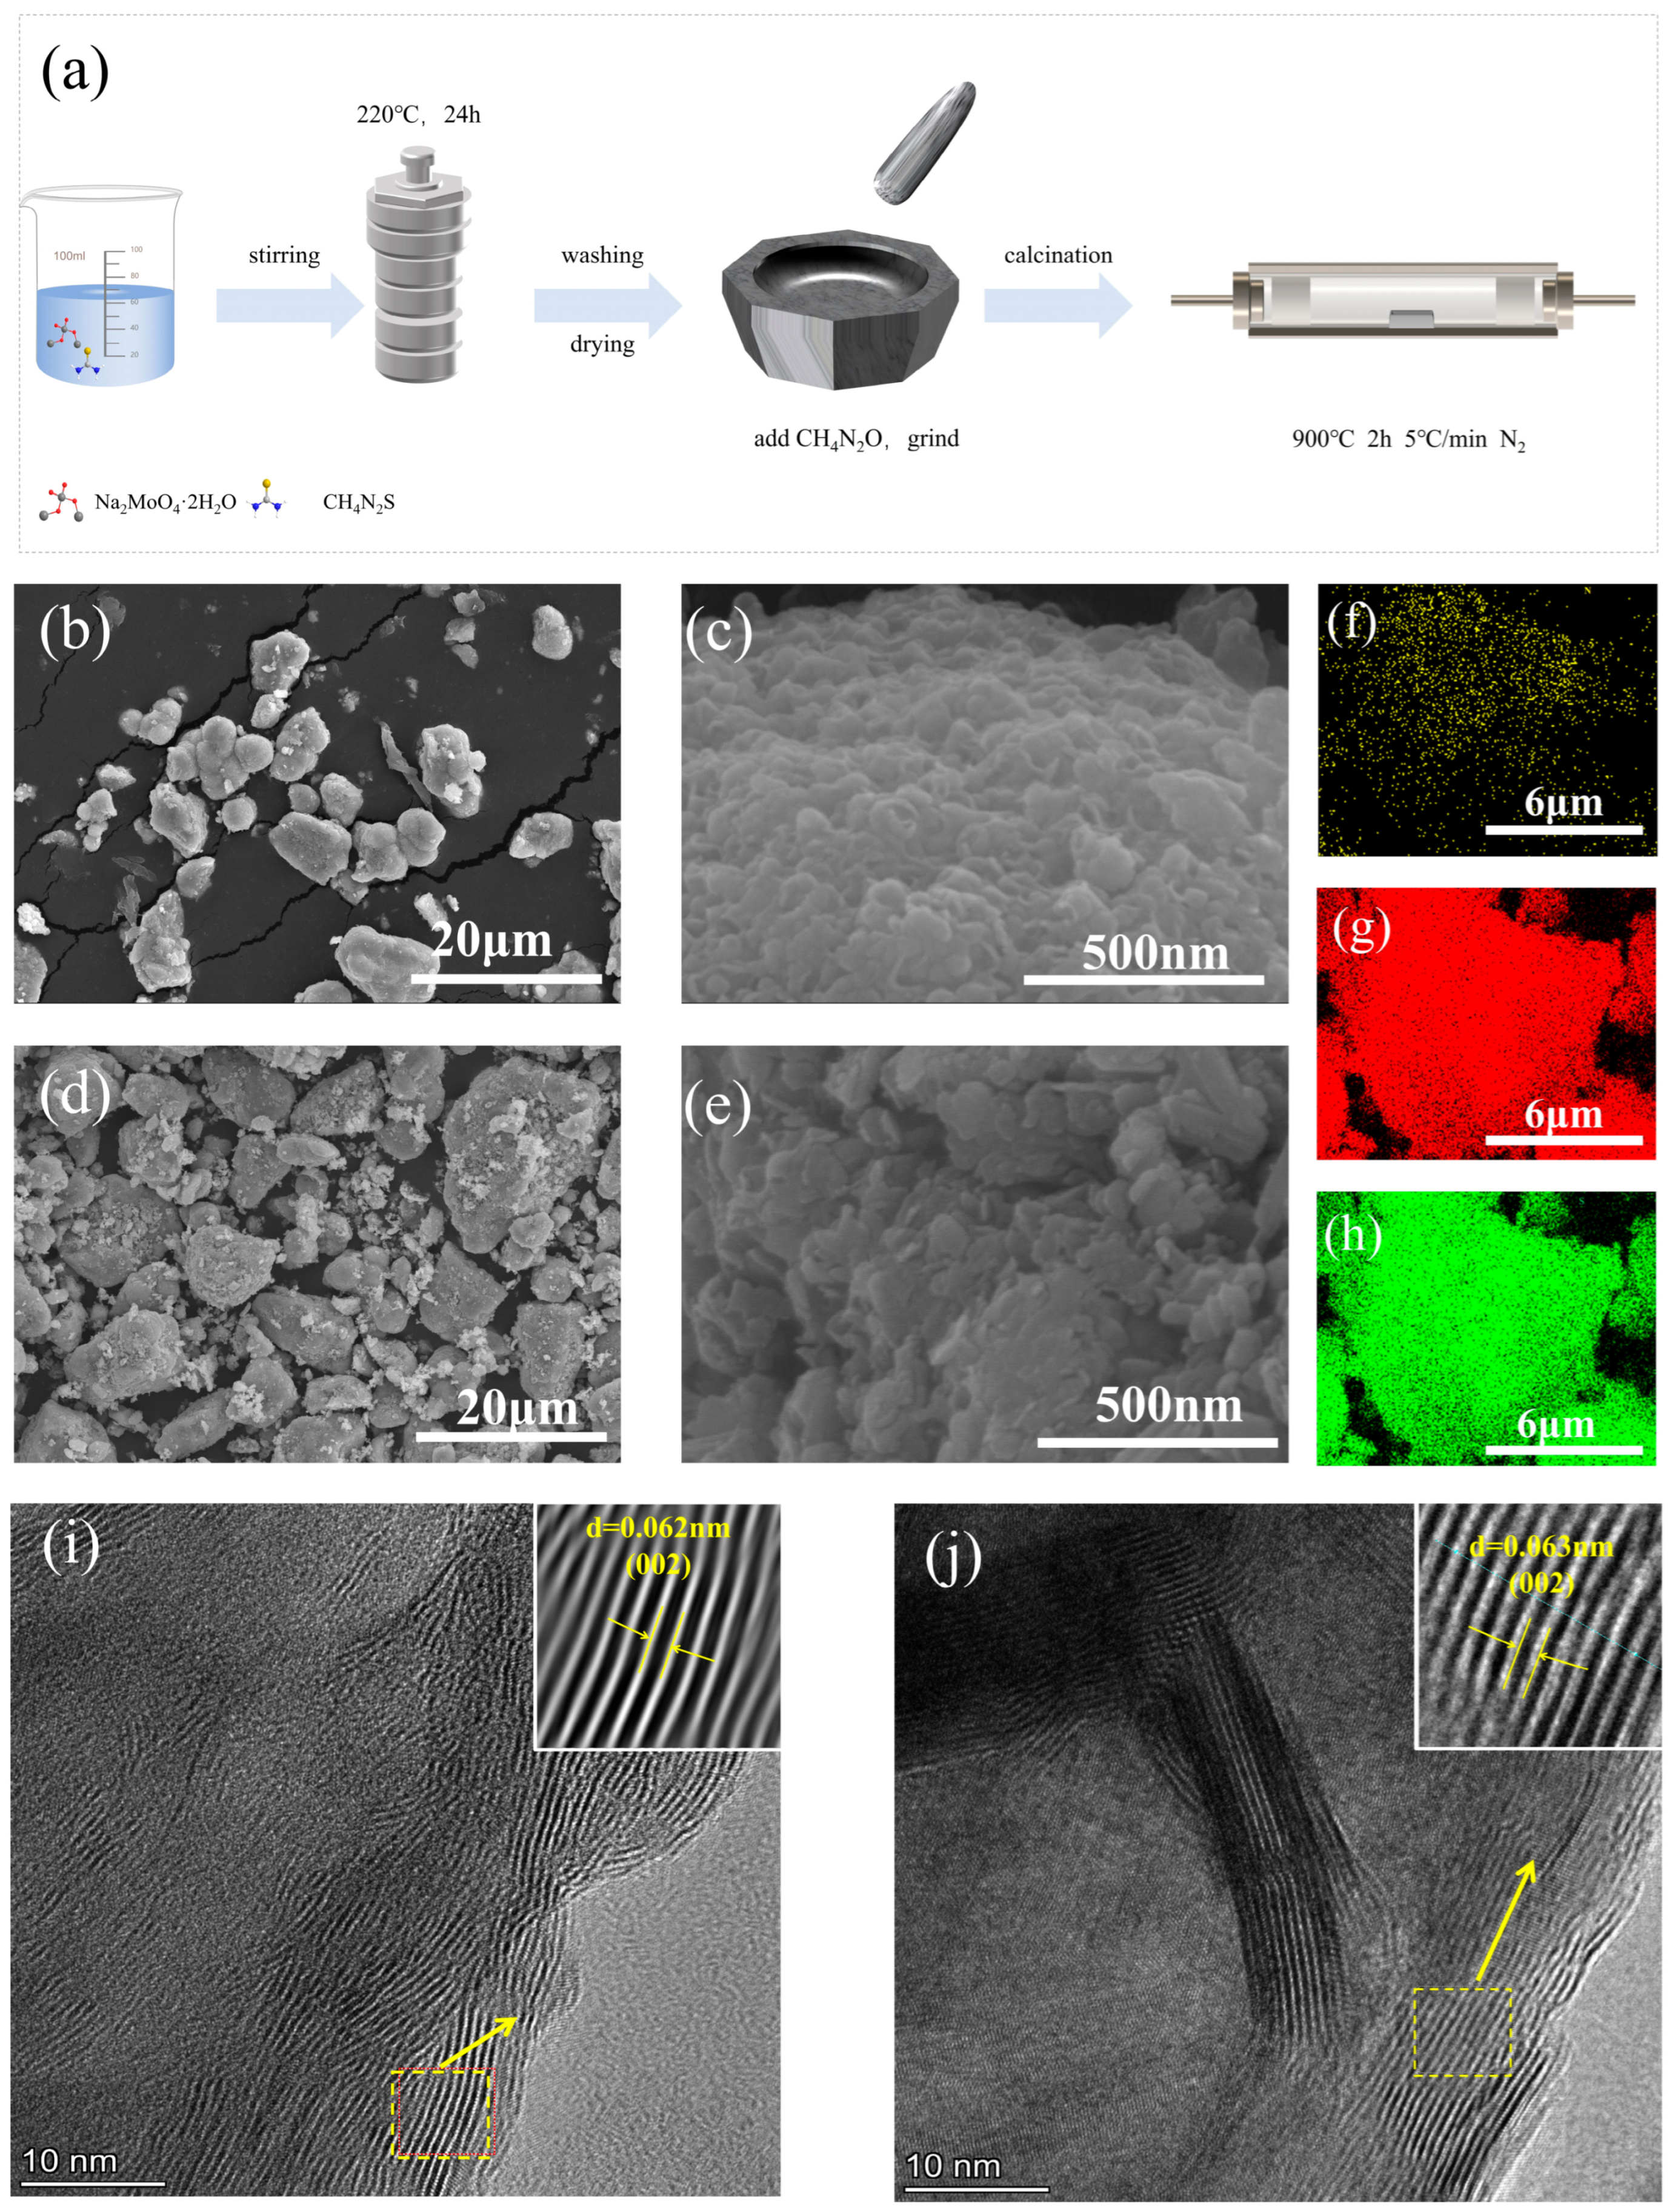
2.2. Synthesis of Piezo-Photocatalysts

MoS2 nanohybrid was prepared using a facile hydrothermal method. Initially, 1.2 g of Na2MoO4·2H2O and 0.76 g of CH4N2S were dissolved in 60 mL of 10% (w/w) ethanol solution under constant stirring for 30 min. The mixed solution was placed in a 100 mL Teflon autoclave and heated to 220 °C for 24 h. After cooling to ambient temperature, the black product was separated using centrifugation and then cleaned three times using anhydrous ethanol and deionized water. The obtained samples were dried under vacuum for 12 h at 80 °C.
Certain weights (0.2, 0.4, 1.2, and 2.0 g) of urea and 0.4 g of MoS2 samples were mixed well and loaded into a porcelain boat. Subsequently, the porcelain boat was placed in a tube furnace and annealed at 900 °C for 120 min in a nitrogen atmosphere. The hierarchical structures of N-doped MoS2 prepared with 0.2, 0.4, 1.2, and 2.0 g of urea were labeled as N-MoS2-0.5, N-MoS2-1, N-MoS2-3, and N-MoS2-5, respectively.

2.3. Characterization and Analysis Methods

The X-ray diffractometer (XRD, SmartLab SE, Tokyo, Japan) was used to examine the crystalline phase of MoS2 with varying N-doped concentrations. Raman spectroscopy was performed using a Horiba HR800 spectrometer(Horiba Scientific, Kyoto, Japan). An integrating sphere and a UV-Vis-NIR spectrophotometer (Shimadzu UV-3600 plus, Kyoto, Japan) were used to record the UV-Vis diffuse reflectance spectra (UV-Vis DRS). The morphology of the samples was examined using a field emission scanning electron microscope (S4800, Hitachi, Tokyo, Japan) and a field emission transmission electron microscope (TEM, FEI-Talos F200S, Hillsboro, OR, USA). X-ray photoelectron spectroscopy (XPS) was used to analyze the materials’ surface properties using a Thermofisher ESCALAB Xi+ device (Thermo Fisher Scientific, Waltham, MA, USA) and a single Al-Kα radiation source (6 mA, 12 kV). The PFM (piezoresponse force microscopy) and KPFM (Kelvin probe force microscopy) modules in an AFM (atomic force microscopy) test system (Bruker Dimension lcon, Billerica, MA, USA) were utilized to monitor the piezoelectric response of the synthesized samples. Electron paramagnetic resonance (EPR) spectroscopy was performed to detect free radical production using an Elexsys E560 system (Bruker, Billerica, MA, USA) with DMPO or TEMP as spin traps.
Additionally, the materials were subjected to photoelectrochemical studies utilizing an electrochemical workstation (PGSTAT204, Metrohm, Herisau, Switzerland). Details of the tests are shown in the Supplementary Text S2.

2.4. Evaluation of the Synergistic Degradation Performance

All experiments were performed in a 200 mL beaker. As the reaction system, 100 mL of reaction solution was used. The beakers were placed in an ultrasonic reactor (CR-070ST, Shenzhen, China) to provide periodic local mechanical strain with an ultrasonic frequency of 40 kHz and a set output power of 480 W. Typically, the degradation phase was preceded by an adsorption–desorption equilibrium phase, where 20 mg of piezoelectric photocatalyst was added to 10 mg/L TC solution for 30 min in the dark. The degradation phase was initiated under different conditions, including visible-light irradiation, ultrasonic action, and visible-light–ultrasonic action. Then, 2 mL portions of solution samples were taken at pre-arranged intervals and filtered through a 0.45 µm filter membrane. The residual concentration of TC was studied and analyzed by measuring the absorbance value of the solution at λmax = 357 nm using the UV spectrophotometer.
The degradation efficiency was calculated by Equation (1):
η ( % ) = ( 1 C t C 0 ) × 100
where C0 and Ct (mg/L) represent the initial concentration of TC and the concentration at a specific time, respectively.
To evaluate the stability and reusability of the catalyst, the catalyst after the catalytic degradation of TC was separated from the solution by centrifugation (10,000 rpm, 5 min), washed multiple times with deionized water and anhydrous ethanol, and then dried in a vacuum oven at 60 °C. The dried catalyst underwent five cyclic experiments under the same reaction conditions.

3. Results and Discussion

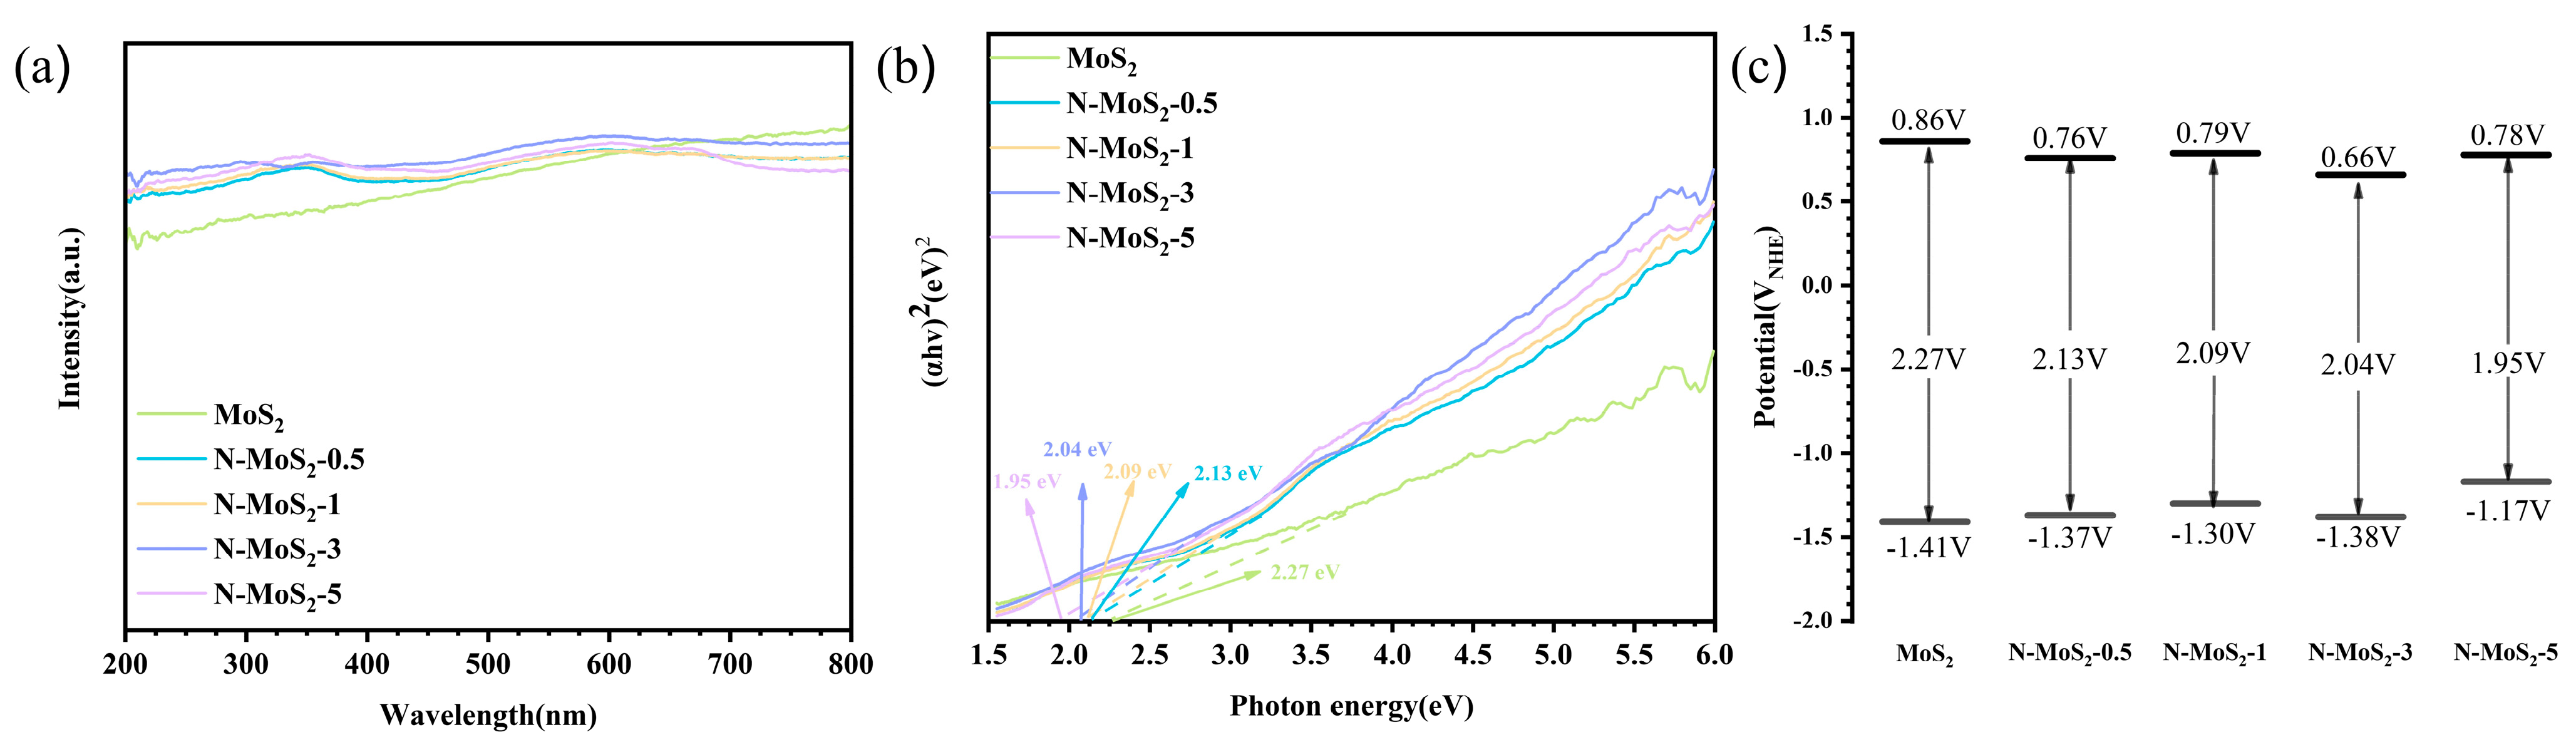
3.1. Characterizations of Catalysts

The preparation of MoS2 and N-MoS2-x catalysts is shown in Figure 1a. The morphology of bulk MoS2 and N-MoS2-x was characterized by scanning electron microscopy (SEM) and transmission electron microscopy (TEM). As shown in Figure 1b–e, the surface of the N-doped samples revealed nanoflake-like aggregation structures identical to pristine MoS2, suggesting that nitrogen incorporation does not alter the surface morphology (Supplementary Figures S1 and S2, and Table S1) [18]. Moreover, it has been demonstrated that the surfaces of the doped samples harbor minute nanoparticles, indicating the successful incorporation of nitrogen into the MoS2 lattice. Furthermore, the elemental mapping obtained from scanning electron microscopy reveals that the elements N, Mo, and S are equally distributed across the surface of the nanosheets in the catalyst N-MoS2-3, as illustrated in Figure 1f–h. The microscopic morphology and lattice stripes of N-MoS2-x were analyzed using TEM (Figure 1i,j and Supplementary Figures S3–S5) [32]. The TEM images of N-MoS2-x reveal orderly lattice stripes on the material’s surface.
The lattice spacings align with the reflecting surface (002) of 2H-MoS2 (JCPDS 37-1492) [33], and a minor increase in the layer spacing of N-MoS2-3 is also noted. The effective doping of the N element is further evidenced [34].
Raman spectroscopy was used to probe the chemical structure of the prepared catalysts. As shown in Figure 2a, in the MoS2 spectrum, two distinct peaks were detected at 374.3 and 400.8 cm−1, which were related to the in-plane E 2 g 1 vibrational modes (Mo-S-Mo) and the out-of-plane A1g vibrational modes (perpendicular to Mo-S-Mo) of 2H-MoS2, respectively, and no other distinctive characteristic peaks were detected in the spectra, which indicated that N doping did not modify the MoS2 layered structure [35]. The vibrational peaks of N-MoS2-3 exhibit a minor blue shift in position, with a frequency difference of around 26.5 cm−1 between the two peaks. This mostly results from the localized stress and alterations in the electrical structure induced by nitrogen doping.
The crystal structure of the synthesized catalysts was analyzed using an X-ray powder diffractometer (XRD). Figure 2b illustrates a succession of distinctive diffraction peaks at 14.4° (002), 29.0° (004), 32.7° (100), 35.9° (102), 39.5° (103), and 58.3° (110), confirming the effective synthesis of hexagonal 2H-MoS2 (JCPDS 37-1492) [36]. It is important to highlight that, despite the successful doping of the N element into MoS2, no diffraction peaks corresponding to Mo-N species were detected in the XRD spectra, suggesting that the N doping did not influence the crystal structure of MoS2. Furthermore, the half-peak width of the characteristic peak (002) of N-doped MoS2 is obviously reduced, while the peak (102) appears at 35.87°, indicating that the incorporation of N atoms markedly enhances its crystallinity.
X-ray photoelectron spectroscopy (XPS) was used to examine the surface chemical compositions and atomic valence states of MoS2 and N-MoS2-x. The full-scan spectra show that the nitrogen doping was successful since the surface of nitrogen-doped MoS2 has peaks of the N element in addition to the Mo, S, and O elements (Figure 2c). Gas molecules like CO2 or O2 adsorbed on the material’s surface could be the source of the O peak among them. The S 2p1/2 and S 2p3/2 peaks from S (II) are displayed in Figure 2d. Figure 2e displays the Mo 3d3/2 and Mo 3d5/2 peaks from Mo (IV). Furthermore, a specific peak at 235.3 eV associated with Mo (VI) has a very weak signal. Thus, the valence state of Mo remains predominantly Mo (IV). In Figure 2f, a Mo-N peak appears, which further confirms the successful doping of N element in MoS2. It is evident from Figure 2d–f that charge transfer has taken place in nitrogen-doped MoS2 since the elemental binding energies Mo 3p, Mo 3d, S 2s, and S 2p in N-MoS2-x are negatively shifted in comparison to those of MoS2. These results can be attributed to the doping of element N into the MoS2 lattice in the form of substituting S to form N-Mo bonds and triggering energy band bending. Moreover, the percentage of N in the optimal catalyst N-MoS2-3 was about 18.39 at% (Supplementary Table S2).

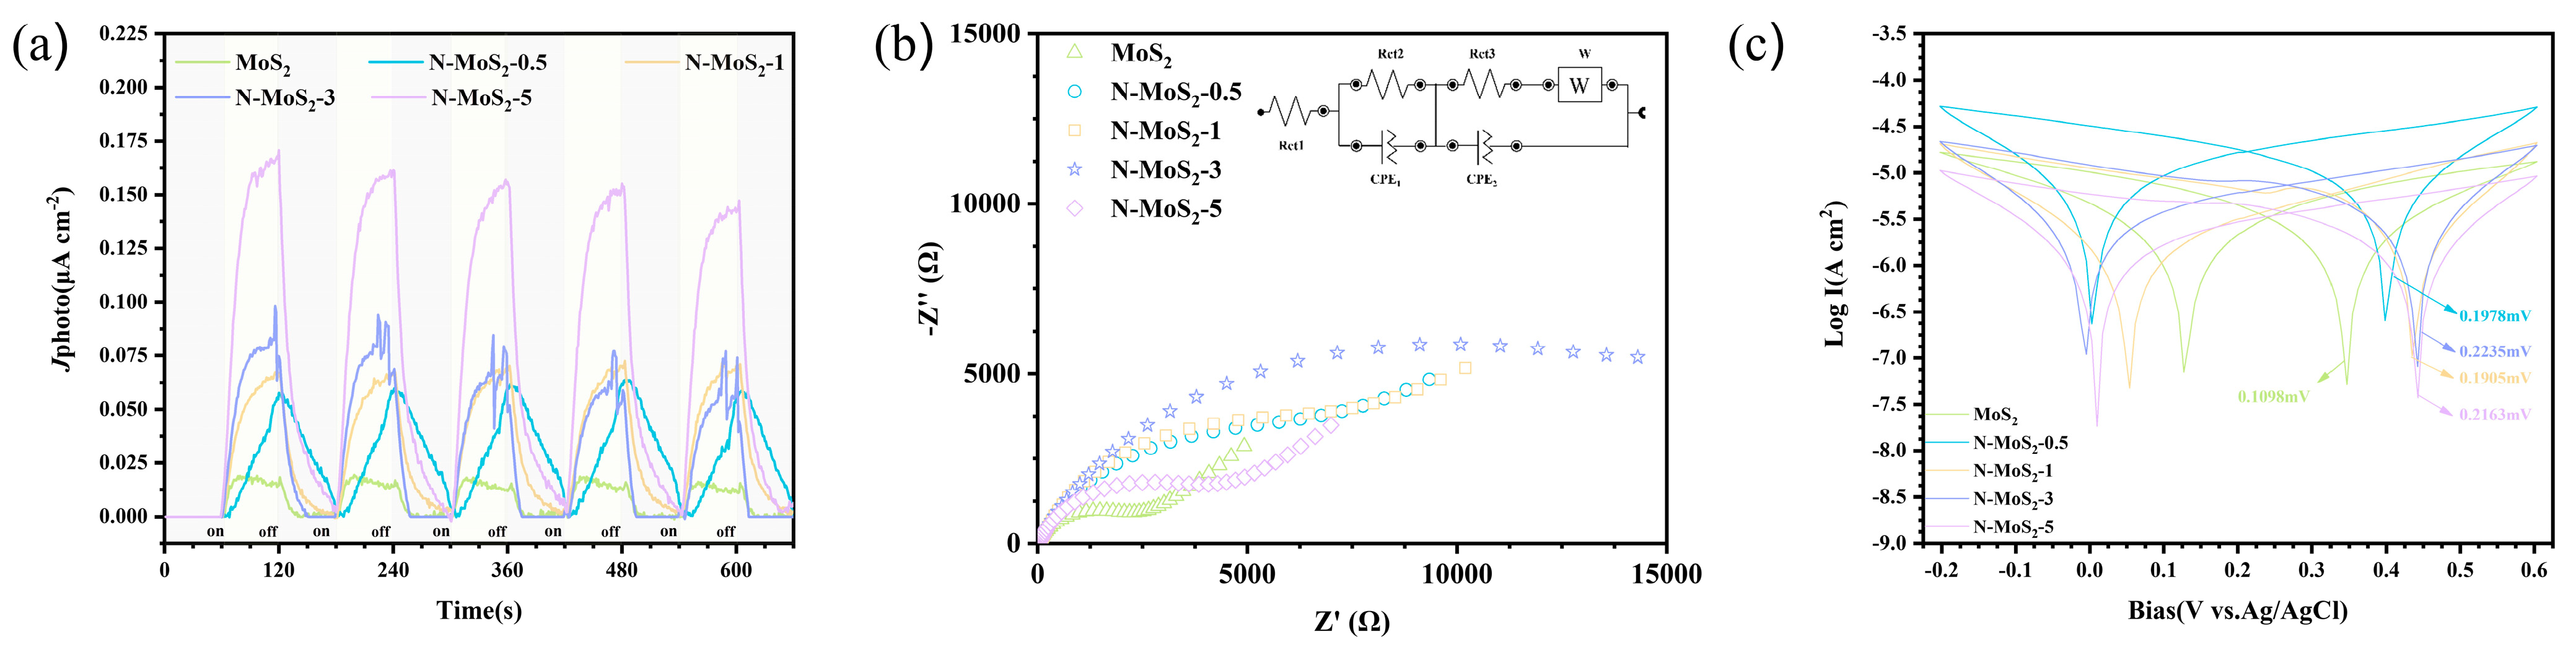
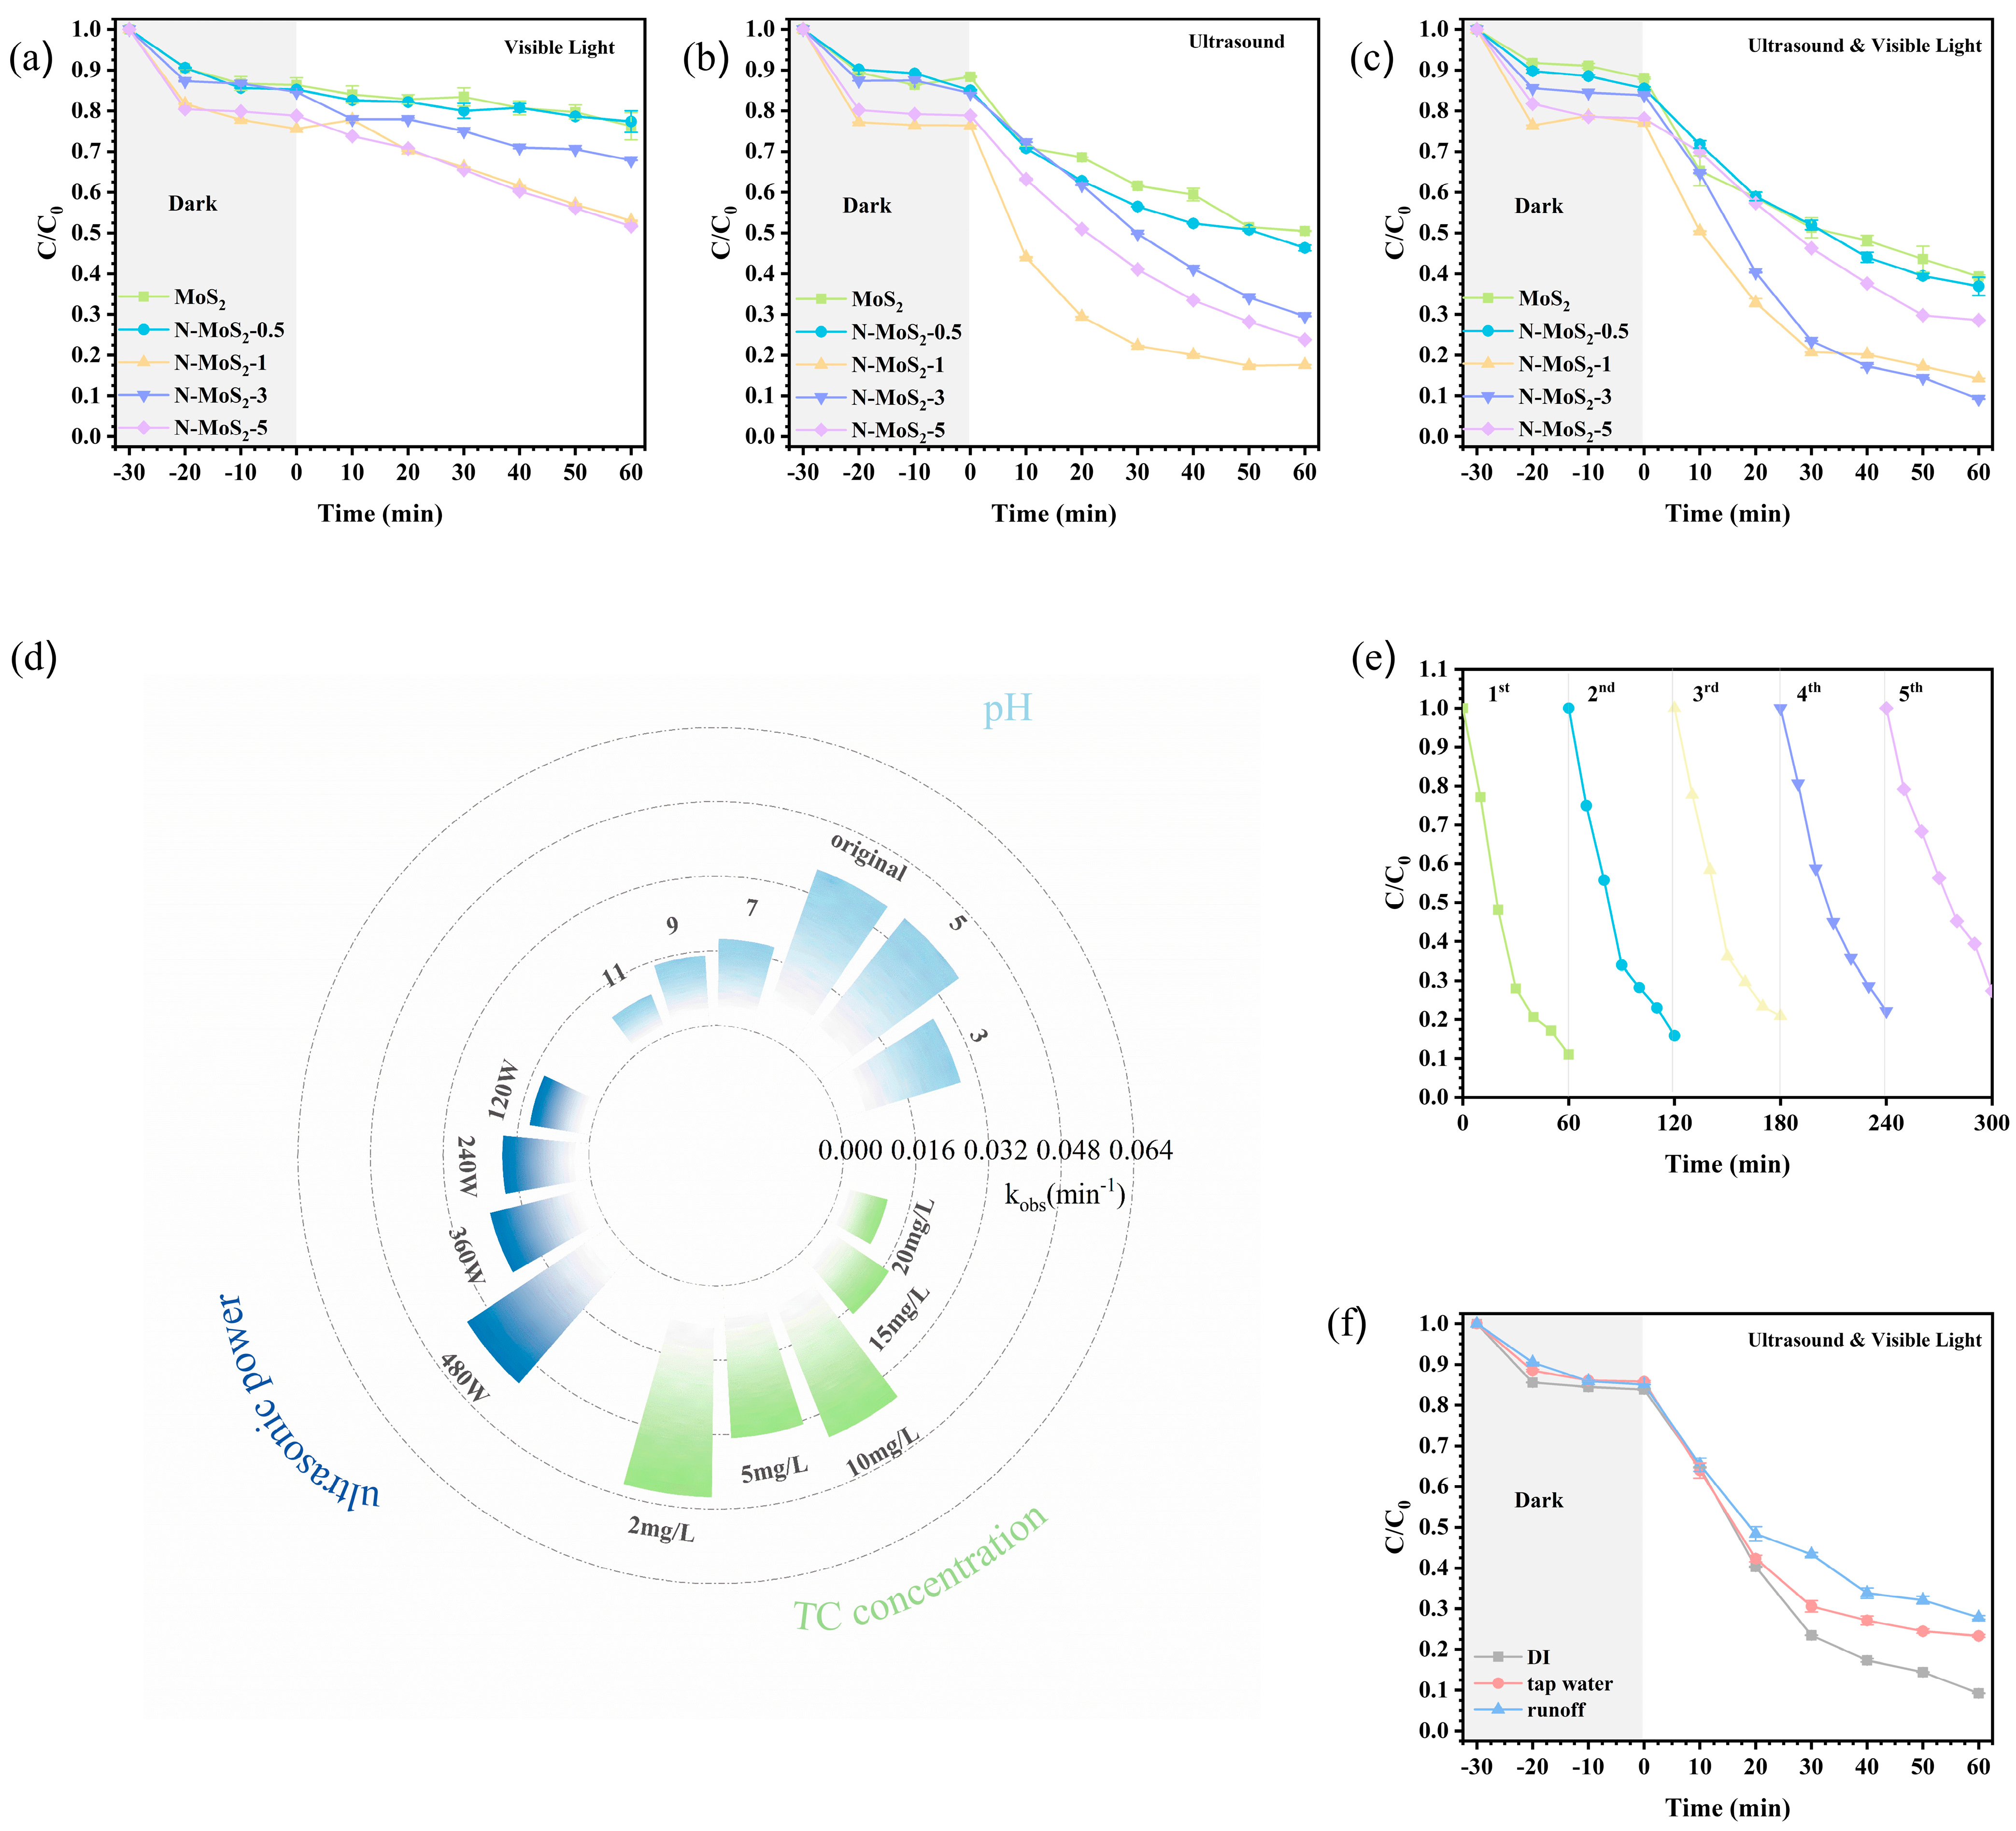
3.2. Photocatalytic Activity

The effectiveness of a photocatalytic reaction is contingent upon the light-harvesting capacity of the photocatalyst, which exerts a direct influence on the number of charge carriers produced and the efficiency with which natural sunlight is utilized [37,38]. Consequently, the optical characteristics of the catalysts were evaluated using UV-Vis DRS spectroscopy (Figure 3a). The black surface contributes to the increase in the molar adsorption coefficient, thereby exhibiting strong light-harvesting properties over a wide range of 200–800 nm. Compared with pure MoS2, N-MoS2-x has enhanced light-harvesting performance in the visible range (400–700 nm), and the enhanced visible-light adsorption ability can improve the light utilization and generate more effective photogenerated electrons to participate in the photocatalytic reaction. In addition, the energy band gap (Eg) of the nitrogen-doped molybdenum disulfide was narrowed from 2.27 eV to 1.95~2.13 eV according to the classical Tauc diagram (Supplementary Equations (S1) and (S2)). In addition, the positions of the conduction (ECB) and valence bands (EVB) were determined according to VB-XPS and Mott–Schottky. According to the VB-XPS results, the EVB values of MoS2, N-MoS2-0.5, N-MoS2-1, N-MoS2-3, and N-MoS2-5 are 0.55 eV, 1.09 eV, 1.00 eV, 0.61 eV, and 0.9 eV, respectively. The linear regions of the Mott–Schottky curves are all positively sloped, showing typical n-type semiconductors characteristics. The flat band potentials’ Efb values are −1.51 V, −1.47 V, −1.4 V, −1.48 V, and −1.27 V (relative to Ag/AgCl). This corresponds to −1.31VNHE, −1.27VNHE, −1.2VNHE, −1.28VNHE, and −1.07VNHE according to Supplementary Equation (S3). In general, for n-type semiconductors, the value of Efb is about 0.1V higher than the value of ECB [39]. Therefore, the values of Efb are about 0.1V higher for MoS2, N-MoS2-0.5, N-MoS2-1, N-MoS2-3, and N-MoS2-5, and the ECB values are estimated to be −1.41 VNHE, −1.37 VNHE, −1.3 VNHE, −1.38 VNHE, and −1.17 VNHE, respectively. The energy band positions are illustrated in Figure 3c.
The charge transfer dynamics at the piezoelectric photocatalyst/solution interface were examined using photoelectrochemical testing [40]. The capability of photoelectric conversion was evaluated utilizing the transient photocurrent density (J). All transient photocurrent density profiles exhibited a quick increase following the illumination for five cycles. The stable Jphoto values gradually increased with the increase in N doping, and the Jphoto values of MoS2, N-MoS2-0.5, N-MoS2-1, N-MoS2-3, and N-MoS2-5 were 0.015 μA·cm−2, 0.058 μA·cm−2, 0.066 μA·cm−2, 0.075 μA·cm−2, and 0.171 μA·cm−2 (Figure 4a). Notably, the optimized N-MoS2-5 sample achieved a remarkable 11.4-fold improvement in photocurrent generation compared to the undoped MoS2 counterpart. The high and stable Jphoto values indicate that the samples may have higher photogenerated carrier separation efficiency and thus exhibit a higher photocurrent response. In this work, the photoelectrochemical stability was evaluated by the photocurrent density retention ratio (PDRE), as shown in Equation (2):
P D R E = i 5 i 1 × 100 %  
where PDRE is the photocurrent density retention efficiency; and i1 and i5 are the stabilized photocurrent densities at the 1st and 5th cycles, respectively. The calculated efficiencies of all piezoelectric photocatalysts’ PDREs exceeded 80%. Especially for N-MoS2-1, no obvious photocurrent density attenuation was found. All piezoelectric photocatalysts exhibited satisfactory photoelectrochemical stability during five cycles.
In general, a decrease in the diameter of the capacitive arc represents a decrease in the charge transfer resistance (Rct), which exhibits a relatively strong electron transport capability [38,41]. The Nyquist curves demonstrate incomplete capacitive arc shapes under both dark and visible-light illumination when fitted using the [R (RQ)([RW] Q)] equivalent circuit model. Under dark conditions, the corresponding capacitive arc radii are in the order of MoS2 (27.9 Ω) > N-MoS2-0.5 (25.9 Ω) > N-MoS2-3 (22.5 Ω) > N-MoS2-1 (19.9 Ω) = N-MoS2-5 (19.9 Ω). In comparison with the primitive MoS2 samples, the arc radius underwent a significant decrease following nitrogen doping, indicating that N doping can effectively enhance the conductivity and reduce the charge transfer resistance of the material (Figure S8). Under visible-light irradiation, the Nyquist curves of all samples displayed a shape akin to those observed in darkness (Figure 4b); however, the Rct values experienced a further decrease in the dark, indicating that photogenerated electrons can be produced and migrate to the electrode/electrolyte interface under visible-light exposure. A quantitative analysis of the built-in electric field (BIEF) was conducted to elucidate its role as the driving force for the separation of photogenerated electron–hole pairs. As anticipated, the BIEF intensity was found to be enhanced under visible-light irradiation in comparison to dark conditions (Figure 4c and Figure S10).
In summary, nitrogen-doped molybdenum disulfide has enhanced visible-light absorption, hence augmenting its piezoelectric–photocatalytic activity.

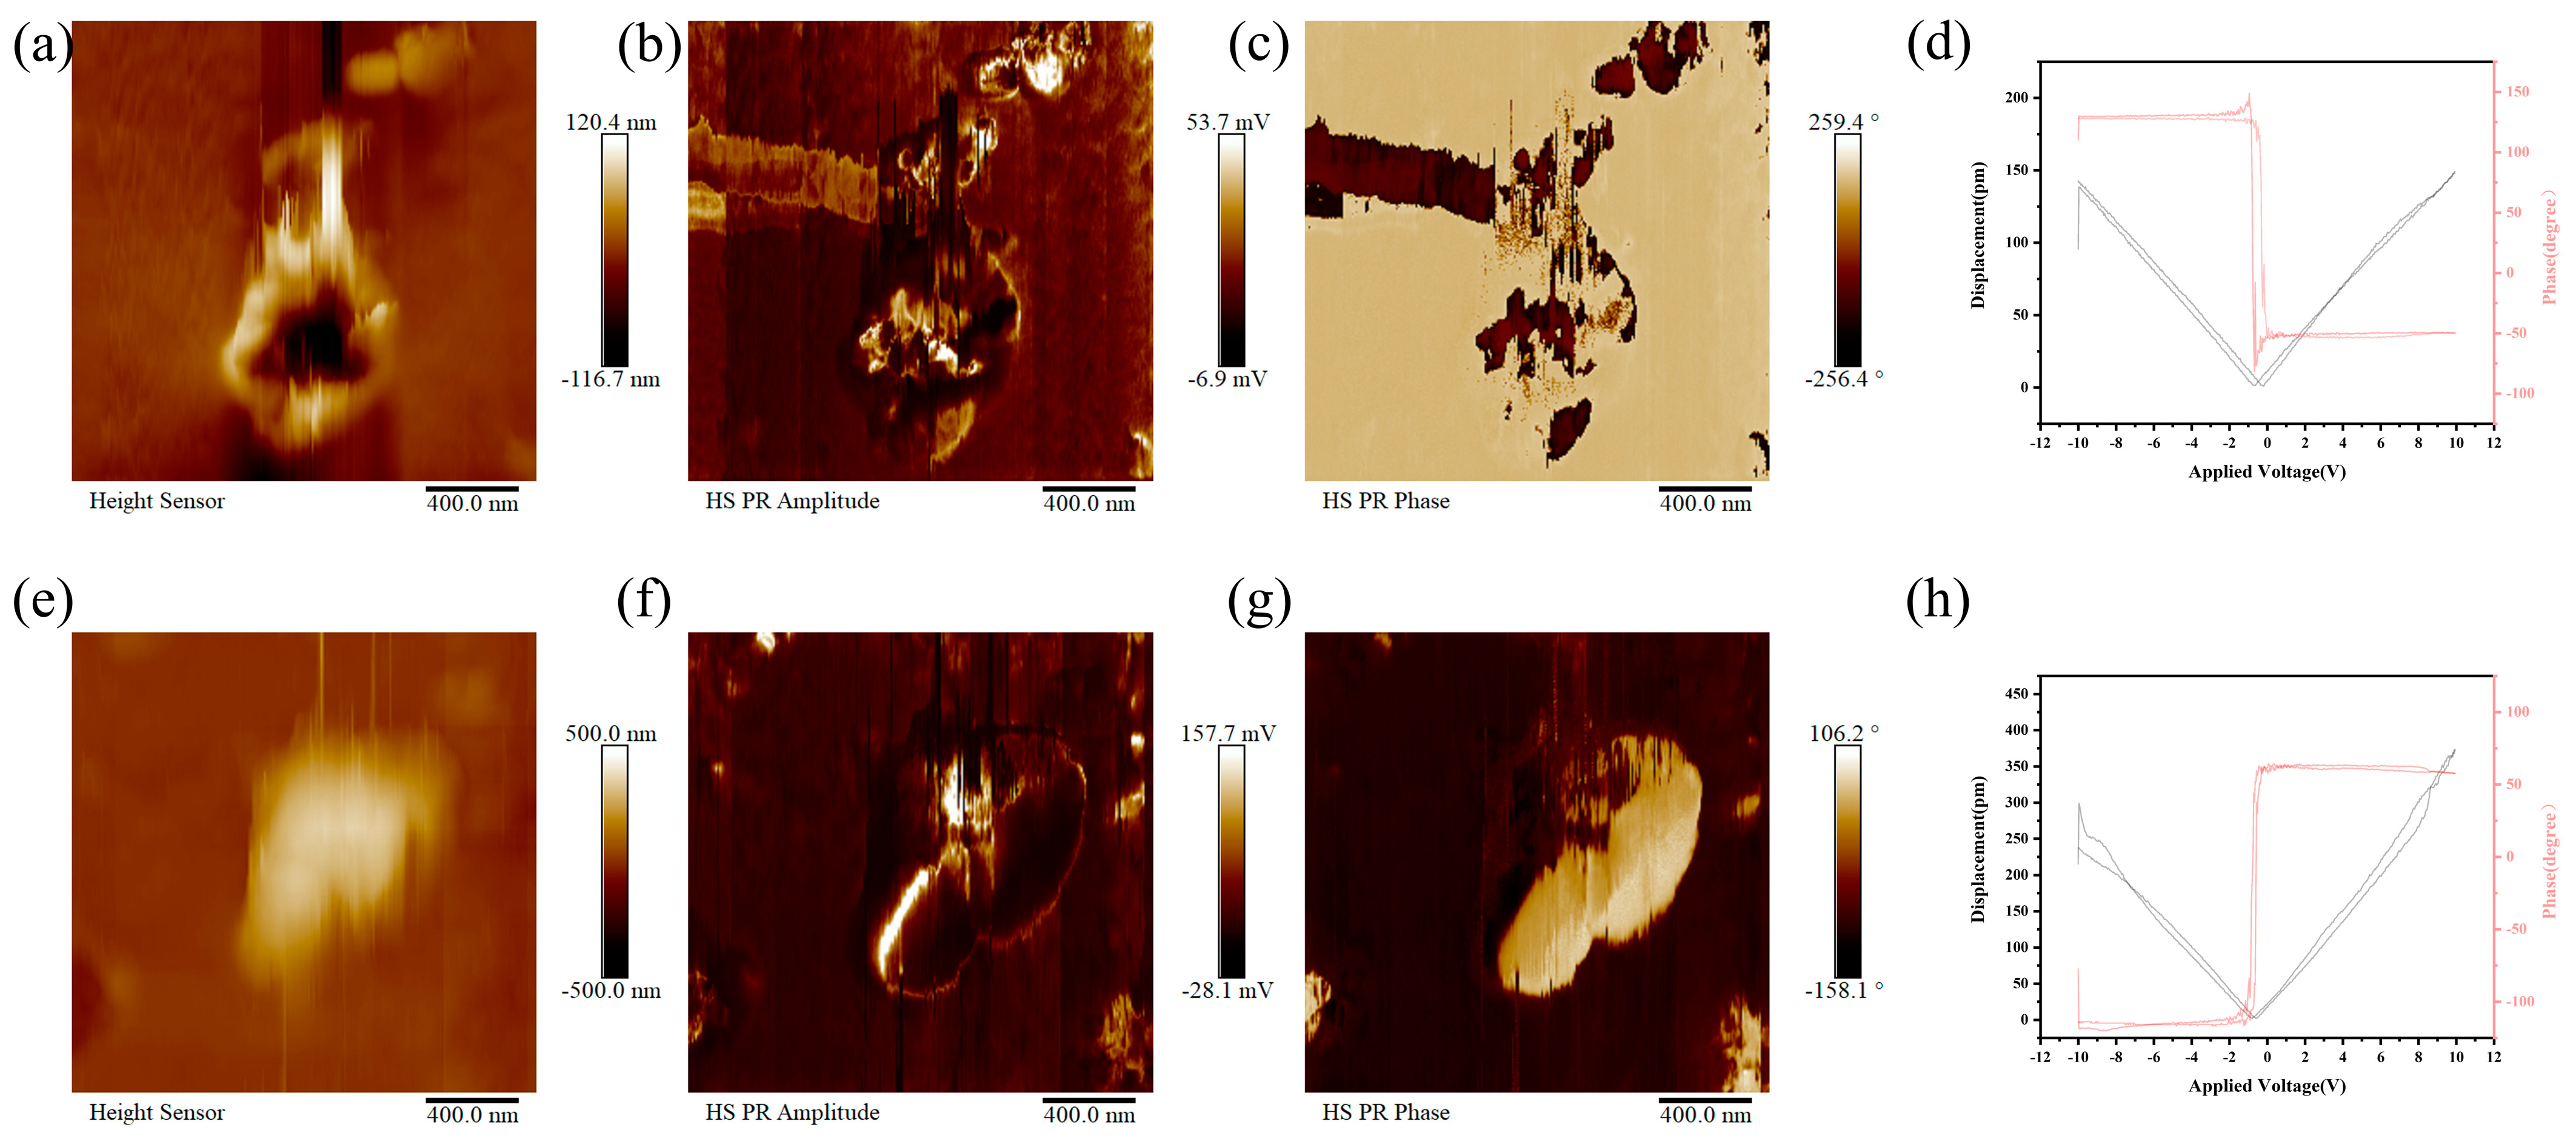
3.3. Piezoelectric Performances

Generally, the charge centers of cations and anions become asymmetric under external stress applied to the surface of a piezoelectric material, thereby inducing an internal electric field that promotes the separation of photogenerated charge carriers [42]. The piezoelectric characteristics of MoS2 and N-MoS2-3 were confirmed using atomic force microscopy (AFM), employing Kelvin probe force microscopy (KPFM) and piezoresponse force microscopy (PFM) techniques [43]. These catalysts exhibited a distinct disparity in their piezoresponse amplitudes. The topographic pictures of MoS2 and N-MoS2-3 samples in PFM measurements distinctly reveal their surface features (Figure 5a,e and Supplementary Figure S12), corroborating the HRTEM results. Simultaneously, the phase diagram in Figure 5c,g, characterized by its congruent topography, demonstrates the homogeneous distribution of polarization within the nanostructures.
As shown in Figure 5b,f, the surface potential of N-MoS2-3 reaches a maximum value of 157.7 mV, which is 2.94 times higher than that of MoS2 (53.7 mV). When scanned by applying a bias voltage of −10 to +10 V, the piezoelectric response amplitudes of the samples show a mirror symmetry similarity (Figure 5d,h) [44]. The good piezoelectric performance is further confirmed by the butterfly curve. And the maximum effective piezoelectric coefficient (d33) was calculated from the slope of the butterfly curve (Supplementary Figure S14). The results show that the d33 of N-MoS2-3 (183 pC V−1) is 1.58 times higher than that of MoS2. N doping considerably improves the piezoelectric characteristics of MoS2, according to a comparison of the surface potentials and piezoelectric response amplitudes measured in the PFM. This enhancement of piezoelectric properties can be attributed to the effect of N doping on the crystal structure and electrical conductivity of MoS2. Regarding the KPFM test, in contrast to the weak BIEF (28.687 mV) produced by MoS2 under probe tip stress, N-MoS2-3 produces a positive surface voltage of up to 59.357 mV, showing its excellent piezoelectric properties.
In addition, to further verify the piezoelectric effect. The transient piezoelectric current response maps were investigated at varying ultrasonic power levels (120 to 480 W). Supplementary Figure S15 and Figure 6a illustrate an effective positive connection between Jpiezo and ultrasonic power, suggesting that the synthesized piezoelectric catalysts exhibit significant piezoelectric sensitivity. Moreover, the intensity of the piezoelectric-induced BIEF was markedly elevated to 0.2015~0.2418 mV compared to the intensity of the photoelectric-induced BIEF (Figure 6a). The findings indicate that the piezoelectric properties of N-doped MoS2 enhance electron–hole separation efficiency.
We also analyzed the transient piezoelectric current response maps during the synergistic interaction of piezoelectricity with photovoltaics (Figure 6b and Supplementary Figures S16 and S17). The results indicated that the Jpiezo-photo of all materials was elevated in comparison to Jphoto and Jpiezo across all piezoelectric photocatalysts. Simultaneously, the BIEF intensity within the synergistic system increased to 0.2198–0.2454 mV (Supplementary Figure S18), indicating a significant enhancement in the charge transfer mechanism at the piezoelectric photocatalyst/solution interface.
The preceding studies demonstrate that N-MoS2-3 can effectively promote the redox process on the surface by generating additional polarization carriers under the effect of applied stress. This effect is accompanied by the material’s excellent piezoelectric properties.

3.4. Performance Evaluation of Piezoelectric–Photocatalytic Degradation of Tetracycline

The significant current response generated under paired ultrasonic and visible-light irradiation indicates excellent piezoelectric–photocatalytic activity, as mentioned above. The photocatalytic and piezoelectric properties of pure MoS2 and N-MoS2-x samples were assessed by the degradation efficacy of TC. Before the degradation studies, the catalyst samples were introduced to the aqueous TC solution for 30 min in the absence of light to establish adsorption–desorption equilibrium. The adsorption of tetracycline by N-doped MoS2 was significantly greater than that of pristine MoS2, with N-MoS2-1 exhibiting the highest adsorption, at 2.92 times that of MoS2. This finding indicates that nitrogen doping may enhance adsorption capacity by increasing surface active sites or optimizing pore structure, thereby indirectly suggesting an improvement in specific surface area.
Figure 7a illustrates that, under visible-light irradiation, 20.0% of pristine MoS2 was eliminated within 60 min, while the degradation efficiency of N-MoS2-5 increased to 48.4%, with the kinetic rate constant rising by a factor of 4.44 following nitrogen doping. This outcome confirms that the localized surface plasmon resonance (LSPR) effect, facilitated by an optimal nitrogen modification, enhances the visible-light absorption of MoS2, thereby augmenting the photocatalytic degradation efficiency of TC. The degradation performance of N-MoS2-x was significantly improved for piezoelectric–photocatalysis. N-MoS2-3 exhibited limited photocatalytic (32.2%) and piezoelectric–catalytic (70.5%) activity for TC removal. In contrast, 90.8% of TC was eliminated in 60 min when piezoelectricity and visible light were combined, which was significantly better than other doping ratio materials (Figure 7c).
The kinetic rate constant (Supplementary Figure S20) of N-MoS2-3 under piezoelectric–photocatalytic coupling is 3.07 times higher than that of MoS2. Notably, this rate constant exceeds the combined photocatalytic and piezocatalytic rate constants by a factor of 1.75. This indicates that the piezoelectric field generated by ultrasound facilitates the separation and migration of photogenerated electron–hole pairs during the catalytic process. The overall degradation efficiency was markedly improved due to the increased participation of holes and electrons in the piezoelectric–photocatalytic interaction [45].
In order to better understand the TC degradation process, the effects of various operating parameters in the piezoelectric–photocatalytic system were investigated. These parameters included ultrasonic parameters, TC concentration, and initial pH.
Previous research indicates that ultrasonic frequency and power significantly influence piezocatalytic degradation activity. The suitable ultrasonic frequency can optimize the deformation of piezoelectric–catalytic materials by inducing resonance under ultrasonic influence, while augmenting power input can enhance the degree of deformation of the materials. The impact of mechanical force intensity on the efficacy of the catalyst for TC degradation was examined (Supplementary Figure S21a). As the ultrasonic power escalates, the computed kobs exhibits a corresponding increase. Relative to kobs at 120 W, kobs at 480 W exhibited a 77% increase. This suggests that increased ultrasonic power produces greater applied stress, leading to a more robust piezoelectric potential, which facilitates the generation of ROS, hence improving the catalytic efficacy of piezoelectric–photocatalysis.
The degradation rate of TC by N-MoS2-3 diminished progressively with the increase in starting concentration, yielding rates of 96.0%, 91.7%, 90.8%, 70.8%, and 51.1%, respectively. The migration of carriers to the active site of the photocatalyst was influenced by the abbreviated transport pathway and the transmittance of photogenerated carriers at elevated pollutant concentrations, which concurrently diminished the photocatalytic efficiency of the catalyst [46]. The photocatalytic activity diminished due to intermediate intermediates in the TC photocatalytic degradation process competing with TC molecules for the limited photocatalytic active sites. Although the elevated concentration diminished photocatalytic activity, N-MoS2-3 demonstrated remarkable photocatalytic efficacy for tetracycline elimination at low pollutant concentrations, achieving a removal rate of 96.0% for 2 mg/L of pollutant. Considering that pollutant concentrations are typically low in actual wastewater, N-MoS2-3 can be regarded as an efficient photocatalyst for the degradation of the antibiotic TC.
Another crucial element influencing the production of reactive oxygen species (ROS) and photocatalytic degradation in actual wastewater is the pH of the reaction solution. Supplementary Figure S21c illustrates the degradation efficiencies of TC at varying pH levels (3, 5, 7, 9, and 11), which are 84.40%, 92.08%, 70.69%, 60.40%, and 54.06%, respectively. The degradation efficiency is maximized at pH 5, where the reaction rate constant (kobs = 0.0377 min−1) is likewise the highest. The subsequent pH levels are 3 and 7, exhibiting reaction rate constants of 0.0281 min−1 and 0.0185 min−1, respectively. Under acidic conditions, TC mostly exists in its cationic form [47]. Excess H+ not only depletes surface hydroxyl groups via protonation, so hindering •OH production, but also facilitates the recombination of photogenerated electrons with H+, resulting in diminished TC degradation efficiency. In weakly acidic and neutral conditions, TC is more readily adsorbed onto the catalyst surface, hence improving degrading efficiency. In alkaline conditions, a significant concentration of OH- competes with TC for active sites, diminishing reaction efficiency; concurrently, the surplus OH- facilitates the reaction between H2O and H+, resulting in a reduction of the primary active species H+ in the photocatalytic process, thereby impairing overall photocatalytic degradation performance.
The stability of N-MoS2-3 was examined using cycle testing, with the findings presented in Figure 7e. The degradation efficiency of TC exceeded 80% after five cycles, consequently affirming the strong stability and excellent reusability of the N-MoS2-3 piezoelectric photocatalyst. The crystalline phase and structure of N-MoS2-3 were preserved during the piezoelectric–photocatalytic degradation of TC under visible light and ultrasound, as evidenced by XRD and SEM analyses conducted before and after recycling.
XRD and SEM measurements performed before and upon recycling demonstrated that the crystalline phase and structure of N-MoS2-3 remained unchanged during the piezoelectric–photocatalytic breakdown of TC under visible light and ultrasound (Supplementary Figures S22 and S23). This result further confirms the exceptional long-term stability of the catalyst.
To investigate the efficacy of piezoelectric photocatalysts, we performed TC degradation studies in different real water sources (ultrapure water, laboratory tap water, and runoff rainwater) to which TC was introduced (Figure 7f). The piezoelectric–photocatalytic degradation performance of N-MoS2-3 exhibited variability across diverse water samples, indicating that the composition of these samples influences its catalytic activity. The TC degradation efficacy in the other two water samples was diminished relative to ultrapure water; however, the catalytic activity remained adequate. The runoff precipitation exhibited the lowest degradation efficiency of 72.13%. The reduction in degrading efficiency mostly stemmed from the synergistic influence of intricate constituents in runoff rainfall. Humic acids and suspended particles decreased the efficient use of light energy due to light attenuation, whereas concurrent organic matter competed with TC molecules for reactive oxygen species. Moreover, inorganic salt ions like Cl further impeded the degradation cycle by quenching free radicals. The experimental results demonstrated that the system not only effectively degraded the target pollutants but also had the capacity to non-selectively degrade additional organic contaminants in the actual water environment.

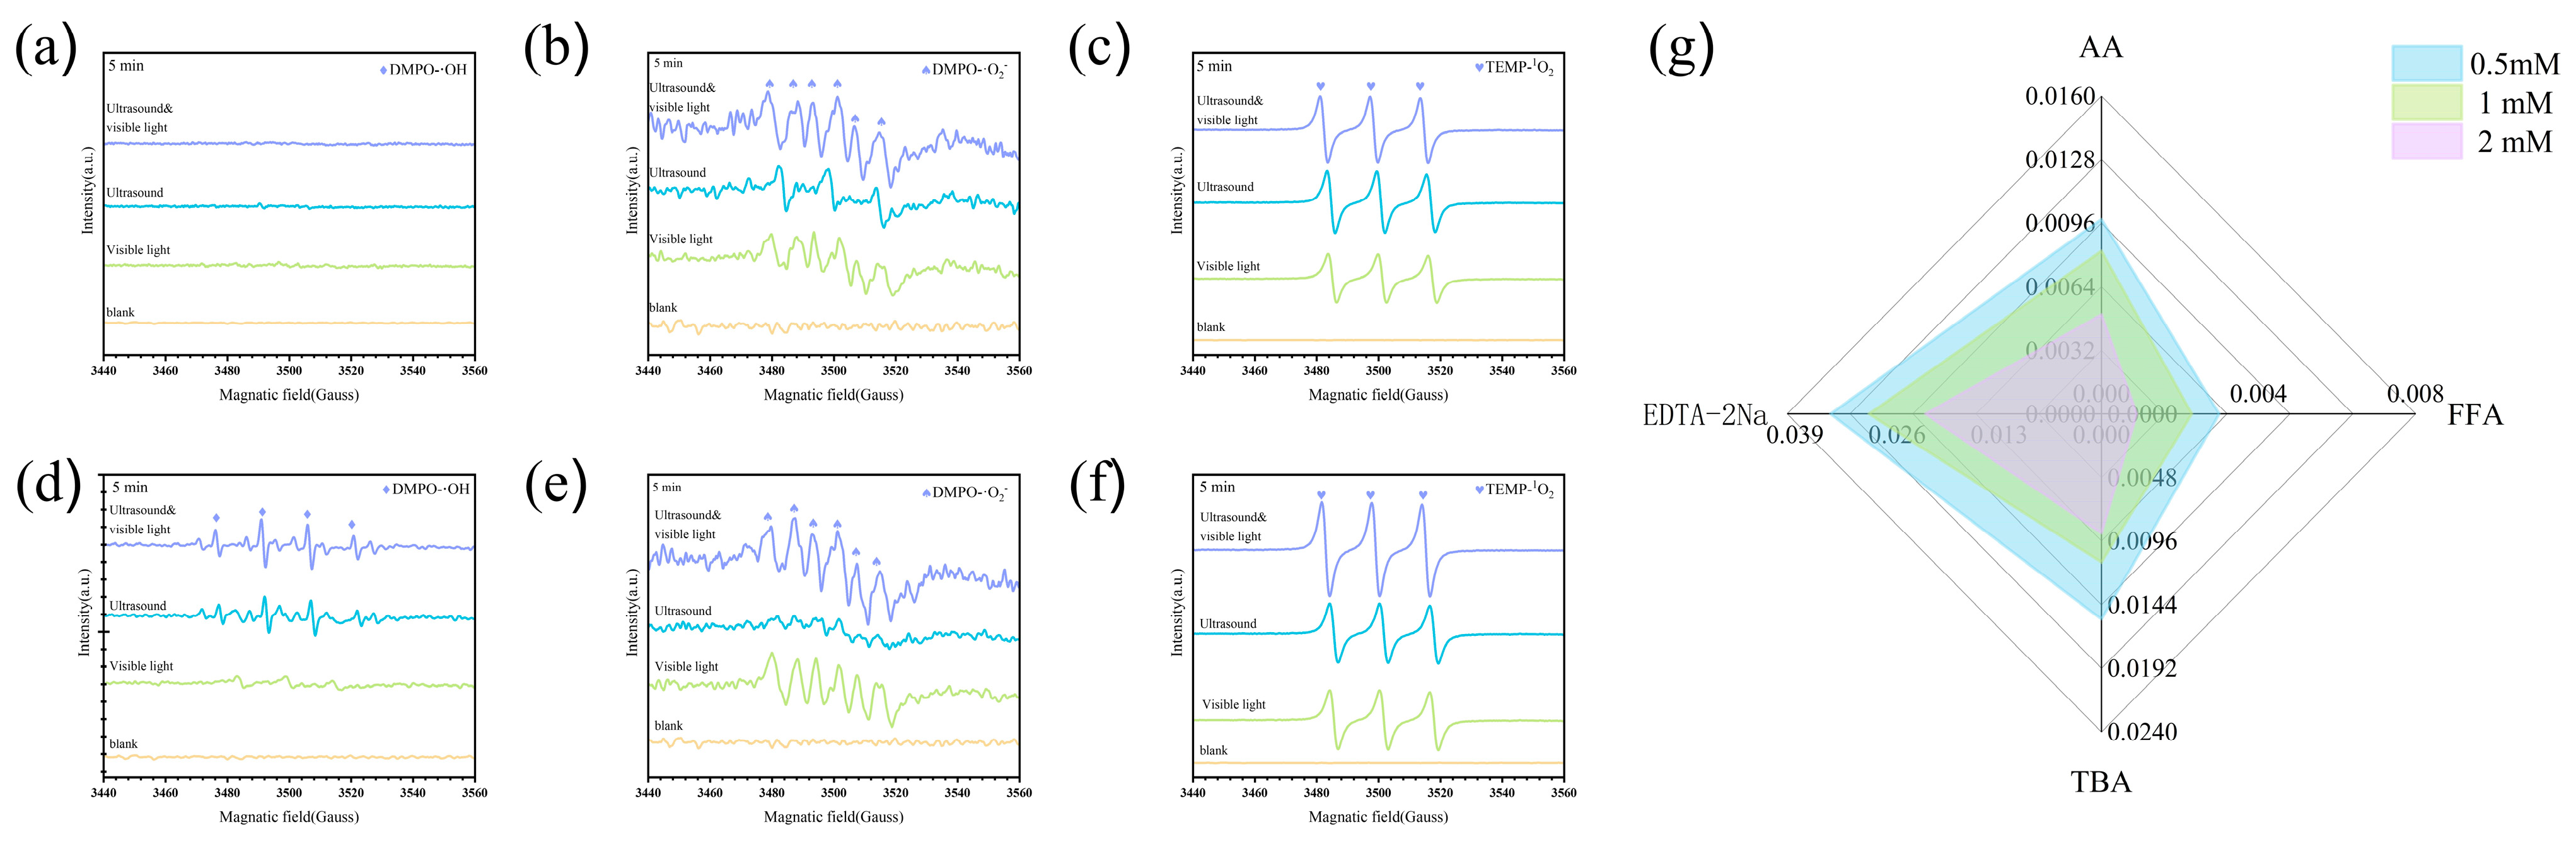
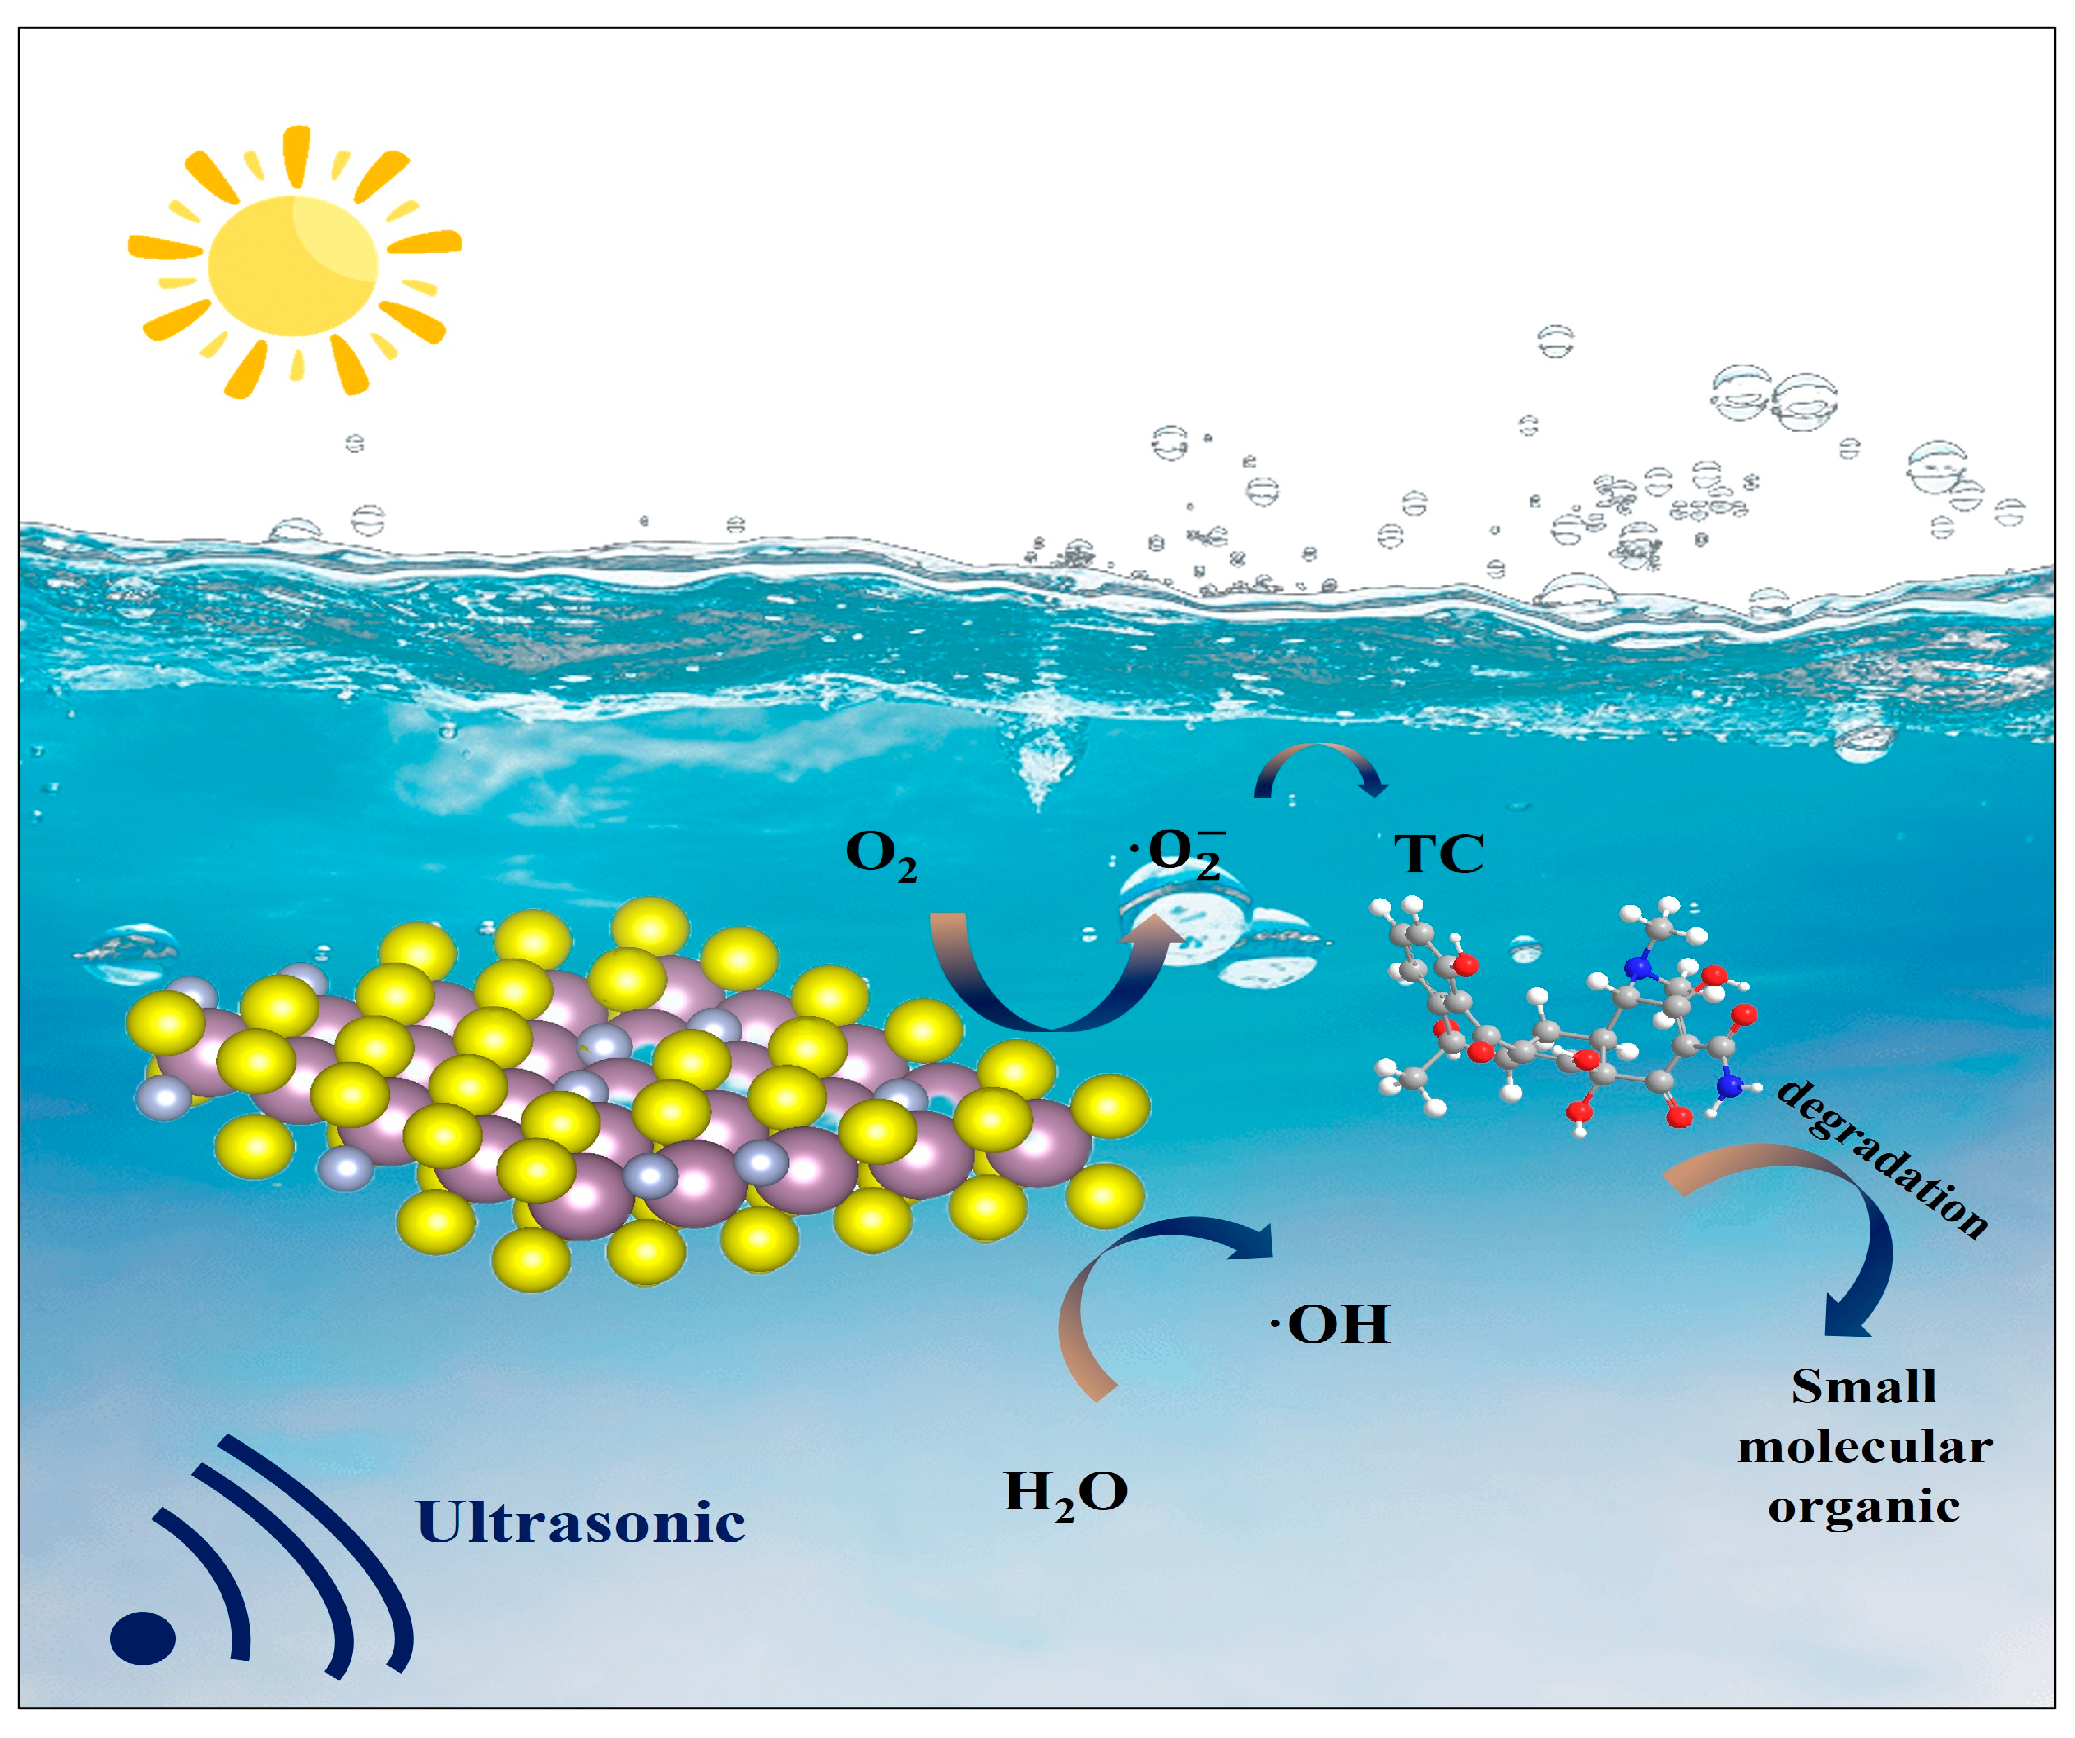
3.5. Piezocatalytic Mechanism

In Supplementary Figure S24, in order to gain more insight into the degradation mechanism, we performed a series of gradient trapping experiments of free radicals using different trapping agents, thus identifying the species of active species and estimating their respective contributions in the system. The addition of ascorbic acid (AA, detecting •O2), disodium ethylenediaminetetraacetic acid (EDTA-2Na, detecting h+), tertiary butyl alcohol (TBA, detecting •OH), and furfuryl alcohol (FFA, detecting 1O2) resulted in a certain degree of decrease in the degradation efficiency, suggesting that all of the h+, 1O2, •O2, and •OH reactive oxide species were involved in the degradation.
The active oxide species in MoS2 and N-MoS2-3 were further identified by EPR testing, as shown in Figure 8a–f [48,49]. Hydroxyl radicals (•OH) were identified utilizing 5,5-dimethyl-1-pyrroline-N-oxide (DMPO) as the trapping agent and deionized water as the solvent. No •OH signals were observed for MoS2 under any conditions; however, N-MoS2-3 exhibited characteristic •OH peaks during both sonication and photo-sonication, with no •OH signals found under visible-light irradiation (Figure 8a,d). The presence of •O2 was identified utilizing DMPO as a trapping agent and methanol as a solvent. In the case of MoS2, characteristic •O2 peaks were observed under both visible-light irradiation and photo-ultrasound; however, no •O2 signal was recorded under ultrasound. The same results were obtained for N-MoS2-3 (Figure 8d,e). Conversely, 1O2 was seen under all conditions.
The findings indicated that •O2 could be produced during visible-light exposure, but ultrasonic action facilitated the synthesis of 1O2, enhancing the degradation capacity. In contrast to MoS2, N-MoS2-3 produced OH upon ultrasonic stimulation, and the strength of the distinctive peaks markedly enhanced under light–ultrasonic stimulation. Simultaneously, the concentrations of all active species in N-MoS2-3 were above those in MoS2 under all conditions, signifying that nitrogen-doped MoS2 augmented the generation of active species induced by visible-light and ultrasonic stimulation.
Based on the above analysis, we propose a synergistic degradation mechanism for piezoelectric–photocatalytic degradation of MoS2 regulated by N doping (Figure 9). In the visible photocatalytic process, nitrogen doping altered the charge distribution of the Si-Moi-Sd structure, enhanced the charge transfer kinetics, expedited the charge transfer from Moi to Si, and established a built-in electric field from the positive surface to the interior under visible-light irradiation. The BIEF facilitated the separation of photogenerated electrons and holes, enabling the photogenerated electrons on the surface of the N-doped MoS2 nanosheets to react with O2 in solution, thereby producing the active species •O2. The breakdown of organic contaminants is then achieved through a reaction with TC. Consequently, h+ could not interact with H2O or -OH to produce •OH, yet free radical trapping and EPR experiments indicated the presence of •OH in the system, leading to the hypothesis that •OH was created by the reaction between •O2 and H2O at the CB location. It is posited that •OH is produced through the reaction of •O2 and H2O at the CB location. In piezoelectric catalysis, photogenerated carriers are typically transported in the direction opposite to the electric field, resulting in a gradual decline in potential and an increase in their energy. This phenomenon enhances the carriers’ capacity to evade surface defects and to surpass the overpotential necessary for engaging in redox reactions. In contrast to the sole photocatalytic degradation of organic matter, the piezoelectric–photocatalytic process utilizes ultrasound as an applied mechanical force to activate the piezoelectric–catalytic effect of the material N-MoS2. The synergistic coupling mechanism between this physical field and the photoexcitation process markedly enhances the separation efficiency of the carriers.

4. Conclusions

In this study, N-doped modified MoS2 nanosheets were prepared for enhancing the degradation performance of piezoelectric–photocatalytic synergistic system. The experimental results showed that the N-MoS2-3 sample achieved 90.8% (60 min) degradation efficiency of TC under piezoelectric–photocatalytic synergism, and its reaction kinetic constant was enhanced by 3.66 times compared with that of pristine MoS2. It also exhibits good morphological and chemical structure stability, and maintains a good catalytic performance after several cycling experiments. In the study of the photocatalytic degradation mechanism of TC, we analyzed four main active species: h+, 1O2, •O2, and ·OH active oxide species are involved in the degradation. This study can provide a case reference for the element-doped modified MoS2 piezoelectric–photocatalytic removal of new pollutants in water.

Supplementary Materials

The following supporting information can be downloaded at https://www.mdpi.com/article/10.3390/w17091296/s1. Text S1. Chemical agents; Text S2. Photoelectrochemical tests; Text S3. Equations; Table S1. Detailed data on particle size distribution.; Table S2. XPS survey spectrum elemental content percentage; Table S3. Summary of Ea values for different models; Table S4. Fitting results of the EIS measurement; Table S5. Charge transfer distribution statistics; Table S6. Bond lengths distribution statistics; Table S7. Charge transfer distribution statistics at 1 GPa pressure level; Table S8. Bond lengths distribution statistics at 1 GPa pressure level; Figure S1. Particle size distribution statistics. (a) MoS2, (b) N-MoS2-0.5, (c) N-MoS2-1, (d) N-MoS2-3, and (e) N-MoS2-5; Figure S2. Surface morphologies. (a) MoS2, (b) N-MoS2-0.5, (c) N--MoS2-1, (d) N-MoS2-3, and (e) N-MoS2-5; Figure S3. Particle size distribution. (a) MoS2, (b) N-MoS2-0.5, (c) N-MoS2-1, (d) N-MoS2-3, and (e) N-MoS2-5; Figure S4. HRTEM images. (a) MoS2, (b) N-MoS2-0.5, (c) N--MoS2-1, (d) N-MoS2-3, and (e) N-MoS2-5; Figure S5. Lattice spacing. (a) MoS2, (b) N-MoS2-0.5, (c) N--MoS2-1, (d) N-MoS2-3, and (e) N-MoS2-5; Figure S6. Mott–Schottky curves; Figure S7. Valence band XPS spectra; Figure S8. Nyquist plots of five samples obtained from electrochemical impedance spectroscopy in the dark; Figure S9. Variations in the photocurrent signals in response to the on/off visible light; Figure S10. Built-in electric field scanning at the rate of 0.2 V·s−1; Figure S11. The potentiodynamic polarization curves of the as-prepared photocatalysts; Figure S12. PFM images of (a) MoS2 and (b) N-MoS2-3; Figure S13. (a) The KPFM observed phase change in (b) MoS2 and (c) N-MoS2-3 corresponding surface potential distribution on the selected line; Figure S14. The d33 tests of MoS2 and N-MoS2-3; Figure S15. The variation in the piezo/photo-current density (Jpiezo-photo) ultrasonic action at different powers: (a) MoS2, (b) N-MoS2-0.5, (c) N-MoS2-1, (d) N-MoS2-3, and (e) N-MoS2-5; Figure S16. The variation in the piezo/photo-current density (Jpiezo-photo) under visible-light irradiation and ultrasonic action at different powers: (a) MoS2, (b) N-MoS2-0.5, (c) N-MoS2-1, (d) N-MoS2-3, and (e) N-MoS2-5; Figure S17. The variation in the piezo/photo-current density (Jpiezo-photo) under visible-light irradiation and ultrasonic action at different powers; Figure S18. Built-in electric field scanning at the rate of 0.2 V·s−1 under visible-light irradiation and 480 W ultrasonic action; Figure S19. Adsorption effects under dark state conditions; Figure S20. Comparison of the k values of the catalysts for TC degradation in different conditions. Note: Visible-light intensity, 0.1 W·cm−2; ultrasonic power, 480 W; [TC] = 10 mg/L; and [catalysts] = 0.2 g·L−1; Figure S21. Effect of the key factors on the degradation performance: (a) ultrasonic power range of 120~480 W, (b) effects of initial pollutant concentration range of 2~20 mg/L, and (c) the initial pH range of 3~11; Figure S22. XRD patterns of the N-MoS2-3 before and after five cycles of catalytic experiment; Figure S23. SEM images of different sizes of the N-MoS2-3 before and after five cycles of catalytic experiment; Figure S24. The quenching experiments for the degradation of TC with (a) AA, (b) TBA, (c) FFA, and (d) EDTA-2Na; Figure S25. DFT theoretical simulation model of MoS2; Figure S26. DFT theoretical simulation model of N-MoS2-0.5; Figure S27. DFT theoretical simulation model of N-MoS2-1; Figure S28. DFT theoretical simulation model of N-MoS2-3; Figure S29. DFT theoretical simulation model of N-MoS2-5; Figure S30. The calculated work function; Figure S31. Electron partial density of states (PDOS). (a) MoS2, (b) N-MoS2-0.5, (c)N-MoS2-1, (d) N-MoS2-3, and (e) N-MoS2-5; Figure S32. Charge density difference in the dark. (a) MoS2, (b) N-MoS2-0.5, (c) N-MoS2-1, (d) N-MoS2-3, and (e) N-MoS2-5; Figure S33. Electron localization function in the dark. (a) MoS2, (b) N-MoS2-0.5, (c) N-MoS2-1, (d) N-MoS2-3, and (e) N-MoS2-5; Figure S34. Charge density difference at 1 GPa pressure level. (a) MoS2, (b) N-MoS2-0.5, (c) N-MoS2-1, (d) N-MoS2-3, and (e) N-MoS2-5; Figure S35. Electron localization function at 1GPa pressure level. (a) MoS2, (b) N-MoS2-0.5, (c) N-MoS2-1, (d) N-MoS2-3, and (e) N-MoS2-5. Figure S36. COMSOL multiphysics simulation of pressure distribution and potential distribution of nanoflower morphology structures under different pressures; Figure S37. The standard curve of TC concentration.

Author Contributions

D.Y., conceptualization, funding acquisition, and writing—review and editing; C.G., conceptualization, data curation, formal analysis, investigation, methodology, and writing—original draft; Y.N., formal analysis, methodology; X.F., data curation and methodology; X.L., data curation; X.X., formal analysis and methodology; C.W., data curation; Y.K., methodology, funding acquisition, and writing—review and editing; J.C., conceptualization, funding acquisition, project administration, resources, supervision, and writing—review and editing. All authors have read and agreed to the published version of the manuscript.

Funding

This work was supported by the National Natural Science Foundation of China (Grant Nos. 52270055, 52170097, and 52470100); the Fundamental Research Funds for the Central Universities (Grant No. buctrc202209); the Natural Science Foundation of Shandong Province, China (ZR2022QE124); and The Key R&D Program (Competitive Innovation Platform) of Shandong Province, China (2024CXPT101).

Data Availability Statement

All data generated or analyzed during this study are included in this published article and its Supplementary Materials.

Acknowledgments

We are grateful to all the authors for their contributions and financial help.

Conflicts of Interest

Chen Wang is from China Academy of Urban Planning and Design (Beijing) Planning & Design Consultants Co., Ltd. The authors declare no conflicts of interest.

References

  1. Yao, W.; Qi, Y.; Han, Y.; Ge, J.; Dong, Y.; Wang, J.; Yi, Y.; Volmer, D.A.; Li, S.L.; Fu, P. Seasonal variation and dissolved organic matter influence on the distribution, transformation, and environmental risk of pharmaceuticals and personal care products in coastal zone: A case study of Tianjin, China. Water Res. 2024, 249, 120881. [Google Scholar] [CrossRef] [PubMed]
  2. Rehman, M.U.; Nisar, B.; Mohd Yatoo, A.; Sehar, N.; Tomar, R.; Tariq, L.; Ali, S.; Ali, A.; Mudasir Rashid, S.; Bilal Ahmad, S.; et al. After effects of Pharmaceuticals and Personal Care Products (PPCPs) on the biosphere and their counteractive ways. Sep. Purif. Technol. 2024, 342, 126921. [Google Scholar] [CrossRef]
  3. Yang, Y.; Zhao, X.M.; Lai, R.W.S.; Liu, Y.; Liu, S.; Jin, X.; Zhou, G.J. Decoding Adverse Effects of Organic Contaminants in the Aquatic Environment: A Meta-analysis of Species Sensitivity, Hazard Prediction, and Ecological Risk Assessment. Environ. Sci. Technol. 2024, 58, 18122–18132. [Google Scholar] [CrossRef] [PubMed]
  4. Liu, G.C.; Yi, X.H.; Chu, H.Y.; Wang, C.C.; Gao, Y.; Wang, F.; Wang, F.X.; Wang, P.; Wang, J.F. Floating MIL-88A(Fe)@expanded perlites catalyst for continuous photo-Fenton degradation toward tetracyclines under artificial light and real solar light. J. Hazard. Mater. 2024, 472, 134420. [Google Scholar] [CrossRef]
  5. Su, Z.; Wang, K.; Yang, F.; Zhuang, T. Antibiotic pollution of the Yellow River in China and its relationship with dissolved organic matter: Distribution and Source identification. Water Res. 2023, 235, 119867. [Google Scholar] [CrossRef]
  6. Zhu, Y.-M.; Chen, Y.; Lu, H.; Jin, K.; Lin, Y.; Ren, H.; Xu, K. Simultaneous efficient removal of tetracycline and mitigation of antibiotic resistance genes enrichment by a modified activated sludge process with static magnetic field. Water Res. 2024, 262, 122107. [Google Scholar] [CrossRef]
  7. Wang, G.; Huang, D.; Cheng, M.; Du, L.; Chen, S.; Zhou, W.; Li, R.; Li, S.; Huang, H.; Xu, W.; et al. The Surface Confinement of FeO Assists in the Generation of Singlet Oxygen and High-Valent Metal-Oxo Species for Enhanced Fenton-like Catalysis. Small 2024, 20, e2401970. [Google Scholar] [CrossRef]
  8. Wang, Z.; Li, Y.; Wang, J.; Li, S. Tetracycline antibiotics in agricultural soil: Dissipation kinetics, transformation pathways, and structure-related toxicity. Sci. Total Environ. 2024, 949, 175126. [Google Scholar] [CrossRef]
  9. Xiang, W.; Liao, Y.; Cui, J.; Fang, Y.; Jiao, B.; Su, X. Room-temperature synthesis of Fe/Cu-BTC for effective removal of tetracycline antibiotic from aquatic environments. Inorg. Chem. Commun. 2024, 167, 112728. [Google Scholar] [CrossRef]
  10. Shen, Y.; Kang, J.; Guo, L.; Qiu, F.; Fan, Y.; Zhang, S. Recent progress on the application of MOFs and their derivatives in adsorbing emerging contaminants. Sep. Purif. Technol. 2024, 350, 127955. [Google Scholar] [CrossRef]
  11. Singh, V.; Suthar, S. Occurrence, seasonal variation, mass loading and fate of pharmaceuticals and personal care products (PPCPs) in sewage treatment plants in cities of upper Ganges bank, India. J. Water Process Eng. 2021, 44, 102399. [Google Scholar] [CrossRef]
  12. Zhou, X.; Shen, B.; Lyubartsev, A.; Zhai, J.; Hedin, N. Semiconducting piezoelectric heterostructures for piezo- and piezophotocatalysis. Nano Energy 2022, 96, 107141. [Google Scholar] [CrossRef]
  13. Jiang, T.; Wang, Y.; Cai, C.; Nie, C.; Peng, H.; Ao, Z. Piezocatalysis for water treatment: Mechanisms, recent advances, and future prospects. Environ. Sci. Ecotechnol. 2025, 23, 100495. [Google Scholar] [CrossRef]
  14. Jia, P.; Li, J.; Huang, H. Piezocatalysts and Piezo-Photocatalysts: From Material Design to Diverse Applications. Adv. Funct. Mater. 2024, 34, 2407309. [Google Scholar] [CrossRef]
  15. Liu, J.; Jin, L.; Dai, Z.; Ji, Y.; Qian, J.; Lu, Y.; Wang, J.; Shen, B.; Li, Y.; Xu, R.; et al. Single Atom Embedding Enhanced Macroscopic Polarization in Carbon Nitride Nanosheets for pH-Universal Piezo-Photocatalytic Nitrate Reduction over a Wide Concentration Range. ACS Catal. 2025, 15, 4025–4038. [Google Scholar] [CrossRef]
  16. Zhang, Y.; Liu, S.; Wang, J.; Tian, C.; Hong, W.; Lv, C. Based on the internal electric field S scheme mesoporous g-C3N4 nanosheets supported 2H MoS2 heterostructures for HCHO degradation of interior decoration and organic dyes degradation. Inorg. Chem. Commun. 2024, 169, 113047. [Google Scholar] [CrossRef]
  17. Zeng, G.; Miao, H.; Wu, J.; Zhu, X.; Yi, j.; Zhu, X.; Qi, H.; Jiang, Z.; Mo, Z.; Liu, J.; et al. Ingenious regulation and activation of sites in the 2H-MoS2 basal planes by oxygen incorporation for enhanced photocatalytic hydrogen evolution of CdS. Chem. Eng. J. 2024, 499, 156367. [Google Scholar] [CrossRef]
  18. Li, H.; Tian, F.; Chen, D.; Wu, J. Preparation and electrochemical performance of sulfur-vacancy riched N-doped MoS2 for supercapacitors. J. Alloys Compd. 2025, 1016, 179027. [Google Scholar] [CrossRef]
  19. Zhang, Y.; Wang, X.; Song, X.; Jiang, H. Collaborative effect between single-atom Re and S vacancy on modulating localized electronic structure of MoS2 catalysts for alkaline hydrogen evolution. Nano Res. 2024, 17, 9507–9517. [Google Scholar] [CrossRef]
  20. Shan, Y.; Liu, Y.; Feng, L.; Yang, S.; Tan, X.; Liu, Z. Magnetic Fe3O4-C@MoS2 composites coordinated with peroxymonosulfate catalysis for enhanced tetracycline degradation. J. Alloys Compd. 2024, 989, 174318. [Google Scholar] [CrossRef]
  21. Zhang, W.; Xu, S.; Zhao, Y.; Chen, H.; Li, H.; Liu, H. Efficient degradation of sulfamethazine in aqueous solution by Co@MoS2-activated peroxomonosulfate: Performance and mechanism. J. Water Process Eng. 2024, 66, 105909. [Google Scholar] [CrossRef]
  22. Bai, H.; Yang, Y.; Dong, M.; Yuan, H.; Huang, Y.; Liu, X.; Ni, C. Structure and defect engineering synergistically boost Mo6+/Mo4+ circulation of Sv-MoS2 based photo-Fenton-like system for efficient levofloxacin degradation. Appl. Catal. B Environ. Energy 2024, 358, 124430. [Google Scholar] [CrossRef]
  23. Mano, P.; Jitwatanasirikul, T.; Roongcharoen, T.; Takahashi, K.; Namuangruk, S. Tuning covalent bonding of single transition metal atom doped in S vacant MoS2 for catalytic CO2 reduction reaction product selectivity. Appl. Surf. Sci. 2025, 688, 162339. [Google Scholar] [CrossRef]
  24. Sehrawat, P.; Mehta, S.K.; Kansal, S.K. Synergistic enhancement of photocatalytic activity in ZnS/P-doped-MoS2 composite for hydrogen generation simultaneously oxidation of benzyl alcohol through water splitting and dye degradation. Int. J. Hydrogen Energy 2024, 80, 573–585. [Google Scholar] [CrossRef]
  25. Zhang, X.; Tian, F.; Lan, X.; Liu, Y.; Yang, W.; Zhang, J.; Yu, Y. Building P-doped MoS2/g-C3N4 layered heterojunction with a dual-internal electric field for efficient photocatalytic sterilization. Chem. Eng. J. 2022, 429, 132588. [Google Scholar] [CrossRef]
  26. Liu, J.; Hu, Y.; Li, X.; Xiao, C.; Shi, Y.; Chen, Y.; Cheng, J.; Zhu, X.; Wang, G.; Xie, J. High-efficient degradation of chloroquine phosphate by oxygen doping MoS2 co-catalytic Fenton reaction. J. Hazard. Mater. 2023, 458, 131894. [Google Scholar] [CrossRef] [PubMed]
  27. Zhang, Y.; Yang, T.; Li, J.; Zhang, Q.; Li, B.; Gao, M. Construction of Ru, O Co-Doping MoS2 for Hydrogen Evolution Reaction Electrocatalyst and Surface-Enhanced Raman Scattering Substrate: High-Performance, Recyclable, and Durability Improvement. Adv. Funct. Mater. 2022, 33, 2210939. [Google Scholar] [CrossRef]
  28. Wang, X.; Liu, S.; Huang, L.; Sun, T.; Kong, L.; Gao, Z.; Fu, R.; Xiao, Y. Transition metal doped MoS2 for piezoelectric Fenton-catalyzed degradation of norfloxacin: Rapid innergenerated-H2O2 conversion and dual pathways of non-radicals and radicals. Chem. Eng. J. 2025, 504, 159027. [Google Scholar] [CrossRef]
  29. Xie, L.; Lu, X.; Huang, W.; Jiang, G.; Liu, Y.; Fan, X. Local polarization electric field promoted the active sites formation on the piezo-photocatalytic BaCaBO3F containing OVs and N doping to effectively degradation of oxytetracycline in water. Sep. Purif. Technol. 2025, 361, 131637. [Google Scholar] [CrossRef]
  30. Zhao, E.; Yang, S.; Zhou, Z.; Deng, Y.; Qi, X.; Liu, Y.; Liu, L.; Yang, C.; Lan, Y.; Zhao, B.; et al. Oxygen vacancy-enhanced piezo-photocatalytic for tetracycline hydrochloride degradation in wastewater and H2 evolution. J. Colloid Interface Sci. 2025, 686, 359–366. [Google Scholar] [CrossRef]
  31. Wang, N.; Yang, W.H.; Wang, R.X.; Li, Z.R.; Xu, X.F.; Long, Y.Z.; Zhang, H.D. Oxygen Vacancy-Enhanced Centrosymmetric Breaking of SrFeO3−x for Piezoelectric-Catalyzed Synthesis of H2O2. Small 2023, 20, e2307291. [Google Scholar] [CrossRef] [PubMed]
  32. Tang, Y.; Zhou, W.; Shang, Q.; Guo, Y.; Hu, H.; Li, Z.; Zhang, Y.; Liu, L.; Wang, H.; Tan, X.; et al. Discerning the mechanism of expedited interfacial electron transformation boosting photocatalytic hydrogen evolution by metallic 1T-WS2-induced photothermal effect. Appl. Catal. B Environ. 2022, 310, 121295. [Google Scholar] [CrossRef]
  33. Ren, M.; Zhao, P.; Fu, X.; Liu, M.; Ning, Y.; Zhang, Y.; Wang, C.; Lin, A.; Cui, J. Phase-modulated built-in electric field to boost photogenerated electron migration for efficient dehalogenation. Chem. Eng. J. 2023, 474, 145524. [Google Scholar] [CrossRef]
  34. Yin, M.; Wang, K.; Gao, C.; Yang, R.; Huang, Y.; Yu, L. Synthesis and insights into the gas sensing mechanisms of N-doped MoS2 hierarchical structures with superior gas sensing properties at room temperature. Mater. Res. Bull. 2024, 179, 112943. [Google Scholar] [CrossRef]
  35. Lee, C.; Yan, H.; Brus, L.E.; Heinz, T.; Hone, J.; Ryu, S. Anomalous Lattice Vibrations of Single- and Few-Layer MoS2. ACS Nano 2010, 4, 2695–2700. [Google Scholar] [CrossRef]
  36. Xu, X.; Robertson, S.J.; Yang, T.; Chen, F.; Geng, X.; Wang, Y.; Ji, F.; Sun, C.; Chen, S.; Shao, M.; et al. Interfacial space charge design with desired electron density to enhance sodium storage of MoS2@Nb2O5 anode. Nano Energy 2024, 127, 109739. [Google Scholar] [CrossRef]
  37. Meng, L.; Zhao, C.; Chu, H.; Li, Y.H.; Fu, H.; Wang, P.; Wang, C.C.; Huang, H. Synergetic piezo-photocatalysis of g-C3N4/PCN-224 core-shell heterojunctions for ultrahigh H2O2 generation. Chin. J. Catal. 2024, 59, 346–359. [Google Scholar] [CrossRef]
  38. Jang, E.; Ahn, J.; Yoon, S.; Cho, K. High Dielectric, Robust Composite Protective Layer for Dendrite-Free and LiPF6 Degradation-Free Lithium Metal Anode. Adv. Funct. Mater. 2019, 29, 1905078. [Google Scholar] [CrossRef]
  39. Su, Q.; Li, J.; Yuan, H.; Wang, B.; Wang, Y.; Li, Y.; Xing, Y. Visible-light-driven photocatalytic degradation of ofloxacin by g-C3N4/NH2-MIL-88B(Fe) heterostructure: Mechanisms, DFT calculation, degradation pathway and toxicity evolution. Chem. Eng. J. 2022, 427, 131594. [Google Scholar] [CrossRef]
  40. Tu, S.; Wang, Y.; Huang, H.; Zhang, J.; Li, H.; Sun, J.; Chen, T.; Zhang, Y. Band shifting triggered ·OH evolution and charge separation enhanced H2O2 generation in piezo-photocatalysis of Silleń-Aurivillius-structured Bi4W0.5Ti0.5O8Cl. Chem. Eng. J. 2023, 465, 142777. [Google Scholar] [CrossRef]
  41. Liu, M.; Ning, Y.; Ren, M.; Fu, X.; Cui, X.; Hou, D.; Wang, Z.; Cui, J. Internal Electric Field-Modulated Charge Migration Behavior in MoS2/MIL-53(Fe) S-Scheme Heterojunction for Boosting Visible-Light-Driven Photocatalytic Chlorinated Antibiotics Degradation. Small 2023, 19, e2303876. [Google Scholar] [CrossRef]
  42. Guo, R.; Zhang, X.; Chen, Y.; Zhang, Y. Internal Electric Field-Induced High-Efficiency Piezo-Photocatalytic Performance in Bimetal-Regulated Layered Perovskite SrBi2Nb2O9. Adv. Funct. Mater. 2024, 34, 2408838. [Google Scholar] [CrossRef]
  43. Zhang, C.; Lei, D.; Xie, C.; Hang, X.; He, C.; Jiang, H. Piezo-Photocatalysis over Metal-Organic Frameworks: Promoting Photocatalytic Activity by Piezoelectric Effect. Adv. Mater. 2021, 33, e2106308. [Google Scholar] [CrossRef]
  44. Lin, K.; Zhu, Z.; Ge, W.; Jiang, T.; Huang, H. Atomic-level unveiling secondary recrystallization enabled micro- and macroscopic polarization enhancement for piezo-photocatalytic oxygen activation. Nano Res. 2024, 17, 5040–5049. [Google Scholar] [CrossRef]
  45. Zhang, G.; Li, D.; Liu, M.; Wang, Y.; Zhang, J.; Zhang, Y.; Liu, H.; Li, W.; Li, Z.; Lv, W.; et al. Non-noble plasmonic TiN modified BiOBr for the piezo-photocatalytic removal of sulfisoxazole: Simultaneous improvement of photocatalytic and piezoelectric properties. Sep. Purif. Technol. 2024, 337, 126358. [Google Scholar] [CrossRef]
  46. Liang, Q.; Liu, X.; Shao, B.; Tang, L.; Liu, Z.; Zhang, W.; Gong, S.; Liu, Y.; He, Q.; Wu, T.; et al. Construction of fish-scale tubular carbon nitride-based heterojunction with boosting charge separation in photocatalytic tetracycline degradation and H2O2 production. Chem. Eng. J. 2021, 426, 130831. [Google Scholar] [CrossRef]
  47. Du, S.; Sui, M.; Guo, Y.; Tian, Y.; Lv, X.; Qi, X. MoS2/SrTiO3 composite for piezocatalysis and piezocatalytic activation of peroxymonosulfate for efficient degradation of sulfamethoxazole. J. Water Process Eng. 2024, 60, 105120. [Google Scholar] [CrossRef]
  48. Wu, Z.; Song, W.; Xu, X.; Yuan, J.; Lv, W.; Yao, Y. High 1T phase and sulfur vacancies in C-MoS2@Fe induced by ascorbic acid for synergistically enhanced contaminants degradation. Sep. Purif. Technol. 2022, 286, 120511. [Google Scholar] [CrossRef]
  49. Ren, T.; Tian, W.; Shen, Q.; Yuan, Z.; Chen, D.; Li, N.; Lu, J. Enhanced piezocatalysis of polymorphic few-layered MoS2 nanosheets by phase engineering. Nano Energy 2021, 90, 106527. [Google Scholar] [CrossRef]
Figure 1. (a) Schematic illustration of the synthesis of MoS2 and N-MoS2-x catalysts; (b,c) SEM images of MoS2 at different magnifications; (d,e) SEM images of N-MoS2-3 at different magnifications; (fh) EDS elemental mappings of N, S, and Mo of N-MoS2-3; (i) HRTEM images of MoS2; and (j) HRTEM images of N-MoS2-3.
Water 17 01296 g001
Figure 2. (a) Raman spectra and (b) XRD patterns of MoS2 and N-MoS2-x catalysts. (c) Survey spectra and high-resolution scans of the (d) Mo 3d; (e) S 2p; and (f) N 1s of MoS2 and N-MoS2-x.
Water 17 01296 g002
Figure 3. (a) UV–Vis spectra of the as-prepared photocatalysts. (b) Tauc plots of the as-prepared photocatalysts. (c) The energy band positions of the as-prepared photocatalysts.
Water 17 01296 g003
Figure 4. (a) The transient photocurrent densities in response to the simulated light. (b) EIS Nyquist curves of the as-prepared photocatalysts under visible-light irradiation. (c) Built-in electric field scanning at the rate of 0.2 V·s−1 under visible-light irradiation.
Water 17 01296 g004
Figure 5. Piezoelectricity measurements of MoS2 and N-MoS2-3: (a,e) morphology picture, (b,f) amplitude picture, (c,g) phase picture, and (d,h) amplitude and phase curves.
Water 17 01296 g005
Figure 6. Piezoelectricity measurements of MoS2 and N-MoS2-3. (a) The variation in the piezoelectric-induced Jpiezo under 480 W ultrasonic action. (b) Variations in the current signals in response to the on/off visible-light irradiation and 480 W ultrasonic action. (c) Built-in electric field scanning at the rate of 0.2 V·s−1 under 480 W ultrasonic action.
Water 17 01296 g006
Figure 7. The performance of degradation under varying conditions: (a) under visible-light irradiation, (b) under 480 W ultrasonic action, and (c) under visible-light irradiation and 480 W ultrasonic action. (d) Apparent first-order rate constants corresponding to various influencing factors (pH, TC concentration, and ultrasonic power). (e) Five cyclic experiments of photocatalytic removal of TC by N-MoS2-3. (f) TC removal in diverse water matrices.
Water 17 01296 g007
Figure 8. EPR signals of MoS2 and N-MoS2-3 under different conditions: (a,d) DMPO-•OH, (b,e) DMPO-•O2, and (c,f) TEMP-1O2. (g) Determination of quencher concentration for gradient quenching experiments.
Water 17 01296 g008
Figure 9. Piezo-photocatalysis mechanism in the N-MoS2-3 system.
Water 17 01296 g009
Disclaimer/Publisher’s Note: The statements, opinions and data contained in all publications are solely those of the individual author(s) and contributor(s) and not of MDPI and/or the editor(s). MDPI and/or the editor(s) disclaim responsibility for any injury to people or property resulting from any ideas, methods, instructions or products referred to in the content.

