Article

Heavy Metals in Sediments of the Yangtze River, Poyang Lake and Its Tributaries: Spatial Distribution, Relationship Analysis and Source Apportionment

1
School of Economics and Management, Jining Normal University, Ulanqab 012000, China
2
College of Water Sciences, Beijing Normal University, Beijing 100875, China
3
School of Chemical and Environmental Engineering, China University of Mining and Technology (Beijing), Beijing 100083, China
4
Department of Ecology and Environment of Xinjiang Uygur Autonomous Region, Urumqi 830000, China
*
Authors to whom correspondence should be addressed.
These authors contributed equally to this work.
Water 2025, 17(9), 1295; https://doi.org/10.3390/w17091295
Submission received: 23 March 2025 / Revised: 19 April 2025 / Accepted: 23 April 2025 / Published: 26 April 2025
(This article belongs to the Section Water Quality and Contamination)

Abstract

:
The concentration, spatial distribution characteristics, river–lake relationship analysis and source apportionment of heavy metals in the sediments of the Yangtze River, Poyang Lake and its tributaries were studied in this work. Heavy metals were detected more frequently in the sediments of the Yangtze River compared with the sediments of Poyang Lake and its tributaries. V, Cr, Pb and Ni were the dominant heavy metals in Poyang lake, with V being the most abundant in the lower Yangtze River, Poyang Lake and its tributaries. As, Cu, Ni and V showed similar distribution patterns, with a fan-shaped increasing trend in the southwestern area of Poyang Lake. The spatial distribution of Cr, Hg, Pb and Cd showed a large spatial variability with a decreasing distribution from the northwest to the southeast of the lake. The heavy metals in the sediments of Poyang Lake are related to those in its tributaries. The organic matter, oxidation-reduction potential and depth of sediments are correlated with the heavy metals in sediments. Mining, industrial and road traffic sources were the main sources of heavy metals in the study area. Except for Cd and Hg, most heavy metals in Poyang Lake exhibited a low ecological risk in an environmental evaluation. The results of this study might guide future studies on heavy metals in the sediments of Poyang Lake.

1. Introduction

Recent accelerating socioeconomic development and industrialization result in heavy metal pollution, which has become an important environmental issue globally [1]. The contamination of aquatic environments by heavy metals is of increasing concern due to their toxicity, persistence and bioaccumulation properties [2]. These characteristics enable heavy metals to disrupt microbial communities, inhibiting the growth of aquatic plants. Through bioaccumulation and biomagnification in the food chain, these pollutants can ultimately pose a threat to human health and ecosystem stability [3,4,5]. Heavy metals in sediments are sourced from natural sources (physical and chemical weathering of parent rocks, etc.) and anthropogenic sources (municipal wastewater, fertilizer runoff, etc.) [6,7,8].
Natural sediments form an important component of water bodies and can act as a record of environmental changes within that water body and the catchment more generally, such as changes related to climate and eutrophication. Therefore, lake sediments can be used to reconstruct the pollution history of a lake [9]. Heavy metals are mainly transported into water systems by particulate matter, after which they are deposited in sediments. However, these metals stored in sediments can be released back into the water in various ways under suitable conditions [10]. Therefore, sediment can act as a form of secondary heavy metal pollution [11]. These released metals might migrate into the food chain, ultimately entering the human body and resulting in chronic or acute diseases [12]. Therefore, natural sediments of water bodies can act as both a source and a sink of heavy metals and other contaminants in aquatic environments [13,14].
Lakes provide a variety of ecosystem services, including water circulation, climate regulation, habitat provision for aquatic organisms and important freshwater resources [15,16]. Heavy metal contamination of lakes greatly affects the lake ecological structure and function, with risks extending to surrounding organisms and human populations. Recent studies on major lake ecosystems worldwide, including Lake Victoria, Lake Dian, Lake Hulun and Lake Tasaul, suggest that heavy metal contamination may potentially compromise ecosystem functions [17,18,19,20]. Therefore, there is an important need for an increased focus on heavy metal pollution in lakes [10]. Poyang Lake, the largest freshwater lake in China, is also the largest through-river lake in the Yangtze River Basin [21]. The lake is characterized by drastic annual changes in its water level and water surface area [22]. Poyang Lake can be described as a typical overwater, throughput seasonal lake, characterized by seasonal high water–low water cycles [23]. Poyang Lake and its contributing catchment are essential to the regional development of Jiangxi Province and for the water supply of millions of people downstream [24].
The objectives of the current study were to investigate: (1) the concentration and composition of heavy metals in surface sediments from various sections of Poyang Lake, its tributaries, and the Yangtze River; (2) the distribution across space of heavy metals in the sediments of Poyang Lake and their relationships with human activities and geochemical variables; (3) the relationship between the Yangtze River, Poyang Lake and its tributaries; and (4) the potential sources of heavy metals in surface sediments of different sections of the lake.

2. Materials and Methods

2.1. Sampling and Preparation Methods

Figure 1 shows the locations of sample sites in the study area. Based on the topography of Poyang Lake basin, unique hydrological conditions, the influence of its tributaries (Gan River, Xiu River, Rao River, Fu River and Xin River) and the Yangtze River, on-site exploration and the results of correlation analyses among sampling points, the basin is spatially divided into three main areas, namely A, B and C. Section A is the northern part of Poyang Lake, which located in the north area of black line (Figure 1) and might be influenced by the Yangtze River, including 12 sampling points. Section B is the main lake area and may be influenced by the Gan River, including 21 sampling points. Section C is the remaining sampling site, including 16 sampling points, which located in the east area of green line (Figure 1). Sediment samples were collected from Poyang Lake (n = 49), its tributaries (n = 9) and the Yangtze River (n = 6) during the normal season (April 2021 and April 2023) and the wet season (July 2021) of Poyang Lake. Samples of surface sediment were collected at a depth of 2 cm using a stainless-steel sampler (JDHC-200A, Jintan, Changzhou, China). Each collected sample was immediately transferred to a clean and labeled polyethylene sample bag. Samples were then transported as soon as possible to the laboratory, where the samples were processed to remove sand, gravel, and plant roots and stored at 4 °C until further analysis.
Sediment samples were pre-treated by freeze-dried for 48 h in an FD-1A-50+ freeze-dryer (Biocool, Beijing, China). The obtained samples were uniformly ground in an agate mortar and then passed through a 50-mesh stainless steel sieve to remove large particles of material, such as stones and roots. The sieved samples were placed in wide-mouth brown glass vials, which there then sealed and transferred to a refrigerator for storage at −20 °C.

2.2. Analytical Methods

The metal concentrations (Ca, K, Fe, Zn, Cu, Pb, Hg, As, Ni, Cd, Mn) of the samples were measured using an X-MET8000 X-ray fluorescence spectrometer (Hitachi, Shanghai, China), and were measured in triplicate for each sample. For QA/QC, an internal calibration method was employed to quantify heavy metal concentrations. The instrument’s built-in energy calibration module was used for quality assurance and control, with each measurement lasting 15 s. The position of the FeKa peak was checked to ensure it was centered at the highest peak. If centered, no energy calibration was needed. Otherwise, calibration was performed. Energy calibration was conducted every five samples to ensure data accuracy and reliability.
Physicochemical variables of bottom water samples co-collected with sediment samples at the sediment–water interface, including temperature (T), pH, dissolved oxygen (DO) and oxidation-reduction potential (ORP) at the same point, were measured using a multiparameter water quality analyzer (Horiba U-50, Tokyo, Japan). Sediment organic matter (SOM) was determined using the burned weight loss method, calculated as follows:
SOM % = M 1 - M 2 M 1 - M 0 × 100
where M0 is the weight of the crucible dried to constant weight in an oven at 105 °C and cooled to room temperature. M1 is the weight of a 5.00 g sediment sample and crucible after being dried to constant weight in an oven at 105 °C and cooling to room temperature. M2 is the weight of the sample and crucible after placement in a muffle furnace for 2–3 h (450 °C) and cooling to room temperature.
The particle size of the sediment samples was determined using a laser particle size analyzer (Mastersizer 2000, Malvern, UK) capable of conducting particle size measurements in the range of 0.02–2000 μm with an error of <5% for the parallel analysis of the samples. Sample particles were categorized by size into the following categories: clay (<4 μm), silt (4–63 μm) and sand (>63 μm).

2.3. Statistical Analysis

Positive matrix factorization (PMF) is a widely used multivariate factor analysis method for the source apportionment of environmental pollutants [25,26]. EPA PMF 5.0 software was used to clarify the heavy metals sources in the surface sediment of Poyang Lake according to the following equation:
X i j = k = 1 p g ik f kj + e ij
where Xij represents the concentration of the jth heavy metal at the ith sampling site; gik is the contribution of the kth source to the ith sample; fkj represents the concentration of the element j from source k; and eij is the residual error matrix.
The uncertainties for each sample was calculated by an equation-based uncertainty file in EPA PMF 5.0, according to Equation (3) (C ≤ MDL) and Equation (4) (C > MDL):
U = 5 6 MDL
U = ( EF ×   C ) 2 + ( 0.5 × MDL ) 2
where U represents the relative uncertainty; C represents the measured values of heavy metals; MDL is the method detection limit; and EF represents the error fraction. The distribution across space of sediment heavy metals was plotted using Kriging spatial interpolation analysis in ArcGIS 10.8 software. Pearson correlation analysis was conducted in IBM SPSS Statistics 25 to investigate the relationships between the rivers and the lake [27].

3. Results and Discussion

3.1. Occurrence and Composition of Heavy Metals in Surface Sediments

The concentration ranges of the eight heavy metals (Pb, Cd, As, Hg, Cr, V, Cu and Ni) and their frequencies of detection in the surface sediment samples are summarized in Table 1 and Table 2. The highest maximum concentrations of six heavy metals (Pb, As, Hg, V, Cu and Ni) were found in the surface sediments of Poyang Lake, followed by its tributaries, the Upper Yangtze River and the Lower Yangtze River. By comparing with the sediment quality guidelines (SQG) standards (Table S15), the average concentrations of Pb, Cd, As, Cr, V, Cu and Ni fall between the threshold effect concentration (TEC) and the probable effect concentration (PEC), indicating that the pollution levels are within a potential risk range [28]. The frequency of detection of heavy metals in the sediment of the Yangtze River exceeded that in Poyang Lake and its tributaries. As shown in Figure S1, the heavy metals detected at the highest concentrations were V, Cr, Pb and Ni, accounting collectively for over 79.0% of total heavy metals concentrations in all assessed water bodies. The mean concentrations of heavy metals in the sediment of different lake systems are summarized in Table S1 [29,30,31,32,33]. The average concentrations of Pb, Cd and Ni increased, while the concentrations of Cr and Cu decreased, compared to a previous article about Poyang Lake [21]. The concentrations of heavy metals (except for Cr) in Poyang Lake had similar levels to those of Chaohu Lake (Table S1) [34], which is also one of the five largest freshwater lakes in China. Both Chaohu Lake and Poyang Lake are important lakes connected to the Yangzte River. The average concentrations of heavy metals (except Cr) in Poyang Lake were much higher than those in Lake Victoria (Table S1) [35], the largest lake in Africa and the second-largest freshwater lake in the world. This disparity may be attributed to the fact that Lake Victoria has fewer tributaries and is subject to relatively lower levels of human activity.

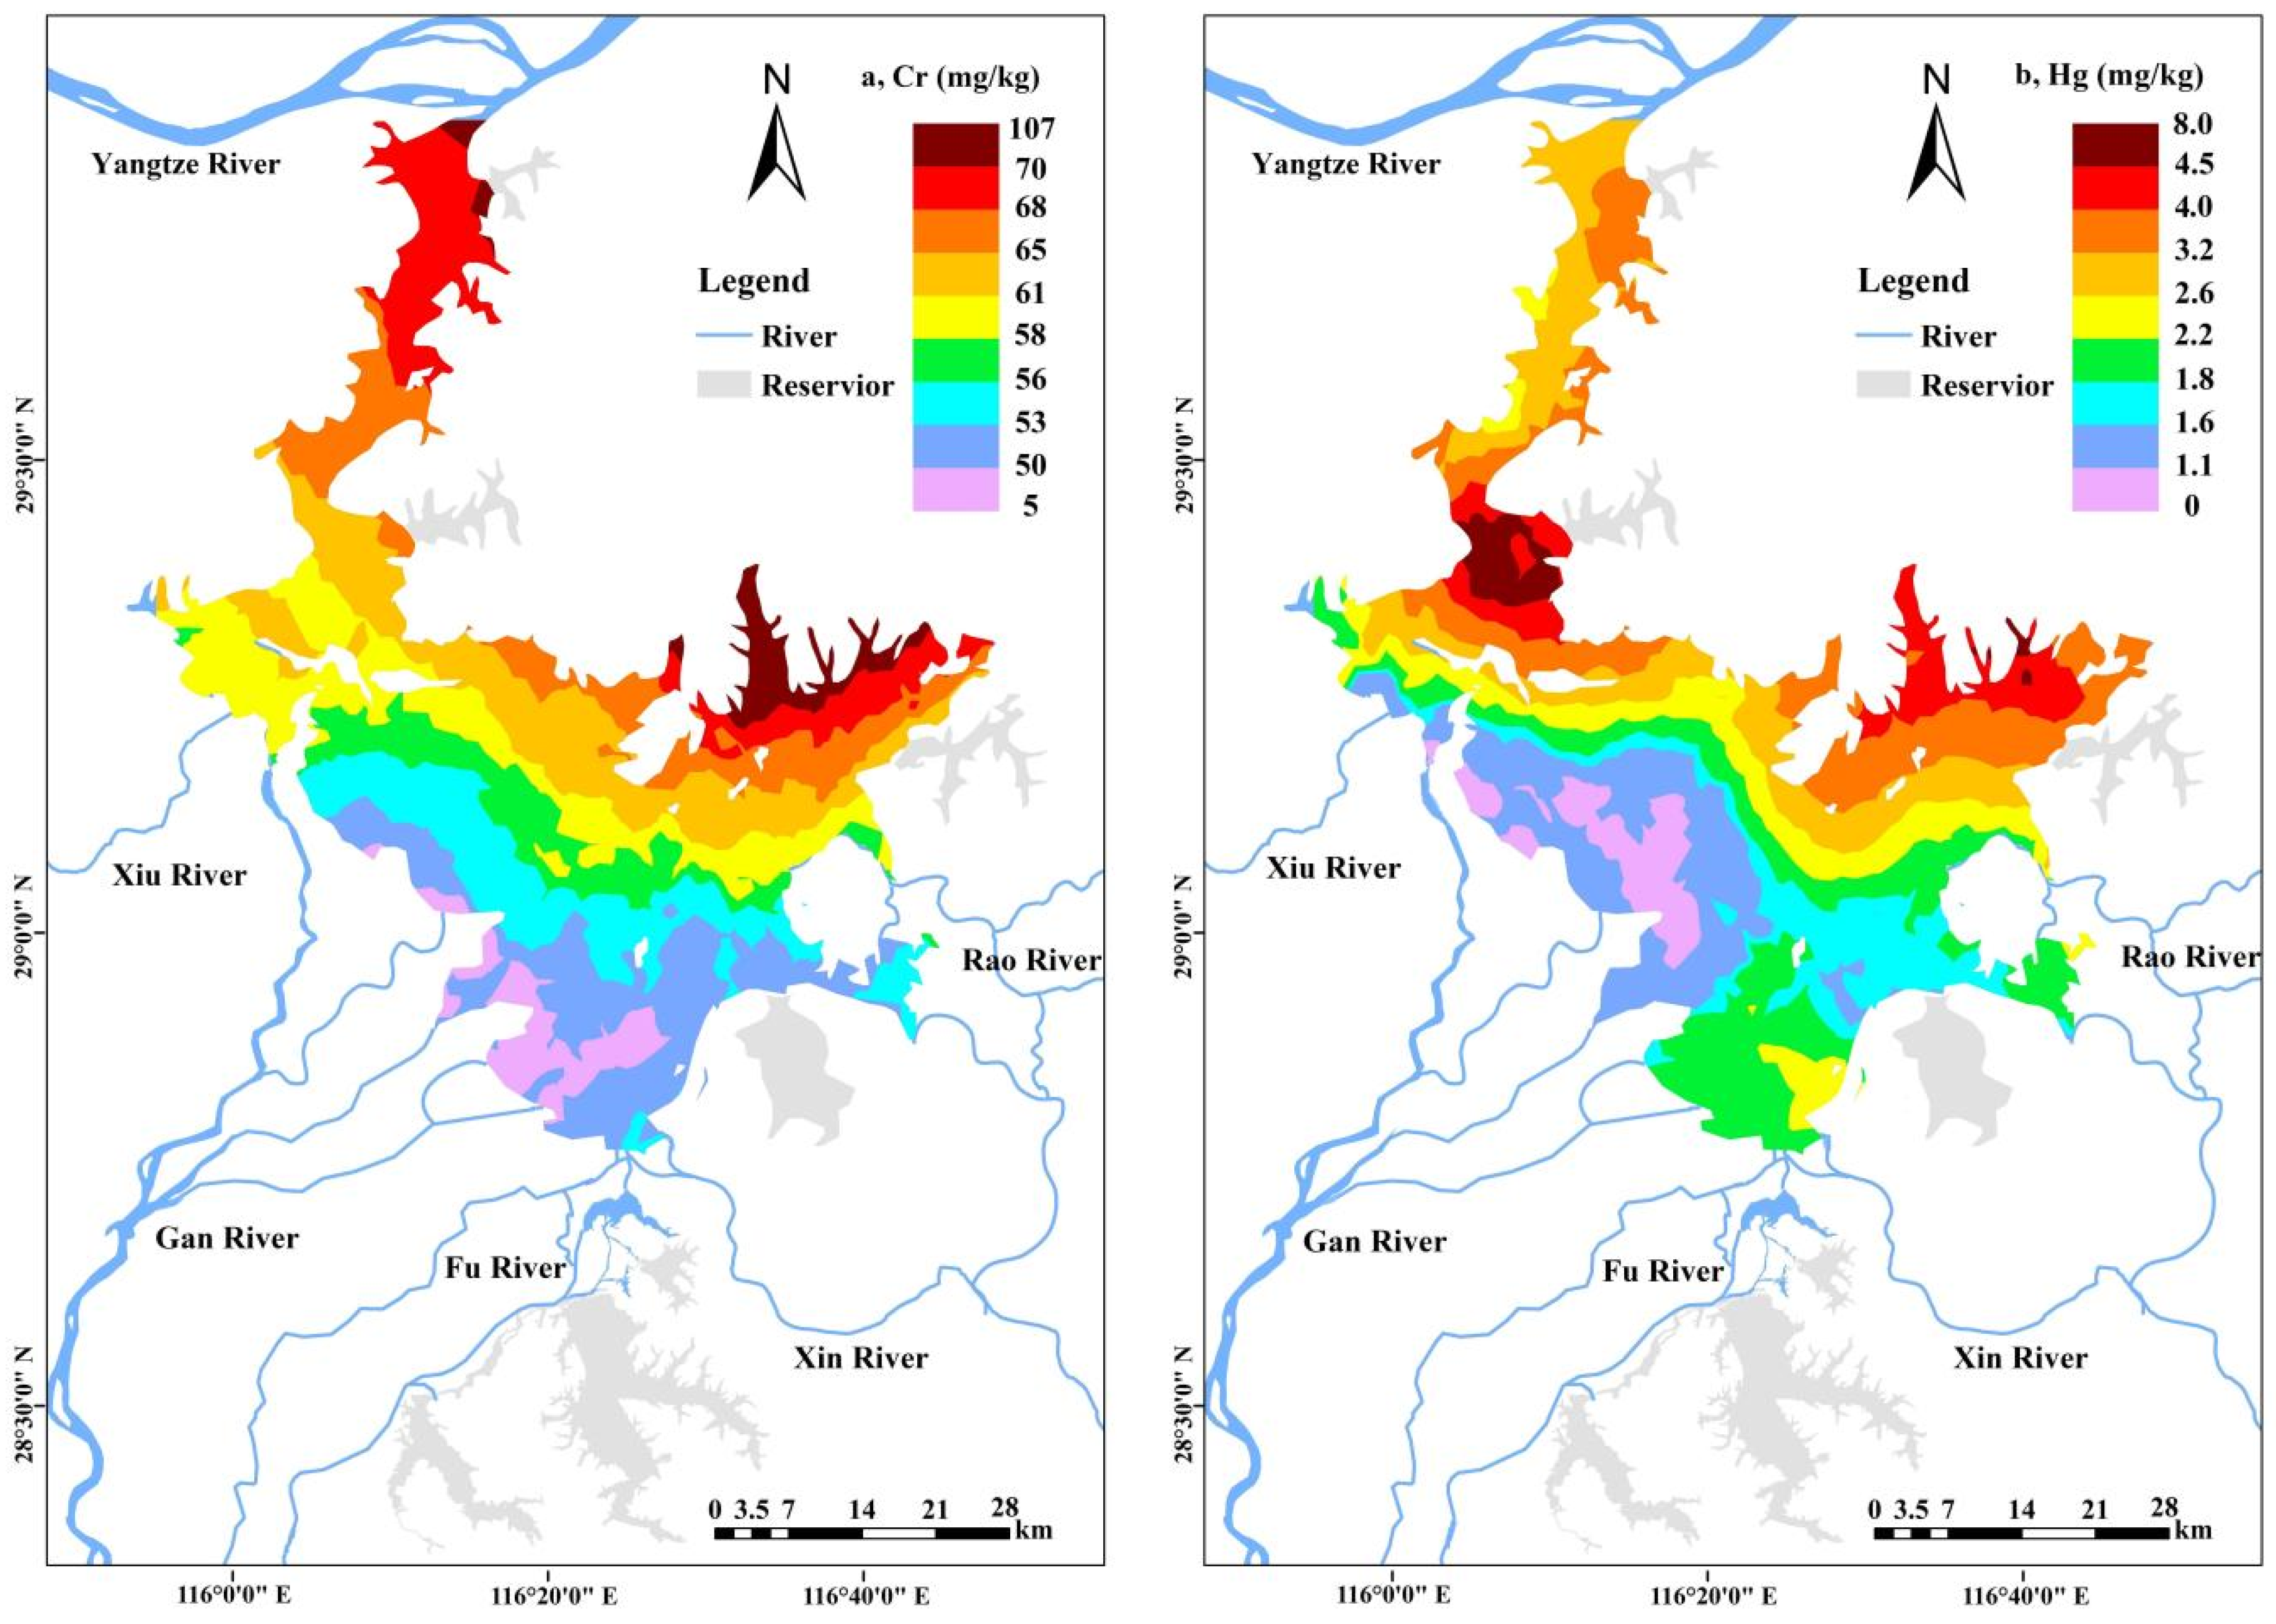
3.2. Spatial Distribution of Heavy Metals in Surface Sediments

Heavy metal concentrations in sediment samples varied significantly among the different sampling sites. The average concentrations of the eight heavy metals in the different sections of the lake are summarized Table S2. The concentrations of five heavy metals (Ni, V, Cr, Hg and Cd) in the sediments of Poyang Lake followed the same order: Section A > C > B. The distribution patterns of sediment heavy metal concentrations in the study area were generated using geographic information system (GIS) techniques, as illustrated in Figure 2, Figure 3 and Figure 4.
The Cu concentrations in Poyang Lake increased from the southwest (i.e., adjacent to the three inlets of Gan River) with fan shapes according to Figure 2a, and the high concentrations (hot spots) were located in the northeast area. The average sediment Cu concentrations of Sections C and A of the lake exceeded that of Section B by 55.2% and 27.9%, respectively. The average concentration of Cu in Section B of Poyang Lake was 19.4% higher than that of the major inlet contiguous river, the Gan River. The Gan River is the largest tributary of Poyang Lake in terms of runoff (~6.8 × 10¹¹ m3/a) and sediment load (~8.9 × 10⁶ tons/a), accounting for 45.9% and 52.4% of the total inputs into Poyang Lake, respectively. The Gan River separates into several branches from southwest to northeast before merging into Poyang Lake, in a distribution similar to the fan-shaped increasing heavy metal concentrations distribution trend of the lake. The concentration difference between Gan River and different lake sections, the large runoff and the flow direction of the Gan River might contribute to the fan-shaped distribution of increasing sediment heavy metals from the southwest to the northeast in Poyang Lake [36]. The highest Cu concentration was observed in the northeastern part of the lake in Section C. The sediment Cu concentration of the Rao River exceeded those of Section B of Poyang Lake and other tributaries. It is noteworthy that the concentration of Cu in the Rao River was 52.5% higher than that in the Gan River. Rao River runoff passes through several metal mines in its midstream [37]. The famous one is Dexing Copper Mine [38], which is the largest open-pit copper mine in Asia, and high levels of heavy metals such as Cu, Zn and As have been found in its environment [39].
The As, Ni and V concentrations also increased from the southwest with fan shapes, and the high concentration (hot spot) is located in the northeast of Poyang Lake according to Figure 2b–d. The average concentrations of As, Ni and V in Sections A and C exceeded those in Section B, which in turn exceeded those in the Gan River. The concentrations of As, Ni and V in the Rao River exceeded those in Section B and in the Gan River. Water was still resident in Section C of Poyang Lake during the dry season according to Figure S2. The northeastern area is relatively semi-closed, and is surrounded by several islands such as Changshan and Xiashan Islands. This unique topography results in long hydraulic residence times for heavy metals in Section C and limited water exchange with surrounding areas [40]. Concentrations of heavy metals tend to increase in this area of the lake due to evaporative concentration and seasonal tidal action. The notably elevated heavy metal contamination in Section C and adjacent northern areas likely stems from industrial wastewater discharges originating from mining, metallurgical and electroplating operations in Duchang County. This spatial pattern aligns with our previous findings documenting elevated PAH concentrations in the same region (Figure S3) [41]. Redundancy analysis (RDA) revealed significant correlations between PAHs and heavy metals (Figure 3), implying a potential common origin from anthropogenic sources. The sediment samples from site C16 exhibited distinct noxious odors, which indicated severe pollution of this site according to field observations.
The concentration distribution of Cr showed an increasing trend from the south to the north of Poyang Lake, as seen in Figure 4a. The highest Cr concentration was located in Section C of the lake. The Cr concentration of Rao River exceeded that of Section B of Poyang Lake as well as that of the Gan River by 65.3%. Higher concentrations of sediment Cr were also observed at the junction of Sections A and B. The Cr concentrations in the Xiu River significantly exceeded those in Poyang Lake and other tributaries, except for the Fu and Xin Rivers. The confluence of Xiu River might account for the high Cr concentration in this area. Hg showed a similar distribution pattern to that of Cr, i.e., the concentration increased from south to north in the lake, as seen in Figure 4b. The highest Hg concentration was observed at the junction of Sections A and B.
The Pb and Cd distribution patterns demonstrated significant spatial variation with an irregular shape (Figure 5). Higher concentrations of Pb and Cd were observed in the central-northern part of Poyang Lake. This distribution can possibly be attributed to additional anthropogenic sources of these metals, including non-point sources [21]. It is interesting that the concentrations of Pb in the eastern part of Poyang Lake were low, in contrast to distribution patterns observed for other metals. The concentrations of Pb in the Rao River, a contiguous river in this area, were slightly lower than in the lake and other tributaries. It is noteworthy that Cd concentrations were also high in the southern part of Poyang Lake, which is possibly attributable to higher sediment Cd concentrations of the Fu River and Xin River tributaries, which enter the lake in this region.

3.3. Relationship Analysis

The relationship of heavy metals in Poyang Lake and its five tributaries was elucidated using SPSS and is listed in Tables S3–S9. There were significant positive correlations between almost all sampling sites in Section A, with correlation coefficients ranging from 0.8360 to 0.9980 (p < 0.01). Similarly, there were strong positive correlations between almost all sampling sites of Sections B and C, with the correlation coefficients of 0.8360–0.9960 (p < 0.01) and 0.8430–0.9970 (p < 0.01), respectively. The results of a Pearson correlation analysis among the eight studied heavy metals are summarized in Figure 6. There were positive correlations (p < 0.01) among most of the heavy metals except for Cd, indicating that most sediment heavy metals sourced from the same sources. Cd showed a different pattern. Although Cd and Zn commonly coexist in nature due to their similar chemical properties [42], the results indicate that Cd in the Poyang Lake region may have additional anthropogenic sources. Specifically, industrial activities such as wastewater discharge from smelters, textile dyeing and printing mills, and chemical plants, as well as agricultural practices involving the use of fertilizers and pesticides, are likely significant contributors of Cd to the lake sediments.
The sediment heavy metals of the Gan River showed strong positive correlation with those of around 38.1% of sampling sites in Section B, with correlation coefficients of 0.9910–0.9990 (p < 0.01). The relationship of heavy metals between the sampling sites in the Gan River and the representative sampling sites of Poyang Lake is shown in Figure S4a. The heavy metals of the three branches of the Gan River showed positive correlations with most sampling sites in Section B, illustrated by the light-red to deep-red color in Figure S4a. This result is reasonable, since Cu, As, Ni and V in Figure 2 as well as Cr and Hg in Figure 4 showed similar spatial distributions in the surface sediments of the southwestern area of Poyang Lake.
Figure S4a shows the positive correlations between sampling sites of Poyang Lake and the Gan River, with sediment heavy metal concentrations of the Gan River influencing those of around 48.1% of Poyang Lake. This result is consistent with runoff entering the lake from the Gan River accounting for ~53.4% of the lake. The influence of the Gan River on the lake explains the fan-shaped distributions of increasing sediment concentrations of the six heavy metals in southwestern Poyang Lake (Figure 2 and Figure 4).
The sediment heavy metals of Rao River showed strong positive correlations with those of 23.8% of sampling sites in Section B, with correlation coefficients of 0.9910–0.9990 (p < 0.01), and with 12.5% of sampling sites in Section C, with correlation coefficients of 0.9970–0.9990 (p < 0.01). Runoff from the Rao River into the lake of ~1.4 × 10¹¹ m3/a accounts for ~11.3% of the lake. As shown in Table S9, the Rao River influenced sediment heavy metal concentrations at ~14.3% of sampling sites in Poyang Lake, which is consistent with its runoff contribution to the lake. The Fu River influenced sediment heavy metal concentrations at ~14.3% of sampling sites in Section B, with correlation coefficients of 0.9960–0.9980 (p < 0.01), which is consistent with the runoff contribution of this river to the lake at 12.3%. The Xiu River influenced sediment heavy metal concentrations at 12.2% of sampling sites in the lake (correlation coefficients of 0.9930–0.9990; p < 0.01; Table S6), mainly in Sections A and B, which is consistent with the runoff contribution of Xiu River to the lake of 8.9%. Therefore, the influences of the various tributaries (the Xin, Fu and Xiu Rivers) on heavy metal concentrations were consistent with their relative contributions to the total runoff to the lake, as indicated by the results of the Pearson correlation analysis (Tables S6–S8).
There were significant relationships between heavy metals in the lower Yangtze River and those in Section A of Poyang Lake, with correlation coefficients of 0.9910–1.000 (p < 0.01). Figure S4b illustrates the relationships between heavy metals at sampling sites in the Yangtze River and those in sites in Poyang Lake. The shading of light red to deep red in Figure S4b illustrates the strong relationships between sampling sites of the lower Yangtze River and Section A of Poyang Lake. Figure S4b also shows no clear relationships between sediment heavy metals of the upper Yangtze River and most of the sampling sites in Section A. This result can be considered reasonable, since Poyang Lake converges into the lower reaches of the Yangtze River. In addition, the runoff of the Yangtze River backing up into Poyang Lake of ~2.7 × 10¹⁰ m3/a has an impact on the Yangtze River estuary at Poyang Lake. There were no significant correlations between the heavy metals at the sampling sites in the upper and lower Yangtze River and those of sites B1 in Section B and C1 in Section C. Therefore, the lower Yangtze River mainly affected Section A in the lake.
Redundancy analysis (RDA, Figure 7) and correlation analysis (Table S19) were applied to investigate the principal factors that influence the heavy metal distribution in sediments of Poyang Lake. A correlation analysis (Table S16) revealed significant relationships between Mn, Zn and Fe with all analyzed heavy metals (except Cd), suggesting that these elements may share a common origin. Additionally, significant correlations were observed between Cu/As and SOM. There were strong correlations between sediment Pb, Hg, Cr and Ni concentrations as well as between these four metals and Fe (the orange triangle in Figure 7). This result suggests that these four metals may come from the same sources. There were strong correlations between As, Cu and V as well as between Zn and Mn and SOM, the ORP of sampling sites, and water depth (the green triangle in Figure 7). Cd was not included in these relationships, since it showed a different spatial distribution. Since SOM can participate in the complexation and chelation of sediment heavy metals and may alter the chemical form of heavy metals, SOM affects the transport, bioavailability and toxicity of heavy metals in the environment. Therefore, SOM can regulate the accumulation of sediment heavy metals. This linkage may explain the strong correlations between most heavy metals and SOM [43]. Most heavy metals in the lake were also positively correlated with ORP. This can be attributed to changes in ORP directly or indirectly affecting the metal valence state and existing forms, which translates to changes in their toxicity, activity and environmental behavior [44]. The water depth of the different sampling sites also had an influence on sediment heavy metals. This is because water depth regulates runoff dynamics and velocities, thereby controlling the residence times of heavy metals in water [45]. There is a negative correlation between the water quality index parameter DO and heavy metals, and the effect of DO on heavy metals is mainly reflected in its ability to change the reducibility of sediments. With an increase in DO, the release of heavy metals in the sediments increases, and their valence states tend to stabilize [46]. There is a positive correlation between the water quality indicator pH and heavy metals, and the effect of pH on heavy metals is mainly manifested in its ability to change the valence state and existing forms of heavy metals in sediments. It was found that with an increase in pH, the release of heavy metals in sediments decreases and the existing forms are more likely to form insoluble compounds or complexes. All sediment heavy metals showed negative correlations with salinity and grain size. This result indicates that lower salinity [47] and finer sediment grains enhance the accumulation of contaminants in sediment.

3.4. Source Apportionment of Sediment Heavy Metals

As shown in Figure S5, the results of the PMF source analysis of Section A identified four factors with higher contributions to sediment heavy metals. The dominant elements in Factor 1 of the PMF analysis were Cd (100%), Pb (42%), Cr (21%),and Ni (20%), whereas there were limited effects on Hg and As. The dominant elements in Factor 2 were Cu (48%), Cr (35%), V (40%) and Ni (29%), whereas concentrations of Cd and As had lower contributions. The major elements in Factor 3 were Hg (53%), As (18%), Pb (22%), Cr (34%) and Ni (17%), whereas Cd and V showed lower contributions. The dominant elements of Factor 4 were As (69%), V (32%), Ni (32%) and Cu (22%).
The results of the PMF source analysis of Section B showed that five factors mostly explained sediment heavy metal concentrations (Figure S6). The dominant elements of Factor 1 were Pb (25%), Cr (20%) and Ni (14%), whereas V and Cd made lower contributions. The dominant elements of Factor 2 were Cu (64%), Ni (33%), As (31%), V (23%) and Pb (27%), with Cd and Hg making lower contributions. The dominant elements of Factor 3 were Hg (78%), As (32%), Cu (35%) and Ni (31%), whereas V and Cd made lower contributions. The dominant elements of Factor 4 were V (56%), Cr (34%) and As (26%). The dominant elements of Factor 5 were Cd (75%) and Pb (24%), whereas Hg and As had little influence.
The sources of heavy metal pollution in Poyang Lake sediments include transport, mining, industrial, agriculture and natural processes. Transport is a common source in both Sections A and B, with high concentrations of Cd, Pb, Ni and Cr linked to vehicle exhaust, ship emissions, and fuel combustion [48]. In Section A, factor 1 identifies transport as the primary source, particularly near Jiujiang City, and Pb and Cd levels are high. In Section B, factor 5 points to vehicle exhaust and diesel combustion as the main contributors to Cd and Pb [49,50]. Mining activities significantly impact Section A and B, with higher concentrations of Cu, Cr, V and Ni associated with copper and lead–zinc mining. Factor 2 in both areas shows that mining is an important source, with metals entering the lake via watershed runoff. Industrial emissions, particularly from smelting, also play a significant role, with elevated levels of Hg, As, Pb, Cr and Ni indicating the smelting process as a major pollution source. Factor 3 highlights industrial emissions, with industrial parks in area A (e.g., Jiangxi Copper) and the non-ferrous metal smelting industry in area B as primary sources [51,52]. Agriculture mainly affects area B, where the use of phosphorus and nitrogen fertilizers leads to higher concentrations of Pb, Cr and As [53]. Natural sources, including rock weathering and soil erosion, influence both areas, since Factor 4 showed that metals like V, As, Ni and Cu enter the lake through these processes [54,55].
The results of the PMF analysis of Section C, the tributaries and the YR identify four factors explaining the distributions of sediment heavy metals. For Section C (Figure S7), factors 1, 2, 3 and 4 represent transport, mining, industrial and agricultural sources, respectively. For the tributaries (Figure S8), factors 1, 2, 3 and 4 represented the mining, industrial, transport and a mixed agricultural/natural sources, respectively. For the YR (Figure S9), factors 1, 2, 3 and 4 represented the transport, industrial, natural and agricultural sources, respectively.
Figure 8 shows the distribution across space of sources of sediment heavy metals in Sections A, B and C. The results show that the sediment heavy metals in Poyang Lake mainly originated from natural, industrial and transport sources. The sediment heavy metals in Sections A, B, C and tributaries of Poyang Lake came from similar sources. This result suggests that the tributaries may be important sources of sediment heavy metals in the lake. In addition to agricultural and mining sources, there was a high degree of overlap between heavy metal sources between Section A and the YR, thereby further confirming that the Yangtze River influenced sediment heavy metals in Section A of Poyang Lake.

3.5. Environmental Evaluation of Heavy Metals

The geo-accumulation index (Igeo) and potential ecological risk index (PERI) methods were used to evaluate the ecological risk, as detailed in the Supplementary Materials. The results of the geo-accumulation index method are shown in Table S11, and the pollution evaluation criteria for the geo-accumulation index are presented in Table S12. The results indicate that Cr and V show no pollution, while Pb, As, Cu and Ni exhibit slight pollution levels. Cu, Pb and As show relatively higher pollution levels, falling into the slight-to-moderate pollution range. Cd and Hg have the highest average pollution levels, with Cd reaching a moderate-to-heavy pollution level, and Hg reaching a heavy pollution level.
The classification standards for the potential ecological risk of heavy metals are shown in Table S13, and the results of the potential ecological risk index are presented in Table S14. The potential ecological risk indexes for Pb, As, Cr, Ni, Cu and V are below 40, indicating a low risk. However, the potential risk indexes for Cd and Hg reach 468 and 789.3, respectively, both falling into the “extremely high risk” category.

4. Conclusions

Heavy metals were found to be widely present in the sediments in the Yangtze River, Poyang Lake and its tributaries. V, Cr, Pb and Ni were the dominant heavy metals in terms of concentration. The concentration difference and the runoff of the tributaries resulted in different spatial distribution patterns of heavy metals. All tributaries affected different sections of the lake that are contiguous to them, and the area of influence was consistent with their relative runoff contributions. Mining sources, industrial sources and traffic sources were identified as the main sources of heavy metals in the surface sediments of Poyang Lake. The results might provide basic data for the ecosystem conservancy for Yangtze River, Poyang Lake and its tributaries.

Supplementary Materials

The following supporting information can be downloaded at: https://www.mdpi.com/article/10.3390/w17091295/s1, Figure S1: Composition of heavy metals in surface sediments. (a) Poyang Lake, (b) tributaries, (c) Upper Yangtze River, (d) Lower Yangtze River. Figure S2: Remote sensing map of typical water surface of Poyang Lake during dry water period. Figure S3: Spatial distribution of PAHs in surface sediments of Poyang Lake. Figure S4: Relationships of heavy metals between the sampling sites in the rivers and the representative sampling sites of Poyang Lake. (a) the Gan Rivers and Poyang Lake, (b) the Yangtze River and Poyang Lake. Figure S5: Source profiles and contributions of heavy metals in the studied Section A of Poyang Lake sediments obtained with the PMF model. Figure S6: Source profiles and contributions of heavy metals in the studied Section B of Poyang Lake sediments obtained with the PMF model. Figure S7: Source profiles and contributions of heavy metals in the studied Section C of Poyang Lake sediments obtained with the PMF model. Figure S8: Source profiles and contributions of heavy metals in the studied Section R sediments obtained with the PMF model. Figure S9: Source profiles and contributions of heavy metals in the studied Section YR sediments obtained with the PMF model. Table S1: Average concentration of heavy metals in sediments of the lake systems following the order of sampling time. Table S2: Average concentration of heavy metals in sediments of the different sections. Table S3: Pearson correlation coefficients between heavy metals in the surface sediments of Section A of Poyang Lake. Table S4: Pearson correlation coefficients between heavy metals in the surface sediments of Section B of Poyang Lake. Table S5: Pearson correlation coefficients between heavy metals in the surface sediments of Section C of Poyang Lake. Table S6: Pearson correlation coefficients between heavy metals in the surface sediments of Xiu River and Poyang Lake. Table S7: Pearson correlation coefficients between heavy metals in the surface sediments of Fu River and Poyang Lake. Table S8: Pearson correlation coefficients between heavy metals in the surface sediments of Xin River and Poyang Lake. Table S9: Pearson correlation coefficients between heavy metals in the surface sediments of Rao River and Poyang Lake. Table S10: Pearson correlation coefficients between heavy metals in the surface sediments of the Yangtze River and Poyang Lake. Table S11: Geochemical background values and geo-accumulation index of heavy metals in the sediments of Poyang Lake. Table S12: Geo-accumulation index grade classification standard. Table S13: Potential ecological risk index grade classification standard. Table S14: Potential ecological risk index of heavy metals in the sediments of Poyang Lake. Table S15: PEC and TEC for metals in freshwater ecosystems. Table S16: The concentrations of metals in Poyang Lake sediments. Table S17: Water quality parameters at sampling sites in Poyang Lake. Table S18: Proportion of particle size at each sampling point. Table S19: Correlation analysis results for the relationships between heavy metals and water quality indicators. Table S20: The information of rivers flowing into Poyang Lake. Table S21: Pearson correlation coefficients between heavy metals of Poyang Lake.

Author Contributions

Conceptualization, B.-T.Z. and Y.M.; methodology, Y.C.; software, M.H.; validation, T.L. and G.L.; formal analysis, J.B.; investigation, J.W., B.-T.Z. and T.L.; resources, Y.M.; data curation, Y.C.; writing—original draft preparation, J.W. and J.B.; writing—review and editing, B.-T.Z., Y.C. and J.W.; visualization, M.H.; supervision, G.L.; project administration, Y.M.; funding acquisition, B.-T.Z. All authors have read and agreed to the published version of the manuscript.

Funding

This work was supported by the National Key R&D Program of China (Grant No. 2021YFC3200101, 2023YFC3708903) and the College Students’ Innovative Entrepreneurial Training Plan Program (202403035).

Data Availability Statement

The original contributions presented in this study are included in the article/Supplementary Materials. Further inquiries can be directed to the corresponding author(s).

Conflicts of Interest

The authors declare that they have no competing financial interests or personal relationships that could have appeared to influence the work reported in this paper.

References

  1. Zhang, R.; Zhou, L.; Zhang, F.; Ding, Y.; Gao, J.; Chen, J.; Yan, H.; Shao, W. Heavy metal pollution and assessment in the tidal flat sediments of Haizhou Bay, China. Mar. Pollut. Bull. 2013, 74, 403–412. [Google Scholar] [CrossRef]
  2. Elhamji, S.; Sbihi, K.; Lghoul, S.; Aziz, K.; El Maallem, A.; Kurniawan, T.A.; Aziz, F. Addressing the challenge of heavy metal contamination in aquatic environment: Harnessing the bioremediation potential of Navicula permitis diatom for wastewater treatment. Biomass Bioenergy 2025, 197, 107776. [Google Scholar] [CrossRef]
  3. Dai, L.; Wang, L.; Li, L.; Liang, T.; Zhang, Y.; Ma, C.; Xing, B. Multivariate geostatistical analysis and source identification of heavy metals in the sediment of Poyang Lake in China. Sci. Total. Environ. 2018, 621, 1433–1444. [Google Scholar] [CrossRef] [PubMed]
  4. Zamora-Ledezma, C.; Negrete-Bolagay, D.; Figueroa, F.; Zamora-Ledezma, E.; Ni, M.; Alexis, F.; Guerrero, V. Heavy metal water pollution: A fresh look about hazards, novel and conventional remediation methods. Environ. Technol. Innov. 2021, 22, 101504. [Google Scholar] [CrossRef]
  5. Saravanan, P.; Saravanan, V.; Rajeshkannan, R.; Arnica, G.; Rajasimman, M.; Baskar, G.; Pugazhendhi, A. Comprehensive review on toxic heavy metals in the aquatic system: Sources, identification, treatment strategies, and health risk assessment. Environ. Res. 2024, 258, 119440. [Google Scholar] [CrossRef] [PubMed]
  6. Li, F.; Huang, J.; Zeng, G.; Yuan, X.; Li, X.; Liang, J.; Wang, X.; Tang, X.; Bai, B. Spatial risk assessment and sources identification of heavy metals in surface sediments from the Dongting Lake, Middle China. J. Geochem. Explor. 2013, 132, 75–83. [Google Scholar] [CrossRef]
  7. Redwan, M.; Elhaddad, E. Correction to: Heavy metal pollution in Manzala Lake sediments, Egypt: Sources, variability, and assessment. Environ. Monit. Assess. 2022, 194, 461. [Google Scholar] [CrossRef]
  8. Bastami, K.; Neyestani, M.; Shemirani, F.; Soltani, F.; Haghparast, S.; Akbari, A. Heavy metal pollution assessment in relation to sediment properties in the coastal sediments of the southern Caspian Sea. Mar. Pollut. Bull. 2015, 92, 237–243. [Google Scholar] [CrossRef]
  9. Bing, H.; Wu, Y.; Nahm, W.-K.; Liu, E. Accumulation of heavy metals in the lacustrine sediment of Longgan Lake, middle reaches of Yangtze River, China. Environ. Earth Sci. 2013, 69, 2679–2689. [Google Scholar] [CrossRef]
  10. Goretti, E.; Pallottini, M.; Ricciarini, M.; Selvaggi, R.; Cappelletti, D. Heavy metals bioaccumulation in selected tissues of red swamp crayfish: An easy tool for monitoring environmental contamination levels. Sci. Total Environ. 2016, 559, 339–346. [Google Scholar] [CrossRef]
  11. Peng, J.-F.; Song, Y.-H.; Yuan, P.; Cui, X.-Y.; Qiu, G.-L. The remediation of heavy metals contaminated sediment. J. Hazard. Mater. 2008, 161, 633–640. [Google Scholar] [CrossRef] [PubMed]
  12. Salomons, W.; Förstner, U. Metals in the Hydrocycle; Springer: Berlin, Germany, 1984. [Google Scholar]
  13. Yu, M.; Chen, L.; Tao, H.; Cao, M.; Zhang, X.; Liang, Y.; Shi, J. Pollution status and risk assessment of heavy metals in the sediment of a historically contaminated lake treated by oxidation pond in China. Environ. Sci. Pollut. Res. 2023, 30, 41794–41805. [Google Scholar] [CrossRef]
  14. Zhang, C.; Yu, Z.; Zeng, G.; Jiang, M.; Yang, Z.; Cui, F.; Zhu, M.; Shen, L.; Hu, L. Effects of sediment geochemical properties on heavy metal bioavailability. Environ. Int. 2014, 73, 270–281. [Google Scholar] [CrossRef] [PubMed]
  15. Hansen, A. Lake sediment cores as indicators of historical metal(loid) accumulation. A case study in Mexico. Appl. Geochem. 2012, 27, 1745–1752. [Google Scholar] [CrossRef]
  16. Sterner, R.W.; Keeler, B.; Polasky, S.; Poudel, R.; Rhude, K.; Rogers, M. Ecosystem services of earth’s largest freshwater lakes. Ecosyst. Serv. 2020, 41, 101046. [Google Scholar] [CrossRef]
  17. Oyege, I.; Katwesigye, R.; Kiwanuka, M.; Mutanda, H.; Niyomukiza, J.; Kataraihya, D.; Kica, S.; Egor, M. Temporal trends of water quality parameters, heavy metals, microplastics, and emerging organic pollutants in Lake Victoria and its basin: Knowns, knowledge gaps, and future directions. Environ. Nanotechnol. Monit. Manag. 2024, 22, 100962. [Google Scholar] [CrossRef]
  18. Vasiliu, D.; Bucse, A.; Lupascu, N.; Ispas, B.; Gheablau, C.; Stanescu, I. Assessment of the metal pollution in surface sediments of coastal Tasaul Lake (Romania). Environ. Monit. Assess. 2020, 192, 749. [Google Scholar] [CrossRef]
  19. Liang, H.; Zhang, Y.; Du, S.; Cao, J.; Liu, Y.; Zhao, H.; Ding, T. Heavy metals in sediments of the river-lake system in the Dianchi basin, China: Their pollution, sources, and risks. Sci. Total Environ. 2024, 957, 177652. [Google Scholar] [CrossRef] [PubMed]
  20. Zhang, H.; Zhao, S.; Shi, X.; Sun, B.; Cui, Z.; Zhao, Y.; Zhang, J. Distribution characteristics, risk assessment, and source analysis of heavy metals in typical lake sediments in Inner Mongolia, China. Ecol. Indic. 2024, 166, 112341. [Google Scholar] [CrossRef]
  21. Niu, Y.; Niu, Y.; Yu, H.; Jiang, X.; Guo, X.; Pang, Y.; Xu, X. Concentration distribution and toxicity of heavy metals in surface sediment of Poyang Lake, China. Wetlands 2019, 39, 55–62. [Google Scholar] [CrossRef]
  22. Guo, J.; Wang, X.; Cao, X.; Qi, W.; Peng, J.; Liu, H.; Qu, J. The influence of wet-to-dry season shifts on the microbial community stability and nitrogen cycle in the Poyang Lake sediment. Sci. Total Environ. 2023, 903, 166036. [Google Scholar] [CrossRef] [PubMed]
  23. Chen, H.; Jin, G.; Tang, H.; Wu, J.; Wang, Y.-G.; Zhang, Z.; Deng, Y.; Zhang, S. Spatiotemporal variations of water levels and river-lake interaction in the Poyang Lake basin under the extreme drought. J. Hydrol. Reg. Stud. 2025, 57, 102165. [Google Scholar] [CrossRef]
  24. Lai, X.; Huang, Q.; Zhang, Y.; Jiang, J. Impact of lake inflow and the Yangtze River flow alterations on water levels in Poyang Lake, China. Lake Reserv. Manag. 2014, 30, 321–330. [Google Scholar] [CrossRef]
  25. Huang, J.; Guo, S.; Zeng, G.-M.; Li, F.; Gu, Y.; Shi, Y.; Shi, L.; Liu, W.; Peng, S. A new exploration of health risk assessment quantification from sources of soil heavy metals under different land use. Environ. Pollut. 2018, 243, 49–58. [Google Scholar] [CrossRef]
  26. Wang, S.; Cai, L.-M.; Wen, H.-H.; Luo, J.; Wang, Q.-S.; Liu, X. Spatial distribution and source apportionment of heavy metals in soil from a typical county-level city of Guangdong Province, China. Sci. Total Environ. 2019, 655, 92–101. [Google Scholar] [CrossRef]
  27. Ma, Y.; Li, Y.; Fang, T.; He, Y.; Wang, J.; Liu, X.; Wang, Z.; Guo, G. Analysis of driving factors of spatial distribution of heavy metals in soil of non-ferrous metal smelting sites: Screening the geodetector calculation results combined with correlation analysis. J. Hazard. Mater. 2023, 445, 130614. [Google Scholar] [CrossRef] [PubMed]
  28. MacDonald, D.; Ingersoll, C.; Berger, T. Development and evaluation of consensus-based sediment quality guidelines for freshwater ecosystems. Arch. Environ. Contam. Toxicol. 2000, 39, 20–31. [Google Scholar] [CrossRef]
  29. Ahmadov, M.; Humbatov, F.; Mammadzada, S.; Balayev, V.; Ibadov, N.; Ibrahimov, Q. Assessment of heavy metal pollution in coastal sediments of the western Caspian Sea. Environ. Monit. Assess. 2020, 192, 500. [Google Scholar] [CrossRef]
  30. Khosravi, R.; Nemati Mansour, S.; Ekrami, J.; Mosaferi, M. Health and ecological risks assessment of heavy metals and metalloids in surface sediments of Urmia Salt Lake, Northwest of Iran. Environ. Monit. Assess. 2023, 195, 403. [Google Scholar] [CrossRef]
  31. Mamat, Z.; Haximu, S.; Zhang, Z.; Aji, R. An ecological risk assessment of heavy metal contamination in the surface sediments of Bosten Lake, northwest China. Environ. Sci. Pollut. 2016, 8, 7255–7265. [Google Scholar] [CrossRef]
  32. Zhang, Y.; Che, F.; Fu, Z.; Xu, Y.; Li, W. Distribution and potential ecological risk assessment of heavy metals in sediments of Lake Qinghai. Environ. Sci. 2022, 43, 3037–3047. [Google Scholar] [CrossRef]
  33. Liu, T.; Zhang, D.; Yue, W.; Wang, B.; Huo, L.; Liu, K.; Zhang, B.-T. Heavy metals in sediments of Hulun Lake in Inner Mongolia: Spatial-temporal distributions, contamination assessment and source apportionment. Water 2023, 15, 1329. [Google Scholar] [CrossRef]
  34. Xia, J.; Long, J.; Gao, Y.; Chen, Y.; Meng, J.; Zhou, Y.; Chen, S. Ecological risk assessment and source analysis of heavy metal pollutions in sediments of the Chaohu Lake. Earth Environ. 2020, 48, 220–227. [Google Scholar] [CrossRef]
  35. Shen, Q.S.; Friese, K.; Gao, Q.; Kimirei, I.; Kishe, M.; Chen, C.; Zhang, L.; Yu, C.; Wu, G.; Liu, Y. Accumulation characteristics and ecological implications of heavy metals in surface sediments of the Mwanza Gulf, Lake Victoria. Environ. Monit. Assess. 2022, 194, 756. [Google Scholar] [CrossRef] [PubMed]
  36. Yuan, G.; Liu, C.; Chen, L. Inputting history of heavy metals into the inland lake recorded in sediment profiles: Poyang Lake in China. J. Hazard. Mater. 2011, 185, 336–345. [Google Scholar] [CrossRef]
  37. Liao, F.; Wang, G.; Shi, Z.; Huang, X.; Xu, F.; Xu, Q.; Guo, L. Distributions, sources, and species of heavy metals/trace elements in shallow groundwater around the Poyang Lake, East China. Expo. Health 2018, 10, 211–227. [Google Scholar] [CrossRef]
  38. Zhang, H.; Jiang, Y.; Ding, M.; Xie, Z. Level, source identification, and risk analysis of heavy metal in surface sediments from river-lake ecosystems in the Poyang Lake, China. Environ. Sci. Pollut. Res. 2017, 24, 21902–21916. [Google Scholar] [CrossRef]
  39. Wang, Y.; Liu, R.; Fan, D.; Yu, P.; Wang, J.; Tang, A. Distribution and accumulation characteristics of heavy metals in sediments in southern sea area of Huludao City, China. Chin. Geogr. Sci. 2013, 23, 194–202. [Google Scholar] [CrossRef]
  40. Yao, W.; Hu, C.; Yang, X.; Shui, B. Spatial variations and potential risks of heavy metals in sediments of Yueqing Bay, China. Mar. Pollut. Bull. 2021, 173, 112983. [Google Scholar] [CrossRef]
  41. Ma, Y.; Sun, C.; Bi, J.; Zhang, B.-T.; Liu, Y.; Shao, P.; Liu, T.; Wang, S.; Zhong, W. Spatial-temporal distribution and source analysis of polycyclic aromatic hydrocarbons in the sediments of Poyang Lake. Environ. Sci. 2024, 45, 1492–1501. [Google Scholar] [CrossRef]
  42. Kusunoki, K.; Sakata, M. Long-range transport of heavy metals from the Asian continent contributes to surface sediments in Lakes Shinji and Nakaumi in western Japan. Limnology 2018, 19, 43–52. [Google Scholar] [CrossRef]
  43. Wang, R.; Zhang, C.; Huang, X.; Zhao, L.; Yang, S.; Struck, U.; Yin, D. Distribution and source of heavy metals in the sediments of the coastal East China sea: Geochemical controls and typhoon impact. Environ. Pollut. 2020, 260, 113936. [Google Scholar] [CrossRef] [PubMed]
  44. Cui, X. Multiphase spatial distribution characteristics of Cd morphology in typical intertidal. Environ. Sci. 2022, 43, 1375–1383. [Google Scholar] [CrossRef]
  45. Liu, W.-Q.; Ni, Z.-K.; Wu, Z.-Q.; Wang, S.-R.; Zeng, Q.-R. Influence of the river-lake relation change on the distribution of heavy metal and ecological risk assessment in the surface sediment of Poyang Lake. Environ. Sci. 2014, 35, 1750–1758. [Google Scholar] [CrossRef]
  46. Kang, M.; Tian, Y.; Sen, P.; Wang, M. Effect of dissolved oxygen and nutrient levels on heavy metal contents and fractions in river surface sediments. Sci. Total Environ. 2019, 648, 861–870. [Google Scholar] [CrossRef]
  47. Zhang, B.-T.; Gao, Y.; Lin, C.; Yang, W.; Liu, T.; Liu, X.; Wang, Y. Spatial distribution of phthalate acid esters in sediments of the Laizhou Bay and its relationship with anthropogenic activities and geochemical variables. Sci. Total Environ. 2020, 722, 137912. [Google Scholar] [CrossRef]
  48. Chen, W.; Zhu, S.; Li, N.; Luo, X. Source apportionment and risk assessment of metal pollution in natural biofilms and surface water along the Lancang River, China. Sci. Total Environ. 2022, 843, 156977. [Google Scholar] [CrossRef]
  49. Zeng, Q.; Wang, Z.; Luo, Y.; Zhang, Z.; Zhang, J.; Feng, X.; Tian, D.; Li, C.; Cheng, Q.; Yi, F. Evaluation and source apportionment on potentially toxic elements pollution of agricultural soil in mango planting areas in Panzhihua city, China. Soil Sediment Contam. Int. J. 2024, 34, 104–126. [Google Scholar] [CrossRef]
  50. Zeng, X.; Xu, L.; Hu, Q.; Liu, Y.; Hu, J.; Liao, W.; Yu, Z. Occurrence and distribution of organophosphorus flame retardants/plasticizers in coastal sediments from the Taiwan Strait in China. Mar. Pollut. Bull. 2020, 151, 110843. [Google Scholar] [CrossRef]
  51. Zhang, B.-T.; Gao, Y.; Lin, C.; Liu, T.; Liu, X.; Ma, Y.; Wang, H. Spatial distribution of phthalate acid esters in sediments and its relationships with anthropogenic activities and environmental variables of the Jiaozhou Bay. Mar. Pollut. Bull. 2020, 155, 111161. [Google Scholar] [CrossRef]
  52. Chen, Z.; Ding, Y.; Jiang, X.; Duan, H.; Ruan, X.; Li, Z.; Li, Y. Combination of UNMIX, PMF model and Pb-Zn-Cu isotopic compositions for quantitative source apportionment of heavy metals in suburban agricultural soils. Ecotoxicol. Environ. Safe 2022, 234, 113369. [Google Scholar] [CrossRef] [PubMed]
  53. Jiang, W.; Meng, L.; Liu, F.; Sheng, Y.; Chen, S.; Yang, J.; Mao, H.; Zhang, J.; Zhang, Z.; Ning, H. Distribution, source investigation, and risk assessment of topsoil heavy metals in areas with intensive anthropogenic activities using the positive matrix factorization (PMF) model coupled with self-organizing map (SOM). Environ. Geochem. Health 2023, 45, 6353–6370. [Google Scholar] [CrossRef] [PubMed]
  54. Kuang, H.; Hu, C.; Wu, G.; Chen, M. Source analysis of heavy metals in surface sediments of Poyang Lake during the abundant water period by combining Principal Component Analysis (PCA) and Positive Definite Matrix Factorization (PMF). Lake Sci. 2020, 32, 964–976. [Google Scholar] [CrossRef]
  55. Zhao, H.; Lan, X.; Yu, F.; Li, Z.; Yang, J.; Du, L. Comprehensive assessment of heavy metals in soil-crop system based on PMF and evolutionary game theory. Sci. Total Environ. 2022, 849, 157549. [Google Scholar] [CrossRef]
Figure 1. Map of sampling sites in the study region.
Water 17 01295 g001
Figure 2. Spatial distribution patterns of heavy metals in the surface sediments of Poyang Lake. (a) Cu; (b) As; (c) Ni; (d) V.
Water 17 01295 g002
Figure 3. Redundancy analysis of the relationships between heavy metals (blue vectors) and polycyclic aromatic hydrocarbons (red vectors) in surface sediments of Poyang Lake.
Water 17 01295 g003
Figure 4. Spatial distribution patterns of heavy metals in the surface sediments of Poyang Lake. (a) Cr; (b) Hg.
Water 17 01295 g004
Figure 5. Spatial distribution patterns of heavy metals in the surface sediments of Poyang Lake. (a) Pb; (b) Cd.
Water 17 01295 g005
Figure 6. Pearson correlation coefficients among heavy metals (* p < 0.01).
Water 17 01295 g006
Figure 7. Relationships of heavy metals and geochemical variables of the surface sediments in Poyang Lake using redundancy analysis.
Water 17 01295 g007
Figure 8. Contribution of various sources to heavy metal concentrations in sediments of different areas.
Water 17 01295 g008
Table 1. The concentrations of heavy metals in sediments of Poyang Lake and its tributaries.
Heavy MetalsPoyang Lake
(mg/kg, d.w. n = 49)
Tributaries
(mg/kg, d.w. n = 9)
MinMaxMeanFODMinMaxMeanFOD
CuND115.037.195.9%14.039.024.0100.0%
As2.028.016.7100.0%ND29.014.088.9%
NiND71.037.298.0%10.061.032.3100.0%
VND142.068.195.9%37.0119.065.8100.0%
Cr15.093.061.4100.0%5.0107.054.6100.0%
HgND8.02.773.5%ND4.01.755.6%
Pb12.094.053.4100.0%27.062.046.9100.0%
CdND8.01.759.2%ND7.02.977.8%
ΣHMs80.0492.0278.4-150.0412.0231.1-
Notes: FOD, the frequency of detection (%, samples detected); d.w., dry weight; ND, not detected.
Table 2. The concentrations of heavy metals in sediments of Yangtze River.
Heavy MetalsUpper Yangtze River
(mg/kg, d.w. n = 3)
Lower Yangtze River
(mg/kg, d.w. n = 3)
MinMaxMeanFODMinMaxMeanFOD
Cu11.317.314.0100.0%18.730.024.6100.0%
As4.35.75.1100.0%4.010.77.8100.0%
Ni44.047.345.2100.0%37.040.338.1100.0%
V40.373.061.1100.0%75.097.383.6100.0%
Cr52.0109.076.1100.0%52.056.754.0100.0%
Hg4.36.05.0100.0%ND4.72.166.7%
Pb25.031.327.7100.0%28.045.036.3100.0%
Cd8.09.38.7100.0%5.012.78.3100.0%
ΣHMs203.0285.0242.9-231.0267.0254.8-
Notes: FOD, the frequency of detection (%, samples detected); d.w., dry weight; ND, not detected.
Disclaimer/Publisher’s Note: The statements, opinions and data contained in all publications are solely those of the individual author(s) and contributor(s) and not of MDPI and/or the editor(s). MDPI and/or the editor(s) disclaim responsibility for any injury to people or property resulting from any ideas, methods, instructions or products referred to in the content.

