Article

Vulnerability Assessment of Dams and Reservoirs to Climate Change in the Mediterranean Region: The Case of the Almopeos Dam in Northern Greece

by
Anastasios I. Stamou
1,*,
Georgios Mitsopoulos
1,
Athanasios Sfetsos
2,
Athanasia Tatiana Stamou
1,
Sokratis Sideris
1,
Konstantinos V. Varotsos
3,
Christos Giannakopoulos
3 and
Aristeidis Koutroulis
4
1
Laboratory of Applied Hydraulics, Department of Water Resources and Environmental Engineering, National Technical University of Athens, 15780 Athens, Greece
2
Environmental Research Laboratory, National Centre of Scientific Research “Demokritos”, 15310 Agia Paraskevi, Greece
3
Institute for Environmental Research and Sustainable Development, National Observatory of Athens, 11810 Athens, Greece
4
School of Chemical and Environmental Engineering, Technical University of Crete, 73100 Chania, Greece
*
Author to whom correspondence should be addressed.
Water 2025, 17(9), 1289; https://doi.org/10.3390/w17091289
Submission received: 18 March 2025 / Revised: 17 April 2025 / Accepted: 24 April 2025 / Published: 25 April 2025

Abstract

:
Dam and reservoir (D&R) systems, during their long history, have suffered from hundreds of failures, whose mechanisms have been accelerated by climate change and climate hazards. The following research question is posed: “which are the potentially significant climate hazards of D&R systems?” To answer this question, the vulnerability of D&R systems to climate change is assessed via a typologized methodology that is consistent with the technical guidelines of the European Commission on the climate proofing of infrastructure. The main steps of the methodology, which are (1) a description of the D&R system, (2) climate change assessment, and (3) vulnerability assessment, are performed using literature surveys, expert opinions, and climate models. The methodology is applied to the Almopeos D&R system in Greece, which is in the design stage, and the following conclusions are drawn: (1) the potentially significant groups of climate hazards are (i) temperature increase and extreme heat, (ii) precipitation decrease, aridity, and droughts, and (iii) extreme precipitation and flooding, and (2) the vulnerability assessment identified the climate indicators, the most important effects, and the most vulnerable components of the D&R system that can be used in the risk assessment that follows to identify the significant climate hazards and to propose targeted adaptation strategies to reduce their risks to an acceptable level.

1. Introduction

Dam and reservoir (D&R) systems are fundamental water infrastructure that serve multiple purposes/functions simultaneously, including water supply for domestic, agricultural, industrial, and community use; flood control; recreation; and clean, renewable energy through hydropower [1]. During their long history, D&R have systems suffered from hundreds of dam failures that have caused immense property and environmental damage and have taken thousands of lives. The typical dam failure modes are (i) overtopping, (ii) foundation defects, (iii) piping, (iv) cracking, and (v) inadequate maintenance and upkeep; in the U.S., the first three modes account for approximately 34%, 30%, and 20% of all U.S. dam failures [2]. The main failure modes for earthfill dams can be categorized as follows: (i) overtopping, (ii) seepage, (iii) structural, and (iv) combined [3,4,5]; for gravity dams, these are (i) sliding, (ii) overturning, and (iii) structural failures [6]. In the UK, the Environment Agency performed a project entitled “Modes of dam failure and monitoring and measuring techniques”, in which 48 hazards (hazard: “situation with a potential for human injury, property damage or other undesirable outcome”) were identified and correlated with more detailed failure modes (failure mode: “the mechanism by which a hazard leads to failure of a dam”, and failure: “a major uncontrolled and unintended release of retained water, or an event whereby a dam is rendered unfit to safely retain water because of a total loss of structural integrity”) as follows: (i) catastrophic overtopping, (ii) dam breach, (iii) foundation failure of concrete and embankment dam, (iv) instability of concrete or embankment dam, (v) overflow failure, (vi) structural failure of concrete dam and embankment dam (deterioration of core or load exceedance) and uncontrolled flow due to appurtenant works failure, and (vii) uncontrolled seepage [7].
Climate change and climate hazards affect dam failure modes often via accelerating their failure mechanisms; for example, increased droughts and increased extreme precipitation increase the risk of piping and overtopping failure, respectively [8]. Moreover, new failure modes may arise due to climate change or current ones may become obsolete [9]; for instance, in the context of geological hazards, studies have confirmed the influence of climate change on slope stability [10]. A slope failure event near a dam site could eventually entail a part of the terrain falling into the reservoir or impacting the dam, which could trigger overtopping and eventually a dam failure. Atkins [8] focused on climate hazards, clarified that the failure mode “describes the way in which problems caused by climate can cause significant operation problems or perhaps physical failure of a particular structure (of a D&R system)”, and provided the following list of problems/failures that are practically the “failure modes” [11]: (i) for earthfill dams, the erosion of the upstream face or shoulders, erosion of the crest and downstream face, piping, the slumping or settlement of embankment, the desiccation of the clay core and blankets, and the failure of (or damage to) liners; (ii) for concrete dams, cracking, spalling, and joint failure on the dam face/structure, overturning, sliding, and foundation failure; (iii) for overflow structures, the overwhelming/blocking of the structure and the damage or scouring of spillway/stilling basin; and (iv) for ancillaries, damage to tunnels, valves or draw-off facilities, the expansion/seizure of metal components or electronic failure, and others, including the expansion/seizure of metal components and electronic failures. To clarify the relationship of “hazard–impact–failure or damage”, the following example is considered: “Increased precipitation results in increased flowrates into the reservoir that can cause dam overtopping”. The “climate hazard” is the increased precipitation, while the “direct impact” is the increased flow leading to an increased water level that eventually overpasses the capacity of the spillway (the mechanism) and leads to dam overtopping (the failure). Climate hazards can also combine; for example, the climate hazard “increased temperature–heat waves” can cause the effect of “heat stress/disease on certain tree species”, which results in their uprooting during storm events (the storm is the second climate hazard), which may lead to spillway blockage (the damage) and further to dam overtopping (the failure). The sequence of these combined effects can be best described using impact chains that are conceptual models capturing the hazard, vulnerability, and exposure factors that lead to a specific risk [12]; impact chains are often employed in climate risk and vulnerability assessment (CRVA).
Table 1 shows the general categories and types of climate hazards for water infrastructure, which include D&R systems, following the Intergovernmental Panel on Climate Change (IPCC) categorization [13] and the typology proposed by Stamou [14,15,16].
Table 1 depicts that there are five main categories of hazards, namely Heat and Cold (HC), Wet and Dry (WD), Wind and Air (WA), coastal (C), and Snow and Ice (SI), that are further grouped into twenty-four types of hazards. Climate change effects are expected to intensify in the Mediterranean region during the 21st century [17]. The mean air and sea temperature (HC1) and their extremes (HC2 and HC3) will continue to increase more than the global average and heat waves (HC2), intensifying in duration and peak temperatures [18]; the mean precipitation (WD1) will decrease by 4–22% [18], droughts (WD6) will become more severe, more frequent, and longer, and conditions will be drier [19]; heavy precipitation (WD2) and rainfall extremes will likely increase in the northern part of the Mediterranean region, potentially accompanied by an increase in flash floods (WD3) [18]; large wildfires (WD9) will increase [20]; extreme winds (WA2) will increase in intensity [18]; erosivity will increase [21]; sea levels will increase, enhancing the risk of coastal flooding (C2), erosion (C3), and saline intrusion (C4) [18].
There are important research works in the literature dealing with climate change effects on D&R systems. Atkins [8] carried out a UK Government research project aiming at providing a review of the impacts of climate change on D&R systems in England and Wales, which utilized the advantages of the projections and tools that are available from UK Climate Projections 2009 (UKCP09), as well as other available research. The report of this project contains both an evidence-based identification of the potential impacts of climate change on D&R systems and guidance that practitioners (operators, owners, and policy makers) can make use of easily and quickly to provide a robust and auditable assessment of the risks of climate change and the implications it has for their strategic asset management processes. Hughes and Hunt [11] also presented “A Guide to the Effects of Climate Change in Dams”, which summarizes the findings of Atkins’ project. ICOLD [22] assessed the role of D&R systems in adapting to the effects of global climate change, determined the threats and potential opportunities posed by global climate change to existing D&R systems, and then recommended various measures to mitigate against or adapt to the effects of global climate change. Fluixá-Sanmartín et al. [9] presented a comprehensive and multidisciplinary review of the impacts of climate change on dam safety following the risk analysis approach, in which all variables concerning dam safety, from the hydrological loads to the consequences of failure, and their interdependencies are included in a comprehensive way. Mallakpour et al. [23] examined possible changes in flood hazard under the projected climate change using the 100-year flood concept for major dams in California and showed that hydrological failure probability is likely to increase for most dams in California by 2100. Rocha et al. [24] assessed the impacts of future climate changes on (1) water resource availability, (2) water quality, and (3) irrigation needs for the multipurpose reservoirs Monte Novo and Vigia in southern Portugal. Their results indicated that climate change will negatively impact water availability and that future domestic water supplies could be constrained by water quality problems related to phosphorus loads; moreover, they suggested climate change adaptation strategies, especially for the agricultural sector. Ghimire et al. [25] examined how the level of auxiliary spillway erosion varies depending on its material and structural properties and concluded that the inflow hydrograph had the largest impact on erosion, while the representative diameter, spillway width, and side slope ratio had intermediate levels of impact on erosion. Ghimire and Schulenberg [26] evaluated the impacts of climate change on earthen dams and spillways by conducting a post-failure analysis of the two cascading dams, Edenville Dam and Sanford Dam, in Michigan, USA, which failed in series in May 2020; their overall results showed that (1) extreme storms and flooding are associated with increases in temperature and precipitation rates, impacting overall dam safety, and (2) careful precautions should be undertaken before any of these catastrophic dam events occur. Jusko et al. [27] examined the effect of climate change on the siltation rate of a small water reservoir and the relevant contribution of unpaved roads by comparing the siltation under pronounced climate change in the period 1990–2014 with the reference period 1970–1989; their results showed that the siltation rate was almost the same in both periods, because the positive effects of the forest expansion and changes in the forest management practices balanced the largely increased erosivity caused by intense precipitation.
Wilk et al. [28] used mathematical modeling to examine the spatial and temporal distribution of sediment particles to the drinking water reservoir Dobczyce in Poland and showed (1) a large variability of the sediment load between months and (2) that the predicted climate changes will cause a significant increase in mineral fraction loads (silt and clay) during months with high flows. Sant Anna et al. [29] presented a hydrologically driven approach to climate change adaptation, aiming at supporting the reoperation of D&R systems that was illustrated with the multipurpose multi-reservoir system of the Lievre River basin in Quebec in Canada; their results showed that cluster-specific, adapted, operating rules can improve the performance of the system and reveal its operational flexibility with respect to the different operating objectives. MackTavish et al. [30] investigated the climate risks impacting dams in Canada through a literature review, stakeholder interviews, and a workshop, validated by an advisory panel of industry experts; their literature review showed that climate risks to dams include (1) changes to the hydrologic cycle potentially impacting design loads and Inflow Design Floods (IDFs); (2) changes to operations and maintenance to respond to different operating needs, frequencies, and conditions; (3) changes to foundations due to melting permafrost; (4) issues with site access due to storms and extreme weather events; (5) additional stress on water supplies, impacting dam operations and functionality; and (6) impacts on hydropower generation due to a less predictable hydrologic cycle. The National Research Council Canada (NRC), recognizing the need to adapt the new and existing infrastructure and operation procedures to withstand increased climatic loads and degradation mechanisms, performed a research project (1) to identify knowledge gaps in the adaptation of Canadian dams to climate change and (2) to develop future research directions for the NRC’s Construction Research Centre in the areas of climatic data requirements, operations, water quality, monitoring, geotechnical/structural aspects, and material durability [31]. This project, which combined a literature review, interviews, discussions, and consultations with dam experts and professionals, as well as a review of the current regulations, identified eleven groups of gaps as potential research directions. Krztoń et al. [32] analyzed three projections of representative concentration pathways (RCPs of 4.5, 6.0, and 8.5) for the period 2061–2080 and found that the mean annual temperature at dam reservoir locations will increase by 3.06 °C to 4.74 °C from present. Brandesen [33] performed an analysis of climate change that may lead to risks to dam safety in Sweden using the results of a literature review considering the following driving climate parameters: (1) temperature, (2) precipitation, (3) wind with their combinations, and (4) sea level, which will generally increase, except for the wind, where the picture is so far unclear. About seventy impact chains were used to identify risks that can affect dam safety, and it was concluded that the results do not show any new risks, but that they are primarily already known risks that may be exacerbated by climate change, which is relevant for dam safety; moreover, recommendations were made, mainly to authorities, industry organizations, and dam owners. Zhang and Shang [34], based on existing studies and environmental and climate data, examined how environmental and climatic changes impact dam safety and proposed targeted measures to promote research on the role of D&R systems in local and regional climates and to ensure the sustainability of global dams. Lombi et al. [35] presented a methodology that considers the impact of climate change on both inflow hydrographs and initial reservoir water levels, applying it to the Eugui Dam in the River Arga catchment in Spain using an ensemble of 12 climate models; their results showed an increase in (1) the maximum reservoir water level during flood events and (2) the overtopping probability in the RCP 8.5 scenario, especially in the period 2071–2100. Savino et al. [36] combined hydrological modeling (HEC-HMS) and regional climate modeling (ensembles of thirteen combinations of General Circulation Models and Regional Climate Models) for scenarios RCP4.5 and RCP8.5 to assess the potential impacts of climate change on the water availability at Brugneto Lake in northern Italy. Their assessment showed that (1) the uncertainty in inflow is mainly due to the uncertainty of the future rainfall and that (2) a moderate reduction in water availability and modifications of the flow regime are expected in Brugneto Lake by the end of this century.
The design, construction, and operation of D&R systems in most of the countries worldwide are carried out assuming stationary climatic and non-climatic conditions; moreover, current dam safety regulations aim at ensuring that D&R systems are designed, constructed, maintained, operated, and decommissioned with the best available technology and best practices, without taking into consideration, and sometimes without even mentioning, climate change in the relevant technical reports. However, in today’s changing climate, the assumptions of stationary climatic baselines may no longer be appropriate for the long-term design and operations of D&R systems [31]; moreover, the research works that were summarized previously demonstrated that climate change should be considered in the design and operation of D&R systems. In Europe, this consideration became evident by the European Commission [37], who in 2021 released “The Technical Guidance on the Climate Proofing of Infrastructure in the Period 2021–2027”. This guidance, which aims at fostering the development of resilient infrastructure, is primarily designed for project developers and experts involved in the preparation of infrastructure; moreover, it serves as a valuable resource for public agencies, implementation partners, investors, stakeholders, and others. The EC guidance is divided into two pillars, which are (1) mitigation and (2) adaptation, and for each pillar, it is applied in two phases, which are (1) screening and (2) detailed analysis. The methodology for the adaptation of infrastructure to climate change is virtually a CRVA. Stamou et al. [38] developed a CRVA methodology for water infrastructure in the frame of the emblematic national project CLIMPACT (https://climpact.gr/main/; accessed on 9 April 2025), which is based on a literature survey and the EC guidelines that were applied indicatively to a wastewater system in Greece. This methodology, which consists of five steps that are performed in the two phases of the EC guidance, can be adjusted for application in D&R systems, as shown in Figure 1. Figure 1 depicts that the first steps (1, 2, and 3) are carried out in the first phase (screening) to decide whether the vulnerability of the D&R system under investigation is high enough to justify proceeding to the second phase (detailed analysis), which includes steps 4 and 5, which are the risk assessment and the assessment of adaptation measures. In other words, the outcome of the vulnerability analysis is the basis for identifying, appraising, and implementing targeted adaptation measures, which help reduce the residual risk to an acceptable level.
In the present work, the following research question is posed: “which are the potentially significant climate hazards of D&R systems?” To answer this question, the vulnerability of D&R systems to climate change is assessed via a typologized methodology that includes steps 1, 2, and 3 of the first (screening) phase of the CRVA. The aim of the vulnerability assessment is to quickly determine, mainly based on the literature (L), expert opinions (EOs), and climate models (Ms), the potentially significant climate hazards. This paper is structured into four main sections. Section 1 provides the introduction; Section 2 presents the methodology focusing on the first step and the case study; Section 3 deals with the application of the vulnerability assessment to a D&R system in Greece, which is in the design stage, to identify the potentially significant climate hazards with the preliminary estimations, results, and discussion; and Section 4 offers a summary of the key conclusions drawn from this research.

2. Methodology

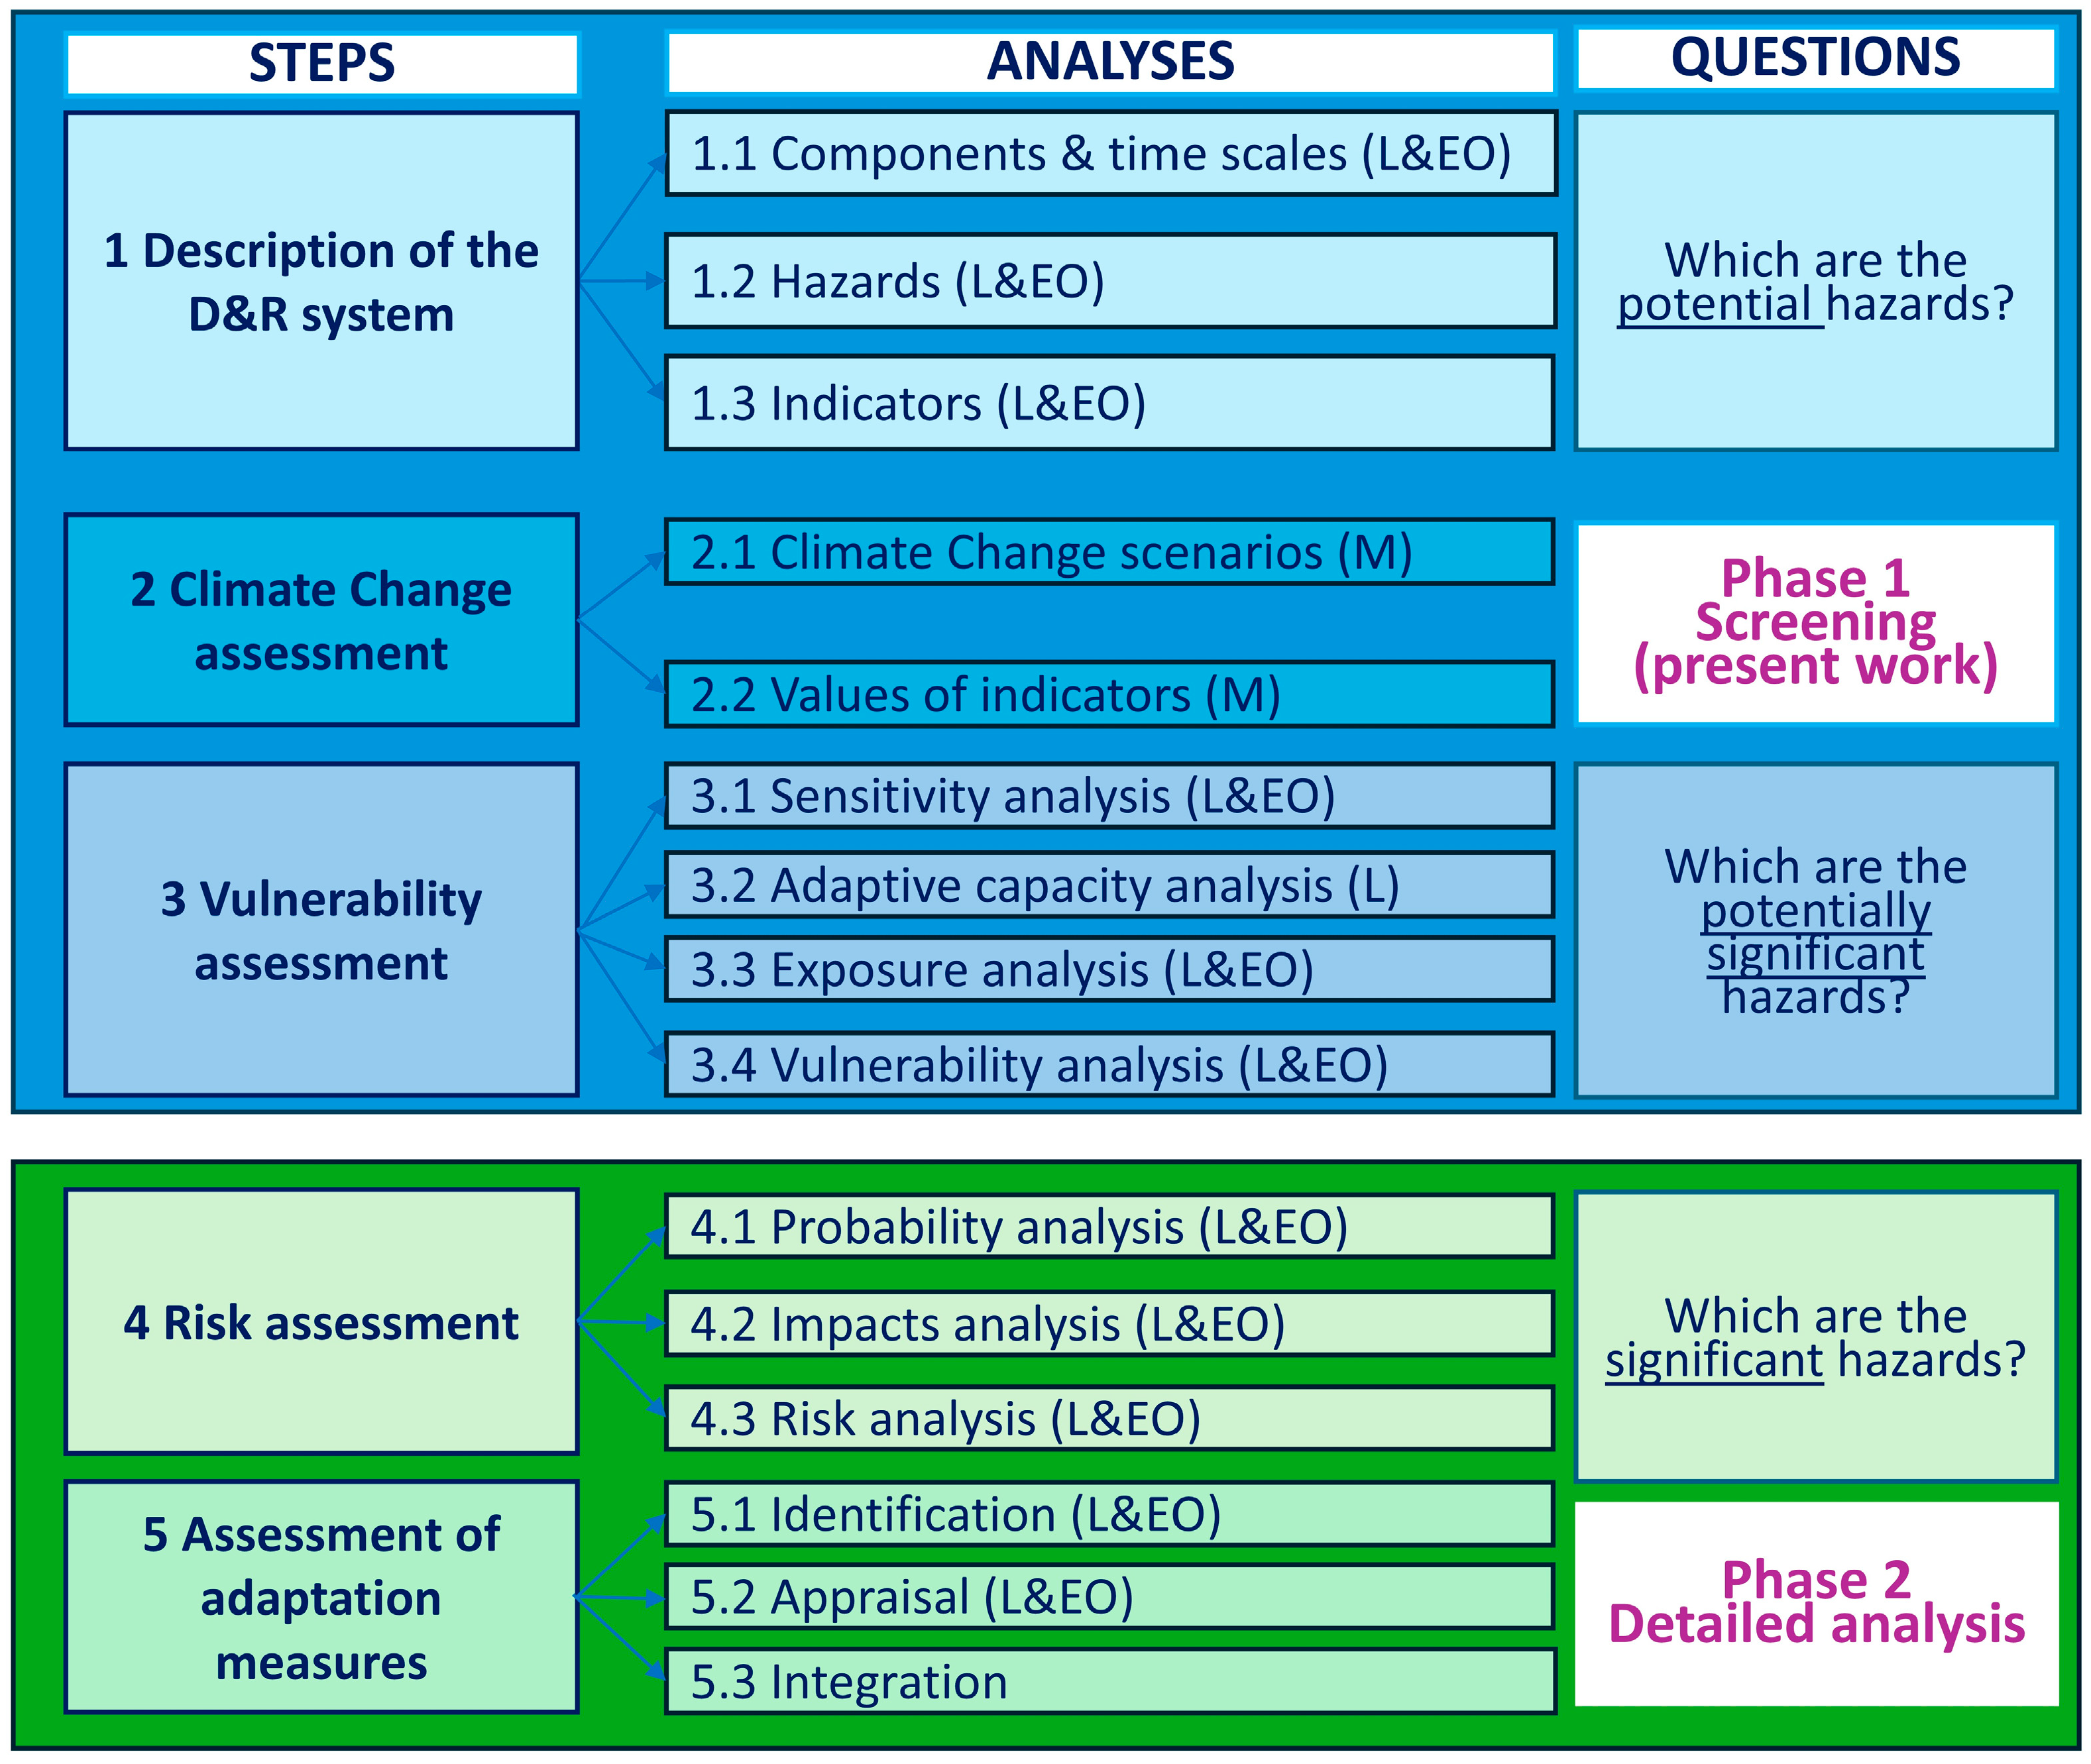
2.1. Main Steps of the Methodology

The methodology for the assessment of the vulnerability of D&R systems to climate change, which is presented in this work, includes steps 1, 2, and 3 of the CRVA (shown in Figure 1), which are (1) the description of the D&R system, (2) climate change assessment, and (3) vulnerability assessment. These steps involve the use of various materials and methods; for example, step 1 can be performed based on literature surveys (L) and/or opinion of experts (OE), while in step 2, data derived from General Circulation Models (GCMs) and Regional Climate Models (RCMs) are used.
In the description of the D&R system (1.1), its main components and their time scale are defined, (1.2) the potential climate hazards for the individual components of the D&R system are identified, and (1.3) the corresponding indicators for each hazard and component are selected. This description requires knowledge of (i) the characteristics of the D&R system and its components and (ii) the potential impacts of all potential climate hazards on every component of the D&R system; this knowledge can primarily be obtained by combining (i) a literature survey and (ii) the opinion of experts, such as experienced engineers specialized in D&R systems.

2.2. Climate Hazards for Dam and Reservoir Systems

Based on the literature [8,30,31,33,34,35,39,40,41,42], there are eight climate hazards that are most commonly examined for D&R systems from the twenty four that are shown in Table 1. These hazards can be categorized into the following four groups: mean air temperature increase (HC1) and extreme heat—heat waves (HC2), mean precipitation decrease (WD1), aridity (WD4) and droughts (WD5), extreme precipitation (WD2) and flooding (WD3), and extreme winds (WA2).

2.3. Components of Dam and Reservoir Systems and Their Typologization

The performance of the description of a D&R system firstly requires its breaking into components; this task is usually performed by experienced engineers specializing in the design, construction, and operation of D&R projects in cooperation with researchers working in D&R systems. Currently, there is no standard procedure to determine the components of D&R systems; however, there are only a few works in the forms of roadmaps [39], guidelines [37], and guides [43,44,45,46].
Generally, the components of a D&R system should cover all its aspects that can be affected by climate change; however, their number should not be high enough to complicate the assessment, which can be facilitated via their grouping. Based on the literature [47,48,49], the components of D&R systems can be categorized into five groups that are shown in Table 2. These groups of components were selected to be consistent with their use in the subsequent analyses of the CRVA, such as the key areas of sensitivity and exposure analyses (in step 3 of the vulnerability assessment) and the risk areas of the impact analysis (in the detailed analysis), which are also employed in the EC technical guidelines [37].
The D&R system inputs are their inflows, which mainly include incoming rivers, but also watershed runoff, direct precipitation, and groundwater inflows and outflows.
The fundamental functions of D&R systems are storage for drinking and/or irrigation water supply (P1), flood prevention and control (P2), hydropower generation (P3), and recreation (P4), e.g., water-based sports and activities, and esthetics, including habitats for wildlife and birds and wildlife sanctuaries and parks, as well as other functions like navigation. These functions depend on the processes taking place in the D&R systems, which can include precipitation, evapotranspiration, runoff, infiltration, erosion, groundwater exchange (seepage), sedimentation, resuspension, stratification, hydrodynamics, mixing, resuspension, and water pollution, which are affected by climate hazards.
Assets include the embankment, which is an earthfill or concrete (gravity) dam (A1), the spillway (A2), the auxiliaries (A3), and the buildings (A4). The main parts of an earthfill dam are (1) the upstream face, including erosion protection, such as the liners (HDPE, concrete or asphaltic concrete) and the shoulders, (2) the crest, including the parapet walls and the roads, (3) the downstream face, (4) the clay core or homogenous clay construction, and (5) the fillers. The main parts of a concrete dam are (1) the concrete structure, including joints, and (2) the foundation. The spillway consists of (1) the approach channel, (2) the control structure, (3) the discharge carrier, (4) the discharge channel, and (5) the energy dissipators.
Auxiliaries entail various structures, including draw-off facilities, energy dissipation structures downstream of the spillway (e.g., downstream pool, stilling basin, and outflow into the downstream river), gates and valves (mainly of steel), penstocks (closed pipes), and other channels and pipes used for sediment removal, flow and fish bypassing, etc. The buildings involved are usually the administration and power buildings, including their equipment.
The outflow of D&R systems refers to the interaction of D&R systems with their environments, which are mainly the downstream uses and services; these include water for drinking and irrigation supply (O1; see also P1), hydropower generation (O2; see also P2), releases to downstream watercourses, e.g., rivers, such as environmental flow, spillway release, flushing, and flooding (O3; see also P3), and the corresponding downstream impacts to users and water bodies.
Supporting infrastructure includes the electric power supply (S1), communications, operation, data collection, monitor and control (S2), transportation and access (S3), and personnel (S4). Electric power supply refers to the required power at the pumping stations, flow monitors, control gates, and SCADA locations. Communications, operation, data collection, monitor, and control include modes of communication, such as telephone, radio, e-mail, internet, and telemetry; SCADA, as well as the method of transmission of SCADA signals from control points (e.g., a weir) to a control device (e.g., a gate) and to the operations center; and records with data collected concerning daily infrastructure operations, as well as weather conditions and events. Transportation and access refer to (access) road conditions and driving conditions that can affect operations and staff response time. Personnel deal mainly with working conditions (indoor and outdoor) and maintenance operations.
In the present work, the time scale of D&R systems is assumed to be equal to their design working life [50], which is around 100 years [51]; this period determines the scenarios that are examined in the climate change assessment (see Section 3.2).

2.4. Potential Climate Change Impacts of Dam and Reservoir Systems and Their Typologization

In the present section, the potential climate change impacts on D&R systems are typologized and presented for each of the four groups of climate hazards (see Section 2.2) based on the literature [8,30,31,33,34,35,39,40,41,42]. For the typologization, the notation X-YY is used, where X is the symbol for the group of climate hazards (T, D, F, S, and W; see Section 2.2) and YY the symbol of the component (see Table 2).

2.4.1. Potential Impacts Due to Mean Air Temperature Increase and Extreme Heat

Mean air temperature increases and extreme heat may lead to (1) increased water temperature in rivers, which degrades their water quality due mainly to decreased dissolved oxygen (DO) concentrations, and (2) to earlier spring melting and thus earlier spring river floods (Τ-Ι) [52].
The water temperature in reservoirs increases due to air temperature increases, vegetation growth on and around dams increase due to longer growing seasons, evaporation rates and transpiration from vegetation and soils increase, water storage volumes decrease, and thermal stratification increases, i.e., steeper gradients are observed in the metalimnion due to the increased heating of the water surface (T-P1). Water quality is deteriorated due to increased water temperatures, which may lead to eutrophic conditions, the increased duration and frequency of algal and cyanobacterial blooms, decreased concentrations of DO, and the presence of emerging pollutants. Water quality degradation may result in adverse impacts on fish populations in the reservoirs, increased pest populations (e.g., midges that can be harmful to human health), and reductions in the recreation and esthetics value and biodiversity. Also, navigation problems for some crafts can be created due to increased vegetation (T-P4). Furthermore, reservoir volumes decrease due to increased evapotranspiration and the presence of plants, resulting in decreases in the potential for hydropower production (T-P3) and reductions in the esthetic value of the reservoirs (T-P4). Also, there are positive impacts of air temperature increases on the functions of D&R systems, such as improved flood control due to decreased water volumes (T-P2), increased visitor numbers in the shoulder season (extended recreation and tourism season) due to increased air temperatures, and increased esthetic value and recreation potential due to increased vegetation (T-P4).
Mean air temperature increases and extreme heat may also have a series of effects on the assets of D&R systems [8,30,53,54]. These effects in earthfill dams include the following: (i) increased growth of ground-covering shrubs on the dam face and crest (due to the extended growing season), especially when increased temperatures are combined with increased rainfall that may cause erosion; (ii) grass damage during dry (and hot) periods (frequency and duration) or during increased winter rainfall leading to saturation; (iii) heat stress/disease on certain tree species causing tree fall and uprooting during storm events (see S-A1); and (iv) the desiccation and shrinking of clay due to increased evapotranspiration (T-A1). In concrete dams, alkali–aggregate reactions may increase with temperature, inducing thermal expansion, cracking, and spalling in concrete that may have severe impacts on the safety and functioning of gravity dams, particularly spillway sections [54] (T-A2); furthermore, persistent drought and high temperatures cause internal water loss, resulting in drying and shrinking. When such shrinkage is restricted, cracks can appear and expand because of surface water loss. Moreover, UV can damage concrete, masonry and jointing material (T-A1). Spillways may be blocked due to increased vegetation, while concrete spillways may be cracked (expansion cracking) during high summer temperatures/diurnal variation and heat waves (T-A2). Also, concrete channels and wave walls may crack at high temperatures and metal elements, e.g., steel lining of tunnels or the bottom outlet valves, can be damaged due to expansions that are greater than the design tolerances (T-A3). In buildings, the demand for cooling power during hotter summers and increased heat waves increases; moreover, the lifespan of building components decreases due to increased thermal oxidation (T-A4).
Mean air temperature increases and extreme heat may have various impacts on the outflows of D&R systems [8,30,34,35,53]. Water may not be suitable for use due to degraded water quality, and treatment may be required; furthermore, the demand for drinking and irrigation water supply during hotter summers increases (T-O1). Power demand during hotter summers and increased heat waves affects long-term energy contracts (T-O2). The capacity of receiving watercourses to accept discharge decreases due to their high temperatures; their pollution also increases due to the reservoir’s increased water temperature and degraded water quality, while adverse impacts on fish populations of the receiving watercourses can be observed. Management conflicts may be created for multi-purpose reservoirs, when draw-down is required for primary functions, e.g., environmental flows (T-O3).
Mean air temperature increases and extreme heat may have the following impacts on supporting infrastructure: [8,30,34,53]: The risk of outages of power systems increases due to increased energy demand for cooling in summers, thus increasing the pressure on the grid; furthermore, the thermal stress and damage/failure of electrical and electronic components, such as batteries and transformers, increase (T-S1). Increased vegetation obscures monitoring sites and gauge boards and creates fouling on water level measurement equipment; also, monitoring devices can be damaged due to temperature increases (T-S2). Increased temperatures may result in cracking and rutting parking lot asphalt binders; furthermore, the access roads can be damaged due to reduced frost during high winter temperatures, and thus accessibility becomes poorer (T-S3). The maintenance access is reduced due to the increased growth of shrubs. Also, indoor and outdoor thermal comfort conditions are reduced, thus making working conditions more difficult. The spread of vector-borne diseases or pests in the region of the reservoir increases due to increased air temperatures, and its control becomes more difficult due to the presence of shrubs. These impacts result in reduced occupational health and safety, an increased number of workplace accidents, increased absenteeism and strain on personnel on duty, and, therefore, increased maintenance requirements and more difficult maintenance (T-S4).

2.4.2. Potential Impacts Due to Mean Precipitation Decrease, Aridity, and Droughts

Mean precipitation decreases, aridity, and droughts lead to reduced flowrates of rivers, resulting in the deterioration of river water quality due to the increased concentrations of incoming pollutants, i.e., due to decreased dilution (D-I); this impact is more pronounced when it coincides with temperature increases and heat waves.
Moreover, mean precipitation decreases, aridity, and droughts may result in reduced reservoir volumes and lower water levels due to lower water inflows (rainfall and river flows); degraded water quality due to increased concentrations of pollutants (reduced dilution); reduced water supply (D-P1) and hydropower generation potential (D-P3); the reduced recreation of esthetic value and biodiversity due to the exposure of littoral habitats; the prevention of certain types of recreation, such as sailing and/or causing access difficulties; the creation of health issues due to pollution (D-P4); and the improved flood control and increased flood routing capacity of the dam to reduce outflow peaks (D-P2) [8,30,53].
One of the most important climate change impacts on D&R systems are the prolonged low/fluctuating reservoir water levels (D-P1), which are a key driver of further potential impacts due mainly to the exposure of various parts of the dam to the environment and thus to climate hazards. High air temperatures and UV sunlight may cause damages to liners, joint materials, and binding mixes, such as the degradation of HDPE liners, the thermal cracking and spalling of concrete liners, the block cracking of asphaltic concrete liners (if asphalt dries out that may result in slumping and mass instability), the reduced performance of asphaltic binding mixes, and longitudinal cracking due to diurnal temperature variations (T-A1) [8]. Wind can cause waves on the water surface of reservoirs and subsequently the erosion of exposed parts, such as the soil through holes between large pieces of riprap, the bottom of pitching, and the shoulders; this erosion is more intense when the fetch is longer, which is the case in long reservoirs in the direction of the prevailing wind (S-A1). Heavy rainfall can also cause the drainage and erosion of joint materials, which can be exacerbated by trees and shrubs growing in joints; moreover, the increased frequency and duration of heavy rainfall can result in the poor drainage and erosion of exposed areas (F-A1).
Mean precipitation decreases, aridity, and droughts may also have the following impacts on earthfill dams: the desiccation and shrinkage of clay core and dam shoulders; seepage and possible piping failure; the loss of vegetation cover; soil erosion or subsidence (due to drought); increased erosion of the dam face (when drought is combined with intense rainfall); slumping of the upstream dam face due to more regular cycles of dam wetting; and drying due to reduced summer rainfall (D-A1). In concrete dams, drought can deteriorate certain properties of concrete, especially when it is combined with high temperatures, such as compressive strength, elastic modulus, creep deformation, and shrinkage deformation; this deterioration can cause the concrete to dry and shrink, owing to internal water loss, and when such shrinkage is restricted, cracks can appear and expand because of surface water loss (D-A1) [8,30,53].
Mean precipitation decreases, aridity, and droughts may affect the outflows of D&R systems. Water in the reservoirs may not be suitable for use due to its degraded water quality (higher concentrations of pollutants), and thus, treatment may be required; furthermore, the demand for drinking and irrigation water supply during hotter summers increases due to lower rainfall (D-O1). The hydropower generation potential decreases due to reduced water volumes in the reservoirs (D-O2). The water availability for flushing during summer decreases due to reduced flow rates; moreover, increased competition and management conflicts can be observed in multi-purpose reservoirs, when draw-down is required for primary function, e.g., environmental flows (D-O3).
Moreover, precipitation decreases, aridity, and droughts may lead to more difficult working conditions (D-S4).

2.4.3. Potential Impacts Due to Extreme Precipitation and Flooding

Extreme precipitation and flooding results in increased flow rates due to increased peak flows of extreme rainfall and increased sediment load, debris, mobilized vegetation, and turbidity (during flood events) that result in water quality deterioration (F-I1).
Extreme precipitation and flooding lead to increased water levels due to increased inflows, increased quantities of transported debris and mobilized vegetation, and increased concentrations of sediments and turbidity that deteriorate water quality and reduce the water storage volume (F-P1). Furthermore, the risks of reservoir flooding, overtopping, and downstream flooding increase (F-P2), more rapid fluctuations in operating water levels occur, including rapid filling or emptying as an operational response in advance of heavy rain, and reduced operating levels are used to alleviate flood risk (F-P2), thus reducing the availability or flexibility of hydropower generation (F-P3). However, during winter, the water availability for hydropower generation increases due to high precipitation (F-P3). Moreover, the recreational safety and the esthetic value are reduced due to the degraded water quality and negative impacts on navigation and sports, e.g., canoeing, are observed [8,30,53].
There are various effects of extreme precipitation and flooding on earthfill dams that include the following: (1) increased pore pressure due to the rapid fluctuations in operating water levels that may result in piping or mass instability; (2) increased risk of overtopping due to the increased water levels (above design levels) and subsequent erosion of the downstream face of the dam; (3) increased seepage (flow paths may exit higher up on the downstream face) due to increased water levels; and (4) increased erosion and damage to reservoir toes for reservoirs sited in floodplains (long-term, repeated, seasonal exposure to flooding could reduce reservoir toe integrity) (F-A1). The main effects on concrete dams are (1) an increased risk of overtopping, sliding, and overturning due to increased water levels, (2) an increased risk of dam cracking and failure when sudden heavy rainfall follows persistent drought (WD5), and (3) the increased drainage and erosion of joint materials due to fluctuating water levels or heavy rainfall (F-A1). Also, mobilized vegetation in flood flows may block the spillway; moreover, increased flow rates, flow velocities, and water levels in spillways may exceed design values and result in spillway failure (F-A2). Flaws in the spillway and out of channel flow scouring banks/reinforced bunds around spillway channels may deteriorate more rapidly due to the more frequent operation of the spillway (F-A3). The impacts on auxiliaries include (1) increased damage of dam components due to transported debris caused by intense precipitation; (2) increased pipe failure rates of newly installed cast iron pipes, because these are more susceptible to ground movement associated with large precipitation; (3) increased erosion and/or sediment build-up around ancillary structures; (4) landslides during storm events due to increased rainfall intensity or the drying out of the catchment; (5) increased failure rate of rigid water pipes during a long wetting period followed by a long warm and dry period, causing high volume changes in expansive soils; (6) increased silt buildup or blocking of inlets to valve structures due to increased catchment sedimentation; (7) increased rusting of dam components in winter rainfall that leads to wet conditions; and (8) increased risk of electrical failure (F-A3). Moreover, high precipitation increases the probability of damp and mold in buildings, while the flooding of powerhouses and other buildings may result in electricity supply outages (F-A4).
Transported sediments, debris, mobilized vegetation, and turbidity caused by the extreme precipitation and flooding lead to the deterioration of the water quality of the reservoirs, which may not be suitable for use, and thus, treatment may be required (F-O1). Also, the water availability or flexibility for hydropower generation decrease due to reduced operating water levels to face flood risk and increased water availability during winter for hydropower generation due to high precipitation (F-O2). Furthermore, potential flooding, overtopping, piping, and reservoir pollution (due to increased quantities of sediments and debris) may have significant negative impacts on downstream watercourses (F-O3).
Extreme precipitation and flooding increase the risk of electrical failure (F-S1), can damage access roads (F-S3), and can hamper communications (F-S2), working conditions (mainly outdoors), and maintenance (F-S4).

2.4.4. Potential Impacts Due to Strong Winds

Strong winds and their increased occurrence may increase evaporation in the reservoir, reduce the stratification and thus its stability (destabilization), deepen the surface layer (epilimnion) and reduce its temperature, and cause upwelling and (wind-induced) mixing. Subsequently, the resuspension of (particulate) sediments increases, resulting in an increase in turbidity and the internal nutrient loading that leads to the degradation of water quality (S-P1).
Moreover, strong winds may increase the erosion of exposed parts of the dam (S-A1), and the subsequent settling of eroded particulate matter sediment reduces the effective reservoir storage capacity, decreases the effective lifespan of dams, and lessens various reservoir functionalities (S-P1) [55]. These effects are more pronounced for shallow (stratified) reservoirs (i.e., high surface area to volume ratio) and for long reservoirs with long fetch (in the direction of the prevailing winds) and become less pronounced when both aquatic and terrestrial vegetation exist along the shoreline.
Waves from strong winds may cause damage to dam erosion protection, especially when they coincide with intense rainfall (see also F-A1). Strong winds may damage the slopes of the reservoirs, lead to wind lifting and damage to (HPDE) liners when there is no overburden in place, cause slumping and mass instability, and cause damage to buildings, masts, and poles (S-A1).
The high production of wind power locally can lead to the rapid downregulation of hydropower generation locally because of grid constraints (S-O2). Extreme winds and storms, like Medicanes (Mediterranean hurricanes), may damage monitoring equipment and operating controls, interrupt power supply to critical equipment (S-S1), and damage concrete poles (S-S2), buildings (S-A4), and other permanent structures.
Regarding combined effects, high winds and storms may cause the fall and uprooting of certain tree species (S-A1) that have been affected by heat stress/disease (see T-A1).

2.5. Climate Indicators for Dam and Reservoir Systems

Various indicators have been proposed by researchers in R&D systems; the most commonly used indicators are described in this section together with the corresponding symbols employed by specialized organizations, such as ETCCDI [56]; IPCC [57]; WMO [58]; Climate –Adapt [59,60]; and others [33].
The following indicators are used for mean air temperature increases (HC1) and extreme heat (HC2):
  • Average (TMm), maximum (TXm), and minimum (TNm) values of temperature (°C) for years, seasons (summer and winter), and months;
  • Longest heat wave in days, e.g., heatwave duration (HWD), and tropical days per year, e.g., the number of summer days (SU) with TX > 25 °C;
  • Year-on-year cooling and heating degree days, e.g., heating degree days (HDD) and cooling degree days (CD);
  • Beginning, end, and duration of the growing season and vegetation growth rates, e.g., growing season length (GSL) and growing degree days (GDD);
  • Diurnal and seasonal amplitudes, e.g., daily temperature range (DTR), which is the monthly mean difference between TX and TN;
  • Number of days with frost, cold, zero pass-through, high summer heat, and tropical heat, e.g., number of icing days (ID), which is the annual count of days when the TX (daily maximum temperature) < 0 °C, the number of frost days (FD), which is the annual count of days when the TN (daily minimum temperature) < 0 °C, the number of hot days, which is the number of days when the TX > 35 °C, and the number of tropical nights (TR), which is the number of days when the TN > 20 °C;
  • Evaporation and effective precipitation;
  • Whether precipitation falls as rain or snow;
  • Extent, duration, strength, and water content of snow cover;
  • The start of the spring flood and the length and depth of the frost period;
  • The start of icing, ice thickness, and duration of ice cover;
  • The water temperature in streams and reservoirs (WTLS).
The following indicators are used for mean precipitation decreases (WD1) and droughts (WD5):
  • Standard precipitation index in 3, 6, and 12 months (SPI-3, SPI-6, and SPI-12);
  • Standardized streamflow index (SSI);
  • Longest dry spell in days, e.g., consecutive dry days (CDDs);
  • Average, maximum, and minimum values for years, seasons, 14 days, and weeks, e.g., annual total precipitation on wet days (PRCPTOT);
  • Annual and seasonal precipitation change relative to the baseline period;
  • Average, minimum, and maximum values of river flows for years, seasons, months, 14 days, and weeks, e.g., river discharge index (RID), which is defined as the annual mean daily river discharge;
  • Drought with a return period T = 100 y.
The following indicators are used for extreme precipitation (WD2) and river flooding (WD3):
  • Number of days with heavy and extreme precipitation, e.g., number of days with precipitation > 10 mm (R10mm) and with precipitation > 20 mm (R20mm);
  • Extreme precipitation, e.g., extreme precipitation total index (R95pTOT), which is the total sum in a year of daily precipitation values exceeding the 95th percentile of the reference period (mm);
  • Maximum daily rainfall, e.g., maximum 1 day precipitation (Rx1day);
  • Number of 24 h extreme precipitation events that occur once in 20 or 50 years, e.g., 1 in 20 year return value for maximum one day precipitation (20Rx1day);
  • Number of days with one-hour total rainfall greater than 10 mm, with 24 h total rainfall greater than 25 mm (e.g., R25mm), or with 48 h total rainfall greater than 50 mm;
  • Frequency of Haldo-rain (HR), e.g., 1 day precipitation > 120 mm [33];
  • Mean winter wettest day precipitation;
  • Downpours and extreme rainfall volumes;
  • Rainfall–storm return period;
  • Average effective rainfall, e.g., effective precipitation (EP);
  • Average, minimum, and maximum values of river flows for years, seasons, months, 14 days, and weeks, e.g., river discharge index (RID), which is defined as the annual mean daily river discharge;
  • Frequency of 1, 2, 4, 7, 14, and 30 days of discharge for T = 50–10,000 years recurrence intervals;
  • Current and future high-water events;
  • Average and annual high-snow water content (measured or calculated);
  • Percentage of filling of reservoirs;
  • Soil moisture and surface runoff;
  • Start of spring flood;
  • River runoff, e.g., river flood index is the 50-year flood recurrence value based on maximum river discharge;
  • Probable maximum flow (PMF) and regionalized change factors (including upper and lower end estimates) for the 1 in 50-year return period flow;
  • Change in periods of recurrence of Inflow Design Flood (IDF) from T = 100 years to PMF;
  • Flood with return period T = 100 years, e.g., river flood index using runoff accounts for extreme water discharge, as it reports the value of daily river flow corresponding to a return period of 100 years.
The following indicators are used for winds (WA):
  • Mean wind speed;
  • Extreme wind speed.

2.6. Typologization of Climate Change Impacts on Dam and Reservoir Systems

The potential climate change impacts for these potential hazards are typologized and shown in Table 3, Table 4, Table 5, Table 6 and Table 7; these impacts can also be presented graphically in the form of impact chains [12].

2.7. The Case Study

The area of study extends along the Almopeos River; it consists of a narrow valley, through which the Almopeos River flows, fed by the runoff from the upstream hydrological basin of lowland and mountainous Almopia. The Almopeos dam will be constructed approximately 4 km north of the settlement of Kali, in front of the exit of the river from the gorge on the Giannitsa plain. Figure 2 and Figure 3 show a plan view of the Almopeos dam and a cross-section of the embankment, respectively. The reservoir has a volume of about 1.03 Mm3 and retains 35.5 Mm3 of water with a freeboard of 4.0 m at its maximum water level. In its main cross-section, the dam is 61.0 m high above the foundation level and its base width is about 350.0 m; its crest is 245.0 m long and 12.0 m wide. The slopes of the upstream and downstream shell of the embankment are equal to about 44.4%. The dam core is made of clayey silts, while the shells consist of coarse-grained soils. A 4.0 m thick coating, made of 3.0 m of rockfill and 1.0 m coarse grain soil, protects the upstream shell from erosion due to changes in water level and wave action. Two 6 m filters separate the clayey core from the shells. The foundation soils consist of a layer of alluvial soils, with an average thickness of about 9 m under the dam center line, and it will be processed with 40.0 m deep low-pressure concrete injections along the center line of the dam to prevent seepage through the alluvial layer underlying the embankment.

3. Results

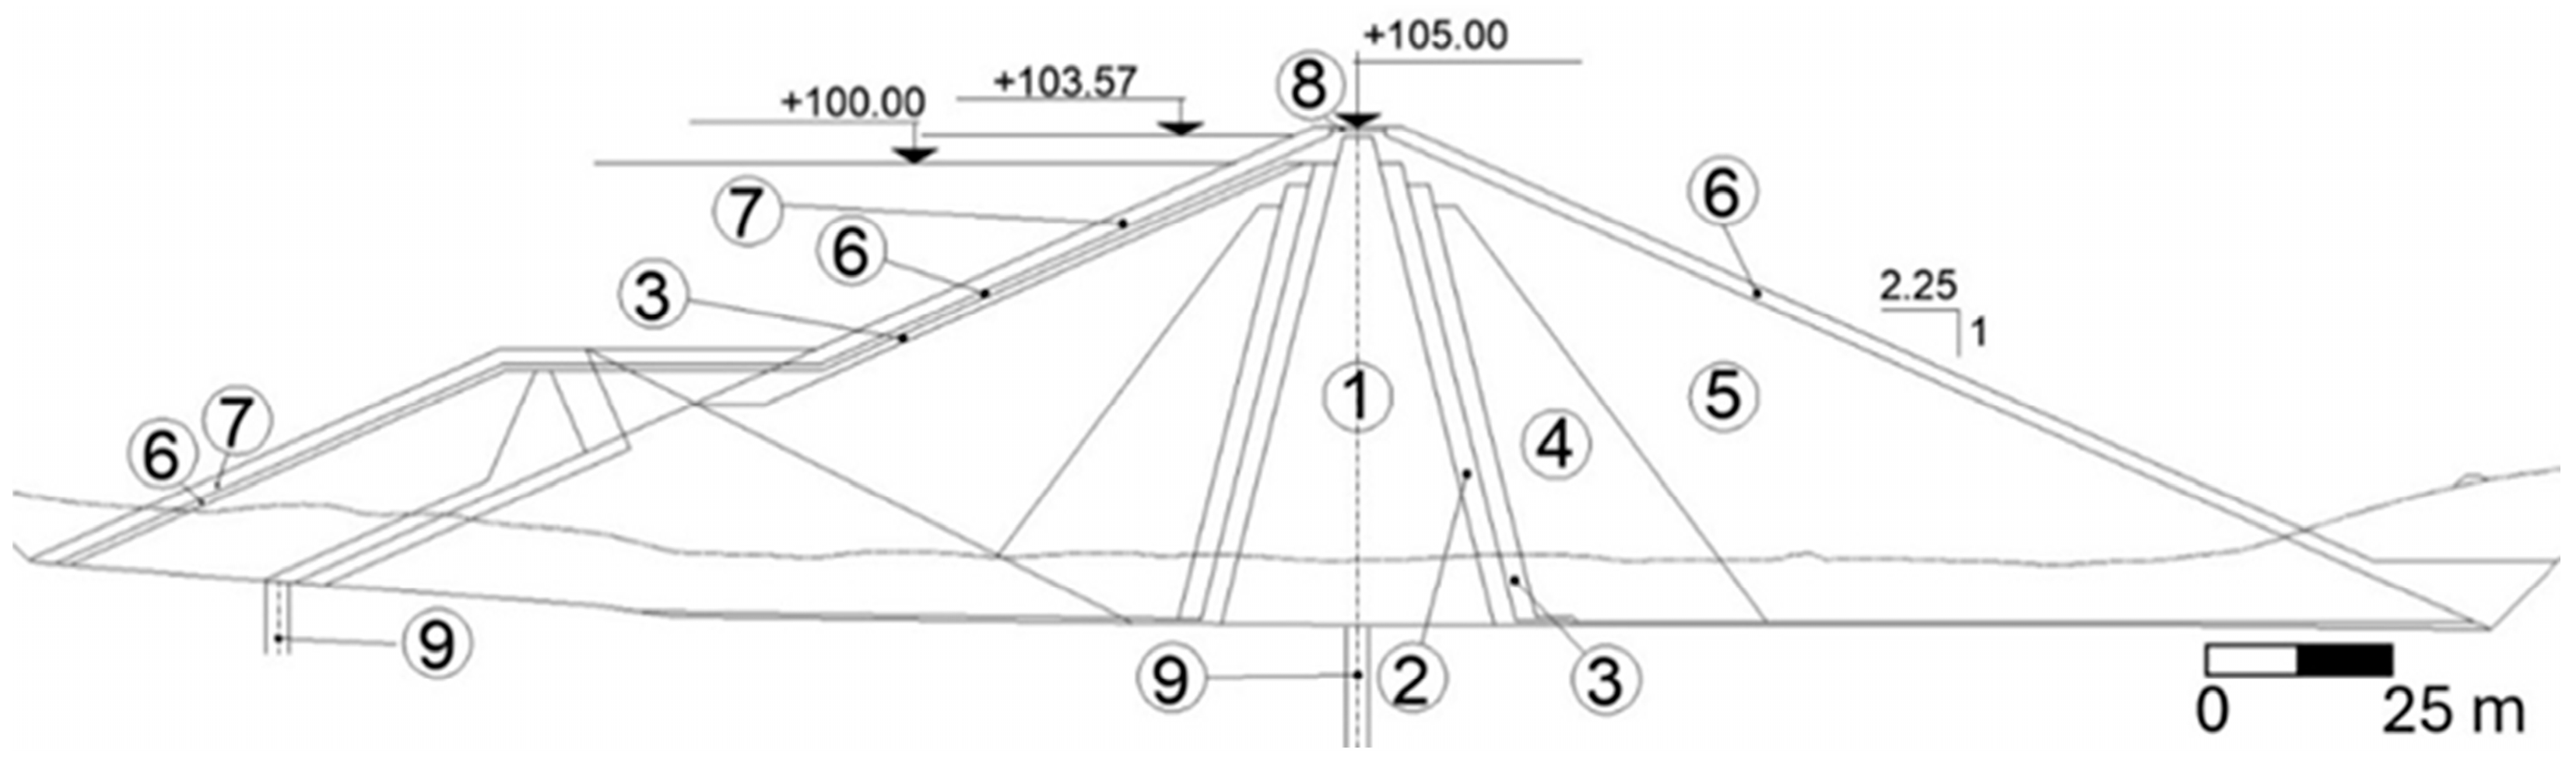
3.1. Description of the Almopeos Dam and Reservoir System

3.1.1. Components of the Almopeos Dam and Reservoir System

The main components of the Almopeos D&R system are described below.
  • Inflow (I). The inflow to the system is the water from Almopeos River; according to the River Basin Management Plan of Western Macedonia [61], its ecological status immediately upstream of the dam is good, but its chemical status is lower than good.
  • Processes (P). The water of the reservoir will be used for irrigation (P1). For safety reasons and to reduce the pollution of the water of the reservoir, deforestation, clearing, the cutting of bushes and trees, and their removal will be performed prior to the construction of the reservoir.
  • Earthfill dam (A1). The dam will be constructed with an impervious clay core, and nearby soil will be used for its layers. Rockfall (riprap) is employed on the dam’s faces for its protection against wave action and erosion. Therefore, there is no vegetation on the dam faces, and only unwanted vegetation can grow between the riprap voids. Moreover, there are no liners and joint materials on the dam.
  • Spillway (A2). The components of the spillway system are the following: (1) the inflow channel, (2) the spillway with 21 fusegates to increase the reservoir storage capacity and/or to increase the spillway discharge capacity, (3) the collector channel, (4) the drop channel, (5) the stilling basin, and (6) the escape channel that ends in the downstream river. All channels are made by reinforced concrete, except for the escape channel that is made by excavated natural soil and partly protected with stones. The fusegates are made of steel and are sealed with EDPM; each fusegate is 6.75 m long and 2.0 m high.
  • Auxiliary structures (A3). The main auxiliary structures of the Almopeos D&R system are the following: (1) vertical concrete well for discharge and irrigation supply; (2) pipelines for (i) discharge (steel pipe Ø1500, contraction to Ø1200, two butterfly control valves Ø1200, and Howell–Bunger valve Ø800 for flow regulation); (ii) irrigation (steel pipe Ø1500, Ø1200 control valve, and a flow meter); (iii) environmental flow (steel pipe Ø500, Ø500 control valve, and a flow meter); and (iv) sediment flushing (metal pipe Ø2500 encased in concrete and a high-pressure gate for downstream control). Sediment flushing is performed after the end of the irrigation season and in the first rain of the winter.
  • Buildings (A4). The administration building is an underground structure made with reinforced concrete with internal dimensions of 19.0 m × 8.40 m. In this building, the automation and remote-control system will be installed together with (1) the majority of the control devices and parts of the pipelines (see A3), (2) the required supporting infrastructure (see S) for the permanent work of the personnel, such as water supply, drainage, HVAC, telephone, data, internet, and other electrical installations, and (3) a bridge crane.
  • Outflow (O). The environmental flow ranges from 0.04 to 1.1 m3/s (O3).
  • Supporting infrastructure (S). Power supply is used for the operation of the bridge crane, the lights, the auxiliary equipment in the administration building, and the monitoring (S1). Flow is controlled by four control valves, a Howell–Bunger valve, two electromagnetic flow meters, and a high-pressure gate. Monitoring is performed (i) for leakage, seepage, and pore water pressure via hydraulic, electrical, and pneumatic piezometers; (ii) settlement and deformation in the interior of the dam via vertical tube extensometers and inclinometers; and (iii) force feedback digital accelerometers. The project site is assessed via two existing rural roads. The first road starts from the settlement of Kali and runs along the left (eastern) bank of the Almopeos River, along which the water supply pipe to the irrigation networks runs, while the second road starts from the settlement of Profitis Ilias and runs along the right (west) bank of the river (see Figure 1). There are no permanent staff on the site of the project, but there will be regular visits from personnel for operation and maintenance purposes.
  • The timescale of all components was set equal to 100 years.

3.1.2. Potential Climate Hazards and Impacts on the Components of the Almopeos Dam and Reservoir System

Based on the available data and information, the following groups of climate hazards are considered in the Almopeos D&R system: (1) mean air temperature increase (HC1) and extreme heat—heat waves (HC2), (2) mean precipitation decrease (WD1) and droughts (WD5), and (3) extreme precipitation (WD2) and river flooding (WD3). Using the typology of Section 2.4 and the description of the case study of Section 3.1.1, the main impacts of these groups are presented in the following text and are summarized in Table 6.
Table 6. Overview of the main potential impacts of Almopeos dam and reservoir system.
Groups of ComponentsTemperature
Increase and
Extreme Heat
(HC1 and HC2)
Precipitation
Decrease,
Aridity and Droughts
(WD1, WD4, and WD5)
Extreme
Precipitation
and Flooding
(WD2 and WD3)
I
Inflows
Increased river water temperature; degraded water quality (Τ-Ι).Reduced flow rates; degraded water quality (D-Ι).Increased flow rates, sediment loads, and debris; mobilized vegetation; degraded water quality (F-I).
P
Storage
Increased water temperature; increased stratification; degraded water quality; impacts on fish (T-P1).Reduced reservoir volumes; reduced water levels; exposure of parts of the dam; degraded water quality; reduced irrigation water potential (D-P1).Increased water levels; increased sediments, debris, mobilized vegetation, and turbidity; degraded water quality; reduced water storage volume due to increased volumes of sediments (F-P1); increased risk of flooding, overtopping, and downstream flooding (F-P2).
A
Assets
Desiccation and shrinking of clay core (T-A1); expansion cracking of concrete spillway (T-A2); cracking of concrete spillway channels (T-A3); increased power demand for cooling and reduced lifespan of building components (T-A4).Desiccation and shrinking of clay core (D-A1).Increased pore pressure; increased risks for piping, overtopping, seepage, and erosion (F-A1); increased risk of spillway failure due to increased flow rates, flow velocities, and water levels (F-A2); damage of dam components due to debris (F-A3); damp and mold, inundation, and electricity supply outage in the administration building (F-A4).
Outflows (O)Increased water irrigation demand during hotter summers (T-O1); degraded water quality downstream of the reservoir and impacts on fish; conflicts in water withdrawals for environmental flow (T-O3).Increased demand for irrigation water during hotter summers (D-O1); reduced availability for flushing during summer and management conflicts (D-O3).Impacts to downstream watercourses due to flooding, overtopping, piping, and pollution (F-O3).
Supporting infrastructure (S)Increased risk of damage of access roads (T-S3); increased maintenance difficulty and requirements (T-S4).More difficult working conditions and maintenance (D-S4).Increased risk of electrical failure (F-S1); increased damaged access roads (F-S3); more hampered communications (F-S2); more difficult working conditions and maintenance (F-S4).
  • Impacts due to mean air temperature increase and extreme heat–heat waves.
T-I. River temperatures will increase due to increased air temperature; in a study performed at 43 geographically diverse streams and river sites in 13 countries, it was found that a 1-degree increase in air temperature results in an increase of about 0.6 to 0.8 degrees in river temperature [62]. According to the Water Management Plan of West Macedonia [61], the chemical status of the Almopeos River upstream of the dam is lower than good; this is mainly due to the runoff of the nutrients from the agricultural area of Aridea that originate from chemical fertilizers, manure, and wastewaters. River water temperature increases can further deteriorate its water quality.
T-P. The water temperature in the reservoir will increase, resulting in increased water temperature, increased vegetation growth, increased evapotranspiration, reduced water storage volume, increased stratification, degraded water quality, and increased adverse impacts on fish. The effect of increased vegetation growth and the subsequent effects, such as the increased evapotranspiration and reduced water storage volume, are not expected to be significant due to the removal of bushes and trees from the project site prior to the construction of the reservoir. However, possible tree fall in the high elevations of the water basin and their uprooting can occur during storm events. The degradation of water quality is due mainly to eutrophication (T-P1).
T-A. Due to the presence of riprap, only unwanted vegetation can grow in their voids. The shrinkage of clay core can occur, but the remaining water below the abstraction well will prevent the core from drying completely (T-A1). The expansion cracking of the concrete spillway during high summer temperatures and heat waves can occur. Spillway blockage due to vegetation carried by the river flow can also occur; however, this risk is low due to the removal of vegetation prior to the construction of the reservoir and the fusegates’ system that cannot be blocked (T-A2). Cracking concrete structures, such as spillway channels, or the expansion of metal elements may occur; however, this is not likely since most concrete structures and metal parts are protected against high temperatures (T-A3). Moreover, most of the auxiliaries are located inside the administration building. Increased power demand for cooling during summer months may result in a reduced lifespan of building components (T-A4).
T-O. The irrigation demand is expected to increase during hotter summers (T-O1). Also, the capacity of the downstream Almopeos River to accept discharge can be reduced due to its high temperature and the degraded discharged water quality that may have negative impacts on fish populations and create conflicts in water withdrawals for environmental flow maintenance (T-O3).
T-S. A power supply is used for the bridge crane, lights, and monitoring, and this is not expected to increase noticeably. Therefore, an increased risk of outages due to temperature increase will not affect the system, except for the maintenance of the auxiliary components in the administration building (T-S1). Damage to the electrical and electronic components of the crane is not likely to occur. Obscuring monitoring sites and gauge boards and damage to the monitoring devices are unlikely to occur (T-S2), because most of the monitoring devices are not sensitive to temperature (below 50 °C). Asphalt binders and access roads can be damaged by temperature increases (T-S3); this effect may be significant when it is combined with excessive loading [30] and may increase maintenance difficulty and requirements (T-S4).
2.
Impacts due to mean precipitation decrease, aridity, and droughts.
D-I. Reduced flow rates due to low rainfall and drought can decrease the dilution of pollutants in the incoming river water from the agricultural area of Aridea and can result in degraded river water quality (D-I), especially when low flow rates are combined with temperature increases and heat waves (T-I).
D-P. Reduced reservoir volumes and water levels during the irrigation period (April to September) result in prolonged low/fluctuating reservoir water levels and exposure of parts of the dam, degraded water quality, and reduced irrigation water potential (D-P1).
D-A. The desiccation and shrinkage of the clay core can occur; however, the remaining water below the abstraction well will prevent the core from drying completely. The erosion of the exposed parts of the dam due to waves caused by strong winds on the water surface of reservoirs can hardly occur due to the presence of riprap (D-A1). There are no auxiliaries exposed to environmental hazards, except for the upper part of the abstraction well (D-A3). The spillway (D-A2) and the administration building (D-A5) are not expected to be affected by precipitation decreases, aridity, and droughts.
D-O. An increased demand for drinking and irrigation water can occur during hotter summers (D-O1); a reduced availability for flushing during summer may occur; and management conflicts for multi-purpose reservoirs may occur (D-O3).
D-S. More difficult working conditions and maintenance (D-S4).
3.
Impacts due to extreme precipitation and river flooding.
F-I. Increased flow rates can result in higher sediment loads and debris, mobilized vegetation, and degraded water quality due to pollutants from the agricultural area of Aridea, which will deteriorate the river water quality (F-I).
F-P. The following may occur: increased reservoir water levels; increased sediments, debris, mobilized vegetation, and turbidity; degraded water quality due to polluted river water; reduced water storage volume due to sediment (F-P1); an increased risk of flooding, overtopping, and downstream flooding (F-P2); and increased sedimentation, which can cause problems in the area of water abstraction, meaning flushing may be required.
F-A. Increased pore pressure and increased risks of piping, overtopping, seepage, and erosion may occur (F-A1). The blockage of the spillway due to mobilized vegetation is unlikely to occur due to the removal of vegetation and the fusegate system; however, the risk of failure due to increased flow rates, flow velocities, and water levels and the rapid deterioration of flaws cannot be ignored (F-A2). The following may occur: the damage of dam components due to debris; the failure of pipes; erosion and sediment build-up around structures; landslides; silt buildup and the blocking of inlets; the rusting of dam components; and the rapid deterioration of flaws (F-A3). Damp and mold due to high precipitation, inundation, and electricity supply outages in the administration building may also occur (F-A4).
F-O. Potential flooding, overtopping, piping, and reservoir pollution (due to increased quantities of sediments and debris) may have significant negative impacts on downstream watercourses (F-O3).
F-S. Extreme precipitation and flooding increase the risk of electrical failure (F-S1), can damage access roads (F-S3), hamper communications (F-S2), and make working conditions (mainly outdoors) and maintenance more difficult (F-S4).

3.1.3. Climate Indicators for the Almopeos Dam and Reservoir System

The assessment of climate exposure for the Almopeos dam and reservoir system relies on a set of climate indicators that capture key variables influencing dam performance under changing climatic conditions. The selection of these indicators is guided by their relevance to the dam’s vulnerability, their measurability, and their alignment with established methodologies, such as those outlined in Section 2.5 and Table 7.
The selection process considered several factors. First, indicators were chosen based on their ability to represent the major climate hazards identified in Section 2.4, including temperature increases, precipitation variability, and extreme weather events. Second, each indicator reflects potential effects on key dam functions, such as water storage, structural integrity, and operational efficiency. Finally, the selection was constrained by available research studies, hydrological models, and engineering assessments for the Almopeos region.
Building on this framework, we utilize nine key indicators, as presented in Table 7, alongside the criteria for defining “medium” scale exposure, which are further explained in Section 3.3. This selection was mainly based on the classification outlined in Table 5, Table 6 and Table 7; however, the process was limited by the scarcity of research papers and engineering reports providing the specific scaling of these indicators (used in the vulnerability analysis in Section 3.3).
Table 7. Climate indicators and medium exposure thresholds relative to the 1981–2000 baseline period.
Climate HazardIndicatorSymbolMedium Exposure Thresholds
(Δ from 1981 to 2000 Baseline)
HC1 and HC2Annual mean daily minimum temperature (°C)TNm1 ≤ Δ < 2 [63]
Annual mean daily maximum temperature (°C)TXm1 ≤ Δ < 2 [63]
Hot days:
annual count of days with daily maximum temperature >30 °C
HD10 ≤ Δ < 20 [63]
Annual count of days with daily maximum temperature >35 °CTX3510 ≤ Δ < 20 [63]
Tropical nights: annual count of days with daily minimum temperature >20 °CTR20 ≤ Δ < 30 [63]
WD1, WD4, and WD5Annual total precipitation on wet days (mm)PRCPTOT−25% ≤ P < −10% [43,45]
−10 ≤ Δ < −5 [63]
566–835 [64]
Consecutive Dry Days: maximum number of consecutive days with daily precipitation less than 1 mm in a year CDD10 ≤ Δ < 20 [63]
40–60 [43,45];11–20 [65]; 31–50 [66]
WD2 and WD3Annual count of days when precipitation is ≥20 mmR20mm1 ≤ Δ < 3 [63]
Annual maximum one-day precipitation (mm)Rx1day5 ≤ Δ < 10 [63]
10.1–25.0 [66]; 7.6–35.5 [67]; 10–35.5 [68]; 20–50 [69]

3.2. Climate Change Impact Assessment

The climate change impact assessment for the Almopeos dam and reservoir system relies on high-resolution bias corrected climate and hydrologic projections. Three General Circulation Models (GCMs), which are EC-EARTH (r12i1p1), HadGEM2-ES (r1i1p1), and MPI-ESM-LR (r1i1p1), and the regional climate model (RCM) RCA4 were selected from the EURO-CORDEX ensemble and combined. These three GCM-RCM combinations were specifically chosen for their demonstrated accuracy in simulating atmospheric circulation, temperature gradients, and precipitation extremes, which are critical for understanding the vulnerabilities of the Almopeos D&R system [70,71]. Together, they provide a robust framework for capturing model uncertainties and regional climate characteristics. The assessment was conducted across several temporal and concentration scenarios, including the historical reference period from 1981 to 2000 and future scenarios for 2041–2060 and 2081–2100 under both medium-concentration (RCP4.5) and high-concentration (RCP8.5) pathways, namely to account for both short-term and long-term climate risks and for the potential variability in global greenhouse gas emissions [72].
Key climate indicators from the EURO-CORDEX models, bias-corrected against ERA5 Land [73], were used to quantify the potential climate impacts on the Almopeos D&R system. For temperature, metrics such as the annual mean daily minimum and maximum temperature (TNm and TXm, respectively), the number of hot days exceeding 30 °C and the number of days exceeding 35 °C (HD and TX35, respectively), and the number of tropical nights (TR) were analyzed. These indicators help capture the effects of heat stress and increased evaporation on reservoir dynamics. Precipitation-related indicators included total annual precipitation (PRCPTOT), the frequency of heavy precipitation days exceeding 20 mm (R20mm), annual maximum one-day precipitation (Rx1day), and the consecutive dry days (CDDs) to account for risks related to droughts, extreme rainfall, and changes in hydrological flow patterns. The indicators were selected for their relevance to the Almopeos D&R system and their ability to capture critical aspects of climate-induced vulnerabilities.
For the selected scenarios and time periods, the values of the indicators were calculated using EURO-CORDEX models and are shown in Table 8.

3.3. Vulnerability Assessment

3.3.1. Sensitivity Analysis

The sensitivity of a D&R system to a climate hazard can be defined as the degree to which the D&R system and its components are affected by this climate hazard [74]. The sensitivity assessment is based on a series of evaluation criteria, which, in the present work, are the five groups of components shown in Table 2. These criteria, which are input (I), functions and processes (P), assets (A), outflow (O), and supporting infrastructure (S), are virtually the same as the themes proposed by EC [37]. The sensitivity analysis of the Almopeos D&R system was based on expert discussions with engineers from consulting companies specializing in the design of dams, including the company that performed the design of the project. To simplify the analysis, three scales, “Low (L)”, “Medium (M)”, and “High (H)”, were used, as shown in Table 9, which depicts the sensitivity scores for (i) each component of the Almopeos D&R system, (ii) each group of components (the highest of each group), and (iii) the Almopeos D&R system (the highest of all groups) for the three examined groups of hazards. From Table 9, the following are depicted:
  • The components that show the highest sensitivity, ranging from medium to high, are the input (i.e., the river water, I1), the storage (P2), the assets, i.e., the dam (A1) and the spillway (A2), and the outflow (i.e., water for irrigation, O1). These components show medium to high sensitivity to WD2 and WD3 and WD1, WD4, and WD5 and medium sensitivity to HC1 and HC2.
  • The components that show low to medium sensitivity are the building (A4) and the water release (O3), while all components of the group of supporting infrastructure (S1 to S4) are practically insensitive to WD1, WD4, and WD5.
  • The highest score of all groups of components for each group of hazards are medium for HC1 and HC2 and high for WD2 and WD3 and WD1, WD4, and WD5.

3.3.2. Exposure Analysis

The exposure of a D&R system to a climate hazard can be defined as the degree to which the D&R system is exposed to this climate hazard due to its location [74]. In the exposure analysis of the Almopeos D&R system, the groups of climate-related hazards to which the system may be subject at its location, both under current climate conditions and those projected for the future within the expected lifespan, are assessed. The exposure analysis was performed for the three groups of components based on the values of the selected indicators that are shown in Table 7 and the proper scales of exposure. In the literature, there are only a relevant few works that either provide ranges of values for the scales of exposure indicators as (i) actual values [64,65,66,67,68,69] or (ii) differences from values in reference conditions [43,45], expressed as actual values (Δ) or percentages (P, %); in Table 7, the ranges of the values of these works for the medium scale of exposure are shown.
In the present work, the differences in actual values (Δ) are used for medium exposure, which are shown in Table 7, based on [63]. Moreover, the three scales, “Low (L)”, “Medium (M)”, and “High (H)”, were employed to simplify the analysis and to ensure consistency with the scales of sensitivity analysis; exposure is characterized as “low” or “high” when values are lower or higher than those of “medium” exposure, respectively. Figure 4 shows a graphical representation of the comparison of the values of the exposure indicators for the three groups of climate hazards examined; the left column refers to the first period (2041–2060) and the right column to the second period (2081–2100).
The exposure analysis was performed using the same indicators for all components of the Almopeos D&R system, which are (i) the annual mean daily maximum temperature (TXm) for the temperature increase and extreme heat (HC1 and HC2), (ii) the consecutive dry days (CDD) for the precipitation decrease, aridity, and droughts (WD1, WD4, and WD5), and (iii) the annual maximum one-day precipitation (Rx1day) for extreme precipitation and flooding (WD2 and WD3); the results for the Almopeos D&R system are summarized in Table 10, while the detailed analysis for all the components of the Almopeos D&R system and their groups are shown in Table 11, which is discussed in Section 3.3.3 (Vulnerability Analysis).
From Figure 4 and Table 10, the following are depicted:
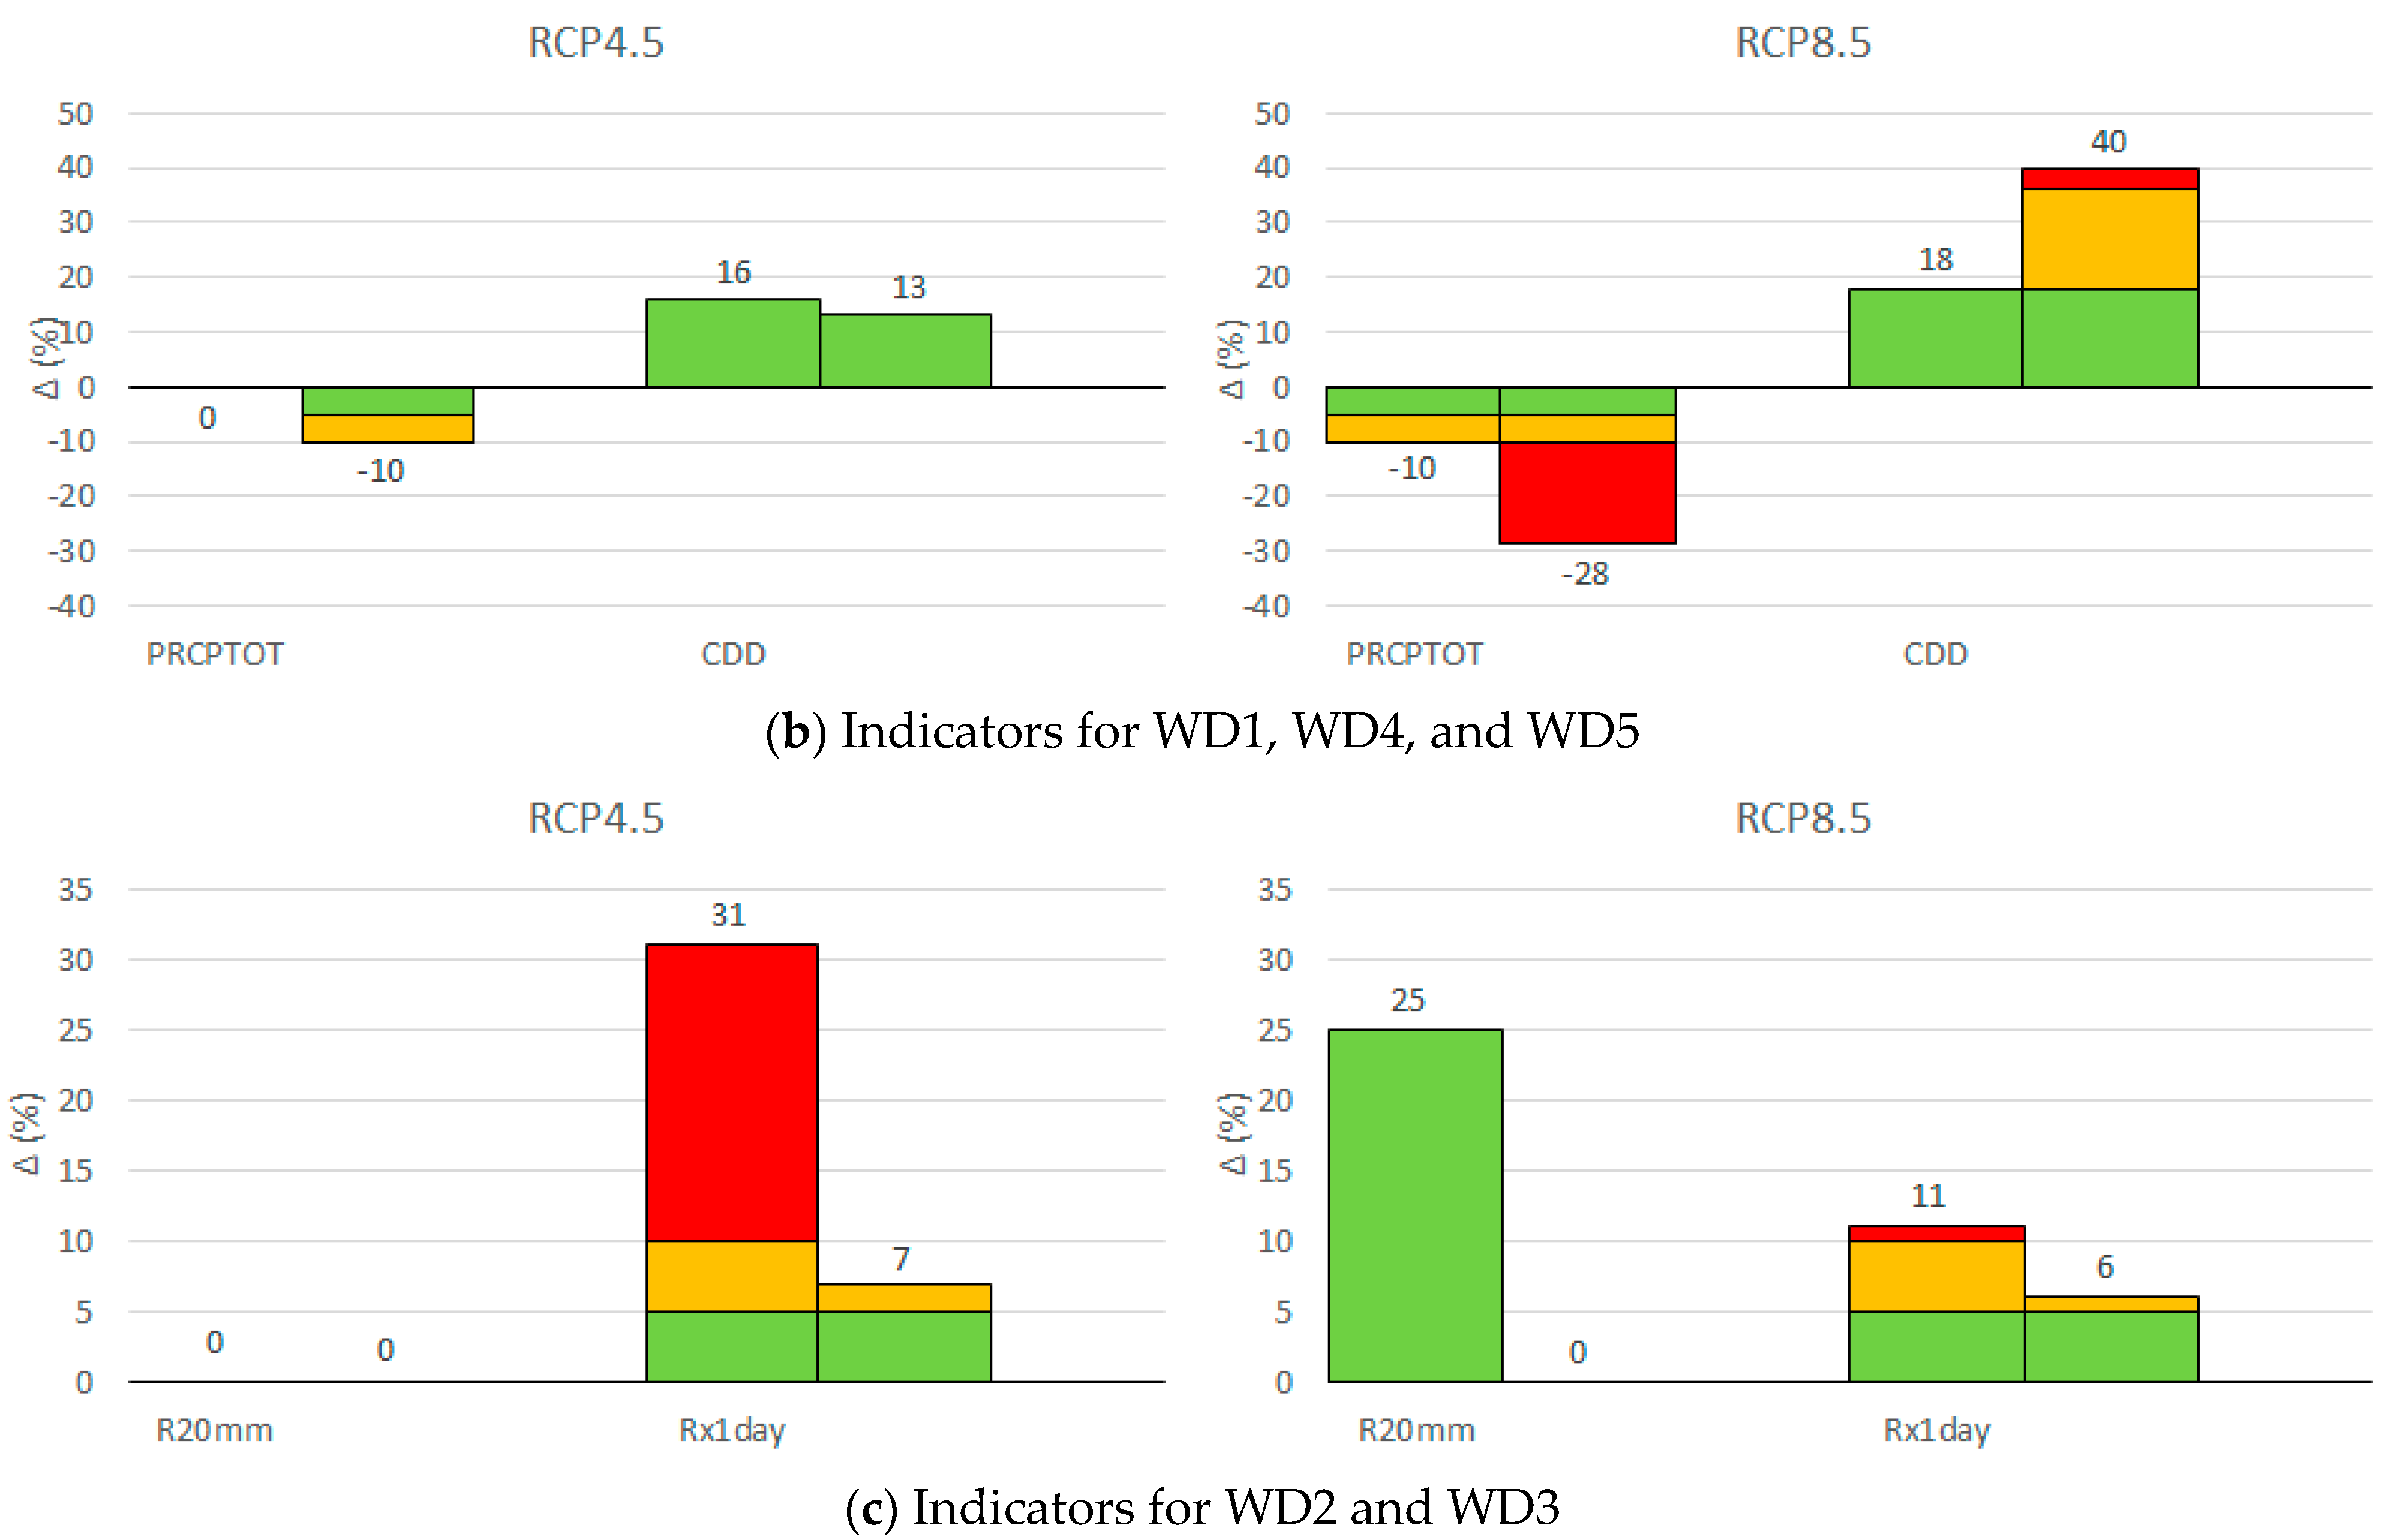
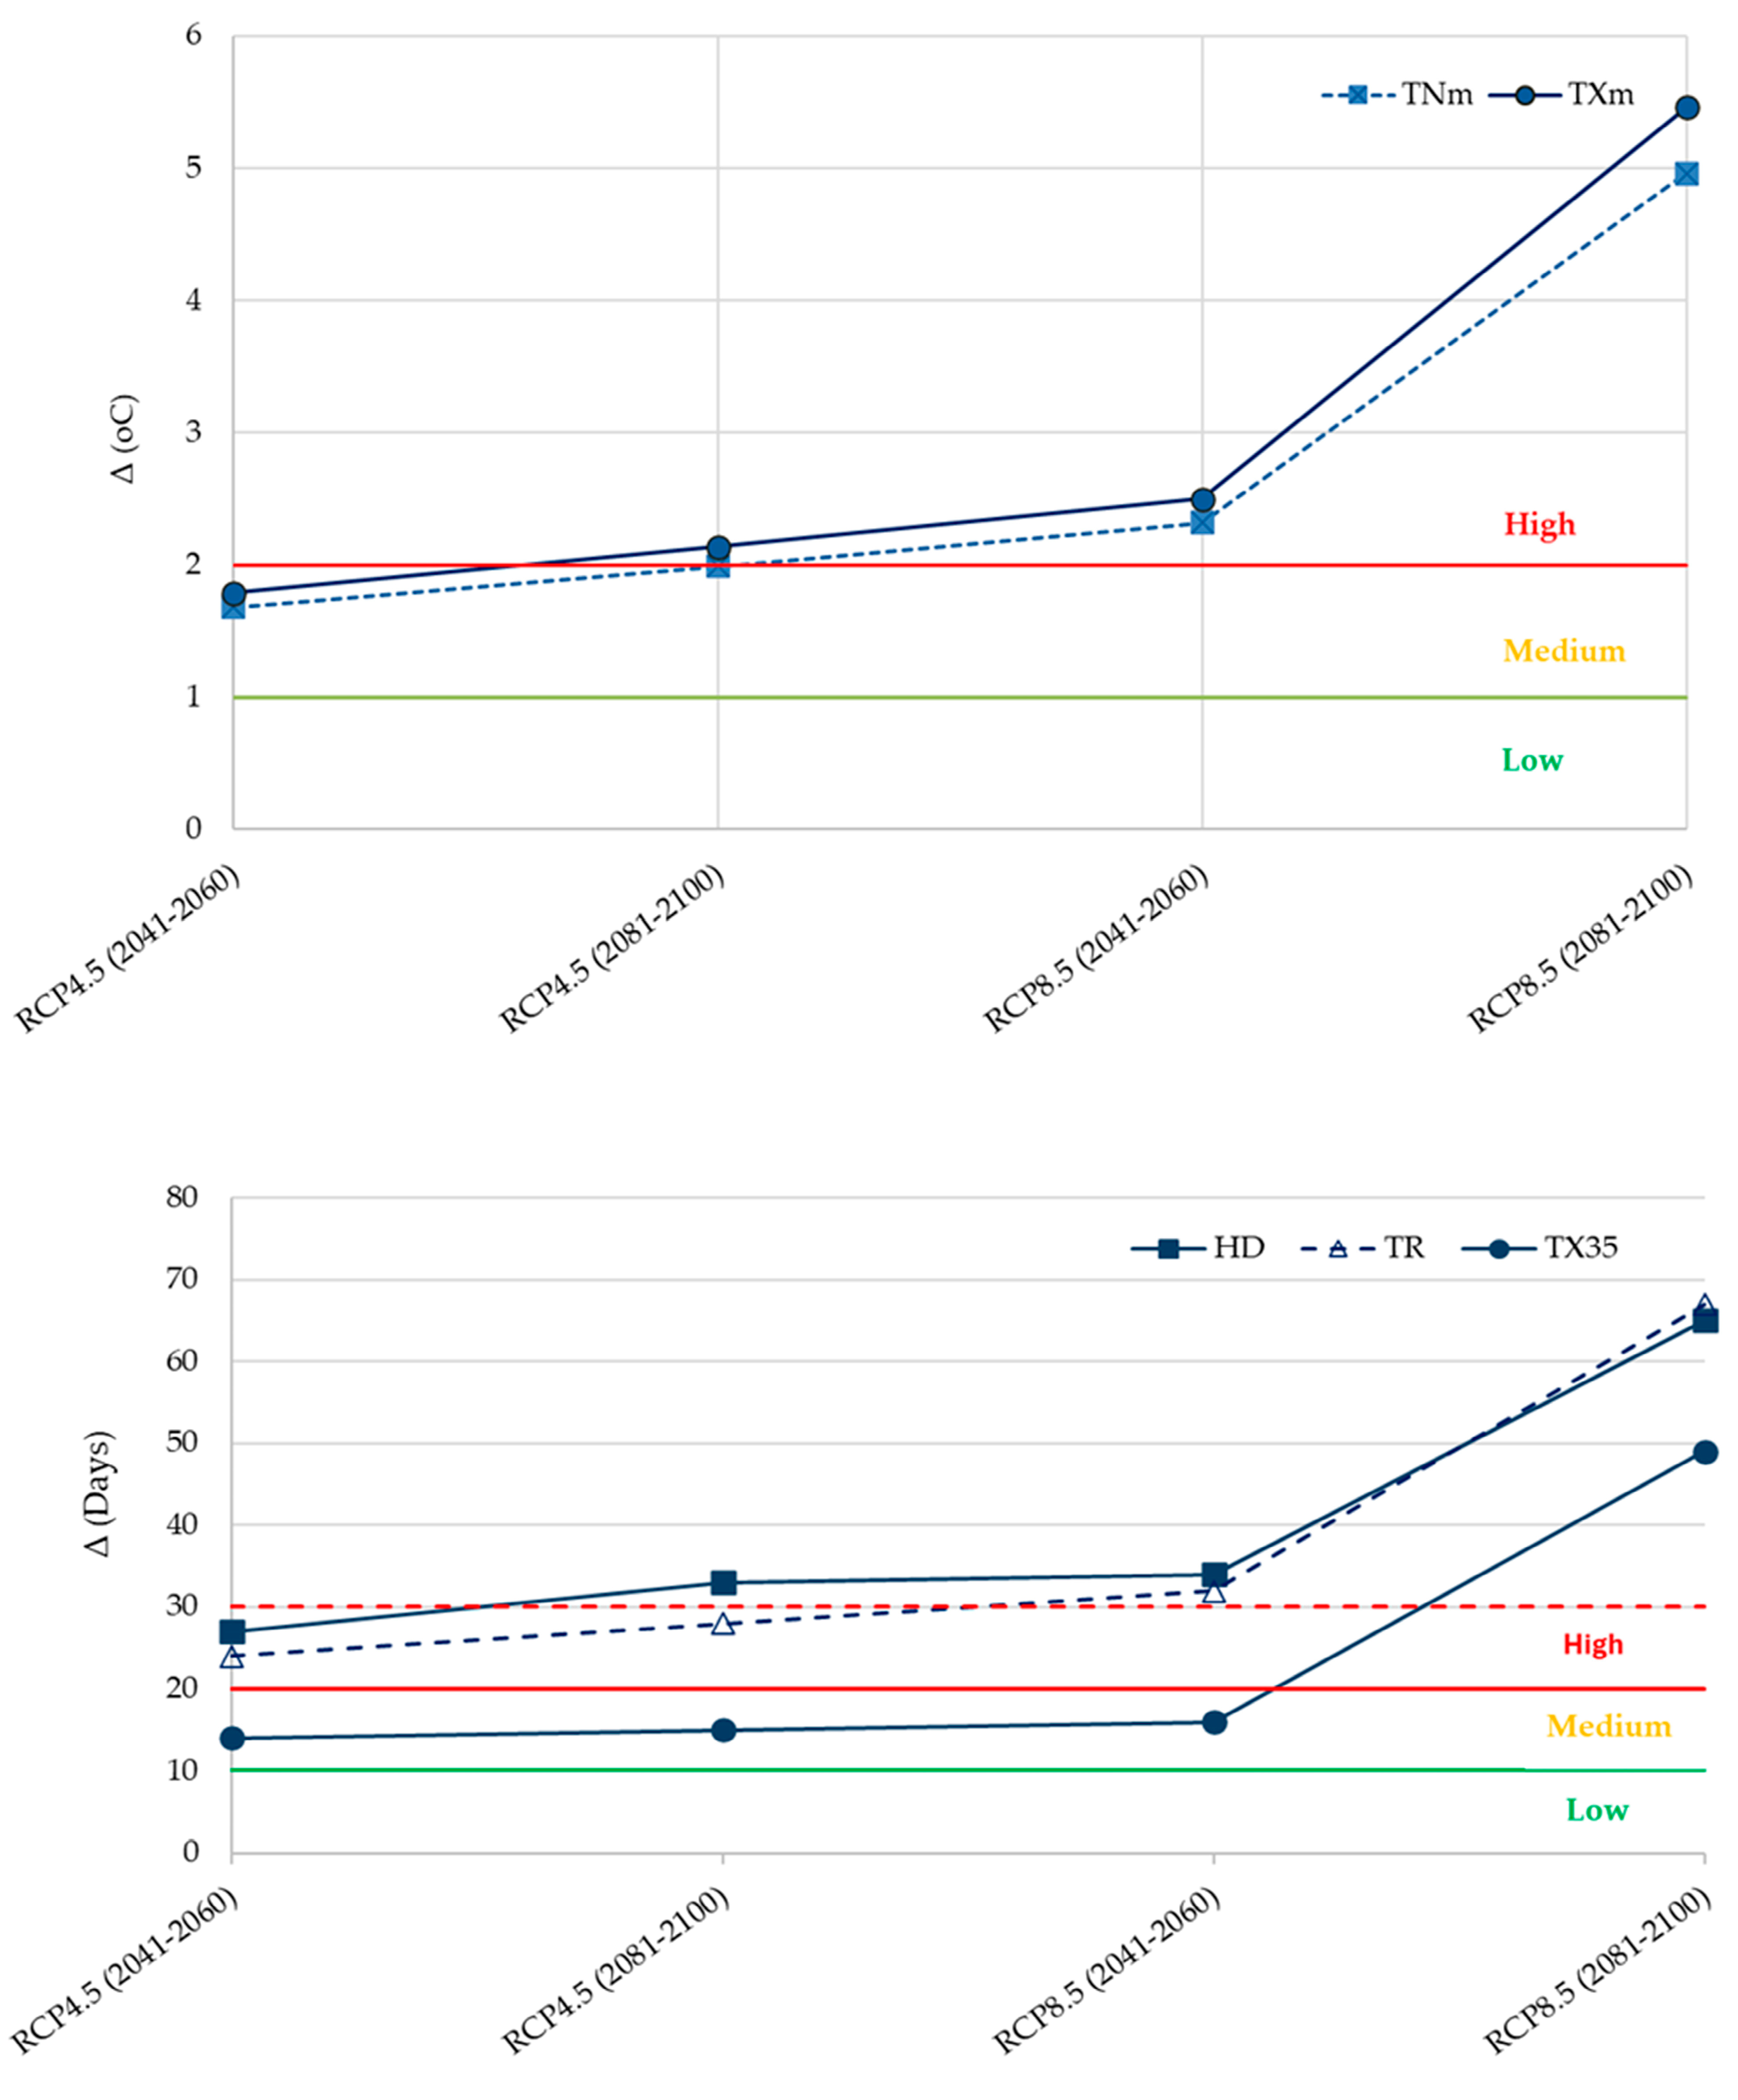
  • For group hazards HC1 and HC2, the scenario RCP8.5 shows high exposure in both periods, while the scenario RCP4.5 shows medium exposure in the first period (2041–2060) which becomes high in the second period (2081–2100).
  • For group hazards WD1, WD4, and WD5, the exposure for the scenario RCP8.5 is medium in the first period and high in the second period, while the exposure is low in both periods for scenario RCP4.5.
  • For group hazards WD2 and WD3, both scenarios RCP8.5 and RCP4.5 show high exposure in the first period, while in the second period, exposure is reduced to medium.

3.3.3. Vulnerability Analysis

The vulnerability of a D&R system to a climate hazard can be defined as its redisposition to be adversely affected by this climate hazard considering its capacity to adapt [75]. In the vulnerability analysis of the Almopeos D&R system, the results from the sensitivity analysis of Table 9 and the exposure analysis of Table 11 are combined to formulate Table 11, which shows the outcome of the vulnerability assessment. In Table 11, the following notation is used: V(S/E), where V, S, and E are the scores of vulnerability, sensitivity, and exposure, respectively. High vulnerability (H) indicates a scenario where both sensitivity and exposure are high or one of them is high and the other is medium; low vulnerability (L) indicates a scenario where both sensitivity and exposure are low or one of them is high and the other is medium; and medium vulnerability (V) indicates a scenario where both sensitivity and exposure are medium or one of them is high and the other is low. For example, the notation M(H/L) denotes a scenario where high sensitivity (H) is combined with low exposure (L) to produce medium vulnerability (M). Table 11 reveals the following:
  • For group hazards HC1 and HC2, the scenario RCP8.5 shows the same scores in both periods; all groups are highly vulnerable to HC1 and HC2. However, in the scenario RCP4.5, all groups show a medium vulnerability in the first period (2041–2060) that becomes high in the second period (2081–2100).
  • For group hazards WD1, WD4, and WD5, the vulnerability of the scenario RCP8.5 ranges from medium to low in the first period (2041–2060); however, these scores increase in the second period (2081–2100) and range from medium to high. In both periods of RCP4.5, all groups show low to medium vulnerability. The components that show the minimum vulnerability are auxiliaries (A3) and buildings (A4) from the group of assets and practically all the components of the group of supplementary infrastructure (S).
  • For group hazards WD2 and WD3, both scenarios RCP8.5 and RCP4.5 show high vulnerability in both periods for all groups, except for the group of the supplementary infrastructure (S), whose vulnerability is reduced to medium in the second period (2081–2100).
Based on Table 11 and the above-mentioned findings, and considering high (H) or medium (M) vulnerability as significant, all three groups of hazards emerge as potentially significant hazards for all conditions and periods. Consequently, a detailed risk assessment for each of the three groups of hazards is required; if the vulnerability assessment had justified that the vulnerability of a group of climate hazards was ranked as low (L), then no further risk assessment for this group hazard would be needed.

4. Discussion

4.1. Effect of the Use of Other Climate Indicators

The vulnerability assessment was performed using the indicators TXm, CDD, and Rx1day. To investigate the effect of the use of other indicators, the vulnerability assessment was repeated using the rest of the indicators—TNm, HD, TX35, TR, PRCPTOT, and R20mm—from Table 7. The results are summarized in Table 12 and Table 13, and the findings are discussed in the next paragraphs. In Table 12 and Table 13, the effect of the value of the indicator is shown with arrows ↑ and ↓ that denote an increase or decrease, respectively, of the score of exposure or vulnerability. It is noted that the score of sensitivity was assumed to be independent of the climate change scenarios.
For group hazards HC1 and HC2, the use of the annual mean daily minimum temperature (TNm) and the number of days with a daily minimum temperature > 20 °C (TR) shows the same behavior and thus produces the same outcome for the exposure analysis. In comparison with TXm, TNm and TR show the same behavior as TXm, except for the second period of scenario RCP4.5, which produces medium vulnerability, lower than the high vulnerability when TXm is used. Τhe use of HD produces high vulnerability for all scenarios. In comparison with TXm, HD shows the same behavior as TXm, except for the first period of scenario RCP4.5, which produces high vulnerability, higher than the medium vulnerability when TXm is used. Generally, the use of TNm, TR, and TX35 show lower scores than TXm, while the use of HD shows higher scores than TXm. This behavior can be explained with the help of Figure 5, which graphically shows the values of the indicators for the group HC1 and HC2 in the two periods of the two scenarios.
For group hazards WD1, WD4, and WD5, the use of PRCPTOT shows the same behavior as CDD, except for the second period of scenario RCP4.5. In this scenario, the vulnerability of all groups increases from medium (M) to high (H) or low (L) to medium (M), except for the group of supporting infrastructure (S), in which the vulnerability remains low (L); however, the vulnerability of the Almopeos D&R system increases from medium to high.
For group hazards WD2 and WD3, the use of R20mm shows the same behavior with RX1day only in the first period of the RCP8.5, except for the group of supporting infrastructure (S). In the rest of the scenarios, the vulnerability for all groups of components is reduced from high to medium or from medium to low, except for the group of supporting infrastructure (S) whose vulnerability score changes significantly from high to low.
Table 11, Table 12 and Table 13 show that the vulnerability of the Almopeos D&R system for all scenarios examined and all indicators is either medium or high, and thus the risk assessment of the Almopeos D&R system should be performed for all three groups of hazards: (i) temperature increases and extreme heat, (ii) precipitation decreases, aridity, and droughts, and (iii) extreme precipitation and flooding. In other words, practically, the outcome of the vulnerability analysis for the Almopeos D&R system is independent of the indicators used. However, this is not the case with the individual components of the Almopeos D&R system or their groups; for example, in both periods of the scenario RCP4.5, when the indicator Rx1day is used, the vulnerability of group S to the group hazards WD1, WD4, and WD5 ranges from medium to high, suggesting that a risk analysis should be performed, but the use of the indicator R20 results in low vulnerability and suggests the opposite.

4.2. The Vulnerability Assessment as Basis for the Risk Assessment

The vulnerability assessment identified the potentially significant groups of hazards for the Almopeos D&R system ranked as “medium” or “high”, which are (i) temperature increases and extreme heat (HC1 and HC2), (ii) precipitation decreases, aridity, and droughts (WD1, WD4, and WD5), and (iii) extreme precipitation and flooding (WD2 and WD3), which will be examined in the detailed risk assessment.
According to the European Commission, “risk means the potential for loss or disruption caused by an incident and is to be expressed as a combination of the magnitude of such loss or disruption and the likelihood of occurrence of the incident” [76]. Typically, risk can be defined as “the potential for adverse consequences for human or ecological systems” [77]. Risk assessment aims at the identification of all significant climate hazards for all components of a D&R system, whose risks need to be managed and reduced to a tolerable level; typically, it combines (i) the likelihood analysis that estimates the probability of a climate hazard to occur within the lifespan of the D&R system and (ii) the impact analysis that determines the consequences of this hazard on the D&R system.
The impact analysis is typically performed based on evaluation criteria that (like in the sensitivity analysis) can be encountered under various names, such as impact criteria, risk areas, impact areas, impacts, and consequences. In the impact analysis of the Almopeos D&R system, the risk areas proposed by the EC [37] will be used, which are (IM1) asset damage—engineering and operational, (IM2) safety and health, (IM3) environmental, (IM4) social, (IM5) financial, and (IM6) reputation. The use of the groups of components as sensitivity themes permits the use of the results of the sensitivity analysis in the impact analysis. For example, the sensitivity analysis of the Almopeos R&D system (see Section 3.3) concluded that the components that show low to medium sensitivity are (i) the buildings (A4) and (ii) the water release (O3); this conclusion can be used in the risk areas of the impact analysis of (i) asset damage (IM1) and (ii) environmental (IM3), respectively.
The likelihood analysis of the Almopeos R&D system will be performed using the Generalized Extreme Value (GEV) distribution of probability distribution that will determine the probability of extreme occurrences of the indicators that are selected based on the vulnerability analysis (see Section 3.3.3 and Section 4.1); these indicators are (i) TXm and HD for HC1 and HC2, (ii) CDD for WD1, WD4, and WD5, and (iii) Rx1day for WD2 and WD3.
To summarize, the vulnerability assessment (step 3) identified the climate indicators, the most important impacts, and the most vulnerable components of the D&R system that can be used in the risk assessment (step 4).

4.3. Research Needs

In the present work, the same indicators were used for all components of the Almopeos D&R system to simplify the analysis; however, the analysis would have been more accurate when different indicators were used for the various components of the system (see Table 3, Table 4 and Table 5).
The selection of climate indicators for water infrastructure systems, including D&R systems, is made from lists of indicators published by well-known organizations, including ETCCDI [56], IPCC [57], WMO [58], and Climate-Adapt [59,60]. The selected indicators are not always the proper ones, because these are usually not developed via an indicator analysis that results in well-defined correlations of the physical mechanisms of climate hazards with the specific components of the infrastructure systems (see Table 2). Therefore, there is a need for the development of new indicators that requires the cooperation of climate scientists, hydrologists, and experienced researchers and engineers specialized in D&R systems; moreover, it requires (i) a large amount of data and extensive research and experience and (ii) new methods for the determination of the scales and thresholds of these indicators (see Table 7), which permit their adjustment to local conditions [16].
Research is also required on the sensitivity analysis of D&R systems that again necessitates the cooperation of experienced researchers and engineers specialized in D&R systems. This cooperation aims at acquiring an in-depth knowledge in the analysis of climate change impacts and, specifically, on the establishment of the relationship “climate hazard–D&R component” for all potential hazards and components that are shown in Table 3, Table 4 and Table 5. Ideally, these relationships can be quantitative via the use of CFD models [16]. The sensitivity analysis of D&R systems and, more generally, CRVA methodologies can be facilitated by typologizing (i) the climate hazards (see Table 1) and their grouping (see Section 1) and (b) the potential impacts of the groups of climate hazards for each group of the D&R components, which are shown in Table 3, Table 4 and Table 5.

5. Conclusions

The following research question is posed: “which are the potentially significant climate hazards of D&R systems?” To answer this question, the vulnerability of D&R systems to climate change is assessed via a typologized methodology which is consistent with the technical guidelines of the European Commission on the climate proofing of infrastructure. The methodology is applied to the Almopeos D&R system in Greece, which is in the design stage, and the following conclusions were drawn:
  • The vulnerability assessment identified the following three groups of climate hazards as potentially significant: (i) temperature increases and extreme heat, (ii) precipitation decreases, aridity, and droughts, and (iii) extreme precipitation and flooding. For these hazards, a detailed risk assessment is required to propose targeted adaptation strategies; in this risk assessment, which typically involves the analyses of probability and impacts, the results of the present work can be used.
  • Based on the sensitivity analysis, the following climate indicators will be used in the probability analysis: (i) the annual mean daily maximum temperature and the number of hot days for temperature increases and extreme heat, respectively; (ii) the consecutive dry days for precipitation decreases, aridity, and droughts; and (iii) the annual maximum one-day precipitation for extreme precipitation and flooding.
  • Based on the vulnerability analysis, the most important impacts and the most vulnerable components of the D&R system were identified, which will be used to prioritize the impacts in the impact analysis.

Author Contributions

Conceptualization, A.I.S. and G.M.; methodology, A.I.S. and G.M.; formal analysis, A.I.S., G.M. and A.T.S.; investigation, A.I.S., G.M., A.S., A.T.S., K.V.V. and C.G.; data curation, A.I.S., G.M., A.T.S., K.V.V., C.G. and S.S.; writing—original draft preparation, A.I.S., G.M., A.S., A.T.S., K.V.V., C.G. and A.K.; writing—review and editing, A.I.S., G.M., A.S., A.T.S., K.V.V., C.G., S.S. and A.K.; visualization, G.M.; supervision, A.I.S.; project administration A.I.S. All authors have read and agreed to the published version of the manuscript.

Funding

This research received no external funding.

Data Availability Statement

The data and materials of the current work are available from the corresponding author upon reasonable request.

Acknowledgments

The present work was performed within the project “Support the upgrading of the operation of the National Network on Climate Change (Climpact)” of the General Secretariat of Research and Technology under Grant “2023ΝA11900001”. The authors would also like to thank the company HYDRODOMIKI CONSULTING ENGINEERS Ltd that performed the design of the Almopeos dam and reservoir system for providing the required data.

Conflicts of Interest

The authors declare no conflicts of interest.

References

  1. Association of State-Dam Safety Officials (ASDSO). Dams 101. Available online: https://damsafety.org/dams101 (accessed on 8 January 2025).
  2. Association of State-Dam Safety Officials (ASDSO). Dam Failures and Incidents. Available online: https://damsafety.org/dam-failures (accessed on 8 January 2025).
  3. Brunner, G.W. HEC-RAS, River Analysis System Hydraulic Reference Manual, Causes and Types of Dam Failures; Hydrologic Engineering Center (HEC): Davis, CA, USA, 2016.
  4. Association of State-Dam Safety Officials (ASDSO). Earth Dam Failures. Available online: https://damsafety.org/dam-owners/earth-dam-failures (accessed on 8 January 2025).
  5. New Hampshire Department of Environmental Services (NHDES). Environmental Fact Sheet-Typical Failure Modes of Embankment Dams; NHDES Dam Bureau: Concord, NH, USA, 2020.
  6. Association of State-Dam Safety Officials (ASDSO). Concrete Gravity Dam Failures. Available online: https://damsafety.org/dam-owners/concrete-gravity-dam-failures (accessed on 8 January 2025).
  7. Almog, E.; Kelham, P.; King, R. Modes of Dam Failure and Monitoring and Measuring Techniques; Environment Agency: Bristol, UK, 2011.
  8. Atkins. Impact of Climate Change on Dams & Reservoirs; Atkins: London, UK, 2013. [Google Scholar]
  9. Fluixá-Sanmartín, J.; Morales-Torres, A.; Escuder-Bueno, I.; Paredes-Arquiola, J. Quantification of Climate Change Impact on Dam Failure Risk under Hydrological Scenarios: A Case Study from a Spanish Dam. Nat. Hazards Earth Syst. Sci. 2019, 19, 2117–2139. [Google Scholar] [CrossRef]
  10. Margottini, C.; Canuti, P.; Sassa, K. Landslide Science and Practice: Volume 4: Global Environmental Change; Springer: Berlin/Heidelberg, Germany, 2013; ISBN 978-3-642-31336-3. [Google Scholar]
  11. Hughes, A.K.; Hunt, D. A Guide to the Effects of Climate Change in Dams; The British Dam Society: London, UK, 2012. [Google Scholar]
  12. Menk, L.; Terzi, S.; Zebisch, M.; Rome, E.; Lückerath, D.; Milde, K.; Kienberger, S. Climate Change Impact Chains: A Review of Applications, Challenges, and Opportunities for Climate Risk and Vulnerability Assessments. Weather Clim. Soc. 2022, 14, 619–636. [Google Scholar] [CrossRef]
  13. Clarke, L.; Wei, Y.-M.; De La Vega Navarro, A.; Garg, A.; Hahmann, A.N.; Khennas, S.; Azevedo, I.M.L.; Löschel, A.; Singh, A.K.; Steg, L.; et al. Energy Systems. In Climate Change 2022—Mitigation of Climate Change: Working Group III Contribution to the Sixth Assessment Report of the Intergovernmental Panel on Climate Change; Shukla, P.R., Skea, J., Slade, R., Al Khourdajie, A., van Diemen, R., McCollum, D., Pathak, M., Some, S., Vyas, P., Fradera, R., et al., Eds.; Cambridge University Press: Cambridge, UK, 2023; pp. 613–746. [Google Scholar]
  14. Stamou, A. Hydro-Environment Research on Climate Change Adaptation of Water Infrastructure (WI). In Proceedings of the 8th IAHR Europe Congress, Lisbon, Portugal, 4–7 June 2024. [Google Scholar]
  15. Stamou, A.I. The Typologization of Water Research as a Possible Means to Improve the Technical Guidelines on the Adaptation of Water Infrastructure to Climate Change. Hydrolink 2024, 3, 04–08. [Google Scholar]
  16. Stamou, A.I.; Mitsopoulos, G.; Sfetsos, A.; Stamou, A.T.; Varotsos, K.V.; Giannakopoulos, C.; Koutroulis, A. Typologizing the Hydro-Environmental Research on Climate Change Adaptation of Water Infrastructure in the Mediterranean Region. Atmosphere 2024, 15, 1526. [Google Scholar] [CrossRef]
  17. Cramer, W.; Guiot, J.; Marini, K.; Azzopardi, B.; Balzan, M.V.; Semia Cherif; Doblas-Miranda, E.; Santos, M.D.; Drobinski, P.; Fader, M.; et al. MedECC 2020 Summary for Policymakers. Climate and Environmental Change in the Mediterranean Basin–Current Situation and Risks for the Future. First Mediterranean Assessment Report; Zenodo: Geneva, Switzerland, 2020. [Google Scholar]
  18. Ali, E.; Cramer, J.; Georgopoulou, E.; Hilmi, N.J.M.; Le Cozannet, G.; Lionello, P. Cross-Chapter Paper 4: Mediterranean Region. In Climate Change 2022: Impacts, Adaptation and Vulnerability. Contribution of Working Group II to the Sixth Assessment Report of the Intergovernmental Panel on Climate Change; Pörtner, H.O., Roberts, D.C., Tignor, M., Poloczanska, E.S., Mintenbeck, K., Alegría, A., Craig, M., Langsdorf, S., Löschke, S., Möller, V., et al., Eds.; Cambridge University Press: Cambridge, UK; New York, NY, USA, 2022; pp. 2233–2272. [Google Scholar]
  19. Douvis, K.; Kapsomenakis, J.; Solomos, S.; Poupkou, A.; Stavraka, T.; Nastos, P.; Zerefos, C. Change in Aridity Index in the Mediterranean Region under Different Emission Scenarios. In Proceedings of the 16th International Conference on Meteorology, Climatology and Atmospheric Physics—COMECAP, Athens, Greece, 25–29 September 2023; p. 171. [Google Scholar]
  20. Ruffault, J.; Curt, T.; Moron, V.; Trigo, R.M.; Mouillot, F.; Koutsias, N.; Pimont, F.; Martin-StPaul, N.; Barbero, R.; Dupuy, J.-L.; et al. Increased Likelihood of Heat-Induced Large Wildfires in the Mediterranean Basin. Sci. Rep. 2020, 10, 13790. [Google Scholar] [CrossRef]
  21. Capolongo, D.; Diodato, N.; Mannaerts, C.M.; Piccarreta, M.; Strobl, R.O. Analyzing Temporal Changes in Climate Erosivity Using a Simplified Rainfall Erosivity Model in Basilicata (Southern Italy). J. Hydrol. 2008, 356, 119–130. [Google Scholar] [CrossRef]
  22. International Commission on Large Dams—ICOLD. Global Climate Change, Dams, Reservoirs and Related Water Resources; ICOLD Technical Committee: Chatou, France, 2016. [Google Scholar]
  23. Mallakpour, I.; AghaKouchak, A.; Sadegh, M. Climate-Induced Changes in the Risk of Hydrological Failure of Major Dams in California. Geophys. Res. Lett. 2019, 46, 2130–2139. [Google Scholar] [CrossRef]
  24. Rocha, J.; Carvalho-Santos, C.; Diogo, P.; Beça, P.; Keizer, J.J.; Nunes, J.P. Impacts of Climate Change on Reservoir Water Availability, Quality and Irrigation Needs in a Water Scarce Mediterranean Region (Southern Portugal). Sci. Total Environ. 2020, 736, 139477. [Google Scholar] [CrossRef]
  25. Ghimire, S.N.; Schulenberg, J.W.; Neilsen, M.L. Sensitivity Analysis of the Auxiliary Spillway Erosion Based on the Material and Structural Properties. In Proceedings of the Sessions of Geo-Extreme 2021, Savannah, GA, USA, 7–10 November 2021; pp. 111–126. [Google Scholar]
  26. Ghimire, S.N.; Schulenberg, J.W. Impacts of Climate Change on the Environment, Increase in Reservoir Levels, and Safety Threats to Earthen Dams: Post Failure Case Study of Two Cascading Dams in Michigan. Civ. Environ. Eng. 2022, 18, 551–564. [Google Scholar] [CrossRef]
  27. Juško, V.; Sedmák, R.; Kúdela, P. Siltation of Small Water Reservoir under Climate Change: A Case Study from Forested Mountain Landscape of Western Carpathians, Slovakia. Water 2022, 14, 2606. [Google Scholar] [CrossRef]
  28. Wilk, P.; Szlapa, M.; Hachaj, P.S.; Orlińska-Woźniak, P.; Jakusik, E.; Szalińska, E. From the Source to the Reservoir and beyond—Tracking Sediment Particles with Modeling Tools under Climate Change Predictions (Carpathian Mts.). J. Soils Sediments 2022, 22, 2929–2947. [Google Scholar] [CrossRef]
  29. Sant’Anna, C.; Tilmant, A.; Pulido-Velazquez, M. A Hydrologically-Driven Approach to Climate Change Adaptation for Multipurpose Multireservoir Systems. Clim. Risk Manag. 2022, 36, 100427. [Google Scholar] [CrossRef]
  30. MacTavish, L.; Bourgeois, G.; Lafleur, C.; Ristic, E. Climate Change Adaptation for Dams. A Review of Climate Vulnerabilities, Adaptation Measures, and Opportunities for Growth in the Canadian Dams Context; Canadian Standards Association: Toronto, ON, USA, 2022; p. 52. [Google Scholar]
  31. Ozkan, I.; Kadhom, B.; Roshani, E.; Shirkhani, H.; Hiedra-Cobo, J.; Cusson, D.; Nkinamubanzi, P.-C. Adaptation of Dams to Climate Change: Gap Analysis; National Research Council of Canada, Construction Research Centre: Ottawa, ON, Canada, 2023; Volume A1-020144-R01.
  32. Krztoń, W.; Walusiak, E.; Wilk-Woźniak, E. Possible Consequences of Climate Change on Global Water Resources Stored in Dam Reservoirs. Sci. Total Environ. 2022, 830, 154646. [Google Scholar] [CrossRef]
  33. Brandesten, C.-O. Impact of Climate Change on Dam Safety; Energiforsk AB: Stockholm, Sweden, 2023. [Google Scholar]
  34. Zhang, J.; Shang, Y. Nexus of Dams, Reservoirs, Climate, and the Environment: A Systematic Perspective. Int. J. Environ. Sci. Technol. 2023, 20, 12707–12716. [Google Scholar] [CrossRef]
  35. Lompi, M.; Mediero, L.; Soriano, E.; Caporali, E. Climate Change and Hydrological Dam Safety: A Stochastic Methodology Based on Climate Projections. Hydrol. Sci. J. 2023, 68, 745–763. [Google Scholar] [CrossRef]
  36. Savino, M.; Todaro, V.; Maranzoni, A.; D’Oria, M. Combining Hydrological Modeling and Regional Climate Projections to Assess the Climate Change Impact on the Water Resources of Dam Reservoirs. Water 2023, 15, 4243. [Google Scholar] [CrossRef]
  37. European Commission (EC). Commission Notice—Technical Guidance on the Climate Proofing of Infrastructure in the Period 2021–2027; European Commission: Brussels, Belgium, 2021. [Google Scholar]
  38. Stamou, A.; Mitsopoulos, G.; Koutroulis, A. Proposed Methodology for Climate Change Adaptation of Water Infrastructures in the Mediterranean Region. Environ. Process. 2024, 11, 12. [Google Scholar] [CrossRef]
  39. The World Bank. Trust Fund for Environmentally & Socially Sustainable Development, Water & Climate Adaptation Plan for the Sava River Basin, ANNEX 3—Guidance Note on Adaptation to Climate Change for– Hydropower; The World Bank: Washington, DC, USA, 2015. [Google Scholar]
  40. Helman, J.M. It’s Hot and Getting Hotter: Implications of Extreme Heat on Water Utility Staff and Infrastructure, and Ideas for Adapting; WUCA & AMWA: Waukesha, WI, USA, 2020. [Google Scholar]
  41. European Commission. Directorate General for Climate Action. EU-Level Technical Guidance on Adapting Buildings to Climate Change; Publications Office: Luxembourg, 2023. [Google Scholar]
  42. Wang, W.; Shi, K.; Wang, X.; Zhang, Y.; Qin, B.; Zhang, Y.; Woolway, R.I. The Impact of Extreme Heat on Lake Warming in China. Nat. Commun. 2024, 15, 70. [Google Scholar] [CrossRef]
  43. European Investment Bank. JASPERS Publications Office Approach to Climate Proofing for Water and Wastewater Projects. Available online: https://jaspers.eib.org/knowledge/publications/climate-proofing-of-water-and-wastewater-projects (accessed on 28 February 2025).
  44. European Investment Bank. JASPERS Publications Office Case Study:Climate Proofing of Water and Wastewater Projects. Available online: https://jaspers.eib.org/knowledge/publications/climate-proofing-of-water-and-wastewater-projects (accessed on 28 February 2025).
  45. European Investment Bank. JASPERS Publications Office Approach to Climate Proofing for Flood and Disaster Risk Management Projects. Available online: https://jaspers.eib.org/knowledge/publications/climate-proofing-of-flood-and-disaster-risk-management-projects (accessed on 28 February 2025).
  46. European Investment Bank. JASPERS Publications Office Case Study: Climate Proofing of a Flood Protection Project. Available online: https://jaspers.eib.org/knowledge/publications/climate-proofing-of-flood-and-disaster-risk-management-projects (accessed on 28 February 2025).
  47. Haseeb, J. Components of Dams | Functions of Components of Dams. Available online: https://www.aboutcivil.org/components-of-dams-and-their-functions.html (accessed on 8 January 2025).
  48. Gopinath, V. Components of Dam—12 Dam Components Explained. Available online: https://vincivilworld.com/2022/10/17/components-of-dam-functions/ (accessed on 8 January 2025).
  49. FEMA Dam Safety Federal Guidelines. Available online: https://www.fema.gov/emergency-managers/risk-management/dam-safety/federal-guidelines (accessed on 8 January 2025).
  50. BS EN 1990:2002 EN 1990; Eurocode—Basis of Structural Design. British Standards Institution: London, UK, 1990.
  51. Wieland, M. Life-span of storage dams. Available online: https://www.waterpowermagazine.com/analysis/life-span-of-storage-dams/ (accessed on 9 April 2025).
  52. Johnson, M.F.; Albertson, L.K.; Algar, A.C.; Dugdale, S.J.; Edwards, P.; England, J.; Gibbins, C.; Kazama, S.; Komori, D.; MacColl, A.D.C.; et al. Rising Water Temperature in Rivers: Ecological Impacts and Future Resilience. WIREs Water 2024, 11, e1724. [Google Scholar] [CrossRef]
  53. Malm, R.; Hellgren, R.; Enzell, J. Lessons Learned Regarding Cracking of a Concrete Arch Dam Due to Seasonal Temperature Variations. Infrastructures 2020, 5, 19. [Google Scholar] [CrossRef]
  54. Colombo, M.; Comi, C. Hydro-Thermo-Mechanical Analysis of an Existing Gravity Dam Undergoing Alkali–Silica Reaction. Infrastructures 2019, 4, 55. [Google Scholar] [CrossRef]
  55. Vilhena, R.M.; Mascarenha, M.M.D.A.; Sales, M.M.; Romão, P.D.A.; Luz, M.P.D. Estimating the Wind-Generated Wave Erosivity Potential: The Case of the Itumbiara Dam Reservoir. Water 2019, 11, 342. [Google Scholar] [CrossRef]
  56. Expert Team on Climate Change Detection and Indices (ETCCDI). Indices of CLIMPACT and CLIMDEX. Available online: https://www.climdex.org/learn/indices/ (accessed on 9 April 2025).
  57. Intergovernmental Panel on Climate Change (IPCC); Gutiérrez, J.M.; Ranasinghe, R.; Ruane, A.C.; Vautard, R. Annex VI: Climatic Impact-Driver and Extreme Indices. In Climate Change 2021—The Physical Science Basis: Working Group I Contribution to the Sixth Assessment Report of the Intergovernmental Panel on Climate Change; Masson-Delmotte, V., Zhai, P., Pirani, A., Connors, S.L., Péan, C., Berger, S., Caud, N., Chen, Y., Goldfarb, L., Gomis, M.I., et al., Eds.; Cambridge University Press: Cambridge, UK, 2021; ISBN 978-1-00-915789-6. [Google Scholar]
  58. Svoboda, M.D.; Fuchs, B.A. Handbook of Drought Indicators and Indices; World Meteorological Organization: Geneva, Switzerland, 2016; ISBN 978-92-63-11173-9. [Google Scholar]
  59. Climate-Adapt Overview List of All Indices. Available online: https://climate-adapt.eea.europa.eu/en/knowledge/european-climate-data-explorer/overview-list (accessed on 19 December 2024).
  60. Crespi, A.; Terzi, S.; Cocuccioni, S.; Zebisch, M.; Berckmans, J.; Füssel, H.-M. Climate-Related Hazard Indices for Europe. 2020. Available online: https://www.eionet.europa.eu/etcs/etc-cca/products/etc-cca-reports/climate-related-hazard-indices-for-europe (accessed on 9 April 2025).
  61. Kougianos and Associates LLP; LDK Consultants; Geosynolo LTD; Afrateos, I. River Basin Management Plan of Western Macedonia River Basin District, 2nd ed.; Ministry of the Environment and Energy: Athens, Greece, 2024.
  62. Morrill, J.C.; Bales, R.C.; Conklin, M.H. Estimating Stream Temperature from Air Temperature: Implications for Future Water Quality. J. Environ. Eng. 2005, 131, 139–146. [Google Scholar] [CrossRef]
  63. Environplan, S.A. Aristotle University of Thessaloniki. Prefecture Plan for Climate Change Adaptation (PESPKA)—Prefecture of Central Macedonia; Prefecture of Central Macedonia: Thessaloniki, Greece, 2023. [Google Scholar]
  64. Berhanu, B.; Melesse, A.M.; Seleshi, Y. GIS-Based Hydrological Zones and Soil Geo-Database of Ethiopia. CATENA 2013, 104, 21–31. [Google Scholar] [CrossRef]
  65. Dwi Purwanti, S.; Putu Okta Veanti, D.; Sucahyono Sosaidi, D.; Adhitiansyah, D.; Abil Nurjani, M.; Yuwan Purnama, F.; Fatahilah Raymon, M. Probability of Hotspots Emergence Using Consecutive Dry Days (CDD) in West Kalimantan. E3S Web Conf. 2023, 464, 01001. [Google Scholar] [CrossRef]
  66. Liu, B.; Yan, Z.; Sha, J.; Li, S. Drought Evolution Due to Climate Change and Links to Precipitation Intensity in the Haihe River Basin. Water 2017, 9, 878. [Google Scholar] [CrossRef]
  67. Sonar, R.B. Observed Trends and Variations in Rainfall Events over Ratnagiri (Maharashtra) during Southwest Monsoon seasonSonar. MAUSAM 2014, 65, 171–178. [Google Scholar] [CrossRef]
  68. Mukherjee, S.; Ballav, S.; Soni, S.; Kumar, K.; Kumar De, U. Investigation of Dominant Modes of Monsoon ISO in the Northwest and Eastern Himalayan Region. Theor. Appl. Climatol. 2016, 125, 489–498. [Google Scholar] [CrossRef]
  69. Faradiba. Analysis of Intensity, Duration, and Frequency Rain Daily of Java Island Using Mononobe Method. J. Phys. Conf. Ser. 2021, 1783, 012107. [Google Scholar] [CrossRef]
  70. Jacob, D.; Petersen, J.; Eggert, B.; Alias, A.; Christensen, O.B.; Bouwer, L.M.; Braun, A.; Colette, A.; Déqué, M.; Georgievski, G.; et al. EURO-CORDEX: New High-Resolution Climate Change Projections for European Impact Research. Reg. Environ. Chang. 2014, 14, 563–578. [Google Scholar] [CrossRef]
  71. Kjellström, E.; Nikulin, G.; Strandberg, G.; Christensen, O.B.; Jacob, D.; Keuler, K.; Lenderink, G.; Van Meijgaard, E.; Schär, C.; Somot, S.; et al. European Climate Change at Global Mean Temperature Increases of 1.5 and 2 °C above Pre-Industrial Conditions as Simulated by the EURO-CORDEX Regional Climate Models. Earth Syst. Dynam. 2018, 9, 459–478. [Google Scholar] [CrossRef]
  72. Van Vuuren, D.P.; Edmonds, J.; Kainuma, M.; Riahi, K.; Thomson, A.; Hibbard, K.; Hurtt, G.C.; Kram, T.; Krey, V.; Lamarque, J.-F.; et al. The Representative Concentration Pathways: An Overview. Clim. Chang. 2011, 109, 5–31. [Google Scholar] [CrossRef]
  73. Muñoz-Sabater, J.; Dutra, E.; Agustí-Panareda, A.; Albergel, C.; Arduini, G.; Balsamo, G.; Boussetta, S.; Choulga, M.; Harrigan, S.; Hersbach, H.; et al. ERA5-Land: A State-of-the-Art Global Reanalysis Dataset for Land Applications. Earth Syst. Sci. Data 2021, 13, 4349–4383. [Google Scholar] [CrossRef]
  74. Intergovernmental Panel On Climate Change (IPCC). Climate Change 2022: Impacts, Adaptation and Vulnerability; Intergovernmental Panel On Climate Change: Geneva, Switzerland, 2022. [Google Scholar]
  75. Intergovernmental Panel on Climate Change (IPCC). Summary for Policymakers. In Climate Change 2014: Impacts, Adaptation, and Vulnerability. Part A: Global and Sectoral Aspects. Contribution of Working Group II to the Fifth Assessment Report of the Intergovernmental Panel on Climate Change; Field, C.B., Barros, V.R., Dokken, D.J., Mach, K.J., Mastrandrea, M.D., Bilir, T.E., Chatterjee, M., Ebi, K.L., Estrada, Y.O., Genova, R.C., Eds.; Cambridge University Press: Cambridge, UK; New York, NY, USA, 2014; pp. 1–32. [Google Scholar]
  76. European Commission (EC). Directive (EU) 2022/2557 of the European Parliament and of the Council of 14 December 2022 on the Resilience of Critical Entities and Repealing Council Directive 2008/114/EC; European Commission: Brussels, Belgium, 2022. [Google Scholar]
  77. Intergovernmental Panel on Climate Change (IPCC). Climate Change 2022—Impacts, Adaptation and Vulnerability: Working Group II Contribution to the Sixth Assessment Report of the Intergovernmental Panel on Climate Change; Cambridge University Press: Cambridge, UK, 2023. [Google Scholar]
Figure 1. Climate risk and vulnerability assessment (CRVA) for D&R systems (L: literature survey; EO: expert opinion; M: climate models).
Water 17 01289 g001
Figure 2. Plan view of Almopeos dam: (1) dam, (2) spillway, (3) collector channel, (4) fall channel, (5) stilling basin, (6) escape channel, (7) water abstraction well, (8) outlet water channel, (9) flushing pipe, (10) flushing sluice gate, (11) administration building, (12) irrigation pipe, (13) access road to administration building, (14) access road to spillway, and (15) Almopeos River axis.
Water 17 01289 g002
Figure 3. Cross-section of Almopeos dam: (1) core, (2) fine-grained filter layer, (3) coarse grain filter layer-drain, (4) inner transition shell, (5) outer shell, (6) erosion protection riprap, (7) wave protection riprap, (8) road pavement layer, and (9) concrete diaphragm.
Water 17 01289 g003
Figure 4. Overview of the values of the exposure indicators; the left column refers to the period 2041–2060 and the right column to the period 2081–2100 (color code: green = low, orange = medium, red = high).
Water 17 01289 g004aWater 17 01289 g004b
Figure 5. Graphical representation of the values of indicators for the group of HC1 and HC2.
Water 17 01289 g005
Table 1. Categories and types of climate hazards for water infrastructure.
Category of Hazard Based on IPCC [13]SymbolType of Hazard
Heat and Cold (HC)HC1Mean air temperature (increase)
HC2Extreme heat–heat waves
HC3Cold spells and frost
Wet and Dry (WD)WD1Mean precipitation (decrease)
WD2Extreme precipitation
WD3Flooding (fluvial and pluvial)
WD4Aridity
WD5Drought
WD6Wildfires
WD7Soil erosion
WD8Landslide (incl. mudflows)
WD9Land subsidence
WD10Water temperature
Wind and Air (WA)WA1Mean wind speed (increase)
WA2Extreme winds
WA3Air quality (change)
Coastal (C)C1Relative (mean) sea level (rise)
C2Coastal flooding
C3Coastal erosion
C4Saline intrusion
C5Sea water temperature (and marine heat waves)
C6Sea water quality (incl. salinity and acidity)
Snow and Ice (SI)SI1Snow and land ice
SI2Avalanche
Table 2. Main components of D&R systems [47,48,49].
Groups of ComponentsSymbolComponent
Input (I)IInflows
Functions (P)P1Storage
P2Flood control
P3Hydropower
P4Recreation
Assets (A)A1Embankment
A2Spillway
A3Auxiliaries
A4Buildings
Outflow (O)O1Water supply
O2Hydropower production
O3Water releases
Supporting
infrastructure (S)
S1Power supply
S2Communications
S3Transportation
S4Personnel
Table 3. Overview of potential impacts of mean air temperature increase, extreme heat, and corresponding indicators [8,30,31,33,56,57,58,59,60].
ComponentPotential ImpactsTNmTMmTXmWTLSGSLGDDHDTX35TRHWDDTRCDIDFD
T-I InflowsIncreased river water temperature and degraded water quality (Τ-Ι).
T-P1 StorageIncreased water temperature; increased vegetation growth; increased evapotranspiration; reduced water storage volume; increased stratification; degraded water quality; increased adverse impacts on fish.
T-P2 Flood
control
Improved flood control.
T-P3 HydropowerReduced potential for hydropower production.
T-P4 RecreationReduced recreation, esthetic value and biodiversity; navigation problems.
T-A1 Earthfill
dams
Increased growth of shrubs, trees, and vegetation; grass kill; tree fall and uprooting during storm events; desiccation and shrinking of clay; erosion of crest and faces of the dam; damages to exposed parts of the dam, such as liners, joint materials, and binding mixes (especially during prolonged low/fluctuating reservoir water levels; see D-P1).
T-A1 Concrete
dams
Expansion, cracking, and spalling of concrete; damage to concrete and masonry/jointing materials; drying and shrinking of concrete (when combined with persistent drought).
T-A2 SpillwayBlockage due to vegetation; thermal expansion and cracking.
T-A3 AuxiliariesCracking of concrete structures; expansion of metal elements.
T-A4 BuildingsIncreased power demand for cooling; reduced lifespan of building components.
T-O1 Water
supply
Water may not be suitable for use due to its degraded quality; increased demand for drinking and irrigation water during hotter summers increases.
T-O2 HydropowerIncreased power demand during summers and heat waves.
T-O3 Water releasesPollution of downstream watercourses with adverse impacts on fish populations; management conflicts for multi-purpose reservoirs.
T-S1 Power supplyIncreased risk of outages; damage of electrical and electronic components.
T-S2 CommunicationsObscuring monitoring sites and gauge boards; damage of monitoring devices.
T-S3 TransportationDamage of parking lot asphalt binders and access roads; poor accessibility.
T-S4 PersonnelReduced thermal comfort and occupational health and safety; increased maintenance requirements.
Table 4. Overview of potential impacts of decreased mean precipitation, aridity, and droughts and corresponding indicators [8,30,31,33,56,57,58,59,60].
ComponentPotential ImpactsPRCPTOTCDDCWDNPDRDISSIHDTX35TRHWD
D-I InflowsReduced flowrates and degraded water quality; this impact is more pronounced when it coincides with temperature increases and heat waves.
D-P1 StorageReduced reservoir volumes and water levels; prolonged low/fluctuating reservoir water levels resulting in the exposure of parts of the dam; degraded water quality; reduced water supply potential.
D-P2 flood controlImproved flood control.
D-P3 HydropowerReduced potential for hydropower production.
D-P4 RecreationReduced recreation, esthetic value, and biodiversity; prevention of certain types of recreation; health issues.
D-A1 Earthfill DamsDesiccation and shrinkage of clay core and dam shoulders; seepage and piping; loss of vegetation cover; soil erosion; subsidence; slumping; dam erosion (when draught is combined with intense rainfall (D-A1); erosion or damage of the exposed parts of the dam due to waves (caused by strong winds on the water surface of reservoirs; see S-A1) and due to high air temperatures (see T-A1) and UV sunlight.
D-A1 Concrete DamsDrying and shrinking of concrete (when combined with high temperatures).
D-A2 Spillway-
D-A3 AuxiliariesIncreased exposure and wave/sun damage to joint materials.
D-A4 Buildings-
D-O1 Water supplyTreatment of water may be required prior to use; increased demand for drinking and irrigation water supply during hotter summers (D-O1).
D-O2 HydropowerReduced potential for hydropower production.
D-O3 Water releasesReduced availability for flushing during summer; management conflicts for multi-purpose reservoirs (D-O3).
D-S1 Power supply-
D-S2 Communications-
D-S3 Transportation-
D-S4 PersonnelMore difficult working conditions for personnel.
Table 5. Overview of potential impacts of extreme precipitation and flooding and corresponding indicators [8,30,31,33,56,57,59,60].
ComponentPotential ImpactsPRCPTOTHRR20mmR95pTOTRx1dayEP
F-I InflowsIncreased flow rates, sediment loads, and debris; mobilized vegetation; degraded water quality.
F-P1 StorageIncreased water levels: increased sediments, debris, mobilized vegetation, and turbidity; rapid fluctuations in operating water levels; degraded water quality; reduced water storage volume due to sediments.
F-P2 Flood controlIncreased risk for flooding, overtopping, and downstream flooding; reduced operating levels to face flood risk.
F-P3 HydropowerReduced operating levels; reduced availability or flexibility for hydropower generation; increased potential for hydropower production during winter.
F-P4 RecreationReduced recreational safety; reduced esthetic value; negative impacts on navigation and sports.
F-A1 Earthfill damsIncreased pore pressure; increased risks for piping, overtopping, seepage, and erosion.
F-A1 Concrete damsIncreased risks of overtopping, sliding, and overturning; increased risk of dam cracking and failure (when sudden heavy rainfall follows persistent drought); increased drainage and erosion of joint materials due to fluctuating water levels or heavy rainfall.
F-A2 SpillwayBlockage due to mobilized vegetation; failure due to increased flow rates, flow velocities, and water levels; rapid deterioration of flaws.
F-A3 AuxiliariesDamage of dam components due to debris; failure of pipes; erosion and sediment build-up around structures; landslides; silt buildup and blocking of inlets; rusting of dam components; rapid deterioration of flaws.
F-A4 BuildingsDamp and mold due to high precipitation; inundation; electricity supply outage.
F-O1 Water supplyTreatment of water may be required prior to use.
F-O2 HydropowerReduced availability or flexibility for hydropower generation during high precipitation; increased water availability during winter.
F-O3 Water releasesImpacts to downstream watercourses due to flooding, overtopping, piping, and pollution.
F-S1 Power supplyOutages of power systems.
F-S2 CommunicationsHampered communications.
F-S3 TransportationDamaged access roads.
F-S4 PersonnelHampered outdoor working conditions and maintenance.
Table 8. Values of the CC indicators for reference and future periods and scenarios.
HazardIndicator1981–20002041–2060
RCP8.5
2081–2100
RCP8.5
2041–2060
RCP4.5
2081–2100
RCP4.5
2041–2060
RCP8.5
2081–2100
RCP8.5
2041–2060
RCP4.5
2081–2100
RCP4.5
HC1 and HC2TNm810.3212.969.689.992.324.961.681.99
TXm17.9720.4723.4319.7620.112.55.461.792.14
HD4175106687434652733
TX3552154192016491415
TR215388454932672428
WD1, WD4, and WD5PRCPTOT613549439615550−64−1742−63
CDD5565776462102297
WD2 and WD3R20mm454441000
Rx1day38.8543.1241.3151.0641.584.272.4612.212.73
Table 9. Sensitivity scores for each component of Almopeos D&R system and each group of components.
Groups of
Components
ComponentsTemperature
Increase and
Extreme Heat
(HC1 and HC2)
Precipitation
Decrease,
Aridity and Droughts
(WD1, WD4, and WD5)
Extreme
Precipitation
and Flooding
(WD2 and WD3)
Input (I)I1 River waterMHH
Functions (P)P2 StorageMHH
Assets (A)A1 DamMMH
A2 SpillwayMMH
A3 AuxiliaryLLL
A4 BuildingsLLM
Outflow (O)O1 Water for irrigationMHH
O3 Water releaseLML
Supporting
Infrastructure (S)
S1 Electric powerMLM
S2 CommunicationsLLM
S3 TransportationLLM
S4 PersonnelMLM
Group IHighest score of
each group
MHH
Group PMHH
Group AMMH
Group OMHH
Group SMLM
Almopeos D&R systemHighest score
of all groups
MHH
Table 10. Overview of the results of the exposure analysis for the Almopeos D&R system (L = low, M = medium, and H = high).
HazardIndicatorScenario
RCP8.5RCP4.5
2041–20602081–21002041–20602081–2100
HC1 and HC2TXmHHMH
WD1, WD4, and WD5CDDMHLL
WD2 and WD3Rx1dayHMHM
Table 11. Summary of the results of the vulnerability analysis for the Almopeos D&R system (L = low, M = medium, and H = high).
Exposure
SensitivityScenarioRCP8.5RCP4.5RCP8.5RCP4.5RCP8.5RCP4.5
Period2041–20602081–21002041–20602081–21002041–20602081–21002041–20602081–21002041–20602081–21002041–20602081–2100
Groups of climate risks (indicator)HC1 and HC2 (TXm)WD1, WD4, and WD5 (CDD)WD2 and WD3 (Rx1day)
ComponentsIΙ1 River waterH(M/H)H(M/H)M(M/M)H(M/H)H(H/M)H(H/H)M(H/L)M(H/L)H(H/H)H(H/M)H(H/H)H(H/M)
PP2 StorageH(M/H)H(M/H)M(M/M)H(M/H)H(H/M)H(H/H)M(H/L)M(H/L)H(H/H)H(H/M)H(H/H)H(H/M)
AA1 DamH(Μ/H)H(Μ/H)M(Μ/M)H(Μ/H)M(M/M)H(M/H)L(M/L)L(M/L)H(H/H)H(H/M)H(H/H)H(H/M)
A2 SpillwayH(M/H)H(M/H)M(M/M)H(M/H)M(M/M)H(M/H)L(M/L)L(M/L)H(H/H)H(H/M)H(H/H)H(H/M)
A3 AuxiliaryM(L/H)M(L/H)L(L/M)M(L/H)L(L/M)M(L/H)L(L/L)L(L/L)M(L/H)L(L/M)M(L/H)L(L/M)
A4 BuildingsM(L/H)M(L/H)L(L/M)M(L/H)L(L/M)M(L/H)L(L/L)L(L/L)H(M/H)M(M/M)H(M/H)M(M/M)
OO1 Water for irrigationH(M/H)H(M/H)M(M/M)H(M/H)H(H/M)H(H/H)M(H/L)M(H/L)H(H/H)H(H/M)H(H/H)H(H/M)
O3 Water releaseM(L/H)M(L/H)L(L/M)M(L/H)M(M/M)H(M/H)L(M/L)L(M/L)M(L/H)L(L/M)M(L/H)L(L/M)
SS1 Electric PowerH(M/H)H(M/H)M(M/M)H(M/H)L(L/M)M(L/H)L(L/L)L(L/L)H(M/H)M(M/M)H(M/H)M(M/M)
S2 CommunicationsM(L/H)M(L/H)L(L/M)M(L/H)L(L/M)M(L/H)L(L/L)L(L/L)H(M/H)M(M/M)H(M/H)M(M/M)
S3 TransportationM(L/H)M(L/H)L(L/M)M(L/H)L(L/M)M(L/H)L(L/L)L(L/L)H(M/H)M(M/M)H(M/H)M(M/M)
S4 PersonnelH(M/H)H(M/H)M(M/M)H(M/H)L(L/M)M(L/H)L(L/L)L(L/L)H(M/H)M(M/M)H(M/H)M(M/M)
GroupsGroup IHHMHHHMMHHHH
Group PHHMHHHMMHHHH
Group AHHMHMHLLHHHH
Group OHHMHHHMMHHHH
Group SHHMHLMLLHMHM
D&R Almopeos systemHHMHHHMMHHHH
Table 12. Effect of the coefficients of HC1 and HC2 on the results of the vulnerability analysis for the Almopeos D&R system (L = low, M = medium, and H = high); ↑ denotes increase, ↓ denotes decrease and no arrow denotes no-change.
Exposure
SensitivityScenarioRCP8.5RCP4.5RCP8.5RCP4.5RCP8.5RCP4.5
Period2041–20602081–21002041–20602081–21002041–20602081–21002041–20602081–21002041–20602081–21002041–20602081–2100
Groups of climate risksTNm and TRHDTX35
ComponentsIΙ1 River waterH(M/H)H(M/H)M(M/M)M↓(M/M↓)H(M/H)H(M/H)H↑(M/H↑)H(M/H)M↓(M/M↓)H(M/H)M(M/M)M↓(M/M↓)
PP2 StorageH(M/H)H(M/H)M(M/M)M↓(M/M↓)H(M/H)H(M/H)H↑(M/H↑)H(M/H)M↓(M/M↓)H(M/H)M(M/M)M↓(M/M↓)
AA1 DamH(Μ/H)H(Μ/H)M(Μ/M)M↓(M/M↓)H(Μ/H)H(Μ/H)H↑(M/H↑)H(Μ/H)M↓(M/M↓)H(Μ/H)M(Μ/M)M↓(M/M↓)
A2 SpillwayH(M/H)H(M/H)M(M/M)M↓(M/M↓)H(M/H)H(M/H)H↑(M/H↑)H(M/H)M↓(M/M↓)H(M/H)M(M/M)M↓(M/M↓)
A3 AuxiliaryM(L/H)M(L/H)L(L/M)L↓(L/M↓)M(L/H)M(L/H)M↑(L/H↑)M(L/H)L↓(L/M↓)M(L/H)L(L/M)L↓(L/M↓)
A4 BuildingsM(L/H)M(L/H)L(L/M)L↓(L/M↓)M(L/H)M(L/H)M↑(L/H↑)M(L/H)L↓(L/M↓)M(L/H)L(L/M)L↓(L/M↓)
OO1 Water for irrigationH(M/H)H(M/H)M(M/M)M↓(M/M↓)H(M/H)H(M/H)H↑(M/H↑)H(M/H)M↓(M/M↓)H(M/H)M(M/M)M↓(M/M↓)
O3 Water releaseM(L/H)M(L/H)L(L/M)L↓(L/M↓)M(L/H)M(L/H)M↑(L/H↑)M(L/H)L↓(L/M↓)M(L/H)L(L/M)L↓(L/M↓)
SS1 Electric PowerH(M/H)H(M/H)M(M/M)M↓(M/M↓)H(M/H)H(M/H)H↑(M/H↑)H(M/H)M↓(M/M↓)H(M/H)M(M/M)M↓(M/M↓)
S2 CommunicationsM(L/H)M(L/H)L(L/M)L↓(L/M↓)M(L/H)M(L/H)M↑(L/H↑)M(L/H)L↓(L/M↓)M(L/H)L(L/M)L↓(L/M↓)
S3 TransportationM(L/H)M(L/H)L(L/M)L↓(L/M↓)M(L/H)M(L/H)M↑(L/H↑)M(L/H)L↓(L/M↓)M(L/H)L(L/M)L↓(L/M↓)
S4 PersonnelH(M/H)H(M/H)M(M/M)M↓(M/M↓)H(M/H)H(M/H)H↑(M/H↑)H(M/H)M↓(M/M↓)H(M/H)M(M/M)M↓(M/M↓)
GroupsGroup IHHMM↓HHH↑HM↓HMM↓
Group PHHMM↓HHH↑HM↓HMM↓
Group AHHMM↓HHH↑HM↓HMM↓
Group OHHMM↓HHH↑HM↓HMM↓
Group SHHMM↓HHH↑HM↓HMM↓
D&R Almopeos systemHHMM↓HHH↑HM↓HMM↓
Table 13. Effect of the coefficients PRCTOT and R20 on the results of the vulnerability analysis for the Almopeos D&R system (L = low, M = medium, and H = high); ↑ denotes increase, ↓ denotes decrease and no arrow denotes no-change.
Exposure
SensitivityScenarioRCP8.5RCP4.5RCP8.5RCP4.5
Period2041–20602081–21002041–20602081–21002041–20602081–21002041–20602081–2100
Groups of climate risksPRCTOTR20
ComponentsIΙ1 River waterH(H/M)H(H/H)M(H/L)H↑(H/M↑)H(H/M↓)M↓(H/L↓)M↓(H/L↓)M↓(H/L↓)
PP2 StorageH(H/M)H(H/H)M(H/L)H↑(H/M↑)H(H/M↓)M↓(H/L↓)M↓(H/L↓)M↓(H/L↓)
AA1 DamM(M/M)H(M/H)L(M/L)M↑(M/M↑)H(H/M↓)M↓(H/L↓)M↓(H/L↓)M↓(H/L↓)
A2 SpillwayM(M/M)H(M/H)L(M/L)M↑(M/M↑)H(H/M↓)M↓(H/L↓)M↓(H/L↓)M↓(H/L↓)
A3 AuxiliaryL(L/M)M(L/H)L(L/L)L(L/M↑)L↓(L/M↓)L(L/L↓)L(L/L↓)L(L/L↓)
A4 BuildingsL(L/M)M(L/H)L(L/L)L(L/M↑)M↓(M/M↓)L↓(M/L↓)L↓(M/L↓)L↓(M/L↓)
OO1 Water for irrigationH(H/M)H(H/H)M(H/L)H↑(H/M↑)H(H/M↓)M↓(H/L↓)M↓(H/L↓)M↓(H/L↓)
O3 Water releaseM(M/M)H(M/H)L(M/L)M↑(M/M↑)L↓(L/M↓)L(L/L↓)L(L/L↓)L(L/L↓)
SS1 Electric PowerL(L/M)M(L/H)L(L/L)L(L/M↑)M↓(M/M↓)L↓(M/L↓)L↓(M/L↓)L↓(M/L↓)
S2 CommunicationsL(L/M)M(L/H)L(L/L)L(L/M↑)M↓(M/M↓)L↓(M/L↓)L↓(M/L↓)L↓(M/L↓)
S3 TransportationL(L/M)M(L/H)L(L/L)L(L/M↑)M↓(M/M↓)L↓(M/L↓)L↓(M/L↓)L↓(M/L↓)
S4 PersonnelL(L/M)M(L/H)L(L/L)L(L/M↑)M↓(M/M↓)L↓(M/L↓)L↓(M/L↓)L↓(M/L↓)
GroupsGroup IHHMH↑HM↓M↓M↓
Group PHHMH↑HM↓M↓M↓
Group AMHLM↑HM↓M↓M↓
Group OHHMH↑HM↓M↓M↓
Group SLMLLM↓L↓L↓L↓
D&R Almopeos systemHHMH↑HM↓M↓M↓
Disclaimer/Publisher’s Note: The statements, opinions and data contained in all publications are solely those of the individual author(s) and contributor(s) and not of MDPI and/or the editor(s). MDPI and/or the editor(s) disclaim responsibility for any injury to people or property resulting from any ideas, methods, instructions or products referred to in the content.

