Article

Research on Typical Market Mode of Regulating Hydropower Stations Participating in Spot Market

1
Kunming Power Exchange Center Company Limited, Kunming 650011, China
2
School of Civil and Hydraulic Engineering, Huazhong University of Science and Technology, Wuhan 430074, China
*
Author to whom correspondence should be addressed.
Water 2025, 17(9), 1288; https://doi.org/10.3390/w17091288
Submission received: 27 March 2025 / Revised: 22 April 2025 / Accepted: 23 April 2025 / Published: 25 April 2025
(This article belongs to the Section Hydraulics and Hydrodynamics)

Abstract

:
As the second largest power source in the world, hydropower plays a crucial role in the operation of power systems. This paper focuses on the key issues of regulating hydropower stations participating in the spot market. It aims at the core challenges, such as the conflict of cascade hydro plants’ joint clearing, the lack of adaptability for different types of power supply bidding on the same platform, and the contradiction between long-term operation and the spot market. Through the construction of a water spillage management strategy and settlement compensation mechanism, the competitive abandoned water problem caused by mismatched quotations of cascade hydro plants can be solved. In order to achieve reasonable recovery of the power cost, a separate bidding mechanism and capacity cost recovery model are designed. Subsequently, the sufficient electricity supply constraint of the remaining period is integrated into the spot-clearing model, which can coordinate short-term hydropower dispatch with long-term energy storage demand. The operation of the Yunnan electricity spot market is being simulated to verify the effectiveness of the proposed method.

1. Introduction

As the leading hydropower producer worldwide, China has relied on hydropower as an essential regulating resource for peak shaving, frequency regulation, and black start capabilities for a long time [1]. The promoted market-based consumption of hydropower has become one of the core challenges in China’s new electricity market reforms [2]. In the electricity market with a high share of hydropower, effectively addressing the key challenges of cascade hydropower station participation is critical [3]. In particular, the complex characteristics of regulating hydropower—such as the tight spatiotemporal coupling of hydraulic and electrical constraints—differ fundamentally from those of traditional coal-dominated systems. These complexities may lead to inefficiencies in market mechanisms, including unjustified water spillage, inadequate generation capacity, and difficulties in executing market transactions. Resolving these bottleneck issues is essential to integrating high-proportion hydropower into electricity markets.
Hydropower is a clean and renewable energy source, yet ensuring its efficient utilization in a market-driven environment remains challenging. A key issue is how to prevent long-term structural water spillage and power shortages, as well as short-term competitive water spillage and infeasible market transactions caused by mismatches in cascade hydropower operations [4]. Different countries have adopted various approaches to address these challenges. Brazil employs centralized hydropower dispatch and a capacity market to mitigate these issues. However, its spot market still operates under a centralized economic dispatch model rather than full market liberalization. In contrast, the Nordic market resolves these concerns through self-dispatch, treating hydropower the same as other generation resources without dedicated market mechanisms [5]. In Canada, hydropower plays a dual role in both peak shaving and baseload supply, with a significant portion of generation secured at fixed government-set prices [6]. To accommodate hydropower, Canada has introduced a specialized contract-for-difference mechanism. Sichuan Province in China has designed a hydropower-specific spot market model with separate wet and dry season periods, allowing hydropower to participate only during the wet season. However, this framework does not enable different generation types to compete under unified bidding rules [7].
The scale and complexity of China’s hydropower marketization far exceed those of hydropower markets in Brazil, the Nordic region, and North America. The sector faces multiple challenges, including uncertainties in runoff and load demand, imperfections in market rules, and diversity in trading varieties [8]. Additionally, hydropower bidding decisions are constrained by numerous interrelated factors. As a traditional clean energy source, hydropower is expected to play an increasingly vital role under carbon neutrality target. Establishing and refining electricity market mechanisms that accommodate hydropower participation is of significant practical importance. This paper focuses on the challenges of optimizing the market clearing process for regulating hydropower in the electricity spot market. It explores typical market mode for regulating hydropower stations, which can promote the construction process of the electricity market in high proportion hydropower provinces in China [9]. The major contributions of this paper are clarified as follows: (1) Water spillage management strategy and settlement compensation mechanism are designed to solve the competitive abandoned water problem caused by the mismatched quotation of cascade hydro plants. (2) A bidding method is proposed for different types of power sources on the same platform, which realizes reasonable recovery of power cost. (3) Sufficient electricity supply constraint of remaining period is added to the spot-clearing model, which can coordinate short-term hydropower dispatch with long-term energy storage demand.
The rest of this paper is organized as follows: The issues and challenges for regulating hydropower stations participating in the spot market are presented in Section 2. The mechanisms and methods for solving these problems are formulated in Section 3. In Section 4, the proposed mechanisms and methods are applied to the electricity market in Yunnan. Section 5 concludes the paper and presents the future research directions.

2. Issues and Challenges

2.1. Upstream and Downstream Joint Clearing of Cascade Hydropower Stations

In the day-ahead market clearing process, cascade hydropower stations face inherent conflicts between coordination and competition. If upstream stations bid higher prices while downstream stations bid lower prices in the day-ahead market, downstream stations will have more volume cleared than upstream stations. However, the downstream stations may face infeasible dispatch schedules due to the lack of sufficient storage capacity. This issue can be addressed by introducing constraints to limit the cleared volume of downstream stations. Conversely, if upstream stations bid lower prices while downstream stations bid higher prices in the day-ahead market, and the latter lack sufficient regulation capacity, competitive water abandonment may occur [10]. To maximize the utilization of abandoned water, penalties for water spillage can be incorporated into the objective function of the market clearing model. Alternatively, the participation mechanism for high-bid downstream stations experiencing spillage can be adjusted to prioritize their clearing. Regardless of the mitigation measure applied, these adjustments may reduce the cleared volume of low-bid market participants, potentially undermining market competitiveness and fairness [11]. Therefore, it is essential to develop an integrated market-clearing algorithm for upstream and downstream cascade hydropower stations in the spot market. This algorithm should propose viable strategies for managing competitive water spillage while ensuring that the cleared volumes for each station remain executable.

2.2. Different Types of Power Source Bidding on the Same Platform

Both domestic and international electricity market practices have demonstrated that a single energy market based on marginal pricing struggles to accommodate power systems with diverse technical and cost characteristics. For power sources with significant cost structure differences, differentiated treatment is necessary. Based on cost characteristics, conventional power generation resources can generally be categorized into low-variable-cost and high-variable-cost generators. Low-variable-cost resources include hydropower, renewables, nuclear power, and so on. Their primary cost component is upfront capital investment, while operational costs are minimal or nearly zero. In contrast, high-variable-cost resources, such as coal and gas-fired power plants, have relatively lower initial investment costs but significantly higher operational costs, particularly fuel expenses. A key challenge for hydropower’s direct participation in the spot market is determining how it can effectively compete alongside other generation resources under the existing market-clearing mechanisms.

2.3. Coordination Between Spot Market and Long-Term Planning

For hydropower stations with annual regulation capacity, their primary role in the power system is to ensure long-term supply security and provide flexibility support [12]. By coordinating with downstream cascade hydropower stations, regulating hydro plants can transfer electricity generation between wet and dry seasons. They can store surplus energy as water during the wet season and release it during the dry season to increase power output. Given this unique operational characteristic, the long-term water storage and release strategy must be considered when these stations participate in the spot market. If regulating hydro plants are allowed to clear the market without constraints, water levels may deviate excessively from planned targets during certain periods, potentially jeopardizing the long-term stability of the power system. Therefore, a critical challenge that requires further research is how regulating hydro plants can effectively participate in the spot market while simultaneously ensuring stable operations over long-term horizons.

3. Mechanisms and Methods

3.1. Day-Ahead Spot Market Clearing Method for High-Proportion Hydropower Systems

In the day-ahead spot market with a high share of hydropower, independent bidding by upstream and downstream cascade stations may lead to competitive water spillage. To address this issue, relevant control constraints are introduced or updated, and an alternative participation mechanism for stations experiencing water spillage is proposed. A water spillage management strategy is developed, along with a corresponding settlement and compensation mechanism to account for deviation volumes arising from the spillage mitigation process [13].

3.1.1. Water Spillage Management Strategy

Considering that competitive water spillage primarily arises from mismatches in bidding between upstream and downstream cascade stations, the root cause is often the excessively high bids of spillage-prone stations, which prevent them from fully participating in market clearing. Therefore, from the perspective of spillage-prone stations, transitioning them into price takers can enable priority clearing, allowing them to secure higher cleared volumes and thereby reduce power curtailment [14]. At the same time, output control constraints must be introduced to ensure that the maximum cleared output of spillage-prone stations does not exceed the sum of their original cleared output and their spillage-induced surplus capacity, thereby maintaining fairness in market clearing [15]. Furthermore, since increasing the cleared volume of these stations through bid adjustments inevitably reduces the cleared volume of other participants, additional constraints must be incorporated to prevent new instances of water spillage at non-spillage stations.
(1) Adjusting the Market Participation Mode for Spillage-Prone Stations During the Water Spillage Period
Spillage-prone stations should shift from their original bid-based market participation to acting as price takers during periods of water spillage. If multiple stations experience spillage, they should be treated equally, and all abandoned hydropower stations should participate in clearing as price recipients.
(2) Establishing Control Constraints
Three categories of control constraints are introduced: output control constraints for spillage-prone stations, curtailment constraints for spillage-prone stations, and curtailment constraints for non-spillage stations. The specific details are as follows:
① Output Control Constraints for Spillage-Prone Stations. For the power station with water spillage in the conventional cleaning stage, it will gain priority clearing after bid adjustments. Without additional controls, these stations may encroach on the market share of other participants. Therefore, constraints must be imposed on the maximum allowable cleared output of each spillage-prone station in each time period.
P ¯ i , t P i , t + P S i , t
where P ¯ i , t represents the cleared output of spillage-prone hydropower station i during period t in the spillage management stage, P i , t denotes the cleared output of spillage-prone hydropower station i during period t in the conventional market clearing stage, P S i , t represents the curtailed energy of spillage-prone hydropower station i during period t in the conventional market clearing stage.
② Curtailment Control Constraints for Spillage-Prone Stations. Spillage-prone stations that experienced curtailment in the initial market clearing process must not generate additional spillage in the adjusted clearing stage.
Q S ¯ i , t P S i , t δ i , t + Q F i , t
where Q S ¯ i , t represents the spillage flow of spillage-prone hydropower station i during period t in the spillage management stage. Q F i , t denotes the flood discharge flow of spillage-prone hydropower station i during period t in the conventional market clearing stage. δ i , t represents the water consumption rate of spillage-prone hydropower station i during period t in the conventional market clearing stage. P S i , t δ i , t indicates the curtailed electricity flow, where the sum of curtailed electricity flow and flood discharge flow constitutes the total spillage flow.
③ Curtailment Control Constraints for Non-Spillage Stations. Stations that did not experience curtailment in the initial market clearing must continue to operate without curtailment in the adjusted clearing stage.
Q S ¯ j , t 0
where Q S ¯ j , t represents the spillage flow of non-spillage-prone hydropower station j during period t in the spillage management stage.
(3) Secondary Market Clearing
A second round of spot market clearing is conducted by adjusting the bid prices of spillage-prone stations to zero during spillage periods and incorporating the aforementioned control constraints. If water spillage persists after the second clearing process, it indicates that the system is unable to fully accommodate the excess energy, and market operations will proceed based on the final cleared results.

3.1.2. Settlement Compensation Mechanism

The implementation of the above water spillage management strategy will inevitably impact the revenues of other market participants. To address this, a settlement compensation mechanism is proposed to account for deviation volumes between different market clearing stages. This strategy follows the fairness principle of “those who benefit compensate those who incur losses”, identifying the entities eligible for compensation and those responsible for providing it based on the incremental revenue gained from market adjustments. Since the results of conventional market clearing are entirely determined by supply and demand, the locational marginal price (LMP) accurately reflects the value of electricity resources. Therefore, the conventional clearing results serve as the baseline for settlement and compensation in subsequent stages. Electricity consumers continue to be billed based on the LMP derived from the conventional clearing stage.
After adjusting the original bid price of spillage-prone hydropower stations to zero during the spillage period, these stations are granted priority clearing status. As a result, their awarded electricity volume significantly increases, while the market-cleared volume of other power stations inevitably decreases. Thus, the payers are the spillage-prone hydropower stations under conventional market clearing, whereas the compensation recipients are other stations experiencing reduced market-cleared electricity volume. Since spillage-prone hydropower stations participate in market clearing with zero bidding prices, they inevitably displace high-priced electricity from the market, leading to a lower clearing price compared to the conventional clearing stage. For the final cleared electricity volume of non-spillage-prone hydropower stations, it continues to be settled at the LMP determined during the conventional clearing stage, and their fundamental revenue is calculated as follows:
B j , t = P ¯ j , t λ j , t
where B j , t represents the fundamental revenue of non-spillage-prone hydropower station j during period t , P ¯ j , t denotes the cleared output during the spillage management stage in period t , and λ j , t is the LMP in the conventional clearing stage for period t .
For the additional electricity volume of spillage-prone hydropower stations, settlement is conducted at the lower LMP determined during the spillage management stage, whereas the electricity cleared in the conventional clearing stage remains settled at the conventional LMP. The fundamental revenue is calculated as follows:
B i , t = ( P ¯ i , t P i , t ) λ ¯ i , t + P i , t λ i , t
where B i , t represents the fundamental revenue of spillage-prone hydropower station i during period t , P ¯ i , t denotes the cleared output in the spillage management stage for period t , P i , t denotes the cleared output in the conventional clearing stage for period t , λ ¯ i , t denotes the LMP in the spillage management stage for period t , and λ i , t is the LMP in the conventional clearing stage for period t .
Since the preferential absorption of low-priced spillage electricity reduces the awarded electricity volume of some original generators, an additional penalty is imposed on the excess revenue of spillage-prone hydropower stations. This penalty is then allocated as compensation to other affected generators.
F 1 = i = 1 H η ( P ¯ i , t P i , t ) λ ¯ i , t
where F 1 denotes the penalty amount, η is the penalty coefficient determined by the market operator based on actual conditions, 0 η 1 , H represents the total number of spillage-prone hydropower stations.
Consequently, the final revenue of spillage-prone hydropower stations is given by:
B ¯ i , t = ( 1 η ) ( P ¯ i , t P i , t ) λ ¯ i , t + P i , t λ i , t
Compared to the conventional clearing stage, the reduction in clearing price during the spillage management stage results in a total revenue difference for generators given by:
F 2 = j = 1 U ( P j , t P ¯ j , t ) λ j , t i = 1 H ( P ¯ i , t P i , t ) λ ¯ i , t
where F 2 represents the total revenue difference of power plants, U denotes the total number of non-spillage-prone hydropower stations with reduced awarded electricity volume in the spillage management stage, P j , t and P ¯ j , t are the cleared output of non-spillage-prone hydropower station j in the conventional clearing stage and spillage management stage for period t , respectively.
In adherence to the principle of fairness, the compensation funds are allocated based on the revenue loss of each power station. Compensation is provided to non-spillage-prone power stations that experience a reduction in generation, with the total penalty amount and the overall revenue difference of power plants distributed in proportion to the decrease in electricity output. The final revenue B ¯ j , t of a non-spillage-prone power station with reduced generation during the spillage management stage is given by:
B ¯ j , t = B j , t + ( F 1 + F 2 ) ( P j , t P ¯ j , t ) λ j , t j = 1 U ( P j , t P ¯ j , t ) λ j , t
This strategy fundamentally represents a transfer of interests between spillage-prone hydropower stations and other generators, effectively incentivizing market participants to actively engage in the absorption of curtailed energy. Spillage-prone hydropower stations generate additional electricity that would otherwise be curtailed and gain extra revenue at a lower price, while generators with reduced electricity output receive a compensation margin without incurring generation costs.

3.2. Bidding Mechanism for Hydropower and Thermal Power in a Unified Market

Currently, power generation resources can generally be categorized into low-variable-cost and high-variable-cost generators. Low-variable-cost resources include hydropower, renewable energy, and nuclear power, where the primary cost component is upfront capital investment, while operational costs are minimal or nearly zero. These resources should be guided to bid based on long-term marginal costs and dynamically changing supply–demand relationships. In contrast, high-variable-cost resources, such as coal- and gas-fired power plants, have relatively lower initial investment costs but significantly higher operational costs, particularly fuel expenses. In fully competitive markets, clearing prices are often determined by short-term marginal costs, primarily the fuel costs of marginal units.

3.2.1. Electricity Markets Dominated by Hydropower

In markets where hydropower constitutes the dominant share of installed capacity, the role of thermal power plants has shifted from providing baseload generation to being primarily on standby, operating only during certain periods to address uncertainties and fluctuations in climate conditions and renewable energy output [16]. During the wet season, to ensure full utilization of hydropower, only a limited number of thermal power plants necessary for system security and stability are dispatched. In contrast, during the dry season, when hydropower output is insufficient, thermal generation is ramped up to fill the supply gap [17]. If market participants bid solely based on costs in the spot market, the marginal clearing process will inevitably dispatch the most expensive thermal units when clean energy supply is insufficient. This will lead to higher LMP, which brings increased electricity costs for local consumers, and excessive revenues for clean energy plants. However high-cost thermal generators face competitiveness challenges, reduced dispatch opportunities, and difficulties in cost recovery. Addressing the challenge of integrating a small but essential portion of high-cost thermal power into market competition is crucial. A recommended approach is to manage thermal power costs through structural adjustments and to establish a capacity market for recovering fixed investment costs, ensuring orderly investment in generation capacity.

Separate Bidding Mechanism in the Medium- and Long-Term Market

In hydropower-dominated markets, thermal power plants have minimal generation requirements during the wet season, primarily serving as backup and regulatory capacity. However, in the dry season, they become essential baseload resources, and full operation is needed to ensure electricity supply [18]. Throughout the year, thermal power plays an indispensable role in maintaining system stability and balancing fluctuations. However, since hydropower has near-zero variable costs and significantly lower long-term marginal costs compared to thermal power, it naturally holds a price advantage. If hydropower and thermal power are allowed to bid directly in the same market across both the long-term and spot markets, hydropower will consistently outcompete thermal generation, securing priority dispatch. This will result in a market-wide average electricity price determined by hydropower. Thermal power can only obtain partial electricity during peak period when hydropower output is insufficient.
Over time, hydropower plants may prioritize maximizing their immediate revenues, generating more electricity without considering the long-term stability of the power system. This could lead to excessive hydropower generation during periods when regulation capacity is still available, further limiting thermal generation opportunities. However, as reservoir levels eventually decline to their lowest limits, hydropower output will become severely constrained. At that point, the suppressed share of thermal generation from earlier periods cannot be retroactively reallocated, and the excess hydropower generated in earlier stages cannot be restored. Consequently, the power system may face a severe electricity supply shortage, jeopardizing system reliability. Conversely, if market rules mandate that thermal power plants provide system security capacity while accepting market prices predominantly shaped by hydropower, cost recovery for thermal plants will be inadequate. This could lead to persistent financial losses, discouraging future investment and undermining the operational sustainability of thermal power enterprises.
To address these issues, a separate bidding mechanism is recommended for the mid- to long-term market. Under this framework, traditional thermal generation and clean energy sources are separated into distinct markets. This prevents clean energy from leveraging its zero marginal cost advantage to undercut thermal power, while also ensuring that traditional thermal generators are not excluded from cost recovery due to a clean-energy-dominated pricing mechanism. This approach facilitates a fair valuation of different energy resources and provides effective price signals. In the traditional energy market segment, since thermal power lacks a competitive price advantage, a quota-based approach can be adopted. Specifically, all consumers are required to proportionally purchase a certain share of thermal power to support system reliability. By securing the majority of thermal power’s capacity and pricing in the mid- to long-term market, the system’s overall supply capability is largely predetermined. Consequently, the spot market can compete freely between hydropower and thermal power on the same platform, so as to promote the price formation in different periods.

Price Difference Subsidy Mechanism for Thermal Power

For thermal power units with reduced market share, a short-term solution to address stranded costs is the implementation of a price difference subsidy mechanism. By subsidizing generation costs, this mechanism promotes fair competition, ensuring that all market participants can compete on equal footing within the new electricity market framework [19]. If thermal generators are unable to recover their costs, investor confidence in future government-supported projects may be undermined, and traditional power companies may find themselves unable to compete fairly in a market-driven environment. This could ultimately lead to plant closures, resulting in a series of social stability concerns.
To enhance the competitiveness of thermal power while preventing a small proportion of thermal generation from disproportionately inflating overall market prices, price difference subsidies can be applied to thermal power bids, allowing them to compete alongside hydropower and other generation resources. Initially, price difference subsidies were introduced as a policy tool to support the rapid development of renewable energy. In a market-driven setting, they can also serve as a transitional measure for high-cost resources such as gas-fired and coal-fired power plants. For high-cost generators, price difference subsidies address two key challenges. First, these generators inherently lack a competitive advantage due to their high operational costs. Second, their elevated bid prices can drive up the overall market clearing price. To mitigate these effects, price difference subsidies can be used to enhance their competitiveness while preventing excessive price increases in the market.
In a perfectly competitive market where all participants submit cost-based bids without strategy, subsidizing high-cost generators will increase their chances of being dispatched while simultaneously lowering the uniform clearing price in the spot market. Regardless of the specific approach taken, introducing subsidies for high-cost generators will inevitably impact true market price formation. Since subsidies reduce the costs of high-cost generators during peak demand periods, they compress price differentials between peak and off-peak hours, distorting market signals that would otherwise accurately reflect supply and demand dynamics. Thus, price difference subsidies should be regarded only as a temporary transitional measure to mitigate stranded costs for thermal power.

Capacity Cost Recovery Mechanism for Thermal Power

A single energy market relying solely on energy prices is insufficient to ensure cost recovery for all types of power generation. A well-functioning wholesale electricity market should incorporate multiple trading mechanisms across different time horizons to establish a comprehensive pricing system. In addition to the energy market, market design should include an ancillary services market and a capacity cost recovery mechanism. The diversification of electricity products and trading time frames ensures a rational price structure, allowing power producers with different technological and economic characteristics to achieve cost recovery.
Different countries and regions have adopted various approaches to recover the cost of power generation capacity, generally categorized into three models: scarcity pricing mechanisms, capacity markets, and capacity compensation mechanisms. Scarcity pricing mechanisms rely on market-driven price signals with minimal regulatory intervention, offering simplicity and transparency. However, they present risks, such as extreme price volatility or supply shortages, making long-term capacity adequacy uncertain. Capacity markets establish a competitive mechanism to price generation capacity, allowing generators to recover fixed costs and make investment decisions based on projected load growth. This approach prevents excessive capital investment while reducing end-user electricity prices, but its implementation requires sophisticated forecasting and strong market oversight, posing challenges for emerging electricity markets. Capacity compensation mechanisms provide direct financial compensation for installed or available capacity, incentivizing generation investment. This method is typically government-led, where regulatory authorities define compensation standards and determine eligible capacity, ensuring stable cost recovery but lacking full market-driven dynamics.
A comparative analysis of these approaches suggests that the capacity compensation mechanism should be prioritized as an initial strategy to facilitate a smooth transition toward a competitive wholesale electricity market. As the market matures, more market-oriented capacity cost recovery mechanisms can be explored to better align with long-term market objectives.

3.2.2. Electricity Markets Dominated by Thermal Power

In electricity markets where traditional energy sources dominate, hydropower and other clean energy sources often achieve lower per-unit electricity prices due to their low long-term marginal costs. As a result, in mid- to long-term markets, hydropower may become the preferred choice for power consumers, driving transaction prices closer to those of traditional thermal power [20]. However, in the spot market, if electricity is cleared based purely on LMP, clean energy resources may get a free-ride on fossil-fuel-based LMP due to their near-zero marginal costs. To prevent this issue, an authorization contract mechanism or an excess revenue recovery mechanism can be introduced to regulate hydropower revenues.

Authorization Contract Mechanism with Peak Regulation Incentives

Over the years, China’s electricity pricing mechanisms have undergone multiple stages of reform, evolving from fully regulated tariffs to market-based pricing. However, historical cost and price discrepancies across different power sources have made direct competition between clean energy and conventional thermal power difficult. Many provinces still have portions of their generation capacity subject to government-administered fixed prices. The authorization contract mechanism remains one of the most effective tools for managing these pricing complexities.
For generation resources with significant cost differences and near-zero variable costs, such as hydropower and renewable energy, existing assets struggle to determine prices purely through energy market competition [21]. A recommended approach is to establish government-authorized contracts to determine settlement prices while incorporating a peak regulation incentive mechanism. By using spot market price signals, this mechanism encourages these resources to adjust their output in response to demand fluctuations, allowing them to capture arbitrage opportunities and enhance their flexibility.
A useful reference is the electricity market in Ontario, Canada, where a significant portion of generation capacity is priced at fixed government-administered rates. While this ensures stability, it also dampens incentives for hydropower to participate in system regulation. To address this issue, Ontario has implemented a special contract-for-difference mechanism, in which contracts are settled monthly based on actual generation, rather than predefined quotas. The benchmark price is derived from the hourly clearing price in the real-time market. This system encourages hydropower plants to generate more electricity during peak price periods and reduce output when prices are low, thereby improving their participation in grid balancing [22].

Excess Revenue Recovery Mechanism for Generation Resources

In electricity markets where clean energy has not yet become the dominant generation source, market clearing prices are typically set by marginal fossil fuel generators. In such cases, the competition between clean energy and traditional fossil-fuel-based generation can distort price signals. Since clean energy generators have extremely low variable costs, they often submit zero or negative bids, allowing fossil fuel generators to remain the marginal price-setting units [23]. As a result, market prices are often higher than the actual costs of clean energy, enabling clean energy resources to secure substantial excess revenues.
For hydropower plants with storage capacity, this issue is particularly pronounced. They not only benefit from near-zero operating costs but also possess significant flexibility, allowing them to generate more during peak price periods and maximize revenues. To address this, one approach is to follow the Nordic electricity market model, which does not implement special market mechanisms for hydropower. Instead, hydropower competes under the same rules as other generators [24]. Under this approach, flexible hydropower resources naturally achieve higher revenues due to their superior dispatchability, and no additional intervention is required.
Alternatively, if excessive profits from regulating hydropower stations are deemed problematic, an excess revenue recovery mechanism can be introduced. This mechanism would regulate hydropower revenues by defining a comprehensive cost benchmark. Any revenue exceeding this benchmark would be subject to recovery. To encourage hydropower to actively participate in system balancing, excess revenue recovery could be calculated based on the difference between the market-wide weighted average price and a predefined benchmark tariff. This would incentivize hydropower plants to generate more during periods of high electricity prices and reduce output when prices are low, thereby promoting grid stability while ensuring fair market competition.

3.3. Coordination Method Between Spot Market and Long-Term Supply Security

Due to its large reservoir capacity, regulating hydropower stations possess long-term regulation capability, meaning its generation potential is interdependent over an extended period. A hydropower station can choose to generate more electricity in the present while reducing output later or, conversely, generate less now to preserve water for increased future generation [25]. If excessive electricity is generated in the short term, water resources may be depleted prematurely, constraining future generation capacity. Conversely, if generation is too low in the present while future inflows exceed system absorption capacity, water spillage may occur. Therefore, in electricity systems with a high share of regulating hydropower stations, effective water level and energy storage planning is essential to prevent inefficient temporal allocation of supply capacity [26].
To ensure regulating hydropower stations maintain both long-term supply security and short-term flexibility in the spot market, its cleared volume should be appropriately constrained in the market clearing model. To prevent reservoirs from losing regulation capacity prematurely due to short-sighted dispatch decisions, the optimization-based spot market clearing model should be designed to incorporate multi-day constraints, expanding the time horizon beyond a single clearing period. By integrating hydropower storage continuity into the clearing model, the final reservoir storage level must meet future power supply adequacy requirements. This approach ensures that while optimizing spot market clearing efficiency, the model also accounts for hydropower’s role in securing electricity supply in subsequent periods.

3.3.1. Objective Function

The objective of the spot-clearing model is to minimize the total cost of power purchase.
obj = min i = 1 N t = 1 T C i , t P i , t + C i , t U + C i , t p min + l = 1 N L t = 1 T M S L l + + S L l + s = 1 N S t = 1 T M S L s + + S L s
where N denotes the total number of generating units, T represents the total number of dispatch periods. P i , t denotes the power output of unit i at time period t , C i , t P i , t , C i , t U and C i , t p min refer to the operation cost, startup cost, and minimum technical output cost of unit i at time period t , respectively. M is the penalty factor applied in LMP for network power flow relaxation, S L l + and S L l denote the forward and reverse power flow relaxation variables, respectively, of the line l. NL represents the total number of transmission lines. S L s + and S L s denote the forward and reverse power flow relaxation variables, respectively, of the section s, NS is the total number of sections.

3.3.2. Constraints

(1) System Load Balance Constraint
i = 1 N P i , t + j = 1 N T T j , t = D t
where P i , t represents the output power of unit i at time period t , T j , t represents the scheduled power flow of interconnection line j at time period t , N T is the total number of interconnection lines, D t represents the system demand at time period t .
(2) System Positive Reserve Constraint
i = 1 N α i , t P i , t max D t + R t U
where α i , t denotes the operating status of unit i at time period t , with α i , t = 0 indicating the unit is offline and α i , t = 1 indicating the unit is online. P i , t max represents the maximum output of unit i at time period t , R t U denotes the system positive reserve requirement at time period t .
(3) System Negative Reserve Constraint
i = 1 N α i , t P i , t min D t R t D
where P i , t min represents the minimum output of unit i at time period t , R t D represents the system negative reserve requirement at time period t .
(4) System Primary Frequency Regulation Reserve Constraint
i = 1 N min P i , t max P i , t , P i , t max × α i , t P R t P
where P i , t max represents the maximum output of unit i at time period t , α i , t P denotes the primary frequency regulation capacity calculation coefficient, R t P represents the system primary frequency regulation reserve requirement at time period t .
(5) Transmission Line Power Flow Constraints
P l min i = 1 N G l , i P i , t + j = 1 N T G l , j T j , t k = 1 K G l , k D k , t S L l + + S L l P l max
where P l min , P l max represent the lower and upper limits of the power flow on transmission line l , respectively. G l , i denotes the generator output power shift distribution factor of generator i at its corresponding node with respect to line l . G l , j represents the generator output power shift distribution factor of tie-line j at its corresponding node with respect to line l . N T is the total number of tie-lines. T j , t indicates the scheduled power of tie-line j during period t . G l , k denotes the generator output power shift distribution factor of node k with respect to line l . D k , t represents the bus load at node k during period t . The variables S L l + and S L l denote the positive and negative slack variables for power flow on line l , respectively.
(6) Section Power Flow Constraints
P s min i = 1 N G s , i P i , t + j = 1 N T G s , j T j , t k = 1 K G s , k D k , t S L s + + S L s P s max
where P s min , P s max denote the lower and upper limits of power flow across section s , respectively. G s , i is the generator output power transfer distribution factor from the node where unit i is located to section s . Similarly, G s , j is the generator output power transfer distribution factor from the node where tie-line j is located to section s . N T is the total number of tie-lines, and T j , t denotes the scheduled power flow on tie-line j at time period t . G s , k represents the power output distribution factor of node k relative to section s . D k , t is the bus load at node k during time period t . S L s + and S L s represent the forward and reverse power flow relaxation variables of section s , respectively.
(7) Sufficient Electricity Supply Constraint of Remaining Period
i = 1 M   V i T V i E + T E ( I i E Q i E ) / δ i E β V i T = V i 0 + t = 1 T ( I i , t Q i , t ) Δ t I i , t = L i , t + Q i 1 , t Γ i Q i , t = P i , t H δ i , t + Q i , t S
where V i T denotes the reservoir storage of hydro plant i at the end of time period T, V i E represents the reservoir storage of hydro plant i at the end of remaining period E. T E is the duration of the remaining period. I i E and Q i E denote the inflow and outflow of hydro plant i during remaining period, respectively. δ i E is the water consumption rate of hydro plant i during remaining period, while β represents the power supply adequacy coefficient for hydropower generation, which can be determined based on the forecasted generation and system energy balance calculations. M denotes the total number of hydropower stations. V i 0 is the initial storage of hydropower plant i , I i , t represents the inflow at time period t , and Q i , t represents the outflow. T is the total time horizon. L i , t represents the interval flow for hydropower plant i at time period t , and Γ i represents the upstream water retention time of the hydropower station. Q i 1 , t Γ i represents the upstream outflow of hydropower station i at time period t Γ i . P i , t H represents the power output of hydro plant i at time period t , and δ i , t denotes the water consumption rate. Q i , t S represents the water spillage of hydro plant i at time period t .
(8) In addition, the model includes conventional constraints such as generator output upper and lower limits, generator ramping constraints, minimum up/down time constraints, maximum start-stop frequency constraints, hydropower reservoir capacity constraints, and hydropower generation control constraints.

3.3.3. Solving Algorithm
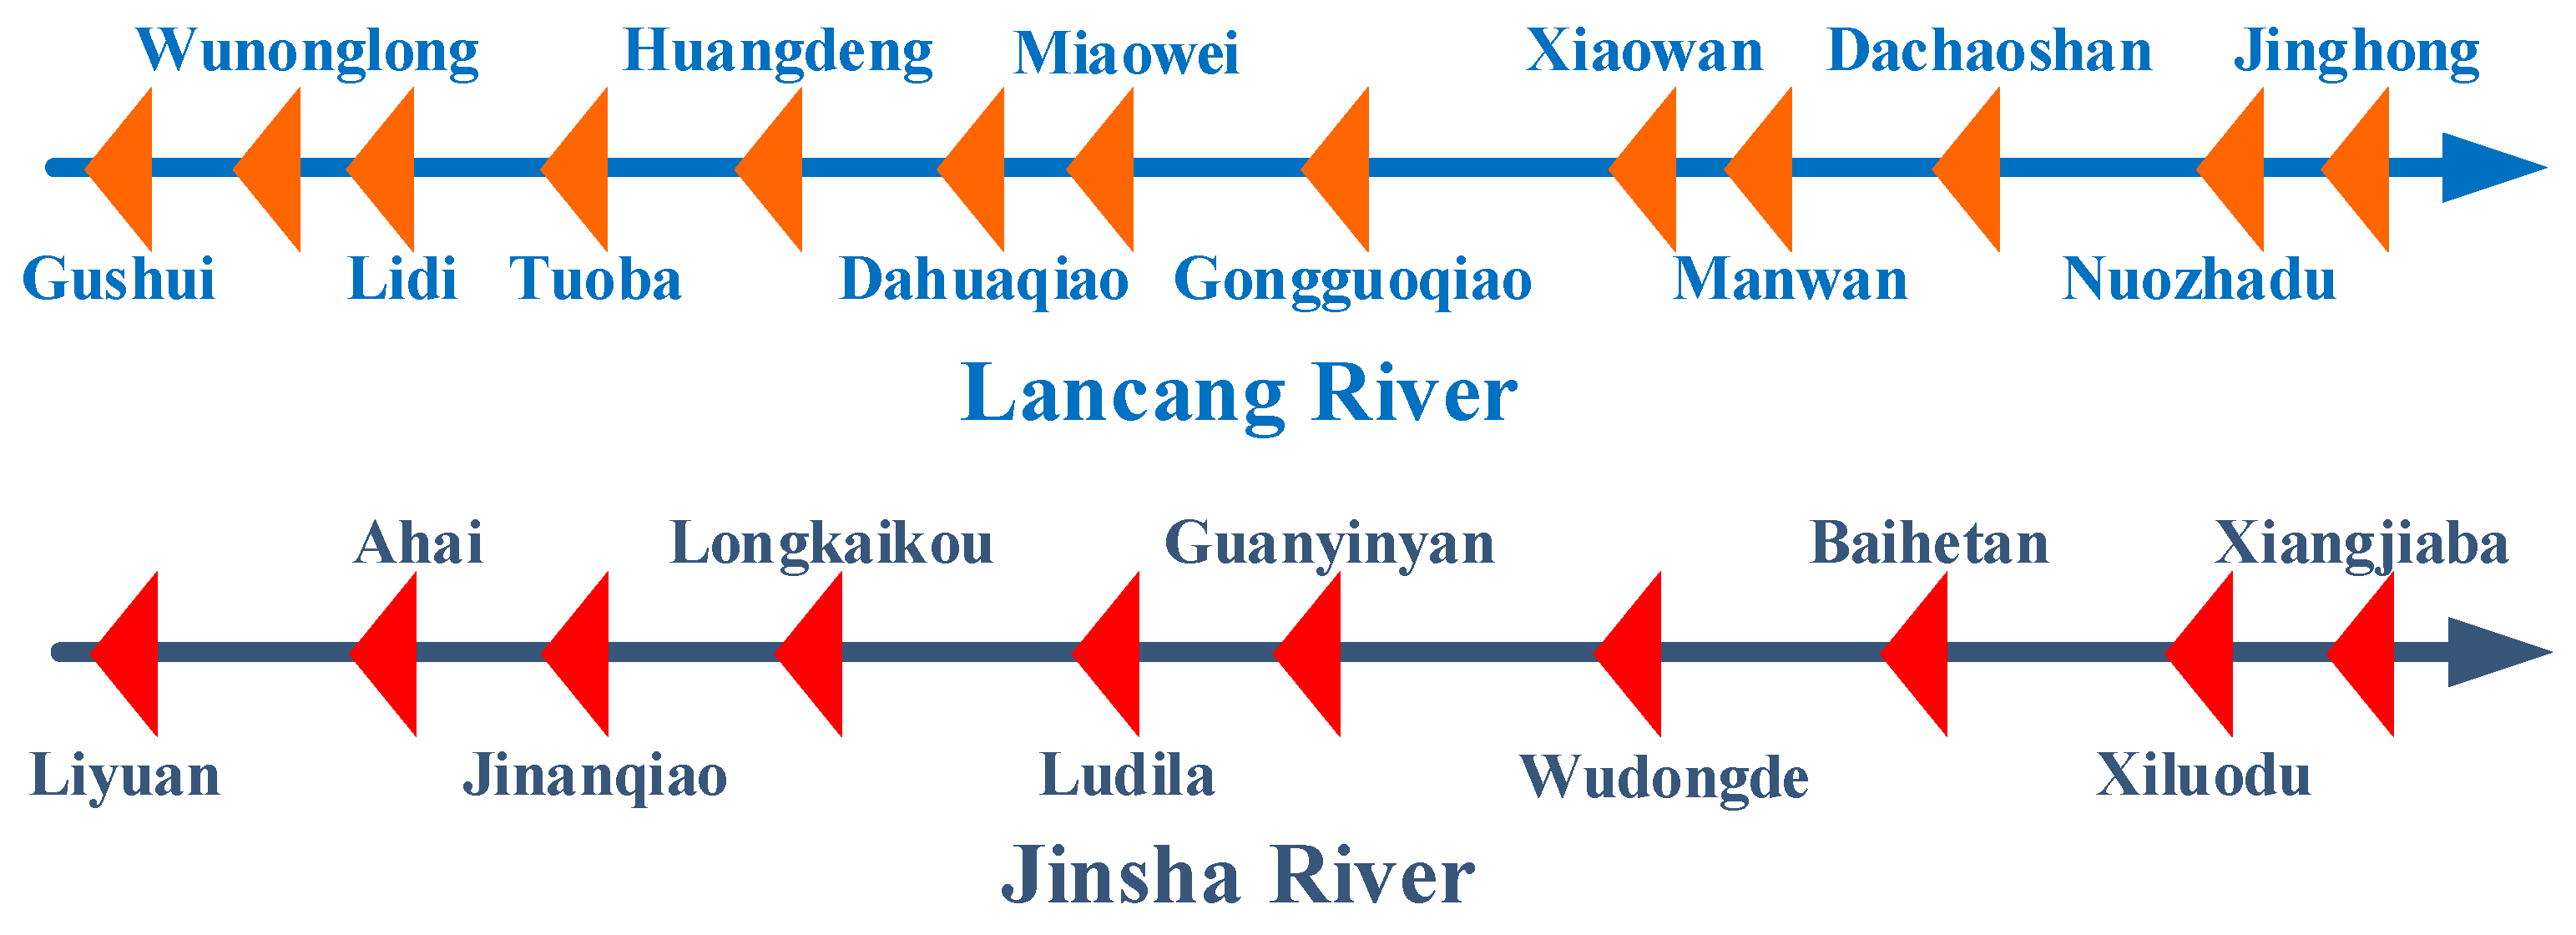
CPLEX is a solver designed for solving linear programming, quadratic programming, integer programming, and some nonlinear programming problems. It can handle millions of constraints and variables and can transform complex business problems into mathematical programming models. It also provides advanced optimization algorithms to quickly find solutions to the models. This paper needs to solve large-scale mixed-integer linear programming problems. Considering the requirements for solution efficiency and interactive interface, the CPLEX solver is adopted as the solution engine for the spot-clearing algorithm. According to the requirements of CPLEX format specification, by configuring the Java library files of CPLEX in Eclipse, the model and algorithm solver are automatically connected to realize the clearing of the entire transaction results.
The complexity of differentiated market structures and system characteristics introduces significant challenges for scheduling decisions and bidding strategies in high-proportion hydropower systems. A key challenge in spot market operations is how to manage the end-of-period reservoir levels of critical hydropower stations to preserve sufficient generation capacity for long-term system stability. To address this issue, the sufficient electricity supply constraint is introduced into the spot market clearing model. When the future supply adequacy requirement is not met, the model reduces the cleared volume of hydropower stations with relatively high bid prices while increasing the dispatch of alternative generation sources. This mechanism ensures sufficient energy storage for later periods, balancing immediate and long-term supply security and achieving a coordinated integration of hydropower spot market clearing with long-term system operations.

4. Case Study

Yunnan is located in the southwest of China. By the end of year 2024, the proportion of hydropower installed capacity was 56.6%, while the proportion of new energy installed capacity was 33.6%, and the proportion of thermal power installed capacity was 9.8%. It is a typical electricity market dominated by hydropower and clean energy. Yunnan’s hydropower system covers a number of cascade hydropower stations in Lancang River, Jinsha River, Zhu River, Red River, Nu River, Irrawaddy River, and other river basins [27], including world-class giant hydropower stations, such as Nuozhadu, Xiaowan, Wudongde, Xiluodu, etc. [28]. Yunnan’s total installed hydropower capacity has exceeded 80 million kW. The power market reform initiated by China in 2015 has changed the mode of power system dispatching and operation management. As one of the first pilot provinces for comprehensive electricity market reform, Yunnan has developed a relatively mature mid- to long-term market structure over the past decade. How to effectively solve the problem of regulating hydropower participating in the clearing of the spot market has become the focus of current research.
Among the hydropower stations participating in the electricity market in Yunnan, the largest installed capacity is the group of hydropower stations in the Lancang River cascade and Jinsha River cascade [29], as shown in Figure 1. Taking the spot market quotations of the annual regulating hydro plant Xiaowan and its downstream seasonal regulation hydro plant Manwan as a typical example and assuming that the power plant adopts a five segment quotation, Xiaowan has a normal quotation, and the highest output quotation is CNY 470/MWh. Manwan believes that it has sufficient regulating capabilities and intends to engage in speculative activities with the aim of obtaining high profits. It has a higher quotation, and the highest output quotation reaches CNY 600/MWh. In addition, Yunnan’s medium- and long-term electricity market has implemented a separate bidding mechanism, and contract for difference is used for settling accounts. While the spot market adopts LMP mechanism and the centralized full-electricity bidding market model. It is assumed that most power plants quote based on their own marginal costs. The thermal power plant A has already transacted the corresponding electricity in the medium and long-term market. In order to ensure this part of electricity, its quotation in the low output stage is 0, while in the high output stage, it is quoted according to the marginal cost, which is higher than the price of general hydropower stations. Due to the lack of regulating capability, most wind and photovoltaic power plants offer zero price to guarantee priority clearance. The quotations are presented in Table 1.

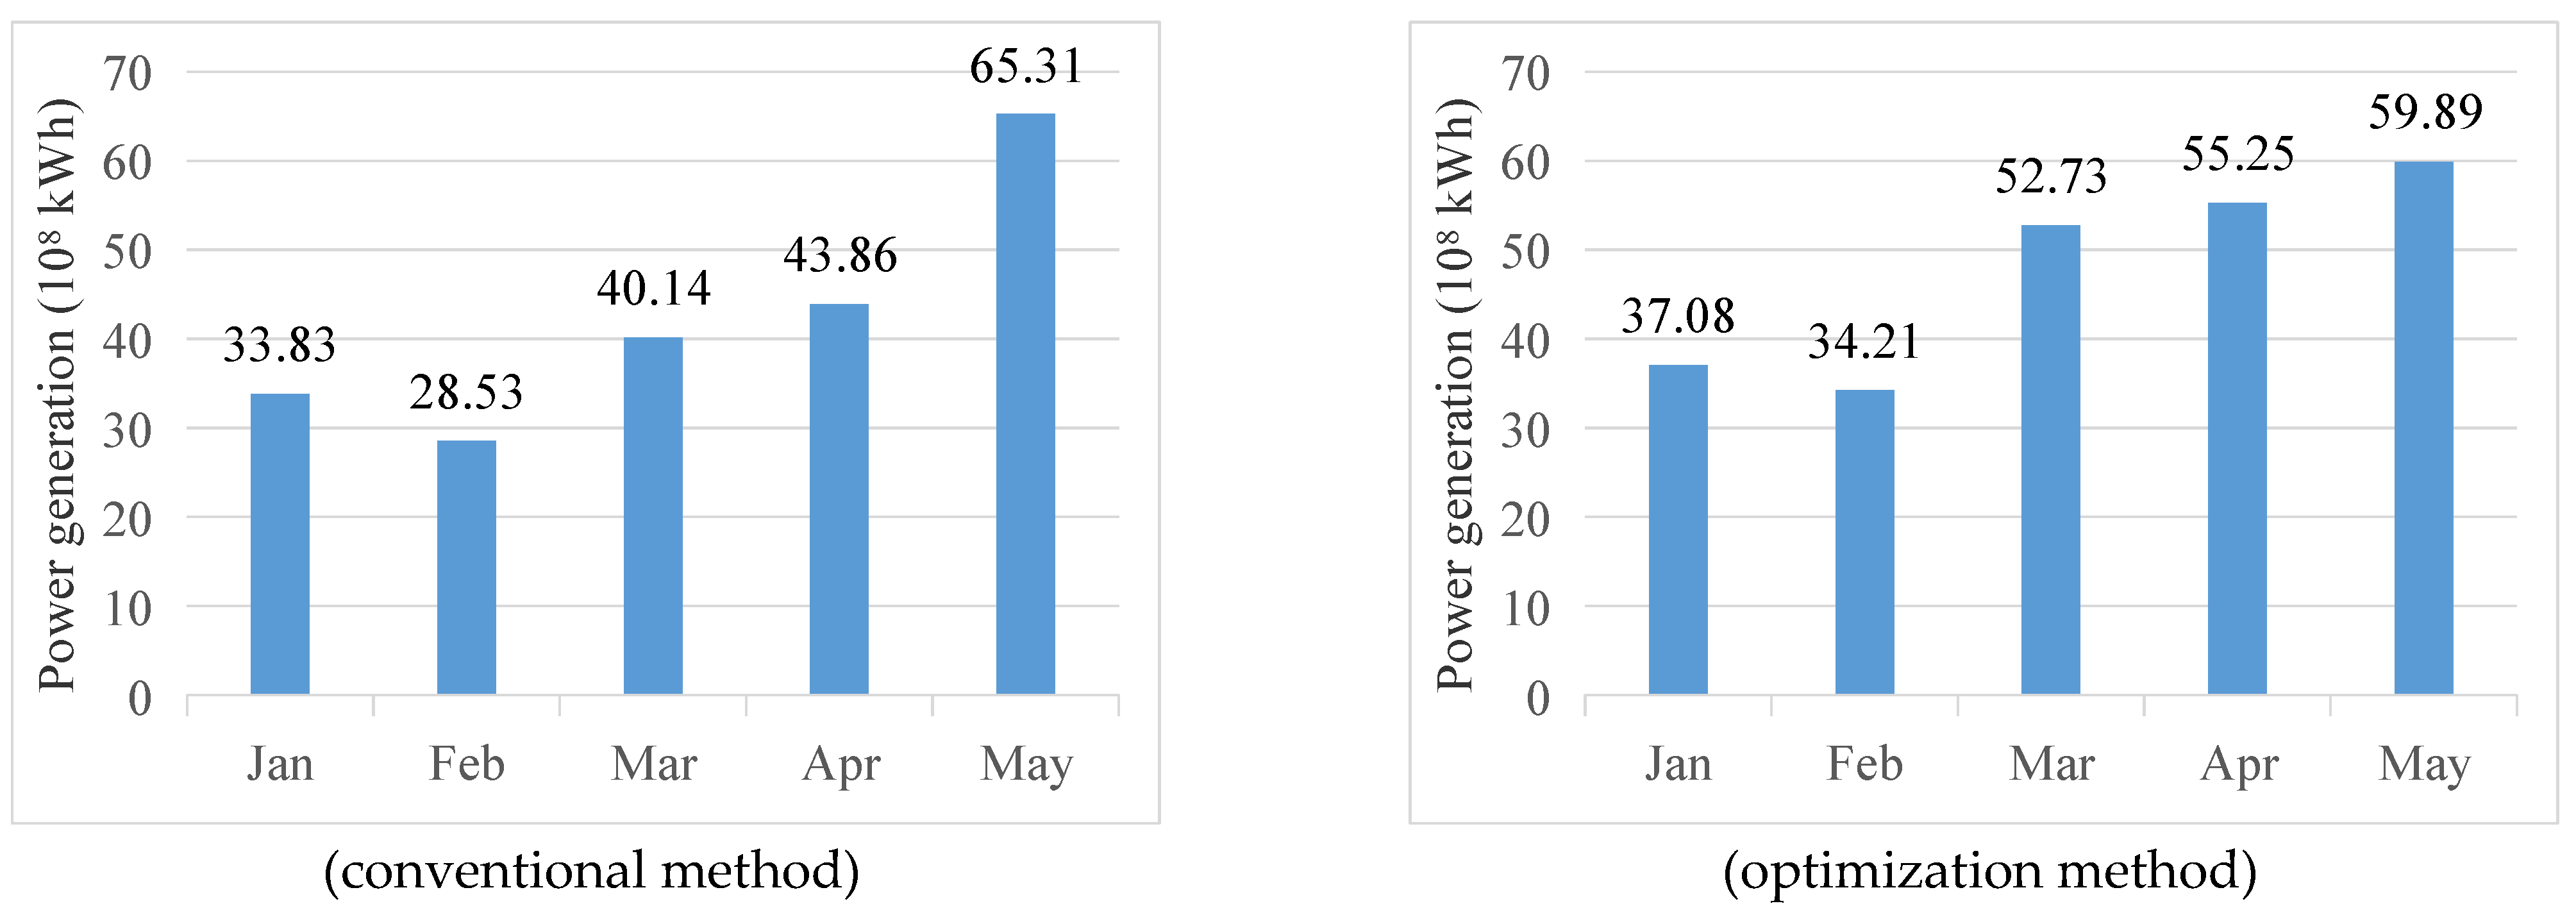
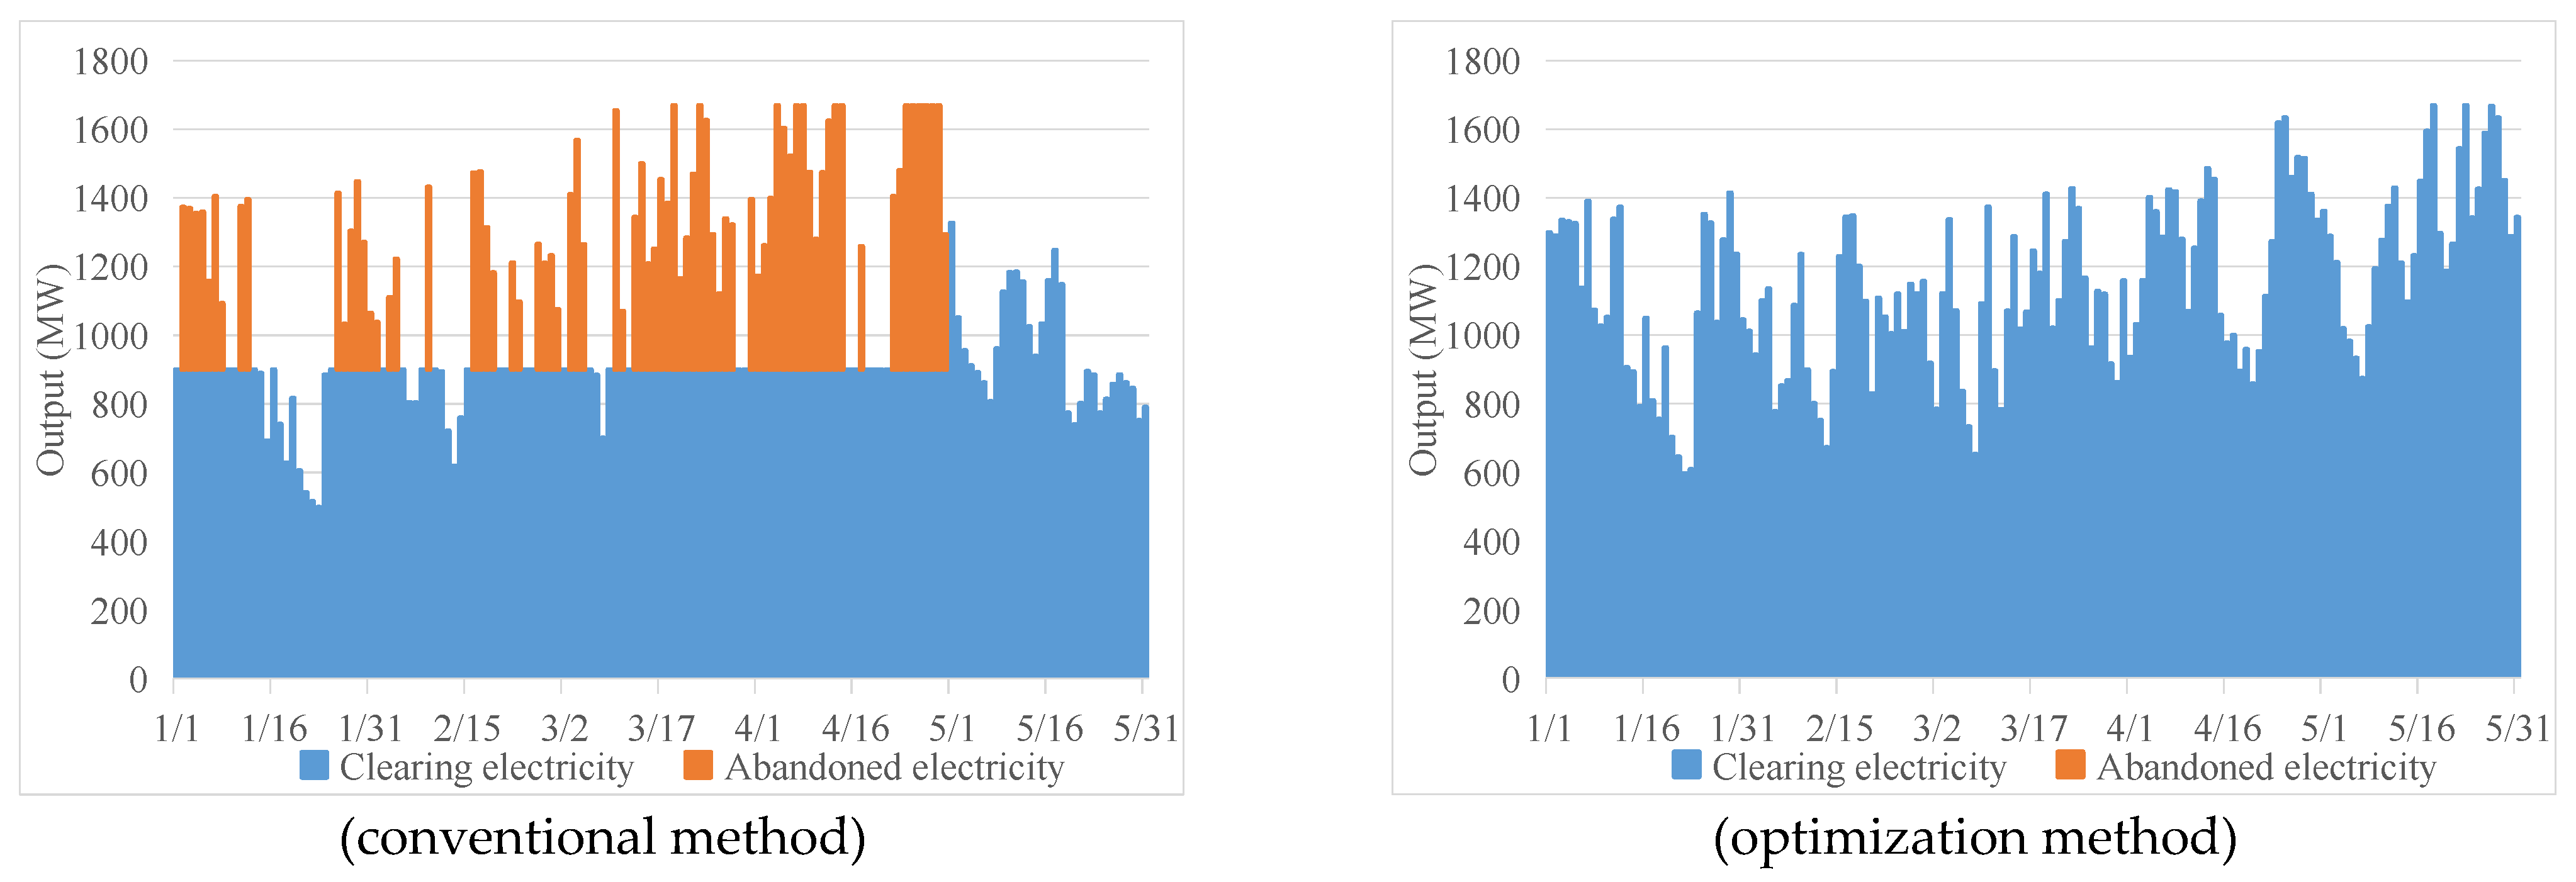
4.1. Conventional Method

The dry season from January to May is selected for continuous cleaning simulation operation. Firstly, the study assumes that the clearing is carried out completely according to the quotations, without dealing with the water spillage and without considering the long-term operation of regulating hydropower. When hydropower stations participate in spot market clearing, they are only subject to the constraints of their own physical parameters. Table 2 lists the key physical constraints of the main power plants in the Lancang River and Jinsha River basins. Using this conventional method to obtain the overall operation results of the electricity market and the situation of hydropower operation.

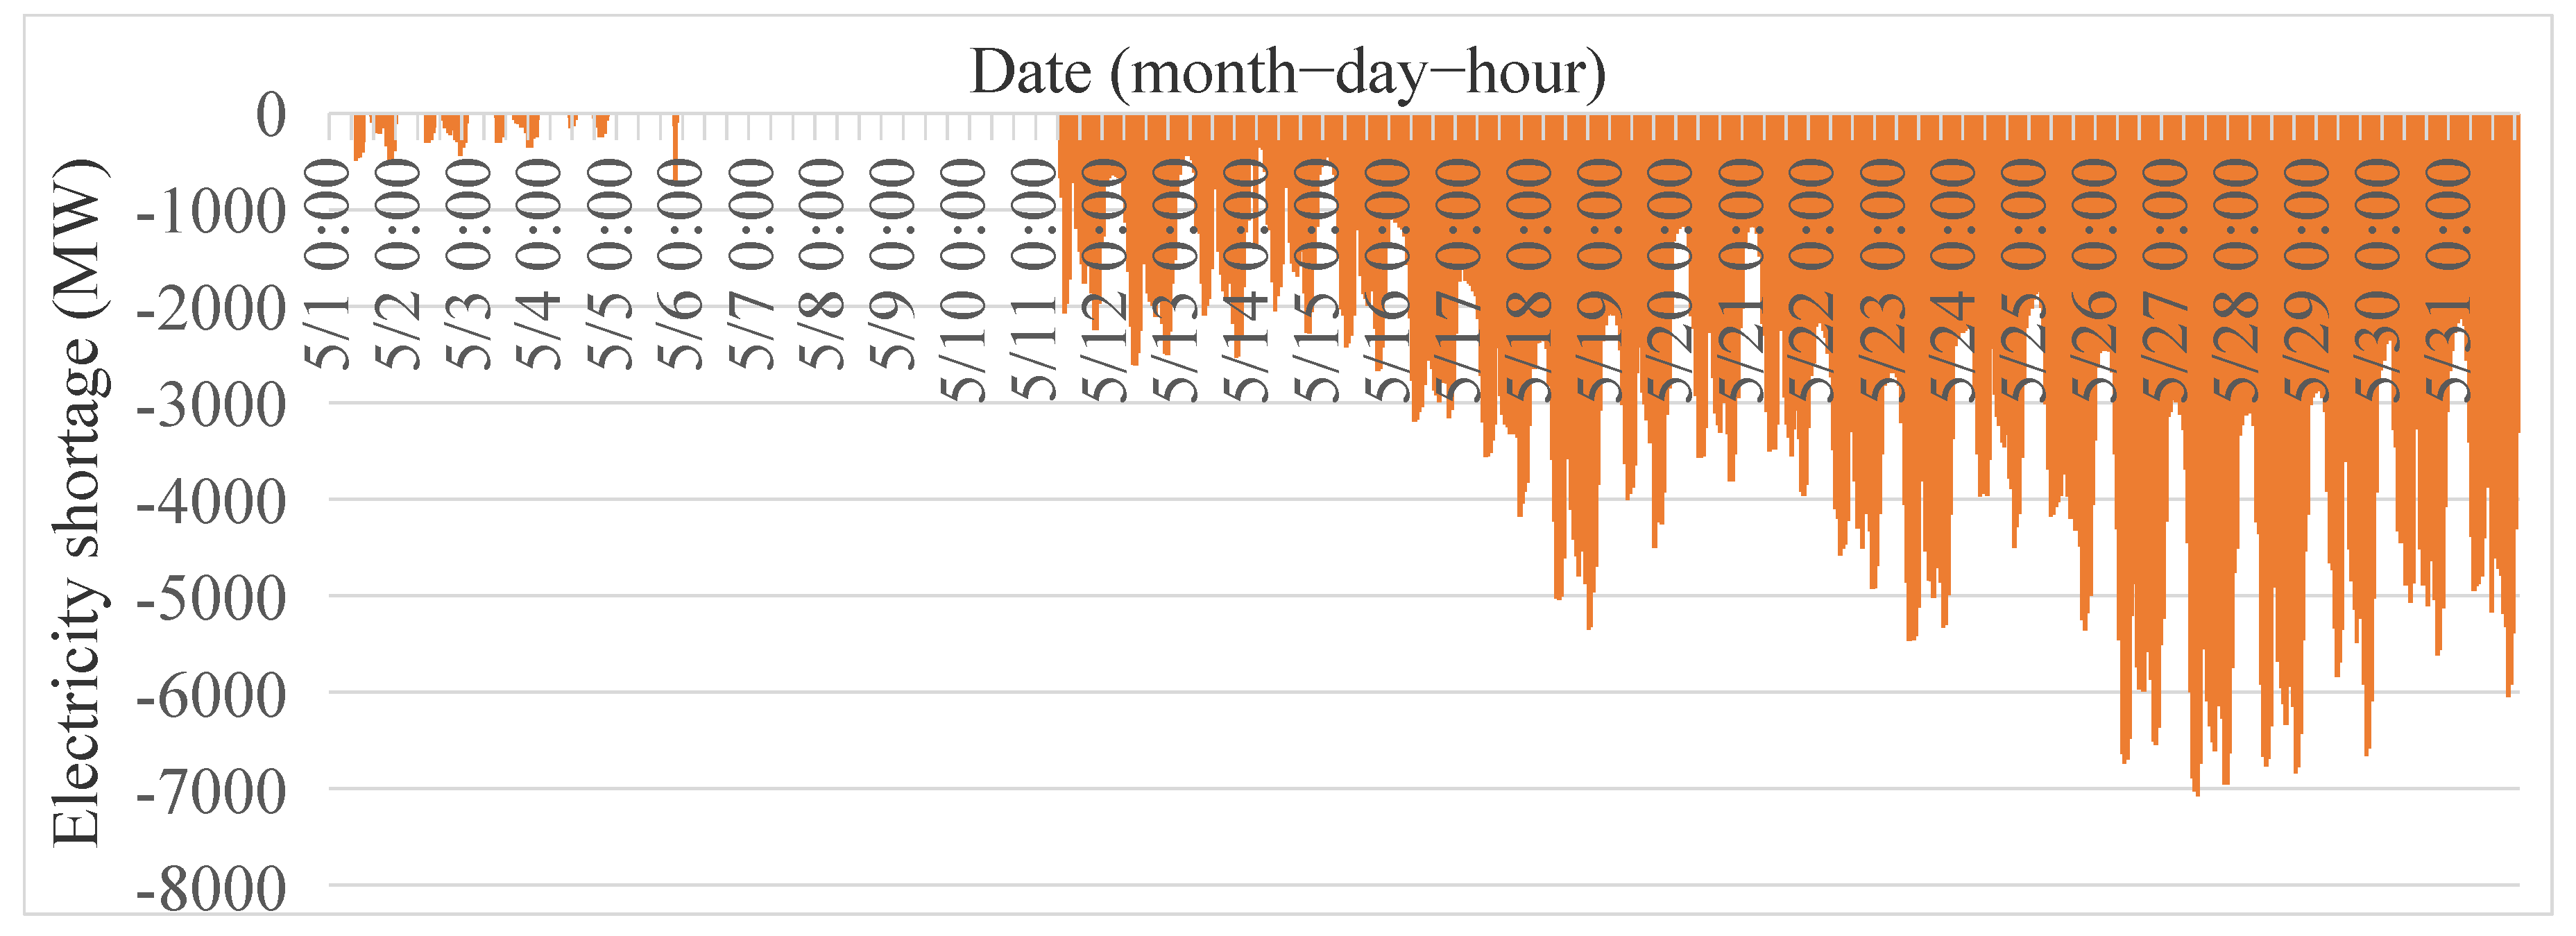
4.2. Optimization Method

Secondly, by applying the method of the day-ahead spot market clearing method for high-proportion hydropower systems and the coordination method between the spot market and long-term planning, another optimized results can be obtained. The specific difference between the optimization method and the conventional method is that the optimization method takes into account the priority consumption of water spillage in the spot-clearing model. For the water spillage that can be consumed, it will ignore the relevant power plant’s quotations to clear them first, aiming to lower the marginal clearing price and increase the consumption of clean energy. At the same time, to prevent the excessive consumption of hydropower energy storage, the optimization method particularly adds sufficient electricity supply constraint of remaining period in the spot-clearing model to ensure the long-term adequacy of power supply.

4.3. Comparison of Results

The water level and clearance value of Xiaowan are shown as Figure 2. Under the conventional method, due to the lower quoted price of Xiaowan compared to the high quoted price of thermal power plants, the amount of cleared electricity was relatively large. In early May, the water level prematurely dropped to the dead water level. After that, due to the limited power generation capacity, the amount of cleared electricity significantly decreased. Under the optimization method, the clearing power of Xiaowan was effectively reduced in the early stage, and the energy storage of Xiaowan was controlled, so that it still retained sufficient regulating capacity in May.
The total amount of electricity cleared by the two methods for thermal power is shown as Figure 3. Under the conventional method, thermal power cannot compete with hydropower due to the high bidding price in the high segment, and the amount of electricity cleared from January to April is relatively low. In early May, due to the large amount of electricity cleared by Xiaowan Power Plant and other hydropower plants in the early stage, the water level dropped to the dead water level prematurely. After the hydropower storage energy was consumed, the power generation capacity was insufficient, and thermal power began to clear and generate electricity at its maximum capacity. However, due to the limited upper limit of thermal power capacity, it was still unable to make up for the system electricity shortage. At times of high electricity demand or low output of new energy, hydropower plants similar to Xiaowan dropped to the dead water level and could not provide electricity support. The entire system experienced a shortage of electricity, and the spot market failed to clear. The entire system gap is shown as Figure 4. Under the optimization mode, the clearing model adds constraints on the adequacy of power supply during the remaining period, which increases the clearing capacity of thermal power and limits the clearing capacity of hydropower, retaining sufficient energy storage for the later stage. There was no power shortage during the entire operation period from January to May.
The clearing electricity and abandoned electricity of Manwan in the spot market are shown in Figure 5. Under the conventional method, due to the high output quotation in the stage above 900 MW, which is even higher than the second stage quotation of thermal power plants, Manwan was forced to generate water spillage. Under the optimization method, by implementing a water spillage management strategy, Manwan was transformed from participating in the clearing process based on the original quantity quotation to participating as a price receiver during the water spillage period. This reduced the clearing electricity of other high priced and adjustable power plants and absorbed the abandoned electricity of Manwan. There was no water spillage during the entire operation period.
In order to illustrate the impact of the water spillage management strategy on the price, taking the result at 8 o’clock on 30 April as an example. The load demand was 29,951 MW. When the water spillage management strategy was not implemented, the marginal clearing price was CNY 501/MWh. The clearing electricity of Manwan was 900 MW, and the abandoned electricity was 389 MW. After implementing the water spillage management strategy, Manwan was transformed as a price taker during periods of water spillage. The clearing electricity was 1289 MW, and the marginal clearing price dropped to CNY 480/MWh. Under ideal conditions, without considering the influence of blocking, the total purchase cost of the system in this hour will decrease by 21 × 29,951 = CNY 628,971. The illustration is shown as Figure 6.

5. Conclusions

The participation of hydropower in the spot market has always been a core research topic in the electricity market. This paper studies the typical market model of regulating hydropower participating in the spot market. The main innovations are concluded as follows: First, a method for treating water spillage in hydropower and a settlement compensation strategy are proposed, which solve the problem of competitive water spillage in upstream and downstream hydro plants caused by mismatched quotations. Second, the bidding problem of different types of power sources, such as hydropower and thermal power on the same platform is solved while realizing the reasonable recovery of the power cost. Third, by incorporating sufficient electricity supply constraint into the spot-clearing model, a reasonable connection between the spot-clearing and the long-term operation can be achieved. Finally, the proposed optimization methods, including the separate bidding mechanism, water spillage management strategy, and sufficient electricity supply constraint of the remaining period, are applied to the Yunnan electricity market. The results show that the proposed method of regulating hydropower by participating in the spot market can effectively reduce water spillage and promote clean energy consumption. It can reasonably adjust the clearing volume of regulating hydropower to a certain extent, so as to ensure the long-term stable operation of the power market.
There is still a lot of work to be done in the future. (1) It needs to validate whether the proposed method in this paper can be generalized to other regional electricity markets, and whether the model proposed in this paper is applicable to the differences in power source type composition and market rules. (2) It is necessary to study how to adopt a superior algorithm to ensure the feasibility of the calculation when the system scale is further expanded. (3) It is necessary to explore how model outcomes shift under different scenarios, such as fluctuating inflows, changes in market rules, or policy adjustments. Sensitivity analysis will reinforce the robustness and adaptability of the proposed approach. (4) It is necessary to think about how to design mechanisms to provide information for long-term resource planning, investment decisions or regulatory design, and elevate the practical relevance of the work. (5) After a large amount of new energy is put into production, how to coordinate hydropower with other power sources in the market through joint optimization is also a problem that requires attention.

Author Contributions

Conceptualization, M.X. and H.C.; methodology, M.X.; software, M.X.; validation, Y.X.; formal analysis, D.W.; investigation, X.L.; resources, H.C.; data curation, X.L.; writing—original draft preparation, M.X.; writing—review and editing, M.X.; visualization, M.X.; supervision, X.L.; project administration, M.X.; funding acquisition, H.C. All authors have read and agreed to the published version of the manuscript.

Funding

This research received no external funding.

Data Availability Statement

All data that support the findings of this study are included within the article.

Acknowledgments

We would like to thank all the workmates who participated in the work in the Kunming Power Exchange Center Company Limited.

Conflicts of Interest

Authors Mengfei Xie, Xiangrui Liu, Huaxiang Cai and Dianning Wu were employed by the company Kunming Power Exchange Center Company Limited. The remaining authors declare that the research was conducted in the absence of any commercial or financial relationships that could be construed as a potential conflict of interest.

References

  1. Cheng, C.; Yan, L.; Mirchi, A.; Madani, K. China’s Booming Hydropower: Systems Modeling Challenges and Opportunities. J. Water Res. Plan. Manag. 2017, 143, 5. [Google Scholar] [CrossRef]
  2. Wu, Y.; Su, C.; Liu, S.; Guo, H.; Sun, Y.; Jiang, Y.; Shao, Q. Optimal Decomposition for the Monthly Contracted Electricity of Cascade Hydropower Plants Considering the Bidding Space in the Day-Ahead Spot Market. Water 2022, 14, 2347. [Google Scholar] [CrossRef]
  3. Zhang, X.; Lu, W.; Li, T.; Wang, C. A High Proportion of New Energy Participates in the Design of the Day-Ahead Market Clearing Mechanism. In Proceedings of the 11th International Conference on Power and Energy Systems, Shanghai, China, 18–20 December 2021; pp. 620–625. [Google Scholar]
  4. Liu, Y.; Zhang, H.; Guo, P.; Li, C.; Wu, S. Optimal Scheduling of a Cascade Hydropower Energy Storage System for Solar and Wind Energy Accommodation. Energies 2024, 17, 2734. [Google Scholar] [CrossRef]
  5. Song, Y.; Shen, C.; Wang, Y. Multi-objective optimal reservoir operation considering algal bloom control in reservoirs. J. Environ. Manag. 2023, 344, 118436. [Google Scholar] [CrossRef] [PubMed]
  6. Jia, Z.; Shen, J.; Cheng, C.; Zhang, Y.; Lyu, Q. Optimum day-ahead clearing for high proportion hydropower market considering complex hydraulic connection. Int. J. Electr. Power Energy Syst. 2022, 141, 20. [Google Scholar] [CrossRef]
  7. Li, Z.Y.; Wang, S.J. Market Risk Analysis to Hydropower Project Based on Monte Carlo Method—Case Study of Xiluodu Hydropower Station in Sichuan Province. Adv. Mater. Res. 2012, 472–475, 1437–1440. [Google Scholar] [CrossRef]
  8. Cheng, C.; Chen, F.; Li, G.; Ristic, B.; Mirchi, A.; Qiyu, T.; Madani, K. Reform and renewables in China: The architecture of Yunnan’s hydropower dominated electricity market. Renew. Sustain. Energy Rev. 2018, 94, 682–693. [Google Scholar] [CrossRef]
  9. Liu, S.; Yang, Q.; Cai, H.; Yan, M.; Zhang, M.; Wu, D.; Xie, M. Market reform of Yunnan electricity in southwestern China: Practice, challenges and implications. Renew. Sustain. Energy Rev. 2019, 113, 109265. [Google Scholar] [CrossRef]
  10. Yuan, W.; Sun, Y.; Su, C.; Wu, Y.; Guo, H.; Tang, Y. Day-ahead optimal scheduling of hydropower-dominated power grids under a spot market environment. J. Clean. Prod. 2024, 446, 141350. [Google Scholar] [CrossRef]
  11. Yuksel, I.; Demirel, I.H. Investigation of the optimal method for determining hydropower potential of small streams: A case study Batman Basin in Turkey. Arab. J. Geosci. 2021, 14, 580–581. [Google Scholar] [CrossRef]
  12. Cai, Z.; Zhang, C.; Zhang, C.; Sun, Y.; Zhang, G.; Zhang, D. Market Clearing with Participation of Cascade Hydropower Stations Based on Variable Dimension Reduction. In Proceedings of the 2021 3rd Asia Energy and Electrical Engineering Symposium (AEEES), Chengdu, China, 26–29 March 2021; pp. 1080–1086. [Google Scholar]
  13. Shen, J.J.; Cheng, C.T.; Jia, Z.B.; Zhang, Y.; Lv, Q.; Cai, H.X.; Wang, B.C.; Xie, M.F. Impacts, challenges and suggestions of the electricity market for hydro-dominated power systems in China. Renew. Energy 2022, 187, 743–759. [Google Scholar] [CrossRef]
  14. Costa, L.; Neto, J.A. Proposal for a water resource management strategy model using the water footprint concept. Assoc. Bras. Eng. Prod.—Abepro 2017, 14, 371–380. [Google Scholar] [CrossRef]
  15. Schaffer, L.E.; Adeva-Bustos, A.; Bakken, T.H.; Helseth, A.; Korpas, M. Modelling of Environmental Constraints for Hydropower Optimization Problems—A Review. In Proceedings of the 2020 17th International Conference on the European Energy Market, Stockholm, Sweden, 16–18 September 2020; pp. 1–7. [Google Scholar] [CrossRef]
  16. Oliveira, A.M.; Melo, A.; Souza, R.C. Optimum price bidding strategy in the short-term market of hydro-dominated systems. In Proceedings of the 2004 International Conference on Probabilistic Methods Applied to Power Systems, Ames, IA, USA, 12–16 September 2004; pp. 373–379. [Google Scholar]
  17. Nycander, E.; Soder, L. Modelling Prices in Hydro Dominated Electricity Markets. In Proceedings of the 2022 18th International Conference on the European Energy Market, Ljubljana, Slovenia, 13–15 September 2022; pp. 1–6. [Google Scholar] [CrossRef]
  18. Kleiven, A.; Risanger, S.; Fleten, S. Co-movements between forward prices and resource availability in hydro-dominated electricity markets. Energy Syst.-Optim. Model. Simul. Econ. Asp. 2023, 1–34. [Google Scholar] [CrossRef]
  19. Niessen, S.; Krasenbrink, B.; Haubrich, H.J.; Reuter, A. Unit commitment and planning of electricity trading for a hydro dominated generation system in decentral electricity markets. IFAC Proc. Vol. 2000, 33, 245–250. [Google Scholar]
  20. Qiu, Y.; Zhou, S.; Gu, W.; Zhang, X.P. Analysis of China’s Electricity Price and Electricity Burden of Basic Industries Under the Carbon Peak Target Before 2030. CSEE J. Power Energy Syst. 2024, 10, 481–491. [Google Scholar] [CrossRef]
  21. Cai, Z.; Cui, H.; Han, B.; Zhang, G.; Lu, Y.; Dai, Y. Analysis and Outlook of Future Chinese Electricity Spot Market Model. In Proceedings of the 2020 Asia Energy and Electrical Engineering Symposium (AEEES), Chengdu, China, 29–31 May 2020; pp. 875–880. [Google Scholar] [CrossRef]
  22. Xia, W.; Wang, Z.; Yang, T.; Gao, C.; Ming, H. Research on Electricity Selling Pricing of Electricity Retailers Considering the Independent Choice of Users. In Proceedings of the 2022 IEEE 6th Conference on Energy Internet and Energy System Integration (EI2), Chengdu, China, 11–13 November 2022; pp. 3274–3279. [Google Scholar] [CrossRef]
  23. Shi, J.; Guo, Y.; Tong, L.; Wu, W.; Sun, H. A Scenario-Oriented Approach to Energy-Reserve Joint Procurement and Pricing. IEEE Trans. Power Syst. 2023, 38, 411–426. [Google Scholar] [CrossRef]
  24. Huang, M.; Wei, Z.; Ju, P.; Wang, J.; Chen, S. Incentive-Compatible Market Clearing for a Two-Stage Integrated Electricity-Gas-Heat Market. IEEE Access 2019, 7, 120984–120996. [Google Scholar] [CrossRef]
  25. Zhang, Q.; Wang, M.; Wang, X.; Tian, S. Mid-long term optimal dispatching method of power system with large-scale wind-photovoltaic-hydro power generation. In Proceedings of the 2017 IEEE Conference on Energy Internet and Energy System Integration (EI2), Beijing, China, 26–28 November 2017; pp. 1–6. [Google Scholar] [CrossRef]
  26. Ge, X.L.; Zhang, L.Z.; Shu, J.; Fu, N.N. A Multi-Scenario Model for Mid-Long Term Hydro-Thermal Optimal Scheduling. In Proceedings of the 2012 Asia-Pacific Power and Energy Engineering Conference, Shanghai, China, 27–29 March 2012; pp. 1–4. [Google Scholar] [CrossRef]
  27. Liu, S.; Xie, M. Modeling the daily generation schedules in under-developed electricity markets with high-share renewables: A case study of Yunnan in China. Energy 2020, 201, 117677. [Google Scholar] [CrossRef]
  28. Xu, B.; Zhong, P.-A.; Du, B.; Chen, J.; Liu, W.; Li, J.; Guo, L.; Zhao, Y. Analysis of a Stochastic Programming Model for Optimal Hydropower System Operation under a Deregulated Electricity Market by Considering Forecasting Uncertainty. Water 2018, 10, 885. [Google Scholar] [CrossRef]
  29. Shen, J.; Cheng, C.; Zhang, X.; Zhou, B. Coordinated operations of multiple-reservoir cascaded hydropower plants with cooperation benefit allocation. Energy 2018, 153, 509–518. [Google Scholar] [CrossRef]
Figure 1. The cascade hydropower stations in Lancang River and Jinsha River.
Water 17 01288 g001
Figure 2. The water level and clearance value of Xiaowan.
Water 17 01288 g002
Figure 3. The clearing capacity of thermal power from January to May.
Water 17 01288 g003
Figure 4. The electricity shortage of conventional method.
Water 17 01288 g004
Figure 5. The clearing electricity and abandoned electricity of Manwan.
Water 17 01288 g005
Figure 6. The impact of the water spillage management strategy on electricity price.
Water 17 01288 g006
Table 1. The quotations of different types of power sources.
Power PlantParameterStage 1Stage 2Stage 3Stage 4Stage 5
XiaowanOutput (MW)0–840840–16801680–25202520–33603360–4200
Quotation (CNY/MWh)220260300400470
ManwanOutput (MW)0–300300–600600–900900–12001200–1670
Quotation (CNY/MWh)300400450550600
Thermal AOutput (MW)360–400400–450450–500500–550550–600
Quotation (CNY/MWh)0520560600688
Wind BOutput (MW)0–2020–4040–6060–8080–100
Quotation (CNY/MWh)00000
Photovoltaic COutput (MW)0–3030–6060–9090–120120–150
Quotation (CNY/MWh)00000
Table 2. The key physical constraints of hydropower stations.
Power PlantDead Water Level (m)Highest Water Level (m)Minimum Discharge (m3/s)Minimum Output (MW)Installed Capacity (MW)
Wunonglong1901190613099990
Lidi1814181814060420
Tuoba172517351501581400
Huangdeng158616191603121900
Dahuaqiao14721477160103920
Miaowei139814081701411400
Gongguoqiao13031307170160900
Xiaowan116612401201204200
Manwan988994130901670
Dachaoshan889899150931350
Nuozhadu7658121706555850
Jinghong5916025004301750
Liyuan160516183004202400
Ahai149215043505602000
Jinanqiao13981418350402400
Longkaikou128912983802701800
Ludila121212234001652160
Guanyinyan1122113435012003000
Wudongde9459751160143210,200
Baihetan7658251180190016,000
Xiluodu5406001200231713,860
Disclaimer/Publisher’s Note: The statements, opinions and data contained in all publications are solely those of the individual author(s) and contributor(s) and not of MDPI and/or the editor(s). MDPI and/or the editor(s) disclaim responsibility for any injury to people or property resulting from any ideas, methods, instructions or products referred to in the content.

