Article

Harnessing AHP and Fuzzy Scenarios for Resilient Flood Management in Arid Environments: Challenges and Pathways Toward Sustainability

by
Mortaza Tavakoli
1,2,
Zeynab Karimzadeh Motlagh
2,
Dominika Dąbrowska
3,
Youssef M. Youssef
4,
Bojan Đurin
5,* and
Ahmed M. Saqr
6
1
Department of Geography and Planning, Tarbiat Modares University, Tehran P.O. Box 14115-111, Iran
2
Iranian National Institute for Oceanography and Atmospheric Science (INIOAS), Tehran 1411813389, Iran
3
Faculty of Natural Sciences, University of Silesia, Będzińska 60, 41-200 Sosnowiec, Poland
4
Geological and Geophysical Engineering Department, Faculty of Petroleum and Mining Engineering, Suez University, Suez 43518, Egypt
5
Department of Civil Engineering, University North, 42000 Varaždin, Croatia
6
Irrigation and Hydraulics Department, Faculty of Engineering, Mansoura University, Mansoura 35516, Egypt
*
Author to whom correspondence should be addressed.
Water 2025, 17(9), 1276; https://doi.org/10.3390/w17091276
Submission received: 7 March 2025 / Revised: 19 April 2025 / Accepted: 21 April 2025 / Published: 25 April 2025

Abstract

:
Flash floods rank among the most devastating natural hazards, causing widespread socio-economic, environmental, and infrastructural damage globally. Hence, innovative management approaches are required to mitigate their increasing frequency and intensity, driven by factors such as climate change and urbanization. Accordingly, this study introduced an integrated flood assessment approach (IFAA) for sustainable management of flood risks by integrating the analytical hierarchy process-weighted linear combination (AHP-WLC) and fuzzy-ordered weighted averaging (FOWA) methods. The IFAA was applied in South Khorasan Province, Iran, an arid and flood-prone region. Fifteen controlling factors, including rainfall (RF), slope (SL), land use/land cover (LU/LC), and distance to rivers (DTR), were processed using the collected data. The AHP-WLC method classified the region into flood susceptibility zones: very low (10.23%), low (23.14%), moderate (29.61%), high (17.54%), and very high (19.48%). The FOWA technique ensured these findings by introducing optimistic and pessimistic fuzzy scenarios of flood risk. The most extreme scenario indicated that 98.79% of the area was highly sensitive to flooding, while less than 5% was deemed low-risk under conservative scenarios. Validation of the IFAA approach demonstrated its reliability, with the AHP-WLC method achieving an area under curve (AUC) of 0.83 and an average accuracy of ~75% across all fuzzy scenarios. Findings revealed elevated flood dangers in densely populated and industrialized areas, particularly in the northern and southern regions, which were influenced by proximity to rivers. Therefore, the study also addressed challenges linked to sustainable development goals (SDGs), particularly SDG 13 (climate action), proposing adaptive strategies to meet 60% of its targets. This research can offer a scalable framework for flood risk management, providing actionable insights for hydrologically vulnerable regions worldwide.

1. Introduction

Flash floods are among the most destructive natural disasters, causing severe impacts on human life, infrastructure, and ecosystems [1,2]. Their rapid onset and destructive intensity have increased due to climate (CL) change and urbanization [3,4]. These events disrupt socio-economic systems, aggravate poverty, and result in lasting environmental damage [5]. Global reports estimate billions of dollars in losses and thousands of fatalities annually [6]. Addressing these challenges requires integrated flood management strategies aligned with the United Nations’ Sustainable Development Goals (SDGs) [7,8]. These goals promote resilient infrastructure, sustainable cities, and CL adaptation measures [9]. Thus, effective flood management is essential for reducing vulnerabilities and enhancing sustainable development in high-risk regions [10,11].
Floods are primarily driven by intense or prolonged rainfall (RF), topography, and human activities [2]. Urbanization and deforestation increase runoff by disrupting natural drainage and reducing soil permeability [12]. CL change adds to this complexity by causing irregular RF and intensifying hydrological variability [13]. Heavy or sustained RF can exceed river capacity, leading to overflow and flash floods [14]. These events are more severe in areas with poor drainage, unregulated development, and environmental degradation [15,16]. South Khorasan Province, Iran, is especially vulnerable due to its arid and semi-arid CL, steep terrain, and episodic RF [17]. Conventional flood mapping often fails to capture the interplay of environmental, climatic, and anthropogenic drivers [18]. Therefore, precise flood susceptibility assessment is essential [19]. Advanced, integrated approaches are needed to manage spatial variability and decision uncertainty [20]. Scenario-based tools can support better preparedness and resource allocation by addressing multiple risk dimensions and enhancing regional resilience [21].
Multi-criteria decision-making (MCDM) techniques have proven effective in flood risk assessment, especially in regions where diverse environmental and anthropogenic factors interact [22]. These methods integrate hydrological, topographical, and socio-economic variables to provide a comprehensive understanding of flood susceptibility across various scales [23]. Among them, the analytical hierarchy process (AHP) is widely used for its structured approach and ability to incorporate expert judgment [24]. Through pairwise comparisons, AHP enables the prioritization of influencing factors based on their relative importance in a given context [25].
Numerous flood-related studies have utilized AHP to incorporate many hydrological, topographical, and geological indicators into spatial risk modeling [26]. When combined with the weighted linear combination (WLC) method, AHP becomes more robust. WLC aggregates the weighted inputs to generate flood susceptibility maps, aiding in targeted decision-making [27]. Choubin et al. [5] successfully applied the AHP-WLC framework to identify flood-prone areas in Iran, demonstrating its practical application for regional planning. Such studies confirm the adaptability of this method across different geographic and climatic settings and its strength in producing actionable outputs [28].
To enhance modeling under uncertainty, recent studies have introduced fuzzy logic into flood risk assessments. The fuzzy-ordered weighted averaging (FOWA) method addresses data imprecision and subjective variability, which are often limitations in conventional approaches [29]. FOWA supports scenario-based modeling, allowing the exploration of both optimistic and pessimistic risk perceptions [30]. This flexibility helps decision-makers allocate resources more effectively under varying conditions [31]. Tang et al. [32] highlighted the global applicability of the FOWA method, emphasizing its ability to refine flood risk maps in complex environments. The integration of AHP-WLC with FOWA offers a powerful framework for comprehensive, uncertainty-aware flood management planning.
Despite advancements in flood modeling, few studies have integrated AHP, WLC, and FOWA into a single comprehensive framework. Most existing research focuses on individual methods, limiting their capacity to fully address the multidimensional nature of flood risks [25,29]. This study fills that gap by applying an integrated flood assessment approach (IFAA), which combines AHP-WLC and FOWA, to South Khorasan Province, an arid and flood-prone region in Iran. Fifteen controlling factors were evaluated to produce accurate flood susceptibility maps. The study objectives are fourfold: (a) to use AHP-WLC to prioritize flood-prone areas, (b) to apply FOWA for scenario-based analysis under varying risk conditions, (c) to examine key flood management challenges in the region, and (d) to propose a sustainable flood mitigation strategy (SFMS) aligned with the SDGs. This integrated approach can enhance flood resilience and provide policy-relevant insights. The IFAA’s flexibility makes it suitable for application in other CL-sensitive areas, supporting sustainable development and disaster preparedness efforts.

2. Materials and Methods
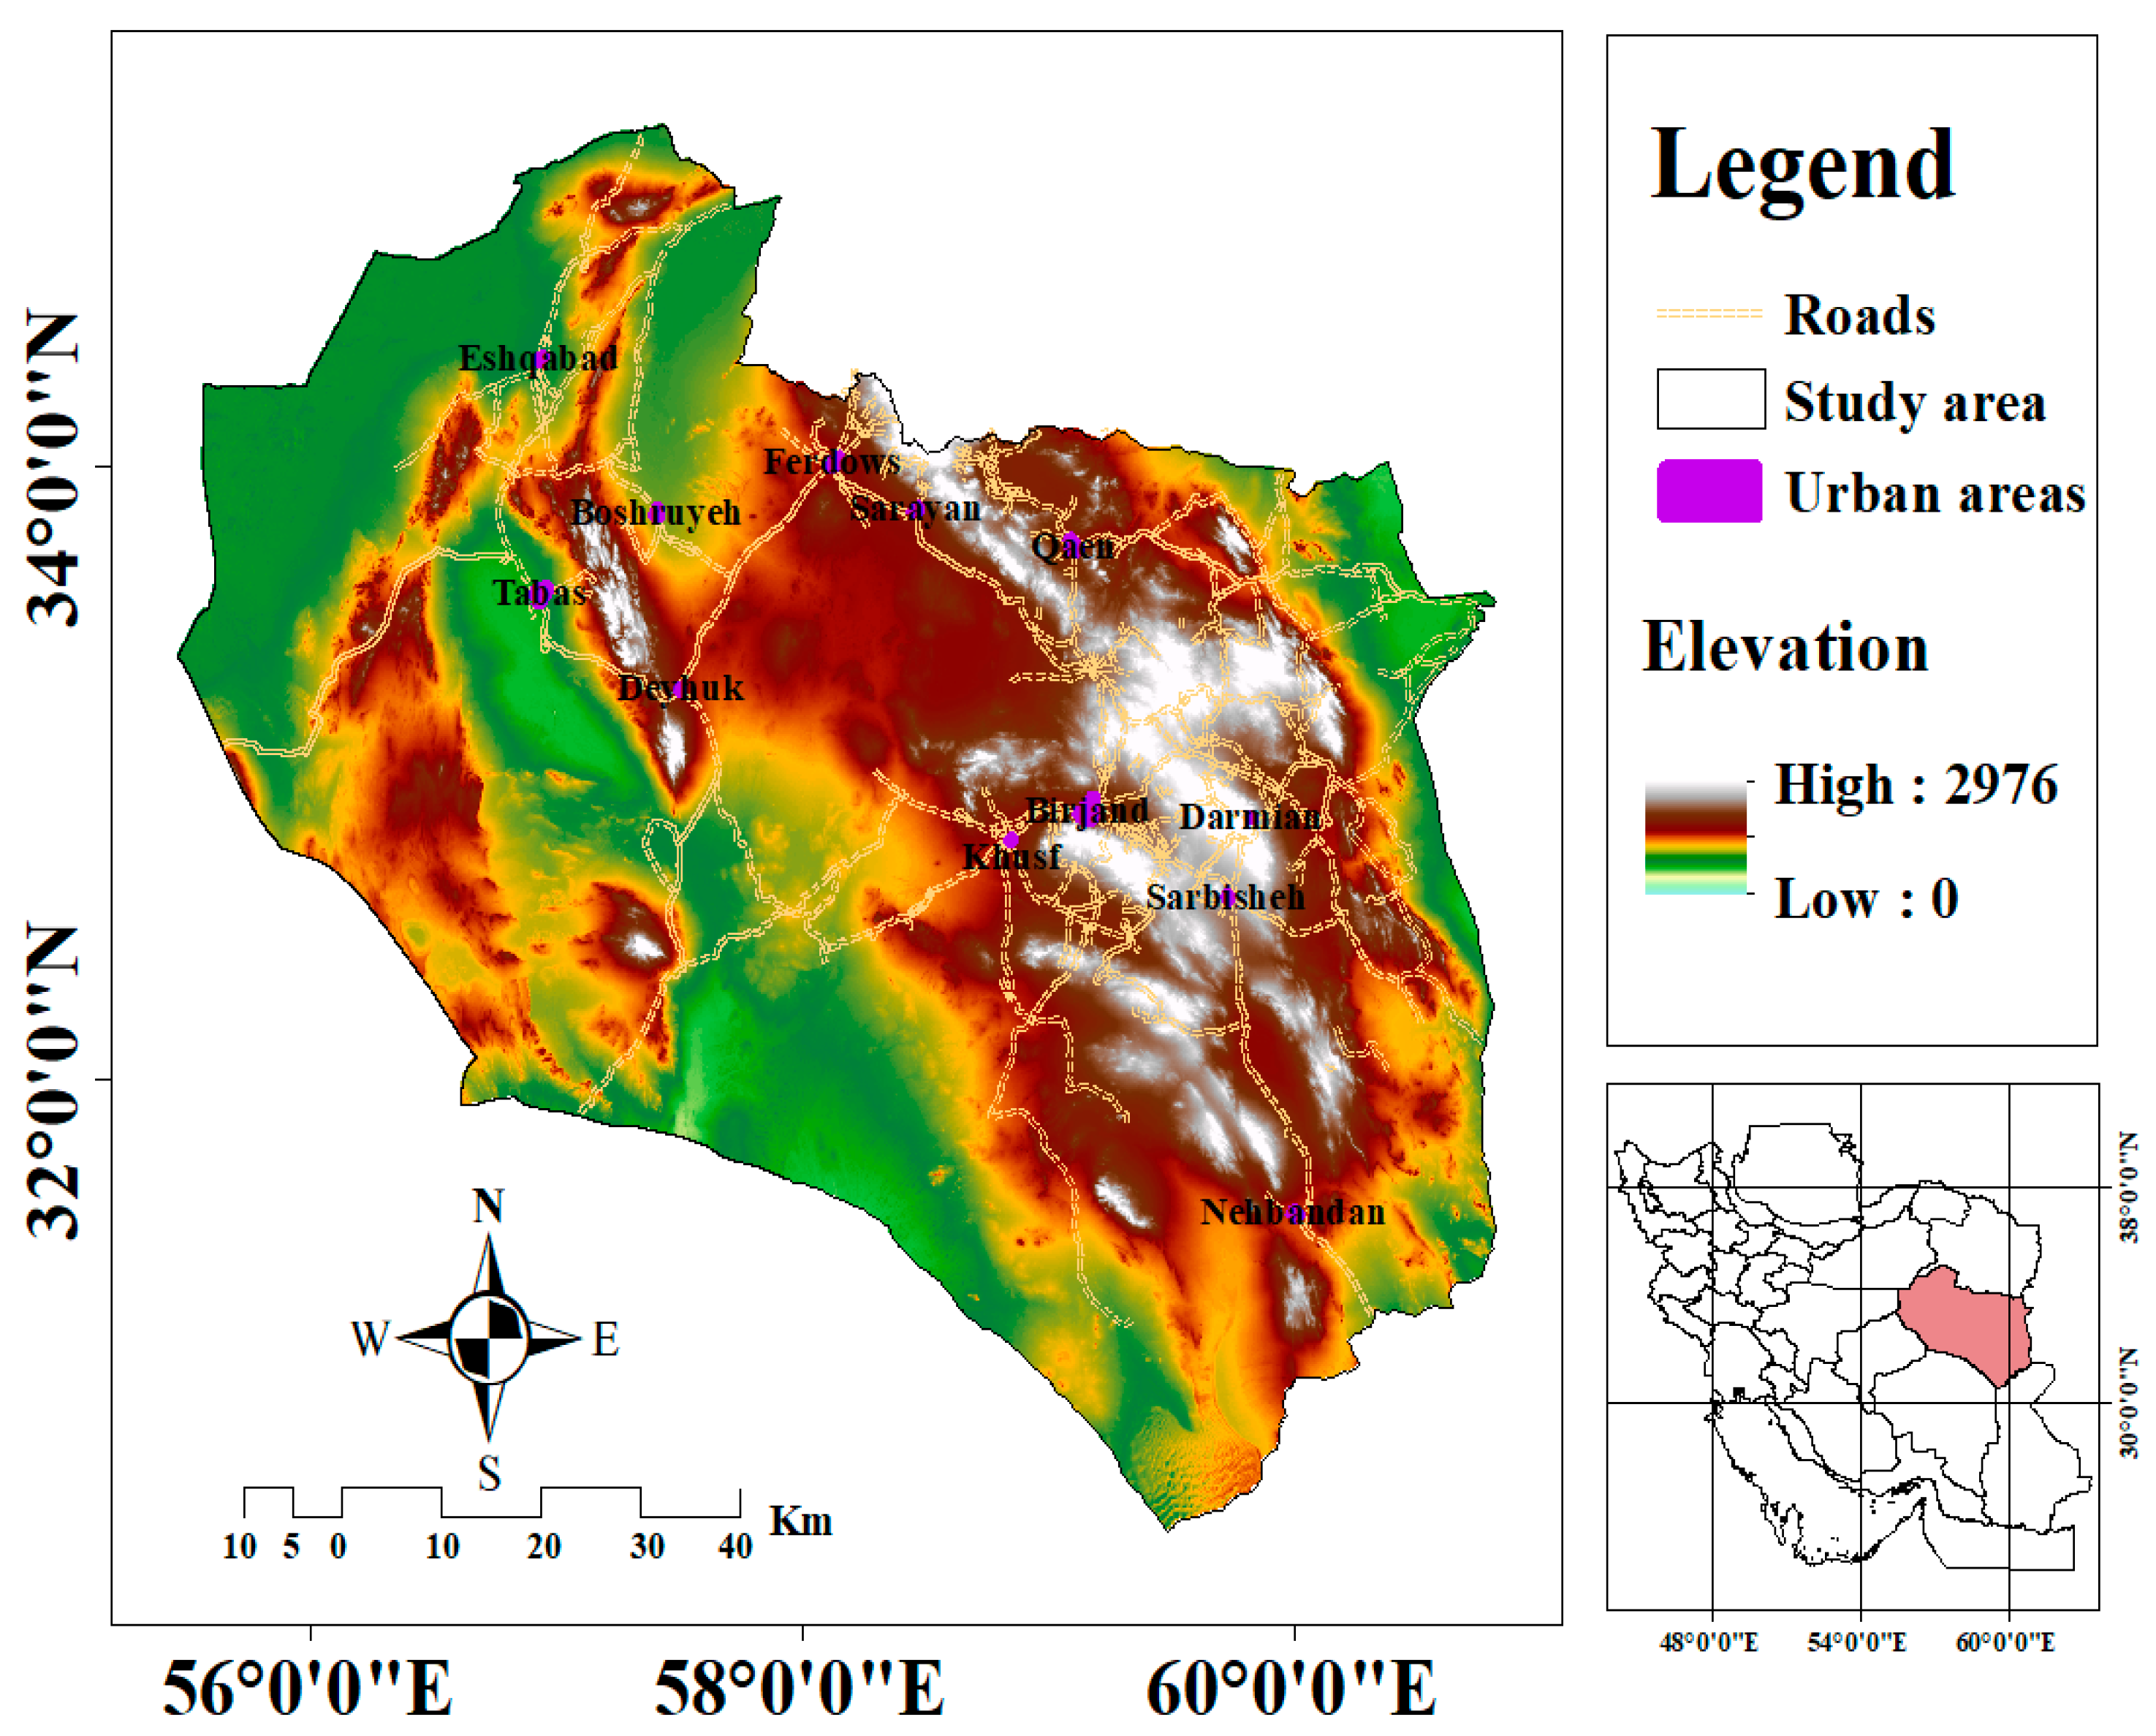
2.1. Study Area

South Khorasan Province is located in the easternmost region of Iran, positioned between longitudes (56–61)° E and latitudes (30–35)° N, with an area of approximately 149,838.45 km2 (Figure 1). It exhibits varied topography, with elevations (ELEs) spanning from near sea level to around 2976 m, encompassing hilly regions in the central and southern sectors and lower altitudes in the northern and western sections. The province has a primarily dry to semi-arid CL marked by elevated temperatures, significant evaporation rates, and scant precipitation. These climatic conditions yield little soil moisture and sparse vegetation cover [33]. The terrain and environment of the study area enhance its vulnerability to severe flash floods. The mountainous landscape facilitates swift runoff after severe localized precipitation, whereas the absence of vegetation diminishes the land’s capacity to retain water.

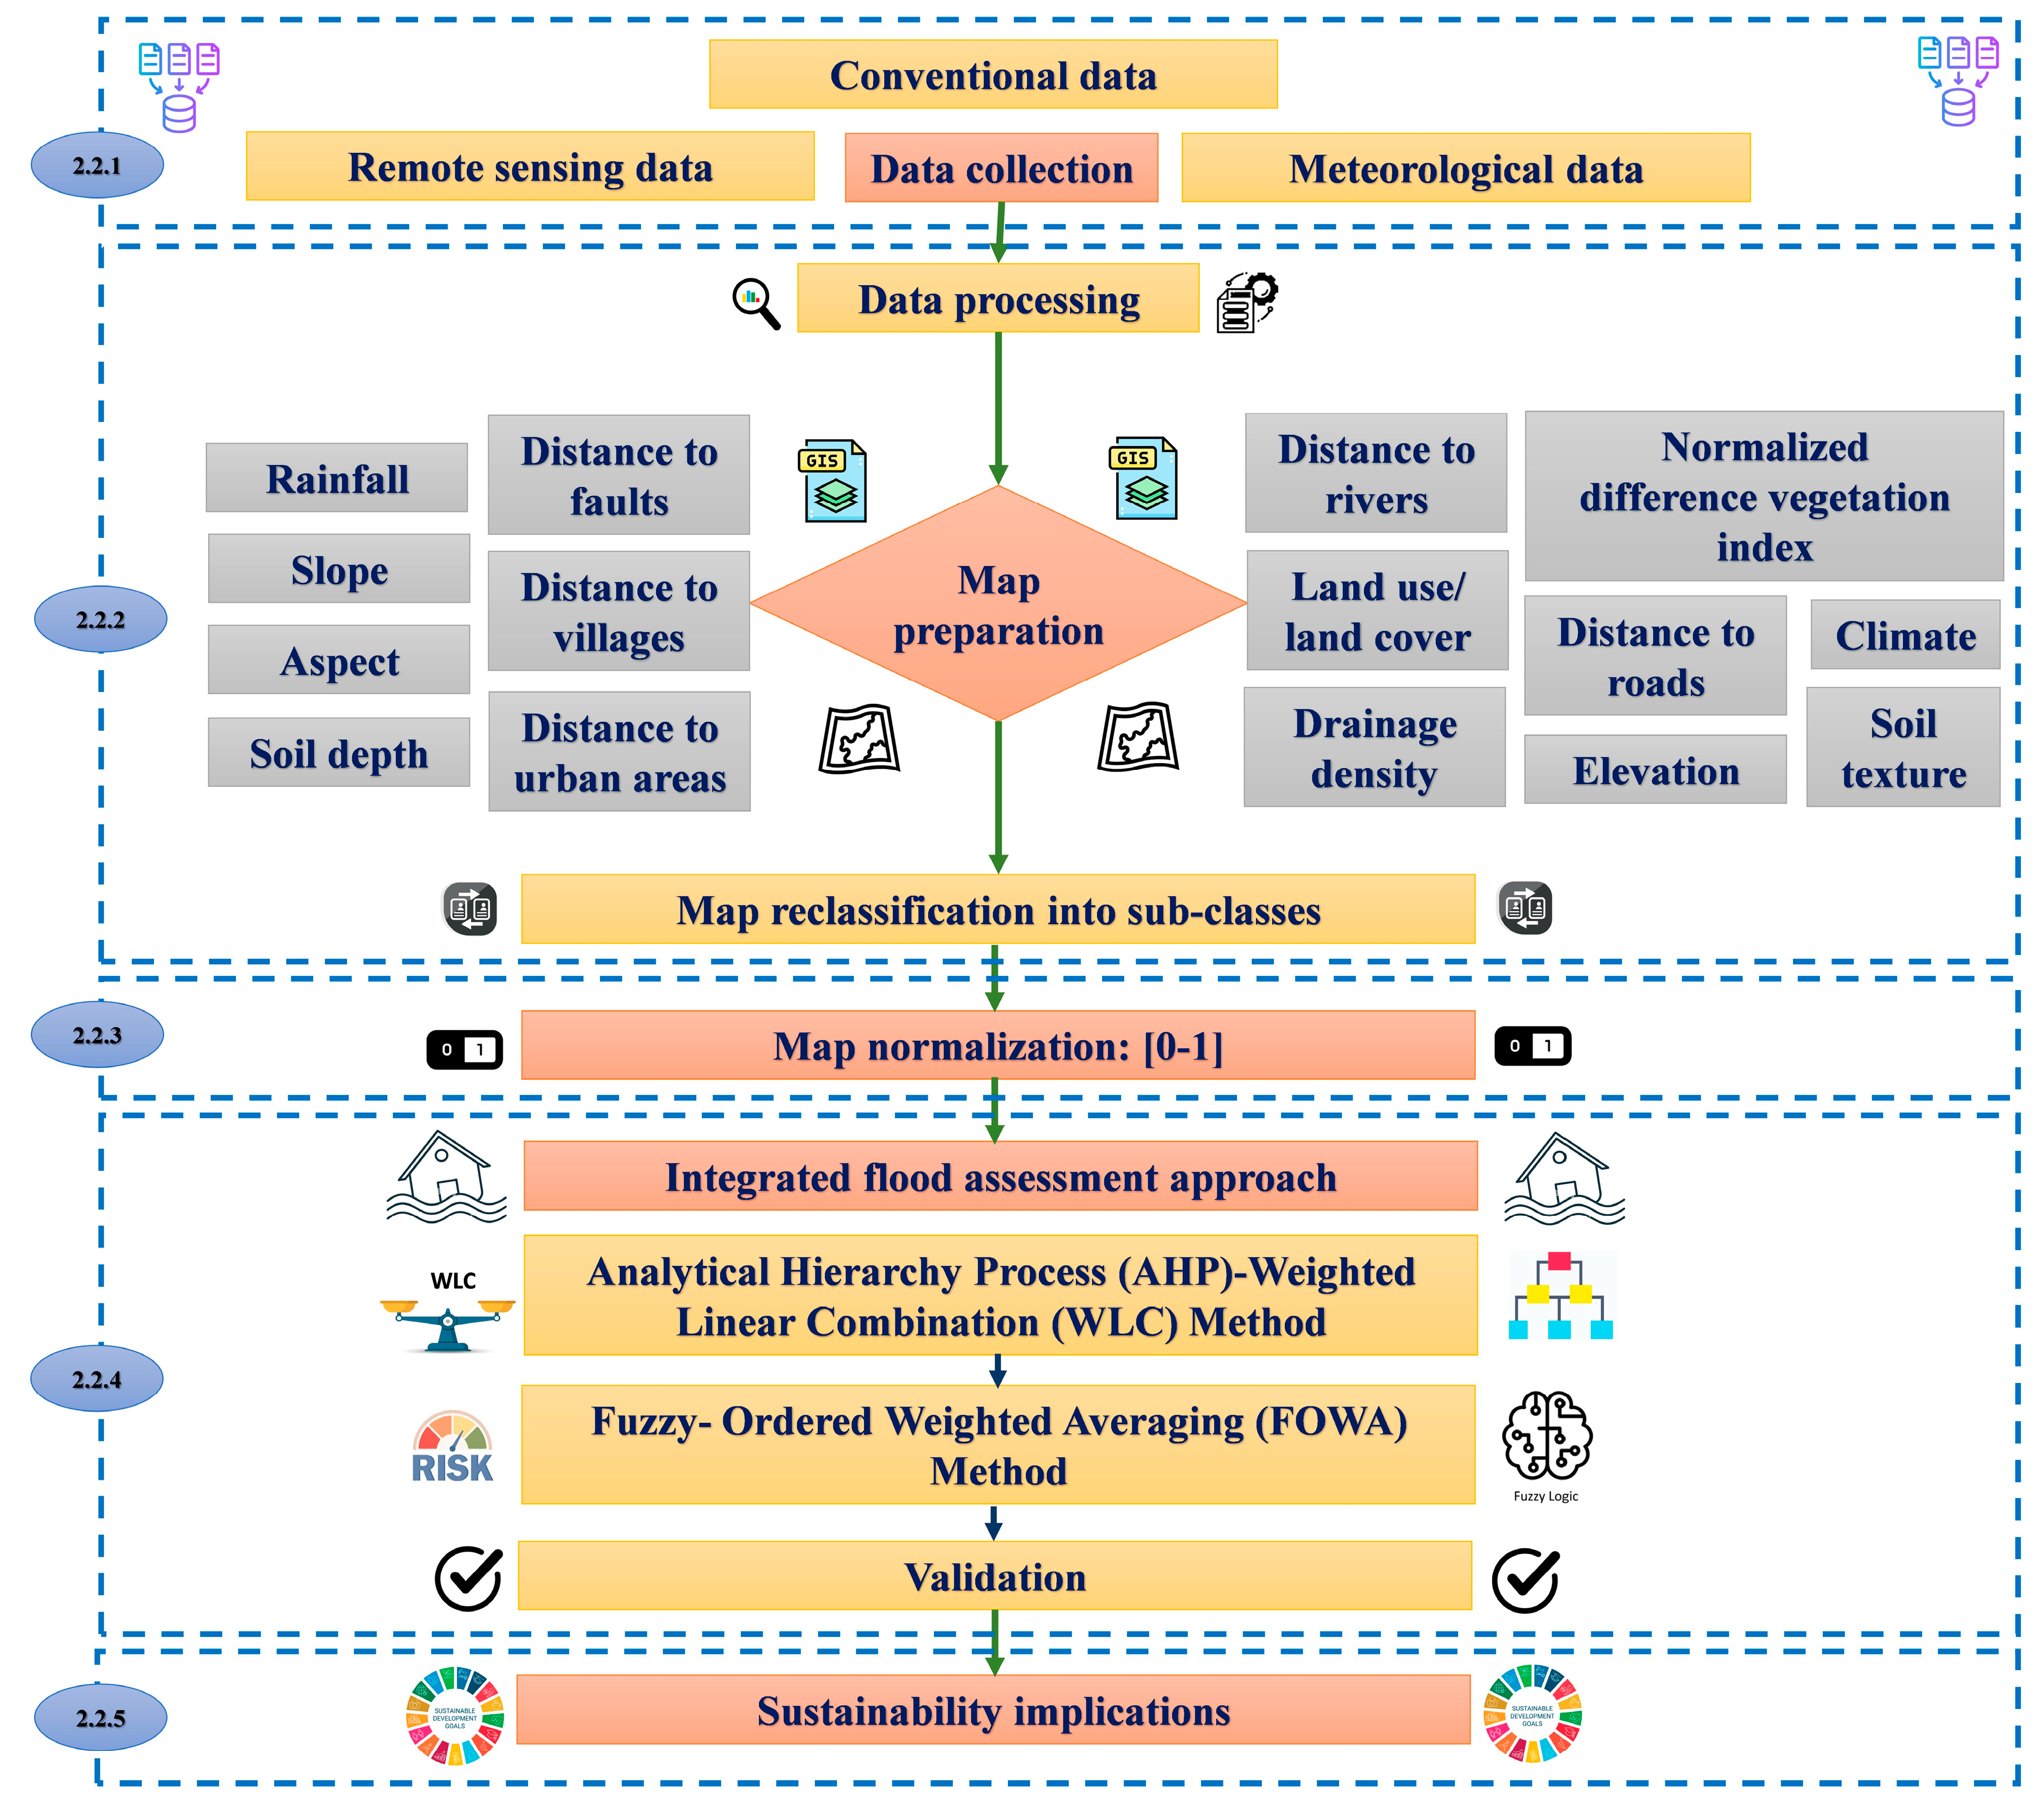
2.2. Research Methodology

The research methodology for this study focused on developing an IFAA approach formed of the AHP-WLC and FOWA methods for sustainable flash flood management. First, the AHP-WLC method was implemented to delineate flood susceptibility zones by incorporating fifteen flash flood controlling factors in South Khorasan Province, Iran. The controlling factors were selected to represent the geological, hydrological, climatic, and topographic characteristics of South Khorasan Province based on data availability, expert judgment, and insights from prior studies [26]. These factors were distance to rivers (DTR), RF, slope (SL), land use/land cover (LU/LC), normalized difference vegetation index (NDVI), ELE, drainage density (DD), soil depth (SD), soil texture (ST), CL, distance to roads (DTD), distance to villages (DTV), distance to urban areas (DTU), aspect (As), and distance to faults (DTF). They were normalized and weighted using the AHP method, followed by the application of the WLC technique to generate a comprehensive flood susceptibility map. Then, the FOWA method was applied to address spatial heterogeneity and decision-maker preferences by evaluating flood risks across seven scenarios, ranging from highly optimistic to highly pessimistic. Next, validation using benchmarks was conducted for the IFAA to evaluate its reliability. Finally, sustainability implications were examined by addressing potential challenges in the study area and possible countermeasures through a proposed SFMS. These methodological steps are demonstrated in the following sub-sections (Figure 2).

2.2.1. Data Collection

A variety of data sources were utilized to achieve the objectives of this research. These data were systematically classified into three main categories: conventional, remote sensing, and meteorological data. The conventional data included soil properties and fault locations, which were crucial for generating maps such as ST, SD, and DTF. Remote sensing data comprised satellite imagery and a digital elevation model (DEM) to extract parameters like LU/LC, SL, DD, and NDVI. Meteorological data, including RF values and climatic characteristics, supported the creation of maps RF and CL. Detailed descriptions of the data types, their sources, and specific applications are provided in Table 1.
The data collection process faced challenges, particularly with outdated or low-resolution soil and LU/LC data. To ensure accuracy, multiple sources, including geological surveys and remote sensing (e.g., Sentinel-2 imagery, DEM), were used for validation [34,35]. Incomplete road network data were resolved using the open street map [36]. RF and CL inconsistencies across stations were addressed through spatial-temporal interpolation [37,38]. These efforts harmonized datasets and improved spatial precision [12]. Despite limitations, the integration of conventional, remote sensing, and meteorological data can significantly enhance the accuracy of flood hazard mapping and the overall reliability of the input parameters used in the analysis [39].
Table 1. Summary of the data utilized in this study.
Data TypesSourceApplication
Conventional dataSoil properties:
(type and depth)
[40]ST and SD maps
Location of faults[34,41]DTF map
Remote sensing dataDigital elevation model (DEM)[35]DTR, ELE, SL, DD,
and AS maps
Sentinel-2 satellite images[34]LU/LC, NDVI,
and DTU maps
Open street map[36]DTD and DTV maps
Meteorological dataRainfall values[37,38]RF map
Climatic characteristics[42]CL map
Note: DTR = Distance to rivers, RF = Rainfall, SL = Slope, LU/LC = Land use/land cover, NDVI = Normalized difference vegetation index, ELE = Elevation, DD = Drainage density, SD = Soil depth, ST = Soil texture, CL = Climate, DTD = Distance to road, DTV = Distance to villages, DTU = Distance to urban areas, AS = Aspect, and DTF = Distance to faults.

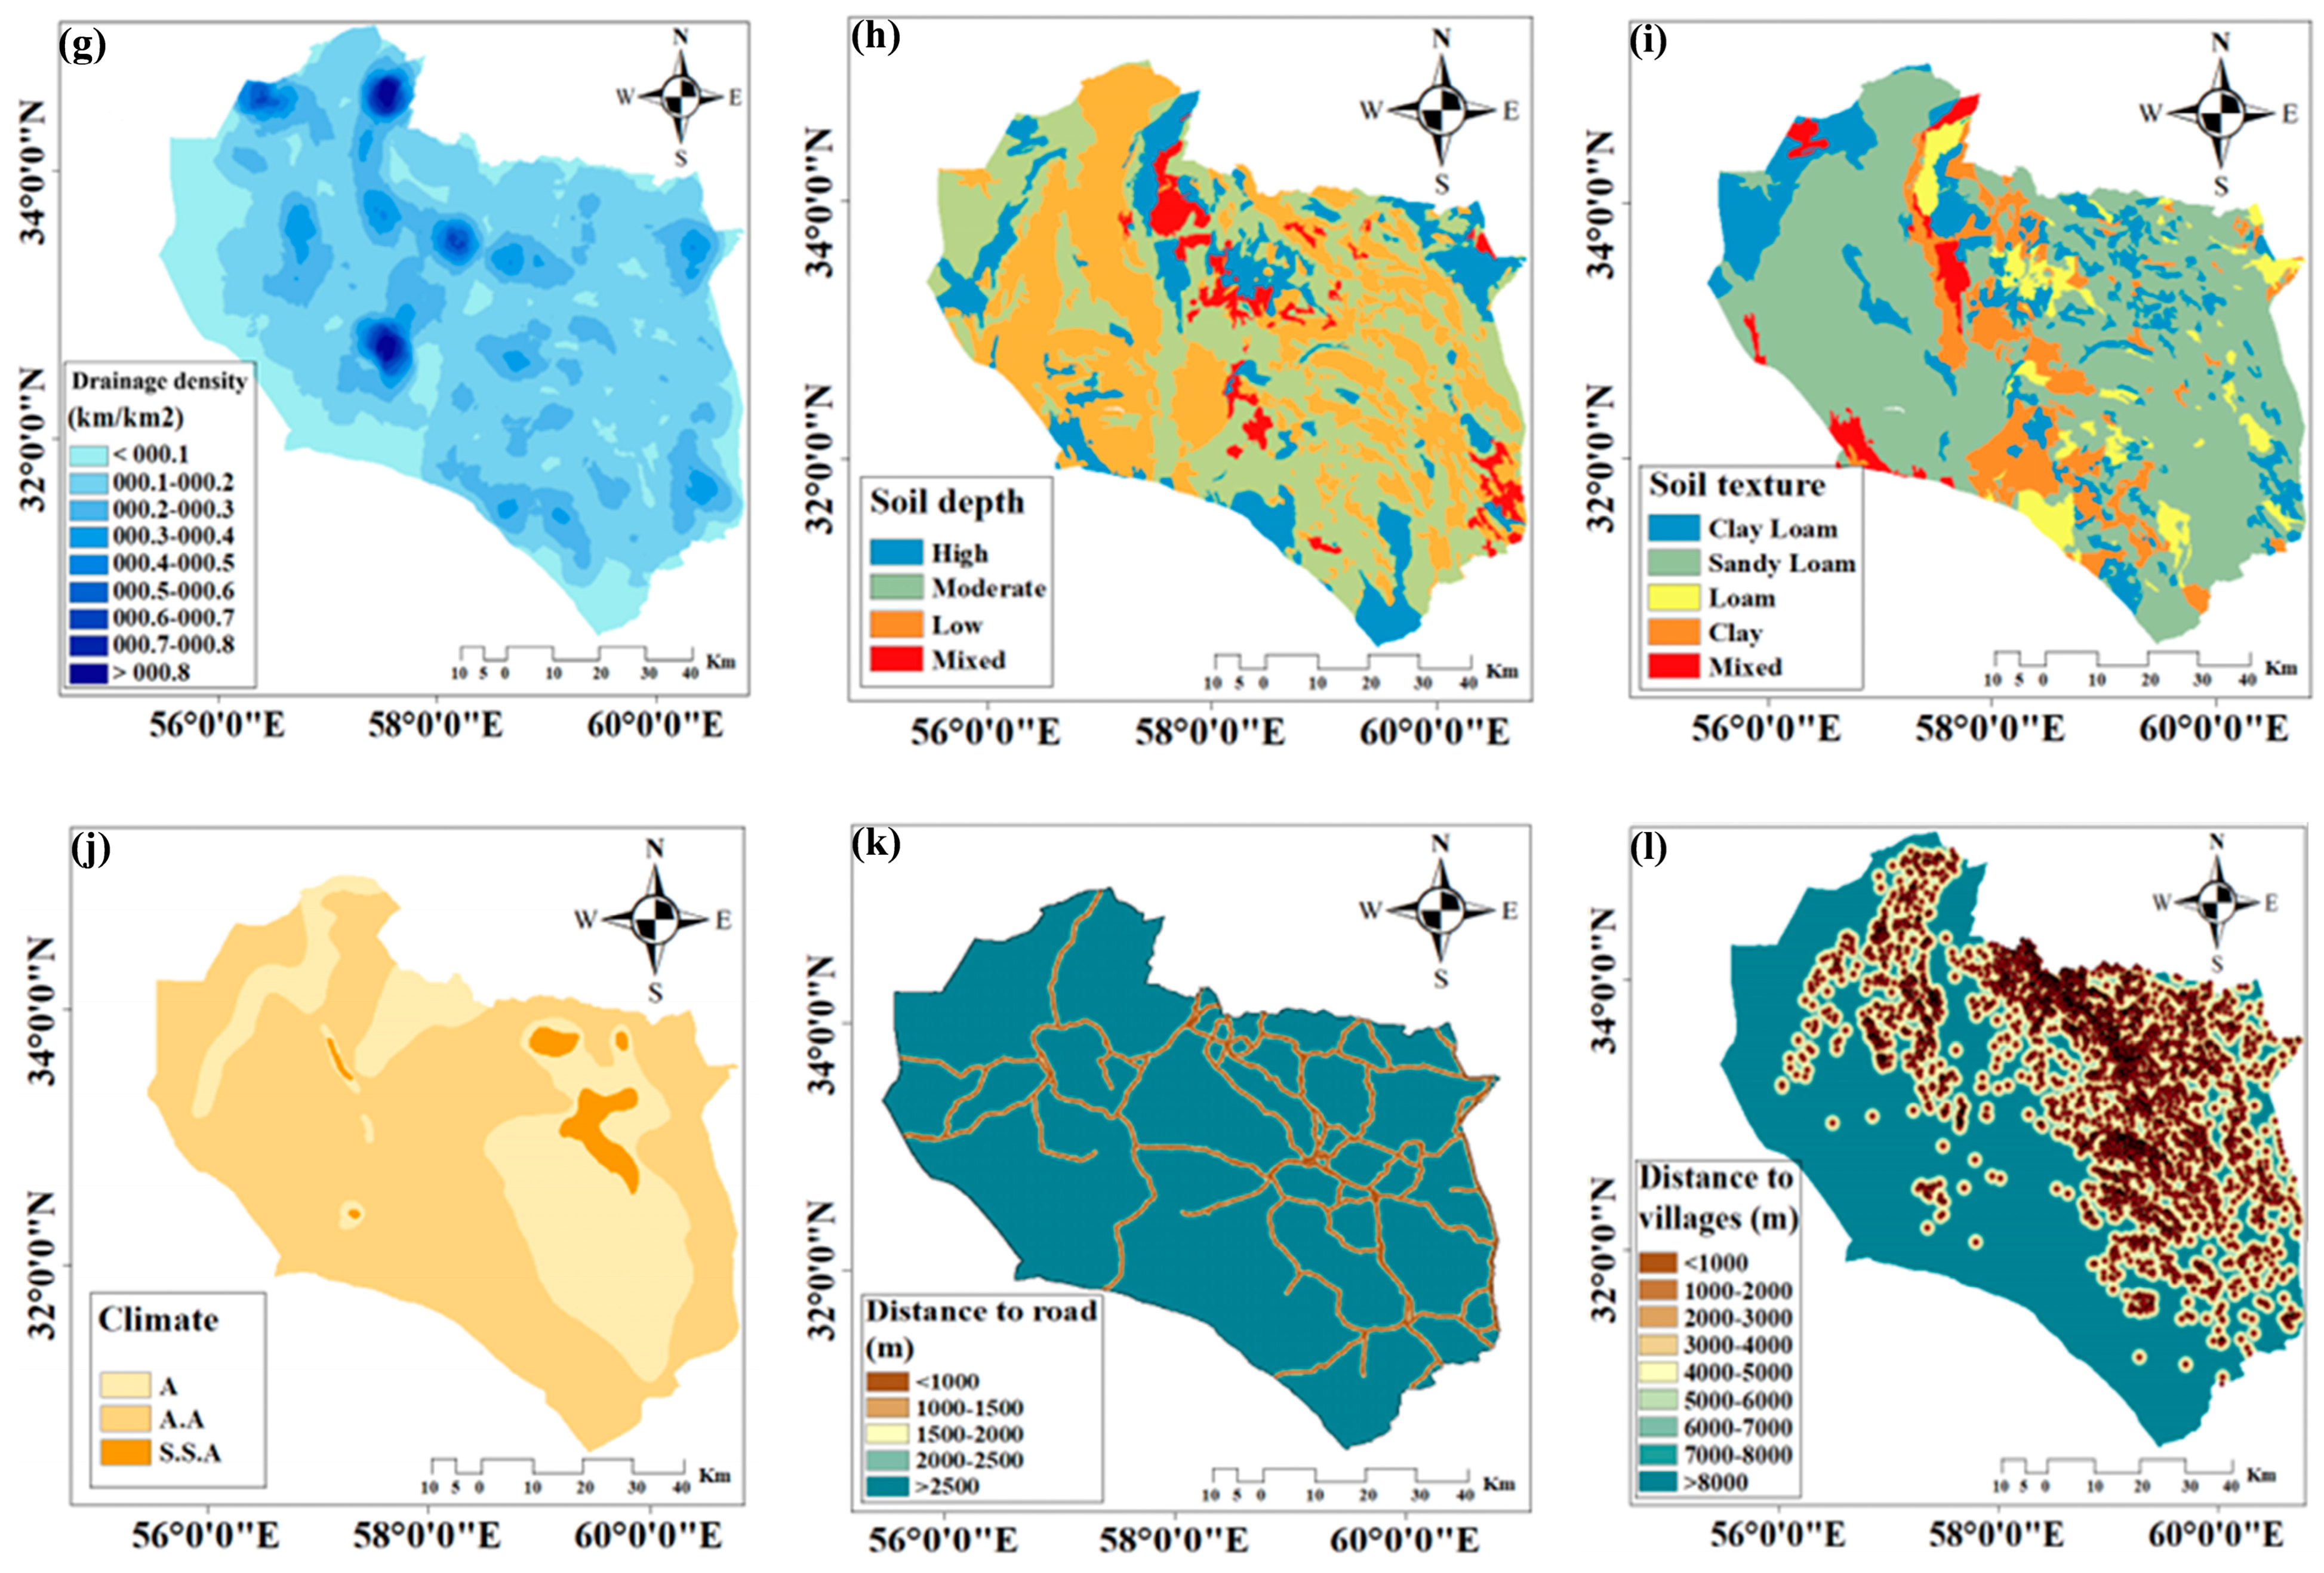
2.2.2. Map Preparation of the Flood Controlling Factors

The gathered data were utilized to develop maps of 15 factors describing the geological, hydrological, climatic, and topographic features of South Khorasan Province, which are critical in determining flood susceptibility. The collected data were first imported into a geographic information system (ArcMap V10.7 software, developed by Esri) and georeferenced to the Universal Transverse Mercator/World Geodetic System 1984 (UTM/WGS84) coordinate system using the UTM Zone 40N projection. To ensure consistency, all data were resampled to a uniform spatial resolution of 30 m by 30 m. The maps of flash flood controlling factors were designed using geospatial tools in GIS and reclassified into relevant sub-classes to reflect varying flood susceptibility levels, as illustrated in the following lines.
  • Distance to Rivers (DTR) Map
The DTR map was prepared by buffering river networks extracted from the DEM. Buffers were created at intervals of 100, 200, 300, 400, and >400 m to capture proximity-based flood risks. This approach aligns with the DTR method used by Dodangeh et al. [42].
  • Rainfall (RF) Map
RF data were interpolated using the inverse distance weighting (IDW) method in GIS to generate the RF map. The RF map was categorized into five classes: <100, 100–120, 120–140, 140–160, and >160 mm. A comparable RF classification approach was employed by Graf et al. [43].
  • Slope (SL) Map
The SL map was derived from the DEM using SL analysis tools in GIS. This process calculates the rate of ELE change over a defined spatial extent. The generated SL map was divided into nine sub-classes: <2, 2–5, 5–8, 8–12, 12–15, 15–20, 20–30, 30–65, and >65%. This classification can reflect different runoff potentials, with flatter SLs being more prone to flooding. A similar SL classification approach was reported by Sathiyamurthi et al. [25].
  • Land Use/Land Cover (LU/LC) Map
The LU/LC map was generated using Sentinel-2 satellite images and was classified into barren land, dry farming, agriculture, forest, dense pastures, semi-dense pastures, less-dense pastures, water bodies, woodland, residential, and clay pit. This classification reflects the varying impacts of human activity and natural vegetation on flood dynamics. A similar LU/LC classification approach was highlighted by Timalsina et al. [28].
  • Normalized Difference Vegetation Index (NDVI) Map
NDVI was calculated from Sentinel-2 satellite images based on GIS raster calculations to assess vegetation density using Equation (1) [44]. The map was categorized into five classes: <0.1, 0.1–0.2, 0.2–0.3, 0.3–0.4, 0.4–0.5, and >0.5, reflecting varying vegetation densities and their role in flood mitigation. Shafizadeh-Moghadam et al. [45] used a similar NDVI classification in flood studies.
N D V I = N I R R E D N I R + R E D ,
where: NIR = Near-infrared band, and RED = Red band.
  • Elevation (ELE) Map
ELE data were obtained from DEM and categorized using GIS reclassification techniques to delineate flood-prone zones. The ELE map was divided into six sub-classes: <1000, 1000–1400, 1400–1800, 1800–2200, 2200–2600, and >2600 m. These divisions can reflect the varying degrees of runoff accumulation and water drainage. A comparable ELE classification was reported by Choubin et al. [5].
  • Drainage Density (DD) Map
DD was computed using the DEM and GIS density analysis tools, which calculate the total length of streams per unit area. The resulting DD map was divided into five classes: <0.1, 0.1–0.2, 0.2–0.3, 0.3–0.4, 0.4–0.5, 0.5–0.6, 0.6–0.7, 0.7–0.8, and >0.8 km/km2. Similar DD classifications were applied by Lin et al. [46].
  • Soil Depth (SD) Map
The SD map was developed using reclassified soil data obtained from geological surveys. It was categorized into four sub-classes area at South Khoras: high, moderate, low, and mixed. A similar SD classification was reported by Songchao et al. [47].
  • Soil Texture (ST) Map
ST data were digitized and mapped based on geological survey reports. The resulting ST map was classified into sandy loam, loam, clay loam, silt loam, and mixed, each influencing water permeability differently. Comparable ST classifications were used by Sepehri et al. [48].
  • Climate (CL) Map
CL zones were delineated using CL data and GIS reclassification methods. The study area was categorized into arid (A), semi-arid (S.S.A), and hyper-arid (A.A) zones, reflecting differences in precipitation and temperature patterns. Chamani et al. [49] used a similar CL approach to categorize climatic zones in hydrological studies.
  • Distance to Roads (DTD) Map
The DTD map was generated by buffering road networks at distances of <1000, 1000–1500, 1500–2000, 2000–2500, and >2500 m. This classification can reflect the impact of roads on altering natural drainage patterns. A similar methodology was applied by Mehrabi et al. [50].
  • Distance to Villages (DTV) Map
The DTV map was analyzed using village location data, and buffer zones were created at distances of <1000, 1000–2000, 2000–3000, 3000–4000, 4000–5000, 5000–6000, 6000–7000, 7000–8000, and >8000 m. This classification can reflect the increased vulnerability of settlements closer to flood-prone areas. Jamshed et al. [51] utilized comparable methods to assess settlement vulnerability to floods.
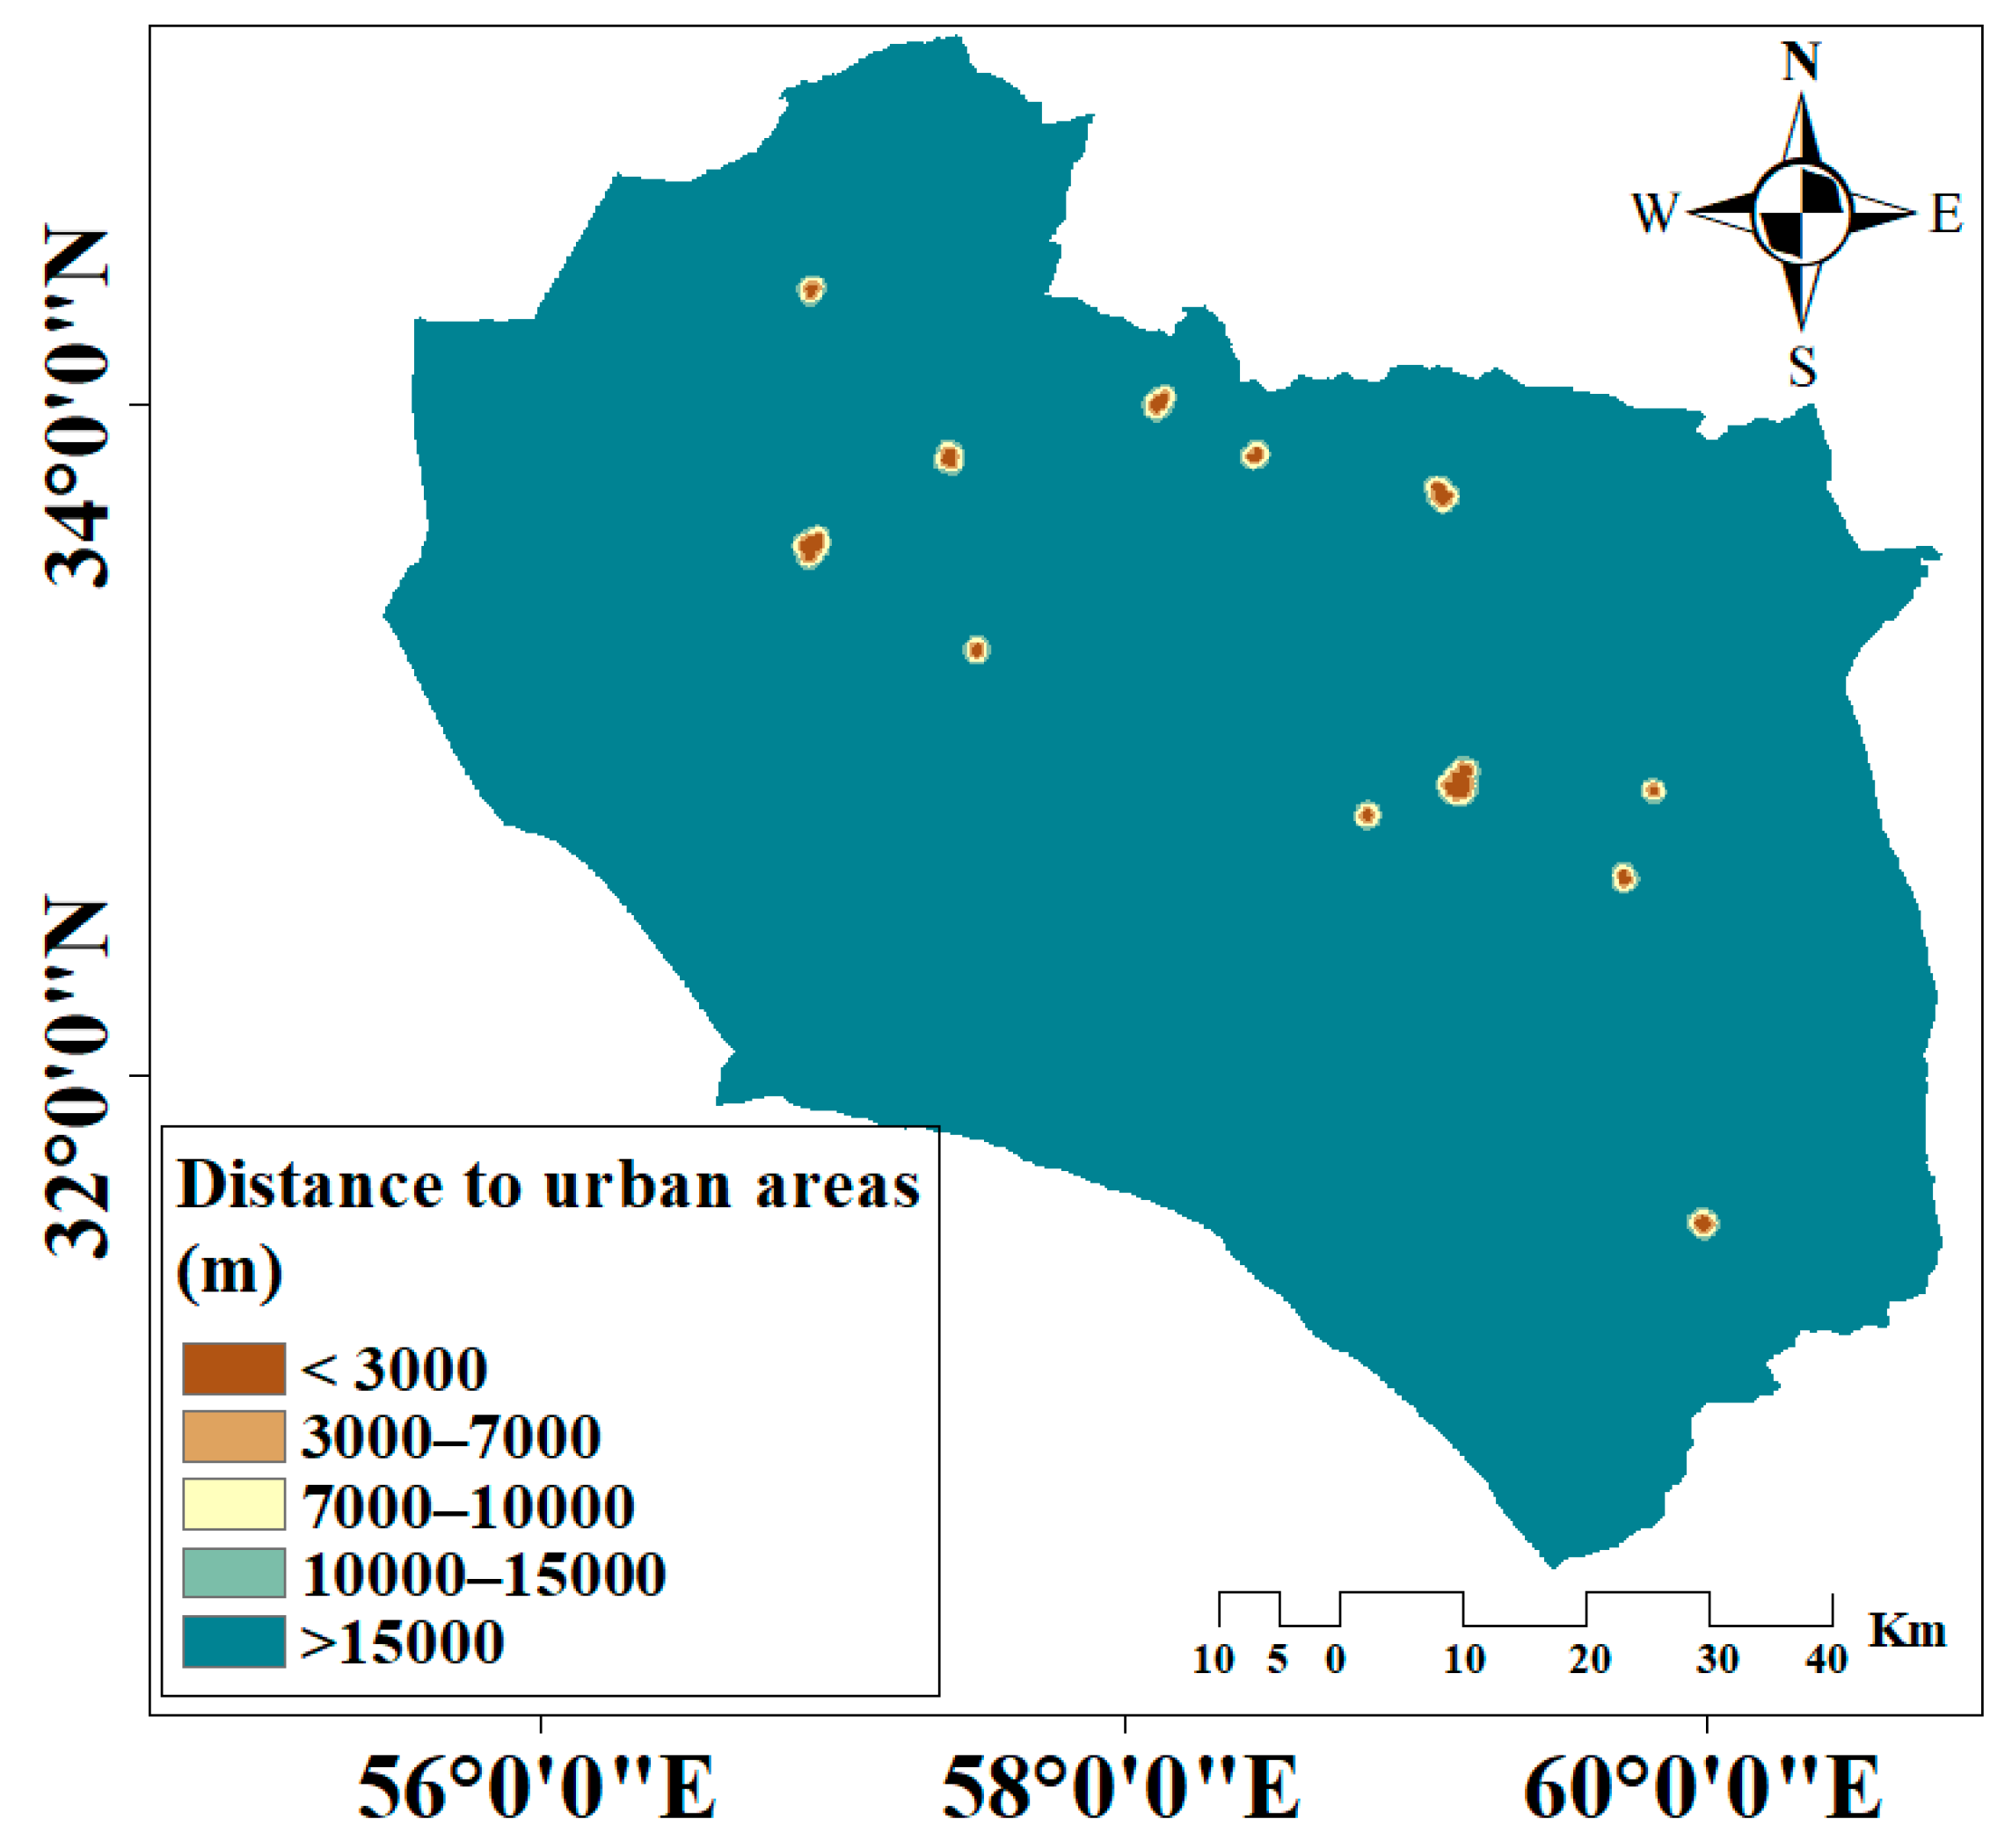
  • Distance to Urban Areas (DTU) Map
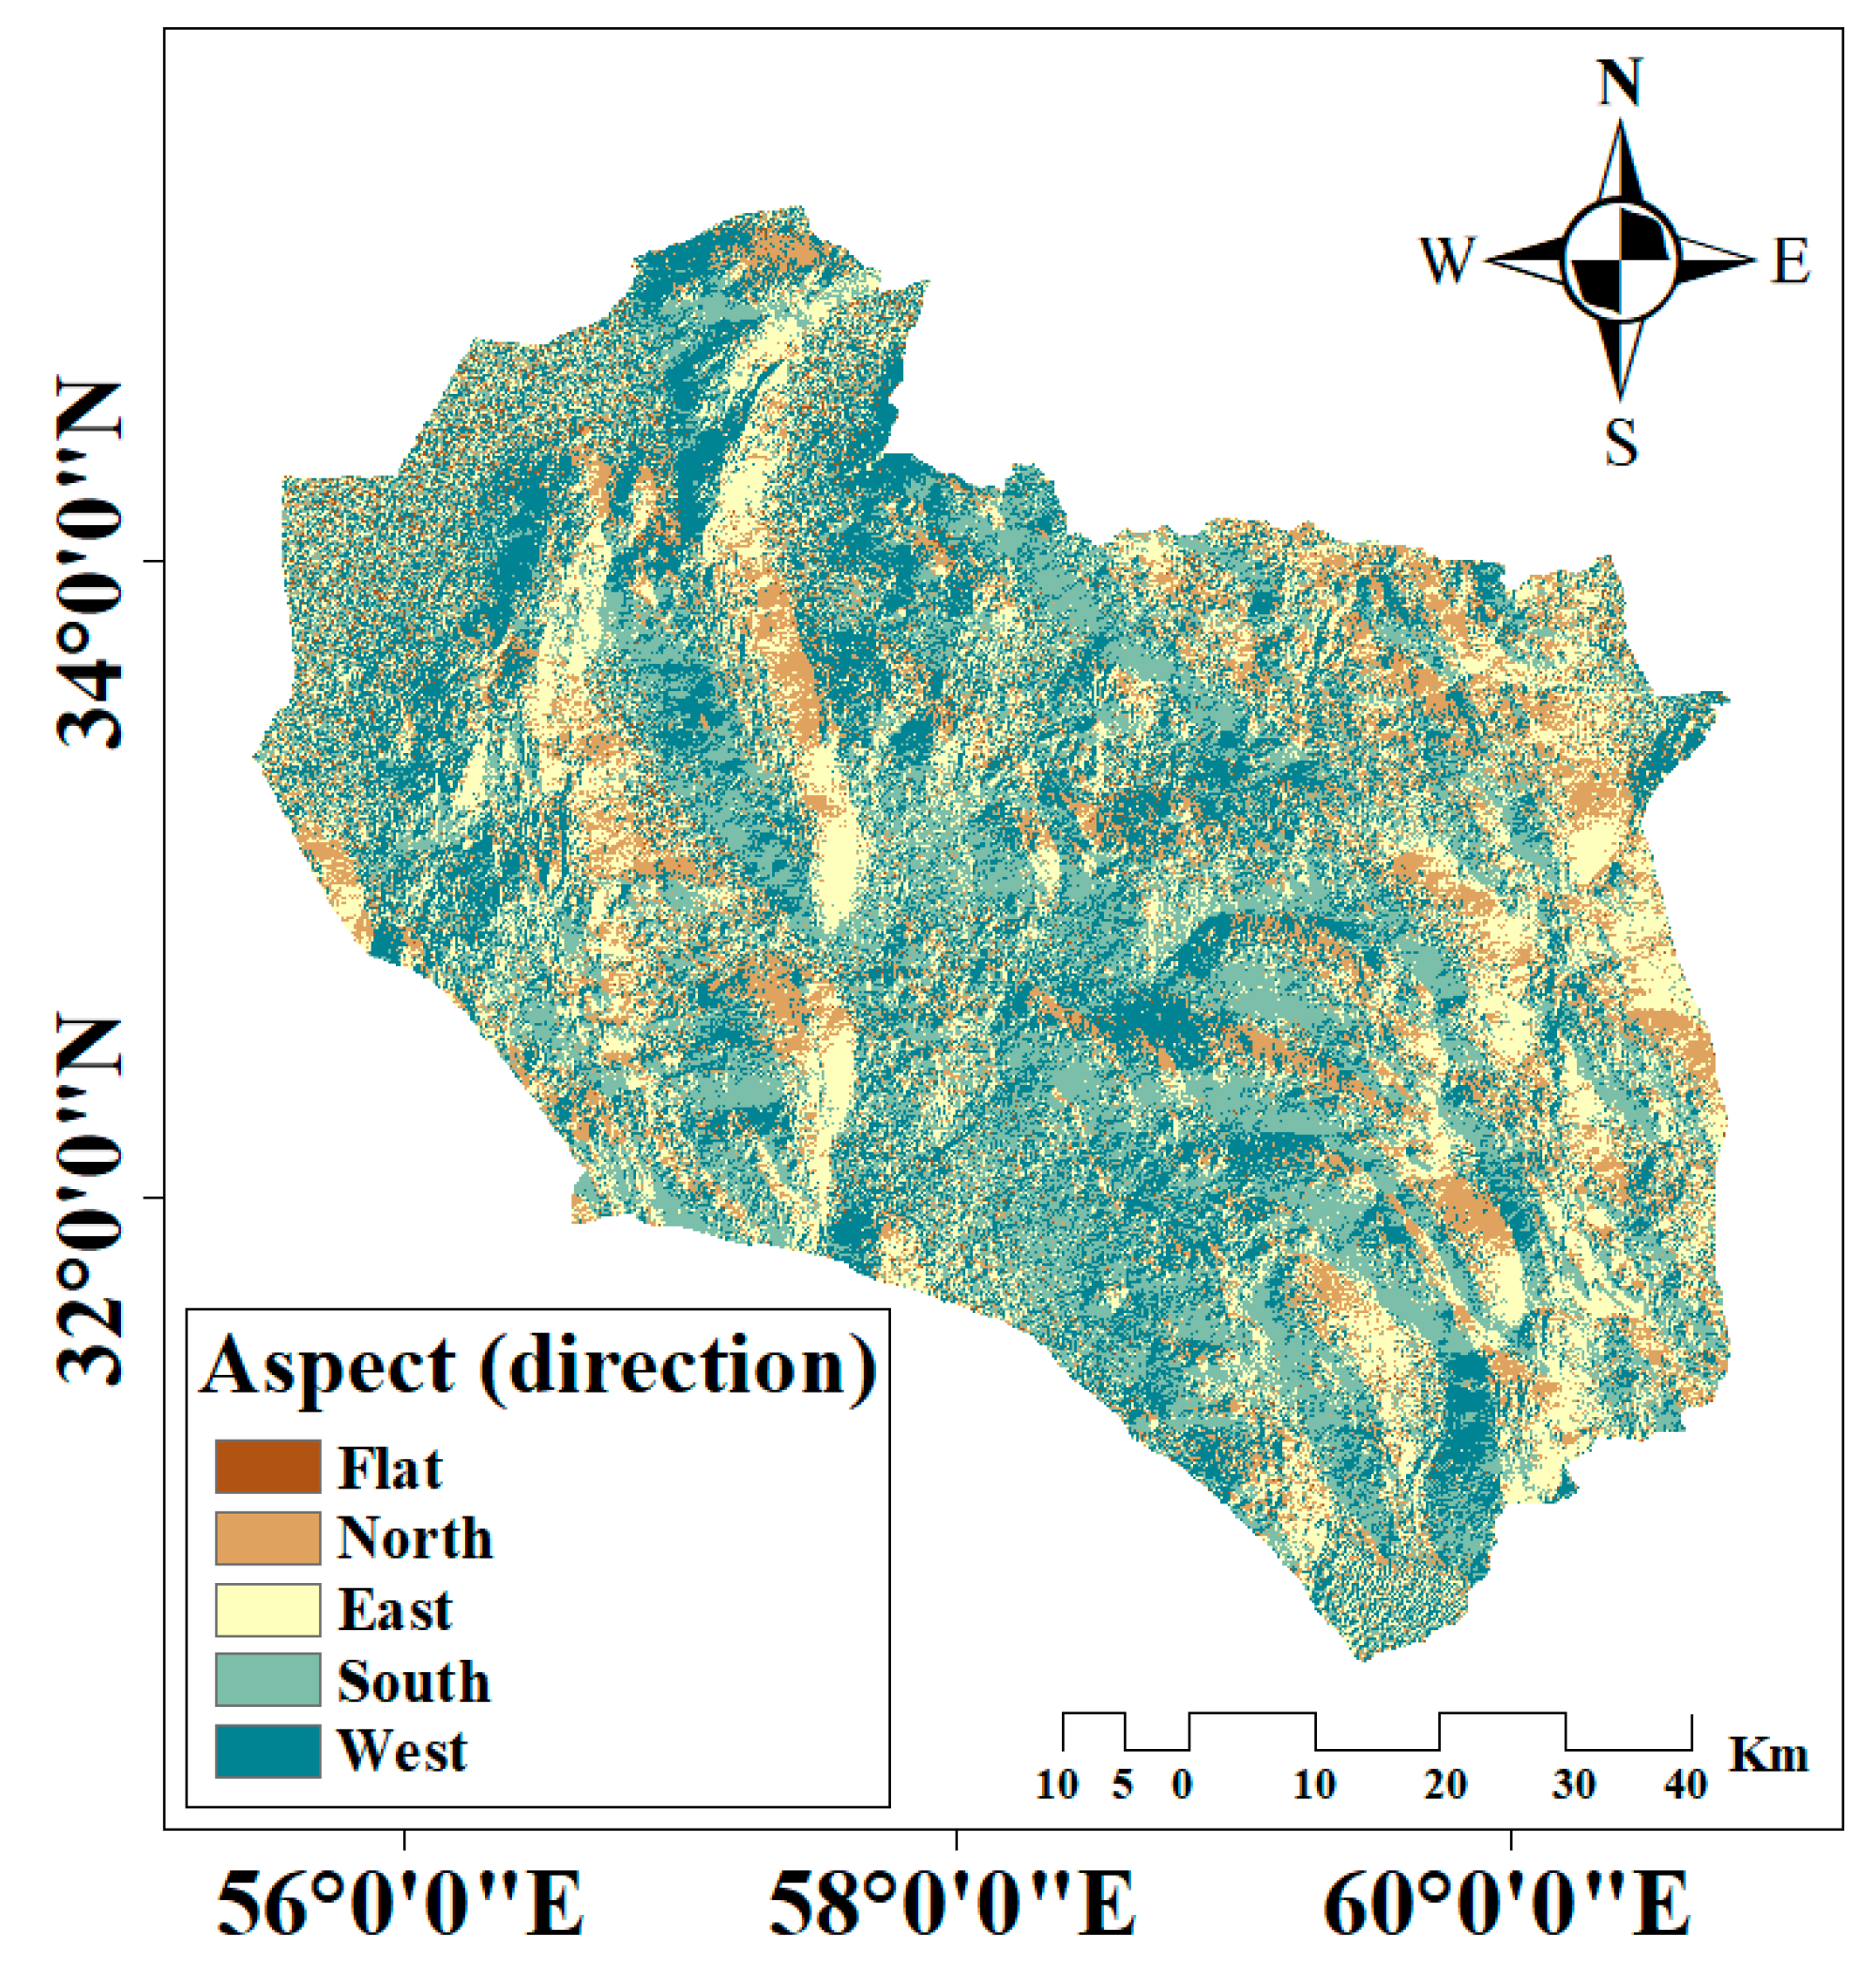
The DTU map was drawn based on urban settlement data and buffering techniques. Buffers were set at distances of <3000, 3000–7000, 7000–10,000, 10,000–15,000, and >15,000 m. Dodangeh et al. [52] used a similar classification approach to assess urban impacts on flood risks.
  • Aspect (AS) Map
The AS map was generated from the DEM using GIS aspect tools to determine SL direction, which influences runoff patterns. The AS map was divided into nine sub-classes: flat, north, east, south, and west. This division was implemented to capture the role of AS in flood dynamics. A similar sub-classing was conducted by Mehrabi et al. [50].
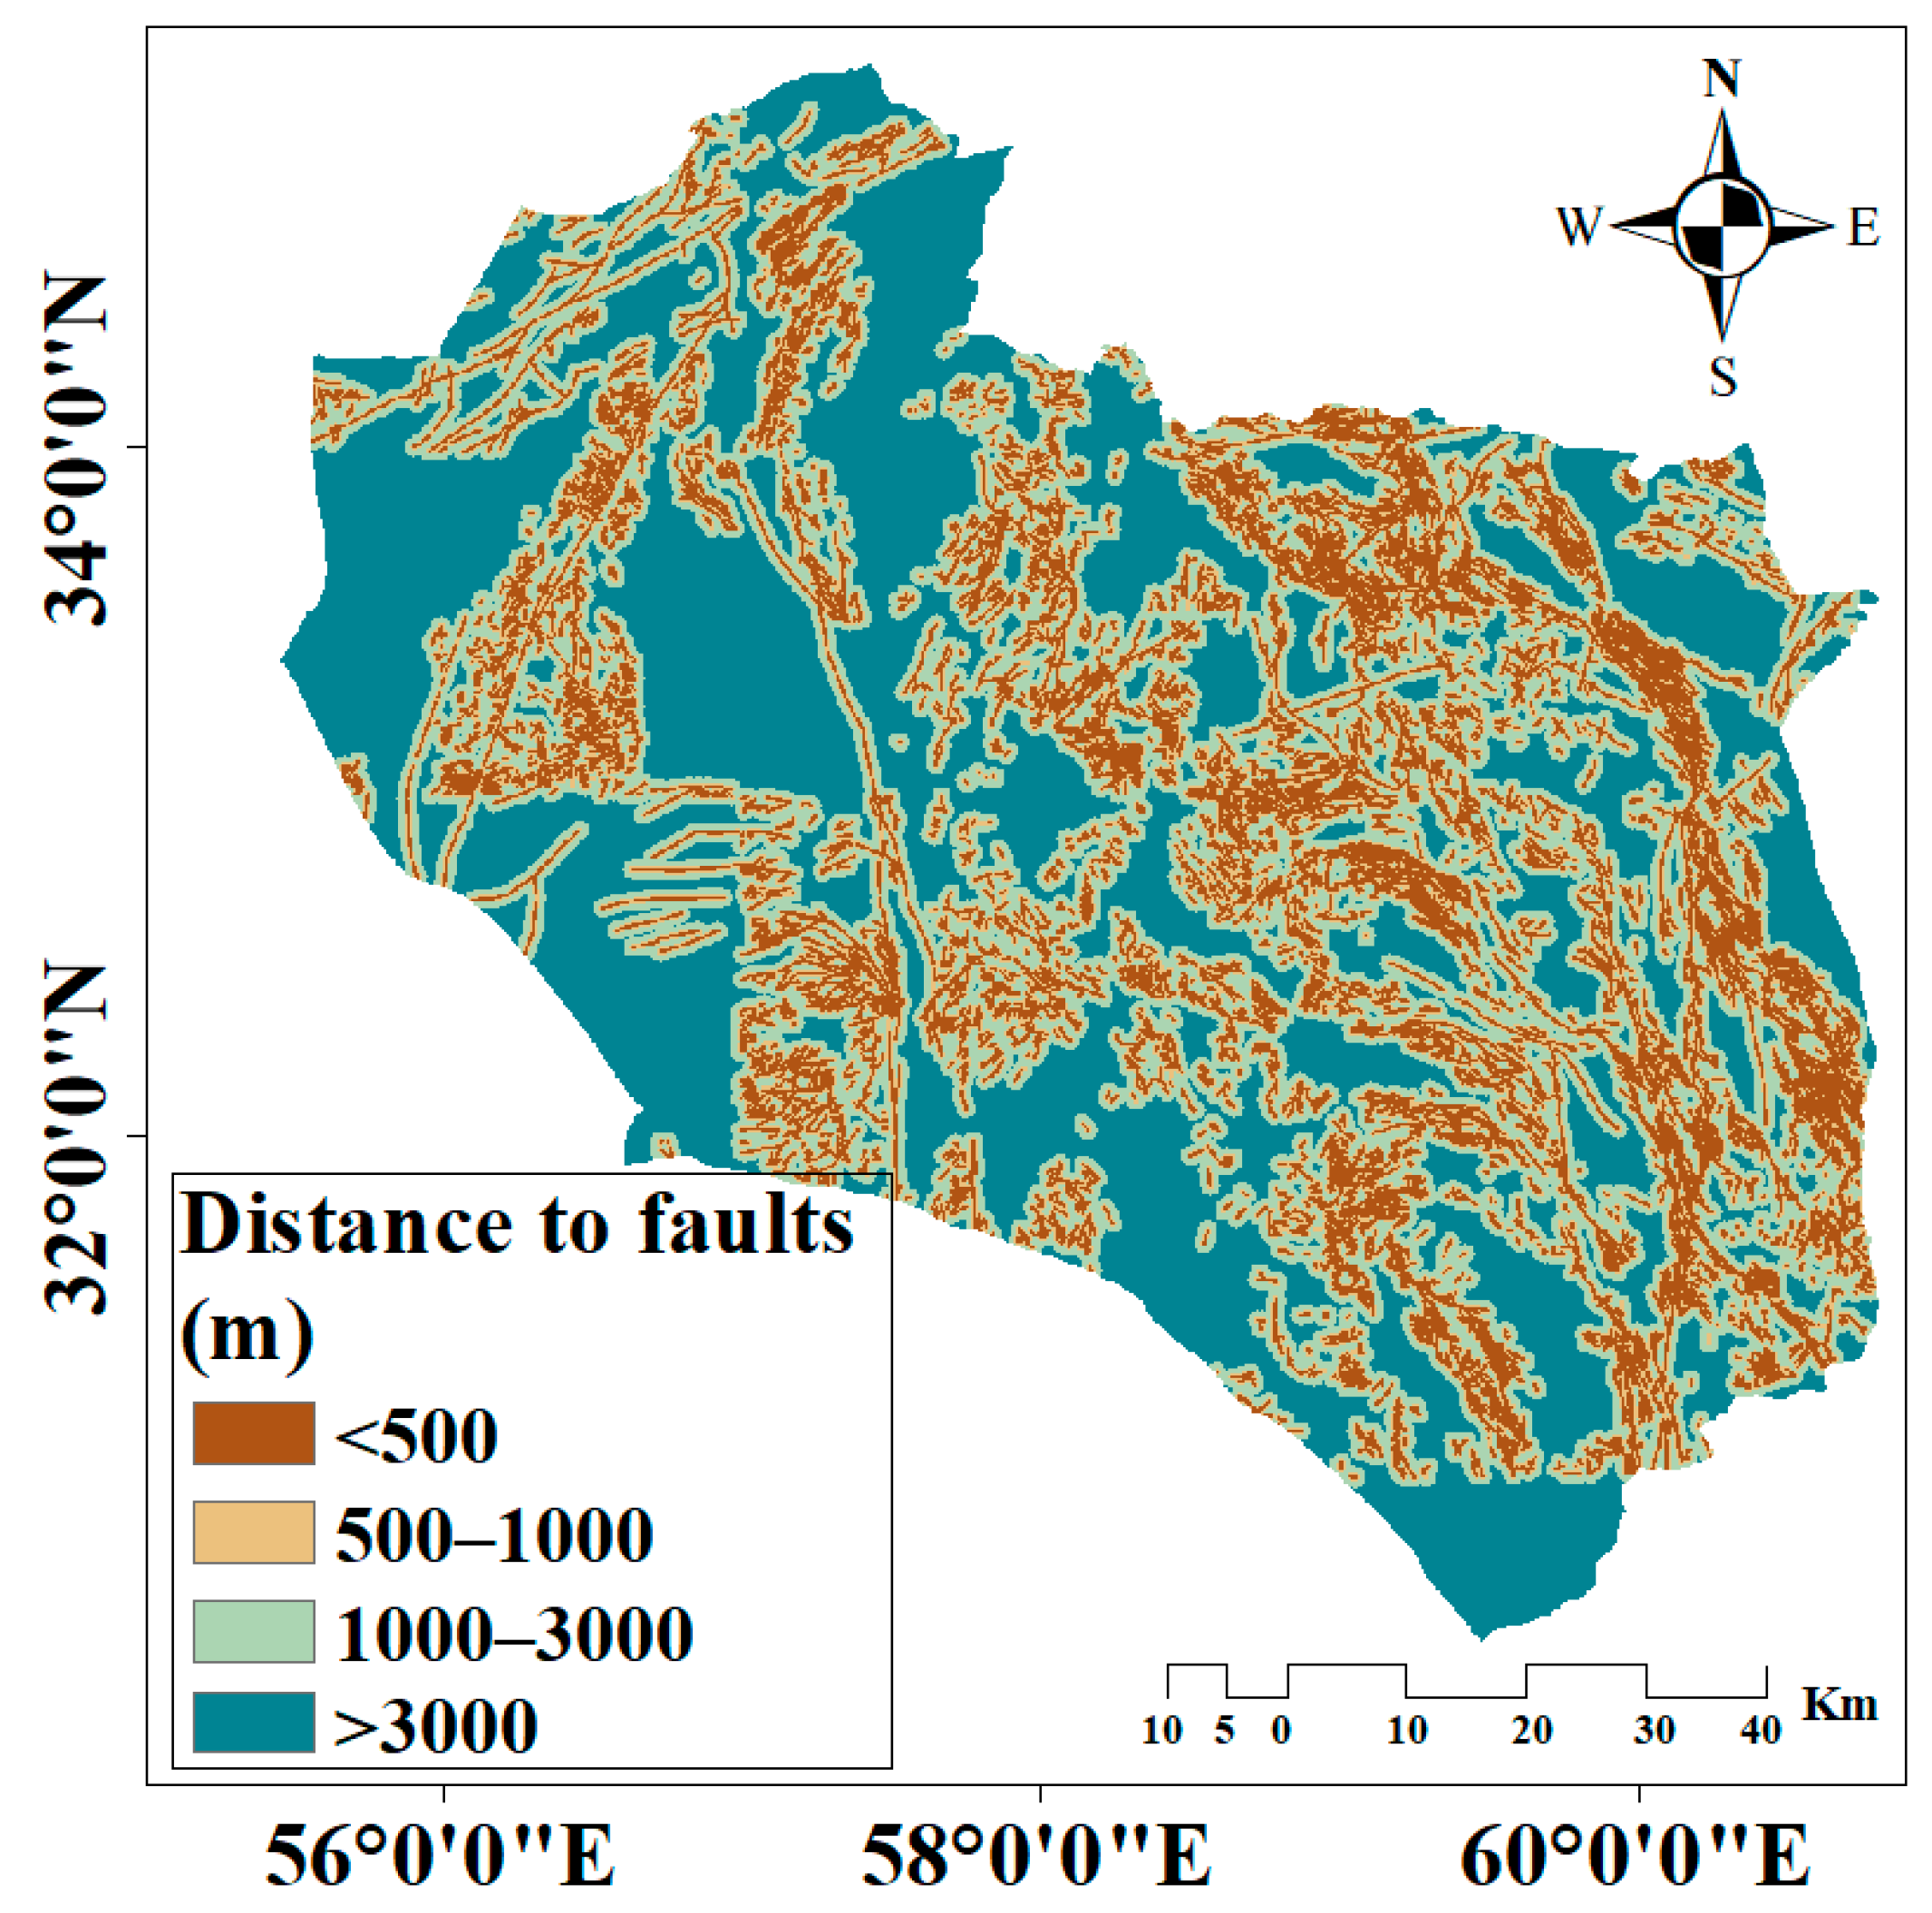
  • Distance to Faults (DTF) Map
The DTF map was prepared by creating buffer zones around geological fault lines. Buffers were generated at intervals of <500, 500–1000, 1000–3000, and >3000 m to capture variations in sub-surface hydrology. Aly et al. [53] reported a similar DTF methodology in geological hazard assessments.

2.2.3. Normalization of the Maps

To ensure comparability across the 15 developed maps for this study, all maps were normalized to obtain dimensionless indicators. This was necessary due to differences in measurement units among the thematic layers. A normalization rank ranging from 0 to 1 was assigned to each map, reflecting the relative contribution of each factor to flood susceptibility. The normalization process was guided by an understanding of the study area’s characteristics and insights from previous studies. Higher normalization ranks correspond to higher flood susceptibility potential, emphasizing the influence of critical factors [54].
For example, in the RF thematic layer, areas with lower RF values were assigned a normalization rank of “0” because reduced precipitation contributes less to flood susceptibility compared to areas with higher RF. Similarly, factors like DD and SL were normalized based on their relative impact, with higher ranks given to sub-classes that indicate greater susceptibility [50]. This systematic normalization ensures that the integrated flood susceptibility model accurately represents the varying contributions of each factor, facilitating a more precise flood risk assessment for South Khorasan Province.

2.2.4. Integrated Flood Assessment Approach (IFAA)

Flood risk assessment requires a comprehensive methodology that can account for the complex interplay of geological, hydrological, climatic, and topographic factors. To address this necessity, an IFAA approach was developed, combining two robust MCDM techniques: the AHP-WLC and the FOWA methods. The steps for applying the AHP-WLC and FOWA are presented in the following lines.
  • Analytical Hierarchy Process (AHP)-Weighted Linear Combination (WLC) Method
The AHP-WLC method was applied to delineate flood susceptibility maps for the study area by assigning weights to the 15 controlling factors in a GIS environment. AHP, introduced by Saaty [55], is a structured decision-making method that assists in analyzing complex problems with multiple criteria by breaking them into a hierarchical structure. This process begins by constructing a hierarchical framework, where the goal is placed at the top, followed by criteria and sub-criteria influencing flood susceptibility. Pairwise comparisons are then conducted to assess the relative importance of these criteria using a scale of integers ranging from 1 to 9 based on literature review, expert opinions, and study area characteristics [25]. The pairwise comparison matrix for this study is shown in Table 2. From this matrix, weights were calculated using Equation (2) [56].
w i = a i j i = 1 n a i j ,
where wi = Weight of the i-th criterion, and aij = Relative importance of criterion i compared with j.
To ensure the reliability of the comparisons, the consistency ratio (CR) was calculated using Equation (3).
C R = C I R I ,
where CI = Consistency index, calculated as C I = λ m a x n n 1 , λmax = Largest eigenvalue of the matrix, n = Number of factors, and RI = Random index, a value that depends on n and can be adopted from Table 3.
A CR value less than 0.1 indicates acceptable consistency, ensuring the validity of the derived weights [21].
The WLC method integrates the weighted factors into a composite flood hazard index (FHI) map. Accordingly, FHI for each pixel was computed using Equation (4) [57].
F H I = i = 1 n w i   ×   M a p i
  • Fuzzy-Ordered Weighted Averaging (FOWA) Method
The FOWA method was employed to account for spatial heterogeneity and decision-maker preferences when assessing flood risk. This advanced approach integrates fuzzy logic and ordered weighted averaging operators to address varying degrees of risk aversion and trade-offs among the controlling factors. The inclusion of FOWA can enhance the analysis by enabling the representation of different decision-making scenarios, from highly optimistic to highly pessimistic perspectives [58]. Moreover, the FOWA method relies on linguistic quantifiers to define scenarios that reflect varying risk preferences and degrees of trade-offs. These quantifiers are expressed using fuzzy logic to better manage uncertainties inherent in flood risk assessment. The OWA operator, introduced by Yager [59], balances two extremes: the “AND” operator, where all criteria must be met, and the “OR” operator, where satisfying any one criterion suffices. By ranking weights in descending order, the OWA method allows the decision-maker to control the degree of optimism or pessimism (α) in the aggregation process. Seven distinct scenarios were constructed based on linguistic quantifiers, representing varying levels of α [24].
  • Scenario 1: At Least One (α = 0.0001): The most optimistic scenario, akin to the “OR” operator, assumes high risk with minimal recoverability. It emphasizes the importance of any single criterion;
  • Scenario 2: Few (α = 0.1): A slightly less optimistic approach that still introduces high risk with moderate trade-offs;
  • Scenario 3: Some (α = 0.5): A balanced scenario that combines higher risks with a greater degree of recoverability, offering a compromise between optimism and trade-offs;
  • Scenario 4: Half (α = 1): Represents moderate risk with complete trade-offs, ensuring an equal balance between risk and recoverability;
  • Scenario 5: Many (α = 2): A scenario with low risk but some trade-offs, moving toward a more conservative assessment;
  • Scenario 6: Most (α = 10): Minimizes risk while allowing for minimal trade-offs;
  • Scenario 7: All (α = 1000): The most pessimistic scenario, similar to the “AND” operator, assumes minimal risk and no trade-offs, prioritizing less important criteria equally.
The quantifier weights corresponding to these scenarios are shown in Table 4. These weights can significantly influence risk perception and the spatial distribution of risk zones. Higher α values reflect greater risk aversion, while lower α values emphasize risk-taking preferences. To implement the FOWA method, the values obtained from each flood-related criterion were applied to their respective maps. The criteria were then integrated using GIS software (10.7), incorporating the calculated OWA weights. By assigning weights based on the quantifier scenarios, a series of flood risk maps were developed, capturing a range of risk perceptions from optimistic to pessimistic [60].
Finally, the flood susceptibility maps, resulting from both AHP-WLC and FOWA methods, divided the study area into five categories of susceptibility: “Very Low”, “Low”, “Moderate”, “High”, and “Very High”. These categories provide valuable insights into flood-prone zones and facilitate the identification of areas requiring mitigation measures.

2.2.5. Validation

The validation process is a critical step in ensuring the accuracy and reliability of the IFAA framework, which integrates the AHP-WLC and the FOWA for flood susceptibility prediction. This study employed advanced tools and techniques, including TerrSet software (v20.01) and a comprehensive flood inventory dataset consisting of both flooded and non-flooded points, to assess the model’s performance in identifying flood-prone areas [61]. First, the AHP-WLC model was evaluated using the receiver operating characteristic (ROC) metric. The ROC metric utilizes the true positive rate (TPR) and the false positive rate (FPR) to measure the model’s accuracy. The area under the curve (AUC) of the ROC was calculated as follows [62]:
A U C = 0 1 T P R F P R d F P R
Then, the performance of different scenarios associated with the FOWA component of the IFAA framework was evaluated using the overall accuracy (OA) metric, which was calculated using the following equation [44]:
O A = C P T N ,
where CP = correctly predicted instances referring to the areas where the predicted flood susceptibility matches the reference data (e.g., historical flooded points from inventory data), and TN = total number of instances (e.g., observations or pixels) evaluated in the analysis.
For both AUC and OA, values closer to unity (i.e., 1) are generally interpreted as indicating higher accuracy and stronger model performance [46]. These metrics are later used to evaluate the predictive validity of the IFAA model.

2.2.6. Sustainability Implications

This study incorporated a sustainability-focused methodology by linking flood risk assessments to key SDGs while addressing challenges associated with flood management. Based on the study outcomes, potential challenges to achieving SDGs would be identified. The methodology also includes developing strategies to overcome these challenges by leveraging GIS-based spatial analysis, multi-criteria decision-making frameworks (AHP-WLC and FOWA), and stakeholder inputs. This approach ensures that the flood assessment findings not only highlight vulnerabilities but also provide actionable strategies for fostering sustainable development and resilience.

3. Results

3.1. Weight Estimation of the Flood Controlling Factors

Each factor was assigned a weight to reflect its relative significance in determining flood hazard susceptibility. Table 5 summarizes the weighting values derived from the AHP method for the 15 factors in the study area, benchmarked against findings from comparable research. The CR for the pairwise comparison matrix was calculated to be 0.0019, which indicates a highly acceptable level of consistency based on the Saaty [55] threshold (CR < 0.1). While the most influential factors, e.g., DTR, RF, SL, and LU/LC, are illustrated in Figure 3a–l, factors with lower importance, including DTF, AS, and DTU, are shown separately in Appendix A Figure A1, Figure A2 and Figure A3 to maintain clarity and focus on key contributors to flood susceptibility.

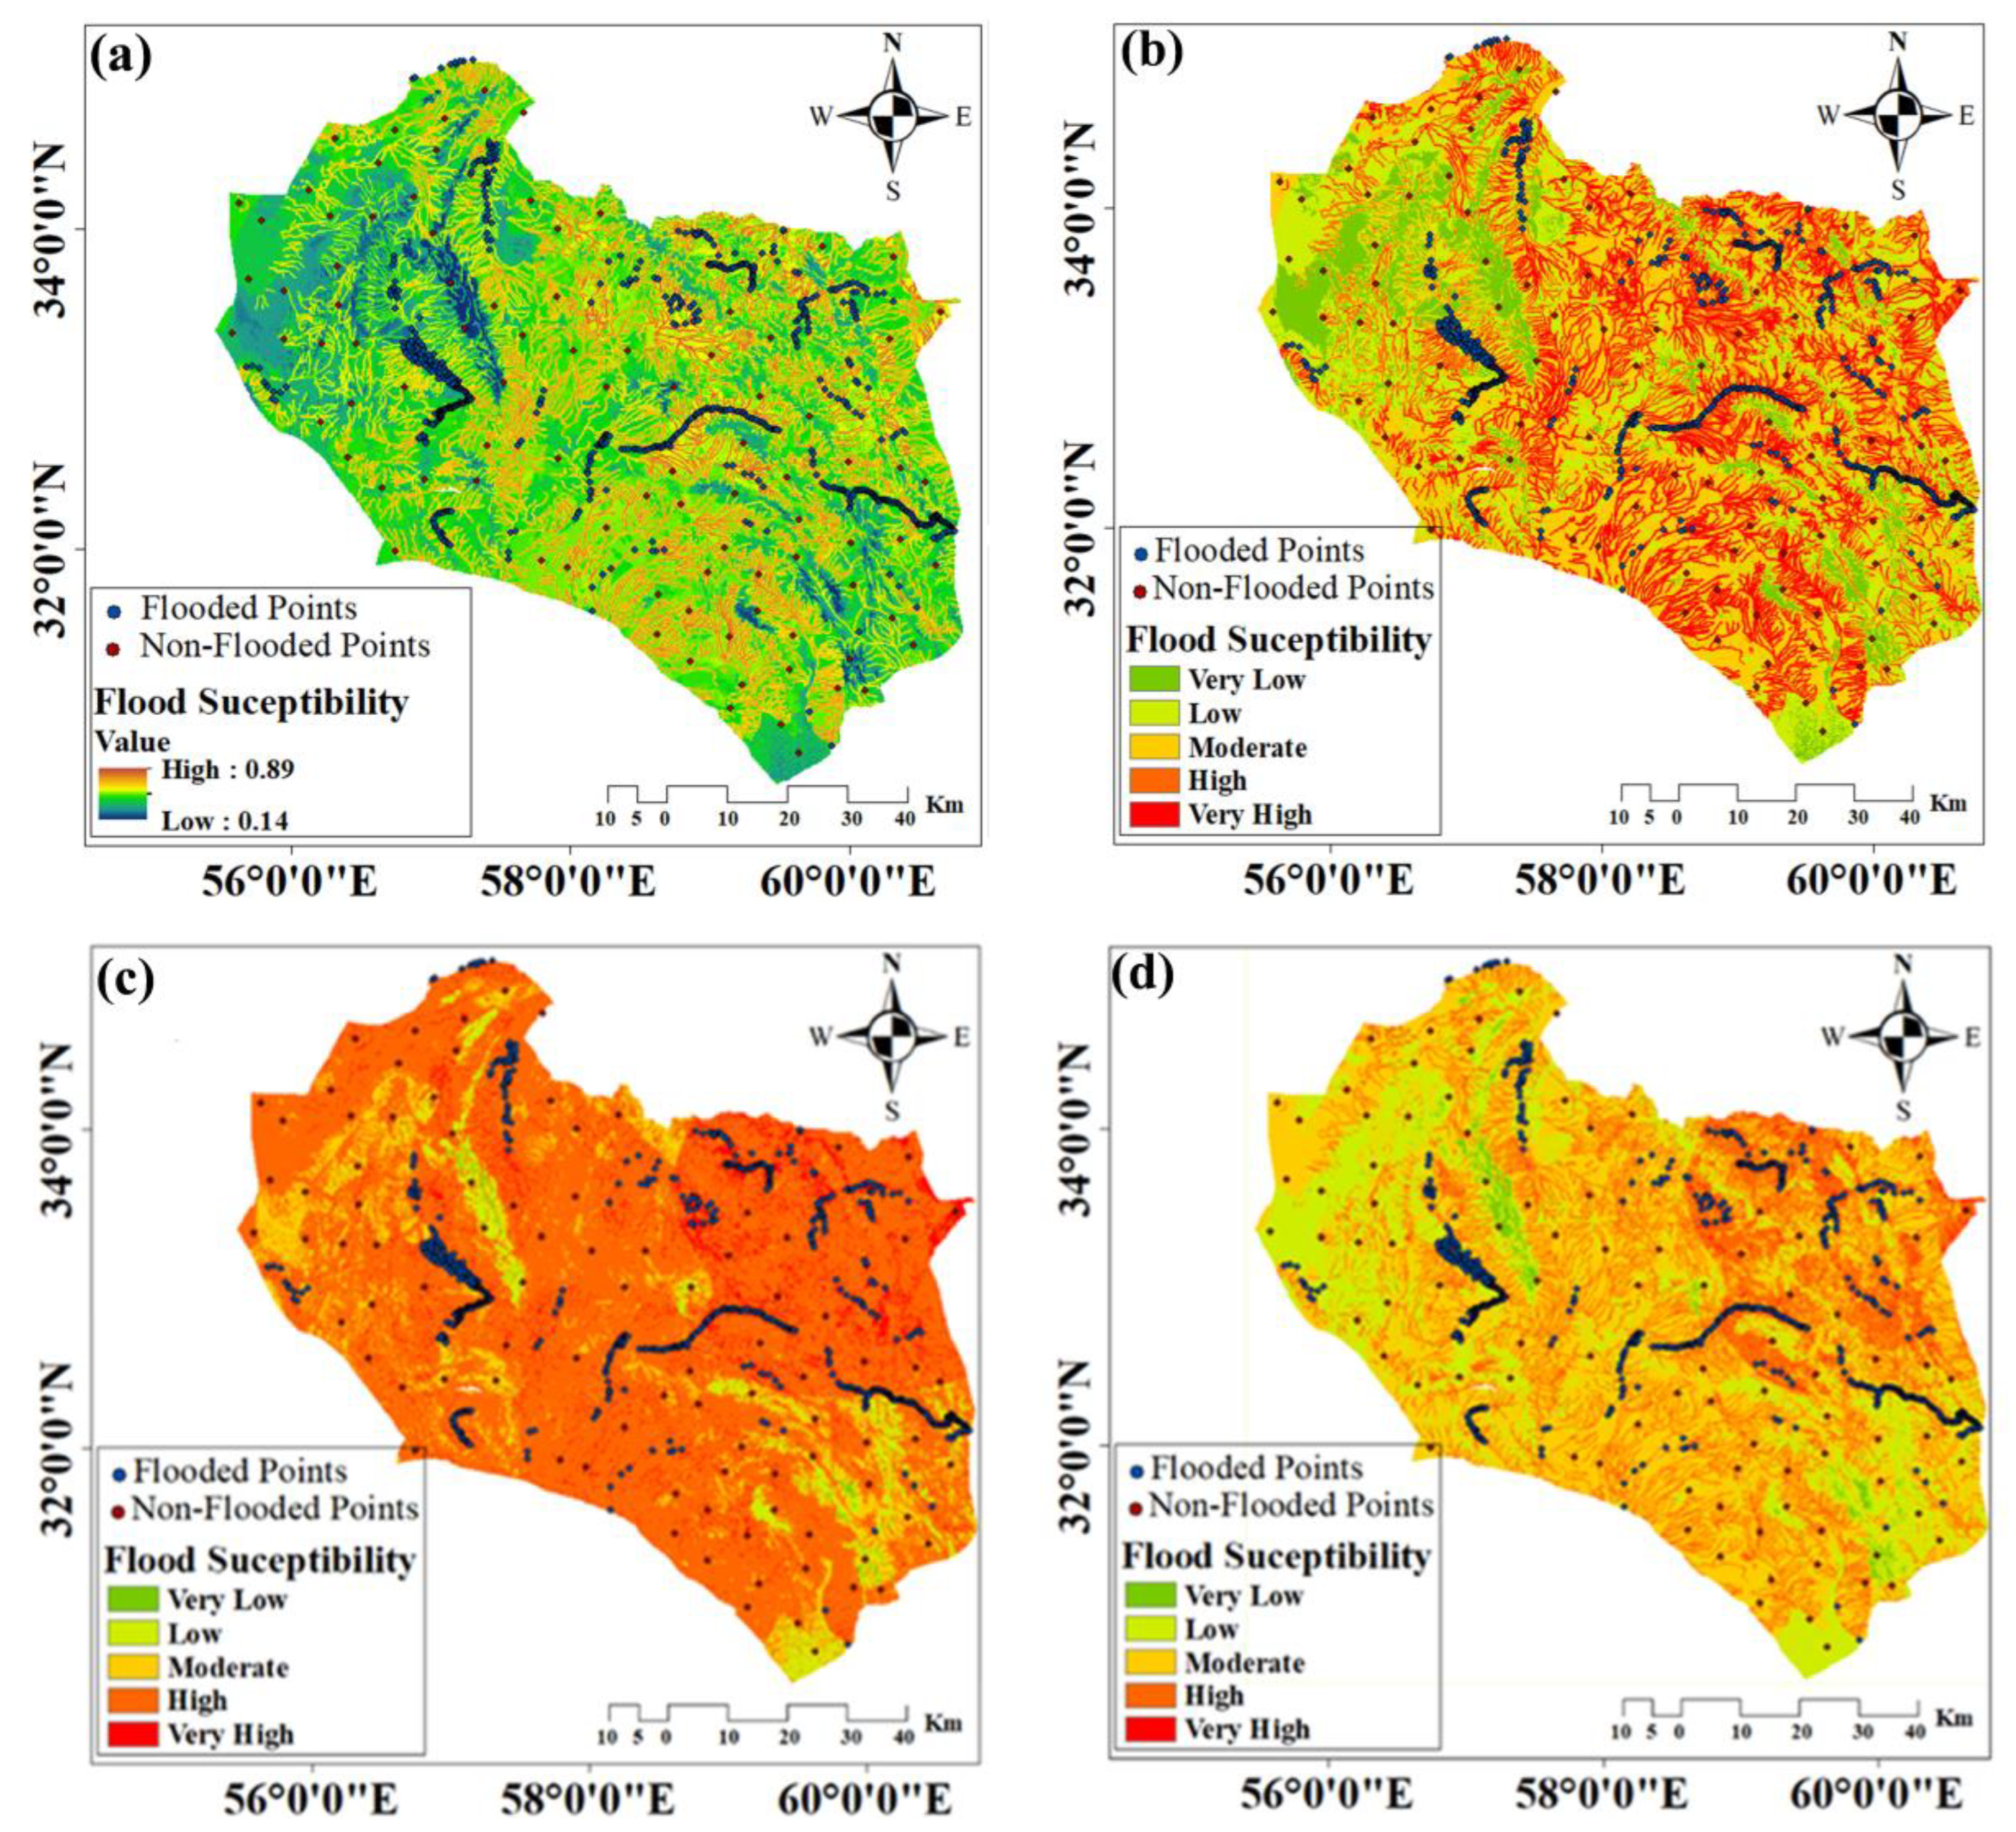
3.2. Flood Susceptibility Maps Using the AHP-WLC Method

According to the derived thematic layers (Figure 3a–i), the weights of the corresponding factors were integrated using the AHP-WLC method to produce a flood susceptibility map for South Khorasan Province (Figure 4a), with FHI values spanning from 0.14 (low) to 0.89 (high). This map classified the study area into five flood susceptibility classes: “Very Low”, “Low”, “Moderate”, “High”, and “Very High”. Based on the classification (Figure 4b), 10.23% of the area was categorized as “Very Low” susceptibility, 23.14% as “Low”, 29.61% as “Moderate”, 17.54% as “High”, and 19.48% as “Very High”, as illustrated in Table 6. Since flood risk is directly related to the FHI, a substantial portion of the province, i.e., over 35% of the study area, was identified as highly vulnerable, falling within the high to very high flood susceptibility categories.

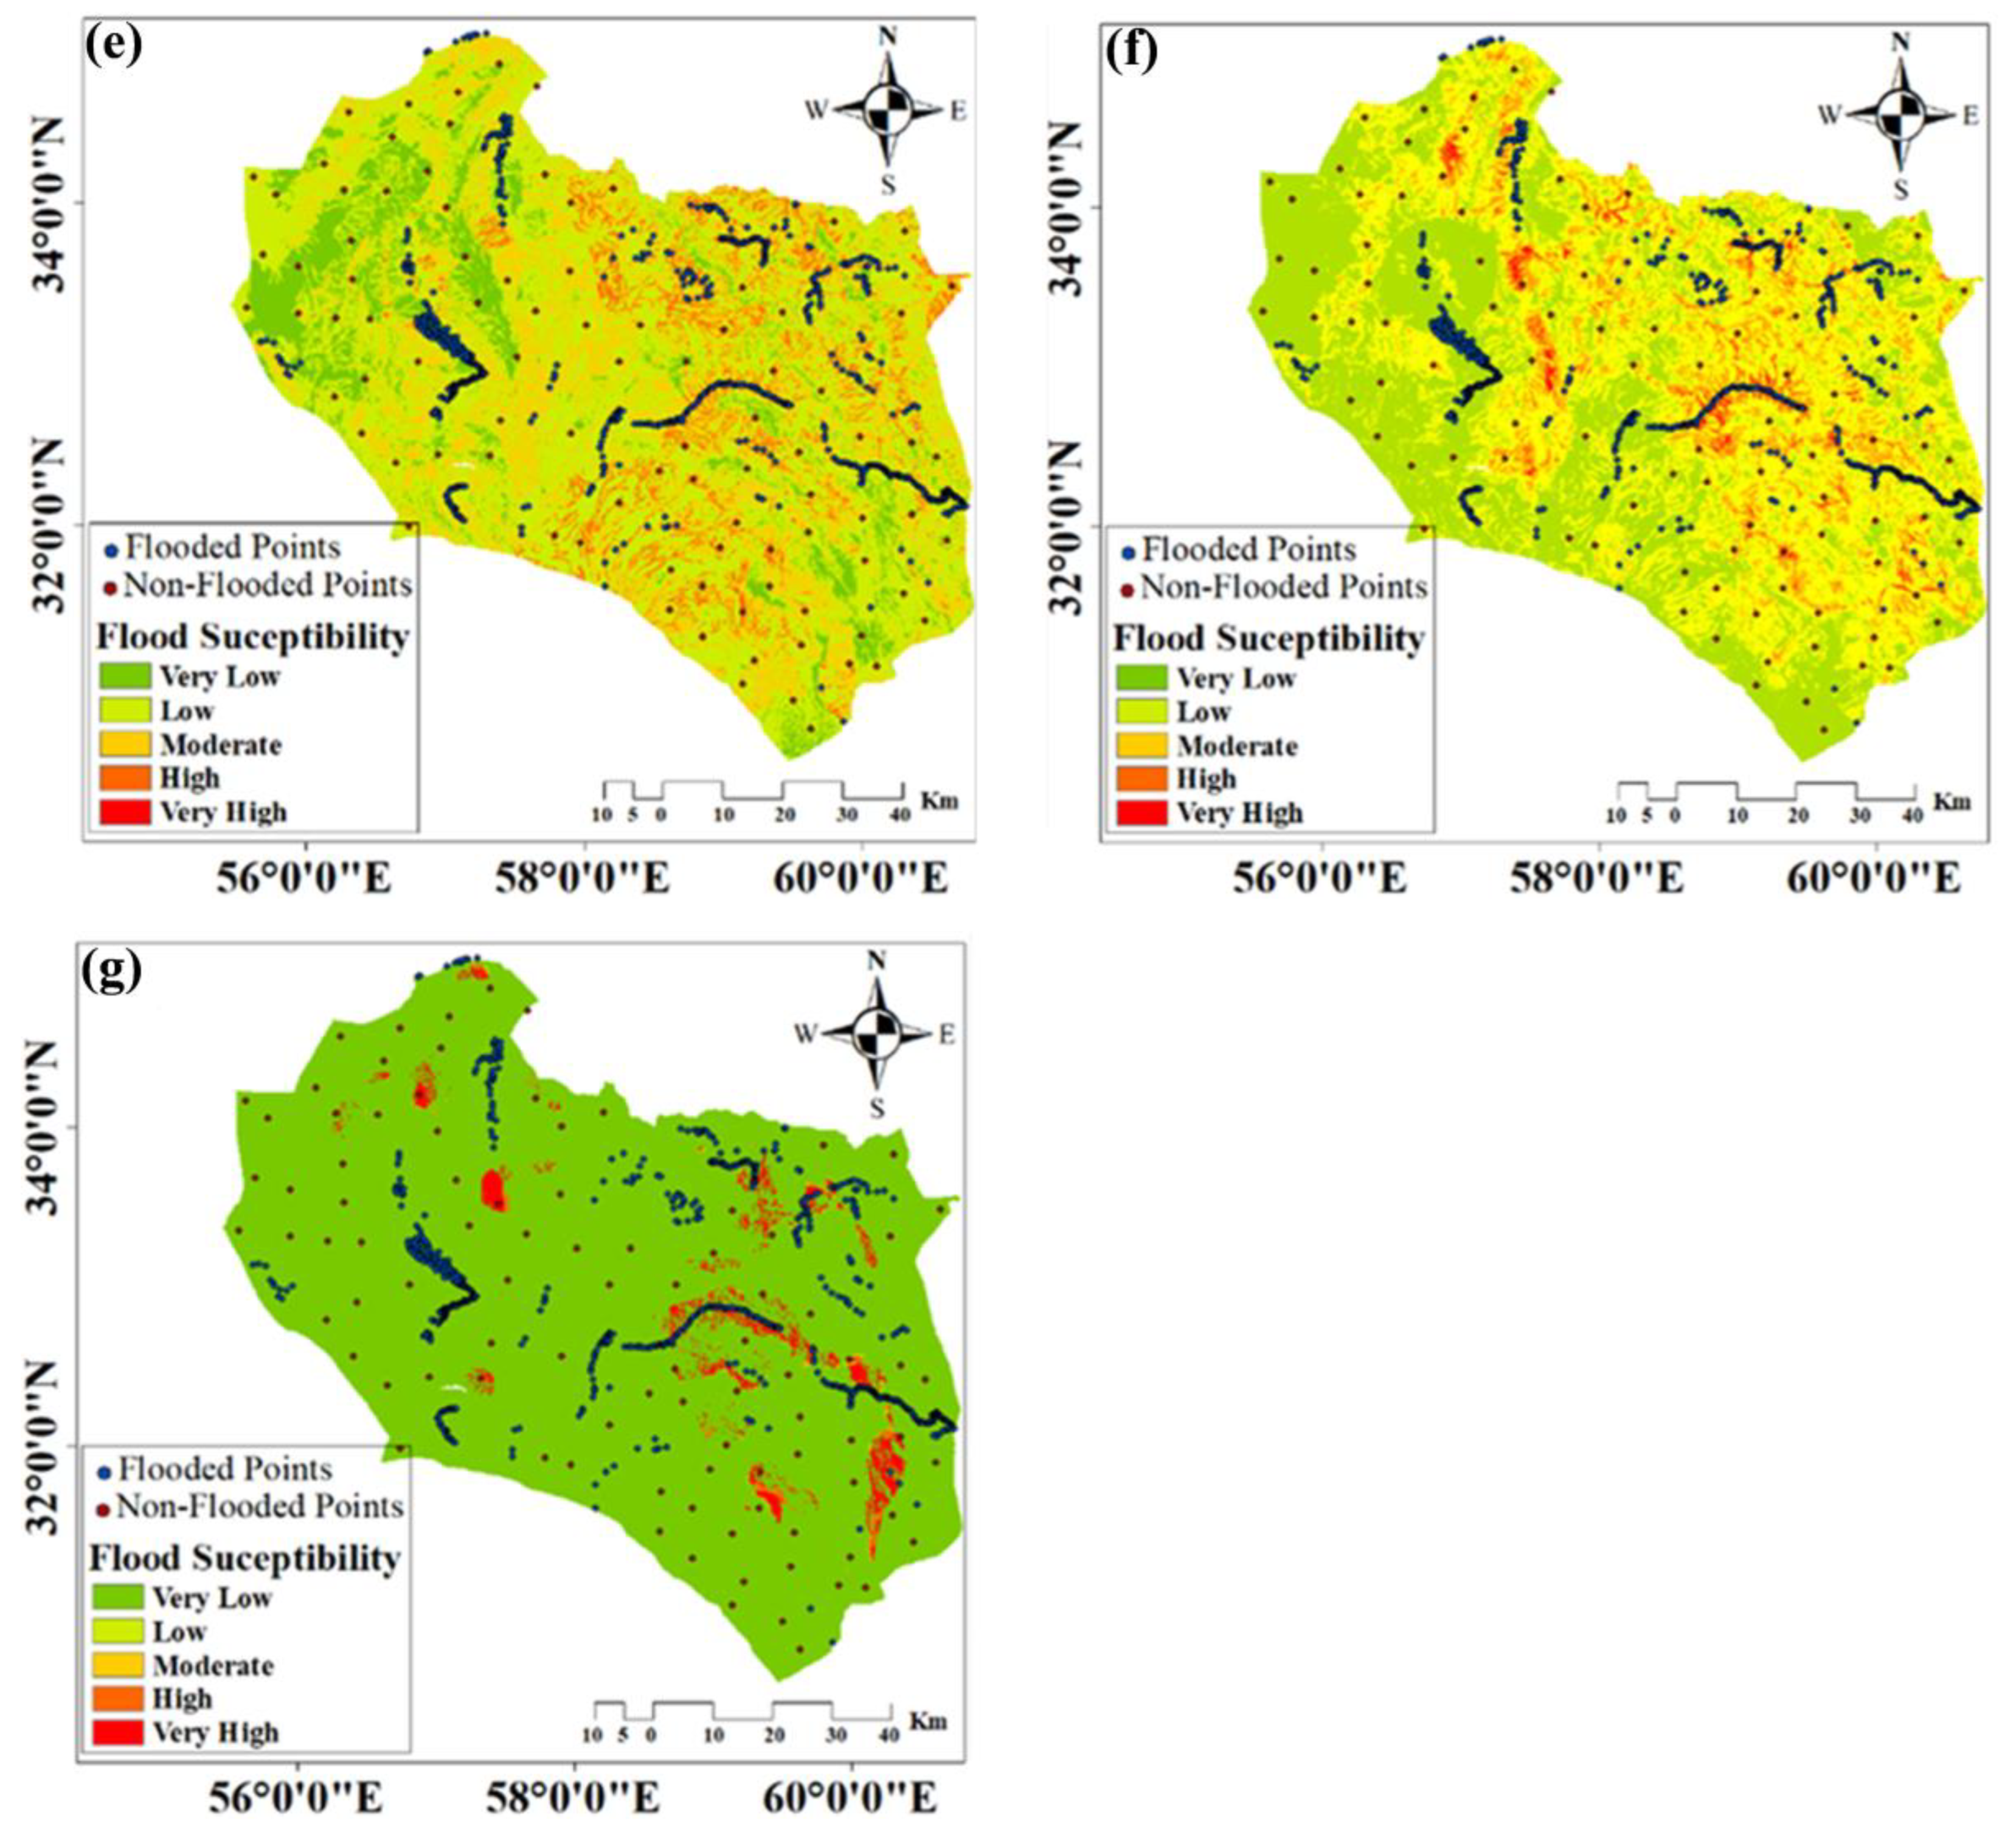
3.3. Risk Scenarios of Flood Susceptibility Using the FOWA Method

The FOWA method was applied to evaluate flood susceptibility in the study area across seven distinct scenarios, reflecting varying levels of risk trade-offs and decision-making priorities (Figure 5a–g). Scenario 1 (Figure 5a) represents the maximum risk level, where no trade-offs are considered. This scenario assumes a fully pessimistic viewpoint using the “AND” operator approach, which assigns dominant weight to the least favorable conditions. As a result, even minor exposure across multiple factors elevates overall risk. Consequently, approximately 98.79% of the study area was classified as “High or Very High” susceptibility (Table 6). At the opposite end, Scenario 7 (Figure 5g) demonstrated the minimum risk level under high trade-off conditions, resembling the “OR” operator in fuzzy logic. This scenario offers an optimistic view of flood resilience, in which less vulnerable conditions can offset more extreme ones. As a result, less than 5% of the area fell under “High” susceptibility, indicating the potential for resilience when mitigation strategies are fully effective. Intermediate scenarios (Figure 5b–f), such as Scenario 4 (Figure 5d), represented a more balanced perspective. The spatial distribution of flood susceptibility across all scenarios revealed persistent high-risk clusters in the northern, central, and southeastern regions of South Khorasan Province, primarily driven by factors such as DTR, high RF, and low SL, which increase surface runoff and reduce infiltration.

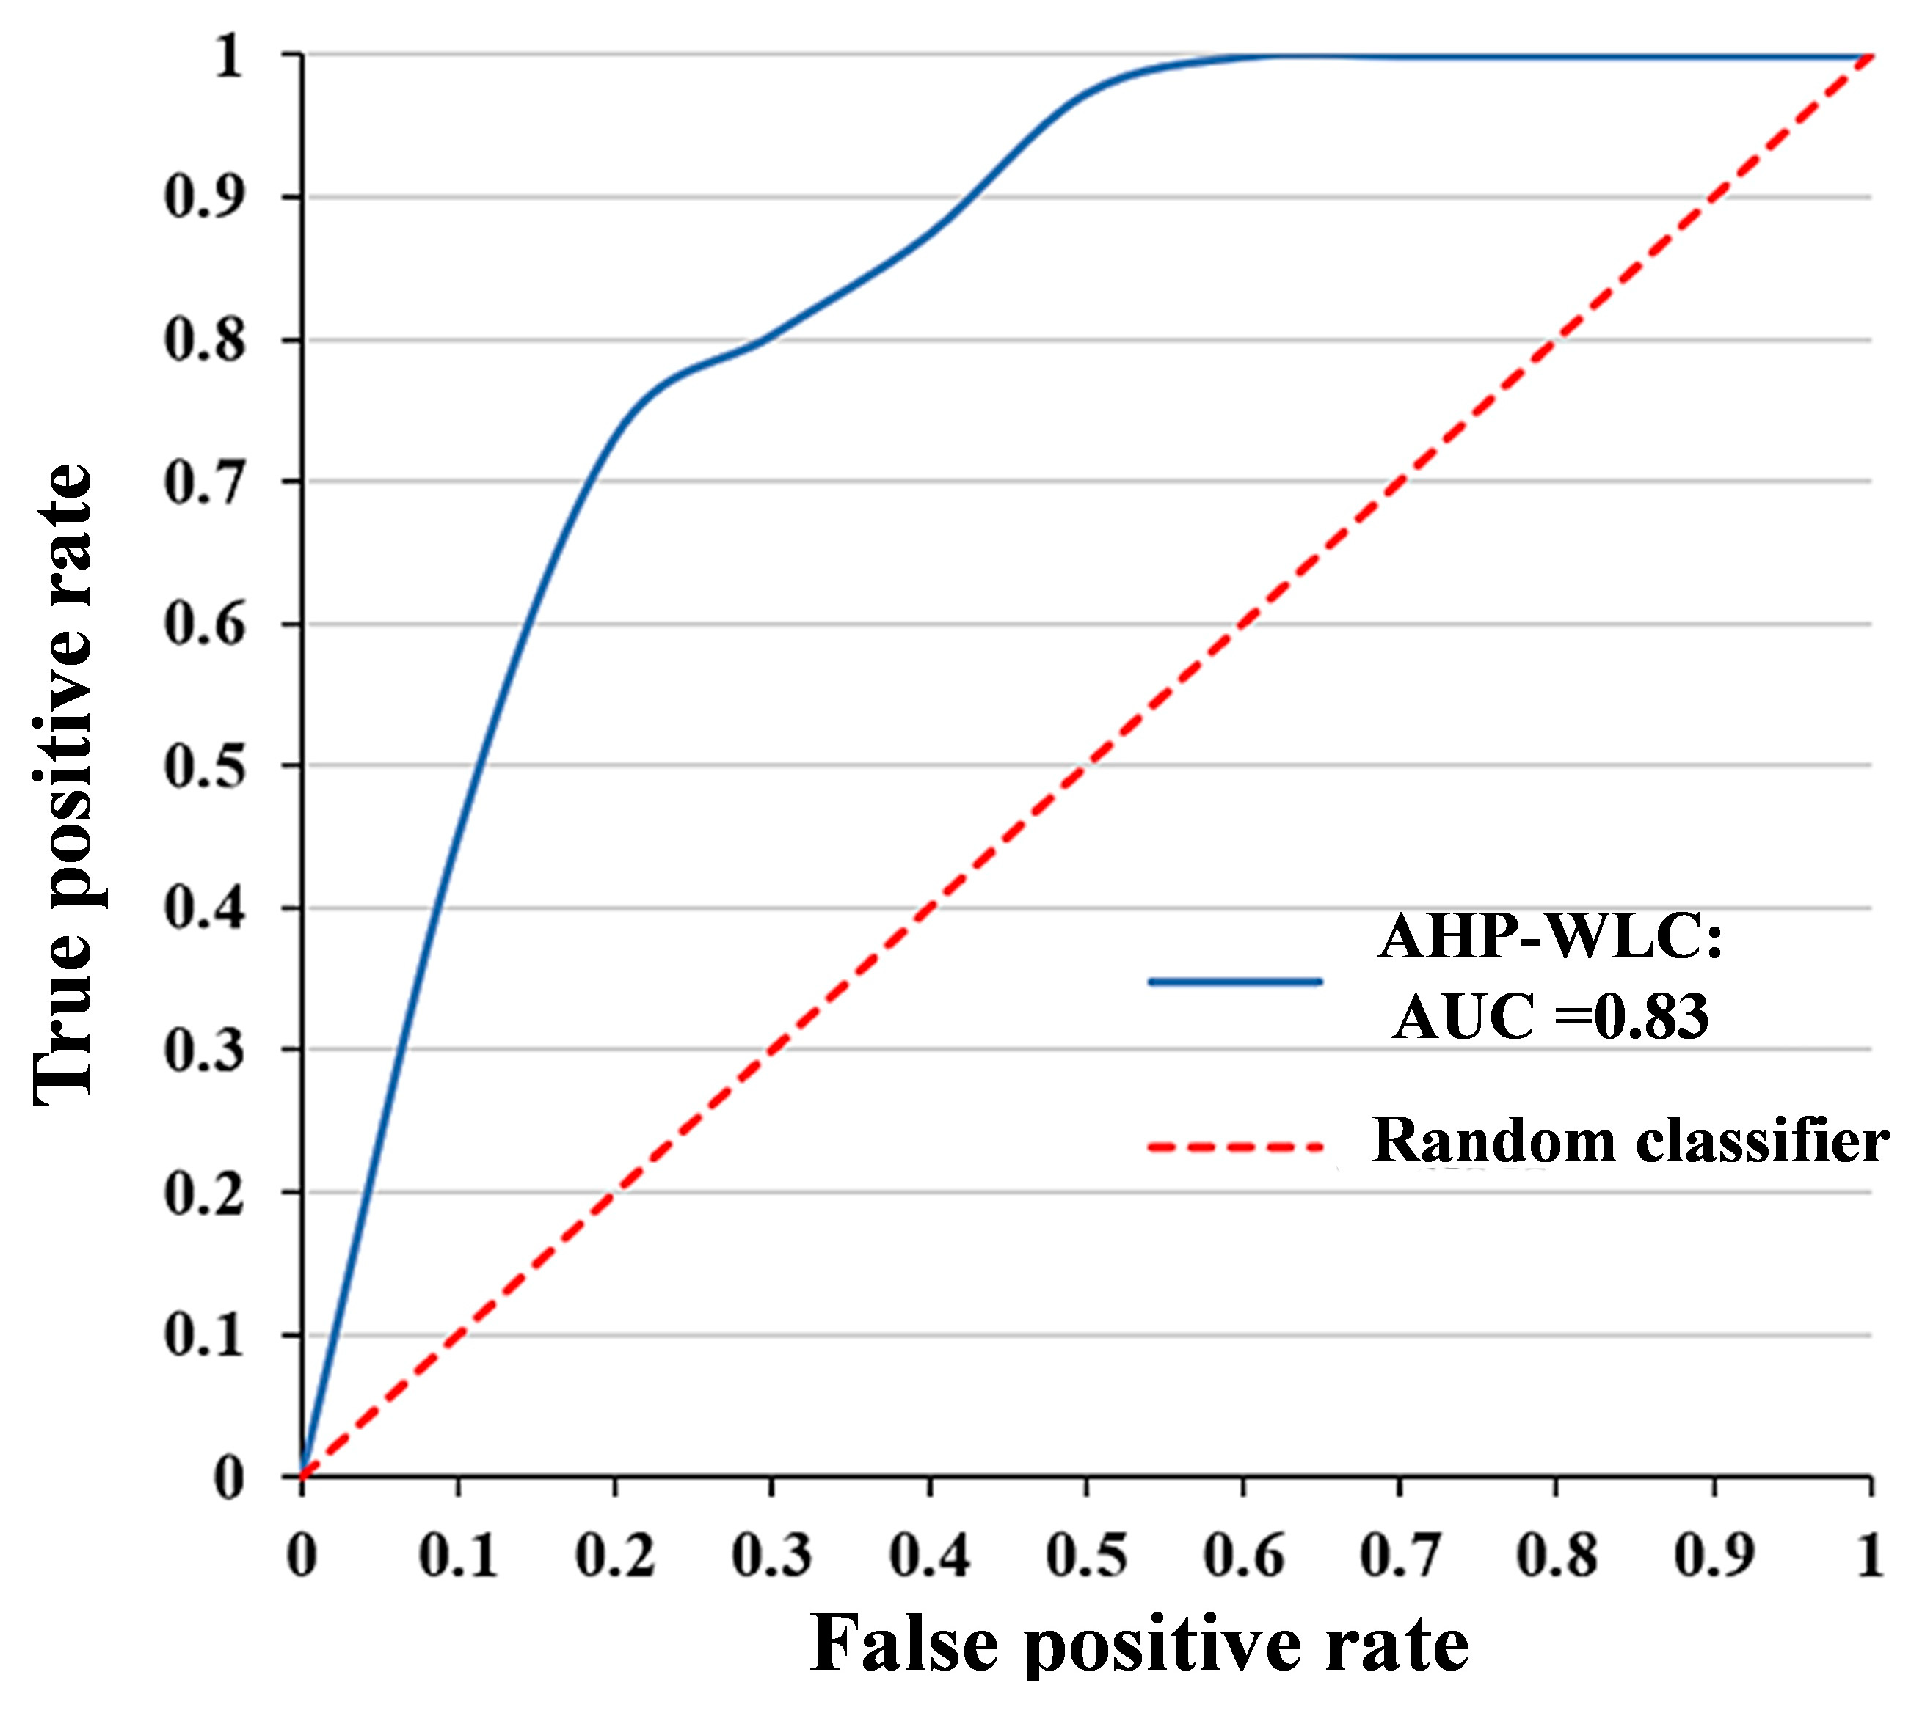
3.4. Accuracy Assessment

The accuracy of the AHP-WLC model, illustrated in Figure 6, achieved an AUC value of 0.83, indicating a strong discriminative ability to identify flood-prone areas. AUC values above 0.8, as obtained in the existing study, are widely recognized as indicative of good model performance. Additionally, Table 7 presented an overview of the OA obtained by the FOWA method for different scenarios. The results highlighted the robustness of the FOWA with an average OA of ~75% across all scenarios of FOWA. Moreover, the FOWA achieved an OA of 87% for scenario 4, indicating a strong capability in accurately predicting outcomes. These high OA values underscored the approach’s suitability for scenarios with moderate trade-offs, reflecting its effectiveness in capturing the complex interplay of factors influencing flood susceptibility. Similarly, scenarios 5 and 6 exhibited OA of 78.77% and 69.59%, respectively, further validating the model’s reliability in forecasting frequent or significant results.

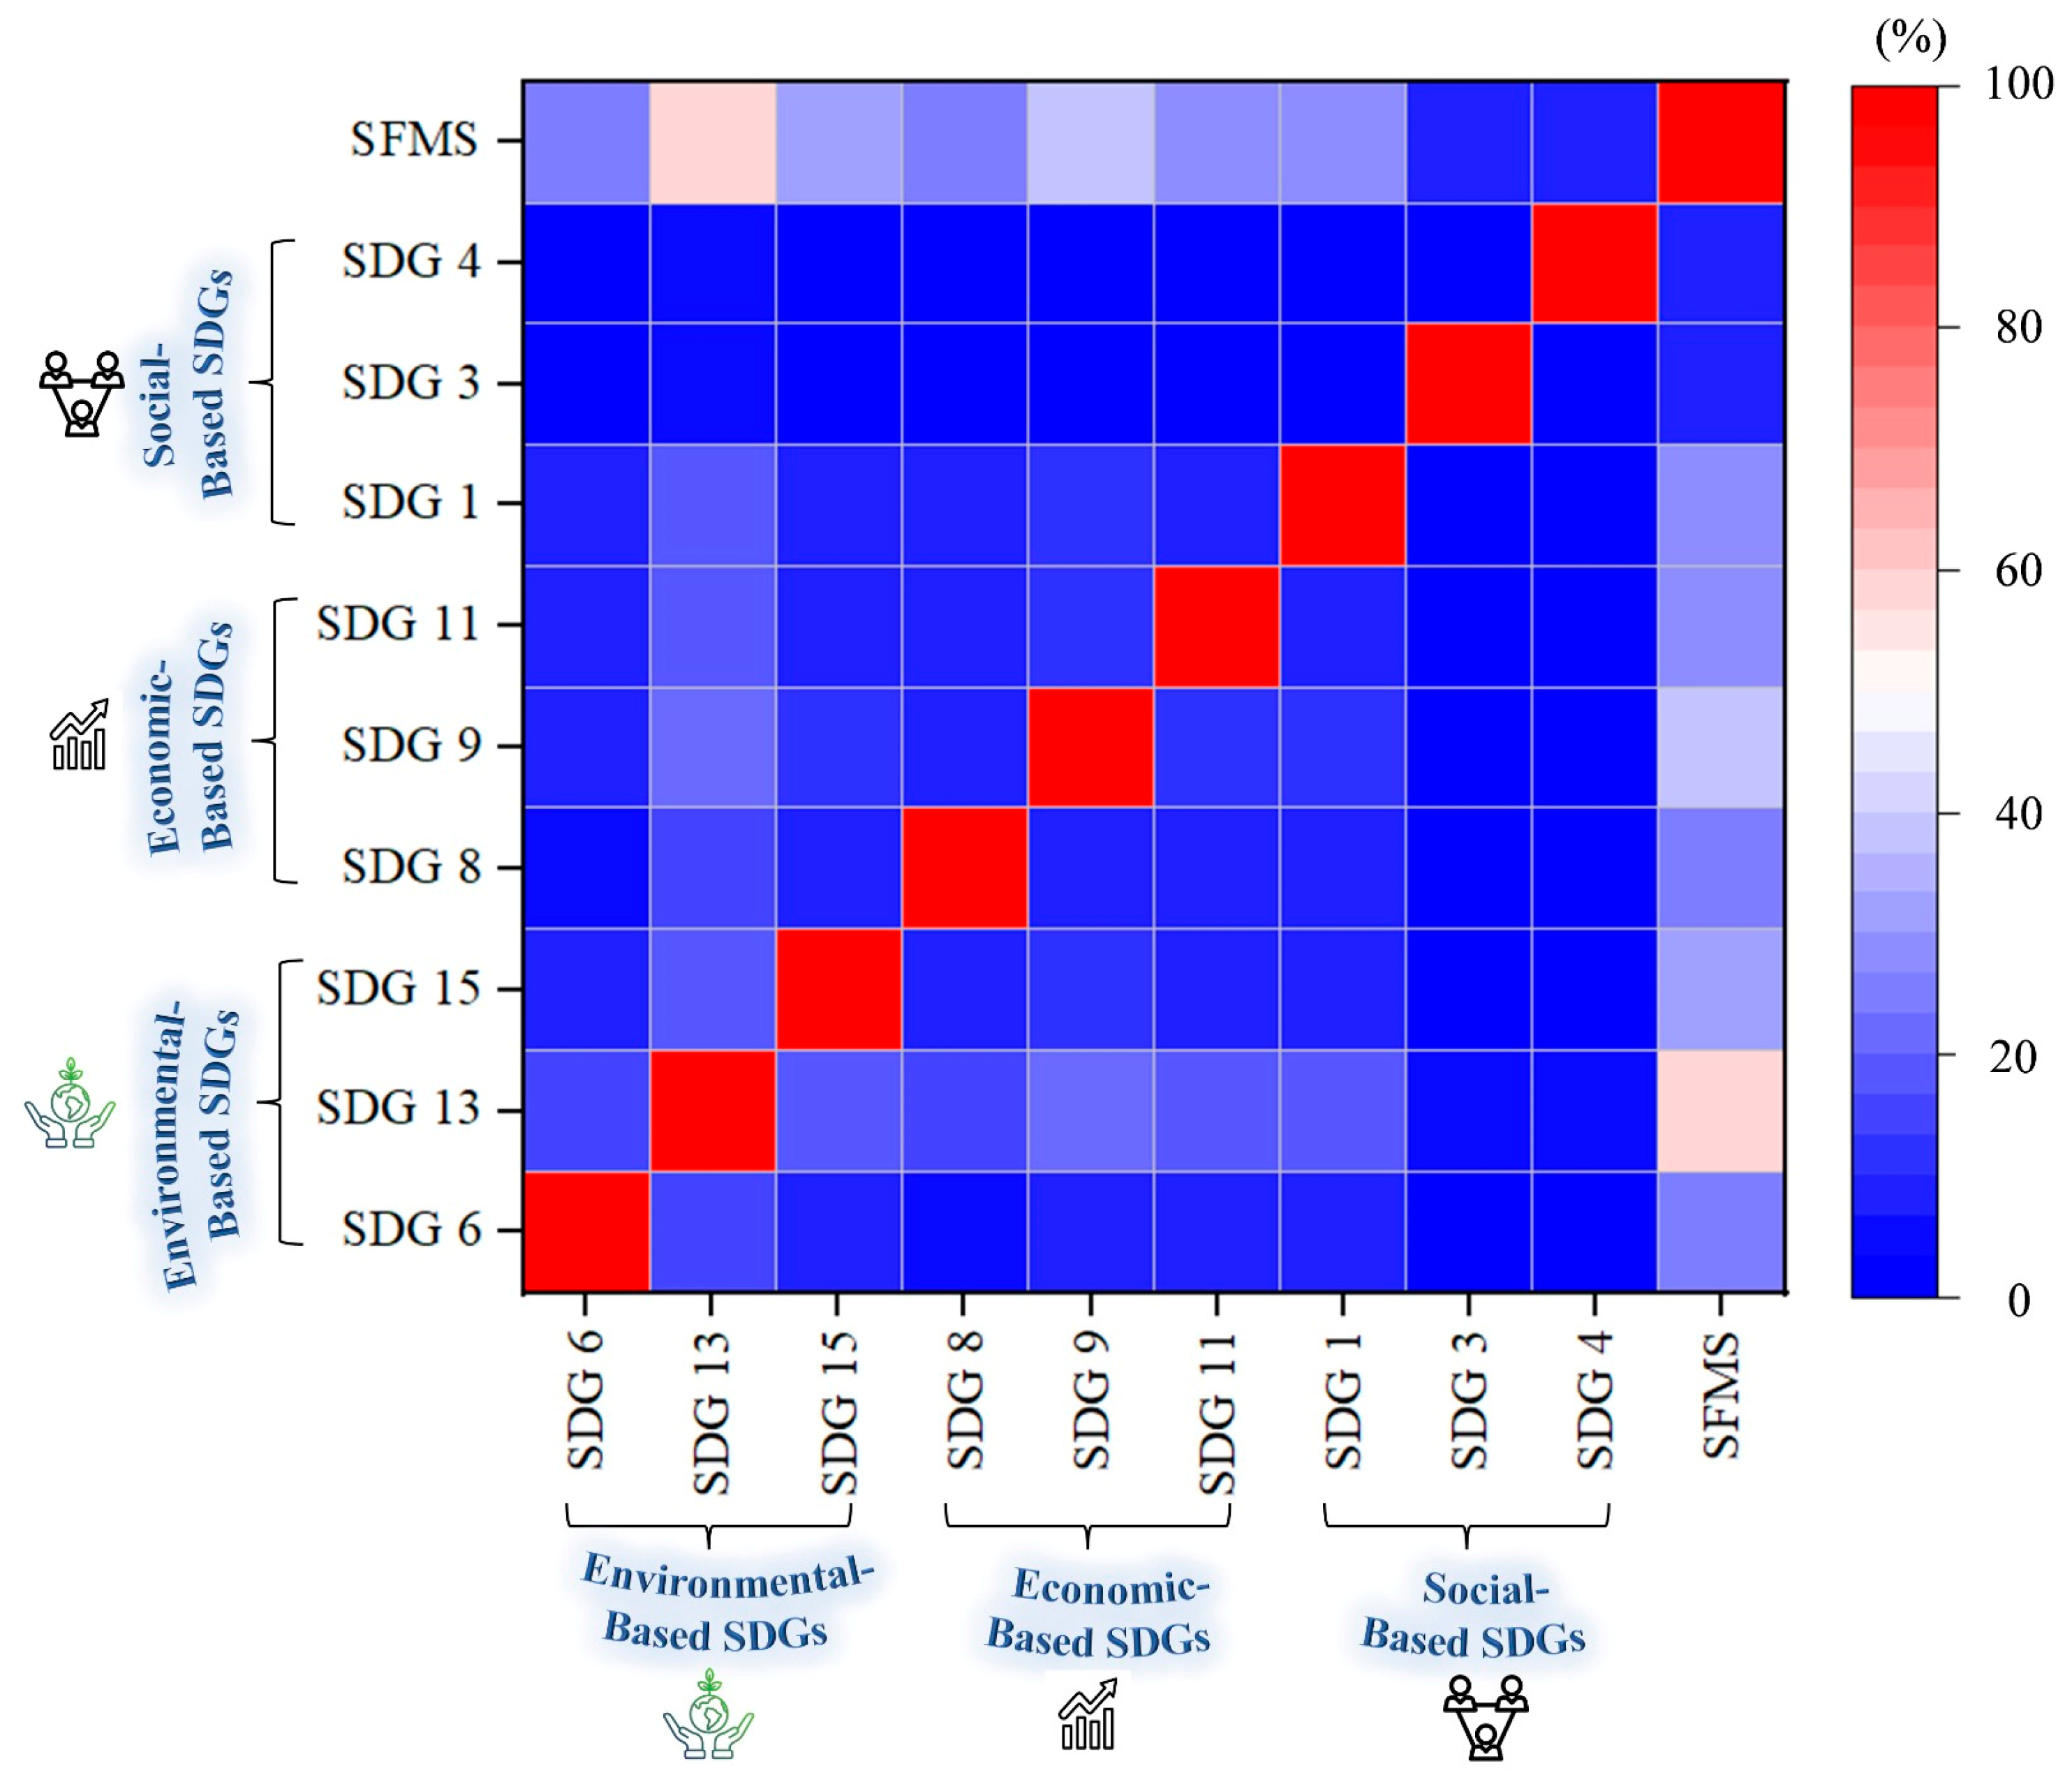
3.5. Impact of the Study Findings on the SDGs

The findings of this study revealed significant vulnerabilities to flash flood risks in South Khorasan Province, emphasizing the urgency of addressing these challenges through innovative and sustainable flood management strategies. Certain areas in the region were disproportionately affected due to their geographic and socio-economic characteristics, requiring targeted interventions. Sustainable solutions are essential to reduce these vulnerabilities and align with the targets of SDGs. This section explored the emerging challenges of flood risks in the province under investigation (Figure 7) and evaluated how the study’s methodology could provide a proposed SFMS linked to the three pillars of sustainability: environmental, economic, and social dimensions (Figure 8).

3.5.1. Emerging Challenges

Flooding in South Khorasan Province is driven by a complex interplay of climatic, topographic, riverine, anthropogenic, and socio-economic factors, leading to multiple emerging challenges, as illustrated in Figure 7. The semi-arid to hyper-arid CL, characterized by low annual RF (~100–160 mm) and high evaporation rates, results in limited soil moisture and sparse vegetation cover (NDVI ~0.1), reducing natural water absorption and increasing runoff. Topographic features also exacerbate flood risks. For instance, steep SLs (>65%) accelerate the surface flow, while low-lying plains with gentle SLs (<2%) and ELEs below 1000 m act as natural runoff accumulation zones. Areas located within 100 m of rivers were identified as having heightened flood susceptibility due to frequent overflow events, as confirmed by the high weight (0.22) assigned to the DTR factor. Anthropogenic pressures, including urban expansion, deforestation, and overgrazing, have significantly altered LU/LC and decreased the land’s natural infiltration capacity, aggravating flood dynamics. Furthermore, socio-economic vulnerabilities emerge due to DTD and DTU, where inadequate drainage networks, indicated by high DD, increase the risk of waterlogging and infrastructural damage, threatening the resilience of rural and peri-urban communities.

3.5.2. Sustainable Strategies

To overcome the challenges identified in South Khorasan Province, a proposed SFMS linked to the three pillars of SDGs should be implemented to address the root causes and mitigate the impacts of flooding (Figure 8).
  • Environmental-Based SDGs
Flash floods in South Khorasan, driven by climatic factors such as high-intensity RF and minimal NDVI (~0.1), require immediate adaptive measures. To address these challenges, strategies should strengthen resilience (Target 13.1) through vegetative restoration in degraded areas, guided by flood hazard maps that incorporate key variables such as DTR, RF, and SL. Adaptive planning based on FOWA-modeled CL scenarios can support preparedness for future RF extremes (Target 13.2). Public awareness campaigns, grounded in susceptibility maps, are essential for improving local knowledge and promoting sustainable behavior (Target 13.3). Consequently, the SFMS can address ~60% of SDG 13 targets.
Ecosystem degradation from deforestation and overgrazing increases flood risk, as confirmed through NDVI and LU/LC analyses. The SFMS should focus on ecosystem conservation (Target 15.1) via afforestation and floodplain protection in high-risk areas. It also should address land degradation (Target 15.3) with erosion control in steep SL zones and protect biodiversity (Target 15.5) by preserving habitats identified as vulnerable to flooding. Collectively, the SFMS can contribute to 33% of SDG 15 targets.
Floods also may disrupt water systems in low-lying areas (ELE~1000). Integrated watershed management (Target 6.5) can improve natural drainage in poorly drained zones while protecting hydrological ecosystems (Target 6.6), ensuring long-term resilience. Therefore, the SFMS can contribute to 25% of SDG 6 targets.
  • Economic-Based SDGs
Floods can severely disrupt livelihoods, especially in agriculture-based rural areas, as indicated by LU/LC layers. The SFMS can reduce economic losses (Target 8.1) by protecting vulnerable farmlands using adaptive cropping strategies and effective drainage systems. It also can enhance productivity (Target 8.2) through sustainable LU/LC and context-specific farming practices in flood-prone zones. These efforts may promote efficient LU/LC and reduce economic fragility (Target 8.4). Accordingly, the SFMS can contribute to 25% of the targets under SDG 8.
Infrastructure located near roads (DTD ~ 1000 m) and urban centers (DTU ~ 3000 m) are at high risk. The SFMS can promote resilient infrastructure (Target 9.1) through the design of flood-adaptive transportation, drainage, and urban systems using susceptibility maps. Incorporating sustainable construction practices (Target 9.4) and fostering regional collaboration and investment (Target 9.a) can further strengthen infrastructure resilience. As a result, the SFMS can address ~37.5% of SDG 9 targets.
Unplanned urban expansion into flood-prone areas, identifiable through DTR and DD analysis, may increase vulnerability. The SFMS can propose integrating flood maps into urban development (Target 11.3) to guide settlement design. Enhanced early warning systems and drainage networks can help mitigate human and economic losses (Target 11.5). Promoting adaptive urban policies (Target 11.b) may ensure long-term urban resilience. Thus, the SFMS can contribute to 30% of SDG 11 targets.
  • Social-Based SDGs
Flooding disproportionately can impact low-income rural populations, often identified via LU/LC indicators. The SFMS should implement community-level flood protection (Target 1.5) to safeguard assets and ensure continuity of livelihoods. Empowering vulnerable groups through participatory planning and localized adaptation (Target 1.b) can significantly improve resilience and reduce poverty-linked flood exposure. These efforts can support ~28.6% of SDG 1 targets.
Flood events can also increase health risks, particularly waterborne diseases, in areas with poor drainage densities (>0.8 km/km2). The SFMS may recommend strengthening healthcare system resilience (Target 3.d) by prioritizing risk mapping for emergency preparedness and targeted interventions. Therefore, the SFMS can contribute to 7.7% of SDG 3 targets.
A lack of awareness and education on flood risks, particularly in high-risk areas near DTR ~ 1000 m, can hamper mitigation efforts. The SFMS should integrate flood risk education into school and community curricula (Target 4.7), fostering sustainable decision-making and disaster preparedness. Thus, the SFMS can address 10% of SDG 4 targets.

4. Discussion

4.1. Controlling Factors vs. Flood Risk Degree

The differences in assigned weights between the study area and other case studies can be attributed to variations in study area characteristics, such as topography and hydrological conditions, as well as local environmental and climatic conditions, as reported elsewhere [52]. These differences emphasized the importance of tailoring weight assignments to reflect the unique conditions of each study area. For instance, factors like SL and DD could hold greater significance in mountainous regions, whereas RF intensity and LU/LC might dominate in urban or lowland areas. The suitable weights assigned to the 15 factors were estimated, incorporating local insights and expert validation to ensure relevance and accuracy [25].

4.1.1. Distance to Rivers (DTR)

DTR contributed a weight of 0.221 to the flood susceptibility map, making it the most critical factor in the analysis (Figure 3a). Proximity to rivers shows a positive correlation with flood occurrence, where areas closer to rivers faced significantly higher susceptibility [26]. For instance, regions within 100 m were at greater risk due to frequent inundation during heavy RF, while areas farther than 400 m exhibited reduced flood risks.

4.1.2. Rainfall (RF)

RF weighted 0.180, reflecting its substantial role in influencing flood susceptibility (Figure 3b). Flood risks rose in tandem with increased RF, as regions receiving over 160 mm annually experience heightened runoff and water accumulation. In contrast, areas with less than 100 mm of RF were less vulnerable to flooding. This association emphasized how RF intensity directly contributed to surface water overflow and flood hazards [65].

4.1.3. Slope (SL)

SL contributed a weight of 0.139 to the flood susceptibility map, indicating its moderate impact on flood risks (Figure 3c). The relationship between SL and flood occurrence is negatively correlated. For instance, flatter SLs, particularly those under 2%, experienced slower drainage and higher water retention, making them more flood-prone. Steeper SLs above 65% mitigated flooding by encouraging rapid runoff and minimizing pooling. This factor underscored how topography affects water flow dynamics [64].

4.1.4. Land Use/Land Cover (LU/LC)

LU/LC, with a weight of 0.111, had a significant influence on flood susceptibility (Figure 3d). Urban areas, characterized by impervious surfaces, correspond directly to higher runoff and amplified flood risks. Conversely, vegetated zones like forests and pastures in the northern parts of the study area may reduce flood vulnerability by promoting infiltration. The type and intensity of LU/LC can play a critical role in shaping flood dynamics, where human-altered landscapes can heighten susceptibility [25].

4.1.5. Normalized Difference Vegetation Index (NDVI)

NDVI contributed a weight of 0.086, reflecting the role of vegetation density in regulating runoff (Figure 3e). The relationship between NDVI and flood risk is inversely associated. For instance, dense vegetation, indicated by NDVI values above 0.5, may help absorb water, slow runoff, and reduce flood hazards. In contrast, barren regions with NDVI values below 0.1 may exhibit heightened flood susceptibility. This factor demonstrates the vital role of vegetation in attenuating the impact of heavy RF [45].

4.1.6. Elevation (ELE)

ELE weighted 0.067, showing its role in flood risk modulation (Figure 3f). Low-lying areas below 1000 m were more flood-prone, as water tends to accumulate and flow toward these regions. Higher ELEs above 2600 m were less vulnerable, as runoff can be swiftly channeled downhill. This inverse association illustrated how ELE gradients could govern water movement and flood exposure [66].

4.1.7. Drainage Density (DD)

With a weight of 0.049, DD played an essential role in shaping flood susceptibility (Figure 3g). Regions with higher DD (>0.8 km/km2) experienced intensified flood risks due to efficient channeling and accumulation of surface water. On the other hand, areas with lower DD (<0.1 km/km2) exhibited reduced vulnerability as water can disperse more slowly. This positive correlation can highlight the role of drainage networks in concentrating runoff and increasing flood hazards [67].

4.1.8. Soil Depth (SD)

SD, weighted at 0.036, influenced flood risks by affecting infiltration rates (Figure 3h). Shallow soils can restrict water absorption, resulting in increased surface runoff and greater flood susceptibility. In contrast, deeper soils with higher infiltration capacities can mitigate flood risks. The relationship is inversely linked, as greater SD reduces the likelihood of water accumulation on the surface [47].

4.1.9. Soil Texture (ST)

ST contributed a weight of 0.027, reflecting its effect on water permeability and runoff dynamics (Figure 3i). Coarse-textured sandy soils can enhance infiltration, reducing flood risks, while fine-textured clay soils can retain water and exacerbate flooding. For example, clay soils in the southern parts of the study area were associated with increased susceptibility [48].

4.1.10. Climate (CL)

CL, with a weight of 0.021, shaped flood susceptibility by influencing precipitation and evaporation patterns (Figure 3j). Semi-arid regions with seasonal RF can exhibit moderate flood risks, while hyper-arid zones with low precipitation may face reduced vulnerability. The relationship between CL and flooding is positively correlated, as wetter conditions can amplify runoff and exacerbate flood hazards in susceptible areas [64].

4.1.11. Distance to Roads (DTD)

DTD, weighted at 0.019, impacted flood risks by altering natural water flow and reducing infiltration (Figure 3k). Areas within 1000 m of roads were more vulnerable due to the impervious nature of road surfaces, which concentrated runoff. Conversely, regions farther from roads experienced reduced susceptibility. This direct relationship underscored how infrastructure can intensify flood dynamics [63].

4.1.12. Distance to Villages (DTV)

DTV, with a weight of 0.015, highlighted the increased vulnerability of rural settlements to flooding (Figure 3l). Proximity to villages near rivers or low-lying areas intensified flood risks due to inadequate infrastructure. Areas within 1000 m of rivers were particularly susceptible. This positive association underscored the need for improved drainage systems in these regions to mitigate flood impacts [51].

4.1.13. Distance to Urban Areas (DTU)

DTU, with a weight of 0.0115, reflected its influence on flood risk through impervious surfaces and limited drainage (Figure A1). Areas closer to urban zones (<3000 m) experienced heightened flood susceptibility due to concentrated runoff, while those farther away were less affected. This direct association demonstrated how urbanization exacerbated flood vulnerabilities in adjacent areas [26].

4.1.14. Aspect (AS)

AS, with a weight of 0.009, indirectly affected flood susceptibility through its influence on evaporation and vegetation cover (Figure A2). South-facing SLs, with higher solar exposure, experienced reduced soil moisture and increased runoff potential, raising flood risks. North-facing SLs with greater vegetation density were less vulnerable. This relationship varied depending on SL orientation and environmental factors [68].

4.1.15. Distance to Faults (DTF)

DTF, contributing a weight of 0.008, indirectly affected flood risks through its impact on sub-surface hydrology (Figure A3). Areas closer to faults, particularly within 500 m, were more vulnerable to flooding due to groundwater discharge and structural instabilities. This positive relationship highlighted how geological features influence water movement and flood susceptibility [69].

4.2. Analysis of the Flood Risk Maps

The analysis of the flood risk maps revealed significant spatial variability in flood susceptibility across South Khorasan Province (Figure 4 and Table 6). High vulnerability zones were predominantly concentrated in the northern, central, and southeastern parts of the province, corresponding to areas characterized by small DTR, higher RF intensities, and steeper SLs. In contrast, the northwestern regions, which experience lower RF, milder SLs, and higher ELEs, exhibited markedly lower flood susceptibility, likely due to improved runoff dispersion and limited water accumulation [65]. These findings align well with previous studies in semi-arid environments. For instance, Choubin et al. [5] identified the DTR as a major controlling factor influencing flood susceptibility, a pattern corroborated by the present study where DTR attained the highest AHP-derived weight. Similarly, Dodangeh et al. [52] emphasized the critical roles of RF and SL variations in shaping flood hazards across diverse topographies, reinforcing the reliability and regional relevance of the AHP-WLC modeling approach employed in the existing study.
The outcomes derived from the FOWA scenarios offered further insights into flood dynamics, particularly in identifying extreme exposure zones (Figure 5 and Table 6). Scenario 1, representing the maximum risk situation, acted as a diagnostic tool to highlight worst-case exposure areas under highly pessimistic assumptions [70]. Although the wide classification of the province as high-risk in Scenario 1 might initially seem exaggerated, it resonates with the real-world vulnerability patterns of this arid region, where short-duration, high-intensity RF events combined with poor drainage infrastructure frequently trigger widespread inundations [71]. Historical flood records, notably from Tabas and Darmian counties, validate these patterns, confirming the accuracy of the model in detecting flood-prone zones adjacent to rivers and urban fringes [66,72]. Scenario 4, which distributed trade-offs more evenly, produced a more balanced risk distribution across the region and provided a valuable reference point for practical policy formulation and infrastructure planning. These outcomes clearly demonstrate the flexibility of the FOWA method in prioritizing intervention areas based on both exposure levels and resource availability [32].
Further, the distinct scenario results highlighted statistically and spatially significant differences in risk distribution, illustrating how varying degrees of risk aversion influence flood susceptibility mapping [73]. This adaptability is vital for effective resource allocation in arid and semi-arid regions, a conclusion supported by Motlagh et al. [60], who emphasized the importance of scenario-based modeling for flood risk prioritization. The heavy concentration of flood risk observed in Scenario 1 is consistent with Dodangeh et al. [52], who stressed the urgency of proactive intervention in highly exposed areas with low adaptive capacities. In contrast, the moderate, more balanced outcomes derived from Scenario 4 align with the findings of Choubin et al. [5], who highlighted the necessity of integrating context-sensitive planning approaches to address flood risks across heterogeneous landscapes. Notably, the incorporation of both optimistic and pessimistic perspectives within the FOWA framework underscores its robustness in simulating various hydrological conditions. This pattern can be considered a crucial aspect of sustainable and inclusive flood risk management, particularly under increasing climatic uncertainty and complex terrain conditions [13].
Comparative analysis based on Table 6 further illustrates the performance differences between the AHP-WLC and FOWA models. While both methods consistently identified the northern, central, and southeastern regions as high-risk zones, notable distinctions were observed in the classification of moderate and high susceptibility areas. The AHP-WLC model exhibited a more balanced susceptibility distribution, with 29.61% of the area classified as “Moderate”, suggesting a smoother gradient between risk categories. Meanwhile, the FOWA method demonstrated greater sensitivity to decision-maker preferences, producing more extreme risk distributions depending on the applied scenario. For instance, Scenario 7 emphasized minimum risk, whereas Scenario 1 amplified high-risk areas, offering a wide range of policy options. Intermediate scenarios, particularly Scenario 4, achieved a more nuanced and realistic risk distribution by balancing trade-offs among controlling factors. These differences reflect the inherent methodological contrasts between AHP-WLC, which applies fixed weights and linear aggregation, and FOWA, which employs flexible weighting to accommodate varying degrees of optimism and pessimism in decision-making processes [58]. Overall, the complementary insights provided by both methods can enhance the understanding of spatial flood vulnerability in South Khorasan Province and offer valuable guidance for sustainable flood risk management and mitigation planning [18,74].

4.3. Precision Evaluation of the Flood Risk Maps

The precision evaluation of the flood risk maps, based on the AHP-WLC and FOWA methods, provided important insights into the reliability of IFAA in predicting flood susceptibility across South Khorasan Province. The AHP-WLC model achieved an AUC value of 0.83 (Figure 6), which shows strong predictive performance. This result is consistent with previous studies [63], where similar accuracy was achieved using the AHP-WLC method for flood risk mapping. The OA results from the FOWA scenarios (Table 7) also confirmed that integrating fuzzy decision-making techniques helped improve the reliability of the predictions [75].
These findings are supported by studies such as Dodangeh et al. [52], who emphasized that using multiple decision-making methods together can improve predictive accuracy. Most of the FOWA scenarios showed good performance, especially Scenario 4, which achieved an OA of 87%. This suggested that Scenario 4 provided a realistic representation of flood risk. However, Scenario 2 had a lower OA of 63.72%. This indicated that the model was less accurate when predicting outcomes in cases where few common flood events were considered [76]. This limitation agrees with the findings by Choubin et al. [5], who also reported lower predictive accuracy when dealing with rare or infrequent flood events. The lower performance in Scenario 2 may be because of the limited historical data available to validate such events [77].
Overall, the validation results demonstrated that the IFAA framework, combining AHP-WLC and FOWA methods, is effective in producing reliable flood susceptibility maps for South Khorasan Province. Using both deterministic (AHP-WLC) and fuzzy (FOWA) approaches together allowed for a more complete understanding of flood risk patterns. This can help support better decision-making and planning for flood risk reduction and sustainable development in the study area [71,78].

4.4. Sustainable Pathways for Flood Resilience in Arid Regions

The emerging challenges identified in South Khorasan Province reflected patterns observed in other arid and semi-arid regions, where the interplay of natural and anthropogenic factors intensifies flood vulnerabilities [79]. Climatic constraints such as low RF and high evaporation are consistent with previous studies highlighting the resulting reduction in soil moisture and vegetative cover, exacerbating runoff and flood risk [80]. The role of ELE, where steep SLs accelerate runoff and flat lowlands accumulate floodwaters, parallels findings in similar environments [13]. The critical importance of DTR is reinforced by previous research that emphasizes the vulnerability of areas adjacent to riverbanks during high-intensity RF events [5]. Anthropogenic alterations, including deforestation, urbanization, and unsustainable LU/LC, mirror global trends where human activities disrupt natural hydrological cycles, intensifying flood hazards [81]. Moreover, the socio-economic implications, particularly regarding infrastructure damage and community vulnerability due to inadequate drainage and proximity to transport networks, align with prior findings that underscore the disproportionate impacts of flooding on marginalized populations [82].
Building on these identified challenges, sustainable strategies must address environmental, economic, and social dimensions to enhance resilience [83]. Environmentally, adaptation strategies must integrate into local planning to mitigate CL vulnerabilities, aligning with the recommendations of Ahmed et al. [80], who stressed the necessity of CL-adaptive measures. Restoration of vegetation cover is essential, supporting Dodangeh et al. [52], who emphasized vegetation’s role in minimizing ecological vulnerability and flood risks. Additionally, hydrological ecosystem restoration is critical for reducing water stagnation and promoting sustainable water use, as advocated by Choubin et al. [5]. Economically, stabilizing rural livelihoods through the integration of flood risk management into agricultural development, as highlighted by Agache et al. [84], is vital, alongside utilizing flood data in infrastructure and urban planning, as recommended by Udo et al. [85]. The need for integrating geospatial analysis into urban governance to guide sustainable urban expansion, consistent with Sathiyamurthi et al. [25], is also crucial. Socially, empowering communities through engagement and participatory adaptation planning resonates with the findings of Gyimah et al. [86], while strengthening public health systems to address flood-induced health risks aligns with Mohajervatan et al. [87]. Furthermore, embedding flood education into community curricula, as suggested by Mutch [88], is essential for building long-term resilience and ensuring sustainable development across South Khorasan Province.

5. Limitation and Future Research

This study demonstrated a robust approach to flood susceptibility assessment in South Khorasan Province. However, several limitations emerged. Firstly, the reliance on historical climatic and hydrological data may not capture recent or emerging trends driven by CL change. This limitation affects the precision of risk predictions, particularly in hyper-arid regions experiencing shifts in precipitation patterns [89]. Additionally, the study’s spatial focus on South Khorasan Province restricted the generalizability of its findings to other regions with differing climatic or topographic characteristics. Although the proficiency of AHP, and FOWA in integrating many factors, they were significantly reliant on the quality and precision of input data, potentially leading to inaccuracies in the identification of flood-prone areas. Another notable limitation was the static nature of the flood susceptibility maps, which did not account for dynamic variables such as LU/LC changes or infrastructure developments over time. This reduced the applicability of the maps for long-term planning [90]. Furthermore, the assessment primarily focuses on physical and environmental factors, with limited integration of socio-economic and cultural dimensions that could offer deeper insights into community-specific vulnerabilities.
Future studies should address the limitations identified in this research to enhance the reliability and applicability of the IFAA approach. First, the incorporation of high-resolution spatial data and comprehensive historical records might improve the accuracy of predictions, particularly for less common flood events. Advanced remote sensing techniques and real-time hydrological monitoring might provide valuable inputs for refining thematic layers and increasing the spatial precision of susceptibility maps. Furthermore, the integration of machine learning algorithms with AHP and FOWA methods can help reduce subjectivity in weight assignment and improve the adaptability of models to diverse environmental and socio-economic conditions. Studies should also consider incorporating CL change scenarios to assess the potential impacts of future RF patterns and LU/LC changes on flood susceptibility. Finally, cross-disciplinary collaborations involving hydrologists, urban planners, and policy-makers can be essential for developing comprehensive and actionable strategies for flood risk management in vulnerable regions [5].

6. Conclusions

This study employed an IFAA, combining AHP-WLC and FOWA, to assess and manage flash flood risks in South Khorasan Province, Iran. Fifteen controlling factors, including RF, SL, LU/LC, and DTR, were integrated to produce flood susceptibility maps. AHP-WLC classified the area into five susceptibility zones: very low (10.23%), low (23.14%), moderate (29.61%), high (17.54%), and very high (19.48%). The method demonstrated strong reliability, achieving an AUC of 0.83. The FOWA method further refined these results, exploring optimistic and pessimistic scenarios. Extreme sensitivity was reported in 98.79% of the study area under the most pessimistic scenario, while the most optimistic scenario reduced high-risk areas to less than 5%. These complementary methodologies provided a robust framework, achieving an average accuracy rate of ~75% across all scenarios. Flood susceptibility was highest in densely populated and industrialized regions, especially in the northern and southern areas, characterized by mild SLs and small DTR. The study findings aligned with the increasing vulnerability of arid regions to flash floods due to urbanization and climatic changes. Addressing these vulnerabilities, the study proposed a robust SFMS linked to SDGs, particularly SDG 13 (climate action), where adaptive measures could achieve 60% of resilience targets. Moreover, contributions to SDG 6 (clean water and sanitation) and SDG 11 (sustainable cities and communities) emphasized improved drainage systems, urban planning, and community preparedness, supporting 25% and 30% of their respective targets. This research can present a scalable model for flood risk management applicable to other hydrologically vulnerable regions. Future studies should integrate dynamic climate change projections, higher-resolution data, and socio-economic factors to further enhance the precision and applicability of flood management strategies. These advancements can support more effective and sustainable disaster mitigation globally.

Author Contributions

Conceptualization, M.T., A.M.S. and D.D.; methodology, Z.K.M., A.M.S. and Y.M.Y.; software, A.M.S.; validation, B.Đ.; formal analysis, D.D.; investigation, Y.M.Y. and A.M.S.; resources, D.D.; data curation, A.M.S.; writing—original draft preparation, M.T.; writing—review and editing, D.D. and A.M.S.; visualization, M.T. and A.M.S.; supervision, B.Đ.; project administration, Z.K.M.; funding acquisition, B.Đ. All authors have read and agreed to the published version of the manuscript.

Funding

This research has not received any research funding.

Data Availability Statement

The original contributions presented in the study are included in the article, and further inquiries can be directed to the corresponding author.

Acknowledgments

The authors would like to express their sincere gratitude to Tarbiat Modares University, Tehran, Iran, and the Iranian National Institute for Oceanography and Atmospheric Science (INIOAS) for their invaluable support of this research. Authors are also grateful to the University North, Croatia, for its support during the research and preparation of the manuscript within the scientific project “Hydrological and geodetic analysis of the watercourse-second part”, UNIN-TEH-25-1-3, from 2025.

Conflicts of Interest

The authors declare no conflicts of interest.

Appendix A

Figure A1. Distance to urban areas (DTU) map for the study area in South Khorasan Province: Iran.
Water 17 01276 g0a1
Figure A2. Aspect (AS) map for the study area at South Khorasan Province, Iran.
Water 17 01276 g0a2
Figure A3. Distance to faults (DTF) map for the study area at South Khorasan Province, Iran.
Water 17 01276 g0a3

References

  1. Chaudhary, M.T.; Piracha, A. Natural Disasters—Origins, Impacts, Management. Encyclopedia 2021, 1, 1101–1131. [Google Scholar] [CrossRef]
  2. Naceur, A.; Igmoullan, B.; Namous, M. Machine Learning-Based Optimization of Flood Susceptibility Mapping in Semi-Arid Zone. DYSONA-Appl. Sci. 2025, 6, 145–159. [Google Scholar] [CrossRef]
  3. Parsian, S.; Amani, M.; Moghimi, A.; Ghorbanian, A.; Mahdavi, S. Flood Hazard Mapping Using Fuzzy Logic, Analytical Hierarchy Process, and Multi-Source Geospatial Datasets. Remote Sens. 2021, 13, 4761. [Google Scholar] [CrossRef]
  4. Akter, T.; Hoque, M.A.A.; Mukul, S.A.; Pradhan, B. Coastal Flood Induced Salinity Intrusion Risk Assessment Using a Spatial Multi-Criteria Approach in the South-Western Bangladesh. Earth Syst. Environ. 2024, 9, 31–49. [Google Scholar] [CrossRef]
  5. Choubin, B.; Moradi, E.; Golshan, M.; Adamowski, J.; Sajedi-Hosseini, F.; Mosavi, A. An Ensemble Prediction of Flood Susceptibility Using Multivariate Discriminant Analysis, Classification and Regression Trees, and Support Vector Machines. Sci. Total Environ. 2019, 651, 2087–2096. [Google Scholar] [CrossRef]
  6. Aerts, J.C.J.H. A Review of Cost Estimates for Flood Adaptation. Water 2018, 10, 1646. [Google Scholar] [CrossRef]
  7. Paudel, G.; Pant, R.R.; Joshi, T.R.; Saqr, A.M.; Ðurin, B.; Cetl, V.; Kamble, P.N.; Bishwakarma, K. Hydrochemical Dynamics and Water Quality Assessment of the Ramsar-Listed Ghodaghodi Lake Complex: Unveiling the Water-Environment Nexus. Water 2024, 16, 3373. [Google Scholar] [CrossRef]
  8. Saqr, A.M.; Nasr, M.; Fujii, M.; Yoshimura, C.; Ibrahim, M.G. Integrating MODFLOW-USG and Walrus Optimizer for Estimating Sustainable Groundwater Pumping in Arid Regions Subjected to Severe Drawdown. In Groundwater in Developing Countries; Ali, S., Negm, A., Eds.; Springer: Cham, Switzerland, 2025. [Google Scholar] [CrossRef]
  9. Ślósarczyk, K.; Dąbrowska, D. A closed municipal landfill as a source of emerging contaminants in adjacent groundwater: Pharmaceuticals and personal care products occurrence and environmental risk assessment. J. Hydrol. 2025, 654, 132829. [Google Scholar] [CrossRef]
  10. Noman, M.; Ullah, I.; Khan, M.A.; Qazi, A.; Farooq, W.; Saqr, A.; Elsheikh, A. Analysis of Overcurrent Protective Relaying as Minimum Adopted Fault Protection for Small-Scale Hydropower Plants. Int. J. Environ. Sci. Technol. 2024, 21, 4457–4470. [Google Scholar] [CrossRef]
  11. Abdo, H.G.; Darwish, K.S.; Bindajam, A.A.; Niknam, A.; Youssef, Y.M.; Ahmed, M.F.M.; Mallick, J. Detection of Flood Vulnerable Areas in Urban Basins Using Multi-Criteria Analysis and Geospatial Tools: A Case Study from Eastern Mediterranean. Environ. Earth Sci. 2024, 83, 524. [Google Scholar] [CrossRef]
  12. Timilsina, B.; Kharel, M.; Shrestha, R.; Saqr, A.M.; Pant, R.R. Assessment of Soil Quality along the Elevation Gradient of the Seti River Watershed in Pokhara Metropolitan City, Nepal. Environ. Monit. Assess. 2025, 197, 296. [Google Scholar] [CrossRef]
  13. Subbarayan, S.; Youssef, Y.M.; Singh, L.; Dąbrowska, D.; Alarifi, N.; Ramsankaran, R.A.A.J.; Visweshwaran, R.; Saqr, A.M. Soil and Water Assessment Tool-Based Prediction of Runoff Under Scenarios of Land Use/Land Cover and Climate Change Across Indian Agro-Climatic Zones: Implications for Sustainable Development Goals. Water 2025, 17, 458. [Google Scholar] [CrossRef]
  14. Masria, A.; Alshammari, T.O.; Ghareeb, M.; Seif, A.K.; Abd-Elmaboud, M.E.; Ammar, A.I. 2D and 3D Modeling of Resistivity and Chargeability to Identify the Type of Saturated Groundwater for Complex Sedimentary Facies. Hydrology 2024, 11, 120. [Google Scholar] [CrossRef]
  15. Afonso de Oliveira Serrão, E.; Silva, M.T.; Ferreira, T.R.; Paiva de Ataide, L.C.; Assis dos Santos, C.; Meiguins de Lima, A.M.; de Paulo Rodrigues da Silva, V.; de Assis Salviano de Sousa, F.; Cardoso Gomes, D.J. Impacts of Land Use and Land Cover Changes on Hydrological Processes and Sediment Yield Determined Using the SWAT Model. Int. J. Sediment Res. 2022, 37, 54–69. [Google Scholar] [CrossRef]
  16. Ali, S.A.; Khatun, R.; Ahmad, A.; Ahmad, S.N. Application of GIS-Based Analytic Hierarchy Process and Frequency Ratio Model to Flood Vulnerable Mapping and Risk Area Estimation at Sundarban Region, India. Model. Earth Syst. Environ. 2019, 5, 1083–1102. [Google Scholar] [CrossRef]
  17. Hodaei, A.; Feizi, V. Analysis of the Role of Dispersion of Rural Settlements against Natural Hazards in South Khorasan Province. Q. Sci. J. Rescue Relief 2021, 13, 202–213. [Google Scholar] [CrossRef]
  18. Bahramloo, R.; Wang, J.; Sepehri, M.; Faghfouri, A.; Ghermezcheshmeh, B.; Atapourfard, A.; Talebi, A.; Abbasi, D.; Bazrafshan, E. Novel MCDA Methods for Flood Hazard Mapping: A Case Study in Hamadan, Iran. Stoch. Environ. Res. Risk Assess. 2024, 38, 4863–4881. [Google Scholar] [CrossRef]
  19. Haseeb, F.; Ali, S.; Ahmed, N.; Alarifi, N.; Youssef, Y.M. Comprehensive Probabilistic Analysis and Practical Implications of Rainfall Distribution in Pakistan. Atmosphere 2025, 16, 122. [Google Scholar] [CrossRef]
  20. Sanderson, B.M.; Oleson, K.W.; Strand, W.G.; Lehner, F.; O’Neill, B.C. A New Ensemble of GCM Simulations to Assess Avoided Impacts in a Climate Mitigation Scenario. Clim. Change 2018, 146, 303–318. [Google Scholar] [CrossRef]
  21. Rincón, D.; Khan, U.T.; Armenakis, C. Flood Risk Mapping Using GIS and Multi-Criteria Analysis: A Greater Toronto Area Case Study. Geosciences 2018, 8, 275. [Google Scholar] [CrossRef]
  22. Lyu, H.M.; Yin, Z.Y.; Zhou, A.; Shen, S.L. MCDM-Based Flood Risk Assessment of Metro Systems in Smart City Development: A Review. Environ. Impact Assess. Rev. 2023, 101, 107154. [Google Scholar] [CrossRef]
  23. Xiao, Y.; Yi, S.; Tang, Z. Integrated Flood Hazard Assessment Based on Spatial Ordered Weighted Averaging Method Considering Spatial Heterogeneity of Risk Preference. Sci. Total Environ. 2017, 599–600, 1034–1046. [Google Scholar] [CrossRef] [PubMed]
  24. Ahmadizadeh, S.R.; Karimzadeh Motlagh, Z.; Ashrafi, A. Capability Evaluation of Ecotourism in Birjand County Based on Scenario Design and Fuzzy_Owa Algorithm. Environ. Res. J. 2016, 7, 31–46. [Google Scholar]
  25. Sathiyamurthi, S.; Youssef, Y.M.; Gobi, R.; Ravi, A.; Alarifi, N.; Sivasakthi, M.; Praveen Kumar, S.; Dąbrowska, D.; Saqr, A.M. Optimal Land Selection for Agricultural Purposes Using Hybrid Geographic Information System–Fuzzy Analytic Hierarchy Process–Geostatistical Approach in Attur Taluk, India: Synergies and Trade-Offs Among Sustainable Development Goals. Sustainability 2025, 17, 809. [Google Scholar] [CrossRef]
  26. Rafiei-Sardooi, E.; Azareh, A.; Choubin, B.; Mosavi, A.H.; Clague, J.J. Evaluating Urban Flood Risk Using Hybrid Method of TOPSIS and Machine Learning. Int. J. Disaster Risk Reduct. 2021, 66, 102614. [Google Scholar] [CrossRef]
  27. Wang, Y.; Hong, H.; Chen, W.; Li, S.; Pamučar, D.; Gigović, L.; Drobnjak, S.; Bui, D.T.; Duan, H. A Hybrid GIS Multi-Criteria Decision-Making Method for Flood Susceptibility Mapping at Shangyou, China. Remote Sens. 2019, 11, 62. [Google Scholar] [CrossRef]
  28. Timalsina, R.; Acharya, S.; Đurin, B.; Awasthi, M.P.; Pant, R.R.; Joshi, G.R.; Byanju, R.M.; Panthi, K.P.; Joshi, S.; Kumar, A.; et al. An Assessment of Seasonal Water Quality in Phewa Lake, Nepal, by Integrating Geochemical Indices and Statistical Techniques: A Sustainable Approach. Water 2025, 17, 238. [Google Scholar] [CrossRef]
  29. Ghasemkhani, N.; Vayghan, S.S.; Abdollahi, A.; Pradhan, B.; Alamri, A. Urban Development Modeling Using Integrated Fuzzy Systems, Ordered Weighted Averaging (OWA), and Geospatial Techniques. Sustainability 2020, 12, 809. [Google Scholar] [CrossRef]
  30. Fateminia, S.H.; Nguyen, P.H.D.; Fayek, A.R. An Adaptive Hybrid Model for Determining Subjective Causal Relationships in Fuzzy System Dynamics Models for Analyzing Construction Risks. CivilEng 2021, 2, 747–764. [Google Scholar] [CrossRef]
  31. Masria, A.; Seif, A.K.; Ghareeb, M.; Abd-Elmaboud, M.E.; Soliman, K.; Ammar, A.I. Numerical Modeling of Vadose Zone Electrical Resistivity to Evaluate Its Hydraulic Parameters. Appl. Water Sci. 2023, 13, 224. [Google Scholar] [CrossRef]
  32. Tang, Z.; Zhang, H.; Yi, S.; Xiao, Y. Assessment of Flood Susceptible Areas Using Spatially Explicit, Probabilistic Multi-Criteria Decision Analysis. J. Hydrol. 2018, 558, 144–158. [Google Scholar] [CrossRef]
  33. Saghafi, M. Evaluating and Classifying Restrictions and Hydrogeomorphic Hazards for Sustainable Urban Development Planning in Dry Areas (Case Study: Birjand, South Khorasan Province, Iran). Nat. Hazards 2018, 93, 219–236. [Google Scholar] [CrossRef]
  34. L3Harris. Available online: https://www.l3harris.com/all-capabilities/satellite-imagery?utm_source=google&utm_medium=cpc&utm_campaign=sas-ss-satellite-imagerysearch&gad_source=1&gclid=cjwkcaiajp-7bhbzeiwamh9rbsbkxngid5y9pcmk26wognarxa_o0kzy01tbursvskqhofljbtxkxocci4qavd_bwe (accessed on 15 February 2023).
  35. USGS Homepage. Available online: https://earthexplorer.usgs.gov/ (accessed on 25 April 2024).
  36. Esri. Available online: https://www.esri.com/en-us/arcgis/products/arcgis-location-platform/services/basemaps (accessed on 2 March 2021).
  37. Sarvestan, R.; Karami, M.; Sabbaghian, R.J. Assessment of the Weather Research and Forecasting Model in Simulation of Rainfall for Khorasan Razavi Province, Iran. Arab. J. Geosci. 2022, 15, 164. [Google Scholar] [CrossRef]
  38. FAO. Available online: https://wapor.apps.fao.org/catalog/wapor_2/1 (accessed on 15 February 2025).
  39. Kader, Z.; Islam, M.R.; Aziz, M.T.; Hossain, M.M.; Islam, M.R.; Miah, M.; Jaafar, W.Z.W. GIS and AHP-Based Flood Susceptibility Mapping: A Case Study of Bangladesh. Sustain. Water Resour. Manag. 2024, 10, 170. [Google Scholar] [CrossRef]
  40. Hassan Sayyari-Zahan, M. Soil Classification and Genesis in Part of Khorasan Province. In Developments in Soil Classification, Land Use Planning and Policy Implications: Innovative Thinking of Soil Inventory for Land Use Planning and Management of Land Resources; Springer: Dordrecht, The Netherlands, 2013; pp. 405–415. [Google Scholar] [CrossRef]
  41. Shirazi, A.; Hezarkhani, A.; Shirazy, A. Exploration Geochemistry Data-Application for Cu Anomaly Separation Based On Classical and Modern Statistical Methods in South Khorasan, Iran. Int. J. Sci. Eng. Appl. 2018, 7, 039–044. [Google Scholar] [CrossRef]
  42. Masoudi, M.; Yousefi, M.; Behbahani, N. Hazard Assessment of Climate Changes in South Khorasan Province, Iran. EQA-Int. J. Environ. Qual. 2018, 29, 29–39. [Google Scholar]
  43. Graf, M.; El Hachem, A.; Eisele, M.; Seidel, J.; Chwala, C.; Kunstmann, H.; Bárdossy, A. Rainfall Estimates from Opportunistic Sensors in Germany across Spatio-Temporal Scales. J. Hydrol. Reg. Stud. 2021, 37, 100883. [Google Scholar] [CrossRef]
  44. Saqr, A.M.; Nasr, M.; Fujii, M.; Yoshimura, C.; Ibrahim, M.G. Monitoring of Agricultural Expansion Using Hybrid Classification Method in Southwestern Fringes of Wadi El-Natrun, Egypt: An Appraisal for Sustainable Development. In Proceedings of the Asia Conference on Environment and Sustainable Development, Kyoto, Japan, 4–6 November 2023; Ujikawa, K., Ishiwatari, M., Hullebusch, E.V., Eds.; Springer: Singapore, 2023; pp. 349–362. [Google Scholar] [CrossRef]
  45. Shafizadeh-Moghadam, H.; Valavi, R.; Shahabi, H.; Chapi, K.; Shirzadi, A. Novel Forecasting Approaches Using Combination of Machine Learning and Statistical Models for Flood Susceptibility Mapping. J. Environ. Manag. 2018, 217, 1–11. [Google Scholar] [CrossRef]
  46. Lin, P.; Pan, M.; Wood, E.F.; Yamazaki, D.; Allen, G.H. A New Vector-Based Global River Network Dataset Accounting for Variable Drainage Density. Sci. Data 2021, 8, 28. [Google Scholar] [CrossRef] [PubMed]
  47. Chen, S.; Arrouays, D.; Mulder, V.L.; Poggio, L.; Minasny, B.; Roudier, P.; Libohova, Z.; Lagacherie, P.; Shi, Z.; Hannam, J.; et al. Digital Mapping of GlobalSoilMap Soil Properties at a Broad Scale: A Review. Geoderma 2022, 409, 115567. [Google Scholar] [CrossRef]
  48. Sepehri, M.; Malekinezhad, H.; Jahanbakhshi, F.; Ildoromi, A.R.; Chezgi, J.; Ghorbanzadeh, O.; Naghipour, E. Integration of Interval Rough AHP and Fuzzy Logic for Assessment of Flood Prone Areas at the Regional Scale. Acta Geophys. 2020, 68, 477–493. [Google Scholar] [CrossRef]
  49. Chamani, R.; Sadeghi, S.H.; Zare, S.; Shekohideh, H.; Mumzaei, A.; Amini, H.; Hemmati, L.; Zarei, R. Flood-Oriented Watershed Health and Ecological Security Conceptual Modeling Using Pressure, State, and Response (PSR) Approach for the Sharghonj Watershed, South Khorasan Province, Iran. Nat. Resour. Model. 2024, 37, e12385. [Google Scholar] [CrossRef]
  50. Mehrabi, M.; Moayedi, H. Landslide Susceptibility Mapping Using Artificial Neural Network Tuned by Metaheuristic Algorithms. Environ. Earth Sci. 2021, 80, 804. [Google Scholar] [CrossRef]
  51. Jamshed, A.; Birkmann, J.; Ahmad Rana, I.; Feldmeyer, D. The Effect of Spatial Proximity to Cities on Rural Vulnerability against Flooding: An Indicator Based Approach. Ecol. Indic. 2020, 118, 106704. [Google Scholar] [CrossRef]
  52. Dodangeh, E.; Choubin, B.; Eigdir, A.N.; Nabipour, N.; Panahi, M.; Shamshirband, S.; Mosavi, A. Integrated Machine Learning Methods with Resampling Algorithms for Flood Susceptibility Prediction. Sci. Total Environ. 2020, 705, 135983. [Google Scholar] [CrossRef]
  53. Aly, M.H.; Giardino, J.R.; Klein, A.G. Suitability Assessment for New Minia City, Egypt: A GIS Approach to Engineering Geology. Environ. Eng. Geosci. 2005, 11, 259–269. [Google Scholar] [CrossRef]
  54. Wani, M.A.; Shaista, N.; Wani, Z.M. Spatial Variability of Some Chemical and Physical Soil Properties in Bandipora District of Lesser Himalayas. J. Indian Soc. Remote Sens. 2017, 45, 611–620. [Google Scholar] [CrossRef]
  55. Saaty, T. The Analytic Hierarchy Process; McGraw Hill: New York, NY, USA, 1980. [Google Scholar]
  56. Arefin, R.; Rahman, A.T.M.S.; Das, J.; Jahan, C.S.; Mazumder, Q.H.; Gomaa, E.; Abd El Aal, A.K.; Radwan, A.E.; Youssef, Y.M. Megacity solid waste disposal suitability mapping in Dhaka, Bangladesh: An integrated approach using remote sensing, GIS and statistics. Environ Monit Assess. 2024, 196, 910. [Google Scholar] [CrossRef] [PubMed]
  57. Yin, S.; Li, J.; Liang, J.; Jia, K.; Yang, Z.; Wang, Y. Optimization of the Weighted Linear Combination Method for Agricultural Land Suitability Evaluation Considering Current Land Use and Regional Differences. Sustainability 2020, 12, 10134. [Google Scholar] [CrossRef]
  58. Goffi, A.; Stroppiana, D.; Brivio, P.A.; Bordogna, G.; Boschetti, M. Towards an Automated Approach to Map Flooded Areas from Sentinel-2 MSI Data and Soft Integration of Water Spectral Features. Int. J. Appl. Earth Obs. Geoinf. 2020, 84, 101951. [Google Scholar] [CrossRef]
  59. Yager, R.R. On Ordered Weighted Averaging Aggregation Operators in Multicriteria Decisionmaking. IEEE Trans. Syst. Man Cybern. 1988, 18, 183–190. [Google Scholar] [CrossRef]
  60. Motlagh, Z.K.; Sayadi, M.H. Siting MSW Landfills Using MCE Methodology in GIS Environment (Case Study: Birjand Plain, Iran). Waste Manag. 2015, 46, 322–337. [Google Scholar] [CrossRef]
  61. Gholami, F.; Li, Y.; Zhang, J.; Nemati, A. Quantitative Assessment of Future Environmental Changes in Hydrological Risk Components: Integration of Remote Sensing, Machine Learning, and Hydraulic Modeling. Water 2024, 16, 3354. [Google Scholar] [CrossRef]
  62. Jaskowiak, P.A.; Costa, I.G.; Campello, R.J.G.B. The Area under the ROC Curve as a Measure of Clustering Quality. Data Min. Knowl. Discov. 2022, 36, 1219–1245. [Google Scholar] [CrossRef]
  63. Souissi, D.; Souie, A.; Sebei, A.; Mahfoudhi, R.; Zghibi, A.; Zouhri, L.; Amiri, W.; Ghanmi, M. Flood Hazard Mapping and Assessment Using Fuzzy Analytic Hierarchy Process and GIS Techniques in Takelsa, Northeast Tunisia. Arab. J. Geosci. 2022, 15, 1405. [Google Scholar] [CrossRef]
  64. Mokhtari, E.; Mezali, F.; Abdelkebir, B.; Engel, B. Flood Risk Assessment Using Analytical Hierarchy Process: A Case Study from the Cheliff-Ghrib Watershed, Algeria. J. Water Clim. Change 2023, 14, 694–711. [Google Scholar] [CrossRef]
  65. Mohseni, U.; Agnihotri, P.G.; Pande, C.B.; Durin, B. Understanding the Climate Change and Land Use Impact on Streamflow in the Present and Future under CMIP6 Climate Scenarios for the Parvara Mula Basin, India. Water 2023, 15, 1753. [Google Scholar] [CrossRef]
  66. Mohseni, U.; Jat, P.K.; Siriteja, V. Multi-criteria analysis-based mapping of the cyclone-induced pluvial flooding in coastal areas of India. DYSONA-Appl. Sci. 2025, 6, 309–321. [Google Scholar] [CrossRef]
  67. Bashir, B.; Alsalman, A. Morpho-Hydrological Analysis and Preliminary Flash Flood Hazard Mapping of Neom City, Northwestern Saudi Arabia, Using Geospatial Techniques. Sustainability 2024, 16, 23. [Google Scholar] [CrossRef]
  68. Hasnaoui, Y.; Tachi, S.E.; Bouguerra, H.; Benmamar, S.; Gilja, G.; Szczepanek, R.; Navarro-Pedreño, J.; Yaseen, Z.M. Enhanced Machine Learning Models Development for Flash Flood Mapping Using Geospatial Data. Euro-Mediterr. J. Environ. Integr. 2024, 9, 1087–1107. [Google Scholar] [CrossRef]
  69. Cui, Y.; Yang, L.; Xu, C.; Zheng, J. Spatial Distribution of Shallow Landslides Caused by Typhoon Lekima in 2019 in Zhejiang Province, China. J. Mt. Sci. 2024, 21, 1564–1580. [Google Scholar] [CrossRef]
  70. Nguyen, H.D.; Nguyen, Q.H.; Dang, D.K.; Van, C.P.; Truong, Q.H.; Pham, S.D.; Bui, Q.T.; Petrisor, A.I. A Novel Flood Risk Management Approach Based on Future Climate and Land Use Change Scenarios. Sci. Total Environ. 2024, 921, 171204. [Google Scholar] [CrossRef]
  71. Huang, X.; Shen, J.; Li, S.; Chi, C.; Guo, P.; Hu, P. Sustainable Flood Control Strategies under Extreme Rainfall: Allocation of Flood Drainage Rights in the Middle and Lower Reaches of the Yellow River Based on a New Decision-Making Framework. J. Environ. Manag. 2024, 367, 122020. [Google Scholar] [CrossRef] [PubMed]
  72. Nkwunonwo, U.C.; Whitworth, M.; Baily, B. A Review of the Current Status of Flood Modelling for Urban Flood Risk Management in the Developing Countries. Sci. Afr. 2020, 7, e00269. [Google Scholar] [CrossRef]
  73. Mudashiru, R.B.; Sabtu, N.; Abustan, I.; Balogun, W. Flood Hazard Mapping Methods: A Review. J. Hydrol. 2021, 603, 126846. [Google Scholar] [CrossRef]
  74. Zabihi, O.; Siamaki, M.; Gheibi, M.; Akrami, M.; Hajiaghaei-Keshteli, M. A Smart Sustainable System for Flood Damage Management with the Application of Artificial Intelligence and Multi-Criteria Decision-Making Computations. Int. J. Disaster Risk Reduct. 2023, 84, 103470. [Google Scholar] [CrossRef]
  75. Majid, S.I.; Kumar, M.; Sahu, N.; Kumar, P.; Tripathi, D.K. Application of Ensemble Fuzzy Weights of Evidence-Support Vector Machine (Fuzzy WofE-SVM) for Urban Flood Modeling and Coupled Risk (CR) Index for Ward Prioritization in NCT Delhi, India. Environ. Dev. Sustain. 2024, 1–39. [Google Scholar] [CrossRef]
  76. Fraehr, N.; Wang, Q.J.; Wu, W.; Nathan, R. Assessment of Surrogate Models for Flood Inundation: The Physics-Guided LSG Model vs. State-of-the-Art Machine Learning Models. Water Res. 2024, 252, 121202. [Google Scholar] [CrossRef]
  77. Kolukula, S.S.; Murty, P.L.N. Enhancing Observations Data: A Machine-Learning Approach to Fill Gaps in the Moored Buoy Data. Results Eng. 2025, 26, 104708. [Google Scholar] [CrossRef]
  78. Yilmaz, M.U. Enhancing Sustainable Flood Risk Management Through a Novel Fuzzy Multi-Stakeholder Framework: Enhancing Sustainable Flood Risk Management through a Novel Fuzzy Multi-Stakeholder Framework: M. U. Yilmaz. Water Resour. Manag. 2024, 39, 1453–1480. [Google Scholar] [CrossRef]
  79. Hoang, D.V.; Liou, Y.A. Assessing the Influence of Human Activities on Flash Flood Susceptibility in Mountainous Regions of Vietnam. Ecol. Indic. 2024, 158, 111417. [Google Scholar] [CrossRef]
  80. Ahmed, I.; Das (Pan), N.; Debnath, J.; Bhowmik, M.; Bhattacharjee, S. Flood Hazard Zonation Using GIS-Based Multi-Parametric Analytical Hierarchy Process. Geosyst. Geoenviron. 2024, 3, 100250. [Google Scholar] [CrossRef]
  81. Banjara, M.; Bhusal, A.; Ghimire, A.B.; Kalra, A. Impact of Land Use and Land Cover Change on Hydrological Processes in Urban Watersheds: Analysis and Forecasting for Flood Risk Management. Geosciences 2024, 14, 40. [Google Scholar] [CrossRef]
  82. Ermagun, A.; Smith, V.; Janatabadi, F. High Urban Flood Risk and No Shelter Access Disproportionally Impacts Vulnerable Communities in the USA. Commun. Earth Environ. 2024, 5, 2. [Google Scholar] [CrossRef]
  83. Saqr, A.M.; Nasr, M.; Fujii, M.; Yoshimura, C.; Ibrahim, M.G. Optimal Solution for Increasing Groundwater Pumping by Integrating MODFLOW-USG and Particle Swarm Optimization Algorithm: A Case Study of Wadi El-Natrun, Egypt. In Proceedings of the International Conference on Environment Science and Engineering, ICESE 2022, Beijing, China, 2–5 September 2022; Chen, X., Ed.; Springer: Singapore, 2023; pp. 59–73. [Google Scholar] [CrossRef]
  84. Agache, I.; Sampath, V.; Aguilera, J.; Akdis, C.A.; Akdis, M.; Barry, M.; Bouagnon, A.; Chinthrajah, S.; Collins, W.; Dulitzki, C.; et al. Climate Change and Global Health: A Call to More Research and More Action. Allergy Eur. J. Allergy Clin. Immunol. 2022, 77, 1389–1407. [Google Scholar] [CrossRef] [PubMed]
  85. Udo, F.; Bhanye, J.; Daoudiallo, B.; Naidu, M. Evaluating the Sustainability of Local Women’s Climate Change Adaptation Strategies in Durban, South Africa: A Feminist Political Ecology and Intersectionality Perspective. Sustain. Dev. 2024, 1–16. [Google Scholar] [CrossRef]
  86. Bhowmik, D.; Kader, Z.; Hosen, B.; Hossain, S. Exploring socioeconomic vulnerability and natural disasters impacts on water access in Southwestern Bangladesh. DYSONA-Appl. Sci. 2025, 6, 186–199. [Google Scholar] [CrossRef]
  87. Mohajervatan, A.; Tavakoli, N.; Khankeh, H.; Raeisi, A.R.; Atighechian, G. Identifying Flood Response Experiences in Iranian Health System: A Qualitative Study. J. Flood Risk Manag. 2023, 16, e12932. [Google Scholar] [CrossRef]
  88. Mutch, C. The Role of Schools in Disaster Preparedness, Response and Recovery: What Can We Learn from the Literature? Pastor. Care Educ. 2014, 32, 5–22. [Google Scholar] [CrossRef]
  89. Moser, C.S. Communicating Climate Change: History, Challenges, Process and Future Directions. Wiley Interdiscip. Rev. Clim. Change 2010, 1, 31–53. [Google Scholar] [CrossRef]
  90. Mumtaz, M.; Jahanzaib, S.H.; Hussain, W.; Khan, S.; Youssef, Y.M.; Qaysi, S.; Abdelnabi, A.; Alarifi, N.; Abd-Elmaboud, M.E. Synergy of Remote Sensing and Geospatial Technologies to Advance Sustainable Development Goals for Future Coastal Urbanization and Environmental Challenges in a Riverine Megacity. ISPRS Int. J. Geo-Inf. 2025, 14, 30. [Google Scholar] [CrossRef]
Figure 1. Location map of the study area.
Water 17 01276 g001
Figure 2. Step-wise methodology of the current research study.
Water 17 01276 g002
Figure 3. Maps of controlling parameters affecting flood risk assessment in the study area: (a) Distance to rivers (DTR), (b) Rainfall (RF), (c) Slope (SL), (d) Land use/land cover (LU/LC), (e) Normalized difference vegetation index (NDVI), (f) Elevation (ELE), (g) Drainage density (DD), (h) Soil depth (SD), (i) Soil texture (ST), (j) Climate (CL), (k) Distance to roads (DTR), and (l) Distance to villages (DTV).
Water 17 01276 g003aWater 17 01276 g003b
Figure 4. Flood risk maps using the analytical hierarchy process (AHP)-weighted linear combination (WLC) method showing (a) flood hazard index (FHI) map and (b) classified map.
Water 17 01276 g004
Figure 5. Flood risk maps using the fuzzy ordered weighting average (FOWA) method for various scenarios: (a) Scenario 1 “At Least One”, (b) Scenario 2 “Few”, (c) Scenario 3 “Some”, (d) Scenario 4 “Half”, (e) Scenario 5 “Many”, (f) Scenario 6 “Most”, and (g) Scenario 7 “All”.
Water 17 01276 g005aWater 17 01276 g005b
Figure 6. The receiver operating characteristic (ROC) curve for the AHP-WLC model, illustrating its performance in predicting flood susceptibility with an area under the curve (AUC) value of 0.83. The red dashed line represents the baseline performance of a random classifier (AUC = 0.5).
Water 17 01276 g006
Figure 7. Emerging challenges due to flash floods in the study area.
Water 17 01276 g007
Figure 8. A heat map showing the quantitative contribution of the sustainable flood mitigation strategy (SFMS) to the three pillars of sustainability in the study area.
Water 17 01276 g008
Table 2. Pairwise comparison matrix of analytic hierarchy process (AHP) method according to the relative importance among the controlling factors of flash floods in the study area.
FactorDTRRFSLLU/LCNDVIELEDDSDSTCLDTDDTVDTUASDTF
DTR123456677888999
RF0.512345667788899
SL0.330.501234566778889
LU/LC0.250.330.50123456677888
NDVI0.200.250.330.5012345667788
ELE0.170.200.250.330.501234566778
DD0.170.170.200.250.330.50123456677
SD0.140.170.170.200.250.330.512345667
ST0.140.140.170.170.200.250.33330.51234566
CL0.130.140.140.170.170.200.250.330.5123456
DTD0.130.130.140.140.170.170.200.250.330.512345
DTV0.130.130.130.140.140.170.170.200.250.330.51234
DTU0.110.130.130.130.140.140.170.170.200.250.33330.5123
AS0.110.110.130.130.130.140.140.170.170.200.250.33330.512
DTF0.110.110.110.130.130.130.140.140.170.170.200.250.330.51
Note: DTR = Distance to rivers, RF = Rainfall, SL = Slope, LU/LC = Land use/land cover, NDVI = Normalized difference vegetation index, ELE = Elevation, DD = Drainage density, SD = Soil depth, ST = Soil texture, CL = Climate, DTD = Distance to road, DTV = Distance to villages, DTU = Distance to urban areas, AS = Aspect, and DTF = Distance to faults.
Table 3. Standard RI (random index) values based on the number of factors (n) [56].
n123456789101112131415
RI000.580.901.121.241.321.411.451.491.511.481.561.571.59
Table 4. Weights of controlling factors according to fuzzy ordered weighting average (FOWA) method for different α values.
α0.00010.10.512101000
Decision StrategyScenario 1: Maximum level of risk (No trade-off)Scenario 2: High level of risk (Some trade-off)Scenario 3: High level of risk (Some trade-off)Scenario 4: Average level of risk (Full trade-off)Scenario 5: Low level of risk (Some trade-off)Scenario 6: Low level of risk (Some trade-off)Scenario 7: Minimum level of risk (No trade-off)
Order weights
DTR0.0000.0010.0040.0080.0160.1451
RF0.00000.0040.0090.0180.1390
SL0.0000.0010.0050.0110.0210.1350
LU/LC0.00000.0070.0150.0290.1470
NDVI0.00000.0090.0190.0360.1330
ELE0.0000.0010.010.0210.0390.0980
DD0.0000.0010.0140.0270.0490.0770
SD0.0000.0020.0190.0360.0620.0520
ST0.0000.0020.0260.0490.0810.0280
CL0.0000.0040.0380.0670.1030.010
DTR0.00000.0510.0860.120.0020
DTV0.0000.0090.0720.1110.1320.0010
DTU0.0000.0140.10.1380.1300
AS0.0000.0280.1630.180.11300
DTF1.0000.9270.470.2210.04800
1.000111111
Note: α = degree of optimism or pessimism in the aggregation process, DTR = Distance to rivers, RF = Rainfall, SL = Slope, LU/LC = Land use/land cover, NDVI = Normalized difference vegetation index, ELE = Elevation, DD = Drainage density, SD = Soil depth, ST = Soil texture, CL = Climate, DTD = Distance to road, DTV = Distance to villages, DTU = Distance to urban areas, AS = Aspect, and DTF = Distance to faults.
Table 5. Factor weighting using the analytical hierarchy process (AHP)-weighted linear combination (WLC) method.
FactorOverlay Weight
South Khorasan Province, IranTakelsa, Northeast TunisiaCheliff-Ghrib Watershed, Algeria
DTR0.2210.160-
RF0.1800.1800.030
SL0.1390.2100.220
LU/LC0.1110.100-
NDVI0.086-0.020
ELE0.067-0.320
DD0.0490.1400.130
SD0.036--
ST0.0270.090-
CL0.021--
DTD0.019--
DTV0.015--
DTU0.012--
AS0.009--
DTF0.008--
TWI-0.0120.08
MNWI--0.05
LI--0.02
ReferenceCurrent study[63][64]
Note: DTR = Distance to rivers, RF = Rainfall, SL = Slope, LU/LC = Land use/land cover, NDVI = Normalized difference vegetation index, ELE = Elevation, DD = Drainage density, SD = Soil depth, ST = Soil texture, CL = Climate, DTR = Distance to roads, DTV = Distance to villages, DTU = Distance to urban areas, AS = Aspect, DTF = Distance to faults, TWI = Topographic wetness index, MNWI = Modified normalized water index, and LI = Lithology.
Table 6. The class percentages of different susceptibility risk maps, deduced from the analytical hierarchy process (AHP)-weighted linear combination (WLC), and fuzzy ordered weighting average (FOWA) methods.
MethodArea of Class (%)
Very LowLowModerateHighVer High
AHP-WLC10.2323.1429.6117.5419.48
FOWAFirst scenario0.030.080.630.4698.80
Second scenario41.450.090.618.4949.36
Third scenario0.204.4911.1477.626.55
Fourth scenario1.0921.7348.5228.050.61
Fifth scenario12.3258.4123.465.810.00
Sixth scenario41.9745.5510.311.890.28
Seventh scenario96.740.120.100.472.57
Table 7. Overall accuracy (OA) percentages for validating different scenarios of the fuzzy ordered weighting average (FOWA) method in the study area.
Scenario1234567
OA (%)69.7863.7272.318778.7769.5966.6
Disclaimer/Publisher’s Note: The statements, opinions and data contained in all publications are solely those of the individual author(s) and contributor(s) and not of MDPI and/or the editor(s). MDPI and/or the editor(s) disclaim responsibility for any injury to people or property resulting from any ideas, methods, instructions or products referred to in the content.

