Article

Illuminating the Impact of a Floating Photovoltaic System on a Shallow Drinking Water Reservoir: The Emergence of Benthic Cyanobacteria

1
Department of Technology and Source Protection, Evides Waterbedrijf, P.O. Box 4472, 3006 AL Rotterdam, The Netherlands
2
AqWa Ecologisch Advies, Simone Veilhof 9, 4463 JA Goes, The Netherlands
3
D2O—Duurzaam Drinkwater, Veenenburg 76, 2804 WZ Gouda, The Netherlands
4
Department of Environmental Technology, Wageningen University, Bornse Weilanden 9, 6708 WG Wageningen, The Netherlands
*
Author to whom correspondence should be addressed.
Water 2025, 17(8), 1178; https://doi.org/10.3390/w17081178
Submission received: 5 March 2025 / Revised: 4 April 2025 / Accepted: 6 April 2025 / Published: 15 April 2025
(This article belongs to the Section Water Quality and Contamination)

Abstract

:
Floating photovoltaic (FPV) systems can play an important role in energy transition. Yet, so far, not much is known about the effects of FPV systems on water quality and ecology. A sun-tracking FPV system (24% coverage) was installed on a shallow drinking water reservoir. We observed for the first time that benthic cyanobacteria (blue-green algae), which can deteriorate water quality, developed massively under the FPV system, while macrophytes and benthic algae, such as Chara (stonewort), mostly disappeared. Calculations of light availability explain this shift. The natural mixing of the water column was hardly affected, and the average temperature of the reservoir was not altered significantly. Biofouling of the water-submerged part of the FPV system consisted mostly of a massive attachment of Dreissena mussels, which affected water quality. Water bird numbers and concentrations of faecal bacteria were similar after the installation of the FPV system. Especially in shallow, transparent water bodies, there is a significant risk of FPV systems promoting the growth of undesirable benthic cyanobacteria. Overall, these new insights can aid water managers and governmental institutions in assessing the risks of FPV systems on water quality and the ecology of inland waters.

Graphical Abstract

1. Introduction

The application of floating photovoltaic (FPV) systems is part of the energy transition, with an estimated global potential of 400 GWp [1]. FPV systems covering only 27% of identified suitable water bodies could produce almost 10% of the current national power generation of the USA [2]. For the Netherlands, the Solar Energy Application Centre (SEAC) expects that about 24 GWp of FPV systems will be needed on inland waters and 45 GWp on the North Sea in order to reach national goals for renewable energy [3]. The deployment of FPV systems has grown strongly over the last 15 years, with over 2.6 GW of installed capacity globally as of August 2020 and an anticipated annual growth rate of 20% by 2025 [4]. Asia is expected to account for roughly two-thirds of global demand.
Solar panels come in a variety of shapes and types and are mainly mono- and polycrystalline silicon-based for land use [5]. These solar panels are also commonly used in FPV systems. FPV consists of PV modules that are commonly attached to an anchored floating platform that is placed on the water surface. FPV is applied at different coverages of the water surface. The advantages of FPV systems are as follows: the possibility of higher yields [6,7,8], decreased evaporation [7,9], the possibility of decreased algal growth [10,11], no competition with land use [12], and a lower carbon footprint [13]. The disadvantages include higher costs, irregular energy generation, faster aging [14], the possibility of leaching of heavy metals [15,16,17], and possible effects on water quality and ecology.
Yet, until now, not much is known about how FPV systems affect the quality of inland water bodies [18,19,20], and even less is known about the effects on the water quality of water storage reservoirs used for drinking water production. Blocking wind could affect the mixing of the water column. The appearance of stratification or the introduction of stronger or longer stratification will generally negatively affect water quality. Warm top layers can stimulate the development of cyanobacterial blooms [21], and when the lower part of the water column becomes anoxic, the risk arises that, for example, metals and phosphorus may be released from the sediment, enhancing eutrophication [22]. The introduction of an area with shading and sheltering can affect many organisms in the water, including photosynthetic organisms. The introduction of an FPV system decreases the depth of the euphotic zone. The euphotic zone is often described as the zone in which sufficient light energy is available to support net photosynthetic growth. Different photosynthetic organisms have different minimal light requirements, and organisms that require higher light intensities to sustain growth might be affected more by FPV systems. Understanding changes to photosynthetic organisms by FPV systems is especially vital because they are primary producers. Moreover, climate change, in particular rising temperatures and CO2 concentrations, is predicted to benefit especially harmful cyanobacteria [23], and it is important to understand whether FPV systems can counter these effects locally by cooling the water or introducing shading. The effect on harmful cyanobacteria also has implications for recreation and drinking water production because cyanobacteria can often produce toxins and unwanted taste and odour compounds.
Some effects of FPV systems have been predicted and/or modelled [10,11,20], while some other effects have been measured, such as a threefold decrease in plant biomass below FPV pilots [8] and the formation of biofouling on an FPV system in contact with water [19]. The effects of a diverse range of water quality and ecology parameters have not been reported or measured at full scale. Because of the significant interest in FPV systems, there is a great need for this type of data, particularly by water managers, including drinking water companies and governmental institutions.
The aim of our study was to investigate the effects of an FPV system (24% coverage) on the raw water quality and ecology of a shallow water storage reservoir for drinking water production. The results of up to 2.5 years of monitoring after installation of a sun-tracking FPV system are presented and discussed. Our study focuses mainly on the effects of the FPV system on photosynthetic organisms, including benthic vegetation and phytoplankton, and on the effects of biofouling and changes in water temperature. However, in order to provide a more complete overview of the potential effects of FPV systems, the study also investigates the effects on zooplankton, macroinvertebrates, numbers of water birds, concentrations of faecal bacteria, and leaching of metals and metalloids. Our study shows that the application of the FPV systems on shallow water bodies can cause a shift from macrophytes and benthic green algae to benthic cyanobacteria below the FPV system, which can deteriorate water quality.

2. Materials and Methods

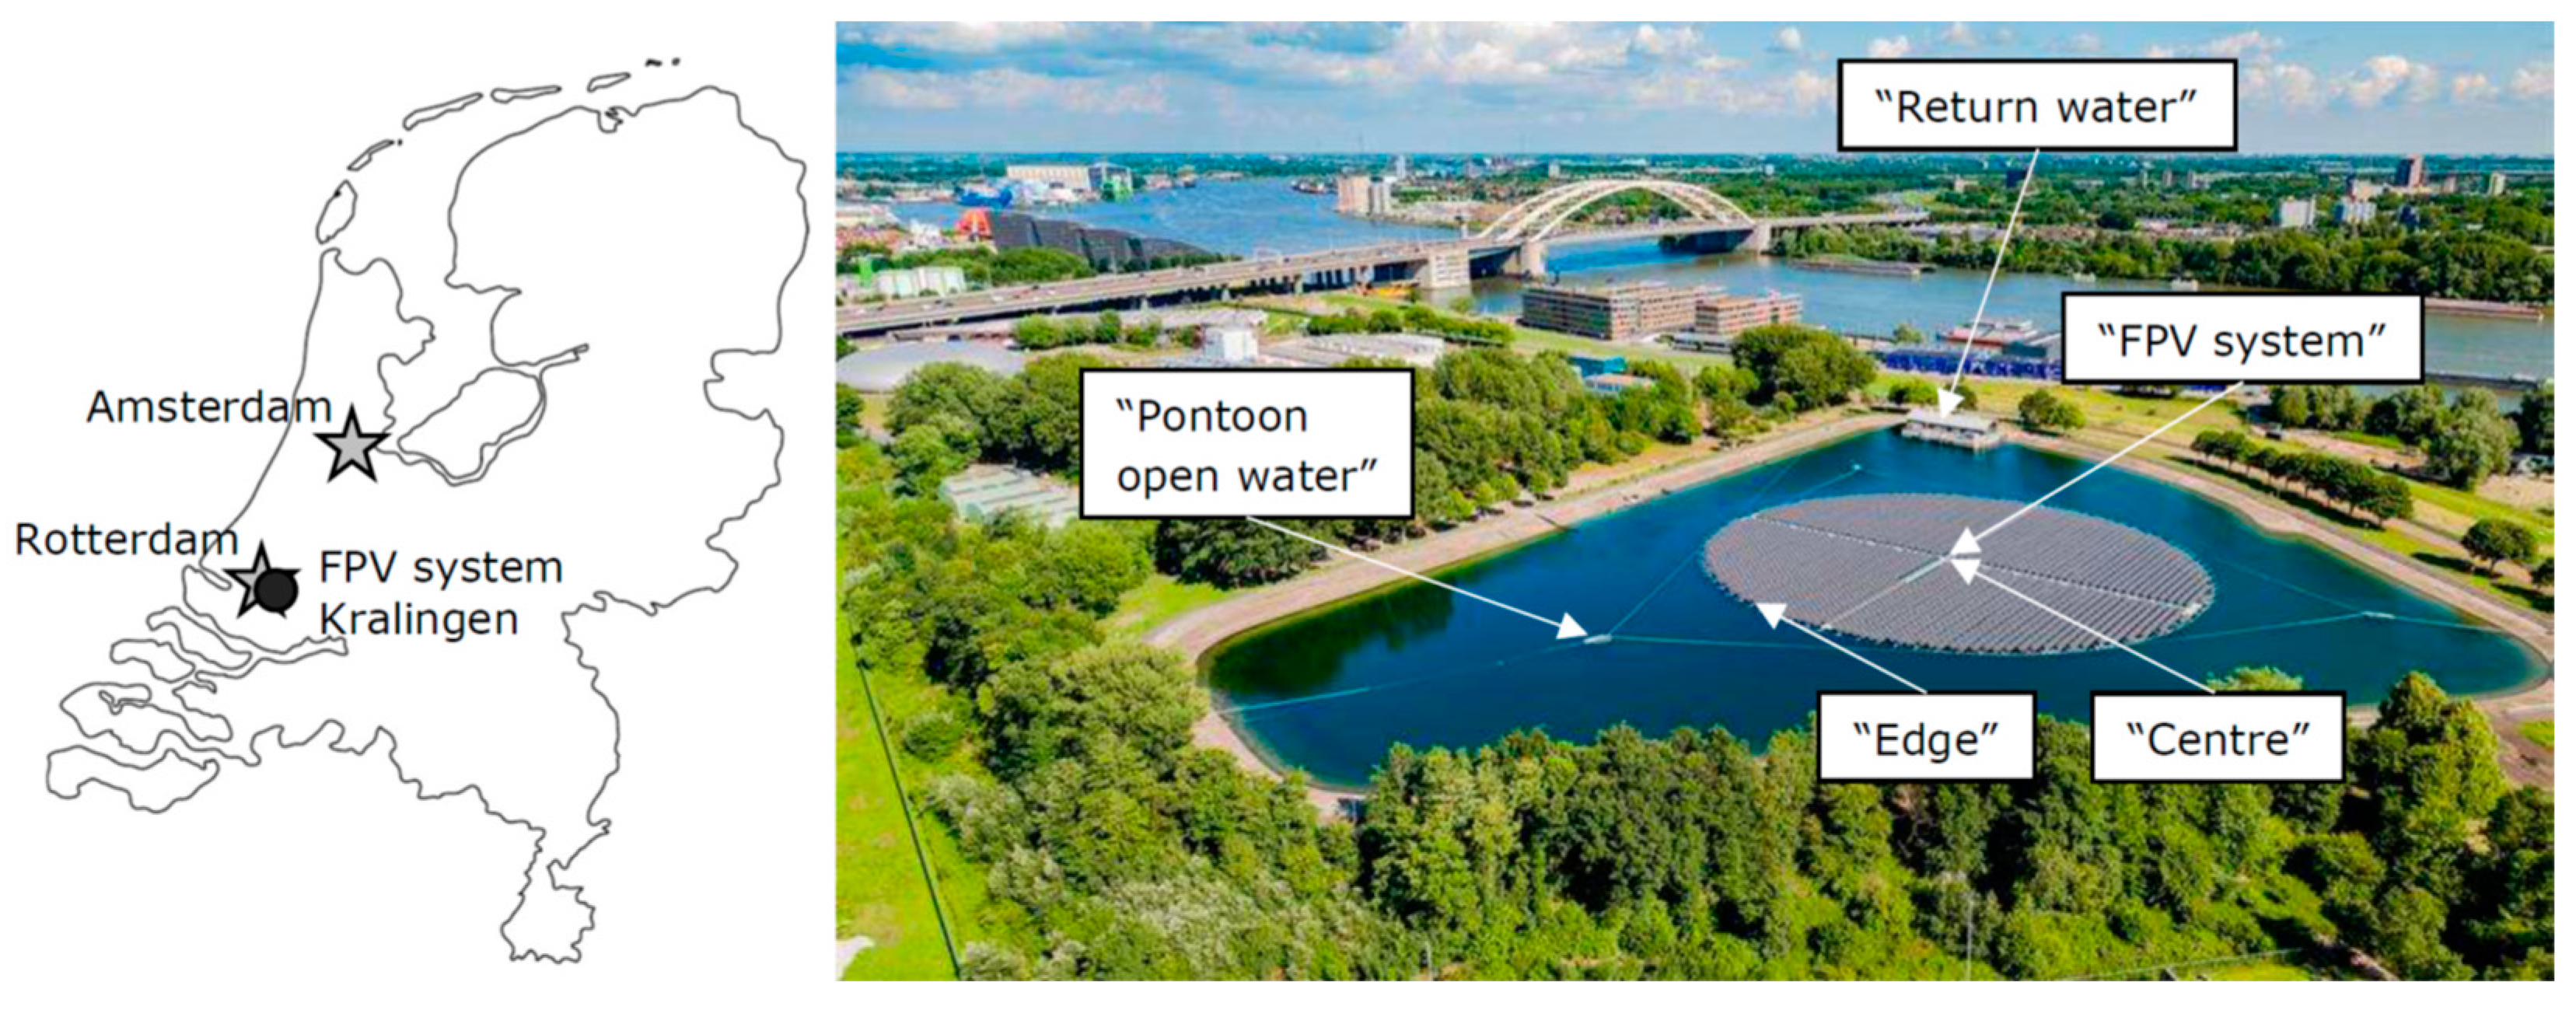
2.1. Local Kralingen Reservoir (Shallow Reservoir)

The Kralingen drinking water production plant (Rotterdam, The Netherlands) is supplied with water originating from the River Meuse (see Supplementary Materials for details). A shallow water storage reservoir is located next to the plant (51°54′21.6″ N 4°31′55.6″ E). The surface area of the reservoir is 4.0 ha, the maximum depth is 3.5 m, and the water volume of the local reservoir of Kralingen is approximately 0.072 Mm3. The bottom of the reservoir is covered with bitumen and topped with 0.5 m of sand. Water returned from the production process is supplied to the east side of the reservoir. Fish are present in the reservoir (such as gobies), but they were not studied in detail. The pH of the reservoir is 8.5–9.8, and the DOC concentration is around 4 mg L−1 C. Under normal conditions, water from the local reservoir is reused in the production plant, providing approximately 3% (120 m3 h−1) of the total water flow rate at the low-pressure pumps of the plant. Hence, the water from the local reservoir hardly has an effect on the water quality of the raw water supplied to the drinking water production plant. This made the local reservoir ideal for studying the application of an FPV system in a practical situation.

2.2. Sun-Tracking Floating Photovoltaic System

In March 2020, a sun-tracking FPV system (Floating Solar B.V., Rhenen, The Netherlands) was locally assembled and installed on the Kralingen reservoir. Construction finished around 1 April 2020. The FPV system has a circular shape and covers 0.95 ha (24% of the surface area of the reservoir, Figure 1).
To boost energy production, the FPV system turns during the day via a winch system to follow the path of the sun. The photovoltaic modules (type Trina Solar Honey TSM, 340 Wp) are placed at a relatively steep angle (30°) and feature sharp ridges at the top to repel birds. In between the rows of photovoltaic modules, there is an open space through which direct sunlight can reach the water. The width of the area of water between each row with PV panels that is exposed to direct sunlight depends on the position of the sun: the higher the sun, the more direct light can reach the water in between the rows of photovoltaic modules. Mid-June, when the sun is at its highest position in the sky mid-day (61.5° at the shallow reservoir), approximately 32% of the surface water below the FPV system is exposed to direct sunlight. In autumn and winter, hardly any direct sunlight reaches the surface water below the FPV system. The FPV system has a peak power of 1.00 MWp. The sampling points used to study the effects on the water quality and ecology are indicated in Figure 1. “Pontoon open water” is located approximately 35 m from the edge of the FPV system and is fully exposed to wind and light. The sampling point “FPV system” is at the centre of the FPV system, and the distances to “Pontoon open water” and the edge of the system are 90 and 55 m, respectively. “Return water” is water from the southeast edge of the reservoir that is pumped (returned) to the treatment plant. This study compares data from before the FPV system was installed with data after installation (parameters: benthic vegetation, macroinvertebrates, faecal bacteria, birds, and temperature), as well as data from the shallow reservoir with the FPV system with the Petrusplaat reference reservoir (parameters: mussels, metals, and metalloids). See Supplementary Materials for further details on the Petrusplaat reservoir, which does not contain an FPV system. To evaluate whether local differences in parameters can arise in the Kralingen reservoir, for example, by reduced wind and light under the FPV, we compared data from “Pontoon open water” with “FPV system” (parameters included benthic vegetation, macroinvertebrates, phytoplankton, zooplankton, oxygen, and temperature). Although the FPV system can potentially also impact the water quality and ecology of the open water, the distance between these two sampling points is considered sufficient to evaluate if local differences can arise. Further information about the FPV system, including the increased energy yield by the sun-tracking mechanism, as well as weather data from the study period, can be obtained from the Supplementary Materials.

2.3. Diving Inspections

Five inspections were carried out by SCUBA divers from Aqualab Zuid B.V. (AQZ; Werkendam, The Netherlands): one before (10 July 2019) and four after the installation of the FPV system (30 July 2020, 10 March 2021, 29 July 2021, and 26 July 2022). The coverage of macrophytes, benthic algae, and benthic cyanobacteria growing on the sediment was estimated. The coverage indicates the percentage of a specific part of the reservoir bottom that is covered with a specific benthic photosynthetic organism. When the sum of the coverage of the benthic photosynthetic organisms is lower than 100%, it means that part of the sediment was not covered. Samples of the benthic photosynthetic organism were identified to species level using M205C (magnification 160×), Diaplan (magnification 400×), and DMI4000B (magnification 630×) microscopes (Leica, Wetzler, Germany). The bottom of the open water was inspected at different depths, including at the same depth as under the FPV system. The bottom under the FPV system was monitored at the edge and at the centre of the FPV system. The biofouling on the floaters of the FPV system was monitored as well. In addition, Dreissena mussels, macroinvertebrates, taste and odour compounds, and cyanotoxins were analysed (see Supplementary Materials for details). Taste and odour compounds were sampled at the middle of the water column under the centre of the FPV system and just above benthic cyanobacterial mats that were detected under the FPV system.

2.4. Nutrients, Phytoplankton, and Zooplankton

All water samples for nutrients, phytoplankton, and zooplankton analyses consisted of a mixture of water samples from different depths using a Ruttner water sampler (Hydro-Bios, Kiel, Germany): surface, 1, 2, and 3 m depth. The analyses were performed on water samples collected at the sampling points “Pontoon open water” and “FPV system” (Figure 1). All analyses from July 2020 to October 2022 were carried out by the accredited laboratory AQZ (Werkendam, The Netherlands) (see Supplementary Materials for details).

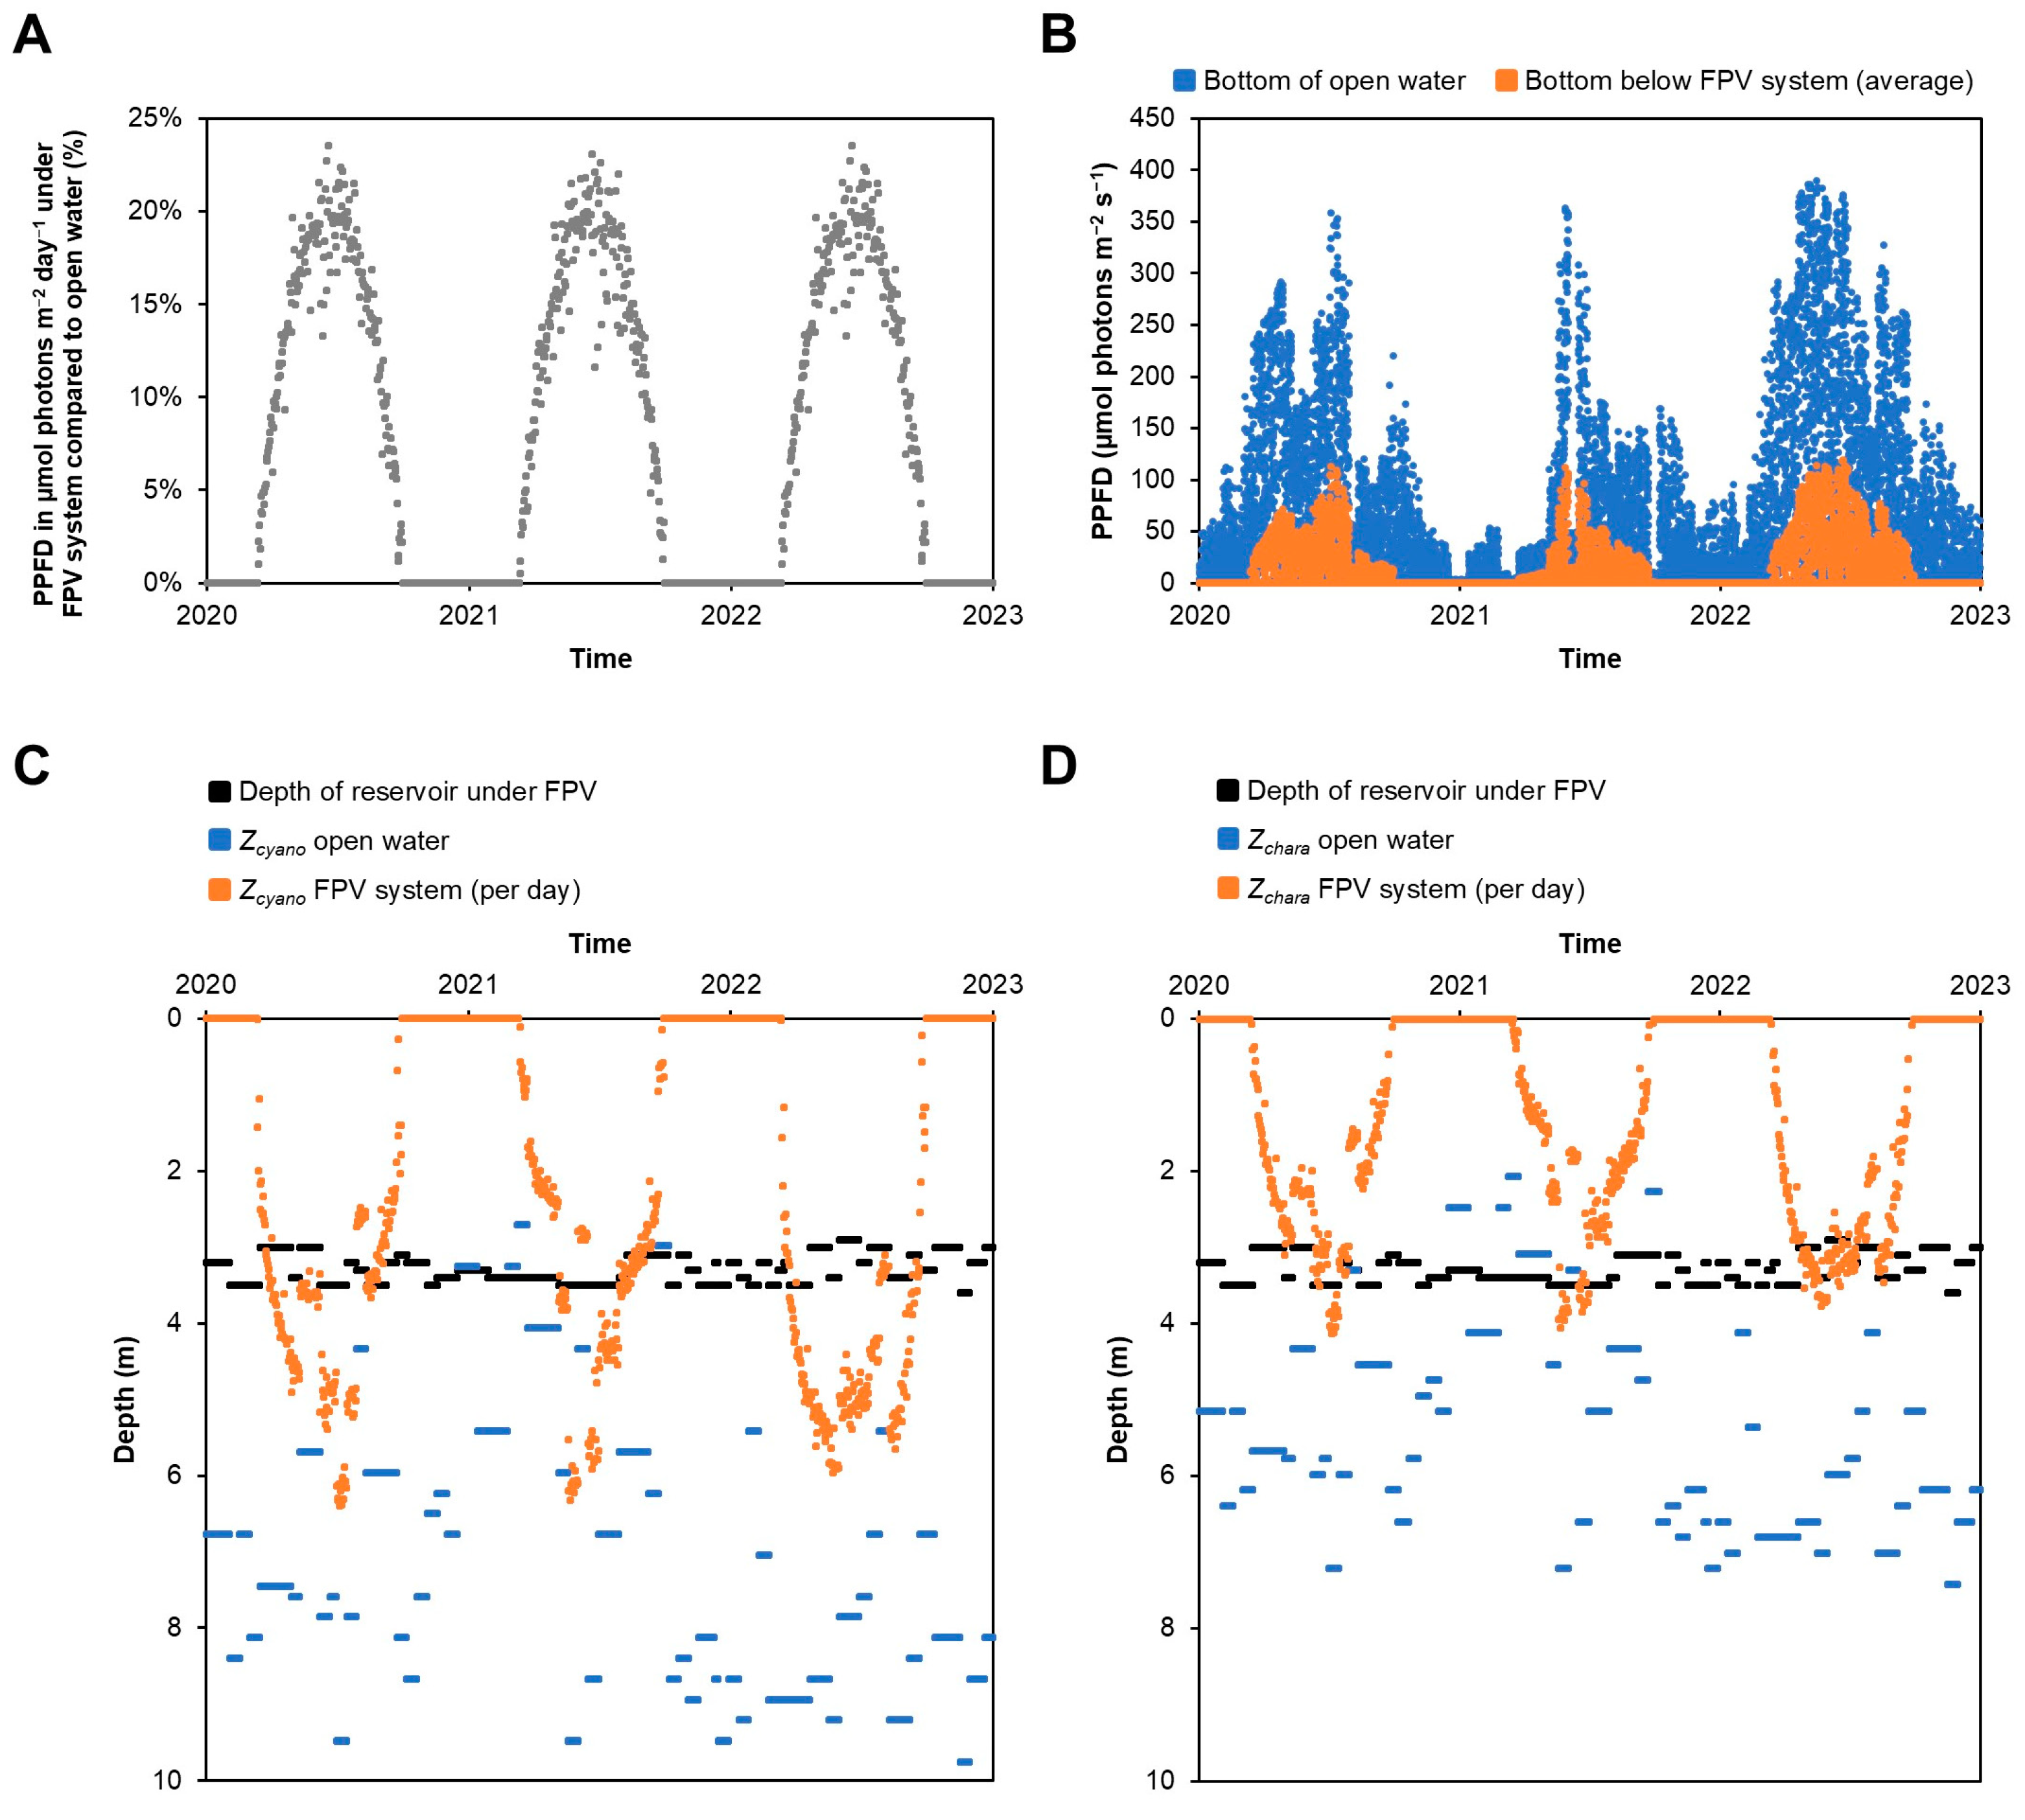
2.5. Field Measurements: Temperature, Oxygen, Secchi Disk Depth, and Light

Field measurements and sampling were performed by AQZ. Temperature and oxygen in the water column were measured during daytime with a WTW A925-P sensor connected to a WTW multimetre 3510 IDS (Xylem, Weilheim, Germany). Measurements were performed 10 cm below the surface, every 0.5 m of the water column, and 10 cm above the sediment. Secchi disk (Hydro-Bios, Kiel, Germany) measurements were performed to estimate transparency. From July 2020 to October 2022, the field measurements were generally performed once every two weeks at the sampling points “Pontoon open water” and “FPV system” (Figure 1). Before that period, the measurements were performed at the “Return water” sampling point. On 11 August 2022, light (Photosynthetically Active Radiation, PAR) profiles were made using an EXO2 multiparameter water quality sonde (YSI, Yellow Springs, OH, USA) with an external PAR system (LI-COR, Lincoln, NE, USA).

2.6. Calculations of Light at Bottom of Reservoir and Euphotic Zone

Global solar radiation (Q) data, reported as a sum per hour, was collected at The Hague Airport by the Dutch Royal Meteorological Institute (KNMI; weather station #344), located approximately 8.5 km from the Kralingen reservoir. After conversion of the data from J cm−2 to W m−2, the data were converted to Photosynthetic Photon Flux Density (PPFD, in µmol photons m−1 s−1) using the conversion factor 1/0.219 and assuming the amount of Photosynthetically Active Radiation (PAR) of the global radiation is 50% [24]:
PPFDsurface = Q × (10000/3600) × (1/0.219) × (0.5).
The Secchi disk depth (Zsd) data was used to calculate the corresponding light extinction coefficients (k in m−1) as follows, assuming the water body is colourless [25]:
k = 1.7/Zsd.
In some cases, the Secchi disk depth could have been slightly higher than the depth of the reservoir (Supplementary Materials, Figure S28). Yet, for those cases, we assumed the Secchi disk depth was similar to the depth of the reservoir.
The PPFD at the bottom of the reservoir in open water was calculated for each hour in 2020–2022 using the following:
PPFDbottom = PPFDsurface × e(−k×Zbottom) × (1 − Runpol).
where Runpol is the fraction of unpolarised light and Zbottom is the depth of the shallow reservoir. To calculate the refraction angles for different sun angles (assuming a flat water surface), Snell’s law was used. To calculate the refractions of s-polarized (Rs) and p-polarized light (Rp), the Fresnel equations were used, assuming an index of refraction (IOR) of 1.00 for air and 1.33 for water. Runpol is defined as the average of Rs and Rp.
Based on the dimensions of the FPV system, the amount of direct light reaching the water surface in between rows of PV panels was calculated for different sun angles (for each hour in 2020–2022) for the entire FPV system. The fractions of direct light at the surface of the water at the FPV system, compared to open water in combination with the above equations, were used to calculate the average amount of PPFD at the bottom of the reservoir under the FPV system.
By definition, the euphotic zone extends from the surface to the depth at which the light intensity is 1% of that at the surface. In our study, we defined 1% of surface PPFD (the euphotic depth) as the lower limit for cyanobacterial growth. We assumed 3% of surface PPFD is the lower limit for growth of Chara based on [26], although the exact lower limit for the present Chara and macrophyte species was unknown.
The depths (Z) at which there is only 1% (for cyanobacteria) or 3% (for Chara and macrophytes) of surface PPFD were calculated using the following, respectively:
Zcyano = Ln(I0/Ic)/k = Ln(100/1)/k,
ZChara = Ln(I0/Ic)/k = Ln(100/3)/k,
where I0 is the light intensity at the surface, and Ic is the light intensity at compensation depth.

2.7. Metals and Metalloids

Leaching experiments were carried out beforehand [27]. Measurements of aluminium, cadmium, chromium, copper, lead, manganese, nickel, zinc, arsenic, and boron were taken during June–October 2020 and August–October 2021 to verify that the concentrations of metals and metalloids (arsenic and boron) in the presence of the full-scale installation on the local reservoir stayed below their water quality threshold values for surface water used for drinking water production. The water samples were taken at sampling point “Return water” (Figure 1) and analysed using Inductively Coupled Plasma–Mass Spectrometry (ICP-MS, iCAP-RQ Thermo Fisher Scientific, Waltham, MA, USA) by AQZ. In addition, these elements were also analysed at the Petrusplaat reference reservoir (one or more measurements each month continuously).

2.8. Birds, Bird Droppings, and Faecal Bacteria

Birds on and directly around the shallow reservoir were counted by Bureau Stadsnatuur (Rotterdam, The Netherlands) from 1999–2010 during winter and by Natuur-Wetenschappelijk Centrum (Dordrecht, The Netherlands) from March 2014 to February 2015 and November 2019 to April 2021 (weekly). The birds were counted using binoculars during daytime, usually 9:30–10:30 AM. Bird droppings on the FPV system were monitored by manual inspections and camera pictures.
Faecal indicator bacteria were analysed weekly from January 2016 onwards by AQZ in water samples taken at sampling point “Return water” (Figure 1). The analyses of bacteria from the coli group, including E. coli, enterococci, and intestinal enterococci, consisted of membrane filtration, culturing, and counting using Dutch standard methods [28,29].

2.9. Data Analysis

Statistics were performed using Jamovi 2.3.13.0. For the statistical analysis of the results of temperature, metals and metalloids, bird counts, and concentrations of faecal bacteria, the non-parametric Mann–Whitney U test was used because the data were non-normally distributed, and in addition, the data for faecal bacteria were zero-inflated. A one-way Welsh’s ANOVA with the Games–Howell post hoc test was applied for statistical analysis of the condition indices of mussels. The specific data of the mussels followed normal distributions, but a Welch’s ANOVA with the Games–Howell post hoc test was used to account for the violation of the homogeneity of variances. Heatmaps of temperature and oxygen data were made using the Data Ocean Viewer software version 5.6.2.

3. Results and Discussion

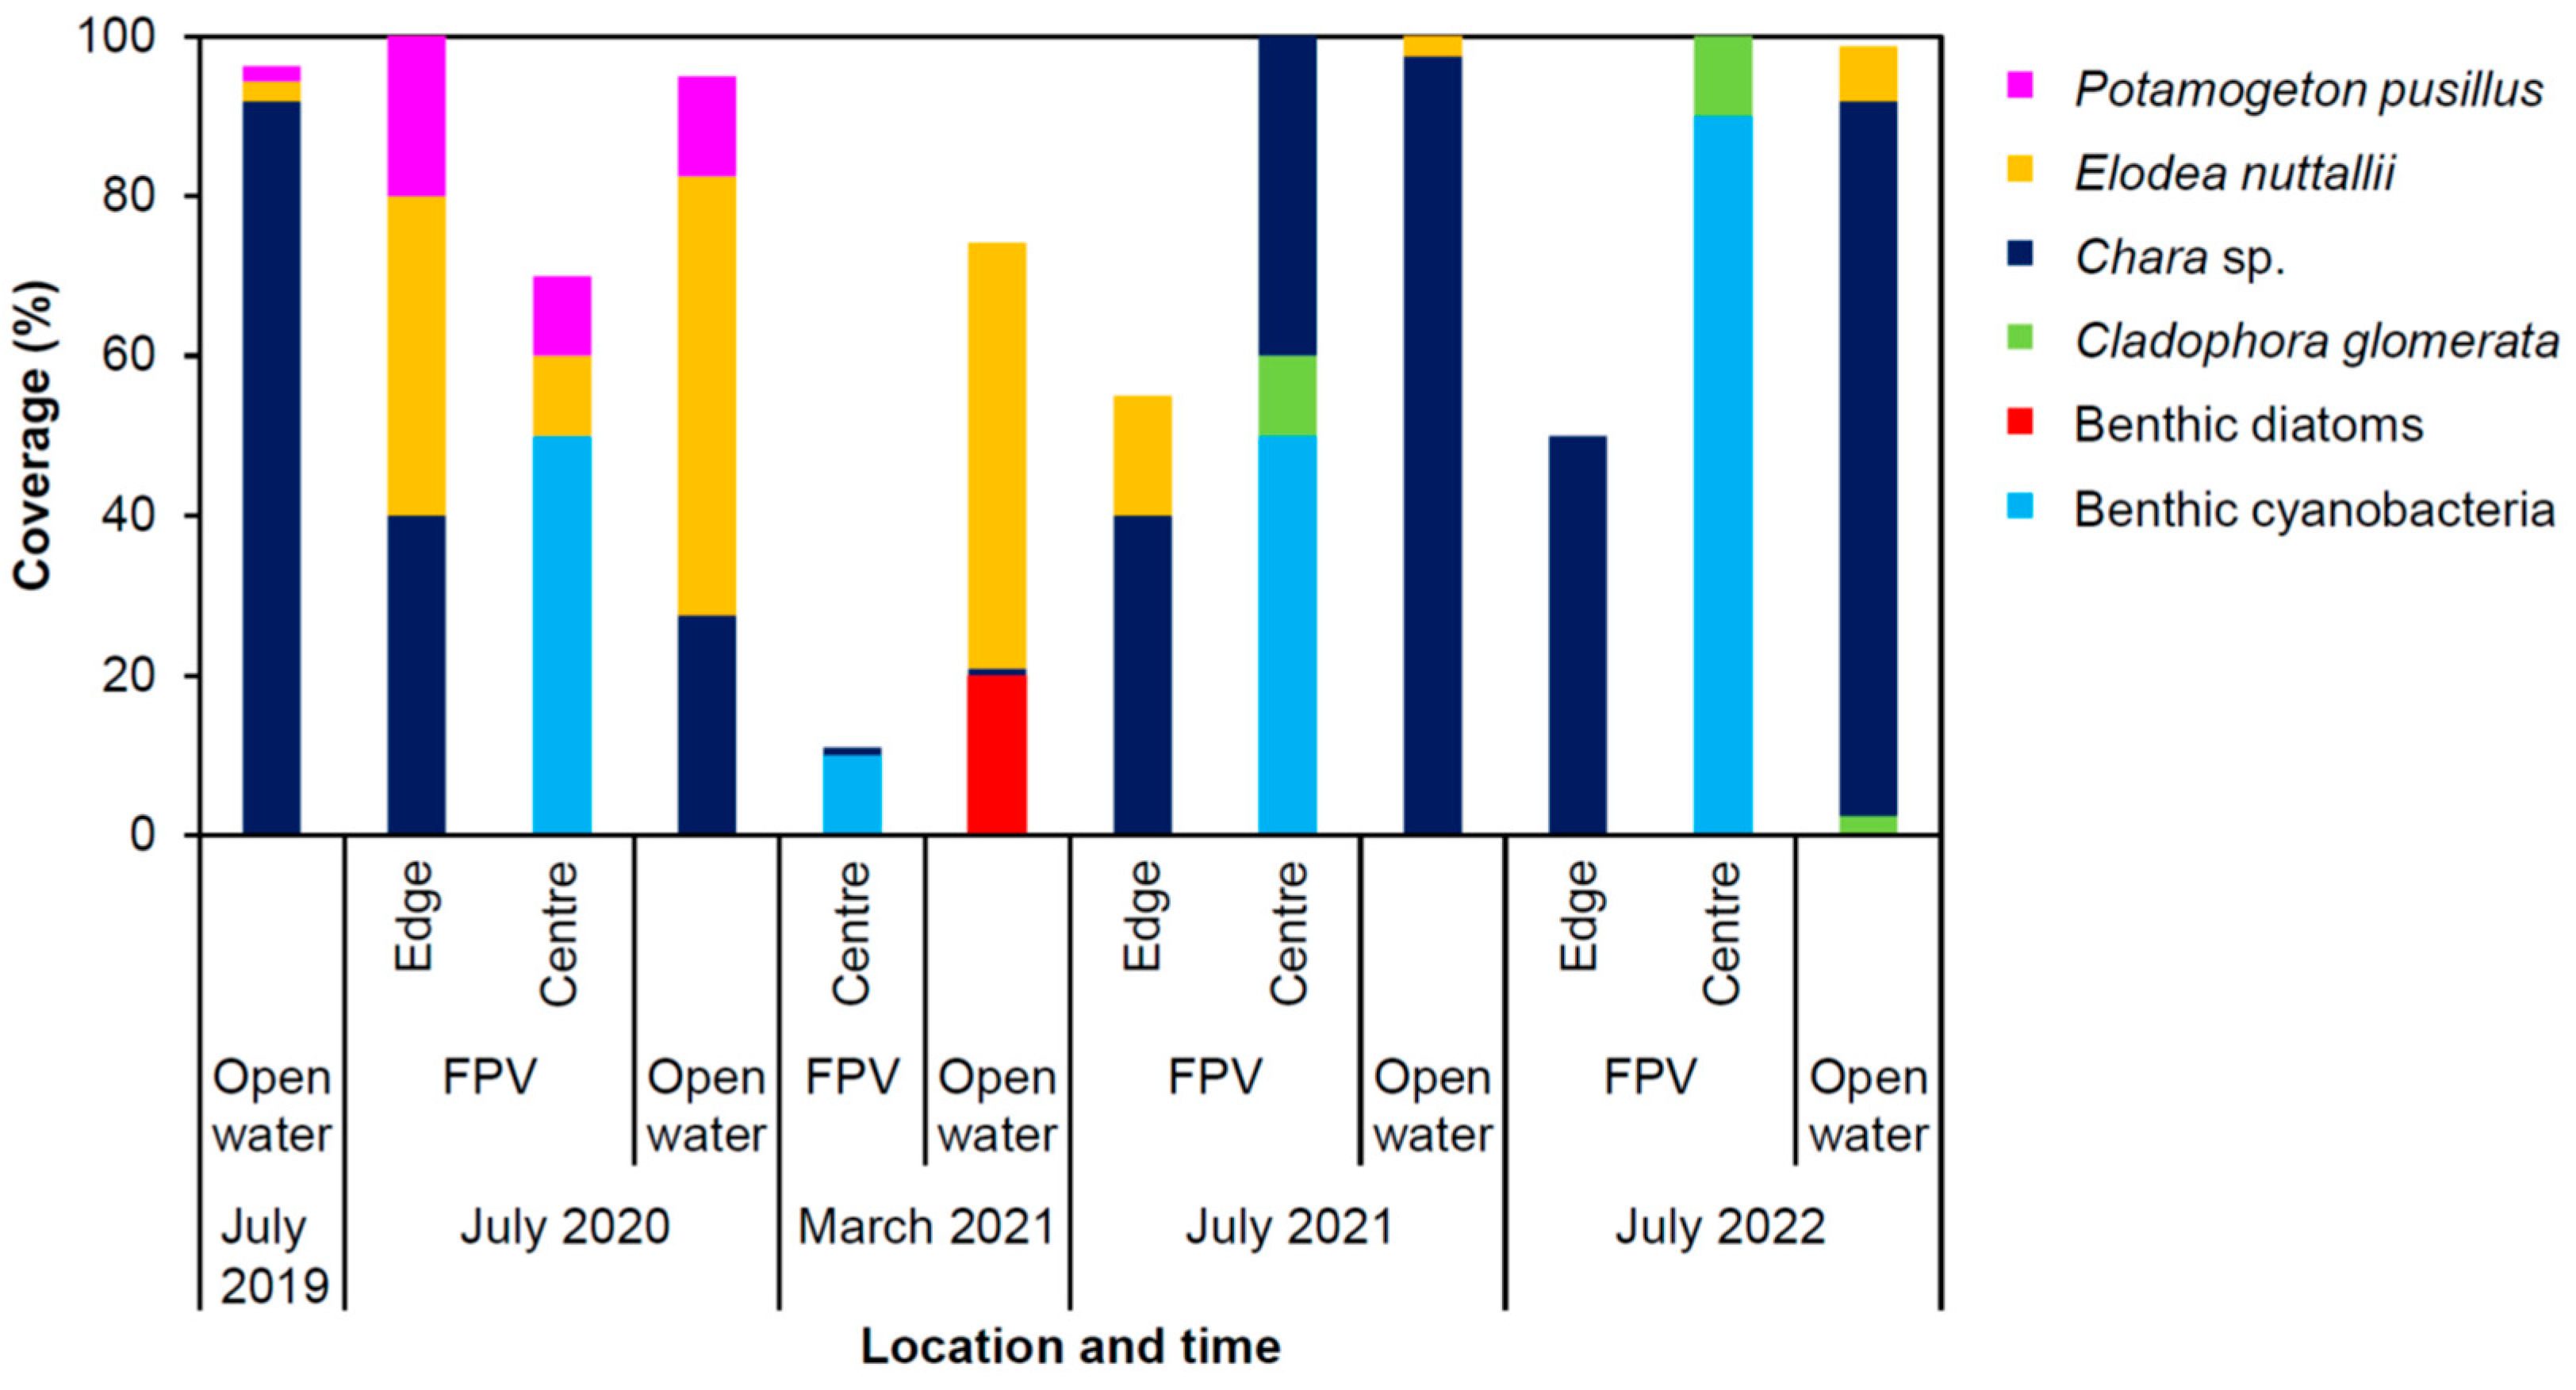
3.1. Shift from Stonewort and Macrophytes to Benthic Cyanobacteria

Before the installation of the FPV system, Chara globularis (stonewort) was the dominant species at the bottom of the reservoir (July 2019, Figure 2). Some Chara vulgaris, Elodea nuttalli (waterweed), and Potamogeton pusillus (small pondweed) were also present at the bottom of the reservoir. In July 2020, E. nuttalli had obtained a higher coverage than C. globularis at the bottom of the reservoir in open water, while by July 2021 and 2022, C. globularis had again become the dominant species at the bottom of the reservoir in open water (Figure 2).
Three months after installation of the FPV system (July 2020), the following changes had occurred in the species composition at the bottom of the reservoir below the FPV system: C. globularis had disappeared, the coverage of E. nuttalli and P. pusillus was reduced, and benthic cyanobacteria (Gomphosphaeria aponina, Table 1) developed with a coverage of around 50% (Figure 2). During the diving inspection in March 2021, benthic diatoms and E. nuttalli seedlings were dominant in open water, while benthic cyanobacteria (G. aponina) were still dominant under the FPV system with a coverage of approximately 10%. In July 2021, the coverage of C. globularis under the FPV system was lower compared to open water; some Cladophora glomerata (blanket weed) was present at the bottom under the FPV system, and benthic cyanobacteria were present with an estimated coverage of 50% (Figure 2). C. glomerata also developed on the floaters of the FPV system. In July 2021, G. aponina was still dominant under the FPV system, but other benthic cyanobacteria (Phormidium cf. breve, Phormidium cf. tenue, and Pseudanabaena sp.) were also found (Table 1). In July 2022, the coverage of benthic cyanobacteria below the FPV system had increased to 90% (Figure 2), and C. globularis was not found under the FPV system beyond a few metres away from the edges towards the centre of the FPV system. Chara and macrophytes reached a height of up to 1.0 m in summer in open water, but at the edge of the FPV system, the heights of the macrophytes and Chara were reduced. In July 2022, the benthic cyanobacterium G. aponina was no longer found below the FPV system; Phormidium breve and Phormidium sp. were the dominant benthic cyanobacteria instead, while Pseudanabaena sp. and some sedimented Microcystis aeruginosa, a planktonic species, were also detected in the mats (Table 1). M. aeruginosa was also present in the water column in July 2022 (Supplementary Materials, Table S3). In the summer of 2024, a diving inspection revealed that benthic cyanobacterial mats were still dominant below the FPV system. Further information (coverages at the edges of the reservoir and photos) can be found in the Supplementary Materials.
Macrophytes and benthic green algae such as Chara sp. can promote stronger temperature stratification by impeding mean flows and reducing vertical mixing near the bottom [30,31]. Hence, in addition to blocking wind and reducing irradiance, high coverages with FPV systems could also affect mixing in water bodies by reducing the growth of macrophytes and benthic green algae. The strong reduction in the size and number of macrophytes and benthic green algae below the FPV system was most likely caused by a reduction in light availability. Although it has been shown that some macrophytes can adapt to low-light conditions [32], they were strongly affected by the introduced shading at the study site (Figure 2). Subsequently, the available niche was taken over by benthic cyanobacteria. Cyanobacteria can grow well at low light intensities [33,34]. They utilise phycobilisomes as light-harvesting antennae, which transfer absorbed light energy to the photosystems to optimise absorption of light energy [35,36]. Phycobilisomes are particularly advantageous in low light conditions. Eukaryotic algae and plants do not possess phycobilisomes. Benthic diatoms, which also grow well in low light intensities [37], were detected during the spring sampling in March 2021 (Figure 2). Yet, they were found only in open water and not under the FPV system. Besides light and nutrients, abiotic factors such as temperature and type of sediment can also influence the competition between and the occurrence of benthic diatoms and cyanobacteria [38].
Calculations of PPFD were performed to further explain the observed shift in photosynthetic organisms at the bottom of the reservoir. Measurements of light below the FPV system revealed that the light was not homogeneous (Supplementary Materials, Figure S27), and, therefore, the average light availability below the FPV system was used for the calculations.
The results show that the sum amount of direct light per day under the FPV system reached a maximum of 23% of the amount in open water in summer (Figure 3A). The calculated amount of light (PPFD) at the bottom of the reservoir is shown in Figure 3B. While PPFD reached a maximum of up to 390 µmol photons m−2 s−1 in open water in the summer in 2020–2022 (not considering vegetation), below the FPV system, the average light intensity at the bottom reached a maximum of only 119 µmol photons m−2 s−1. During daytime in summer, light intensity can vary strongly at the bottom of the reservoir below the FPV system, depending on the angle of the sun. In addition, the bottom below the FPV system also receives direct light for a shorter period during the day (Supplementary Materials, Figure S29). Figure 3C shows the calculated lower depth of the euphotic zone (1% of surface light, Zcyano), revealing that in open water, this depth is generally greater than the depth of the reservoir. Under the FPV system, during April to August 2020, May to August 2021, and April to mid-September 2022, Zcyano was higher and often much higher than the depth of the reservoir. For photosynthetic organisms that generally require more light for net growth, such as Chara, calculations were performed using 3% of the surface light (Zchara). While in open water Zchara is mostly higher than the depth of the reservoir, Zchara was only somewhat higher than the depth of the reservoir under the FPV system during the first half of July 2020, the end of May and end of June 2021, and early May to mid-July 2022. Hence, these theoretical calculations of light availability at the bottom of the reservoir under the FPV system confirm our findings of a shift in the presence of Chara and macrophytes, which require more light for net photosynthetic growth, towards mostly benthic cyanobacteria, which require less light. It is noted that macrophytes generally require even more light for net growth than 3% of the surface light [26,39].
G. aponina was the first benthic cyanobacterium found under the FPV system in July 2020 (Table 1). In July 2021, other benthic cyanobacteria appeared, predominantly of the genus Phormidium, which had replaced G. aponina completely by July 2022. Phormidium is well known for producing cyanotoxins, such as anatoxins and microcystins [40]. A low concentration of anatoxin-a was detected in the cyanobacterial mats in July 2021, while a much higher concentration of microcystins was detected in the cyanobacterial mats in July 2022 (Table 1). In July 2022, some M. aeruginosa cells were also present in the cyanobacterial mats, which could have contributed to the measured microcystin concentration, although the genus Phormidium was dominant in the cyanobacterial mats. For Pseudanabaena, which was present in relatively low amounts in the benthic mats in July 2021 and 2022, microcystin production has not yet been proven, but at least one strain of this genus can produce a different unknown toxin [41]. Not much is known about toxin production by (benthic) Gomphosphaeria. Nodularin, cylindrospermopsins, and saxitoxins were not detected in samples of the mats.
The taste and odour compounds geosmin and 2-methylisoborneol (2-MIB) were detected in the water column in July 2021 and 2022 (Table 1). The geosmin concentration reached 20 ng L−1 in July 2022. These taste and odour compounds have an earthy odour and can be noticed in drinking water at concentrations of around 5 ng L−1 [42], especially when no residual chlorine is present in the drinking water, which is the case in the Netherlands. The genus Phormidium is well known for producing these compounds, and the genus Pseudanabaena can produce these compounds as well, while Microcystis cannot produce geosmin or 2-MIB [43]. Gomphosphaeria has been associated with water containing geosmin before [44], although to our knowledge, no definitive evidence for geosmin or 2-MIB production by Gomphosphaeria has been published.
The measured concentrations of taste and odour compounds and toxins were not problematic for the drinking water production plant of this study because the local reservoir supplies only around 3% of the raw water, and in addition, the treatment plant is able to largely remove these compounds. However, at other locations, this could be an issue. Although microcystins and anatoxins likely remain largely inside the cells of cyanobacterial mats, the mats can detach from the bottom, for example, due to the accumulation of oxygen bubbles within mats, potentially releasing cyanotoxins into the water as the mats degrade [40]. In addition, floating cyanobacterial mats could directly poison nearby animals, such as dogs or cattle, when they consume water.
The colourless, filamentous sulphide-oxidizing bacterium Beggiatoa alba was also detected in the benthic cyanobacterial mats (Supplementary Materials, Figures S12 and S20). Beggiatoa has previously been associated with benthic cyanobacterial mats [45,46]. Oxygen levels and light availability can affect the vertical migration of these motile colourless sulphur bacteria and benthic cyanobacteria and their competition with each other.
Furthermore, the macroinvertebrate composition below the FPV system was affected during the summertime. Macrophytes and benthic algae can provide shelters, living and oviposition sites, and food for macroinvertebrates [47,48]. Likely, the strong reduction in Chara and macrophytes below the FPV system affected the macroinvertebrate composition, which was especially evident in July 2022. Further information can be found in the Supplementary Materials.

3.2. Biofouling of the FPV System: Massive Development of Dreissena Mussels

Biofouling of the underwater construction consisted of sponges, attached algae, and Dreissena mussels (see Supplementary Materials for photos). The sponge Ephydatia fluviatilis was observed on the floaters of the cable pontoons during March and July 2021. On the floaters, ropes, and cables of the FPV system, algae (C. glomerata) were attached, reaching a coverage of approximately 40% of the floaters. The algae reached a length of several decimetres.
It is well known that Dreissena mussels can attach to floating structures [19], and the installation of an FPV system introduces a large surface area to which the Dreissena mussels could attach. Mussels found attached to the FPV system were Dreissena polymorpha (zebra mussel), Dreissena rostriformis bugensis (quagga mussel), and a hybrid of these species. Biofouling on the polyethylene floaters of the cable pontoons with Dreissena mussels was found three months after the installation of the FPV system (Table 2). The mussels grew rapidly, to approximately 20 mm in size in less than one year (see Supplementary Materials, Figure S25, for the size distributions). In July 2021, the density of the Dreissena mussels attached to the cable pontoons had increased due to the settling of juveniles (Table 2). During that time, the first mussels had attached to the underwater construction of the FPV system itself, but the densities in July 2021 and 2022 were lower than on the floaters of the cable pontoons. In July 2022, the mussels attached to the FPV system had increased in size to approximately 14 mm. It is likely that the density of Dreissena mussels attached to the FPV system will expand further in the future. Moreover, in 2024, some Dreissena mussels were also detected growing at the bottom of the reservoir. Likely, these mussels had fallen from vertical clusters attached to the floaters. Strongly elevated numbers of Dreissena larvae could impose problems for drinking water treatment plants or treatment plants of other industries, since the larvae could attach to transport mains and enter treatment plants themselves if no measures are taken to inactivate or remove the larvae.
The Dreissena mussels initially attached themselves only to the floaters of the cable pontoons and then, from July 2021 onwards, to the floaters of the FPV system itself (Table 2). A possible explanation could be that more copper was leaching from the FPV system, which initially prevented the attachment of Dreissena mussels at that location (for leaching of metals, see next paragraph). The highest measured copper concentration at the sample point “Return water” (edge of the reservoir) was 10.5 µg L−1 during the summer of 2020, which is below the no-effect concentration of 13 µg L−1 for zebra mussels, while the EC50 concentration (half maximum effect concentration) for chronic toxicity to zebra mussels is 43 µg L−1 [49]. However, the copper concentrations were possibly higher directly adjacent to the FPV system.
The condition index (biomass compared to reference biomass; see Supplementary Materials for details) of the larger, reproducing mussels at the cable pontoons in the shallow reservoir was higher in 2021 than in the Petrusplaat reservoir (reference drinking water reservoir with a high biomass of Dreissena mussels), but similar in 2022 (Table 2; one-way ANOVA with Tukey’s post hoc test, F = 108, df1 = 6, df2 = 69.1, and p < 0.001). This shows that ample food and space were available for the mussels in 2021, while food availability had likely decreased in 2022 due to competition with mussels on the floaters of the main FPV system. The condition index of Dreissena mussels on the cable pontoons and on the floaters of the FPV system was similar in July 2022 (Table 2). Between the mussels, we observed different species of Gammaridea (Amphipoda), which is a not uncommon occurrence. Mussels increase habitat complexity, reduce predation risks for gammarids, and can increase their food availability [50,51].
The Dreissena mussels also affected water quality. The Secchi disk depths for both open water and under the FPV system were generally higher in 2022 compared to 2020 and 2021, when Dreissena mussels had massively developed on the floaters of the FPV system. For example, in January–October 2021, the Secchi disk depths were only similar or greater than the depth of the reservoir three out of 17 times, while in January–October 2022, 15 out of 21 Secchi disk depths were similar or greater than the depth of the reservoir (Supplementary Materials, Figure S28). Because of the filtering effect of the mussels, the water became more transparent. Calculations of light availability at the bottom of the reservoir did not reveal an increase in light availability in 2022 (Figure 3C,D) because the Secchi disk depth often reached the depth of the reservoir. Yet, this increase in light availability did not result in the disappearance of benthic cyanobacteria or the return of Chara and macrophytes below the FPV system. Other water quality effects caused by the Dreissena mussels are discussed in Section 3.4.

3.3. Metals and Metalloids: No Exceedance of Quality Standards

Several metals and the metalloids arsenic and boron were measured in 2020 and 2021 after the installation of the water-based FPV system in the shallow reservoir. In agreement with laboratory leaching tests that were carried out beforehand [27], copper (Mann–Whitney U test, p < 0.001; z-value: 4.64), manganese (Mann–Whitney U test, p < 0.01; z-value: 4.19) and zinc (Mann–Whitney U test, p < 0.001; z-value: 4.86) were found in higher concentrations in the shallow reservoir compared to the reference reservoir (Petrusplaat). The average concentration of copper in the shallow reservoir was 5.9 µg L−1, that of manganese 8.8 µg L−1, and that of zinc 20.0 µg L−1, compared to, respectively, 1.5, 1.3, and 2.5 µg L−1 in the reference reservoir. Yet, the concentrations of copper, manganese, and zinc in the shallow reservoir remained well below the threshold values for surface water used for drinking water production. Leaching of aluminium was only observed in the first five months after installation of the FPV system. However, over the entire period April 2020–October 2021, the concentration of aluminium in the shallow reservoir was not significantly different from the reference reservoir (Mann–Whitney U test, p > 0.05; z-value: 0). In addition, it has been reported that crystalline silicon-based panels can leach heavy metals such as lead [15,16,17]. Although the PV panels are not in direct contact with the reservoir water, indirect contact via rainwater will occur. Yet, elevated concentrations of lead were not observed in the shallow reservoir. Concentrations of arsenic, boron, cadmium, chromium, and nickel were also comparable between both reservoirs. Further information can be found in the Supplementary Materials, Figure S24.

3.4. Phytoplankton Reduced in Reservoir, Differences in Zooplankton Composition

Nutrient concentrations (total phosphate, orthophosphate, nitrate, ammonium, and silicate; Supplementary Materials, Figure S30) were very similar between the open water and below the FPV system. Furthermore, nutrient concentrations, except for silicate, were comparable among 2020, 2021, and 2022. Silicate in the water was mostly depleted in the summer of 2021 due to a bloom of diatoms (Figure 4A).
Sufficient light was available in the water column below the FPV system for net photosynthetic growth of phytoplankton (Figure 3C). The phytoplankton composition was generally very similar between open water and under the FPV system (Figure 4A,B). One exception was on 15 July 2020, when the biovolume of Chlorophyceae (green algae) was much higher in open water, while the biovolume of Chrysophyceae (golden algae) was higher under the FPV system. Many eukaryotic algae possess flagella, which allows them to swim towards or away from a light source [52]. This could explain the differences found on 15 July 2020.
The total phytoplankton biovolume was sometimes higher in open water and at other times higher under the FPV system. On 29 July 2020, the total phytoplankton biovolume was much higher under the FPV system (mainly diatoms and Cryptophyceae). In March 2021, phytoplankton biovolumes were higher in open water. In September–October 2021, the biovolume of cyanobacteria (predominantly M. aeruginosa) was higher in the open water, while in the summer of 2022, the biovolume of cyanobacteria was comparable between open water and under the FPV system. Biovolumes of cyanobacteria were much higher in 2021 compared to 2020. However, overall, phytoplankton biovolumes were much lower in open water and under the FPV system in 2022 compared to 2020 and 2021 (Figure 4A,B). This was most likely due to the massive development of Dreissena mussels, which can directly affect phytoplankton abundance and composition [53,54]. In addition, recent modelling work has shown that FPV systems can promote cooler water temperatures, which can inhibit phytoplankton growth when coupled with deteriorated light conditions (shading) [11]. This indicates that FPV systems can directly or indirectly reduce overall phytoplankton biomass. Yet, while overall phytoplankton biovolumes decreased, cyanobacteria became relatively more abundant over time after the installation of the FPV system. Moreover, ref. [55] showed that decreasing light can paradoxically increase phytoplankton abundance in shallow lakes since macrophytes that compete for nutrients are more affected. These different factors, in combination with the observed effect that the overall transparency of the water increased, show that long-term studies and modelling are needed to fully understand the effects of FPV systems on phytoplankton. At the moment, it remains unclear whether FPV systems can counter the predicted increase in planktonic cyanobacteria by climate change.
Zooplankton biovolumes are shown in Figure 4C,D. Asplanchna was the dominant rotifer genus. In the summer of 2022 (when it was mostly sunny during sampling), the rotifer biovolume was generally higher in open water, while in the summer and autumn of 2020 and the autumn of 2022, the rotifer biovolumes in open water and under the FPV system were mostly comparable. On 14 July 2021 (a cloudy day), the rotifer biovolume was higher in open water compared to under the FPV system, while on 29 July 2021 (a sunny day), the rotifer biovolume was comparable.
The zooplankton group Cladocera consisted mostly of Anomopoda (Figure 4C,D), and the most dominant Anomopoda genus was Daphnia. The biovolume of total Cladocera was regularly similar between open water and under the FPV system, except for some sunny or partly sunny days (21 April 2022, 24 August 2022, and 21 September 2022), when the total Cladocera biovolume (mainly Anomopoda) below the FPV system was much higher than in open water. On 21 April 2022 (a sunny day), the genus Chydorus comprised 40% of the Anomopoda biovolume under the FPV system and Daphnia 60%, while in open water, the biovolumes of Chydorus and Bosmina were negligible, whereas Daphnia was dominant (biovolume > 99%). On 24 August 2022 (a warm sunny day), the genus Simocephalus was dominant, while on 21 September 2022 (a partly sunny day), the genus Daphnia was dominant. On 19 May 2021 (a partly sunny day), the biovolume of Cladocera belonging to the order Ctenopoda (Sida crystallina) was much higher under the FPV system compared to in open water.
Zooplankton of the class Copepoda consisted mostly of Calanoida and (nauplius and copepodite) larvae (Figure 4C,D). The total Copepoda biovolume was overall comparable between open water and under the FPV system. One exception was 21 October 2020 (a cloudy, rainy day), when the biovolume of Calanoida especially was much higher under the FPV system.
Other zooplankton groups were present in much lower biovolumes in open water and under the FPV system (Figure 4C,D).
Overall, the FPV system did have an effect on the zooplankton distribution in the shallow reservoir at several moments in time (Figure 4C,D), despite the dataset being limited to only 2.5 years. Future studies should focus on longer study periods to investigate trends and seasonal effects in more detail. Studies have shown that zooplankton can move towards light to increase food availability or move to more shaded/sheltered areas to reduce their exposure to fish predation [56]. Because the FPV system introduces shading, this can affect the zooplankton communities. In turn, this could also affect the location of planktivorous fish in water bodies with FPV systems.

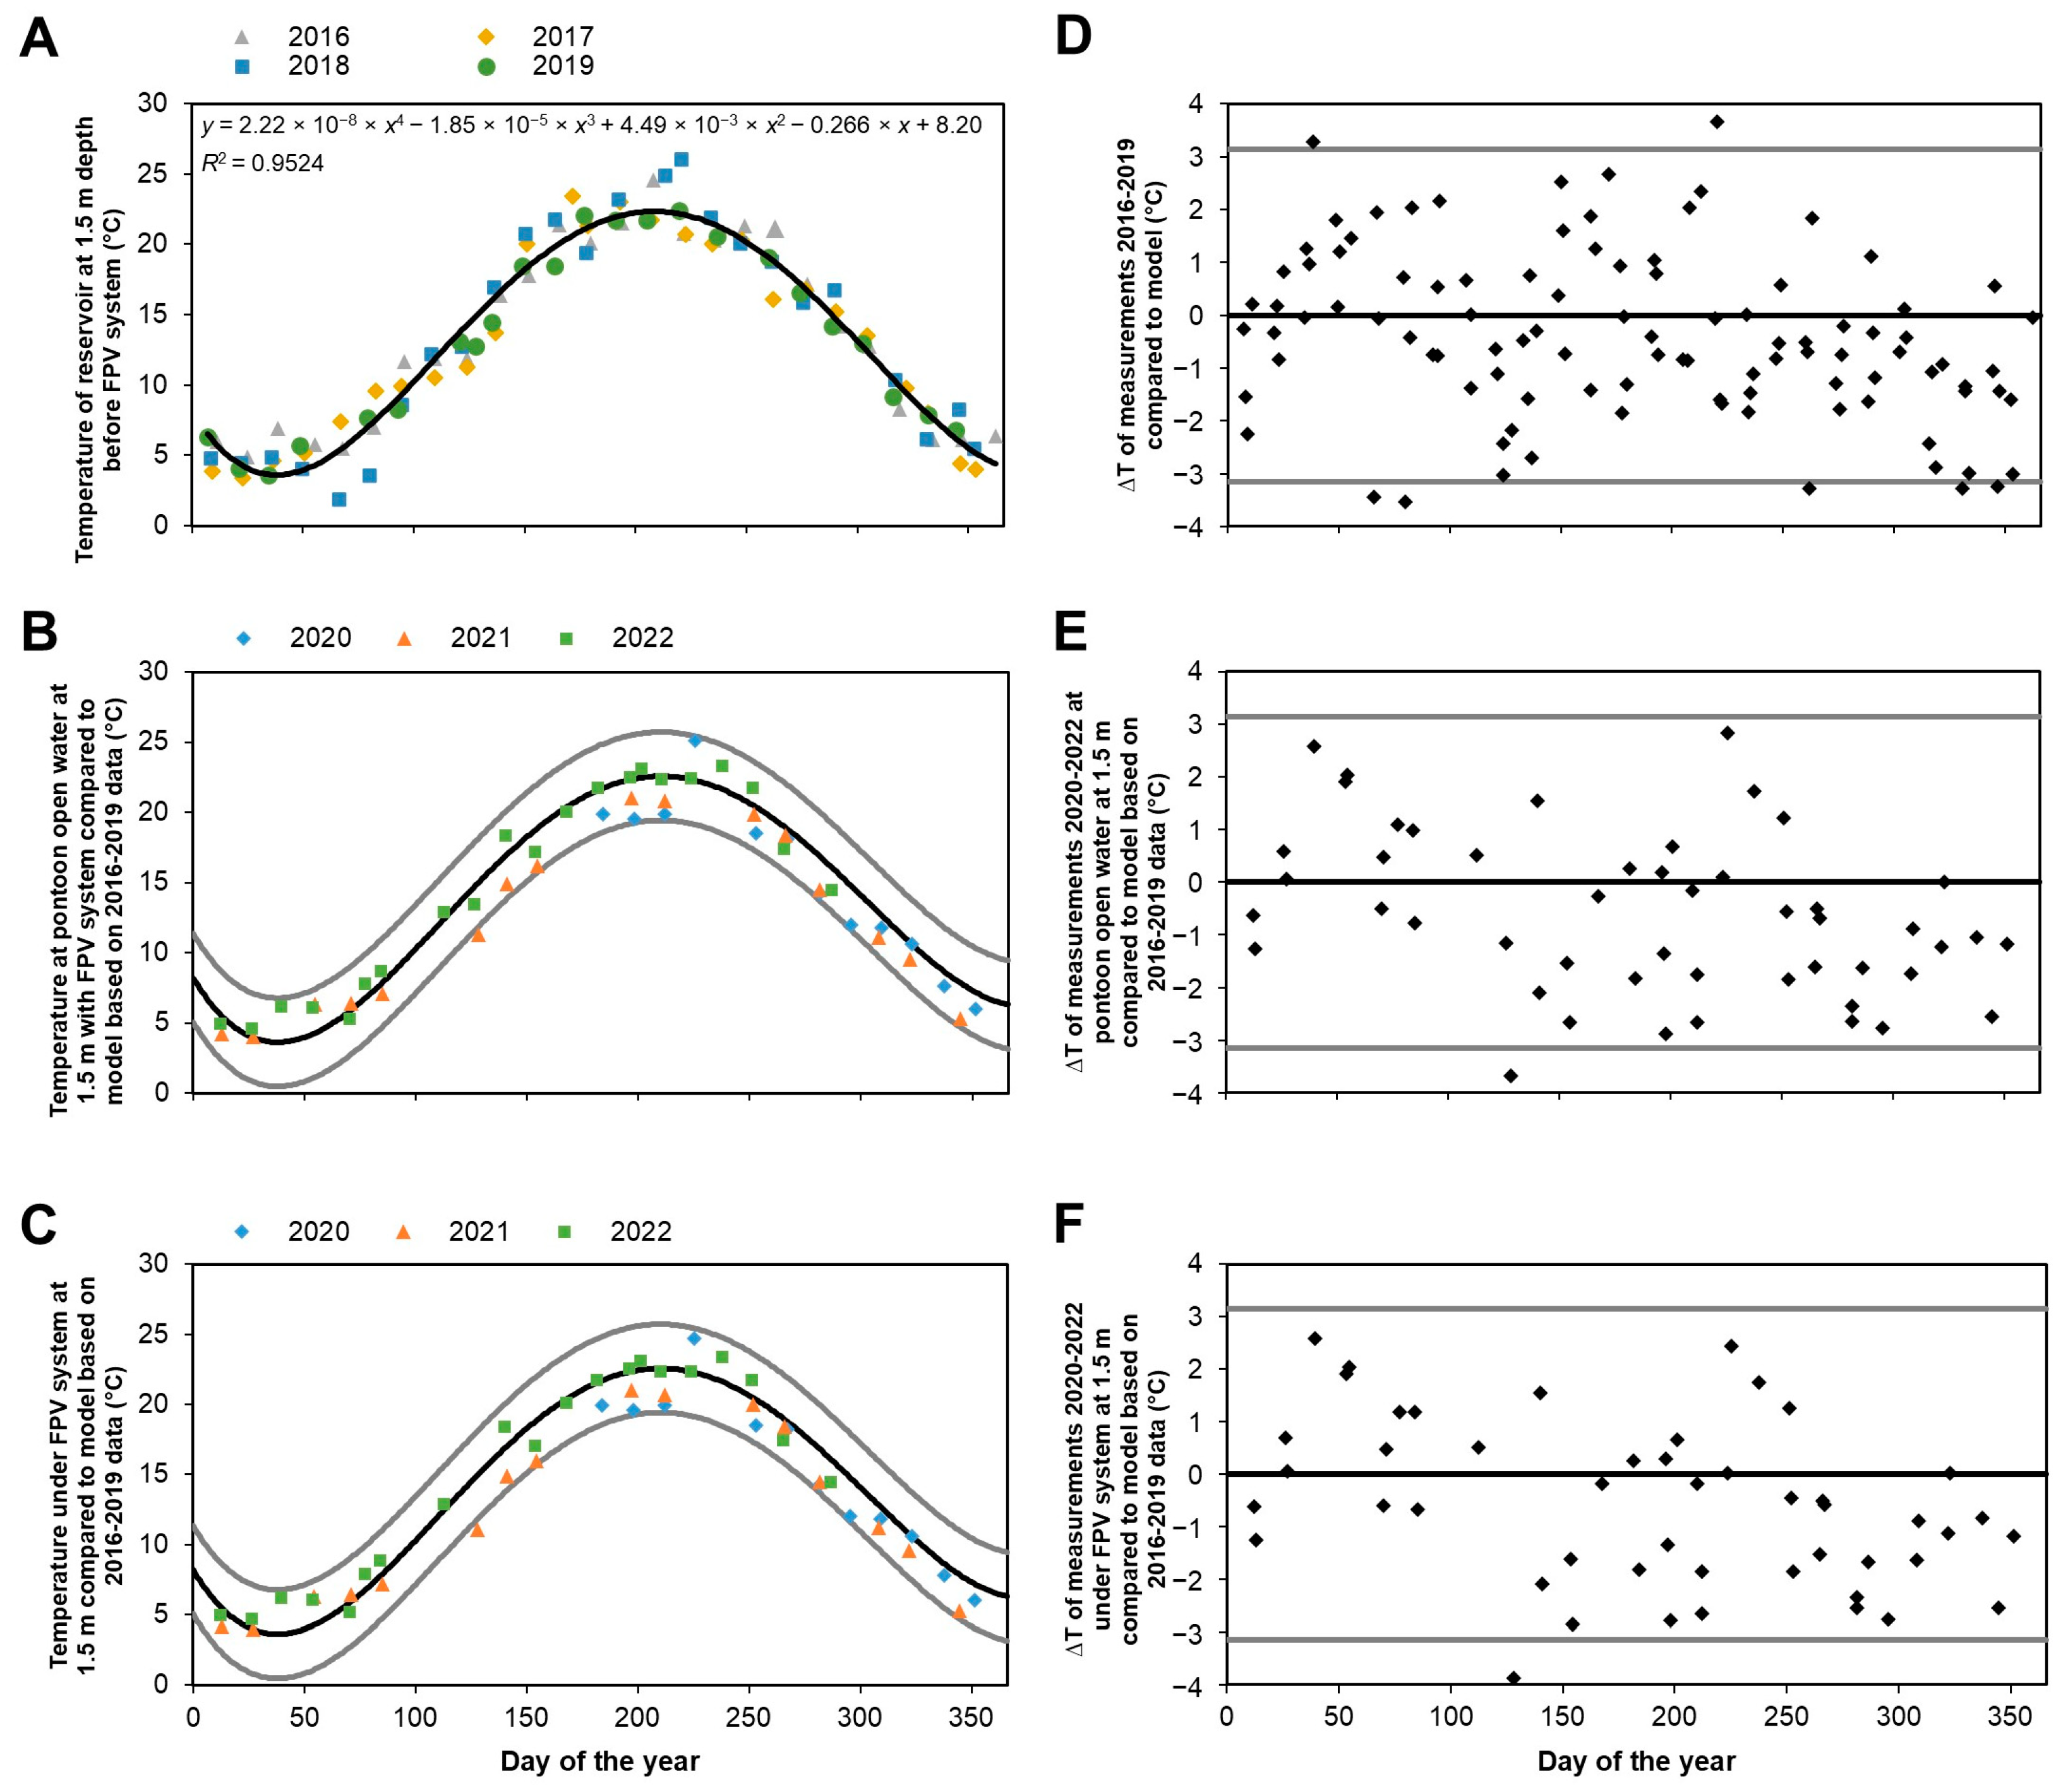
3.5. Temperature and Oxygen Profiles Very Similar

Wind near the water surface was modelled using computational fluid dynamics (CFD) (Supplementary Materials, Figure S31). The results indicate that the orientation of the applied FPV system and the wind direction have a strong effect on the wind speed near the water surface at the FPV system. Because the FPV system turns during the day, the wind speed near the water surface changes constantly. Temperature and oxygen profiles are indicators of how well a water system is mixed. Despite weak and ephemeral stratification sometimes developing in polymictic lakes, it did not occur before or after the installation of the FPV system in the shallow reservoir (Figure 5A,B). The sediment was anoxic, but oxygen concentrations in the water were generally higher than 8 mg L−1 (Figure 5D,E).
Furthermore, we compared the temperature and oxygen profiles of open water with profiles under the FPV system after the installation of the FPV system. Figure 5C,F show the differences in temperature and oxygen concentrations between water under the FPV system and open water. Despite the CFD modelling indicating that the FPV system studied was able to block most of the wind near the water surface if the PV panels were facing the wind direction or the opposite side of the wind direction, the temperature and oxygen concentrations were very similar overall. This is likely because the FPV system had large openings between the rows of PV panels (Supplementary Materials, Figure S3); therefore, heat was not trapped below the PV panels, and the orientation of the FPV system relative to the wind direction changed during the day. Only during warm days with hardly any wind were some differences noticeable between open water and under the FPV system. For example, during the summers of 2020 and 2022, higher oxygen concentrations were sometimes measured in open water near the bottom, while during the summer of 2021, oxygen concentrations were sometimes somewhat higher under the FPV system near the bottom (Figure 5). These differences between both measuring points can be explained by variations in the presence and coverage of different benthic photosynthetic organisms in open water and under the FPV system at those times (Figure 2). Because wind speed was also low during these periods, the local differences in oxygen concentrations were not levelled out by mixing.
Overall, the results indicate that the shallow reservoir was still well mixed by wind after the installation of the FPV system, with a coverage of 24%. In a recent study with 2% coverage by an FPV system at Lake Maiwald (Germany), hardly any changes to the thermal characteristics of the lake were found as well [57]. However, with other FPV systems that are less open or with much higher coverage, temperature and oxygen profiles under the FPV system could likely be affected.
The temperature data from before and after the installation of the FPV system are compared in Figure 6. A fourth-degree polynomial model was fitted to the temperature measurements in 2016–2019. The average ΔT of the data from 2016–2019 compared to the model was −0.408 °C (standard deviation, s.d.: 1.574). The average ΔT of the data after installation of the FPV system compared to the model from 2016–2019 was −0.605 °C (s.d.: 1.543) for open water and −0.586 °C (s.d.: 1.558) for below the FPV system. This shows that the temperature of the reservoir after installation of the FPV system was, on average, 0.2 °C lower at a 1.5 m depth. For the Petrusplaat reference reservoir, the average temperature for 2020–2022 compared to 2016–2019 was only 0.02 °C lower (see Supplementary Materials, Figure S32). However, the non-parametric Mann–Whitney U test showed that the differences in temperature between before and after the installation of the FPV system at the shallow reservoir were not significant (p = 0.6966 and Z = −0.3899 for open water, and p = 0.6022 and Z = −0.5212 for under the FPV system).
Refs. [20,57] have modelled the effects of FPV systems on deep lakes with different coverages and found that a significant cover (>50%) could result in large temperature changes in the lakes and very extensive modifications to stratification timing. On the one hand, this indicates that there is a risk that water quality may be affected with high coverage, and high coverage should be avoided when water quality and or ecology is important. On the other hand, it has also been suggested that floating photovoltaics could mitigate climate change impacts on water body temperature and stratification [20]. Our study shows that 24% coverage on a shallow reservoir does not strongly affect the temperature or mixing of the water column.

3.6. No Significant Changes in the Number of Birds or Concentrations of Faecal Bacteria

To the best of our knowledge, no other studies have investigated the effects of an FPV system on the number of water birds. Water birds were counted on the shallow reservoir before and after the installation of the FPV system. Water birds were grouped by family (Table 3). Anatidae (mostly gadwall, Mareca strepera, and tufted duck, Aythya fuligula) were present in the highest numbers on the reservoir, with the highest number of individuals counted in early winter. Rallidae (mostly Eurasian coot, Fulica atra) were the next most dominant group, followed by Lardidae (mostly black-headed gull, Chroicocephalus ridibundus). Both families also had a peak presence in early winter. Birds belonging to other families (Phalacrocoracidae, Podicipedidae, Ardeidae, and Charadriiformes) were present in much lower numbers.
The maximum number of birds at the reservoir belonging to the Anatidae was somewhat lower in the winter of 2020–2021 (with FPV system: 237 individuals) compared to the winters of 2014–2015 (437 individuals) and 2019–2020 (320 individuals) without the FPV system (Table 3). The maximum number of birds at the reservoir belonging to the Rallidae was lower during the winter of 2020–2021 (with FPV system: 153 individuals) compared to the winter of 2019–2020 (no FPV system: 339 individuals), but higher compared to the winter of 2014–2015 (64 individuals). The maximum number of birds at the reservoir belonging to the Lardidae in the winter of 2020–2021 (with FPV system: 75 individuals) was comparable with the winters of 2014–2015 (81 individuals) and 2019–2020 (71 individuals). Similarly, the maximum numbers of the Phalacrocoracidae, Podicipedidae, Ardeidae, and Charadriiformes with the FPV system were comparable to historical data. In conclusion, the observed maximum numbers of water birds were not considerably different after the installation of the FPV system.
Moreover, when comparing November 2019–February 2020 (before the FPV system) with November 2020–February 2021 (with the FPV system), no significant changes were found in the numbers of water birds, except for the Charadriiformes, which were overall present in very low numbers (Table 3). Further information can be found in the Supplementary Materials, Figures S33–S39.
Hence, despite the fact that the surface area of the open water was decreased by a quarter, enough space remained for the birds to reside on the water. Yet, higher coverages of FPV systems (e.g., 70–90%) can lead to a significant drop in the number of water birds. Furthermore, the similar numbers of birds before and after the installation of the FPV system show that birds were not repelled from the reservoir by this type of FPV system. However, this could be different if laser-beam or sound technology were used on an FPV system to repel birds. On the other hand, birds were also not massively attracted to the FPV system, which could otherwise be problematic for drinking water reservoirs. Water birds can also graze upon macrophytes and benthic algae, such as Chara [58]. A significant reduction in macrophytes and benthic algae could potentially reduce the number of water birds. In our study, Chara was still abundant in open water.
An accumulation of bird droppings, which could lead to peaks in concentrations of faecal bacteria after rain, was largely prevented at the FPV system by the relatively steep angle of the PV panels and the ridged edge at the top of the PV panels. Yet, the cable pontoons in open water, which did not feature a means to repel birds, were covered with numerous bird droppings (Supplementary Materials, Figure S3).
Concentrations of faecal bacteria in the shallow reservoir were measured before and after the installation of the FPV system (Table 4). The results show that the concentrations of total bacteria in the coli group were similar before and after installation of the FPV system (Mann–Whitney U test, p = 0.197, z-value: −1.08). The concentrations of E. coli were also similar (Mann–Whitney U test, p = 0.281, z-value: −1.29). In contrast, the concentrations of total enterococci and intestinal enterococci were somewhat higher after the installation of the FPV system (Mann–Whitney U test; p < 0.001, z-value: −4.34 for total enterococci; p < 0.01, z-value: −2.98 for intestinal enterococci). The median of the total number of enterococci increased from 6 to 13.5, and the median of the intestinal enterococci from 2 to 4.8 CFU 100 mL−1. The log concentration of each group of faecal bacteria in the water was correlated with the log concentration of the other groups of faecal bacteria measured (Supplementary Materials, Figure S40). In addition, the log concentrations of bacteria of the coli group, E. coli, and intestinal enterococci correlated with the total number of water birds, whereas this was not the case for total enterococci (Supplementary Materials, Figure S41).
In agreement with the similar numbers of water birds after installation of the FPV system, the concentrations of bacteria of the coli group and E. coli were not significantly different, although the concentrations of total and intestinal enterococci increased somewhat (median 0.4 log10 higher, Table 4). The reason for the latter is unclear; possibly, the accumulation of bird droppings at the cable pontoons played a role. A slight increase in the concentration of some faecal bacteria does not endanger the microbial safety of the drinking water produced by the treatment plant [27]. Yet, for other types of FPV systems that do not effectively repel birds (e.g., Supplementary Materials, Figure S4), accumulations of bird droppings could pose a microbial safety risk for drinking water reservoirs, especially after heavy rain, when accumulated bird droppings can flush into the water.

3.7. Mitigating Negative Effects and Future Directions of FPV Systems

The effects observed in the study are summarized in Table 5. The main effects include a shift from macrophytes and Chara to benthic cyanobacteria below the FPV system and massive biofouling at the floaters, which reduced phytoplankton biovolume and increased transparency.
The results indicate that benthic cyanobacteria can develop under FPV systems when macrophytes and benthic algae are strongly reduced and enough light remains available at the bottom (around 1–3% of surface light) for benthic cyanobacteria to achieve net photosynthetic growth. Therefore, especially for water systems that are shallow and transparent, we recommend performing measurements and calculations of light availability first to estimate the risk that macrophytes and benthic algae may be replaced by benthic cyanobacteria. In addition, a pilot study is recommended before installing large FPV systems. Future research should focus on developing detailed models to predict changes in benthic photosynthetic organisms after the installation of an FPV system. For deep or very turbid waters, this risk of emergence of benthic cyanobacteria is not likely. However, it should be taken into account that if Dreissena mussels develop massively on the floaters, it can increase the transparency of the water. Combatting benthic cyanobacteria under FPV systems will be very challenging. Disturbing the sediment to inhibit the growth of benthic cyanobacteria with a boat with a harrow [59] is difficult under FPV systems because the area of the FPV system cannot be accessed by boat, and often, cable or anchor lines are present beneath the system. Combatting benthic cyanobacteria with Cu-based algaecides is possible [60], but this is not environmentally friendly and, therefore, not recommended. H2O2 could be effectively used to combat planktonic cyanobacteria [61]. Yet, to our knowledge, no field studies have been performed with H2O2 to combat benthic cyanobacteria. Peroxide in the form of sodium carbonate peroxyhydrate (Phycomycin) was not very effective in inhibiting benthic cyanobacterial chlorophyll-a [62]. Treatments using a combination of chemicals have been successful in reducing benthic cyanobacteria and may be suited to temporarily reduce the number of benthic cyanobacteria [63]. However, negative environmental effects may occur, and they are not suitable for water used for drinking water production. Overall, combatting benthic cyanobacteria under FPV systems is difficult and might, in turn, cause other negative environmental water quality effects.
Further research should also focus on determining the optimal configuration of FPV systems for different water systems with the least number of ecological effects. To contribute to this future research direction, two static FPV systems have recently been installed on one of our much larger drinking water reservoirs, with a part of the PV panels replaced by transparent panels, resulting in a light gradient. With this new research project, we aim to gain more insight into the effects of different light conditions. In addition, studying different FPV system designs allows for more insights into the effects of blocking wind on mixing and stratification.
The massive development of Dreissena mussels attaching themselves to the floaters of the FPV system can affect water quality in positive and negative ways [64]. To prevent the growth of biofilm and Dreissena mussels attaching themselves to the floaters of an FPV system, anti-fouling coatings could be applied. However, most of these coatings are not allowed to be used in water that is used for drinking water production, because they can contain poisonous substances or do not have the required certificates for application in drinking water. Furthermore, many FPV systems are installed for a longer period of 20–25 years, and most coatings are not effective against Dreissena mussels for this long a period of time. Several other preventative measures, such as UV-light, bacteria-based molluscide, Biobullets, pH adjustment, and chemical dosing [65], are not suitable for FPV systems. Ultrasound transducers could be effective against Dreissena mussels [66]; however, they also negatively affect water quality by killing Daphnids, while they do not affect the growth of the cyanobacterium M. aeruginosa [67]. Therefore, if Dreissena mussels are present in the area where an FPV system is to be installed, it will be difficult to prevent massive mussel development on the floaters, and it should be taken into account that mussels will appear on the floaters if they are present in the area. Another alternative is to use PV systems that do not float but are placed above the water surface using, for example, long poles for anchoring.

4. Conclusions

The application of the FPV system to the shallow drinking water reservoir resulted in the emergence of toxins-, geosmin-, and 2-MIB-producing benthic cyanobacteria below the FPV system, which mostly replaced macrophytes and benthic green algae. Theoretical calculations revealed that when light availability at the bottom, below the FPV system, is lowered to around 1–3% of the surface light, there is a risk that benthic cyanobacteria develop, which are well adapted to thriving in low-light conditions. In addition, we found that Dreissena mussels developed massively on the floaters, which reduced overall phytoplankton biovolumes, increased transparency, and also led to an increase in dreissenid larvae, which can attach to pipes. In contrast to the overall phytoplankton biovolume, the biovolume of planktonic cyanobacteria increased, and the temperature of the reservoir did not change significantly. Therefore, it remains unclear whether FPV systems can be effectively employed to counter climate change effects on planktonic cyanobacteria. The effects observed in our study (Table 5) could be included in future modelling studies of FPV systems to better predict the impact on phytoplankton, for example. The extent of the effects of an FPV system on water quality and ecology will depend on the type of FPV system applied, its coverage, the characteristics of the water body, and local weather. At our shallow reservoir, the effects of the FPV system did not negatively affect the functioning of the treatment plant or drinking water quality. However, especially for water systems that are shallow and transparent, we recommend performing calculations of light availability and a pilot study before installing large FPV systems to mainly examine the possible development of benthic cyanobacteria beneath the FPV system. Overall, this study quantified several effects that could be caused by FPV systems on water quality and ecology; this can inform water managers and governmental institutions in the decision-making process to install FPV systems on inland waters.

Supplementary Materials

The following supporting information can be downloaded at https://www.mdpi.com/article/10.3390/w17081178/s1, background information regarding Kralingen drinking water production plant; Figure S1: Location and size of water- and land-based photovoltaic systems; Figure S2: Specific yield of water- and land-based system per month; Figure S3: Pictures of the FPV system at the shallow reservoir (Kralingen); Figure S4: Example of FPV system in the Netherlands without steep angels of PV panels or ridged edges at the top; Figure S5: Maximum, average and minimum air temperature per day in the period 2016–October 2022; Figure S6: Daily precipitation amount in the period 2016–October 2022; Figure S7: Average wind speed per day in the period 2016–October 2022; Figure S8: Sunshine duration per day in the period 2016–October 2022; Figure S9: Global radiation per day in the period 2016–October 2022; Table S1: Weather data of the days phytoplankton and zooplankton were sampled; Table S2: Weather data of days diving inspections were carried out; Figure S10: Coverage per depth of macrophytes, benthic cyanobacteria and benthic algae of the Kralingen reservoir; Figure S11: Microscopy picture of benthic Gomphosphaeria aponina from below the FPV system; Figure S12: Microscopy picture of Beggiatoa alba from below the FPV system; Figure S13: Collected mussels (Dreissena spp.) that were attached to pontoon in open water; Figure S14: Collected freshwater sponge Ephydatia fluviatilis that was attached to pontoon of open water; Figure S15: Mussels (Dreissena spp.) attached to pontoon in open water; Figure S16: Cladophora glomerata attached to FPV system; Figure S17: Microscopy picture of benthic Gomphosphaeria aponina from below the FPV system; Figure S18: Benthic cyanobacterial mat below FPV system; Figure S19: Microscopy picture of Phormidium breve and Microcystis aeruginosa from below the FPV system; Figure S20: Microscopy picture of Phormidium breve and Beggiatoa alba from below the FPV system; Figure S21: Growth of Chara spp. in open water; Figure S22: Growth of mussels (Dreissena spp.) attached to FPV system; Figure S23: Growth of mussels (Dreissena spp.) attached to FPV system; Figure S24: Density of macroinvertebrates in open water and under the FPV system; Figure S25: Size distributions of mussels attached to pontoon in open water or FPV system; Figure S26: Concentrations of metals, arsenic and boron in the Kralingen reservoir with FPV system and Petrusplaat reservoir as reference; Figure S27: Light profiles (PAR) at “Pontoon open water” and “FPV system”; Figure S28: Depth and Secchi depth at “Pontoon open water” and “FPV system”; Figure S29: Comparison of light (Photosynthetic Photon Flux Density, PPFD) in open water and under the FPV system; Figure S30: Concentrations of nutrients at “Pontoon open water” and “FPV system”; Figure S31: Results of the CFD simulations with wind 15 km/h wind from S (top) and SW (bottom); Figure S32: Temperature measurements at 1.5 m depth at Petrusplaat reference reservoir; Figure S33: Bird counts of the family Anatidae at the Kralingen water reservoir; Figure S34: Bird counts of the family Rallidae at the Kralingen water reservoir; Figure S35: Bird counts of the family Lardidae at the Kralingen water reservoir; Figure S36: Bird counts of the family Phalacrocoracidae at the Kralingen water reservoir; Figure S37: Bird counts of the family Podicipedidae at the Kralingen water reservoir; Figure S38: Bird counts of the family Ardeidae at the Kralingen water reservoir; Figure S39: Bird counts of the family Charadriiformes at the Kralingen water reservoir; Figure S40: Pearson correlations between different groups of faecal bacteria; Figure S41: Pearson correlations of faecal bacteria with total number of water birds; protocol: Laboratory analysis of nutrients, phytoplankton and zooplankton; protocol: Laboratory analysis of Dreissena mussels and macroinvertebrates; protocol: Taste & odour and cyanotoxin laboratory analyses; Table S3: Phytoplankton composition. References [7,68,69,70] are cited in the Supplementary Materials.

Author Contributions

Conceptualization, G.S., A.W., R.v.A., B.H., D.M. and A.v.d.W.; Methodology, G.S., A.W., R.v.A. and B.H.; Software, G.S. and A.W.; Validation, G.S. and A.W.; Formal Analysis, G.S. and A.W.; Investigation, G.S. and A.W.; Resources, G.S., D.M. and A.v.d.W.; Data Curation, G.S. and A.W.; Writing—Original Draft Preparation, G.S. and A.W.; Writing—Review and Editing, G.S., A.W., R.v.A., B.H., D.M. and A.v.d.W.; Visualization, G.S. and A.W.; Project Administration, G.S., D.M. and A.v.d.W.; Funding Acquisition, G.S., D.M. and A.v.d.W. All authors have read and agreed to the published version of the manuscript.

Funding

The research was supported by the Dutch tax credit for research and development (WBSO).

Data Availability Statement

The data presented in this study are available from the authors upon request.

Acknowledgments

The authors thank Floating Solar for the realization of the FPV system, Natuur-Wetenschappelijk Centrum Dordrecht for monitoring of birds, AQZ for sampling and performing measurements, Els Faassen (Wageningen University and Research) for the toxin analyses, and AM-Team (Gent, Belgium) for CFD modelling. The authors thank the four anonymous reviewers for their helpful comments.

Conflicts of Interest

The Authors Giovanni Sandrini, Roland van Asperen and Albert van der Wal were employed by the company Evides Waterbedrijf. Author Arco Wagenvoort was employed by the company AqWa Ecologisch Advies. Author Bas Hofs was employed by the company D2O—Duurzaam Drinkwater. The remaining authors declare that the research was conducted in the absence of any commercial or financial relationships that could be construed as a potential conflict of interest.

References

  1. Where Sun Meets Water: Floating Solar Market Report. Washington, DC. Available online: http://hdl.handle.net/10986/31880 (accessed on 1 December 2024).
  2. Spencer, R.S.; Macknick, J.; Aznar, A.; Warren, A.; Reese, M.O. Floating photovoltaic systems: Assessing the technical potential of photovoltaic systems on man-made water bodies in the continental United States. Environ. Sci. Technol. 2019, 53, 1680–1689. [Google Scholar] [CrossRef] [PubMed]
  3. Roadmap PV Systemen en Toepassingen. Available online: https://www.uu.nl/sites/default/files/roadmap-pv-systemen-en-toepassingen-final.pdf (accessed on 1 December 2024). (In Dutch).
  4. Floating Solar PV Gains Global Momentum. PV Magazine. Available online: https://www.pv-magazine.com/2020/09/22/floating-solar-pv-gains-global-momentum/ (accessed on 1 December 2024).
  5. Nain, P.; Kumar, A. Understanding the possibility of material release from end-of-life solar modules: A study based on literature review and survey analysis. Renew. Energy 2020, 160, 903–918. [Google Scholar] [CrossRef]
  6. Cazzaniga, R.; Cicu, M.; Rosa-Clot, M.; Rosa-Clot, P.; Tina, G.M.; Ventura, C. Floating PV plants: Performance analysis and design solutions. Renew. Sustain. Energy Rev. 2018, 81, 1730–1741. [Google Scholar] [CrossRef]
  7. Dörenkämper, M.; Wahed, A.; Kumar, A.; De Jong, M.; Kroon, J.; Reindl, T. The cooling effect of floating PV in two different climate zones: A comparison of field test data from the Netherlands and Singapore. Sol. Energy 2021, 214, 239–247. [Google Scholar] [CrossRef]
  8. Ziar, H.; Prudon, B.; Lin, F.-Y.; Roeffen, B.; Heijkoop, F.; Stark, T.; Teurlincx, S.; De Senerpont Domis, L.; Garcia Goma, E.; Garro Extebarria, J.; et al. Innovative floating bifacial photovoltaic solutions for inland water areas. Progr. Photovolt. Res. Appl. 2021, 29, 725–743. [Google Scholar] [CrossRef]
  9. Redón Santafé, M.; Torregrosa Soler, J.B.; Sánchez Romero, F.J.; Ferrer Gisbert, P.S.; Ferrán Gozálvez, J.J.; Ferrer Gisbert, C.M. Theoretical and experimental analysis of a floating photovoltaic cover for water irrigation reservoirs. Energy 2014, 67, 246–255. [Google Scholar] [CrossRef]
  10. Haas, J.; Khalighi, J.; De la Fuente, A.; Gerbersdorf, S.U.; Nowak, W.; Chen, P.W. Floating photovoltaic plants: Ecological impacts versus hydropower operation flexibility. Energy Conv. Manag. 2020, 206, 112414. [Google Scholar] [CrossRef]
  11. Exley, G.; Page, T.; Thackeray, S.J.; Folkard, A.M.; Couture, R.M.; Hernandez, R.R.; Cagle, A.E.; Salk, K.R.; Clous, L.; Whittaker, P.; et al. Floating solar panels on reservoirs impact phytoplankton populations: A modelling experiment. J. Environ. Manag. 2022, 324, 116410. [Google Scholar] [CrossRef]
  12. Cagle, A.E.; Armstrong, A.; Exley, G.; Grodsky, S.M.; Macknick, J.; Sherwin, J.; Hernandez, R.R. The land sparing, water surface use efficiency, and water surface transformation of floating photovoltaic solar energy installations. Sustainability 2020, 12, 8154. [Google Scholar] [CrossRef]
  13. Nugent, D.; Sovacool, B.K. Assessing the lifecycle greenhouse gas emissions from solar PV and wind energy: A critical meta-survey. Energy Policy 2014, 65, 229–244. [Google Scholar] [CrossRef]
  14. Sahu, A.; Yadav, N.; Sudhakar, K. Floating photovoltaic power plant: A review. Renew. Sustain. Energy Rev. 2016, 66, 815–824. [Google Scholar] [CrossRef]
  15. Nain, P.; Kumar, A. Metal dissolution from end-of-life solar photovoltaics in real landfill leachate versus synthetic solutions: One-year study. Waste Manag. 2020, 1, 351–361. [Google Scholar] [CrossRef]
  16. Nover, J.; Zapf-Gottwick, R.; Feifel, C.; Koch, M.; Werner, J.H. Leaching via weak spots in photovoltaic modules. Energies 2021, 14, 692. [Google Scholar] [CrossRef]
  17. Panthi, G.; Bajagain, R.; An, Y.; Jeong, S. Leaching potential of chemical species from real perovskite and silicon solar cells. Process Safety Environ. Protect. 2021, 149, 115–122. [Google Scholar] [CrossRef]
  18. Armstrong, A.; Page, T.; Thackeray, S.J.; Hernandez, R.R.; Jones, I.D. Integrating environmental understanding into freshwater floatovoltaic deployment using an effects hierarchy and decision trees. Environ. Res. Lett. 2020, 15, 114055. [Google Scholar] [CrossRef]
  19. De Lima, R.L.P.; Paxinou, K.; Boogaard, F.C.; Akkerman, O.; Lin, F. In-Situ water quality observations under a large-scale floating solar farm using sensors and underwater drones. Sustainability 2021, 13, 6421. [Google Scholar] [CrossRef]
  20. Exley, G.; Armstrong, A.; Page, T.; Jones, I.D. Floating photovoltaics could mitigate climate change impacts on water body temperature and stratification. Sol. Energy 2021, 219, 24–33. [Google Scholar] [CrossRef]
  21. Wagner, C.; Adrian, R. Cyanobacteria dominance: Quantifying the effects of climate change. Limnol. Ocean. 2009, 54, 2460–2468. [Google Scholar] [CrossRef]
  22. Marsden, M.W. Lake restoration by reducing external phosphorus loading: The influence of sediment phosphorus release. Freshw. Biol. 1989, 21, 139–162. [Google Scholar] [CrossRef]
  23. Visser, P.M.; Verspagen, J.M.H.; Sandrini, G.; Stal, L.J.; Matthijs, H.C.P.; Davis, T.W.; Paerl, H.W.; Huisman, J. How rising CO2 and global warming may stimulate harmful cyanobacterial blooms. Harmful Algae 2016, 54, 145–159. [Google Scholar] [CrossRef]
  24. Van Westreenen, A.; Zhang, N.; Kaiser, E.; Morales, A.; Evers, J.; Anten, N.; Marcelis, L. Rapid irradiance fluctuations occur in a greenhouse: Quantification and implication. Biosyst. Eng. 2023, 235, 215–229. [Google Scholar] [CrossRef]
  25. Poole, H.H.; Atkins, W.R.G. Photo-electric measurement of submarine illumination throughout the year. J. Mar. Biol. Assoc. U.K. 1929, 16, 297–324. [Google Scholar] [CrossRef]
  26. Middelboe, A.L.; Markager, S. Depth limits and minimum light requirements of freshwater macrophytes. Freshw. Biol. 1997, 37, 553–568. [Google Scholar] [CrossRef]
  27. Mathijssen, D.; Hofs, B.; Spierenburg-Sack, E.; Van Asperen, R.; Van der Wal, A.; Vreeburg, J.; Ketelaars, H. Potential impact of floating solar panels on water quality in reservoirs; pathogens and leaching. Water Pract. Technol. 2020, 15, 807–811. [Google Scholar] [CrossRef]
  28. NEN-EN-ISO 7899-2:2000; Water Quality-Detection and Enumeration of Intestinal Enterococci-Part 2: Membrane Filtration Method. Royal Netherlands Standardization Institute: Delft, The Netherlands, 2000. Available online: https://www.nen.nl/en/nen-en-iso-7899-2-2000-en-58860 (accessed on 1 December 2024).
  29. NEN-EN-ISO 9308-1:2014; Water Quality-Enumeration of Escherichia coli and Coliform Bacteria-Part 1: Membrane Filtration Method for Waters with Low Bacterial Background Flora. Royal Netherlands Standardization Institute: Delft, The Netherlands, 2014. Available online: https://www.nen.nl/en/nen-en-iso-9308-1-2014-en-199719 (accessed on 1 December 2024).
  30. Herb, W.R.; Stafan, H.G. Dynamics of vertical mixing in a shallow lake with submersed macrophytes. Water Resour. Res. 2005, 41, W02023. [Google Scholar] [CrossRef]
  31. Torma, P.; Wu, C.H. Temperature and circulation dynamics in a small and shallow lake: Effects of weak stratification and littoral submerged macrophytes. Water 2019, 11, 128. [Google Scholar] [CrossRef]
  32. Kovtun-Kante, A.; Torn, K.; Kotta, J. In situ production of charophyte communities under reduced light conditions in a brackish-water ecosystem. Est. J. Ecol. 2014, 63, 28–38. [Google Scholar] [CrossRef]
  33. Scheffer, M.; Rinaldi, S.; Gragnani, A.; Mur, L.R.; Van Nes, E.H. On the Dominance of filamentous cyanobacteria in shallow, turbid lakes. Ecology 1997, 78, 272–282. [Google Scholar] [CrossRef]
  34. Erratt, K.J.; Creed, I.F.; Freeman, E.C.; Trick, C.G.; Westrick, J.; Birbeck, J.A.; Watson, C.; Zastepa, A. Deep cyanobacteria layers: An overlooked aspect of managing risks of cyanobacteria. Environ. Sci. Technol. 2022, 56, 17902–17912. [Google Scholar] [CrossRef]
  35. Grossman, A.R.; Schaefer, M.R.; Chiang, G.G.; Collier, J.L. The phycobilisome, a light-harvesting complex responsive to environmental conditions. Microbiol. Rev. 1993, 57, 725–749. [Google Scholar] [CrossRef]
  36. Tandeau de Marsac, N. Phycobiliproteins and phycobilisomes: The early observations. Photosynth. Res. 2003, 76, 193–205. [Google Scholar] [CrossRef] [PubMed]
  37. Gushulak, C.A.C.; Mezzini, S.; Moir, K.E.; Simpson, G.L.; Bunting, L.; Wissel, B.; Engstrom, D.R.; Laird, K.R.; St. Amand, A.; Cumming, B.F.; et al. Impacts of a century of land-use change on the eutrophication of large, shallow, prairie Lake Manitoba in relation to adjacent Lake Winnipeg (Manitoba, Canada). Freshwat. Biol. 2024, 69, 47–63. [Google Scholar] [CrossRef]
  38. Watermann, F.; Hillebrand, H.; Gerdes, G.; Krumbein, W.E.; Sommer, U. Competition between benthic cyanobacteria and diatoms as influenced by different grain sizes and temperatures. Mar. Ecol. Progr. Ser. 1999, 187, 77–87. [Google Scholar] [CrossRef]
  39. Søndergaard, M.; Phillips, G.; Hellsten, S.; Kolada, A.; Ecke, F.; Mäemets, H.; Mjelde, M.; Azzella, M.M.; Oggioni, A. Maximum growing depth of submerged macrophytes in European lakes. Hydrobiologia 2013, 704, 165–177. [Google Scholar] [CrossRef]
  40. Quiblier, C.; Wood, S.; Echenique-Subiabre, I.; Heath, M.; Villeneuve, A.; Humbert, J. A review of current knowledge on toxic benthic freshwater cyanobacteria–ecology, toxin production and risk management. Water Res. 2013, 47, 5464–5479. [Google Scholar] [CrossRef]
  41. Rangel, M.; Martins, J.C.G.; Garcia, N.A.; Conserva, G.A.A.; Costa-Neves, A.; Sant’Anna, C.L.; De Carvalho, L.R. Analysis of the toxicity and histopathology induced by the oral administration of Pseudanabaena galeata and Geitlerinema splendidum (cyanobacteria) extracts to mice. Mar. Drugs 2014, 12, 508–524. [Google Scholar] [CrossRef]
  42. Piriou, P.; Devesa, R.; De Lalande, M.; Glucina, K. European reassessment of MIB and geosmin perception in drinking water. European reassessment of MIB and geosmin perception in drinking water. J. Water Supply Res. Technol.-AQUA 2009, 58, 532–538. [Google Scholar] [CrossRef]
  43. Jüttner, F.; Watson, S.B. Biochemical and ecological control of geosmin and 2-methylisoborneol in source waters. Appl. Environ. Microbiol. 2007, 73, 4395–4406. [Google Scholar] [CrossRef]
  44. Slater, G.P.; Blok, V.C. Volatile compounds of the Cyanophyceae—A review. Water Sci. Technol. 1983, 15, 181–190. [Google Scholar] [CrossRef]
  45. Klatt, J.; Meyer, S.; Häusler, S.; Macalady, J.L.; De Beer, D.; Polerecky, L. Structure and function of natural sulphide-oxidizing microbial mats under dynamic input of light and chemical energy. ISME J. 2016, 10, 921–933. [Google Scholar] [CrossRef]
  46. Lichtenberg, M.; Cartaxana, P.; Kühl, M. Vertical migration optimizes photosynthetic efficiency of motile cyanobacteria in a coastal microbial mat. Front. Mar. Sci. 2020, 7, 359. [Google Scholar] [CrossRef]
  47. Jeppesen, E.; Jensen, J.P.; Søndergaard, M.; Lauridsen, T.; Pedersen, L.J.; Jensen, L. Top-down control in freshwater lakes: The role of nutrient state, submerged macrophytes and water depth. Hydrobiologia 1997, 342, 151–164. [Google Scholar] [CrossRef]
  48. Wetzel, R.G. Limnology: Lake and River Ecosystems, 3rd ed.; Academic Press: San Diego, CA, USA, 2001. [Google Scholar]
  49. Kraak, M.H.S.; Lavy, D.; Peeters, W.H.M.; Davids, C. Chronic ecotoxicity of copper and cadmium to the zebra mussel Dreissena polymorpha. Arch. Environ. Contam. Toxicol. 1992, 23, 363–369. [Google Scholar] [CrossRef] [PubMed]
  50. Gergs, R.; Karl-Otto, R. Effects of zebra mussels on a native amphipod and the invasive Dikerogammarus villosus: The influence of biodeposition and structural complexity. J. N. Am. Benthol. Soc. 2008, 27, 541–548. [Google Scholar] [CrossRef]
  51. Kobak, J.; Jermacz, Ł.; Płąchocki, D. Effectiveness of zebra mussels to act as shelters from fish predators differs between native and invasive amphipod prey. Aquat. Ecol. 2014, 48, 397–408. [Google Scholar] [CrossRef]
  52. Foster, K.W.; Smyth, R.D. Light antennas in phototactic algae. Microbiol. Rev. 1980, 44, 572–630. [Google Scholar] [CrossRef]
  53. Bastviken, D.T.E.; Caraco, N.F.; Cole, J.J. Experimental measurements of zebra mussel (Dreissena polymorpha) impacts on phytoplankton community composition. Freshwat. Biol. 1998, 39, 375–386. [Google Scholar] [CrossRef]
  54. Karpowicz, M.; Feniova, I.Y.; Sakharova, E.G.; Gorelysheva, Z.I.; Więcko, A.; Górniak, A.; Dzialowski, A.R. Top-down and bottom-up control of phytoplankton communities by zebra mussels Dreissena polymorpha (Pallas, 1771). Sci. Total Environ. 2023, 877, 162899. [Google Scholar] [CrossRef]
  55. Yamamichi, M.; Kazama, T.; Tokita, K.; Katano, I.; Doi, H.; Yoshida, T.; Hairston, N.G., Jr.; Urabe, J. A shady phytoplankton paradox: When phytoplankton increases under low light. Proc. R. Soc. B 2018, 285, 20181067. [Google Scholar] [CrossRef]
  56. Bramm, M.E.; Lassen, M.K.; Liboriussen, L.; Richardson, K.; Ventura, M.; Jeppesen, E. The role of light for fish-zooplankton-phytoplankton interactions during winter in shallow lakes—A climate change perspective. Freshw. Biol. 2009, 54, 1093–1109. [Google Scholar] [CrossRef]
  57. Ilgen, K.; Schindler, D.; Wieland, S.; Lange, J. The impact of floating photovoltaic power plants on lake water temperature and stratification. Sci. Rep. 2023, 13, 7932. [Google Scholar] [CrossRef] [PubMed]
  58. Fox, A.D.; Stīpniece, A. Interactions between stoneworts (Charales) and waterbirds. Biol. Rev. Camb. Philos. Soc. 2024, 99, 390–408. [Google Scholar] [CrossRef] [PubMed]
  59. Van Breemen, L.W.C.A.; Ketelaars, H.A.M.; Visser, P.; Ebbeng, J.H. A new method to control growth of geosmin producing benthic cyanobacteria. Verh. Internat. Verein. Limnol. 1991, 24, 2168–2173. [Google Scholar] [CrossRef]
  60. Wood, S.A.; Kelly, L.; Bouma-Gregson, K.; Humbert, J.F.; Laughinghouse, H.D., 4th; Lazorchak, J.; McAllister, T.; McQueen, A.; Pokrzywinski, K.; Puddick, J.; et al. Toxic benthic freshwater cyanobacterial proliferations: Challenges and solutions for enhancing knowledge and improving monitoring and mitigation. Freshw. Biol. 2020, 65, 1824–1842. [Google Scholar] [CrossRef]
  61. Piel, T.; Sandrini, G.; Weenink, E.F.J.; Qin, H.; Herk, M.J.V.; Morales-Grooters, M.L.; Schuurmans, J.M.; Slot, P.C.; Wijn, G.; Arntz, J.; et al. Shifts in phytoplankton and zooplankton communities in three cyanobacteria-dominated lakes after treatment with hydrogen peroxide. Harmful Algae 2024, 133, 102585. [Google Scholar] [CrossRef]
  62. Geer, T.D.; Calomeni, A.J.; Kinley, C.M.; Iwinski, K.J.; Rodgers, J.H. Predicting in situ responses of taste-and odor-producing algae in a Southeastern US reservoir to a sodium carbonate peroxyhydrate algaecide using a laboratory exposure-response model. Water Air Soil Poll. 2017, 228, 53. [Google Scholar] [CrossRef]
  63. Calomeni, A.J.; Iwinski, K.J.; Kinley, C.M.; McQueen, A.; Rodgers, J.H., Jr. Responses of Lyngbya wollei to algaecide exposures and a risk characterization associated with their use. Ecotoxicol. Environm. Safety 2015, 116, 90–98. [Google Scholar] [CrossRef]
  64. McLaughlan, C.; Aldridge, D.C. Cultivation of zebra mussels (Dreissena polymorpha) within their invaded range to improve water quality in reservoirs. Water Res. 2013, 47, 4357–4369. [Google Scholar] [CrossRef]
  65. Mackie, G.L.; Claudi, R. Monitoring and Control of Macrofouling Mollusks in Fresh Water Systems, 2nd ed.; Taylor & Francis Group: Boca Raton, FL, USA, 2010. [Google Scholar]
  66. Donskoy, D.M.; Ludyanskiy, M.; Wright, D.A. Effects of sound and ultrasound on Zebra Mussels. J. Acoust. Soc. Am. 1996, 99, 2577–2603. [Google Scholar] [CrossRef]
  67. Lürling, M.; Tolman, Y. Beating the blues: Is there any music in fighting cyanobacteria with ultrasound? Water Res. 2014, 66, 361–373. [Google Scholar] [CrossRef]
  68. NEN-EN 15204:2006; Water Quality-Guidance Standard on the Enumeration of Phytoplankton Using Inverted Microscopy (Utermöhl Technique). Royal Netherlands Standardization Institute: Delft, The Netherlands, 2006. Available online: https://www.nen.nl/en/nen-en-15204-2006-en-109691 (accessed on 1 December 2024).
  69. French, J.R.P., III; Adams, J.V.; Craig, J.; Stickel, R.G.; Nichols, S.J.; Fleischer, G.W. Shell-free biomass and population dynamics of dreissenids in offshore Lake Michigan, 2001–2003. J. Great Lakes Res. 2007, 33, 536–545. [Google Scholar] [CrossRef]
  70. Chorus, I.; Welker, M. Toxic Cyanobacteria in Water: A Guide to Their Public Health Consequences, Monitoring and Management, 2nd ed.; CRC Press: London, UK, 2021. [Google Scholar] [CrossRef]
Figure 1. Location and photograph of the sun-tracking FPV system applied at the shallow drinking water reservoir at Kralingen, Rotterdam. The names indicate the different sampling points: “Pontoon open water” is located approximately 35 m from the edge of the FPV system, “FPV system” is at the centre of the FPV system (55 m from the edge), and “Return water” is water from the south-east edge of the reservoir that is pumped (returned) to the treatment plant. The sampling points “Edge” and “Centre” are used only for the diving inspections.
Water 17 01178 g001
Figure 2. Coverage of macrophytes, benthic algae, and benthic cyanobacteria before and after installation of the FPV system. The x-axis indicates the inspected site and time at which a diving inspection took place. ”Edge” indicates the bottom at the edge of the FPV system, and “Centre” indicates the bottom area below the centre of the FPV system.
Water 17 01178 g002
Figure 3. Differences in light conditions between open water and under the FPV system. (A) Calculated average amount of direct light (photosynthetically active radiation, PAR) per day that reaches the water surface under the FPV system compared to open water. (B) Calculated photosynthetic photon flux density (PPFD) without vegetation at the bottom in open water (blue) and the average at the bottom under the FPV system (orange) for each hour, 2020–2022. (C) Depths of the reservoir under the FPV system (black) and calculated depths at which 1% of surface PPFD remains (Zcyano) in open water (blue) and under the FPV system (average per day, orange). (D) Depths of the reservoir under the FPV system (black) and calculated depths at which 3% of surface PPFD remains (Zchara) in open water (blue) and under the FPV system (average per day, orange).
Water 17 01178 g003
Figure 4. Phytoplankton and zooplankton biovolumes in open water and under the FPV system. (A) Phytoplankton biovolumes in open water, (B) phytoplankton biovolumes under the FPV system, (C) zooplankton biovolumes in open water, and (D) zooplankton biovolumes under the FPV system. On some days, samples were not taken under the FPV system; this is the case when a date is shown for open water but not for under the FPV system. Dates are displayed in the format: dd-mm-yy. Detailed information about the phytoplankton composition can be found in the Supplementary Materials, Table S3.
Water 17 01178 g004
Figure 5. Heatmaps of temperature and oxygen profiles in open water and under the FPV system and the differences between the locations. (A) Oxygen concentration in open water. (B) Oxygen concentration under the FPV system. (C) Temperature in open water. (D) Temperature under the FPV system. (E) Differences in temperature between open water and FPV system. (F) Differences in oxygen concentration between open water and FPV system. A positive difference indicates a higher value under the FPV system. The black dots indicate the individual measurements. The blank areas indicate no measurement nearby.
Water 17 01178 g005
Figure 6. Temperature measurements at 1.5 m depth before and after installation of the FPV system. (A) Temperature of reservoir in 2016–2019 and model (fourth-degree polynomial) fitted to the data (black line). (B) Temperature in 2020–2022 in open water with model from panel (A) (black line). (C) Temperature in 2020–2022 under the FPV system with model from panel (A) (black line). (D) Deviations of temperature measurements of 2016–2019 compared to model from panel (A). (E) Deviations of temperature measurements of 2020–2022 in open water compared to model from panel (A). (F) Deviations of temperature measurements of 2020–2022 under the FPV system compared to model from panel (A). The grey lines are margins indicating ±2 standard deviations of the model.
Water 17 01178 g006
Table 1. Detected benthic cyanobacteria under the FPV system and measured concentrations of geosmin, 2-methylisoborneol (2-MIB), and cyanotoxins.
DateBenthic Cyanobacteria Identified by Microscopy (in Order of Decreasing Dominance)Samples for
Analyses of
Compounds
Taste and Odour
Compounds
(ng L−1)
Cyanotoxins
(µg g−1 Wet Weight)
19 July 2019No benthic cyanobacterial mats detected (before FPV)-n.a.n.a.
30 July 2020Gomphosphaeria aponina-n.a.n.a.
10 March 2021Gomphosphaeria aponina-n.a.n.a.
29 July 2021Gomphosphaeria aponina; Phormidium cf. breve; Phormidium cf. tenue; Pseudanabaena sp.Middle of water column under centre of FPV2.8 (geosmin)
2.7 (2-MIB)
n.a.
Benthic mat under FPVn.a.0.014 (anatoxin-a)
26 July 2022Phormidium breve, Phormidium sp., Microcystis aeruginosa *, Pseudanabaena sp.Water under FPV just above benthic mat20 (geosmin)
0.8 (2-MIB)
n.a.
Benthic mat under FPVn.a.8.8 (microcystins; 89% MC-LR)
Notes: n.a.: not analysed; * M. aeruginosa is a planktonic species.
Table 2. Density and condition index of Dreissena mussels in the shallow and reference reservoir. See Supplementary Materials, Figure S25, for the size distributions of the mussels.
LocationDateDensity (n m−2)Average Condition Index 1 (n; s.d.)Significant Differences in Condition Index 1
Pontoon open water
(shallow reservoir)
30 July 20202250n.a. 2-
Pontoon open water
(shallow reservoir)
10 March 2021240207.7 (25; 35.5)Group a
Pontoon open water
(shallow reservoir)
29 July 2021104,00089.2 (20; 22.5)Group b
Pontoon open water
(shallow reservoir)
26 July 202223,00061.8 (24; 11.0)Group d
FPV system
(shallow reservoir)
30 July 2020n.d.n.d.-
FPV system
(shallow reservoir)
10 March 2021n.d.n.d.-
FPV system
(shallow reservoir)
29 July 2021600n.a.-
FPV system
(shallow reservoir)
26 July 202211,50062.8 (24; 9.3)Group d
Petrusplaat reservoir *9 March 2021n.a.37.0 (25; 8.2)Group c
Petrusplaat reservoir *2 August 2021n.a.41.6 (25; 14.2)Group c
Petrusplaat reservoir *26 July 2022n.a.50.0 (24; 16.4)Group cd
Notes: 1 One-way ANOVA with α = 0.01 and Games–Howell post hoc test; different letters indicate significant differences. 2 Individuals too small for reproduction. * Reference reservoir. n.d.: not detected, n.a.: not analysed, and s.d.: standard deviation.
Table 3. Numbers of water birds before and after installation of the FPV system.
Water Birds
(Family)
A: November 2014–February 2015
(Before FPV System, n = 17)
B: November 2019–February 2020
(Before FPV System, n = 17)
C: November 2020–February 2021
(with FPV System, n = 17)
A Different from B 1B Different from C 1A Different from C 1
Avg.
(Min; Max)
Median
(Quartile 1; Quartile 3)
Avg.
(Min; Max)
Median
(Quartile 1; Quartile 3)
Avg.
(Min; Max)
Median
(Quartile 1; Quartile 3)
Rallidae29.8
(1; 64)
29.0
(2; 55)
99.8
(2; 339)
6
(4; 267)
63.2
(14; 139)
64
(30; 85)
No
(p = 0.448)
No
(p = 0.241)
Yes
(p = 0.008)
Anatidae197
(8; 462)
178
(84; 270)
111
(19; 320)
71
(42.5; 154)
91.4
(9; 237)
75
(42.5; 153)
Yes
(p = 0.048)
No
(p = 0.679)
Yes
(p = 0.016)
Lardidae21.6
(0; 81)
8
(2.5; 44)
24.6
(1; 71)
20
(10.5; 33.5)
23.2
(6; 75)
15
(10; 27.5)
No
(p = 0.190)
No
(p = 0.629)
No
(p = 0.196)
Phalacrocoracidae0.529
(0; 5)
0
(0; 0.5)
3.35
(1; 20)
1
(1; 4)
1.94
(0; 9)
1
(0; 3.5)
Yes
(p < 0.001)
No
(p = 0.170)
Yes
(p = 0.019)
Podicipedidae2.88
(1; 6)
2
(2; 4.5)
1.94
(0; 4)
2
(1; 3)
3.35
(0; 7)
3
(1.5; 5.5)
No
(p = 0.130)
No
(p = 0.095)
No
(p = 0.648)
Ardeidae0
(0; 0)
0
(0; 0)
0.353
(0; 2)
0
(0; 1)
0.294
(0; 1)
0
(0; 1)
Yes
(p = 0.019)
No
(p = 0.931)
Yes
(p = 0.018)
Charadriiformes0.412
(0; 4)
0
(0; 0)
0.529
(0; 3)
0
(0; 1)
0
(0; 0)
0
(0; 0)
No
(p = 0.487
Yes
(p = 0.019)
No
(p = 0.080)
Alcedinidae0
(0; 0)
0
(0; 0)
0.353
(0; 1)
0
(0; 1)
0.176
(0; 1)
0
(0; 0)
Yes
(p = 0.008)
No
(p = 0.260)
No
(p = 0.080)
Note: 1 Based on the non-parametric Mann–Whitney U test.
Table 4. Concentrations of faecal bacteria before and after installation of the FPV system.
Bacterial GroupApril 2016–March 2020 (Before FPV System)April 2020–March 2022 (with FPV System)Difference Between Two Periods 2
nAverage Concentration (Min; Max) 1Median Concentration (Quartile 1; Quartile 3) 1nAverage Concentration (Min; Max) 1Median Concentration (Quartile 1; Quartile 3) 1
Bacteria of the coli group21281.6 (0; 4100)10.9 (3.00; 32)10223.7 (0; 275)13.7 (4.00; 29.0)No (p = 0.359)
E. coli21332.9 (0; 1700)8.00 (2.00; 26.5)10219.2 (0; 275)10.8 (3.00; 25.6)No (p = 0.256)
Enterococci21325.5 (0; 450)6.00 (1.00; 19.5)10236.8 (0; 610)13.5 (5.00; 29.8)Yes (p < 0.001)
Intestinal enterococci2138.84 (0; 264)2.00 (0; 5.65)10211.5 (0; 312)4.80 (1.00; 10.8)Yes (p = 0.004)
Notes: 1 Concentrations are in colony-forming units (CFU) 100 mL−1. 2 Based on the non-parametric Mann–Whitney U test.
Table 5. Summary of observed effects after installation of the FPV system on the shallow drinking water reservoir.
ParameterObserved Effect
Macrophytes, benthic algae, and benthic cyanobacteriaShift from macrophytes and benthic algae to toxin and taste-and-odour producing benthic cyanobacteria under the FPV system
MacroinvertebratesSome groups absent under the FPV system
BiofoulingMassive development of Dreissena mussels, which also increases the number of Dreissena larvae; attachment of green algae and some sponges
Metals and metalloidsIncreased concentrations of copper, manganese, and zinc, but well below threshold values
Light (PAR)Lower and not homogeneous under FPV system;
under FPV system insufficient light for Chara and macrophytes, but
enough light for benthic cyanobacteria
TransparencyNo difference with open water; overall increase by filtering effect of mussels attached to FPV system
NutrientsNo difference compared to open water
PhytoplanktonOverall, very similar to open water; overall decrease due to mussels attached to FPV system; increase in planktonic cyanobacteria
ZooplanktonSometimes higher biovolume under FPV system or in open water
Temperature and oxygen profilesNo large differences to open water, except for on warm sunny days;
small but not significant decrease in water temperature after installation of FPV system
Bird counts No large changes
Bird droppingsAccumulation on cable pontoons, but hardly on FPV system
Faecal bacteriaNo increase in E. coli, slight increase in intestinal enterococci
Disclaimer/Publisher’s Note: The statements, opinions and data contained in all publications are solely those of the individual author(s) and contributor(s) and not of MDPI and/or the editor(s). MDPI and/or the editor(s) disclaim responsibility for any injury to people or property resulting from any ideas, methods, instructions or products referred to in the content.

