Article

Evaluation of Leaf Water Content in Watermelon Based on Hyperspectral Reflectance

1
College of Horticulture and Gardening, Yangtze University, Jingzhou 434025, China
2
Institute of Economic Crops, Hubei Academy of Agricultural Sciences, Wuhan 430064, China
3
Hubei Key Laboratory of Spices & Horticultural Plant Germplasm Innovation & Utilization, Jingzhou 434025, China
*
Authors to whom correspondence should be addressed.
Water 2025, 17(8), 1142; https://doi.org/10.3390/w17081142
Submission received: 3 March 2025 / Revised: 4 April 2025 / Accepted: 6 April 2025 / Published: 10 April 2025
(This article belongs to the Section Water, Agriculture and Aquaculture)

Abstract

:
Water is a crucial element for the growth of watermelon plants, making rapid and non-destructive monitoring of plant water content vital for precision irrigation in watermelon farming. While previous research has demonstrated the sensitivity of short-wave infrared (SWIR) bands to plant water content, their high costs limit widespread application. In contrast, visible and near-infrared (VNIR) spectral instruments offer significant advantages in terms of affordability, compactness, and spectral resolution. However, their potential for predicting the leaf water content (LWC) of watermelon plants has yet to be fully investigated. This study aims to assess the efficacy of hyperspectral reflectance measured with VNIR spectral instruments in estimating the LWC of watermelon plants at various leaf layers. Hyperspectral reflectance data (350−1100 nm) were collected from three leaf layers (upper, middle, and lower) under various drought treatments. Models for estimating LWC were developed using both spectral indices and full wavelength data. The results indicated that the middle leaf layer was the most effective for estimating LWC, and using full wavelength data achieved higher accuracy in LWC estimation. Furthermore, compared to the simple regression model, the AdaBoost-based machine learning model demonstrated superior performance, achieving an R2 of 0.9636 in estimating LWC through five-fold cross-validation, which indicates high predictive accuracy. Ensemble learning significantly outperforms traditional methods, providing a substantial improvement in model accuracy. The findings offer important technical assistance for the spectral monitoring of LWC and precision irrigation in watermelon cultivation.

1. Introduction

Leaf water content (LWC) is a straightforward indicator of a plant’s hydration status and plays a critical role in various physiological and biochemical processes, such as photosynthesis and transpiration. Given its direct influence on crop growth, development, and yield, accurate and rapid assessment of crop water status is essential for optimizing water resource utilization and enhancing crop quality and yield [1,2,3].
The conventional method for measuring plant water content (PWC), which involves oven-drying plant samples, is straightforward and reliable. However, it is also slow and labor-intensive. This traditional approach requires destructive sampling and involves a time-consuming process, making it challenging to capture the dynamic changes in the water content of individual plants [4]. Therefore, it is very urgent to develop a large-scale, real-time monitoring technique for PWC.
Compared with traditional methods, emerging hyperspectral technology can acquire the reflectance of plants in the visible (VIS), near-infrared (NIR), and short-wave infrared (SWIR) spectral regions and has become an important means for rapid and non-destructive monitoring of plant growth conditions. Researchers have used spectrometers to capture hyperspectral reflectance from plant canopies to monitor PWC [5,6,7]. However, this method relies on the availability of sunlight. Therefore, developing an estimation model for PWC based on leaf-level hyperspectral reflectance is crucial for enhancing effective water management in plants.
Thomas et al. [8] found that the reflectance of plant leaves in the 1450–1930 nm wavelength range is significantly correlated with leaf water content. Carter [9] demonstrated that reflectance at 1450 nm, 1950 nm, and 2500 nm is particularly sensitive to water content in plant leaves. Subsequent studies have used these wavelengths to develop estimation models for assessing crop leaf water status [10].
Although spectral information in the wavelength range above 1000 nm is closely related to plant water status, the associated equipment is relatively expensive, which limits its widespread application. In contrast, devices that measure visible and near-infrared spectral reflectance are more affordable and have been widely used for spectral diagnosis of crop water status. Holben et al. [11] identified the 760–900 nm band as optimal for detecting water stress in soybeans (Glycine max). Similarly, Inoue et al. [12] suggested that reflectance in the 950–970 nm range could be used to estimate the relative water content of canopy leaves. Peñuelas et al. [13,14] also noted a weaker water absorption peak within the 950–970 nm near-infrared range, demonstrating its effectiveness for monitoring plant water content.
To meet the precision requirements of crop water management, it is crucial to enhance the accuracy of monitoring models. Preprocessing spectral information, such as taking reciprocals, logarithms, and derivatives, can reduce the interference of background noise and thereby improve model accuracy. Compared with traditional methods, machine learning (ML) is an innovative data analysis and processing algorithm that can effectively utilize multi-band information for monitoring agricultural systems [15]. For example, Random Forest (RF), as an effective classification and regression method, has been widely used to assess the above-ground biomass of C3 and C4 grasses [16]. Additionally, the Support Vector Machine (SVM) has also proven to be a highly effective method for modeling the relationship between spectral reflectance and leaf water status [17]. Moreover, Mirzaie et al. [18] demonstrated that Partial Least Squares Regression (PLSR) can accurately estimate PWC.
Watermelon (Citrullus lanatus L.) is a globally significant horticultural crop recognized for its high economic value. In many regions, watermelon irrigation largely depends on human experience, leading to low irrigation water use efficiency [19]. However, the advent of intelligent drip fertigation systems, which utilize hyperspectral data for optimizing irrigation scheduling, offers a scientific method to address this challenge [20]. To date, there have been limited studies focused on employing hyperspectral technology for predicting the LWC of watermelon plants. Thus, the aim of this study was to construct a model for estimating LWC in watermelon plants utilizing hyperspectral reflectance data. To accomplish this goal, we tried to identify the most suitable leaf layer for estimating the LWC in watermelon plant under various drought treatments, compares the effectiveness of spectral indices versus full wavelength data in estimating the LWC of watermelon plants, and establish an estimation model for the LWC of watermelon plant utilizing machine learning techniques.

2. Materials and Methods

2.1. Plant Culture

This experiment was conducted in a greenhouse at the College of Horticulture and Gardening, Yangtze University, in Jingzhou, China. The watermelon cultivar Changxin No. 1 was used as the experimental material, known for its few seeds, high quality, and strong adaptability. On 5 July 2024, watermelon seeds were sown in a 21-cell plastic plug tray (54 cm × 28 cm). A seedling substrate composed of perlite and vermiculite (v/v, 1:1) was utilized. The seedlings were irrigated daily with a half-strength Hoagland’s nutrient solution. Once the seedlings had developed two fully expanded true leaves, they were transferred to substrate cultivation conditions in pots with a diameter of 20 cm and a height of 40 cm. During the experiment, watermelon plants were grown in a greenhouse at 30 °C/23 °C (day/night), 15 h light/9 h dark, and 70% relative humidity. During the normal growing season, water was added to the pots to maintain the substrate moisture content at 80% of its maximum water-holding capacity.
During the flowering stage of watermelon plants, a continuous drought stress experiment was conducted. This phase occurs in the hot summer, when the plants are actively growing and exhibit high water demands along with heightened sensitivity to water availability. At 3:00 a.m. on August 6th, the substrate in the pots was thoroughly irrigated until excess water drained from the bottom. Irrigation was subsequently halted. When two basal leaves of the watermelon plants showed wilting, this was considered as moderate drought stress, with the substrate water content in the pots being 50 ± 5% of the maximum water-holding capacity. Severe drought stress was established when five basal leaves exhibited wilting, at which point the substrate water content decreased to 30 ± 5% of the maximum water-holding capacity. Based on these criteria, three drought stress treatments were implemented: withholding irrigation for 0 h (T1), 10 h (T2), and 20 h (T3). Following the drought treatments, healthy and uniformly growing watermelon plants were selected for each treatment group, with a total of 80 plants chosen per treatment for measurements of spectral reflectance and leaf water content.
Leaves of watermelon plants were classified into three categories based on their positions: upper (L1), middle (L2), and lower (L3). For each treatment, a total of 80 leaves were collected and measured. The specific definitions of these leaf positions are depicted in Figure 1, where leaves are arranged from top to bottom in the order of their growth sequence. Specifically, L1 (upper) refers to leaves located at the top 1/3 of the plant height, L2 (middle) at the midpoint (1/2), and L3 (lower) at the 2/3 point from the top leaves to the bottom leaves.

2.2. Hyperspectral Reflectance Measurements

Leaf reflectance spectra were measured using an AvaField-1, a handheld ground spectrometer manufactured by AVANTES B.V. This spectrometer was operated within an effective wavelength range of 350–1100 nm, with a sampling interval of 0.6 nm and a spectral resolution of 1.5 nm. Before each measurement, the spectrometer was calibrated using a white plate with a reflectance of 100%. The central area of each leaf was targeted for spectral reflectance measurements. The reflectance spectra were subsequently processed with AvaReader software Beta 0.8 (AVANTES B.V., Apeldoorn, The Netherlands). To ensure the accuracy and reliability of the measurements, three replicate measurements were conducted for each leaf layer position (upper, middle, and lower), and the average value of these measurements was recorded as the spectral reflectance.

2.3. Determination of Plant Leaf Water Content (LWC)

A total of 720 fresh watermelon leaves were collected, and their fresh weight (FW) was immediately measured. These samples were subsequently placed in an oven, initially dried at 105 °C for 30 min, and then dried at a reduced temperature of 75 °C until a constant weight was achieved. This final weight is termed the dry weight (DW). The leaf water content of the plants is defined as follows:
LWC = (FW − DW)/FW × 100%

2.4. Calculation of Spectral Vegetation Indices

This study employed eleven classical spectral indices to assess their efficacy in estimating the LWC of watermelons (Table 1).

2.5. Model Training and Evaluation

The collected samples were randomly partitioned into two groups: a training set accounting for 70% and a testing set for 30%. To develop models for estimating LWC, both simple linear regression and machine learning techniques were utilized. Specifically, simple linear regression models for LWC at various leaf layers of the watermelon plant were established using individual vegetation indices. Meanwhile, machine learning models were built incorporating vegetation indices and full wavelength data spanning from 350 to 1100 nm as predictive variables.
Four algorithms, including Random Forest (RF) [31], Adaptive Boosting (AdaBoost) [32], Gradient Boosting Decision Tree (GBDT) [33], and Categorical Boosting (Catboost) [34], were selected to establish machine models for estimating the LWC in different leaf layers of watermelon plants. The machine learning models were implemented using the scikit-learn library and executed in Anaconda 4.14.0 on a computer. Among them, Random Forest (RF) is an ensemble learning algorithm based on bagging that leverages the strengths of multiple decision trees to provide accurate and robust predictions; Adaptive Boosting (AdaBoost) is a powerful boosting algorithm that enhances the performance of weak classifiers by focusing on their errors and aggregating their predictions; Gradient Boosting Decision Tree (GBDT) is a flexible machine learning algorithm that integrates the benefits of decision trees and gradient boosting to produce highly accurate predictive models; and Categorical Boosting (CatBoost) is a robust gradient boosting algorithm that utilizes decision trees as base predictors and incorporates techniques such as ordered boosting and gradient bias to mitigate overfitting and enhance predictive performance.
During the model training process, the selection of hyperparameters directly affects the performance of the model. The hyperparameters of each algorithm were optimized using RandomizedSearchCV with five-fold cross-validation. The optimal parameters are as follows: RandomForestRegressor: (n_estimators = 20, max_depth = 2, min_samples_split = 2, min_samples_leaf = 2, random_state = 36); AdaBoostRegressor: (n_estimators = 30, learning_rate = 0.05, loss = ‘square’, random_state = 36); GradientBoostingRegressor: (n_estimators = 100, learning_rate = 0.01, max_depth = 3, min_samples_split = 10, min_samples_leaf = 10, subsample = 0.7, max_features = “sqrt”, random_state = 36); CatBoostRegressor: (iterations = 100, learning_rate = 0.02, depth = 3, loss_function = ‘RMSE’, eval_metric = ‘RMSE’, random_seed = 42, od_type = ‘Iter’, od_wait = 100).
The accuracy of the models was assessed using the coefficient of determination (R2), root mean square error (RMSE), and mean absolute error (MAE). A high R2 value, along with low RMSE and MAE values, indicates high model accuracy. These statistical parameters were calculated using the following formulas:
R 2 = y i y i 2 y ¯ y i 2 R M S E = i = 1 n y i y i 2 n M A E = i = 1 n y i y i n
where n is the number of the sample, and y i , y i , and y ¯ are the observed value, the predicted value, and the mean of the observed values, respectively.

3. Results

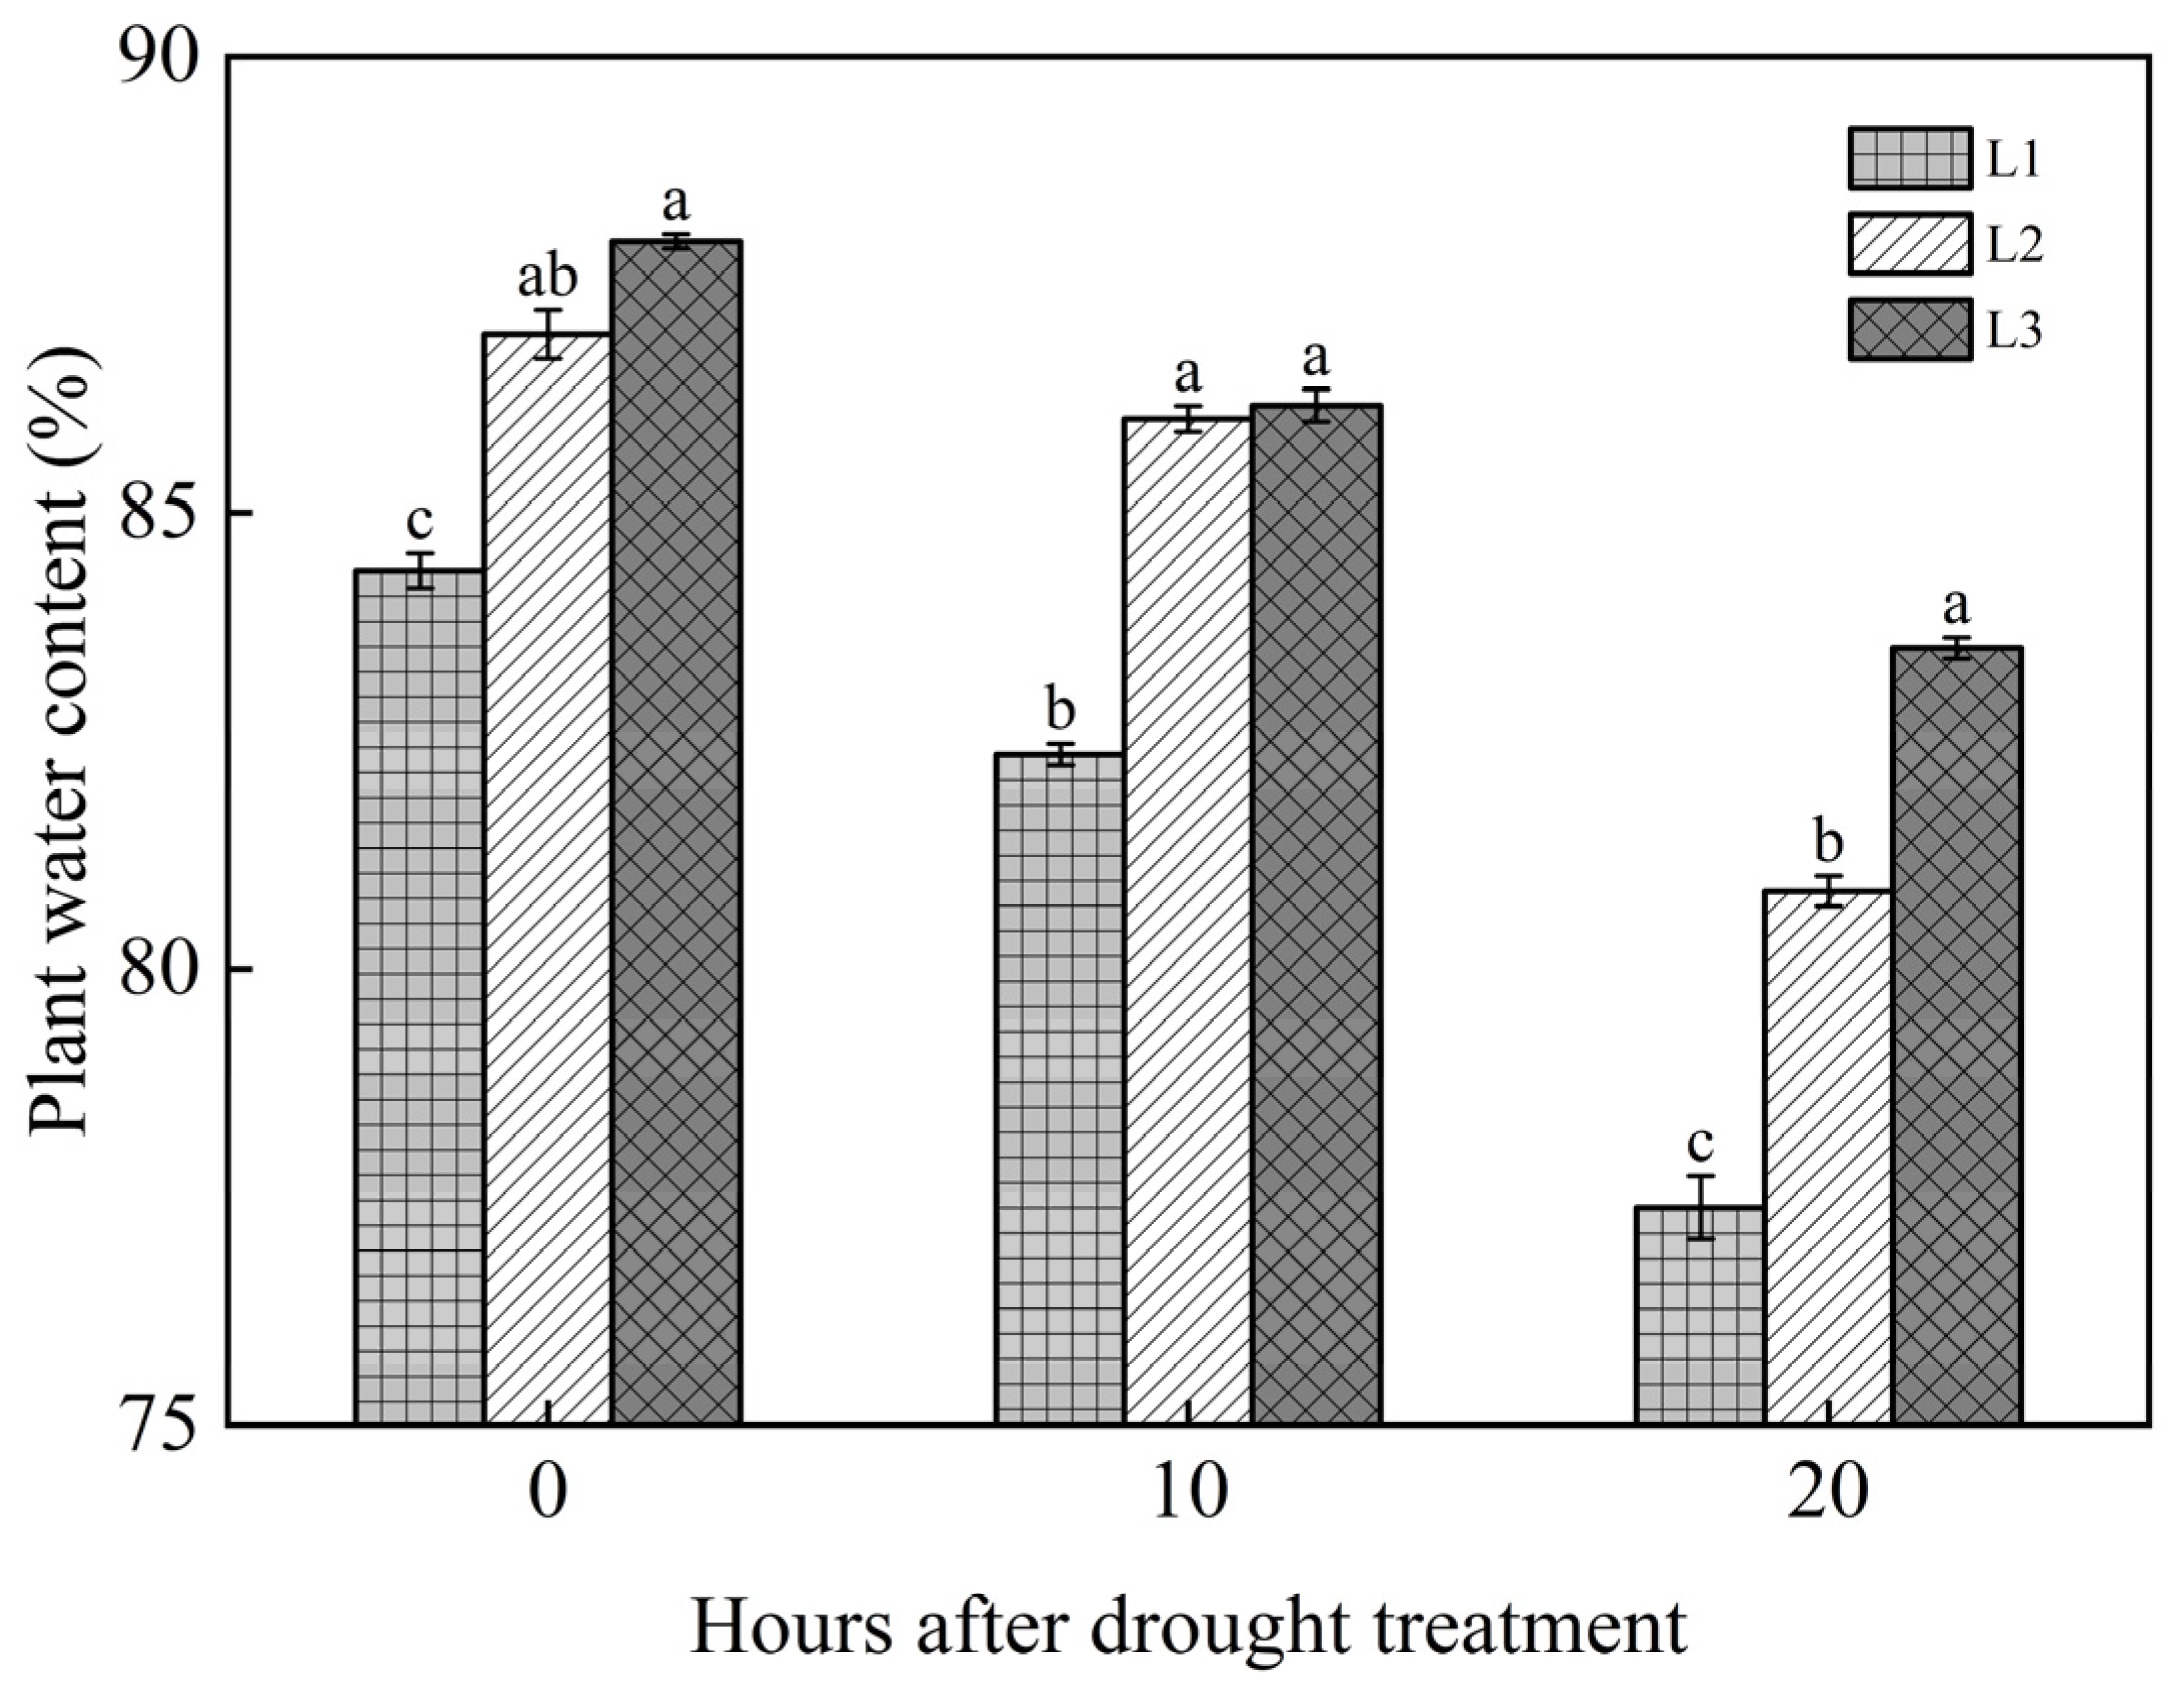
3.1. Dynamic Changes of LWC in Watermelon Plants at Different Leaf Layers

The leaf water content of watermelon at different leaf layers was measured following a drought treatment (Figure 2). For each leaf layer, the LWC gradually declined as the water deficit progressed. After 10 h of drought treatment, the LWC of the three leaf layers (L1, L2, and L3) decreased by 2.38%, 1.07%, and 2.05%, respectively, compared to 0 h of drought. After 20 h of drought treatment, the LWC of the three leaf layers (L1, L2, and L3) decreased by 8.27%, 7.02%, and 5.07%, respectively, compared to 0 h measurement.
Overall, the LWC of L1 during drought treatment was significantly lower than that of L2 and L3. After 20 h of the drought treatment, the LWC between leaf layers was significantly different, indicating that the impact of drought on the LWC varied depending on the leaf position. The difference in the LWC between L2 and L3 was not statistically significant during the early stage of drought.

3.2. Spectral Reflectance of Watermelon Leaf Under Different Drought Treatments

This study selected 350 nm to 1100 nm wavelengths to analyze the changes in hyperspectral reflectance under different drought treatments. Watermelon leaves with varying water content across different leaf layers were selected for spectral analysis. The mean spectral reflectance of all samples at different layers (L1, L2, and L3) and the spectral reflectance of watermelon under varying water content are presented in Figure 3a–c. For the same leaf layer, the spectral reflectance of watermelon slightly increased in the near-infrared bands as water content increased. The spectral reflectance of watermelon with the highest water content was the greatest in the near-infrared region.
Under the T1, T2 and T3 treatment, the spectral curves are shown in Figure 4a–c. Variation patterns of leaf reflectance across different leaf layers were observed. The reflectance changes from 700 nm to 1100 nm exhibited a similar trend, with the following order of L1 < L2 < L3. Under T1 and T2 treatments, the reflectance values of L1, L2, and L3 in the 700–1000 nm range exhibited some differences across the three layers. However, under the T3 treatment, the reflectance differences between L1 and L2 were minimal. Under all drought treatments, L2 showed minor differences in reflectance within the 500–600 nm range compared to both L1 and L3.

3.3. Relationships Between Watermelon Plant LWC and Spectral Indices

The correlation matrix between LWC and corresponding spectral indices is presented in Table 2. Among the spectral reflectance indices, DVI, EVI, CARI, RDVI, SAVI, TVI, and WI were positively correlated with LWC, while NDVI, PRI, RVI, and SIPI exhibited a negative correlation with LWC.
The LWC was significantly positively correlated with WI (r = 0.595, p ≤ 0.001), TVI (r = 0.433, p ≤ 0.01), and both DVI and CARI (r = 0.358 and 0.368, p ≤ 0.05, respectively). The optimal spectral vegetation index is defined as the index with the highest correlation (r) between the LWC and the spectral index. Consequently, WI emerged as the optimal index for estimating the LWC in watermelon plants, followed by TVI, CARI, and DVI.
Additionally, several spectral reflectance indices (NDVI, DVI, RVI, SAVI, and TVI) were found to be significantly positively correlated with one another, indicating a strong correlation among the vegetation indices. The highest correlation was observed between NDVI and RVI, with an r value of 0.998 (p ≤ 0.001).

3.4. Simple Linear Regression Modeling Based on Single Spectral Index

Simple linear regression models were developed to analyze the relationship between the LWC of watermelon plant and spectral reflectance (Table 3). Eleven classical spectral indices were selected to examine the correlations between the spectral indices from different leaf layers and the LWC of watermelon plants. Among all the linear regression models, WI-L2 exhibited the highest R2 value, indicating that it was the most effective spectral index for estimating the LWC. The R2 and root mean square error (RMSE) for the training datasets were 0.2939 and 2.59%, respectively, while the R2 and RMSE for the testing datasets were 0.4524 and 2.76%, respectively.
For the majority of the eleven spectral indices, the indices from L2 provided the best estimates for the LWC, followed by those from L1 and L3. It can be concluded that L2 is the optimal leaf layer for estimating the LWC of watermelon when using simple linear regression models.

3.5. Machine Learning Modeling Based on Eleven Spectral Indices

Eleven leaf spectral indices from each leaf layer were utilized as independent variables to perform machine learning modeling using four algorithms (Table 4). For the training datasets, the determination coefficients (R2) for all models across all leaf layers exceeded 0.6, with corresponding root mean square errors (RMSEs) and mean absolute errors (MAEs) below 3% and 3%, respectively. In the testing datasets, the determination coefficients (R2) for all models across all leaf layers were above 0.5, with the exception of the GBDT model for L1. The corresponding RMSEs and MAEs were below 4% and 3%, respectively.
Among all the machine learning models based on the eleven leaf spectral indices, AdaBoost-L2 achieved the highest R2, indicating that it was the most effective algorithm for estimating the LWC. The R2 and RMSE for the training datasets were 0.9504 and 0.96%, respectively, while the R2 and RMSE for the testing datasets were 0.8760 and 1.80%, respectively.
These results suggest that machine learning modeling utilizing the eleven spectral indices can significantly enhance the estimation accuracy of watermelon plant LWC compared to simple linear regression models. However, the five-fold cross-validation scores of all models were below 0.8, indicating that the generalization abilities of these machine learning models need to be improved.

3.6. Machine Learning Modeling Based on Full Wavelength

The full wavelength data from each leaf layer were utilized as the independent variable to perform machine learning modeling using four algorithms (Table 5). For the training datasets, the determination coefficients (R2) for all models across all leaf layers exceeded 0.7, with corresponding root mean square errors (RMSEs) and mean absolute errors (MAEs) below 3% and 2%, respectively. In the testing datasets, the determination coefficients (R2) for all models across all leaf layers were above 0.7, with the exception of the GBDT model for L1. The corresponding RMSEs and MAEs were below 3% and 3%, respectively.
Among all the machine learning models based on the full wavelength data, AdaBoost-L2 achieved the highest R2, indicating that it was the most effective algorithm for estimating the LWC. The R2 and RMSE for the training datasets were 0.9927 and 0.37%, respectively, while the R2 and RMSE for the testing datasets were 0.9787 and 0.75%, respectively. The model achieves extremely high prediction accuracy, with a five-fold cross-validation score of R2= 0.9636, indicating that the model has good generalization ability.
Figure 5 illustrates the top 15 bands in terms of feature importance ranking from L1, L2, and L3 based on four algorithms. Among all the models, the AdaBoost-L2 model exhibited the highest feature impact with a value of 0.2407 at the wavelength of 660.8 nm. The RF-L3 model ranked second, achieving a feature importance score of 0.2175 at the wavelength of 672.8 nm. All other models had a feature impact below 0.2. This indicates that the wavelengths of 660.8 nm and 672.8 nm played a crucial role in the precision of the models.

4. Discussion

4.1. Changes of LWC Under Different Drought Treatments

Drought stress directly leads to a decrease in the LWC of watermelon leaves, resulting in slowed growth of the vines and weak stems. Prolonged drought can also cause flower and fruit drop, ultimately reducing both yield and quality. Compared to normal water conditions, the leaf water content of rice does not significantly decrease under mild drought stress; however, severe drought stress markedly reduces leaf water content [35]. Similar findings were observed in our study. Under mild drought conditions, leaf water content decreased by approximately 2%, while under prolonged drought, it decreased by about 7%. Changes in leaf water content can lead to variations in cell turgor pressure, which is closely related to cell growth and function. When turgor pressure reaches zero due to severe water deficit, cells begin to degrade, causing leaves to wilt and altering their spectral reflectance.
The water content of leaves at different positions is also related to the duration of drought stress. In the early stages of prolonged drought, there is no statistically significant difference in leaf water content among different leaf positions in summer maize [36]. However, as drought conditions persist, differences in leaf water content emerge, with the order being L1 > L5 > L3. This may be associated with the varying levels of growth activity at different leaf positions. L1 serves as the primary growth center and is highly active, while L5, located near the fruit of maize, acts as a secondary growth center. In rice under water stress, the leaf water content at different positions during the jointing stage followed the pattern of L1 < L2 < L3 < L4 [37]. In later stages, the pattern reversed to the order of L1 > L2 > L3 > L4. Such changes indicated that the variation in leaf water content at different positions in rice may be related to leaf senescence. In this study, differences in leaf water content among various positions were evident following drought stress, with the pattern of L1 < L2 < L3. This may be attributed to the vigorous growth of upper leaves (L1), which experienced higher transpiration rates and water loss. A similar result was observed by Zhou et al. [38] in maize.

4.2. Changes in Leaf Hyperspectral Reflectance Under Different Drought Treatments

Several studies have demonstrated that the spectral reflectance of plant leaves in the visible light region is primarily influenced by pigments [39]. Among these pigments, chlorophyll plays a particularly significant role in determining visible light reflectance [40]. Under stress conditions, chlorophyll degradation often occurs, leading to reduced light energy utilization and increased visible light reflectance of leaves [41,42]. In contrast, the spectral reflectance of plant leaves in the near-infrared region is largely influenced by the internal structure of the leaves [43,44]. Notably, Carter [45] examined the spectral reflectance of six different plant species and found that variations within the 400–1300 nm band were attributable to changes in leaf internal structure related to water content. In the current study, minimal differences were observed in reflectance between drought-stressed watermelon leaves and control leaves. This may be attributed to the brief duration of the drought stress, which resulted in limited chlorophyll degradation and only minor alterations in the leaf structure of watermelon. Furthermore, our findings indicated that wavelengths at 660.8 nm and 672.8 nm were crucial for predicting the water content of watermelon leaves. This could be explained by the slight water loss experienced by the leaves under drought conditions, which subsequently leads to changes in chlorophyll concentration. Higher chlorophyll levels enhance the plant’s absorption of the 660–680 nm spectrum, thus reducing the spectral reflectance in this region.

4.3. Relationships Between LWC of Watermelon Plant and Spectral Indices

The water content of plant leaves is intricately linked to the reflectance of specific spectral ranges. However, leaf surface reflectance is influenced not only by water content but also by factors such as the leaf cuticle, trichomes, and other surface structures, as well as internal anatomical features. This complexity makes it challenging to accurately estimate crop water status using a single spectral band.
To address this issue, spectral indices can enhance the effective reflectance information from vegetation while minimizing the influence of external factors. Constructing appropriate and sensitive spectral indices allows for better extraction of information regarding vegetation water content [46,47]. Commonly used indices include the water index (WI), normalized difference water index (NDWI), moisture stress index (MSI), and water band index (WBI) for monitoring plant water content. Tian et al. [48] proposed a novel vegetation water index, SR(610, 560)/ND(810, 610), for predicting the water status of wheat, where SR and ND refer to the simple ratio index and the normalized difference vegetation index, respectively. Liu et al. [49] investigated the correlation between 15 different spectral indices and indicators of water content in Quercus aliena, revealing that the WI showed a strong correlation with RWC, although it was significantly influenced by the leaf development stage. In our study, we selected eleven classic spectral vegetation indices and found that the LWC of watermelon leaves exhibited the highest correlation coefficient with the WI. Despite this strong correlation, the accuracy of predicting water content in watermelon leaves using the WI was not high, which may be attributed to the specific characteristics of the plant species.

4.4. The Optimal Leaf Layer for the LWC Prediction of Watermelon Plants

The water status of plants can be reflected in leaf water content, which varies across different leaf layers due to factors such as transpiration and water transfer. Leaves at various positions exhibit variations in their morphological structure, physiological function, and nutrient allocation. Among the spectral indices evaluated, the WI achieved the highest R2 values, with WI-L2 demonstrating the greatest predictive accuracy across all leaf layers. Similarly, in the LWC prediction model based on full wavelength data, the AdaBoost algorithm outperformed other methods, with AdaBoost-L2 achieving the highest R2 values. Thus, L2 can be identified as the optimal leaf layer position for predicting the LWC in watermelon plants. This may be related to the fact that L2 serves as the primary growth center of the watermelon plant. Compared to L1 and L3, L2 has a better ability to maintain cell structure and function under drought stress, which prevents excessive water loss in the leaves. Nevertheless, Han et al. [50] reported that the reflectance of L1 and L2 had a stronger correlation with the corresponding leaf water content than L3 and L4. This discrepancy may be attributed to the upright growth habit of the previously studied plants, which leads to differences in light exposure between the upper and lower leaves. In contrast, our study involved watermelons that grow prostrate and horizontally, allowing all leaves to receive uniform light exposure. Xiang et al. [51] demonstrated that the reflectance of upper and middle leaves exhibited the best correlation with their respective leaf water content, which aligns with our findings.

4.5. Future Work

Rapid and non-destructive monitoring of plant water status is essential for advancing sustainable and precision agriculture. Our research indicates that machine learning models utilizing full-spectrum data can effectively predict water content in watermelon leaves with high accuracy. However, translating this finding into practical applications presents challenges. This is primarily due to the influence of various factors on plant reflectance in the VNIR spectral range, including chlorophyll content, nitrogen levels, surface cell structure, and internal leaf morphology.
To enhance the applicability of our predictions, it is crucial to identify specific wavelengths that are closely associated with LWC. Therefore, the next phase of our research should focus on elucidating the VNIR mechanisms that govern the response of watermelon leaves to varying water content. In particular, we should examine how these responses differ across watermelon varieties, cultivation conditions, and seasonal changes.
If we can pinpoint the characteristic wavelengths related to water content in watermelon leaves, we can develop specialized spectrometers tailored for this purpose. By narrowing the spectral detection range, we could simplify the equipment design and significantly reduce manufacturing costs. This advancement would facilitate the early diagnosis of plant water stress and contribute to the development of smart irrigation technologies.

5. Conclusions

This study conducted a systematic analysis of the dynamic changes in the LWC of watermelon plants under various drought treatments, as well as the variations in hyperspectral reflectance across different leaf layers in response to water stress. The LWC and spectral reflectance varied among leaf layers and with different water content levels, with the LWC following the order L1 < L2 < L3 across different leaf layers. Among the LWC prediction models, the machine learning model demonstrated greater accuracy than the simple linear regression model. Notably, L2 achieved the highest estimation accuracy for the LWC of watermelon plants compared to L1 and L3. As a result, L2 was identified as the optimal leaf layer for predicting the LWC of watermelon plants. Our findings demonstrated that the integration of hyperspectral technology with machine learning can effectively predict LWC, thereby providing valuable technical support for efficient monitoring and water management in watermelon cultivation. This approach not only enhances the precision of water status assessment but also offers a practical solution for optimizing irrigation practices and improving crop yield and quality.

Author Contributions

Conceptualization, D.W., P.W. and B.C.; methodology, D.W., P.W. and B.C.; validation, D.W., P.W. and B.C.; formal analysis, D.W., P.W. and B.C.; investigation, D.W., P.W. and B.C.; data curation, D.W., P.W. and B.C.; writing—original draft preparation, L.Y., Z.D. and B.X.; writing—review and editing, L.Y., Z.D. and B.X.; supervision, Z.D. and B.X.; project administration, Z.D. and B.X.; funding acquisition, Z.D. and B.X. All authors have read and agreed to the published version of the manuscript.

Funding

This research was funded by the China Agriculture Research System of Watermelon and Cantaloupe Industry Technology, grant number CARS-25.

Data Availability Statement

The data used in this study are available from the corresponding author upon reasonable request.

Acknowledgments

We are grateful to everyone who provided assistance during the field trials. Moreover, we would like to express our appreciation to the reviewers for their insightful comments and suggestions.

Conflicts of Interest

The authors declare no conflicts of interest.

Abbreviations

The following abbreviations are used in this manuscript:
SWIRshort-wave infrared
VNIRvisible and near-infrared
LWCleaf water content
FWfresh weight
DWdry weight
MLmachine learning
RFRandom Forest
AdaBoostAdaptive Boosting
CatboostCategorical Boosting
GBDTGradient Boosting Decision Tree
RMSEroot mean square error
MAEmean absolute error
RWCrelative water content

References

  1. Junttila, S.; Hölttä, T.; Saarinen, N.; Kankare, V.; Yrttimaa, T.; Hyyppä, J.; Vastaranta, M. Close-Range hyperspectral spectroscopy reveals leaf water content dynamics. Remote Sens. Environ. 2022, 277, 113071. [Google Scholar] [CrossRef]
  2. Boyer, J.S. Plant productivity and environment. Science 1982, 218, 443–448. [Google Scholar] [CrossRef] [PubMed]
  3. Peng, Z.; Lin, S.; Zhang, B.; Wei, Z.; Liu, L.; Han, N.; Cai, J.; Chen, H. Winter wheat canopy water content monitoring based on spectral transforms and “three-edge” parameters. Agric. Water Manag. 2020, 240, 106306. [Google Scholar] [CrossRef]
  4. Rodríguez-Pérez, J.R.; Riaño, D.; Carlisle, E.; Ustin, S.; Smart, D.R. Evaluation of hyperspectral indexes to detect grapevine water status in vineyards. Am. J. Enol. Vitic. 2007, 58, 302–317. [Google Scholar] [CrossRef]
  5. Maimaitiyiming, M.; Ghulam, A.; Bozzolo, A.; Wilkins, J.L.; Kwasniewski, M.T. Early detection of plant physiological responses to different levels of water stress using reflectance spectroscopy. Remote Sens. 2017, 9, 745. [Google Scholar] [CrossRef]
  6. Zhang, Y.; Wu, J.; Wang, A.Z. Comparison of various approaches for estimating leaf water content and stomatal conductance in different plant species using hyperspectral data. Ecol. Indic. 2022, 142, 109278. [Google Scholar] [CrossRef]
  7. Rallo, G.; Minacapilli, M.; Ciraolo, G.; Provenzano, G. Detecting crop water status in mature olive groves using vegetation spectral measurements. Biosyst. Eng. 2014, 128, 52–68. [Google Scholar] [CrossRef]
  8. Thomas, J.R.; Namken, L.N.; Oerther, G.F.; Brown, R.G. Estimating leaf water content by reflectance measurements. Agron. J. 1971, 63, 845–847. [Google Scholar] [CrossRef]
  9. Carter, G.A. Primary and secondary effects of water content on the spectral reflectance of leaves. Am. J. Bot. 1991, 78, 916–924. [Google Scholar] [CrossRef]
  10. Pôças, I.; Rodrigues, A.; Gonçalves, S.; Costa, P.M.; Gonçalves, I.; Pereira, L.S.; Cunha, M. Predicting grapevine water status based on hyperspectral reflectance vegetation indices. Remote Sens. 2015, 7, 16460–16479. [Google Scholar] [CrossRef]
  11. Holben, B.N.; Schutt, J.B.; McMurtrey, J. Leaf water stress detection utilizing thematic mapper bands 3, 4 and 5 in soybean plants. Int. J. Remote Sens. 1983, 4, 289–297. [Google Scholar] [CrossRef]
  12. Inoue, Y.; Morinaga, S.; Shibayama, M. Non-destructive estimation of water status of intact crop leaves based on spectral reflectance measurements. Jpn. J. Crop Sci. 1993, 62, 462–469. [Google Scholar]
  13. Peñuelas, J.; Inoue, Y. Reflectance indices indicative of changes in water and pigment contents of peanut and wheat leaves. Photosynthetica 1999, 36, 355–360. [Google Scholar] [CrossRef]
  14. Peñuelas, J.; Pinol, J.; Ogaya, R.; Filella, I. Estimation of plant water concentration by the reflectance water index WI (900/970). Int. J. Remote Sens. 1997, 18, 2869–2875. [Google Scholar] [CrossRef]
  15. Khan, A.; Vibhute, A.D.; Mali, S.; Patil, C.H. A systematic review on hyperspectral imaging technology with a machine and deep learning methodology for agricultural applications. Ecol. Inform. 2022, 69, 101678. [Google Scholar] [CrossRef]
  16. Shoko, C.; Mutanga, O.; Dube, T.; Slotow, R. Characterizing the spatio-temporal variations of C3 and C4 dominated grasslands aboveground biomass in the Drakensberg, South Africa. Int. J. Appl. Earth Obs. Geoinf. 2018, 68, 51–60. [Google Scholar]
  17. Das, B.; Sahoo, R.N.; Pargal, S.; Krishna, G.; Verma, R.; Chinnusamy, V.; Sehgal, V.K.; Gupta, V.K. Comparison of different uni- and multi-variate techniques for monitoring leaf water status as an indicator of water-deficit stress in wheat through spectroscopy. Biosyst. Eng. 2017, 160, 69–83. [Google Scholar] [CrossRef]
  18. Mirzaie, M.; Darvishzadeh, R.; Shakiba, A.; Matkan, A.A.; Atzberger, C.; Skidmore, A. Comparative analysis of different uni- and multi-variate methods for estimation of vegetation water content using hyper-spectral measurements. Int. J. Appl. Earth Obs. Geoinf. 2014, 26, 1–11. [Google Scholar]
  19. Li, H.; Yang, X.; Chen, H.; Cui, Q.; Yuan, G.; Han, X.; Wei, C.; Zhang, Y.; Ma, J.; Zhang, X. Water requirement characteristics and the optimal irrigation schedule for the growth, yield, and fruit quality of watermelon under plastic film mulching. Sci. Hortic. 2018, 241, 74–82. [Google Scholar]
  20. Wang, X.C.; Liu, R.; Luo, J.; Zhu, P.; Wang, Y.; Pan, X.C.; Shu, L.Z. Effects of water and NPK fertigation on watermelon yield, quality, irrigation-water, and nutrient use efficiency under alternate partial root-zone drip irrigation. Agric. Water Manage. 2022, 271, 107785. [Google Scholar]
  21. Rouse, J.W.; Haas, R.H.; Schell, J.A.; Deering, D.W. Monitoring vegetation systems in the great plains with ERTS. In Proceedings of the Third ERTS Symposium, Washington, DC, USA, 10–14 December 1973; NASA: Washington, DC, USA, 1974; pp. 310–317. [Google Scholar]
  22. Demetriades-Shah, T.H.; Steven, M.D.; Clark, J.A. High resolution derivative spectra in remote sensing. Remote Sens. Environ. 1990, 33, 55–64. [Google Scholar]
  23. Huete, A.; Didan, K.; Miura, T.; Rodriguez, E.P.; Gao, X.; Ferreira, L.G. Overview of the radiometric and biophysical performance of the MODIS vegetation indices. Remote Sens. Environ. 2002, 83, 195–213. [Google Scholar]
  24. Kim, M.S.; Daughtry, C.S.T.; Chappelle, E.W.; Mcmurtrey, J.E.; Walthall, C.L. The use of high spectral resolution bands for estimating absorbed photosynthetically active radiation. In Proceedings of the 6th International Symposium on Physical Measurements and Signatures in Remote Sensing, Val D’Isere, France, 17–21 January 1994; pp. 299–306. [Google Scholar]
  25. Gamon, J.A.; Peñuelas, J.; Field, C.B. A narrow-waveband spectral index that tracks diurnal changes in photosynthetic efficiency. Remote Sens. Environ. 1992, 41, 35–44. [Google Scholar] [CrossRef]
  26. Roujean, J.L.; Breon, F.M. Estimating PAR absorbed by vegetation from bidirectional reflectance measurements. Remote Sens. Environ. 1995, 51, 375–384. [Google Scholar]
  27. Wang, Z.J.; Wang, J.H.; Liu, L.Y.; Huang, W.J.; Zhao, C.J.; Wang, C.Z. Prediction of grain protein content in winter wheat (Triticum aestivum L.) using plant pigment ratio (PPR). Field Crops Res. 2004, 90, 311–321. [Google Scholar]
  28. Huete, A.R. A soil-adjusted vegetation index (SAVI). Remote Sens. Environ. 1988, 25, 295–309. [Google Scholar]
  29. Penuelas, J.; Baret, F.; Filella, I. Semi-empirical indices to assess carotenoids/chlorophyll a ratio from leaf spectral reflectance. Photosynthetica 1995, 31, 221–230. [Google Scholar]
  30. Broge, N.H.; Leblanc, E. Comparing prediction power and stability of broadband and hyperspectral vegetation indices for estimation of green leaf area index and canopy chlorophyll density. Remote Sens. Environ. 2001, 76, 156–172. [Google Scholar]
  31. Breiman, L. Random Forests. Mach. Learn. 2001, 45, 5–32. [Google Scholar]
  32. Freund, Y.; Schapire, R.E. A decision-theoretic generalization of on-line learning and an application to boosting. J. Comput. Syst. Sci. 1996, 55, 119–139. [Google Scholar]
  33. Friedman, J.H. Greedy function approximation: A gradient boosting machine. Ann. Stat. 2001, 29, 1189–1232. [Google Scholar] [CrossRef]
  34. Luo, M.; Wang, Y.; Xie, Y.; Zhou, L.; Qiao, J.; Qiu, S.; Sun, Y. Combination of feature selection and CatBoost for prediction: The first application to the estimation of aboveground biomass. Forests 2021, 12, 216. [Google Scholar] [CrossRef]
  35. Ding, L.; Li, Y.; Li, Y.; Sheng, Q.; Guo, S. Effects of drought stress on photosynthesis and water status of rice leaves. Chin. J. Rice Sci. 2014, 28, 65–70. [Google Scholar]
  36. Wang, F.; He, Q.; Zhou, G. Leaf water content at different positions and its relationship with photosynthesis when consecutive drought treatments are applied to summer maize from the 3-leaf stage. Acta Ecol. Sin. 2019, 39, 254–264. [Google Scholar]
  37. Tian, Y.; Cao, W.; Wang, S.; Zhu, Y. Variation of water and nitrogen contents & photosynthesis at different position leaves of rice under different soil water and nitrogen conditions. Acta Agron. Sin. 2004, 30, 1129–1134. [Google Scholar]
  38. Zhou, S.L.; Xie, R.Z.; Jiang, H.R.; Wang, J.H. Study on the relationship between canopy relative depth index and water content in different leaf layers of maize. Crops 2005, 5, 13–15. [Google Scholar]
  39. Sims, D.A.; Gamon, J.A. Relationships between leaf pigment content and spectral reflectance across a wide range of species, leaf structures and developmental stages. Remote Sens. Environ. 2002, 81, 337–354. [Google Scholar]
  40. Thomas, J.R.; Gausman, H.W. Leaf reflectance vs. leaf chlorophyll and carotenoid concentrations for eight crops. Agron. J. 1977, 69, 799–802. [Google Scholar] [CrossRef]
  41. Bowman, W.D. The relationship between leaf water status, gas exchange, and spectral reflectance in cotton leaves. Remote Sens. Environ. 1989, 30, 249–255. [Google Scholar]
  42. Gausman, H.W.; Allen, W.A. Optical parameters of leaves of 30 plant species. Plant Physiol. 1973, 52, 57–62. [Google Scholar]
  43. Jacquemoud, S.; Baret, F. Prospect: A model of leaf optical properties spectra. Remote Sens. Environ. 1990, 34, 75–91. [Google Scholar] [CrossRef]
  44. Jacquemoud, S.; Ustin, S.L.; Verdebout, J.; Schmuck, G.; Andreoli, G.; Hosgood, B. Estimating leaf biochemistry using the PROSPECT leaf optical properties model. Remote Sens. Environ. 1996, 56, 194–202. [Google Scholar] [CrossRef]
  45. Carter, G.A. Responses of leaf spectral reflectance to plant stress. Am. J. Bot. 1993, 80, 239–243. [Google Scholar] [CrossRef]
  46. Sun, P.; Grignetti, A.; Liu, S.; Casacchia, R.; Salvatori, R.; Pietrini, F.; Centritto, M. Associated changes in physiological parameters and spectral reflectance indices in olive (Olea europaea L.) leaves in response to different levels of water stress. Int. J. Remote Sens. 2008, 29, 1725–1743. [Google Scholar] [CrossRef]
  47. Cao, Z.; Wang, Q.; Zheng, C. Best hyperspectral indices for tracing leaf water status as determined from leaf dehydration experiments. Ecol. Indic. 2015, 54, 96–107. [Google Scholar] [CrossRef]
  48. Tian, Y.C.; Zhu, Y.; Cao, W.X.; Dai, Y.B. Relationship between canopy reflectance and plant water status of wheat. Chin. J. Appl. Ecol. 2004, 11, 2072–2076. [Google Scholar]
  49. Liu, C.; Sun, P.S.; Liu, S.R. A comparison of spectral reflectance indices in response to water: A case study of Quercus aliena var. acuteserrata. Chin. J. Plant Ecol. 2017, 41, 850–861. [Google Scholar]
  50. Han, G. Monitoring Water Status with Hyperspectral Sensing in Wheat. Master’s Thesis, Nanjing Agricultural University, Nanjing, China, 2011; pp. 41–49. [Google Scholar]
  51. Xiang, J.L.; Yao, X.F.; Liu, Q.; Huang, D.F.; Chang, L.Y. Hyperspectral based monitoring of leaf water content in different leaf positions of muskmelon in greenhouse. Jiangsu Agric. Sci. 2018, 46, 105–109. [Google Scholar]
Figure 1. Sampling locations for watermelon plant leaves.
Water 17 01142 g001
Figure 2. Changes in the LWC in watermelon plant at different leaf layers during drought treatments. Different lowercase letters indicate significant differences among different leaf lays at p < 0.05. Bars represent standard deviations. L1, L2, and L3 represent the upper leaves, the middle leaves, and the lower leaves, respectively.
Water 17 01142 g002
Figure 3. Change trends of leaf hyperspectral reflectance in L1 (a), L2 (b), and L3 (c) under different drought treatments. T1, 0 h of drought treatment; T2, 10 h of drought treatment; T3, 20 h of drought treatment.
Water 17 01142 g003
Figure 4. Variation rules of leaf hyperspectral reflectance in T1 (a), T2 (b), and T3 (c), respectively.
Water 17 01142 g004
Figure 5. Feature importance values for the top 15 bands based on various models using the full wavelength data.
Water 17 01142 g005
Table 1. Vegetation indices utilized in this study.
Vegetation IndexEquationReferences
Normalized difference vegetation index (NDVI)(RNIR − RRed)/(RNIR + RRed)[21]
Difference vegetation index (DVI)RNIR − RRed[22]
Enhance vegetation index (EVI)2.5(RNIR − RRed)/(RNIR + 6RRed − 7.5RBlue + 1)[23]
Chlorophyll absorption ratio index (CARI)[|(670a + R670 + b)|/(a2 + 1)0.5](R700/R670)[24]
Photochemical reflectance index (PRI)(R531 − R570)/(R531 + R570)[25]
Renormalized difference vegetation index (RDVI)(NDVI × DVI)0.5[26]
Ratio vegetation index (RVI)RNIR/RRed[27]
Soil adjusted vegetation index (SAVI)1.5(RNIR − RGreen)/(RNIR + RGreen + 0.5)[28]
Structure insensitive pigment index (SIPI)(R800 − R451)/(R800 + R680)[29]
Triangular vegetation coefficient (TVI)0.5[120(R750 − R550) − 200(R670 − R550)][30]
Water index (WI)R900/R970[15]
Note: RNIR, RRed, RGreen, and RBlue represent the reflectance values of the near-infrared band (760–900 nm), red band (630–690 nm), green band (525–605 nm), and blue band (450–515 nm), respectively. R451, R531, R550, R570, R670, R680, R700, R750, R800, R900, and R970 correspond to the reflectance values at the wavelengths of 451 nm, 531 nm, 550 nm, 570 nm, 670 nm, 680 nm, 700 nm, 750 nm, 800 nm, 900 nm, and 970 nm, respectively. a = (R700 − R550)/150, b = R550 − 550a.
Table 2. Correlation between LWC and various classical spectral indices in watermelon plants.
LWCNDVIDVIEVICARIPRIRDVIRVISAVISIPITVIWI
LWC1.000
NDVI−0.0241.000
DVI0.358 *0.736 ***1.000
EVI0.105−0.0160.2321.000
CARI0.368 *−0.302−0.151−0.0671.000
PRI−0.205−0.19−0.484 **−0.804 ***0.424 *1.000
RDVI0.1840.928 ***0.936 ***0.12−0.241−0.366 *1.000
RVI−0.0210.998 ***0.743 ***−0.021−0.303−0.1830.93 ***1.000
SAVI0.1280.962 ***0.894 ***0.084−0.261−0.3220.995 ***0.963 ***1.000
SIPI−0.0290.084−0.098−0.976 ***−0.0240.695 ***−0.010.0920.0161.000
TVI0.433 **0.643 ***0.932 ***0.2750.193−0.372 *0.85 ***0.648 ***0.805 ***−0.1791.000
WI0.595 ***−0.20.0720.0510.13−0.082−0.065−0.185−0.104−0.0230.0511.000
Note: *, **, and *** indicate significant differences at 0.05, 0.01, and 0.001 levels, respectively.
Table 3. Relationships of plant LWC (y) and various classical spectral indices (x).
Spectral IndicesLeaf LayersR2
(Training)
R2
(Testing)
RMSE (%)
(Training)
RMSE (%)
(Testing)
Modeling EquationsTest Equations
NDVIL10.00740.01662.191.77y = −0.1613x + 0.9503y = 0.1782x + 0.7126
L20.02590.04793.133.63y = −0.3867x + 1.1137y = 0.6296x + 0.3865
L30.00490.10573.312.98y = −0.2172x + 0.9562y = −1.4048x + 1.7923
DVIL10.00100.02392.191.78y = −0.0469x + 0.8658y = 0.1710x + 0.7327
L20.13700.14022.883.45y = 1.0591x + 0.2054y = 1.0026x + 0.2178
L30.03140.02693.262.90y = 0.4050x + 0.5602y = −0.3813x + 1.0391
EVIL10.02090.36932.181.47y = 0.4096x + 0.7034y = 1.6896x + 0.2859
L20.06820.05963.253.60y = 1.0146x + 0.5125y = −1.1967x + 1.2145
L30.00750.12733.302.75y = 0.3193x + 0.6994y = −1.3808x + 1.2623
CARIL10.03440.03442.181.78y = 0.0694x + 0.7978y = 0.0487x + 0.8068
L20.19570.04652.813.50y = 0.2059x + 0.7239y = 0.1454x + 0.7388
L30.07920.00463.142.91y = 0.2733x + 0.6554y = −0.0808x + 0.8561
PRIL10.03570.14482.161.71y = −0.4821x + 0.8130y = −0.7617x + 0.8004
L20.06990.01013.173.71y = −1.002x + 0.7953y = −0.4076x + 0.8035
L30.02690.00013.252.94y = −0.6457x + 0.7722y = −0.0088x + 0.8100
RDVIL10.00330.02282.191.77y = −0.0983x + 0.9014y = 0.1921x + 0.7118
L20.01220.09793.113.53y = 0.3166x + 0.6396y = 0.8882x + 0.2484
L30.00820.06223.312.91y = 0.2597x + 0.6356y = −0.8325x + 1.3492
RVIL10.01160.01422.181.77y = −0.0091x + 0.8894y = 0.0076x + 0.794
L20.02350.04633.143.64y = −0.0168x + 0.9384y = 0.0287x + 0.6639
L30.00220.09263.312.97y = −0.0064x + 0.8407y = −0.0585x + 1.1411
SAVIL10.00430.02172.191.76y = −0.1163x + 0.9148y = 0.1933x + 0.7084
L20.00110.08413.113.56y = 0.0907x + 0.7847y = 0.8293x + 0.2751
L30.00290.07893.312.89y = 0.1604x + 0.6977y = −1.0247x + 1.4889
SIPIL10.01680.36892.191.44y = −0.0692x + 0.8898y = −0.2953x + 1.0609
L20.03910.11463.253.54y = −0.1365x + 0.9477y = 0.2978x + 0.5984
L30.00280.16093.312.70y = −0.0367x + 0.8317y = 0.3053x + 0.5826
TVIL10.00050.05082.191.74y = −0.0005x + 0.857y = 0.0042x + 0.6693
L20.22880.14692.783.42y = 0.0201x + 0.0593y = 0.0187x + 0.091
L30.03150.06763.272.94y = 0.006x + 0.5707y = −0.0101x + 1.2033
WIL10.04150.15372.191.86y = 0.7306x + 0.0746y = 1.4071x − 0.6413
L20.29390.45242.592.76y = 2.5300x − 1.7951y = 3.4248x − 2.7426
L30.04880.02923.242.99y = −1.7114x + 2.5663y = −1.1966x + 2.0416
Table 4. Evaluation indices of watermelon plant LWC estimation models based on eleven spectral indices.
AlgorithmsLeaf LayersR2
(Training)
R2
(Testing)
RMSE (%)
(Training)
RMSE (%)
(Testing)
MAE (%)
(Training)
MAE (%)
(Testing)
Cross-Validation Scores (R2)
RFL10.73670.75822.04 1.94 1.27 1.52 0.4099
L20.85760.82901.62 2.12 1.26 1.76 0.6324
L30.80330.79951.32 1.63 0.88 1.22 0.5792
AdaBoostL10.88160.77971.37 1.85 0.94 1.40 0.4913
L20.95040.87600.96 1.80 0.78 1.49 0.6953
L30.94750.84330.68 1.44 0.51 1.03 0.6266
GBDTL10.47060.31012.89 3.27 2.43 2.59 0.2280
L20.67630.57902.45 3.33 1.97 2.96 0.3705
L30.63180.57201.81 2.38 1.34 2.01 0.2972
CatboostL10.68930.64812.21 2.34 1.68 1.80 0.6003
L20.79160.71141.96 2.75 1.60 2.40 0.7485
L30.75540.66381.47 2.11 1.10 1.77 0.6907
Table 5. Evaluation indices of watermelon plant LWC estimation models based on full wavelength.
AlgorithmsLeaf LayersR2
(Training)
R2
(Testing)
RMSE (%)
(Training)
RMSE (%)
(Testing)
MAE (%)
(Training)
MAE (%)
(Testing)
Cross-Validation Scores (R2)
L10.82800.78641.65 1.82 1.00 1.33 0.4276
RFL20.96950.95550.75 1.08 0.60 0.87 0.9022
L30.93030.90480.79 1.12 0.52 0.87 0.8087
L10.94790.81660.91 1.69 0.61 1.32 0.5004
AdaBoostL20.99270.97870.37 0.75 0.31 0.60 0.9636
L30.98920.94170.31 0.88 0.24 0.57 0.8154
L10.65890.63792.32 2.37 1.87 1.93 0.1651
GBDTL20.82300.77851.81 2.41 1.44 2.15 0.6002
L30.75110.72271.49 1.92 0.99 1.48 0.5292
L10.75750.70071.96 2.16 1.45 1.69 0.6372
CatboostL20.90390.85561.33 1.95 1.03 1.68 0.8817
L30.84470.79231.17 1.66 0.77 1.29 0.8030
Disclaimer/Publisher’s Note: The statements, opinions and data contained in all publications are solely those of the individual author(s) and contributor(s) and not of MDPI and/or the editor(s). MDPI and/or the editor(s) disclaim responsibility for any injury to people or property resulting from any ideas, methods, instructions or products referred to in the content.

