Article

Coordination Analysis and Driving Factors of “Water-Land-Energy-Carbon” Coupling in Nine Provinces of the Yellow River Basin

1
Yellow River Institute of Hydraulic Research, YRCC, Zhengzhou 450003, China
2
Yellow River Laboratory, Zhengzhou 450003, China
3
Henan Engineering Research Center of Rural Water Environment Improvement, Zhengzhou 450003, China
4
Henan Key Laboratory of YB Ecological Protection and Restoration, Zhengzhou 450003, China
*
Author to whom correspondence should be addressed.
Water 2025, 17(8), 1138; https://doi.org/10.3390/w17081138
Submission received: 10 March 2025 / Revised: 7 April 2025 / Accepted: 7 April 2025 / Published: 10 April 2025

Abstract

:
As an important ecological barrier and economic belt in China, the sustainable development of the Yellow River Basin (YRB) is of great significance to national ecological security and regional economic balance. Based on the coupled and coordinated development analysis of the water–soil–energy–carbon (W-L-E-C) system in the provinces of the Yellow River Basin from 2002 to 2022, this study systematically analyzed the interaction relationship among the various factors through WLECNI index assessment, factor identification, and driving factor exploration. Thus, it fully reveals the spatiotemporal evolution law of regional coordinated development and its internal driving mechanism. It is found that the coordinated development of the W-L-E-C system in different provinces of the Yellow River Basin presents significant spatiotemporal differentiation, and its evolution process is influenced by multiple factors. It is found that the coordination of the YRB presents a significant spatial difference, and Inner Mongolia and Shaanxi, as high coordination areas, have achieved significant improvement in coordination, through ecological restoration and clean energy replacement, arable land intensification, and industrial water-saving technology, respectively. Shandong, Henan, and Shanxi in the middle coordination zone have made some achievements in industrial greening and water-saving technology promotion, but they are still restricted by industrial carbon emissions and land resource pressure. The Ningxia and Gansu regions with low coordination are slow to improve their coordination due to water resource overload and inefficient energy utilization. Barrier factor analysis shows that the water resources utilization rate (W4), impervious area (L4), energy consumption per unit GDP (E1), and carbon emissions from energy consumption (C3) are the core factors restricting coordination. Among them, the water quality compliance rate (W5) of Shanxi and Henan is very low, and the impervious area (L4) of Shandong is a prominent problem. The interaction analysis of the driving factors showed that there were significant interactions between water resource use and ecological protection (W-E), land resource and energy use (L-E), and carbon emissions and ecosystem (C-E). Inner Mongolia, Shaanxi, and Shandong achieved coordinated improvement through “scenic energy + ecological restoration”, cultivated land protection, and industrial greening. Shanxi, Henan, and Ningxia are constrained by the “W-L-E-C” complex obstacles. In the future, the Yellow River Basin should implement the following zoning control strategy: for the areas with high coordination, it should focus on consolidating the synergistic advantages of ecological protection and energy development; water-saving technology and energy consumption reduction measures should be promoted in the middle coordination area. In the low coordination area, efforts should be made to solve the problem of resource overload, and the current situation of low resource utilization efficiency should be improved by improving the utilization rate of recycled water and applying photovoltaic sand control technology. This differentiated governance plan will effectively enhance the level of coordinated development across the basin. The research results provide a decision-making framework of “zoning regulation, system optimization and dynamic monitoring” for the sustainable development of the YRB, and provide a scientific basis for achieving high-quality development of the basin.

1. Introduction

In the context of globalization, the health and sustainable development of watershed ecosystems has become a hot topic of global concern [1,2]. As the second largest river in China, the YRB, with its unique geographical location, rich natural resources, and profound cultural heritage, has become an important support for national ecological security, water resources management, agricultural production, and regional economic development. However, with climate change, the intensification of human activities, and the increasing pressure on resources and environment, the YRB is facing unprecedented challenges, especially given the complex relationship between the water–soy–energy–carbon system, which needs to be analyzed further [3].
The “W-L-E-C” system is an interdependent and complex system, in which the distribution and utilization of water resources, the maintenance and improvement of soil quality, the balance and regulation of the carbon cycle, and the stability and restoration of the ecosystem constitute the cornerstone of the sustainable development of the basin [4,5,6]. The coupling coordination between water, soil, energy, and carbon directly affects the ecological security, water resource security, food security, and economic security of the YRB. Therefore, it is of great significance to carry out the coordination analysis of “W-L-E-C” coupling and the research on driving factors in the nine provinces of the YRB to reveal the internal mechanism of the basin ecosystem, optimize resource allocation, and formulate scientific and reasonable basin management policies.
In recent years, scholars at home and abroad have carried out extensive research on the “W-L-E-C” coupling system, and have achieved a series of important results. However, most of the existing studies focus on the interaction between a single element or two elements, and there is a lack of systematic analysis of the multi-element coupling relationship of “W-L-E-C”. In addition, the research on the coordination level of “W-L-E-C” coupling and its driving factors in the nine provinces of the YRB is still insufficient. The use of Wu et al.’s (2024) [7] simulation framework based on SPCR is proposed. A non-dominated sorting genetic algorithm (NSGA-II) and entropy weight-based approximate ideal sorting method (TOPSIS) were used to optimize the land use structure with the aim of minimizing net carbon, nitrogen, and phosphorus emissions. Li et al. (2023) [8] proposed the conceptual model DSWUNWUSWSNWSA (“Driving force—water for social development—water for natural development—social water resources situation—natural water resources situation—improvement”) and established the water cycle health evaluation system of the Central Plain urban agglomeration.
This study takes nine provinces in the YRB as the research object, constructs the evaluation index system of “W-L-E-C” coupling coordination, and uses the coupling coordination degree model and spatial autocorrelation analysis to analyze the spatiotemporal evolution characteristics of the “W-L-E-C” coupling coordination level in nine provinces in the YRB, as well as to explore its driving factors. The novelty of this study is reflected in the construction of the W-L-E-C multi-system coupling analysis framework for the first time, breaking through the limitations of traditional single-factor research, and revealing more complex rules of the sustainable development of watershed by integrating the interaction mechanism of the four systems. Based on 20 years of time series data from 2002 to 2022, this study innovatively adopted the WLECNI index quantitative assessment to systematically analyze the spatiotemporal evolution characteristics of the coordination degree in the Yellow River Basin, found the dynamic process from “low level equilibrium” to “regional differentiation”, and proposed the scientific classification criteria for the high–medium–low coordination area for the first time. In terms of methodology, the study not only identified the common factors, such as energy consumption per unit GDP, but also revealed the regional-specific problem of the extremely low rate of water quality compliance in Shanxi Province, and found the nonlinear interaction relationship between the systems through driving interaction analysis. The governance paradigm of “zoning regulation” proposed at the application level has important innovative value, such as designing a collaborative model of “landscape energy + ecological restoration” for high coordination areas, customizing precise solutions such as photovoltaic sand control for low coordination areas, and forming a complete decision-making loop of “assessment—diagnosis—governance—monitoring”. These multidimensional innovations not only promote the theoretical development of human–land system coupling in the basin, but also provide operational scientific tools for differentiated governance, and have important guiding significance for the realization of ecological protection and high-quality development in the Yellow River Basin. The research results can provide a scientific basis and decision-making reference for ecological protection and high-quality development in the YRB.
This study aims to achieve the following deep scientific and policy objectives, and is not limited to specific analytical methods: First of all, the research is committed to establishing a new assessment framework for watershed sustainable development, through the construction of the W-L-E-C multi-system coupling model, breaking through the limitations of traditional research on a single environmental factor, and developing a quantifiable WLECNI index as a standardized measurement tool for the cross-regional coordination degree. Secondly, the study aims to reveal the spatiotemporal evolution of the W-L-E-C coordination degree in the provinces of the Yellow River Basin during 2002–2022, identify key transition thresholds (such as the critical point at which energy structure adjustment begins to improve the coordination degree), and provide a basis for phased policy formulation. Thirdly, the research systematically diagnoses the bottleneck factors and collaborative opportunities of basin development, not only locating specific obstacle factors (such as water resources overload in Ningxia and high-carbon industries in Shanxi), but also analyzing the cross-system leverage points (such as how land use policies can simultaneously alleviate water resources pressure and reduce carbon emissions).

2. Materials and Methods

2.1. Overview of the Study Area and Date Source

2.1.1. Overview of the Study Area

The YRB is the second-longest river in China, flowing through nine provinces and regions of Qinghai, Sichuan, Gansu, Ningxia, Inner Mongolia, Shanxi, Shaanxi, Henan, and Shandong, with a total length of about 5464 km and a watershed area of about 795,000 square kilometers [7,9]. The topography of the basin is high in the west and low in the east, spanning the three major geomorphic units of the Qinghai–Tibet Plateau, the Loess Plateau, and the North China Plain. The climate types are diverse, from the upper reaches of the high cold climate to the lower reaches of the temperate monsoon climate, and the precipitation distribution is uneven [10]. The YRB water resources have limited time and space distribution, the upstream water resources utilization rate is low, but the relatively abundant middle water loss and soil erosion is serious, and there is a contradiction between the supply and demand of downstream water sharp. There are various types of land resources, but the problems of soil erosion and land degradation are prominent in the Loess Plateau, while the downstream plain area is rich in cultivated land resources but faces the threat of salinization. In addition, the YRB is rich in energy resources, especially large reserves of coal, oil, and natural gas, but the development and utilization of energy has also brought ecological and environmental problems such as air pollution, water consumption, and carbon emission increase [11].
The economic development level of the nine provinces and regions in the YRB is significantly different, with the economy of the upper reaches being relatively backward, and the economy of the middle and lower reaches being more developed. The basin is densely populated, and the system of agriculture, industry, and service industry is relatively complete; however, the industrial structure still needs to be optimized and upgraded. In recent years, with the rise of ecological protection and high-quality development in the YRB as a national strategy, regional coordinated development has ushered in important opportunities. However, problems such as water shortage, soil erosion, energy consumption increase, and carbon emission pressure are interwoven, forming a complex “W-L-E-C” coupling system. Studying the regional water–soil–carbon coupling coordination and its driving factors in ecological protection, as well as its ability to promote the YRB development, is of great significance. The overview of the research area is shown in Figure 1.

2.1.2. Date Source

The original data of nine provinces and regions from the four evaluation years were obtained by sorting and analyzing relevant data from the China Statistical Yearbook, the National Bureau of Statistics, the water resources Bulletin, the China Ecological Environment Bulletin, and the Statistical yearbook.

2.2. Multidimensional Evaluation Model

2.2.1. Evaluation Index System Construction

In this study, the evaluation index system of W-L-E-C coupling-coordinated development is constructed using the systematic method. Firstly, the interaction mechanism between the four subsystems is analyzed deeply, and the theoretical model of the coupling coordination degree is established. In the index screening stage, the five principles of scientific, systematic, operable, regional, and dynamic are strictly followed. Through a literature analysis, expert consultation, and field research, 20 core indicators are selected from the 4 systems of water resources, land resources, energy and carbon emissions, and, finally, a quantitative evaluation model, wherein the coupling degree function and coordination degree function are constructed. The system innovatively realizes the organic integration of the four systems, which can not only independently evaluate the development status of each subsystem, but can also comprehensively analyze the interaction between the systems. The research team further conducts empirical tests based on the provincial panel data from 2002 to 2022, and continuously optimizes the indicator setting through sensitivity analysis to ensure that the indicator system has both theoretical rigor and practical guidance value. It provides a systematic and scientific evaluation tool for the decision-making of the sustainable development of the river basin.
The establishment of the evaluation index system of “W-L-E-C” coupling-coordinated development is the key to studying the harmonious relationship between resource utilization and the ecological environment in the nine provinces of the YRB. Based on scientific, systematic, operational, and regional principles, the system covers the following four subsystems: water resources, land resources, and energy and carbon emissions; furthermore, it selects specific indicators such as water resources per capita, gross production per unit of cultivated land in the primary industry, water consumption per unit of energy, and carbon dioxide emissions per capita. This index system can not only evaluate the spatiotemporal evolution characteristics of the “W-L-E-C” system in the nine provinces of the YRB, but it can also identify key driving factors, providing a scientific basis and practical guidance for regional ecological protection and high-quality development [12,13,14,15,16]. The evaluation index system is shown in Figure 2.

2.2.2. Index Weight Determination

In this paper, the AHP method is used to calculate the subjective weight, while the CRITIC weight method is used to calculate the objective weight, and on this basis, the minimum information entropy principle is introduced to form a combination weight calculation method based on the minimum information entropy principle.
On the basis of a single weight calculation method, this paper introduces the combination weight based on minimum information entropy. The principle of minimum information entropy can use subjective and objective weights to obtain the optimal combination weight value, which minimizes the deviation between subjective and objective weights and makes the obtained combination weight value more scientific [8,17,18]. The weight calculation results are shown in Figure 3, and the calculation formula is as follows:
w e i = w E i × w A i 0.5 i = 1 m w E i × w A i 0.5
where wei is the comprehensive weight; wEi is the objective weight determined using the entropy method; wAi is the subjective weight determined by the analytic hierarchy process; and m is the number of indicators.

2.2.3. “W-L-E-C” System Coupling-Coordinated Development Index

In this paper, the “W-L-E-C” bond index (WLECNI) is proposed based on the existing research results.
Reflecting the coupling and coordinated development level of the “W-L-E-C” system, the formula is as follows:
L i + = X i X min / X max X min
L i = X max X i / X max X min
W L E C N I = i = 1 n w i L i / i = 1 n w i

2.3. Driving Factor Analysis

2.3.1. Factor Analysis

In this paper, the “W-L-E-C” bond index (WLECNI) is proposed based on the existing research results. In this study, the obstacle degree model is introduced to analyze the factors of the indicators in the evaluation system, to determine the main factors affecting the coordinated development of the system coupling, and then to formulate more targeted improvement measures [19,20,21]. The specific steps are as follows:
(1)
Calculate the contribution degree of the j -th evaluation index F j as follows:
F j = w i * × w i
where w i * is the weight value of the criterion layer corresponding to the indicator.
(2)
Calculate deviation I j as follows:
  I j = 1 x i j
(3)
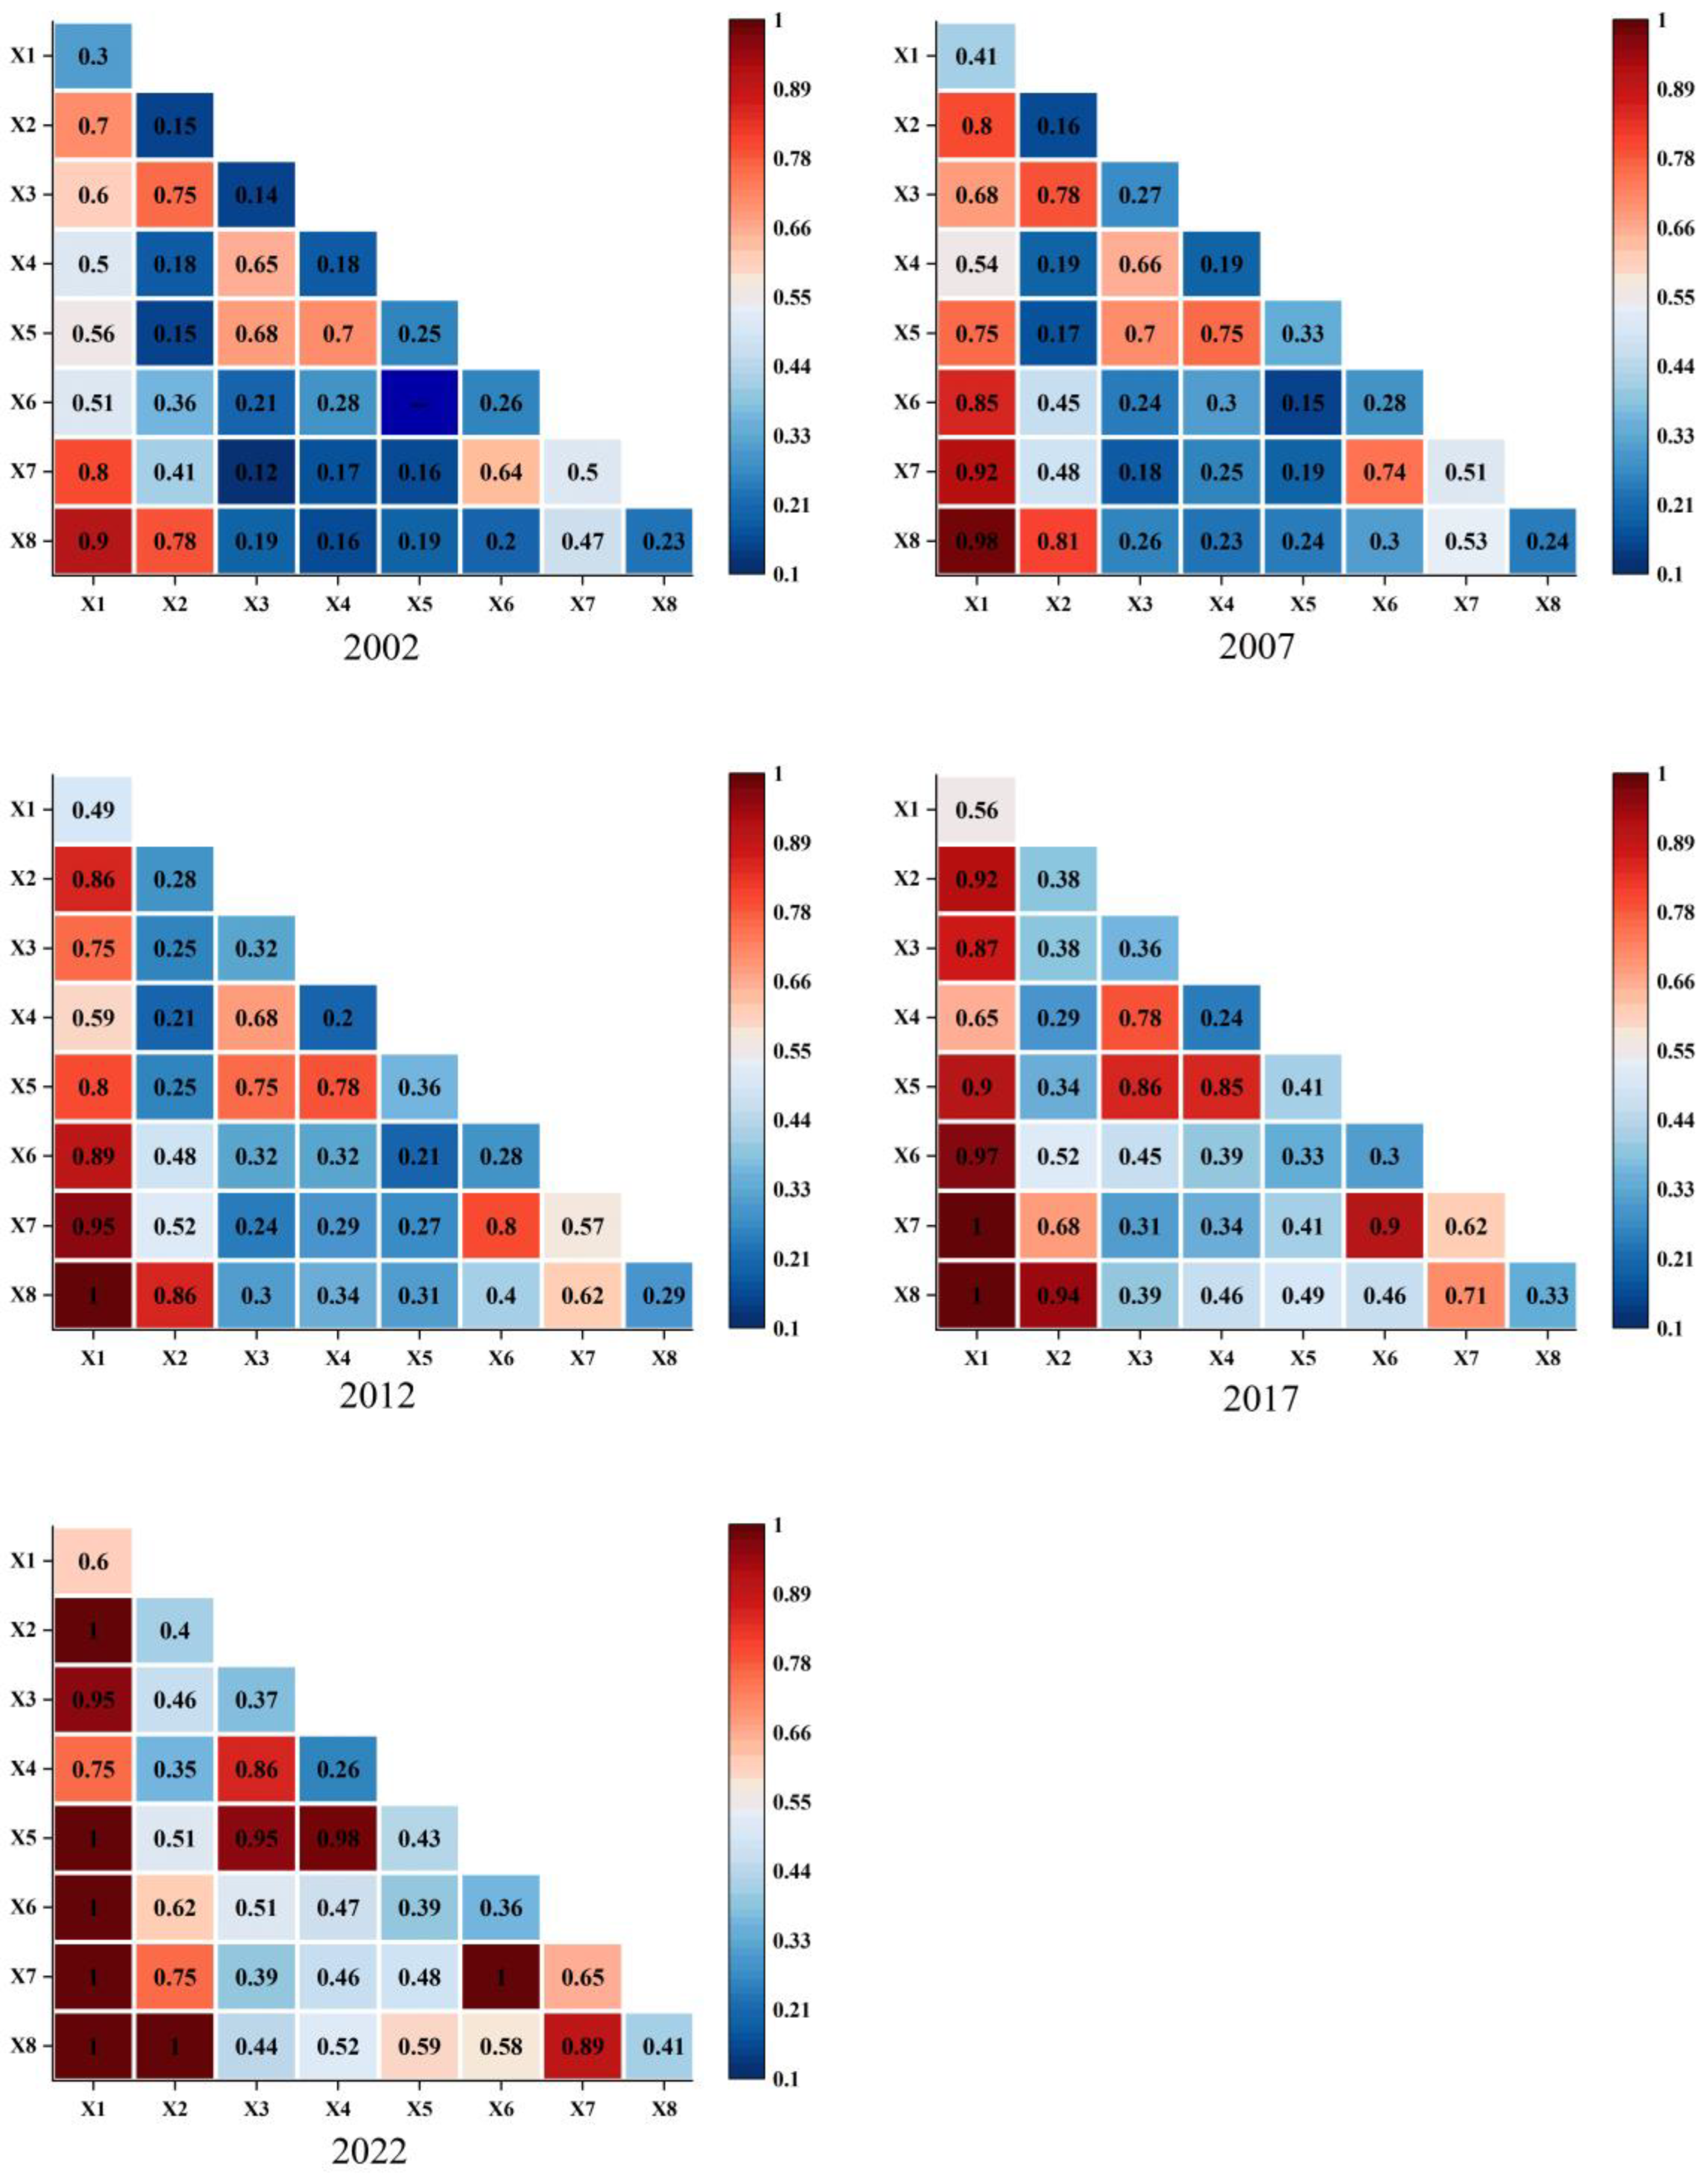
Calculate the obstacle degree of each evaluation index P j as follows:
  P j = F j I j j = 1 n F j I j

2.3.2. Single Subsystem Indicator Results

The geographic detector model is a statistical method to detect spatial heterogeneity and reveal its driving factors, consisting of four detectors—factor detection, interaction detection, risk detection, and ecological detection—the first two components of which are used in this study. The core idea of factor detection is to determine whether the explained variable plays a decisive role by comparing whether the explained variable and the unexplained variable have similar spatial distributions [22,23]. In the geographical detector, the analysis of factor interaction effects quantifies the explanatory power of individual factors and their combinations on the dependent variable using the q statistic. The q-value represents the degree to which a single factor or factor interaction explains the spatial heterogeneity of the dependent variable, ranging from [0,1], with higher values indicating stronger explanatory power. The detection of interaction effects is determined by comparing the q-values of individual factors to the combined q-values of two factors. Specifically, it can be categorized into the following five scenarios: non-linear weakening (interaction q-value is less than the sum of individual q-values), single linear weakening (interaction q-value is less than the maximum individual q-value), bilinear enhancement (interaction q-value is greater than the maximum individual q-value), independence (interaction q-value equals the sum of individual q-values), and non-linear enhancement (interaction q-value is greater than the sum of individual q-values). If the interaction q-value is significantly higher than the individual q-values, it indicates that the combined effect of the two factors has a stronger influence on the dependent variable. The layer in the geographical detector refers to the process of discretizing continuous variables (e.g., using equal intervals, quantiles, or natural breaks) or reclassifying categorical variables, aiming to minimize within-stratum variation and maximize between-stratum variation. The calculation process is as follows:
q = 1 h = 1 L N h σ h 2 N σ 2
where q ∈ [0,1] is the explanatory power of the driving factor of the system coordination level, wherein the larger the value of q, the stronger the explanatory power of the driving factor; h = 1, …, L is the stratification of variables or factors; Nh and N are the number of units in the layer and the whole area; and σ h 2 and σ 2 are the variance of the layer and global values.

3. Results and Discussion

3.1. Analysis of Coordinated Development of “W-L-E-C” Coupling System

We adopted a multidimensional method to ensure the reliability of the conclusions. First, provincial-level data (2002–2022) from authoritative institutions such as the National Bureau of Statistics and the Ministry of Water Resources were adopted, key indicators were calibrated strictly in accordance with IPCC guidelines, and discrepancy data (difference rate < 5%) were revised through local environmental bulletins. In terms of model verification, the comparative test of the entropy weight method and analytic hierarchy process shows that the influence of a WLECNI index weight adjustment on provincial ranking is less than 10%, and the coupling coordination degree results are highly consistent with the Tapio decoupling analysis.

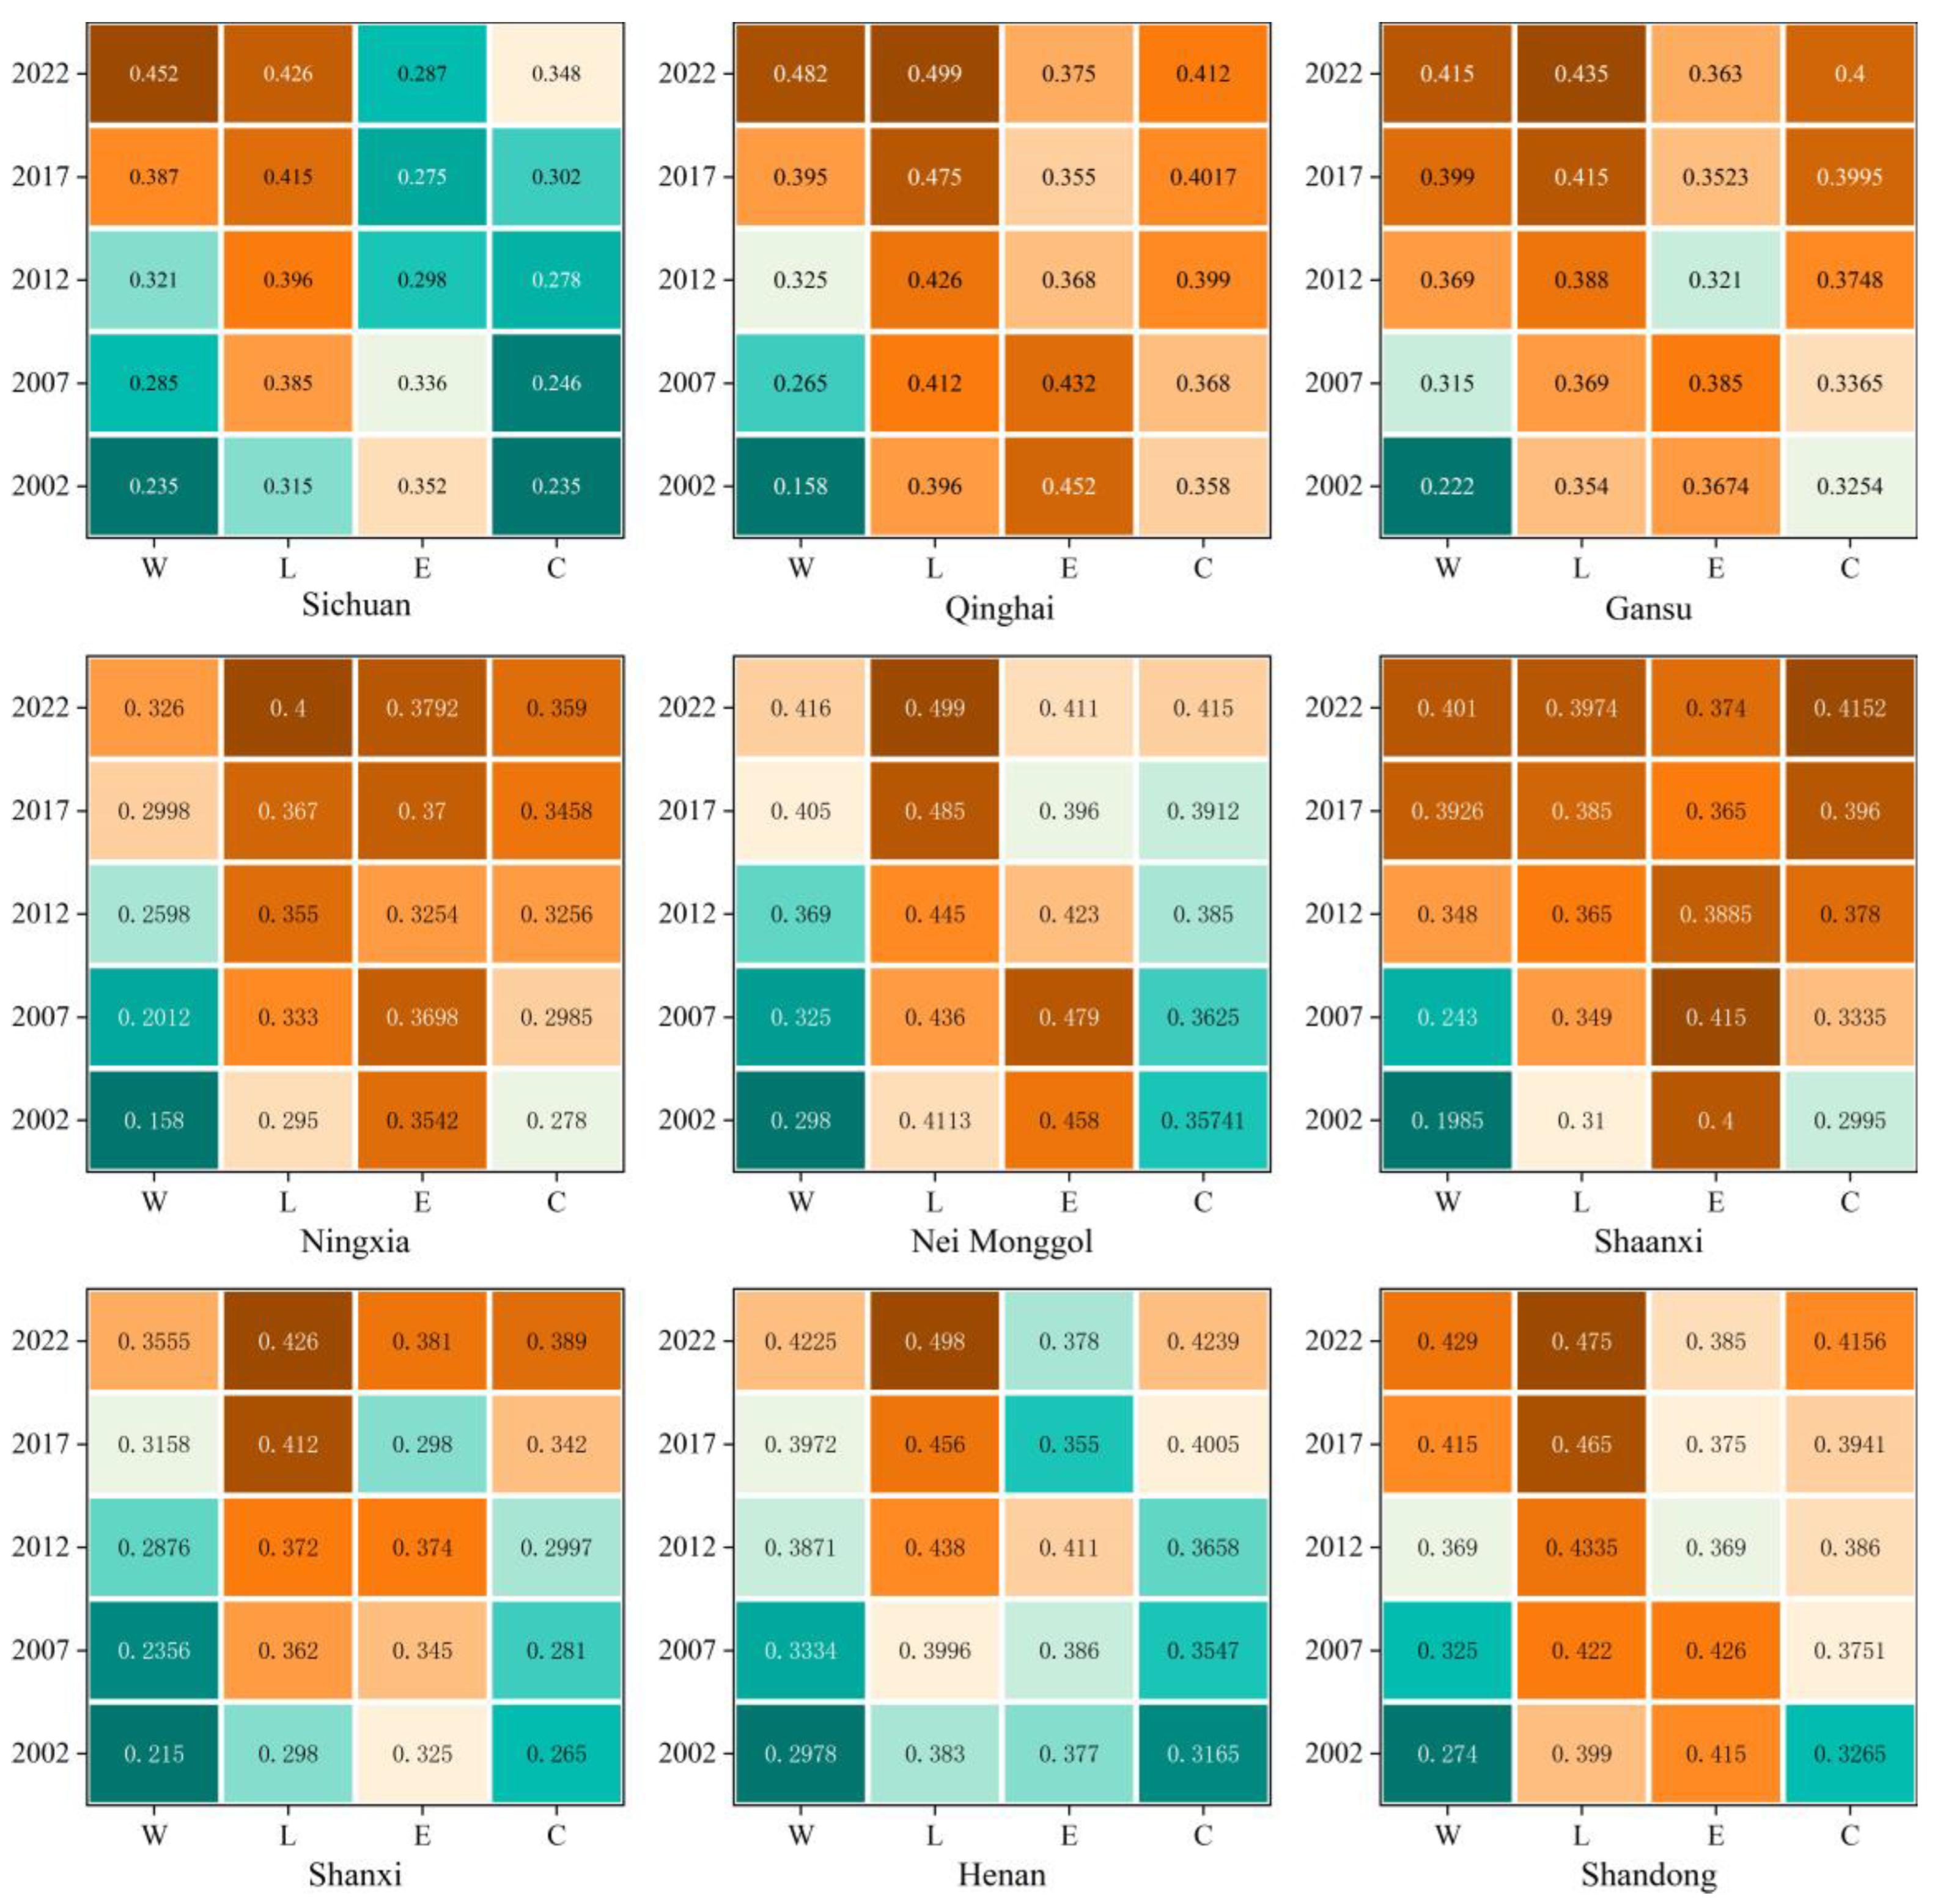
3.1.1. Single Subsystem Indicator Results

The results of single subsystem indicators are shown in Figure 4. From 2002 to 2022, the four indicators of water (W), soil (L), energy (E), and carbon (C) in nine provinces showed significant spatiotemporal differentiation. From the perspective of time, water resource utilization efficiency (W) has generally improved, and the average annual growth rate of the W-value in all provinces is between 3.8% and 8.2%. Take Sichuan Province as an example, wherein its W-value increased from 0.158 in 2002 to 0.326 in 2022, an increase of 106%, reflecting the remarkable effect of water-saving irrigation technology promotion and water resource management policies. The growth rate of the W-value in western regions such as Qinghai and Gansu (6.5% per annum) is higher than that in eastern provinces (4.2% per annum), which may be closely related to the inclined ecological protection policies and the improvement of marginal benefits of water-saving technologies in arid regions. The overall land use intensity (L) remained high, but the regional fluctuation was obvious, described as follows: the L-value of Qinghai Province led for a long time, reaching 0.499 in 2022 (the highest in China), which was closely related to the strict land planning of the Sanjiangyuan Ecological Protection Area; furthermore, the L-value of Shandong Province increased from 0.399 in 2002 to 0.475 in 2022, indicating that agricultural modernization and urbanization have a significant driving effect on land-intensive use.
Energy consumption efficiency (E) presents a spatial pattern of “rising in the west and falling in the east”. The E-value of western provinces such as Ningxia and Gansu continued to rise, and Ningxia’s E-value increased by 10.7% (from 0.3542 to 0.3792) from 2002 to 2022, which may benefit from the expansion of new energy installed capacities, such as photovoltaic and wind power. In the eastern industrial provinces, such as Shandong and Henan, the E-value fell slightly due to the decline in traditional energy dependence, and the decline in Shandong Province reached 9.6%. Carbon emission intensity (C) generally showed a “slowing growth” characteristic, and the average annual increase of the C-value in most provinces dropped to less than 2% after 2017. In Inner Mongolia, for example, its C-value rose from 0.3165 in 2002 to 0.4239 in 2022, but the increase narrowed to 1.8% in 2017–2022, indicating that the constraint effect of the “dual carbon” policy on high-carbon industries is beginning to emerge. It is worth noting that the C-value of central and western provinces, such as Shaanxi, increased by only 5% in 2022 compared to 2017, indicating the gradual penetration of emission reduction policies in energy-intensive regions.
From the perspective of spatial dimension, the regional differences of the four indexes are significant. In western China (Qinghai, Gansu, and Ningxia), the absolute value of water use efficiency (W) was low (mean value of 0.381 in 2022), but the growth rate was higher than that of the whole country, highlighting the marginal benefit of water-saving technology in arid areas. The land use intensity (L) in Qinghai has exceeded 0.48 for five consecutive years, ranking first in China, due to the support of ecological protection policies. The central provinces (Shaanxi, Shanxi, and Henan) are under pressure from the energy transition, with Shanxi’s E-value rising from 0.345 in 2007 to 0.381 in 2022; however, its coal consumption still accounts for more than 60%, resulting in a high-carbon emission intensity (C) (C-value of 0.389 in 2022). The eastern provinces (Shandong and Inner Mongolia) showed the characteristics of “high L-C”, which are as follows: the L-value of Shandong reached 0.475 (2022), reflecting the balance strategy between cultivated land protection and urban expansion; furthermore, due to the concentration of coal and chemical industries, Inner Mongolia’s C-value (0.4239) is the highest in the country, being 8.9% higher than the second, Ningxia. The driving mechanism of regional differences can be summarized into the following three categories: policy intervention, resource endowment, and technology penetration. For example, after the “dual carbon” goal was proposed in 2017, the growth rate of the C-value in high-carbon provinces (Inner Mongolia and Ningxia) slowed down significantly (an average annual decline of 1.2–1.5 percentage points). Additionally, the advantages of new energy resources in western provinces promote the increase of E-value. For example, the installed capacity of wind power in Gansu accounts for more than 30%. In eastern provinces, optimizing land management through digital technologies (such as the “smart agriculture” pilot in Shandong) has supported the continued L-value growth.
The interaction between the indicators showed the coexistence of “water-energy synergy” and “carbon-energy contradiction”. In western China, there is a significant positive correlation between water resource utilization efficiency (W) and energy consumption efficiency (E) (R2 = 0.72), indicating that the collaborative development model of hydropower and new energy has achieved initial results. For example, the “water-light complementarity” project in Longyang Gorge, Qinghai Province has reduced energy consumption per unit GDP by 12%. However, in energy-intensive provinces (Inner Mongolia, Shanxi), carbon intensity (C) is negatively correlated with energy efficiency (E) (R2 = 0.65), reflecting that traditional energy dependence is still the bottleneck of emission reduction. After 2017, the policy-driven effect became prominent, as the growth rate of carbon emissions in all provinces generally declined, but the improvement rate of water resources and land use efficiency accelerated (W- and L-values in 2022 increased by 14.3% and 7.6% on average compared to 2017), indicating the adjustment of resource management priorities under the “ecological priority” policy framework. Future regional development needs differentiated policies; for example, the western region should increase the proportion of renewable energy through the integration of landscape and water storage; Central China needs to explore the coupling model of coal power and carbon capture technology (CCUS); and the eastern part of the country can pilot a carbon emission trading market to force industrial low-carbon transformation through economic means.
To summarize, the spatiotemporal evolution of water, soil, energy, and carbon indicators in various provinces in China is driven by multiple factors, such as policies, resources, and technologies. It is thus suggested to establish a resource–energy–carbon emission accounting system of regional linkage to identify the potential of cross-provincial collaborative emission reduction, to increase investment in water-saving technology and new energy infrastructure for ecologically fragile areas in western China. Furthermore, in the central and eastern industrial agglomeration areas, carbon quota constraints and green technology innovation subsidies will be strengthened. Follow-up studies can be combined with high-resolution remote sensing data and policy text analysis to further quantify the contribution of policy interventions to the evolution of indicators.

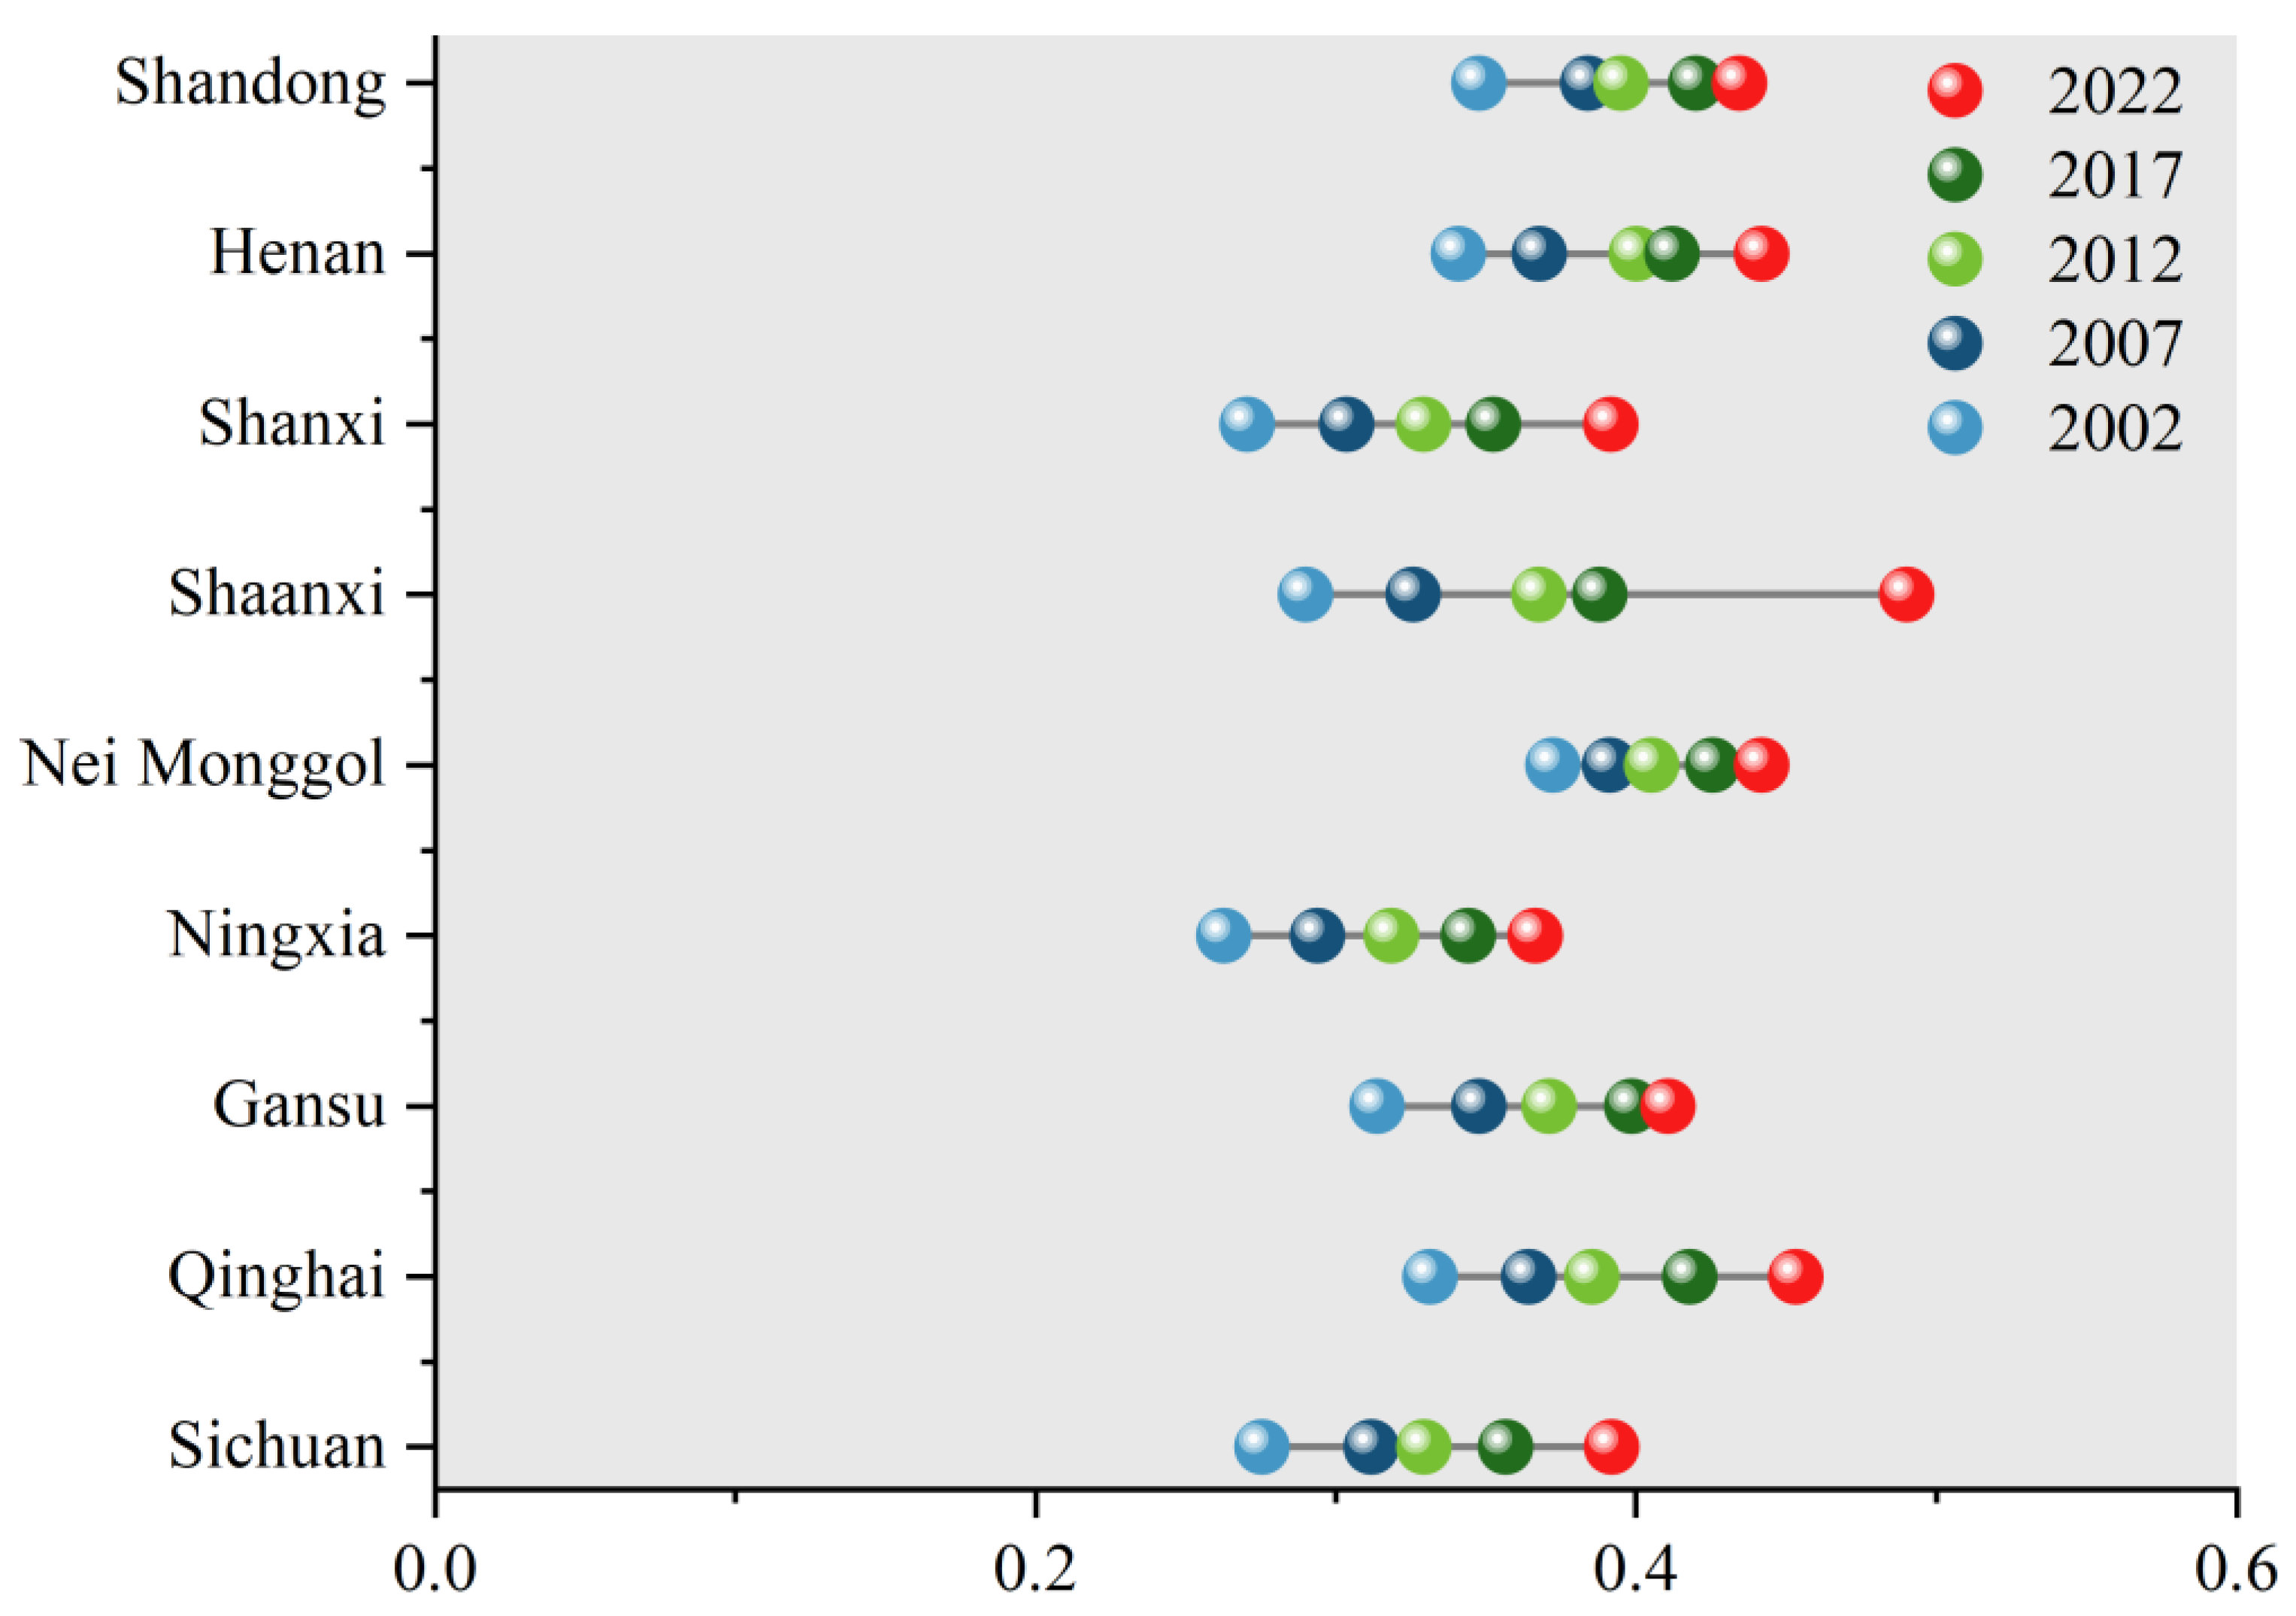
3.1.2. WLECNI Index Results

Based on the WLECNI index time series data of “W-L-E-C” system coupling and coordinated development in the provinces of the YRB from 2002 to 2022, the horizontal differentiation, dynamic evolution characteristics, and regional differences of coordination were systematically analyzed. The WLECNI result is shown in Figure 5. As can be seen in the figure, the coordination of the YRB presents significant spatial–temporal differentiation. The high coordination areas (0.4–0.6) were represented by Inner Mongolia and Shaanxi. The WLECNI index of Inner Mongolia increased steadily from 0.372 (2002) to 0.442 (2022), with an average annual growth rate of 1.7%, benefiting from the synergistic effect of grassland ecological restoration and clean energy replacement. Shaanxi increased from 0.290 (2002) to 0.550 (2022), with an average annual growth rate of 3.4%, and significantly alleviated the pressure on resources and the environment through the intensification of cultivated land and industrial water-saving technology, becoming a benchmark for the improvement of coordination in the middle reaches. The middle coordination zone (0.2–0.4) includes Shandong, Henan, and Shanxi. Shandong increased from 0.348 (2002) to 0.434 (2022), with an average annual growth rate of 1.1%, and the promotion of green industry and water-saving technology has achieved remarkable results. Henan (0.441) and Shanxi (0.391) experienced slower growth due to the pressure of industrial carbon emissions and land resources. The low coordination areas (<0.4) were represented by Ningxia and Gansu. Although Ningxia (0.366) and Gansu (0.410) showed an increasing trend, their coordination remained low for a long time due to the constraints of water resource overload and inefficient energy utilization. Qinghai (0.453) has better coordination than the other upstream provinces due to having a higher ecological protection input.
Regional difference analysis showed that Inner Mongolia, Shaanxi, and Shandong achieved significant improvement in coordination through the “scenic energy + ecological restoration” model, cultivated land protection policy, and industrial greening, while Shanxi and Henan, restricted by industrial carbon emissions and land resource pressure, had lower growth than the average river basin. Due to the superposition of water resources’ development intensity and desertification, Ningxia’s coordination is weak. Future policies should be implemented in different areas. For example, the high coordination area should consolidate the advantages of eco-energy coordination and explore cross-provincial carbon sink trading mechanism. In the middle coordination area, the application of water-saving and consumption-reducing technology is strengthened to reduce the system vulnerability. Finally, low coordination areas have priority in solving the problem of resource overload and inefficient utilization, and they promote the utilization of renewable water and photovoltaic sand control technology.

3.2. Analysis of the Factors of Coordinated Development of “W-L-E-C” System Coupling

The results of the factor analysis for 2022 are shown in Figure 6. The per capita water consumption (W1) of all provinces in the figure is generally high, especially for Shanxi (0.1980) and Ningxia (0.1830), reflecting that extensive water use patterns are still dominant. There were significant regional differences in W5, and the values of Shanxi (0.0020) and Henan (0.0025) were very low, indicating that the superposition of industrial pollution and agricultural non-point source pollution led to the failure of water quality management. In Inner Mongolia (0.0980), water quality barriers were relatively light due to the high investment in ecological restoration. The low water resource utilization rate (W4) in Gansu (0.0315) and Qinghai (0.0125) is directly related to the lack of local water resources endowment, and the risk of over-exploitation should be vigilant.
The obstacle of the cultivated land area (L3) was higher in Shaanxi (0.0950) and Inner Mongolia (0.0850), and the urbanization and ecological farmland return policy aggravated the loss of cultivated land. The barrier of the impervious area (L4) reached its peak in Shandong (0.1200), indicating that rapid urbanization led to prominent surface hardening problems. In energy utilization, the energy consumption per unit GDP (E1) in Inner Mongolia (0.0150) is significantly lower than that in other provinces, thanks to the optimization of energy structure and the promotion of energy efficiency technology. Furthermore, the high unit water consumption of Shanxi (0.0420) and Henan (0.0100) (E4, 0.1310 and 0.1340, respectively) exposed the lag of industrial water-saving technology, forming a “water-energy” two-way restriction.
Energy consumption carbon emission (C3) was high in Gansu (0.0664) and Ningxia (0.0752), which is closely related to the coal-dependent industrial structure. The carbon uptake (C1, C4) of the ecosystem was weak in Shanxi (C1 = 0.0826) and Henan (C4 = 0.0887), and the degradation of the ecological carbon sink function intensified the pressure of carbon neutrality. The per capita carbon dioxide emissions (C5) were higher in Henan (0.0742) and Shandong (0.0647), highlighting the urgent task of reducing emissions in densely populated areas.
In the upper reaches of the YRB (Qinghai and Gansu), the complex barriers of low water resource utilization (W1 and W4) and low energy quality and productivity (E3 ≥ 0.078) should be solved first. The middle reaches (Shaanxi, Shanxi) should focus on the coordination of cultivated land protection (L3) and industrial emission reduction (C3, C4), while the downstream section (Henan, Shandong) needs to contain impervious expansion (L4) and a high-carbon lock-in effect (C5). It is suggested to strengthen the W-E collaboration through a cross-provincial ecological compensation mechanism, promote water-saving and consumption reduction technologies (such as reclaimed water utilization W5, photovoltaic sand control L2), and to establish a linkage system of the carbon emission quota and carbon sink trading, to systematically reduce the intensity of factors and promote the high-quality development of the basin.

3.3. Interactive Detection and Analysis of “W-L-E-C” System Driving Factors

The interactive detection results among the impact factors in the nine provinces of the YRB are shown in Figure 7. Based on the interaction intensity data of the “W-L-E-C” system from 2002 to 2022, this study reveals the dynamic evolution characteristics and internal mechanism of the system. The data are presented in the following triangular matrix, covering the strength of the X1 to X8 factors themselves, and their interaction strength. The analysis shows that the system presents a significant trend of network strengthening, which is as follows: the average interaction strength increases from 0.35 (2002) to 0.58 (2022), and the core nodes of X5, X7, and X8 drive the network density. Among them, the strength of X5 jumped from 0.56 to 1 (2022), and the interaction strength with X4, X6, and X7 exceeded 0.9, becoming the core hub of the system. The interaction strength of X7 with X6 and X8 reaches saturation values of 1 and 0.89 (2022), respectively, highlighting its information relay function. At the same time, the system complexity increases, the vulnerability risk becomes prominent, and the highly dependent feature of the core node may cause cascading failures.
The phased evolution characteristics show that 2012 was a key turning point, as the interaction intensity of X3 and X1 suddenly increased to 0.87 (45% increase over the previous period), while the growth rate of the interaction intensity of most factors slowed down, which is presumed to be related to an external intervention or system adaptive adjustment. Anomalies such as a sharp drop in X2’s own strength in 2017 (0.69 vs. 0.92 previously) and fluctuations in the X3–X2 interaction strength (0.75 → 0.38 → 0.46) require validation of data reliability or exploration of perturbation mechanisms. It is thus suggested to focus on the dynamic behavior of X5 and X7, whose intensity saturation phenomenon may reach the system threshold, and the mechanism analysis should be carried out in combination with driving factors such as policy and technology. Future studies can quantify the impact of network topology changes on system stability through heat map modeling and robust simulation, and they can provide a theoretical basis for complex system optimization.

4. Conclusions

This study draws the following conclusions: The coupling coordination of the “W-L-E-C” system in the YRB presents significant spatial differentiation and temporal dynamic changes. Inner Mongolia and Shaanxi have become the benchmark of the high coordination zone through ecological restoration, clean energy replacement, and cultivated land intensification, while Ningxia and Gansu have been in the low coordination zone for a long time due to water resource overload and inefficient energy utilization. Barrier factor analysis shows that the water resources’ utilization rate (W4), impervious area (L4), energy consumption per unit GDP (E1), and carbon emissions from energy consumption (C3) are the core factors restricting coordination. Among them, the water quality compliance rate (W5) of Shanxi and Henan is very low, and the impervious area (L4) of Shandong is a prominent problem. The interaction analysis of the driving factors revealed a significant interaction between water resource utilization and ecological protection (W-E), land resource and energy use (L-E), and carbon emissions and the ecosystem (C-E). Inner Mongolia, Shaanxi, and Shandong achieved coordinated improvement through “scenic energy + ecological restoration”, cultivated land protection, and industrial greening. Shanxi, Henan, and Ningxia are constrained by the “W-L-E-C” complex obstacles.
In the future, the YRB needs to implement a zoning regulation strategy in order for the high-coordination area to consolidate the advantages of ecological energy coordination, for the middle coordination area to strengthen the application of water-saving and consumption reduction technology, and for the low coordination area to solve the problem of resource overload and inefficient use of renewable water utilization and photovoltaic sand control technology, in order to achieve high-quality development of the whole basin. This study provides a scientific basis and policy suggestions for the sustainable development of the YRB.

Author Contributions

Conceptualization and writing—review and editing, S.Z. and B.C.; writing—original draft preparation, M.J. and T.L.; software, Z.L. and D.Z.; supervision and project administration, W.C. and Z.L. All authors have read and agreed to the published version of the manuscript.

Funding

This study was financially supported by the National Natural Science Foundation of China (52409058).

Data Availability Statement

The original contributions presented in the study are included in the article; further inquiries can be directed to the corresponding author.

Conflicts of Interest

The authors declare no conflicts of interest.

References

  1. Han, Y.; Li, J.; Zhao, M.; Guo, H.; Wang, C.; Huang, H.; Cao, R. Analysis of rainfall abundance and drought occurrence and probability of flood and drought occurrence in Yellow River Basin based on Copula function family. J. Hydrol. Reg. Stud. 2025, 58, 102242. [Google Scholar] [CrossRef]
  2. Li, S.; Xiang, N.; Shu, C.; Xu, F. Unveiling the industrial synergy optimization pathways in Beijing-Tianjin-Hebei urban agglomeration based on water-energy-carbon nexus. J. Environ. Manag. 2025, 376, 124528. [Google Scholar] [CrossRef] [PubMed]
  3. Yin, L.; Li, H.; Liu, D.; Zhang, L.; Wang, C.; Li, M.; Faiz, M.A.; Li, T.; Cui, S. Interpretation and Comprehensive Evaluation of Regional Water–Land–Energy Coupling System Carrying Capacity. Sustainability 2025, 17, 1669. [Google Scholar] [CrossRef]
  4. Zhou, H.; Liu, J.; Gao, C.; Li, W.; Ou, S.; Zhou, Y.; Luan, Q. Copula-based joint impact assessment of rainfall and tidal level on flood risk in tidal-influenced plain river network areas, Taihu Lake Basin. J. Hydrol. 2025, 653, 132785. [Google Scholar] [CrossRef]
  5. Wakchaure, G.; Minhas, P.; Biswas, A.; Meena, K.K.; Pradhan, A.; Gawhale, B.; Choudhary, R.; Kumar, S.; Fagodiya, R.K.; Reddy, K.S.; et al. Assessment of gains in productivity and water-energy-carbon nexus with tillage, trash retention and fertigation practices in drip irrigated sugarcane. Renew. Sustain. Energy Rev. 2025, 211, 115294. [Google Scholar] [CrossRef]
  6. Xu, W.; Wang, H.; Zhao, X.; Zhao, D.; Ding, X.; Yin, Y.; Liu, Y. Study on Evaluation and Dynamic Early Warning of Urban Water Resources Security. Water 2025, 17, 242. [Google Scholar] [CrossRef]
  7. Wu, L.; He, Y.; Tan, Q.; Zheng, Y. Land-use simulation for synergistic pollution and carbon reduction: Scenario analysis and policy implications. J. Environ. Manag. 2024, 356, 120603. [Google Scholar] [CrossRef]
  8. Li, J.; Zhao, M.; Han, Y.; Wei, J. Assessment on water cycle health in the Central Plains Urban cluster based on the DSWU NWU SWS NWS A—WCHI model. Ecol. Indic. 2023, 157, 111236. [Google Scholar] [CrossRef]
  9. Wu, Z.; Fan, Y.; Zhang, S.; Qian, X.; Wang, G. Dynamic assessment of water resources carrying capacity under human impacts on the water cycle: A finer perspective at the spatiotemporal scale of basin. J. Clean. Prod. 2025, 486, 144602. [Google Scholar] [CrossRef]
  10. Lyu, H.; Qiao, J.; Fang, G.; Liang, W.; Tang, Z.; Lv, F.; Zhang, Q.; Qiu, Z.; Huang, G. Variations in Water Stress and Its Driving Factors in the Yellow River Basin. Land 2024, 14, 53. [Google Scholar] [CrossRef]
  11. Ma, D.; Duan, S.; Zhang, X.; Xu, B.; Xu, Y. Spatiotemporal Dynamic Assessment of Water Resources Carrying Capacity and Identification of Obstacle Factors in Yunnan Province Based on Grey Water Footprint Theory. Water 2024, 16, 3651. [Google Scholar] [CrossRef]
  12. Sobkowiak, L.; Wrzesiński, D. Impacts of Climate Change on Water Resources: Assessment and Modeling—First Edition. Water 2024, 16, 3578. [Google Scholar] [CrossRef]
  13. Kang, Y.; He, S.; Ni, T.; Wang, J.; Liu, L. Analysis of water–energy–carbon coupling and influencing factors in food production. J. Water Clim. Change 2024, 15, 5939–5956. [Google Scholar] [CrossRef]
  14. Hadipour, M.; Pourebrahim, S.; Heidari, H.; Nikooy, F.; Ahmed, A.N.; Ern, C.J. Evaluation of water resource balance in the Urmia Lake Basin: Integrating carrying capacity and water footprint model for sustainable management. Ecol. Indic. 2024, 166, 112464. [Google Scholar] [CrossRef]
  15. Du, L.; Niu, Z.; Zhang, R.; Zhang, J.; Jia, L.; Wang, L. Evaluation of water resource carrying potential and barrier factors in Gansu Province based on game theory combined weighting and improved TOPSIS model. Ecol. Indic. 2024, 166, 112438. [Google Scholar] [CrossRef]
  16. Yu, L.; Peng, K.; Huang, Y.; Peng, K.; Huang, Y.; Chen, F.; Chen, S.; Xia, Y.; Huang, X.; Ni, X.; et al. Application of a water-energy-carbon coupling index to evaluate the long-term operational stability of the anaerobic-anoxic-oxic-membrane bioreactor (A2/O-MBR) process under the influence of rainstorms. Water Res. 2024, 255, 121489. [Google Scholar] [CrossRef]
  17. Feng, Y.; Wang, J.; Ren, X.; Zhu, A.; Xia, K.; Zhang, H.; Wang, H. Impact of water utilization changes on the water-land-energy-carbon nexus in watersheds: A case study of Yellow River Basin, China. J. Clean. Prod. 2024, 443, 141148. [Google Scholar] [CrossRef]
  18. Li, J.; Zhao, M.; Han, Y.; Wei, J. Analysis of water resource ecological optimization and obstacles based on the water resources-socio-economic-ecological environment model framework—A case study of the core area of the Central Plains urban agglomeration. Front. Ecol. Evol. 2023, 11, 1263601. [Google Scholar] [CrossRef]
  19. Jiang, W.; Zhang, Z.; Wen, J.; Yin, L.; Song, B. Spatio-temporal variation and influencing factors of industrial carbon emission effect in China based on water-land-energy-carbon nexus. Ecol. Indic. 2023, 152, 110307. [Google Scholar] [CrossRef]
  20. Zhao, M.; Li, J.; Zhang, Y.; Han, Y.; Wei, J. Water cycle health assessment based on combined weight and hook trapezoid fuzzy TOPSIS model: A case study of nine provinces in the Yellow River basin, China. Ecol. Indic. 2023, 147, 109977. [Google Scholar] [CrossRef]
  21. Yao, X.; Chen, W.; Song, C.; Gao, S. Sustainability and efficiency of water-land-energy-food nexus based on emergy-ecological footprint and data envelopment analysis: Case of an important agriculture and ecological region in Northeast China. J. Clean. Prod. 2022, 379, 134854. [Google Scholar] [CrossRef]
  22. Lyu, K.; Tian, J.; Zheng, J.; Zhang, C.; Yu, L. Evaluation of Water–Carbon–Ecological Footprint and Its Spatial–Temporal Changes in the North China Plain. Land 2024, 13, 1327. [Google Scholar] [CrossRef]
  23. Jin, K.; Zhang, S.; Yang, Y.; Chen, X.; Wang, S.; Li, T.; Wang, Y. Evaluation of water-carbon-ecological footprints and its spatial–temporal pattern in the central plains urban agglomeration. Ecol. Indic. 2023, 155, 110982. [Google Scholar] [CrossRef]
Figure 1. Research overview map.
Water 17 01138 g001
Figure 2. Evaluation index system of “W-L-E-C” system coupling-coordinated development.
Water 17 01138 g002
Figure 3. Weight chart of evaluation indicators.
Water 17 01138 g003
Figure 4. Single-index evaluation results of nine provinces in the YRB.
Water 17 01138 g004
Figure 5. Spatiotemporal evolution of WLECNI in nine provinces.
Water 17 01138 g005
Figure 6. Factor analysis results for 2022.
Water 17 01138 g006
Figure 7. Interactive detection results of influencing factors in nine provinces of the YRB.
Water 17 01138 g007
Disclaimer/Publisher’s Note: The statements, opinions and data contained in all publications are solely those of the individual author(s) and contributor(s) and not of MDPI and/or the editor(s). MDPI and/or the editor(s) disclaim responsibility for any injury to people or property resulting from any ideas, methods, instructions or products referred to in the content.

